the use of acid-base accounting to predict post-mining ... · 01/01/2016 · 1 the use of acid-base...
TRANSCRIPT
1
The Use of Acid-Base Accounting to Predict Post-mining Drainage Quality on
West Virginia Surface Mines
Jeff Skousen, Jennifer Simmons, and Paul Ziemkiewicz West Virginia University Morgantown, WV 26506
Abstract
Acid-Base Accounting (ABA) is an analytical tool to determine the acid- or alkaline-producing potential of overburden rocks prior to coal mining. This procedure was developed by Dr. Richard M. Smith and associates at West Virginia University in the late 1960s. After the passage of laws requiring an assessment of mining on water quality, ABA became the preferred method to predict post-mining water quality, and many permitting decisions for surface mines were and are based on the values determined by ABA. As a post-mining water quality predictor, ABA is best used as a qualitative assessment of the site’s potential to produce acid mine drainage. Several studies have attempted to adapt ABA to a quantitative assessment of the site’s post-mining water quality. By this approach, the mass of acid-producing rock is compared to the mass of alkaline-producing rock and a prediction of the water quality (amount of acidity or alkalinity) is obtained. Such analyses have given variable prediction success. We gathered information for 28 sites in West Virginia and estimated overburden amounts and ABA parameters on each site based on ABA data and topographic maps. Maximum potential acidity (MPA), neutralization potential (NP), net neutralization potential (NNP), and NP/MPA ratios were determined for each site based on ABA and correlated to post-mining water quality from springs or seeps on the mined property. On our 28 sites, total NNP varied from -12.7 to 106 tons per thousand tons (t/1000 t) and NP/MPA ratios varied from 0.2 to 21. We found no relationship between MPA with post-mining water quality, while NNP and NP/MPA ratio showed the best correlation. Six sites gave NP/MPA ratios of <1; four of them (67%) gave net acid post-mining water quality, while the other two sites were only slightly net alkaline. Five sites had NP/MPA ratios of 1.1 to 1.6, and only one of these sites had net acid water quality and only slightly so. The remaining 17 sites had NP/MPA ratios >2.2 (all of which should produce alkaline water) and three of the 17 sites produced acid drainage. Two sites with NP/MPA ratios of <1 gave net alkaline water, while 18 out of 22 sites (82%) with NP/MPA ratios >1 gave net alkaline water quality. ABA is a good tool to assess overburden quality before mining and to predict post-mining drainage quality after mining. Most sites followed the prescribed patterns of prediction.
Additional Key Words: Acid Mine Drainage, Neutralization Potential, Overburden Analysis, Pre-mining Planning

2
Introduction
Most coal mining state regulatory agencies began requiring the prediction of acid- and alkaline-producing materials in the overburden of surface mine operations in the early 1970s. For example, in 1971 the West Virginia legislature passed a law requiring mine operators to show in the permit “the presence of any acid-producing materials, which, when present, may cause minesoils with a pH of less than 3.5 and prevent effective revegetation” (West Virginia Surface Mining Law, 1971). Dr. Richard M. Smith and his associates at WVU, in conjunction with the existing West Virginia coal regulatory agency, began working on a procedure for identifying acid-producing materials in 1965 (Perry, 1998). Throughout the late 1960s and 1970s, the procedure was refined and termed “Acid-Base Accounting” (ABA) by Dr. Smith and his students (Smith et al., 1976). ABA was originally designed to distinguish layers in the overburden that could be used as topsoil substitutes or as hard durable rock for valley fills. But since the method identified acid- and alkaline-producing materials in the overburden, this method was the first technology available to predict the quantity of acid-producing materials prior to mining (Skousen et al., 1990). Since the late 1970s and the passage of the Surface Mining Control and Reclamation Act of 1977, ABA has become widely adopted as a method of overburden characterization and prediction of post-mining drainage quality (Sobek et al., 2000).
ABA, as originally developed, is designed to measure Neutralization Potential (NP) and sulfur content of individual overburden strata. From these measurements, Maximum Potential Acidity (MPA) and Net Neutralization Potential (NNP) of each geologic layer down to, including, and immediately underlying the coal seam can be calculated. The NP is a measure of the amount of neutralizing compounds (mostly carbonates and exchangeable bases) present in the coal and overburden. The first step in NP determination is the addition of 1-2 drops of 25% HCl to a small amount of prepared sample. The degree of reaction is then observed and recorded as 0 (none), 1 (slight), 2 (moderate), or 3 (strong). Based on the fizz test results, an appropriate amount and strength of HCl is added to a 2-g sample of rock and boiled for 5 minutes. After cooling, the solution is then titrated with NaOH to pH 7.0. The NP is calculated from the amount of acid neutralized by the sample and is expressed in tons/1000 tons (t/1000 t) of overburden (Kania, 1998). Refinements have been made recently on the NP method to discount alkalinity from slower-reacting minerals such as siderite (Skousen et al., 1997).
The MPA is the maximum amount of sulfuric acid that can be produced from the oxidation of sulfur minerals in the coal and overburden. Although acid production is associated with pyritic sulfur, MPA determinations typically measure total sulfur because it currently provides the easiest basis for calculating MPA (Kania, 1998). The simplest and most frequently used method of total S determination is high-temperature furnace combustion. In this process, the sample is heated to approximately 1350o C while a stream of oxygen is passed over the sample. The sulfur dioxide (SO2) that is released can then be measured using an Automated Sulfur Titrator or infrared absorption (Skousen, 2000). This test results in a percent of sulfur present in the rock and is then multiplied by either 31.25 or 62.5 to determine the MPA in t/1000 t. These numbers are based on the following stochiometry of pyrite oxidation:
FeS2 + 2CaCO3 + 3.75 O2 + 1.5 H2O è Fe(OH)3 + 2 SO4-2 + 2 Ca+2 + 2 CO2 (1)
In this equation, 1 mol of FeS2 (64 g of sulfur) is neutralized by 2 mols of CaCO3 (200 g of CaCO3). Therefore, it takes 31.25 tons of CaCO3 to neutralize 1000 tons of rock containing 1% pyritic sulfur. Cravotta et al. (1990) suggested that in a closed system (such as that of a surface
3
mine backfill) CO2 would not be driven off in the reaction, but would instead react with water to form carbonic acid as in the following reaction:
FeS2 + 4CaCO3 + 3.75O2 + 3.5H2O è Fe(OH)3 + 2SO4-2 + 4Ca+2 + 4HCO3
- (2)
In this reaction, 1 mol of FeS2 is neutralized by 4 mols of CaCO3 . Here 1000 tons of rock containing 1% pyritic sulfur requires 62.5 tons of CaCO3 for neutralization. Studies analyzing ABA have used both methods. The results have been mixed (Brady and Cravotta, 1992; Brady et al., 1994). In general, the 31.25 factor for overburden MPA calculation is most commonly used. After the NP and MPA are calculated using the above methods, total Net Neutralizing Potential (NNP) can be determined for each stratigraphic layer by subtracting the MPA from the NP. Conceptually, a positive number indicates potentially alkaline-producing strata and a negative number indicates potentially acid-producing strata. This number can then be used to identify potentially toxic materials in the overburden and can assist in planning overburden handling and placement (Skousen et al., 1987). The interpretation of ABA data for use in predicting post-mining water quality involves numerous assumptions. First, all sulfur in a sample will react to form acid. Second, all material in the sample that consumes acid in the laboratory will generate alkalinity in the field. Third, the reaction rate of sulfur will be equivalent to the dissolution rate of the neutralizing material. And fourth, NP and %S below certain thresholds do not influence water quality. It is unrealistic to believe that these assumptions are correct in the natural environment and therefore many researchers have questioned the ability of ABA to accurately predict post-mining drainage quality (diPretoro and Rauch, 1988; Erickson and Hedin, 1988). In addition, there is uncertainty as to which ABA parameters most accurately estimate acid- or alkaline-production potential. In the initial usage of ABA as a predictor of post-mining water quality, overburden calculations were made only according to layer thickness, giving equal weight to layers at the top and bottom of the column. However, in most surface mines of West Virginia and Pennsylvania, the topography is hilly to mountainous with horizontal strata. So, a 5-foot-thick rock stratum high up in the overburden contains much less volume of material than a 5-foot-thick rock stratum low in the stratigraphy. Therefore, this method overestimated the amount of alkaline material high in the overburden column, and created a situation where insufficient alkaline material was available for neutralization of acidity in high-sulfur rocks near the coal seam. Some of these sites were mined and subsequently generated severe, post-mining acid mine drainage due to inaccurate overburden interpretation. In the early 1980s, computer spreadsheets came into use for the input and volume adjustment of ABA data. These spreadsheets made it easie r to calculate ABA parameters and to weight them based on overburden layer thickness and areal extent of each layer. Therefore, subsequent ABA calculations included volume estimates for each layer, making it easier to evaluate total volumes of alkaline- or acid-producing materials (Smith and Brady, 1990).
In 1988, two studies by diPretoro and Rauch (1988) and Erickson and Hedin (1988)
compared volume-weighted ABA data with post-mining water quality. Due to the difficulty of measuring the areal extent of each stratigraphic layer, precise volumetric calculations were not performed. In both studies, volume-weighted values were calculated by assuming a right triangle-shaped area to be mined. Although this method can only be considered as an approximate technique for volumetric adjustment, it yielded better results than simple thickness methods of the past.
4
A 1994 study by Keith Brady and his associates at the Pennsylvania Department of Environmental Protection (PADEP) developed a method of ABA calculation using actual measurements of the areas to be mined (Brady et al., 1994). Due to the impracticality of measuring the acreage of each individual stratum, only the acreage of the upper and lower strata was measured. A computer spreadsheet then interpolated the acreage of each stratigraphic layer between the two, assuming a constant slope. Volumes were calculated for each interval using this acreage and the measured thickness (Smith and Brady, 1990). This PADEP study took ABA calculations one-step further by determining the mass of each individual layer, which was calculated from the unit weight of the rock type present in the strata. MPA and NP were then expressed in tons. Even though both of these methods, volume-weighted and mass-weighted, yielded more accurate ABA measures than previous methods, the question remained as to which ABA parameters best predicted post-mining water quality. In studies by diPretoro and Rauch (1988), Erickson and Hedin (1988) and Brady et al. (1994), NP and NNP were found to be the best indicators of post-mining drainage quality (Table 1). diPretoro and Rauch (1988) found that sites with NP >40 t/1000 t (or parts per thousand) and NNP >30 t/1000 t produced net alkalinity in post-mining drainage. Erickson and Hedin (1988) compared the net alkalinity of post-mining water to NNP and found that NNP >80 produced alkalinity and NNP <20 typically produced acidity. It should be noted that this study had no sites with NNPs between 20 and 80 t/1000 t. A mass-weighted study by Brady et al. (1994) resulted in NP and NNP values much lower than earlier studies. In this study, sites with NP >21 t/1000 t and NNP >12 t/1000 t produced alkaline drainage. Table 1: Summary of water quality prediction from studies in northwestern West Virginia and southwestern Pennsylvania (Perry, 1998). ABA Parameter Calculated Value Water Quality Source (t/1000 t) NP <20 net acid
>40 net alkaline diPretoro and Rauch, 1988
<10 net acid >21 net alkaline Brady et al., 1994
NNP <10 net acid >30 net alkaline diPretoro and Rauch, 1988
<20 net acid >80 net alkaline Erickson and Hedin, 1988 <0 net acid
>12 net alkaline Brady et al., 1994 <-5 net acid >15 net alkaline Skousen et al., 1987
______________________________________________________________________________

5
In addition to NP and NNP, the ratio of NP to MPA may also be a reliable indicator of post-mining water quality. The ratio is calculated by dividing the total NP of the entire overburden column by the MPA of the entire overburden column. diPretoro and Rauch (1988) found that sites with a NP/MPA ratios of <2.4 generally resulted in acid mine drainage and sites with >2.4 usually produced alkaline drainage.
Although all three studies identified the importance of NP and NNP in prediction of post-
mining water quality, all three designated different numbers and ranges of NP and NNP to predict post-mining water quality. Also, these ranges only represented trends in the relationship of NP and NNP to water quality prediction, and all sites did not fit the predictions. For these reasons, further examination of ABA data with more sites is needed in the prediction of post-mining water quality.
Objectives This study collected ABA information and permit maps from 28 surface mined sites in West Virginia to determine MPA, NP, NNP and NP/MPA ratio based on precise mass-weighted calculations of overburden materials. These ABA parameters were then compared with post-mining water quality to determine which parameters most accurately predicted post-mining water quality.
Methods Selection of Sites Study sites (Table 2 and Figure 1) were chosen to represent surface mining operations throughout the state of West Virginia. No special consideration was given to the surface mining area, coal seam, mining method, special handling plans, or past post-mining water quality. In all sites, special handling plans were not considered and estimates were based on overburden properties only from drill cores and ABA calculations. If alkaline addition was practiced, the amount of material was added to the overall NP of the site.
Sites were selected from mine operator files or from surface mine permits on file with the WV Division of Environmental Protection. To ensure the most accurate ABA calculations and evaluations, each site had to meet the following five criteria. First, detailed maps were needed to show the boundaries of mining, location of core holes, coal outcrops, depth of overburden, and post-mining water sampling points. Second, a complete ABA data set was required from overburden cores drilled above or near the highest point of mining (ABA data must include depth, thickness, rock type, %S and NP for all layers down to and including the coal pavement). Third, we needed to know the amounts of alkaline addition used during mining. Fourth, we wanted a data included flow, pH, alkalinity, acidity, iron, aluminum, and manganese. Twenty-five sites had data for at least five separate sampling times. The number of samples ranged from 5 to 13 water quality samples and the acidity/alkalinity values were averaged to determine the net alkalinity value of post-mining discharge quality for each site. Most of the sites (18 of 28) had post-mining water data taken from two to five years after completion of the mining, 8 sites had water sampled between 5 and 15 years after completion, and two sites had water quality taken more than 15 years after completion. Only one water sample had been taken at three of the 28 sites, and each of these was taken and analyzed in the fall of 2000. Other records and regulatory personnel were contacted to ascertain that these one-time samples represented the water quality on the site.

6
Table 2: Sites, locations and descriptions of surface mine sites used in this study for Acid-Base Accounting evaluation.
Site Ref County Method Acres Coal Seam1 Drainage Quality Al Clay Contour 27 MK Net acid AR Webster Contour 87 UF, M/U Kit Net alkaline Bf Preston Contour 18 UF Net acid BN Monongalia Contour 17 Waynesburg Net alkaline CF Monongalia Contour 10 Waynesburg Net acid
CH1 Monongalia Contour 33 Waynesburg Net alkaline CH2 Monongalia Contour 143 Waynesburg Net alkaline Cr Preston Contour 4 UF Net acid D2 Preston Contour 15 UF Net acid DC Grant Contour 91 UF Net alkaline EE Preston Contour 38 UF Net acid FM Preston Coutour 116 LF, UK Net alkaline F2 Kanawha Mtntop 96 5/6 B, UK Net alkaline GF Preston Contour 7 UF Net alkaline HG Webster Contour 206 UF, U/M Kit Net alkaline HP Lewis/Upshur Contour 18 Redstone/Pitt Net acid Id Preston Contour 5 Bakerstown Net alkaline IL Preston Contour 9 UF Net acid
KE Monongalia Contour 153 Waynesburg Net alkaline L2 Fayette Contour 78 Alma-Eagle Net alkaline MC Nicholas Contour 70 Gilbert, Eagle Net alkaline ME Monongalia Contour 60 Sewickley, Red Net alkaline NA Mineral Area 21 Bakerstown Net alkaline OS Monongalia Contour 37 Waynesburg Net alkaline PM Fayette Contour 18 Glenalum Tunnel Net alkaline PR Clay Contour 7 UK Net alkaline St Preston Contour 21 Bakerstown Net alkaline TM Nicholas Contour 83 U/M Kit, 5B Net alkaline
1Coal seam abbreviations: UF=Upper Kittanning, MK=Middle Kittanning, LK=Lower Kittanning,
UF=Upper Freeport, LF=Lower Freeport, 5B=Five-Block, 6B=Six-Block, Pitt=Pittsburgh, Red=Redstone.
7
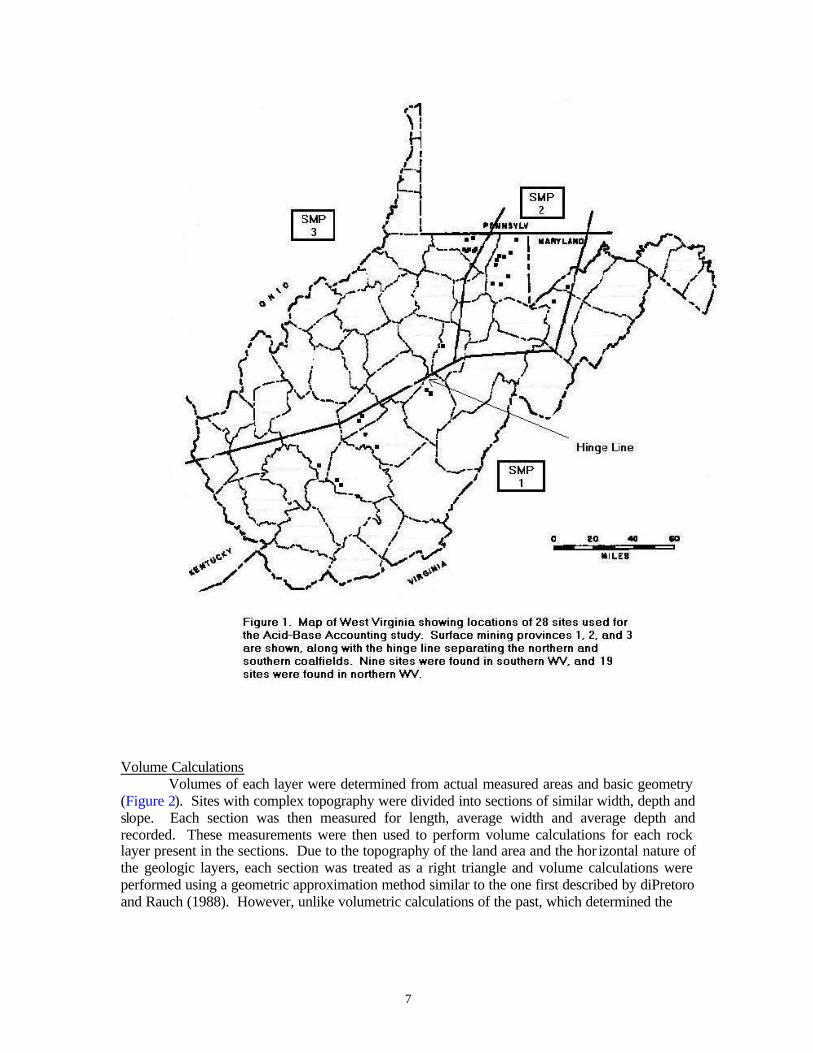
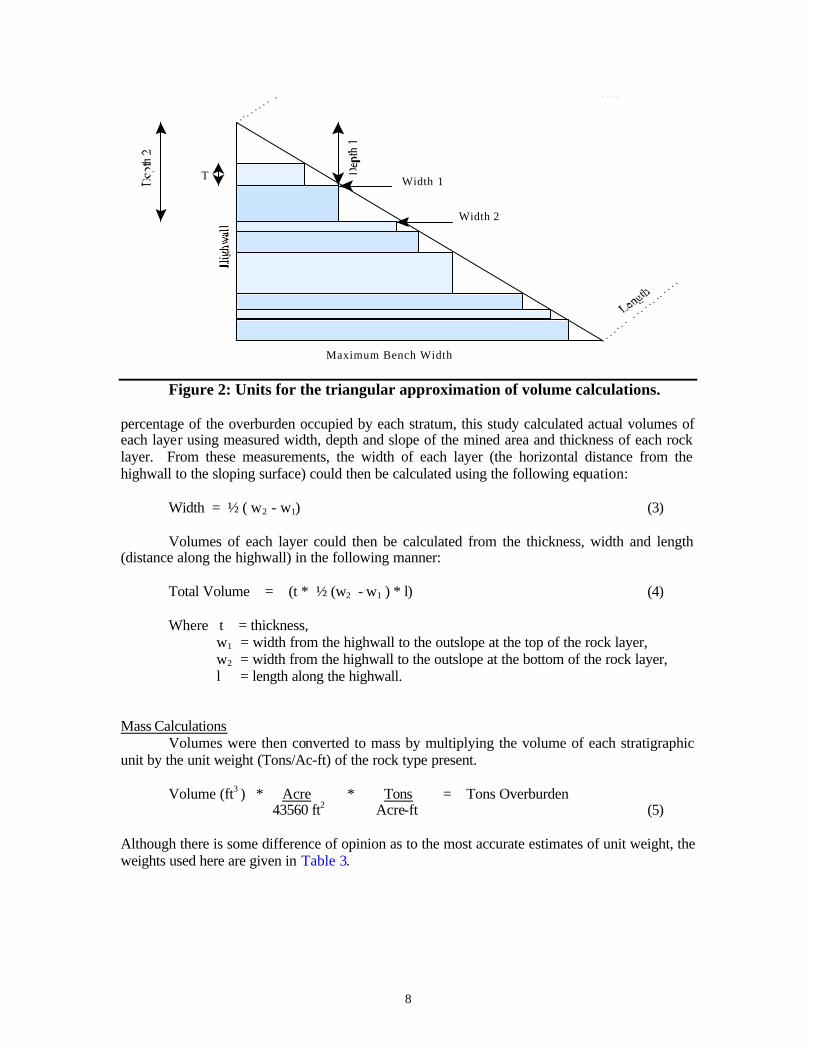
Volume Calculations Volumes of each layer were determined from actual measured areas and basic geometry (Figure 2). Sites with complex topography were divided into sections of similar width, depth and slope. Each section was then measured for length, average width and average depth and recorded. These measurements were then used to perform volume calculations for each rock layer present in the sections. Due to the topography of the land area and the hor izontal nature of the geologic layers, each section was treated as a right triangle and volume calculations were performed using a geometric approximation method similar to the one first described by diPretoro and Rauch (1988). However, unlike volumetric calculations of the past, which determined the
8
Width 1
Width 2
T
Maximum Bench Width
Figure 2: Units for the triangular approximation of volume calculations. percentage of the overburden occupied by each stratum, this study calculated actual volumes of each layer using measured width, depth and slope of the mined area and thickness of each rock layer. From these measurements, the width of each layer (the horizontal distance from the highwall to the sloping surface) could then be calculated using the following equation: Width = ½ ( w2 - w1) (3)
Volumes of each layer could then be calculated from the thickness, width and length
(distance along the highwall) in the following manner: Total Volume = (t * ½ (w2 - w1 ) * l) (4)
Where t = thickness, w1 = width from the highwall to the outslope at the top of the rock layer,
w2 = width from the highwall to the outslope at the bottom of the rock layer, l = length along the highwall.
Mass Calculations Volumes were then converted to mass by multiplying the volume of each stratigraphic unit by the unit weight (Tons/Ac-ft) of the rock type present. Volume (ft3 ) * Acre * Tons = Tons Overburden 43560 ft2 Acre-ft (5) Although there is some difference of opinion as to the most accurate estimates of unit weight, the weights used here are given in Table 3.

9
Table 3. Unit weight (tons/ac-ft) of rocks used in this study to calculate volumes and tonnage of overburden materials (Caterpillar, 1991). Rock Type Unit Weight (Tons/Ac-ft) Soil 2037 Sandstone 3152 Shale 3623 SS/SH 3388 Mudstone 3658 Limestone 3549 Coal 1845 The tons of overburden present in each layer is easily used to convert %S and NP into MPA and NP (both in tons) in the following manner: Tons Overburden * (%S * 31.25) Tons = Tons MPA 1000 Tons Overburden (8) Tons Overburden * Tons NP = Tons NP 1000 Tons Overburden (9) Development of Spreadsheet Due to the nature of volume and mass calculations, we developed a computer spreadsheet to expedite the process similar to one mentioned by Smith and Brady (1990). This Simmons & Skousen (S&S) spreadsheet is a modification of the Pennsylvania spreadsheet developed by the PADER. Figure 3 shows a sample of a completed spreadsheet for one of our sites (St site) using the S&S method. Equations in the spreadsheet are identical to the volume and mass calculations outlined in the previous section of this paper. Sites with complex topography can be divided into sections of similar width, depth, and slope. The addition of any alkaline materials can be added to the total NP. Total overburden, MPA, NP, NNP and NP/MPA ratio are calculated for the entire site and reported in a summary table in tons and in tons per thousand tons (t/1000 t) overburden.

10
Figure 3. Example of the St site spreadsheet used to calculate volumes and tonnages of overburden moved
and the amounts of neutralizing and acid-producing materials based on Acid-Base Accounting values.
Unit Weight Tons/Acre-ft Total acres: 21
SOIL SOIL 2037 inches tons
SANDSTONE SS 3152 Alk. Added: 0 SHALE SH 3623 tons tons/1000 tons
SS/SH SS/SH 3388 Overburden: 2849661 n/a COAL COAL 1845 Total MPA: 15142 5
Totals MUDSTONE MD 3658 Total NP: 317160 111
LIMESTONE LS 3549 Total NNP: 302018 106
NP/MPA Ratio: 21
Rock Unit Weight Spoiled Interval Type (T/Ac-ft) Ratio Volume (ft3) Mass (Tons) %S NP MPA (Tons) NP (Tons) NNP (Tons)
1 LOSS FALSE 1 236819 0 0 0 0 2 SOIL 2037 1 391474 18307 0 7 42 137 95 3 SS 3152 1 616659 44621 0 1 10 63 54
4 SH 3623 1 819343 68147 0 22 0 1500 1500 5 SH 3623 1 1039040 86420 0 170 3 14685 14683 6 SH 3623 1 1292253 107480 0 274 3 29482 29478
7 LS 3549 1 1582582 128939 0 576 0 74219 74219 8 SS 3152 1 1947367 140911 0 129 4 18171 18166 9 SH 3623 1 2322283 193150 0 44 585 8531 7946
10 SH 3623 1 2713441 225684 0 17 14 3925 3911 11 SH 3623 1 3119092 259423 0 80 16 20671 20655 12 SH 3623 1 3553617 295564 0 79 74 23320 23246
13 SS 3152 1 3989018 288645 0 44 126 12799 12672 14 SS 3152 1 4424419 320151 0 137 190 43720 43530 15 SS 3152 1 4859819 351656 0 149 956 52425 51469
16 SH 3623 1 3124884 259905 1 41 11290 10742 -548 17 COAL 1845 0.1 3281628 13899 2 9 686 120 -566 18 SH 3623 1 562177 46758 1 57 1141 2651 1510
11
Results and Discussion
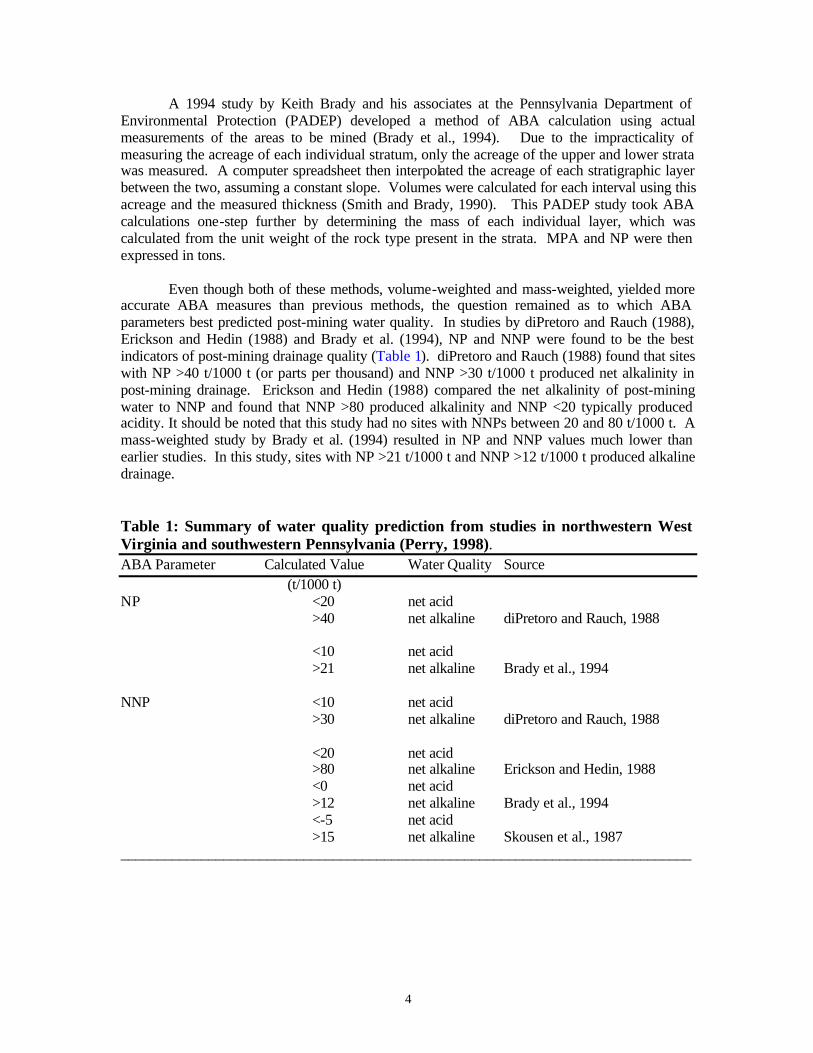
Table 2 lists the 28 sites in alphabetical order and provides information on the location (Figure 1), size, coal seam mined, and the net drainage quality of each site. Nine of the 28 sites are found in southern West Virginia (Clay, Fayette, Kanawha, Nicholas, and Webster Counties). The remaining 19 northern West Virginia sites include nine sites in Preston, seven sites in Monongalia, and one each in Lewis/Upshur, Mineral, and Grant Counties. The coal geology of West Virginia is divided into the northern and southern coalfields, both of which were formed during the Pennsylvanian System (Barlow, 1974). The southern coalfield contains coal seams found in the Pottsville Group (Pocahontas, New River, and Kanawha Formations), which generally have higher overall quality (higher rank and heating value) and lower sulfur and ash contents than northern coals. The northern coalfield contains coal seams in the Allegheny, Conemaugh, and Monongahela Groups, which are generally high in sulfur and ash content. The high sulfur content of the coal and associated rocks in the northern coalfield makes mining of these coals prone to acid mine drainage generation. The dividing line between coalfields is the hinge line (Figure 1).
The geology in the northern coalfield is also separated by the amount of carbonate or
calcareous material in the rocks. The eastern section of the northern coalfield is characterized by low amounts of calcareous material or limestone in the strata, while the western section may have limestone or other alkaline-producing rocks associated with coal seams. Smith et al. (1976) separated these unique geologic settings into “surface mining provinces” (SMP on Figure 1). SMP 1 occurs in southern WV and is comprised of low sulfur and low carbonate rocks. SMP 2 occurs in the eastern section of the northern coalfield and contains coals and associated rocks with high sulfur and low carbonate content. SMP 3 is found in the western section of the northern coalfield with rocks containing high sulfur and high carbonate content.
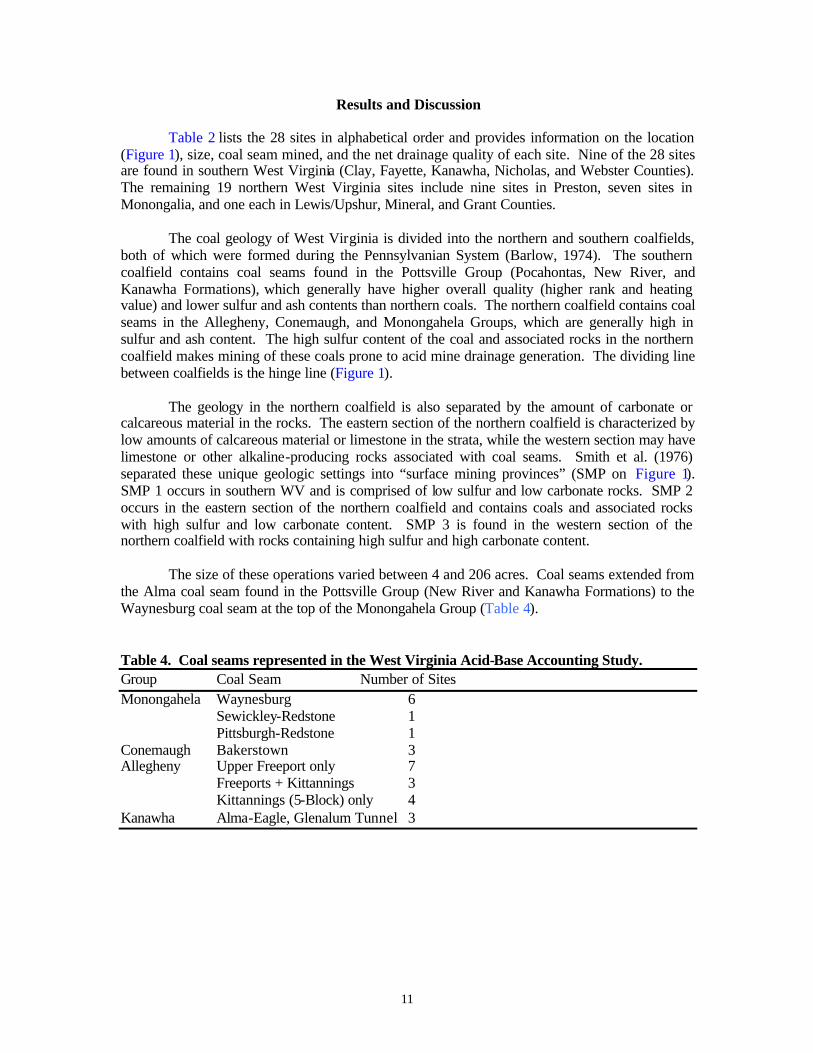
The size of these operations varied between 4 and 206 acres. Coal seams extended from
the Alma coal seam found in the Pottsville Group (New River and Kanawha Formations) to the Waynesburg coal seam at the top of the Monongahela Group (Table 4).
Table 4. Coal seams represented in the West Virginia Acid-Base Accounting Study. Group Coal Seam Number of Sites Monongahela Waynesburg 6
Sewickley-Redstone 1 Pittsburgh-Redstone 1
Conemaugh Bakerstown 3 Allegheny Upper Freeport only 7 Freeports + Kittannings 3 Kittannings (5-Block) only 4 Kanawha Alma-Eagle, Glenalum Tunnel 3

12
Eight of the 28 sites gave net acid water. We did not specifically select northern West Virginia sites, but we were interested in sites that produced acid mine drainage, and very few sites after mining and reclamation in southern West Virginia produce net acid water quality. The areas in Grant, Mineral, Preston, and eastern Monongalia Counties are also of much interest in our study because the coal and overburden geology varies greatly in SMP 2. The mined overburdens for the coal seams within the Allegheny, Conemaugh, and Monongahela Groups (i.e., the Kittannings, Freeports, Bakerstown, and Pittsburgh coal seams) can produce either acid or alkaline mine drainage depending on the dominant overburden types on that specific site. Of the eight sites that gave net acid water, five were from Upper Freeport surface mines in Preston County. However, one Preston County Upper Freeport mine in our study produced net alkaline water. Two operations in Preston County mined the Bakerstown coal, which produced alkaline post-mining water quality, and the other site in this county was an alkaline-producing Kittanning surface mine. Table 5 summarizes the calculations from conducting our overburden volume and mass analyses based on permit map topography, mine size, and overburden cores. From these values, the NP/MPA ratio for each site was calculated. Table 5 lists the sites according to NP/MPA ratio with lines separating NP/MPA ratios <1, 1-2, 2-4, and >4.
13
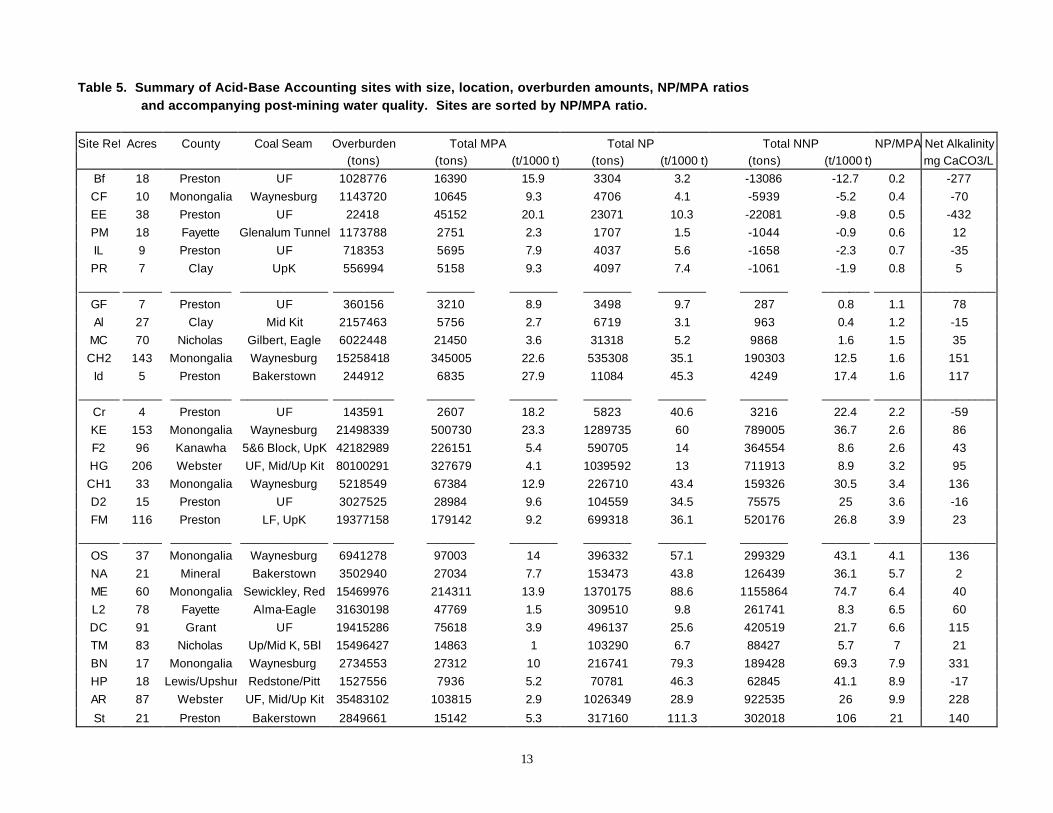
Table 5. Summary of Acid-Base Accounting sites with size, location, overburden amounts, NP/MPA ratios and accompanying post-mining water quality. Sites are sorted by NP/MPA ratio.
Site Ref Acres County Coal Seam Overburden Total MPA Total NP Total NNP NP/MPA Net Alkalinity (tons) (tons) (t/1000 t) (tons) (t/1000 t) (tons) (t/1000 t) mg CaCO3/L
Bf 18 Preston UF 1028776 16390 15.9 3304 3.2 -13086 -12.7 0.2 -277 CF 10 Monongalia Waynesburg 1143720 10645 9.3 4706 4.1 -5939 -5.2 0.4 -70 EE 38 Preston UF 22418 45152 20.1 23071 10.3 -22081 -9.8 0.5 -432 PM 18 Fayette Glenalum Tunnel 1173788 2751 2.3 1707 1.5 -1044 -0.9 0.6 12 IL 9 Preston UF 718353 5695 7.9 4037 5.6 -1658 -2.3 0.7 -35 PR 7 Clay UpK 556994 5158 9.3 4097 7.4 -1061 -1.9 0.8 5
______ ______ _________ _____________ _________ _______ _______ _______ _______ _______ _______ __________________GF 7 Preston UF 360156 3210 8.9 3498 9.7 287 0.8 1.1 78 Al 27 Clay Mid Kit 2157463 5756 2.7 6719 3.1 963 0.4 1.2 -15
MC 70 Nicholas Gilbert, Eagle 6022448 21450 3.6 31318 5.2 9868 1.6 1.5 35 CH2 143 Monongalia Waynesburg 15258418 345005 22.6 535308 35.1 190303 12.5 1.6 151
Id 5 Preston Bakerstown 244912 6835 27.9 11084 45.3 4249 17.4 1.6 117 ______ ______ _________ _____________ _________ _______ _______ _______ _______ _______ _______ __________________
Cr 4 Preston UF 143591 2607 18.2 5823 40.6 3216 22.4 2.2 -59 KE 153 Monongalia Waynesburg 21498339 500730 23.3 1289735 60 789005 36.7 2.6 86 F2 96 Kanawha 5&6 Block, UpK 42182989 226151 5.4 590705 14 364554 8.6 2.6 43 HG 206 Webster UF, Mid/Up Kit 80100291 327679 4.1 1039592 13 711913 8.9 3.2 95 CH1 33 Monongalia Waynesburg 5218549 67384 12.9 226710 43.4 159326 30.5 3.4 136 D2 15 Preston UF 3027525 28984 9.6 104559 34.5 75575 25 3.6 -16 FM 116 Preston LF, UpK 19377158 179142 9.2 699318 36.1 520176 26.8 3.9 23
______ ______ _________ _____________ _________ _______ _______ _______ _______ _______ _______ __________________OS 37 Monongalia Waynesburg 6941278 97003 14 396332 57.1 299329 43.1 4.1 136 NA 21 Mineral Bakerstown 3502940 27034 7.7 153473 43.8 126439 36.1 5.7 2 ME 60 Monongalia Sewickley, Red 15469976 214311 13.9 1370175 88.6 1155864 74.7 6.4 40 L2 78 Fayette Alma-Eagle 31630198 47769 1.5 309510 9.8 261741 8.3 6.5 60 DC 91 Grant UF 19415286 75618 3.9 496137 25.6 420519 21.7 6.6 115 TM 83 Nicholas Up/Mid K, 5Bl 15496427 14863 1 103290 6.7 88427 5.7 7 21 BN 17 Monongalia Waynesburg 2734553 27312 10 216741 79.3 189428 69.3 7.9 331 HP 18 Lewis/Upshur Redstone/Pitt 1527556 7936 5.2 70781 46.3 62845 41.1 8.9 -17 AR 87 Webster UF, Mid/Up Kit 35483102 103815 2.9 1026349 28.9 922535 26 9.9 228
St 21 Preston Bakerstown 2849661 15142 5.3 317160 111.3 302018 106 21 140
14
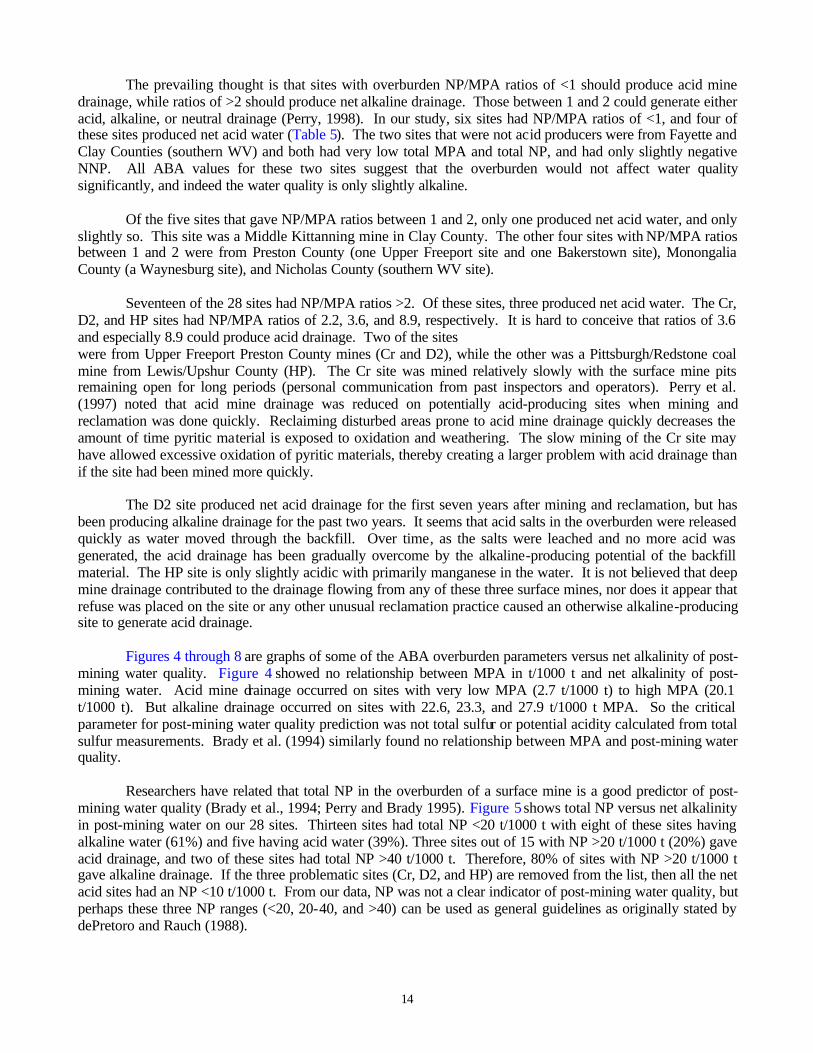
The prevailing thought is that sites with overburden NP/MPA ratios of <1 should produce acid mine drainage, while ratios of >2 should produce net alkaline drainage. Those between 1 and 2 could generate either acid, alkaline, or neutral drainage (Perry, 1998). In our study, six sites had NP/MPA ratios of <1, and four of these sites produced net acid water (Table 5). The two sites that were not acid producers were from Fayette and Clay Counties (southern WV) and both had very low total MPA and total NP, and had only slightly negative NNP. All ABA values for these two sites suggest that the overburden would not affect water quality significantly, and indeed the water quality is only slightly alkaline.
Of the five sites that gave NP/MPA ratios between 1 and 2, only one produced net acid water, and only slightly so. This site was a Middle Kittanning mine in Clay County. The other four sites with NP/MPA ratios between 1 and 2 were from Preston County (one Upper Freeport site and one Bakerstown site), Monongalia County (a Waynesburg site), and Nicholas County (southern WV site).
Seventeen of the 28 sites had NP/MPA ratios >2. Of these sites, three produced net acid water. The Cr,
D2, and HP sites had NP/MPA ratios of 2.2, 3.6, and 8.9, respectively. It is hard to conceive that ratios of 3.6 and especially 8.9 could produce acid drainage. Two of the sites were from Upper Freeport Preston County mines (Cr and D2), while the other was a Pittsburgh/Redstone coal mine from Lewis/Upshur County (HP). The Cr site was mined relatively slowly with the surface mine pits remaining open for long periods (personal communication from past inspectors and operators). Perry et al. (1997) noted that acid mine drainage was reduced on potentially acid-producing sites when mining and reclamation was done quickly. Reclaiming disturbed areas prone to acid mine drainage quickly decreases the amount of time pyritic material is exposed to oxidation and weathering. The slow mining of the Cr site may have allowed excessive oxidation of pyritic materials, thereby creating a larger problem with acid drainage than if the site had been mined more quickly.
The D2 site produced net acid drainage for the first seven years after mining and reclamation, but has
been producing alkaline drainage for the past two years. It seems that acid salts in the overburden were released quickly as water moved through the backfill. Over time, as the salts were leached and no more acid was generated, the acid drainage has been gradually overcome by the alkaline-producing potential of the backfill material. The HP site is only slightly acidic with primarily manganese in the water. It is not believed that deep mine drainage contributed to the drainage flowing from any of these three surface mines, nor does it appear that refuse was placed on the site or any other unusual reclamation practice caused an otherwise alkaline-producing site to generate acid drainage.
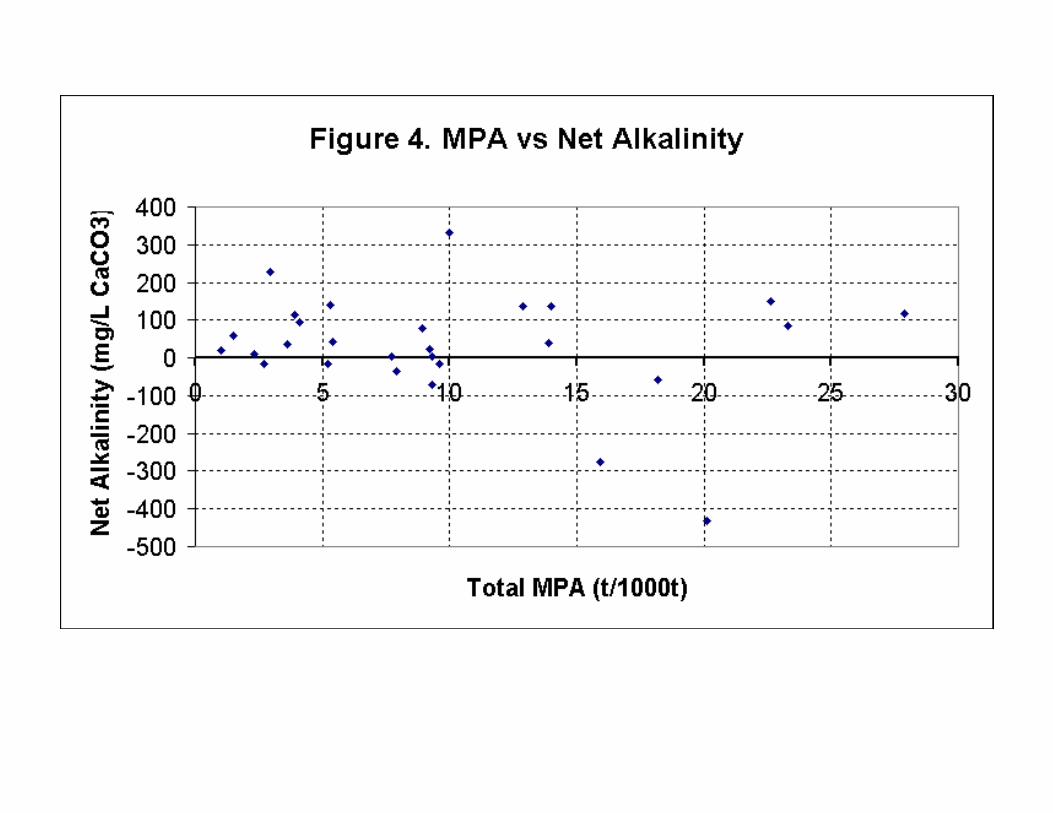
Figures 4 through 8 are graphs of some of the ABA overburden parameters versus net alkalinity of post-mining water quality. Figure 4 showed no relationship between MPA in t/1000 t and net alkalinity of post-mining water. Acid mine drainage occurred on sites with very low MPA (2.7 t/1000 t) to high MPA (20.1 t/1000 t). But alkaline drainage occurred on sites with 22.6, 23.3, and 27.9 t/1000 t MPA. So the critical parameter for post-mining water quality prediction was not total sulfur or potential acidity calculated from total sulfur measurements. Brady et al. (1994) similarly found no relationship between MPA and post-mining water quality. Researchers have related that total NP in the overburden of a surface mine is a good predictor of post-mining water quality (Brady et al., 1994; Perry and Brady 1995). Figure 5 shows total NP versus net alkalinity in post-mining water on our 28 sites. Thirteen sites had total NP <20 t/1000 t with eight of these sites having alkaline water (61%) and five having acid water (39%). Three sites out of 15 with NP >20 t/1000 t (20%) gave acid drainage, and two of these sites had total NP >40 t/1000 t. Therefore, 80% of sites with NP >20 t/1000 t gave alkaline drainage. If the three problematic sites (Cr, D2, and HP) are removed from the list, then all the net acid sites had an NP <10 t/1000 t. From our data, NP was not a clear indicator of post-mining water quality, but perhaps these three NP ranges (<20, 20-40, and >40) can be used as general guidelines as originally stated by dePretoro and Rauch (1988).

15
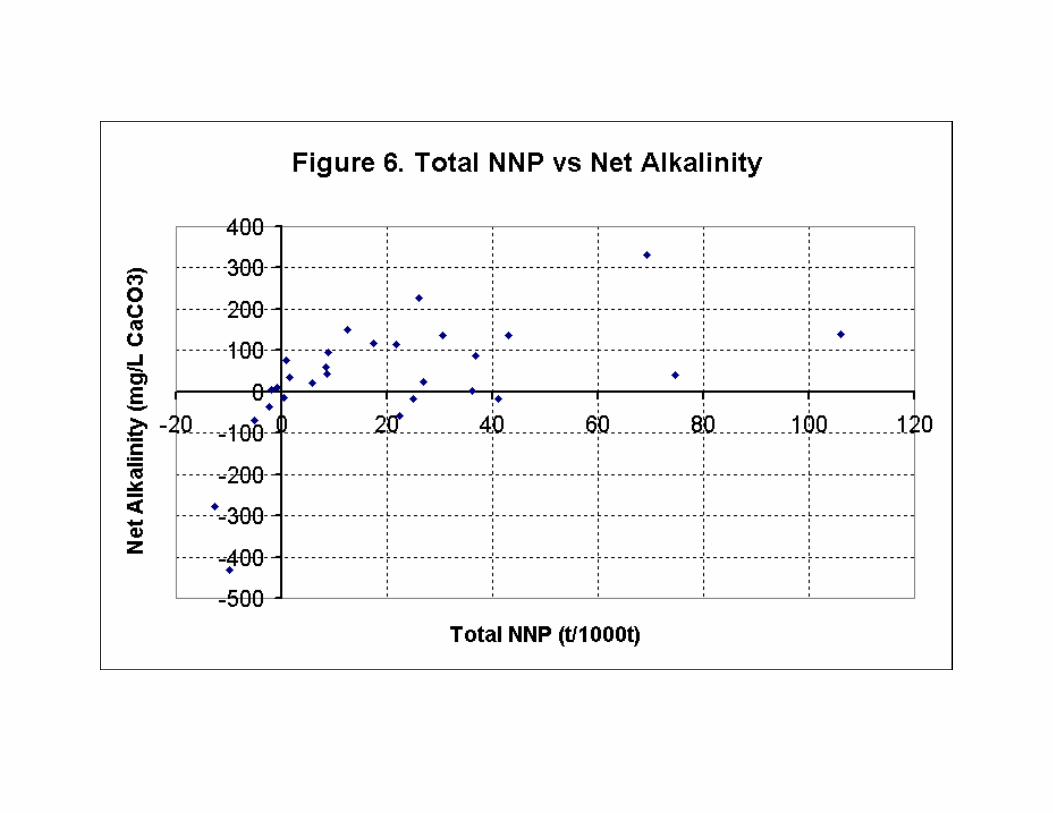
Total NNP combines MPA and NP into one variable, which was plotted against net alkalinity (Figure 6). Past predictions have used >5 or >12 NNP (Brady et al., 1994; Perry and Brady, 1995), >15 NNP (Skousen et al., 1987), and >30 NNP (diPretoro and Rauch, 1988) as values that should produce net alkaline water. Values of <5 NNP (Brady et al., 1994; Perry and Brady, 1995; Skousen et al., 1987) and <10 NNP (diPretoro and Rauch, 1988; Erickson and Hedin, 1988) have been used as predictors of acid drainage.
In our data, those sites with high negative NNP values (<-2.3 NNP in Table 5) gave acid drainage, while
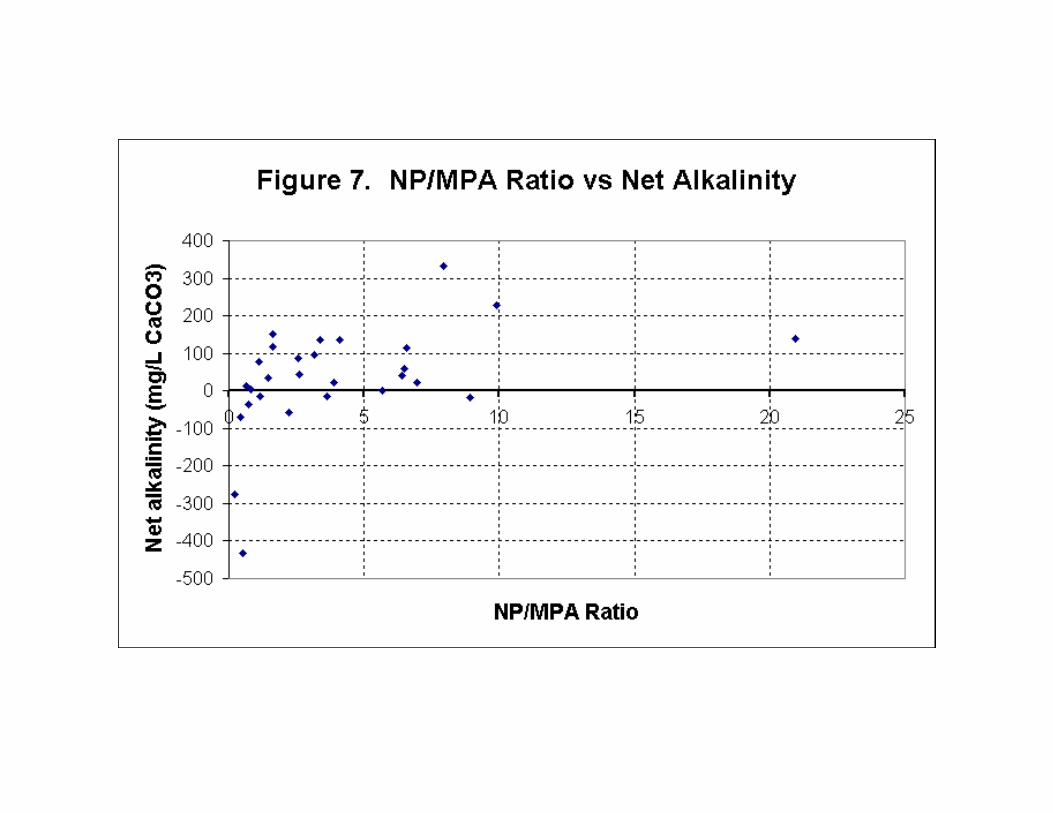
five other sites with nearly neutral NNP values (-1.9 to 1.6) gave slightly acidic or alkaline drainage. Three sites (the same problematic sites as noted above), all with >20 NNP, produced acid drainage (-59 to -16 net alkalinity). Again, if these three sites are excluded, all of the acid sites had NNP <0.4 t/1000 t. Figure 7, plotting NP/MPA ratio against net alkalinity, shows the same trend as NNP versus net alkalinity. The same three sites with acid water and high NP/MPA ratios are apparent on this graph, while the other five acid sites fit the general prediction pattern of NP/MPA ratios of <1 producing acid drainage. So, in general, an NP/MPA ratio of <1 will produce mostly acid drainage sites, between 1-2 will produce mostly alkaline drainage sites, while NP/MPA ratios of >2 will produce alkaline drainage with some exceptions.
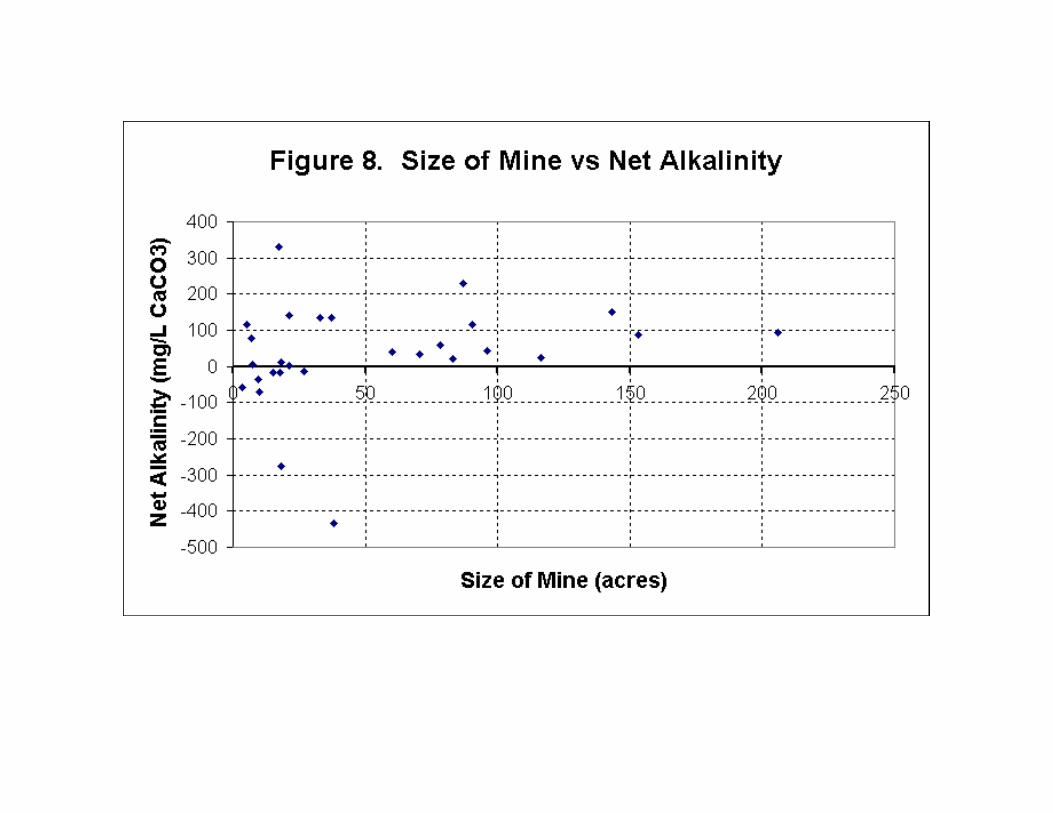
We wondered if any relationship existed between the size of the mine (equating to total tons of overburden moved) and net alkalinity of post-mining water (Figure 8). All 11 sites >50 acres gave alkaline water, while eight of the 17 sites <50 acres in size gave acid water. Small mines move less overburden and therefore have less chance of intercepting calcareous strata.
Summary and Conclusions
Acid-base accounting has been adopted to help in the prediction of post-mining water quality on surface mines. Twenty-eight sites were selected from West Virginia Division of Environmental Protection (WVDEP) files and from operator files. Permit boundaries from topographic maps were obtained along with overburden core information to estimate the amounts of overburden moved on each site and the amounts of neutralizing and acid-producing material. From these estimates, total MPA, NP, NNP and NP/MPA ratios were determined. Post-mining water quality was obtained from WVDEP files or was determined by our sampling and analysis. Six sites from our pool of 28 sites had NP/MPA ratios of <1, and four of these six sites (67%) produced acid drainage. The two remaining sites with NP/MPA ratios <1 were from southern WV and produced only slightly alkaline drainage.
Five of the 28 sites had NP/MPA ratios of between 1 and 2, and only one site of these five (20%)
produced acid drainage, and only slightly so. Seven sites had NP/MPA ratios between 2 and 4, and two of the seven sites produced acid drainage (29%). Combining these two categories (NP/MPA ratio between 1 to 4) gives 3 acid sites out of 12 total (25% acid sites). Ten sites out of 28 had NP/MPA ratios >4, and one of these sites (10%) produced slightly acid water.
From these data, all sites in northern West Virginia (four sites) with a NP/MPA ratio <1 produced acid drainage. For all sites with an NP/MPA ratio >1, 18 out of 22 (82%) produced alkaline drainage, and only one site with an NP/MPA ratio of >1 (Upper Freeport Preston County mine) gave post-mining net acid water above 50 mg/L. The other three net acid sites with NP/MPA ratios >1 produced only slightly acid water (-15 to -17 mg/L acidity).
16
Acknowledgments The authors express appreciation to Ron Hamric of Patriot Mining Company, and Steve Shaffer of Buffalo Coal Company for information on several sites. We also thank Eric Perry and Keith Brady for guidance and assistance during overburden calculations and helpful comments.
Literature Cited
Barlow, J.A., 1974. Coal and coal mining in West Virginia. Coal Geology Bull. No. 2. West Virginia Geological and Economic Survey, Morgantown, WV.
Brady, K.B.C. and C.A. Cravotta III, 1992. Acid base accounting: an improved method of interpreting overburden chemistry to predict quality of coal mine drainage. In: Proceedings: Thirteenth Annual West Virginia Surface Mine Drainage Task Force Symposium, Morgantown, WV. April 8-9, 1992, West Virginia Mining and Reclamation Association, Charleston, WV.
Brady, K.B.C., E.F. Perry, R.L. Beam, D.C. Bisko, M.D. Gardner and J.M. Tarantino, 1994. Evaluation of acid base accounting to predict the quality of drainage at surface coal mines in Pennsylvania, U.S.A. p. 138-147. In: International Land Reclamation and Mine Drainage Conference and Third International Conference on the Abatement of Acidic Drainage, Vol. 1, U.S. Bureau of Mines IC 9183, Pittsburgh, PA.
Caterpillar, 1991. Caterpillar performance handbook. 22nd Ed. Peoria, IL. Cravotta, C.A. III, K.B.C. Brady, M.W. Smith, and R.L. Beam, 1990. Effectiveness of alkaline addition at surface
mines in preventing or abating acid mine drainage: Part I. Geochemical considerations. p. 221-226. In: Proceedings: 1990 Mining and Reclamation Conference and Exhibition, April 23-26, 1990, Charleston, WV.
diPretoro, R.S. and H.W. Rauch, 1988. Use of acid-base accounts in premining prediction of acid drainage potential: a new approach from Northern West Virginia. p. 1-10. In: Proceedings: Mine Drainage and Surface Mine Reclamation, Vol. 1, U.S. Bureau of Mines IC 9183, Pittsburgh, PA.
Erickson, P.M. and R. Hedin, 1988. Evaluation of overburden analytical methods as a means to predict post-mining coal mine drainage quality. p. 11-19. In: Proceedings: Mine Drainage and Surface Mine Reclamation, Vol. 1, U.S. Bureau of Mines IC 9183, Pittsburgh, PA.
Kania, T., 1998. Laboratory methods for acid-base accounting: An update. Chapter 6. In: Coal Mine Drainage Prediction and Pollution Prevention in Pennsylvania, PA Department of Environmental Protection. Harrisburg, PA.
Perry, E., 1998. Interpretation of acid-base accounting. Chapter 11. In: Coal Mine Drainage Prediction and Pollution Prevention in Pennsylvania, PA Department of Environmental Protection. Harrisburg, PA.
Perry, E., and K. Brady. 1995. Influence of neutralization potential on surface mine drainage quality in Pennsylvania. In: Proceedings of the Sixteenth West Virginia Surface Mine Drainage Task Force Symposium, April 4-5, 1995, Morgantown, WV.
Perry, E., M. Gardner, and R. Evans, 1997. Effects of acid material handling and disposal on coal mine drainage quality. p. 1007-1026. In: Proceedings Fourth International Conference on Acid Rock Drainage, Vol. III, Vancouver, BC.
Skousen, J.G., 2000. Static tests for predicting coal mine drainage. In: Acid mine drainage prediction in the Eastern United States. Acid Drainage Technology Initiative (ADTI) Technical Report. National Mining Association and National Mine Land Reclamation Center, Morgantown, WV. Anticipated release date is April 2001.
Skousen, J., J. Renton, H. Brown, P.Evans, B. Leavitt, K. Brady, L. Cohen, and P. Ziemkiewicz, 1997. Neutralization potential of overburden samples containing siderite. J. Environmental Quality 26:673-681.
Skousen, J.G., J.C. Sencindiver, and R.M. Smith, 1987. A review of procedures for surface mining and reclamation in areas with acid-producing materials. National Research Center for Coal and Energy, National Mine Land Reclamation Center. Morgantown, WV.
Skousen, J.G., R.M. Smith, and J.C. Sencindiver, 1990. Development of the acid-base account. Green Lands Vol. 20 (1): 32-37, West Virginia Mining and Reclamation Association, Charleston, WV.
Smith, M.W. and K.B.C. Brady, 1990. Evaluation of acid-base accounting data using computer spreadsheets. p. 213-219. In: Proceedings: 1990 Mining and Reclamation Conference and Exhibition, Charleston, WV.
Smith, R.M., A.A. Sobek, T. Arkle, J.C. Sencindiver, and J.R. Freeman, 1976. Extensive overburden potentials for soil and water quality. EPA-600/2-76-184. U.S. Environmental Protection Agency, Cincinnati, OH.
Sobek, A.A., J.G. Skousen, and S.E. Fisher, Jr., 2000. Chemical and physical properties of overburdens and minesoils. P. 77-104. In: Reclamation of Drastically Disturbed Lands, Agronomy No. 41, American Society of Agronomy, Madison, WI.
West Virginia Surface Mine Law, 1971. West Virginia Department of Mines. Charleston, WV.