the use of activity-based costing with competitive ... · 2 the use of activity-based costing with...
TRANSCRIPT

The Use of Activity-based Costing with Competitive Strategies:
Impact on Firm Performance
Kip R. Krumwiede*
Associate Professor
Department of Accounting
Robins School of Business
University of Richmond
1 Gateway Road
University of Richmond, VA 23173 USA
Phone: (804)287-1835
Shannon L. Charles
Assistant Professor
School of Accountancy
Brigham Young University
540 TNRB
Provo, Utah 84602 USA
March 2011
* Corresponding author.
Data Availability: The data used in this study belong to the IMA and can only be used with
permission.
Acknowledgements
We appreciate the support of the Institute of Management Accountants and the research
assistance of Amber Webb and Matt Sommers. We also wish to thank Taylor Randall, Monte
Swain, and Sally Widener and workshop participants at Brigham Young University and the
University of Richmond for helpful comments on previous versions of this paper.

2
The Use of Activity-based Costing with Competitive Strategies:
Impact on Firm Performance
Abstract
In spite of the many research studies regarding activity-based costing and management
(ABCM), very few studies have examined its use in firms with differentiated competitive
strategies. This study investigates the relationships between the use of ABCM, competitive
strategy, and organizational performance. Based on a survey of U.S. firms, this study uses a
method inspired by Lillis and van Veen-Dirks (2008) to divide firms into strategy groups
based on their degree of emphasis on three strategic priorities (low price, flexibility, and
customer service). We find some evidence of a direct impact on firm performance by the use
of ABCM for firms with customer-service and low-price strategies. There is also strong
evidence of an indirect impact of ABCM on firm performance for each of the three strategy
types when used with certain other management control practices. This study supports
contingency theory and helps meet Chenhall’s (2003) call for research linking management
control system practices and firm strategy with organizational outcomes.
Keywords: Activity-based costing, competitive strategy, organizational performance, and
survey.
Data Availability: The data used in this study belong to the Institute of Management
Accountants and can only be used with permission.
1
The Use of Activity-based Costing with Competitive Strategies:
Impact on Firm Performance
INTRODUCTION
In the late 1980s and early 1990s, activity-based costing was hailed as a more
accurate costing methodology that provided decision makers with the more granular cost data
needed to make appropriate strategic decisions (Cooper and Kaplan 1988; Cooper et al. 1992;
Drucker 1995). A new term “Activity-based Management” was coined to mean the use of
activity-based costing to improve a business (Turney 1992).1 There have been many studies
of activity-based costing/management (ABCM) since then, but the prior literature relating to
the impact of ABCM on firm performance is mixed at best (Kennedy and Afflack-Graves
2001; Cagwin and Bouwman 2002; Ittner et al. 2002; Banker et al. 2008). There have also
been very few studies examining the use of ABCM with differentiated competitive strategies
(Bhimani et al. 2005).
One study that attempts to link groups of firms with similar strategic emphases,
management techniques, and management accounting practices, including ABCM, is an
innovative study by Chenhall and Langfield-Smith (1998) [CLS]. Using cluster analysis,
CLS found that firms emphasizing differentiation strategies and using most of the
management techniques and accounting practices had the highest performance. ABCM usage
was relatively low overall, but it was significantly stronger for higher-performing clusters
than for low-performing clusters. However, as an exploratory study, the CLS study had some
limitations in its methodology that make the results somewhat difficult to interpret. By
including strategic priorities, management techniques, and management accounting practices
in the same cluster analysis, the resulting clusters had mixed strategic priorities. For instance,
ABC benefits are highest for the highest performing cluster. But because this highest
2
performing cluster is a mix of the “customer service” and “flexibility” strategic priorities plus
all the management techniques and other accounting practices, it is unclear whether ABCM
is beneficial for firms with a customer service priority or a flexibility priority. Also, there
was only one “low price” cluster, which makes it difficult to compare the use of ABCM with
another lower-performing “low price” cluster to determine if ABCM has an impact on firm
performance.
This paper extends CLS by testing whether the use of ABCM with certain strategic
priorities leads to improved firm performance. Based on a survey of U.S. firms, we use factor
analysis based on strategic priorities to define three dimensions of strategy: customer service,
flexibility, and low price. Next, using a method inspired by Lillis and van Veen-Dirks (2008),
we dichotomize each of the three factor scores to identify firms with high emphasis or low
emphasis on each of the strategies. This identification allows us to classify firms into
relatively homogeneous strategy groups. We then examine empirically whether firm
performance is affected by the use of ABCM within certain strategic priorities and with other
management techniques and accounting practices including strong information system
quality, budgeting, and profitability analysis practices.
This study contributes to the literature in several ways. This study is the first to link
ABCM to firm performance for differentiated strategic priority groups. When ABCM is
tested as a main effect on firm performance, it has no impact. But when use of ABCM is
matched with customer service or low price strategies, we find evidence of a direct impact on
firm performance. We also find strong evidence of an indirect impact of ABCM on firm
performance for each of the three strategy types when used with certain other management

3
control practices. This study helps meet Chenhall’s (2003) call for research linking
management control system practices, firm strategy, and organizational outcomes.
The paper is organized as follows. First, we connect this study to the relevant prior
literature and develop hypotheses relating the use of ABCM with different strategic priorities
and with certain management techniques and accounting practices. Next, we describe the
study’s methodology, present the results, and relate the results back to prior studies. Finally,
we conclude with a summary of the study’s contributions and limitations.
RELEVANT PRIOR LITERATURE AND HYPOTHESES
Contingency theory suggests that all components of an organization must fit well with
each other if an organization is to perform optimally (Perrow 1967). Chenhall (2003) reviews
the literature from contingency-based research and suggests directions for the future. The
“conventional, functionalist contingency-based approach” to research assumes that
management control systems are implemented to achieve some desired organizational goals.
Optimal performance occurs when context, structure, and business practices are congruent.
Thus, high-performers tend to have a good fit and low performers tend to have a poorer fit.
Chenhall (2003) suggests that one of the most important recent additions to this literature is
the role of strategy. Other important factors cited included the role of contemporary
management practices (e.g., ABCM). He calls for research on the links between different
types of controls for operational, managerial, and strategic decisions and the relationship with
organizational performance.
Strategic Priorities
Prior literature has characterized competitive strategies in different ways. Miles and
Snow identified four general strategy types representing the intensity of product/market

4
development: prospectors, analyzers, defenders, and reactors.2 Porter (1980, 1985) also
identified three generic groups: differentiation, cost leadership, and focus (e.g., on a specific
market segment).3 Treacy and Wiersema (1995) disaggregate differentiation and classify
competitive strategies as product leadership, customer intimacy, and operational excellence
(similar to the cost leadership category). Chenhall and Langfield-Smith (1998) find three
generic strategy facets conceptually similar to Treacy and Wiersema: flexibility, customer
service, and low price.
Firms with a flexibility strategy, which resembles Treacy and Wiersema’s (1995)
“product leadership” strategy, strive to differentiate their products or services through
continual innovation and flexibility. The operating model should focus on invention of
unique features or services, fast design changes and product development, and the ability to
make rapid changes in volume or product mix.
Firms with a customer service strategy, (“customer intimacy” strategy in Treacy and
Wiersema’s framework), differentiate themselves by trying to deliver what individual
customers want. They cultivate relationships with customers by trying to meet (and exceed)
their expectations rather than necessarily trying to provide the latest product or lowest price.
The operating model should focus on satisfying customer needs with high quality products
and services, reliable delivery, effective post-sales support, and customized design features.
As suggested by Chenhall and Langfield-Smith (1998), successful “low-price”
companies focus on ensuring processes are highly cost efficient so that they can provide their
products or services at a cost relatively lower than their competitors (also Porter 1980, 1996;
Treacy & Wiersema 1995). They tend to invest heavily in modern and efficient facilities,
pursue cost reductions through product design and standardized offerings, and avoid

5
marginal customer accounts. Their management systems need to keep the organization
running smoothly and efficiently. The culture abhors waste and rewards efficiency.
Following a single strategy is difficult because organizations in most industries today
need to be both low cost producers and provide customers with high quality, timely and
reliable delivery (Chenhall 2003). Porter (1980) describes firms that pursue a mixed (i.e.,
joint) strategy as “stuck in the middle” destined to have lower performance than those with a
distinct (i.e., archetypal) strategy. A more recent view in the strategic management and
manufacturing management literatures is that the most successful firms are those that balance
multiple strategies (Chenhall 2003; Lillis and van Veen-Dirks 2008). As discussed earlier,
most of the clusters in the CLS (1998) study had mixed strategic priorities including the top-
performing cluster. Lillis and van Veen-Dirks (2008) provide an excellent discussion of joint
versus archetypal strategies and provide one of the few empirical studies of management
control system practices of firms with joint strategies.
ABCM and firm performance
Prior research testing for associations between use of ABCM and firm performance
has been mixed at best (Gordon and Silvester 1999; Ittner and Larcker 2001; Kennedy and
Afflack-Graves 2001; Cagwin and Bouwman 2002; Ittner et al. 2002; Banker et al. 2008).
Kennedy and Afflack-Graves (2001) provide the only evidence to date that ABCM has a
direct benefit on firm performance. They found significant superior stock returns for firms
adopting ABCM over non-adopting firms, although there was a 2-3 year delay between
implementation and the stock price benefits. They also found that the ABCM firms had
higher operating profit and return on equity than the non-adopting firms. However, they add
that, “While ABCM may provide a richer information base that leads to new management

6
insights, it is ultimately management that is responsible for taking new actions that lead to
value enhancement” (39).
Those studies that do find a connection between ABCM and firm performance
usually find these benefits are contingent upon its use with other initiatives or in certain
settings. Cagwin and Bouwman (2002) find a positive association between ABCM and ROI
when ABCM is used with other strategic initiatives in complex and diverse firms, where
costs are relatively important, and where there are a limited number of intra-company
transactions. Ittner et al. (2002) find that extensive ABC use has no direct impact on ROA or
manufacturing cost, but there is evidence that it has a positive indirect effect on
manufacturing cost through a plant’s quality level and improvements in cycle time. Ittner et
al. (2002) also find evidence that firms using ABC extensively have larger information
technology expenditures than non-ABC users and higher adoption of advanced
manufacturing practices (e.g., just-in-time, total quality management, employee
empowerment, customer and supplier partnerships).
Banker et al. (2008) find that ABC does not have a direct impact on plant
performance measures, but rather the impact on performance is mediated through
implementation of world-class manufacturing practices (e.g., JIT, TQM, benchmarking, etc.).
They suggest that ABC is an enabler for the development of process-centric capabilities
required to successfully implement these practices (Cooper and Kaplan 1991; Ittner and
Larcker 1997; Fullerton and McWatters 2002; Anderson et al. 2002).
Linking ABCM and strategy
Although there has been limited research regarding the impact of ABCM on firm
outcomes when used in conjunction with other initiatives, there has been very little research

7
examining its use in firms with different competitive strategies (Bhimani et al. 2005). Early
studies found “linkage to competitive strategy” to be a common factor related to ABCM
implementation success (Anderson 1995; Shields 1995; Foster and Swenson 1997;
Krumwiede 1998; Anderson and Young 1999; England & Gerdin 2008). However, linkage to
specific strategies was not considered. Gosselin (1997) hypothesized and found that business
units with a prospector strategy (also characterized as flexible organizations) were more
likely to adopt ABCM. Bhimani et al. (2005) finds limited evidence that defenders perceive
the success of ABCM to be higher than prospectors and analyzers. However, the prior
research on whether an innovative or prospector culture is associated with implementation of
ABCM is mixed (Baird et al. 2004; Bhimani et al. 2005).
Several studies have found evidence that management accounting practices help
satisfy the demands for information created by the different strategies and operations (Bisbe
and Otley 2004; Cagwin and Bouwman 2002; Simons 1987; Govindarajan 1988). Simons
(1987) found that prospectors adapted their cost management systems to user needs more
than defenders.
Chenhall and Langfield-Smith (1998) found early evidence that various profiles of
management techniques and management accounting practices can work together in a system
with certain strategic priorities to enhance firm performance. Based on a survey of
Australia’s largest companies, Chenhall and Langfield-Smith (1998) used cluster analysis to
form groups of firms with similar strategic priorities, management techniques, and
management accounting practices. Strategic priorities were based on three factor scores
(customer service, low price, and flexibility). Management techniques included factor scores
for six different practices (e.g., human resource management policies, integrating systems,
8
etc.). Management accounting practices were based on factor scores for six different
practices, including benchmarking, activity-based costing, and strategic planning.
Organizational performance was measured using an instrument developed by Govindarajan
(1988) and Govindarajan and Fisher (1990) in which respondents assess their business
performance relative to competitors over the last three years across ten dimensions.
The resulting six-cluster solution showed considerable variation in strategic priorities
and other practices. They found that firms emphasizing differentiation strategies and using
most of the management techniques had the highest performance. ABCM usage was
relatively low overall but its usage was found to be significantly stronger for higher-
performing clusters than for low-performing clusters. In this study, we attempt to extend the
results of Chenhall and Langfield-Smith (1998) by increasing and clarifying the strategy
classifications and focusing on whether the use of ABCM with certain strategic priorities
leads to improved firm performance.
ABCM & customer service strategies
Chenhall and Langfield-Smith (1998) hypothesized that ABCM would be used by
higher-performing, low-price oriented firms. However, they found its use was actually
highest among strong performing firms with a customer-service/flexibility strategic focus.
One explanation is that ABCM can help customer service-oriented firms better understand
the costs of meeting their customers’ needs. If management uses the better activity cost
information to take actions that help ensure their customer service efforts are appropriate and
profitable, then the firm will have better performance outcomes. Firms with a customer
service orientation may enhance performance with ABCM when used with customer
profitability analysis, quality information systems, and the balanced scorecard.

9
Customer profitability analysis. ABCM may be especially beneficial to customer
service-oriented firms when used in conjunction with customer profitability analysis (CPA).
Kaplan and Cooper (1998) discuss the benefits of using ABCM with customer profitability
analysis, including more profitable pricing structures aimed at turning unprofitable customers
into profitable ones. They suggest other ways this combination can increase profitability
including targeted negotiations with customers regarding price, product mix and variety,
delivery terms, and distribution and payment arrangements. ABCM is often recommended as
an effective way to measure customer related costs for CPA (Searcy 2004; Niraj et al. 2008;
Van Veen-Dirks and Molenaar 2009). Van Veen-Dirks and Molenaar (2009) suggest the real
opportunity for CPA is in transforming unprofitable customers into profitable ones through
better pricing decisions and structures. They suggest ABCM helps companies gain insight
into the profitability of customers. Textbooks also discuss how customer profitability
analysis is facilitated with ABCM information (Horngren et al. 2009; Blocher et al. 2010).
Quality information systems. Using ABCM with a quality information system that
contains a wide array of real-time customer data coming from integrated systems may be
especially effective in isolating and measuring the costs of serving customers’ needs, thus
allowing firms to better identify profitable services and customers. Kallunki and Silvola
(2008), Granlund and Malmi (2002), Kaplan and Cooper (1998) all support the idea that
integrated enterprise resource planning (ERP) systems help firms implement advanced cost
accounting practices such as ABCM more easily. Proposed benefits include greater and
more frequent data exchanges between systems than “PC-based” systems, more accurate
budgeting and resource planning, sensitivity analysis, and transfer pricing, and more potential
cost driver data availability.
10
On the other hand, there is prior literature suggesting that ABCM is not necessarily
implemented with ERP systems. Granlund and Malmi (2002) find that ERP implementation
generally did not influence the decision to adopt ABCM or any other management
accounting or MCS practices. It did allow for faster data processing in some cases, but
generally not more advanced management accounting methods. Possible reasons include the
time and resources needed to implement ERP and a perceived lower need for ABCM
information after ERP implementation due to the ability to get more cost information that can
be disaggregated to very low levels. The Granlund and Malmi (2002) study did find evidence
that half the ERP companies studied handled product/customer-level cost and profitability
analysis in the ERP environment. Hyvönen (2007) finds that a fit between customer strategy,
financial performance measures, and ERP system implementation has a positive association
with firm performance. This suggests that the work necessary to implement integrated
systems helps provide the data necessary to be successful with a customer-focused strategy.
For ABCM to be successful with a customer service strategy, it may take more than
just an integrated information system. It may require other strong characteristics such as user
friendliness so the data is available, a wide array of cost and customer data, and real-time
availability. Having such strong customer-related data in conjunction with an ABCM model
that effectively identifies appropriate cost drivers and activity rates could greatly enhance
these firms’ ability to assess the costs of meeting customer needs, take appropriate actions,
and thus enhance firm performance. Of course, the availability of good ABCM information
alone will not make a company successful. Taking appropriate actions with that information
is what will make it successful. Actions might include identifying customers that are
profitable and those that are not so they can enhance their services to the profitable customers
11
to lower attrition and increase their purchases. For the unprofitable customers, they might
charge extra fees or reduce services to turn them into profitable customers or lose them as
customers; either way firm profitability is increased (Morton 2002).
Balanced Scorecard. Finally, CLS proposed that high-performing differentiation
firms gain benefits from using a balanced scorecard (BSC) approach to strategic performance
management. However, they found that usage of BSC was similar for both high- and low-
performing differentiation firms. In this study, we propose that usage of BSC and ABCM
together will help customer service-oriented firms identify and measure better performance
metrics for servicing customers for their scorecard (Kaplan and Norton 1996, 2001). Further,
this will enable these firms to benchmark their customer service activity costs against other
firms or the industry to identify and reduce unnecessary service costs.
Based on the preceding discussion, the following hypotheses will be tested:
H1: Firms with a high commitment to a customer-service strategy will have higher
performance with stronger usage of ABCM than those with weaker usage, especially firms
that use of the following practices:
Customer profitability analysis (H1a)
Quality information systems (H1b)
Balanced Scorecard (H1c)
ABCM & Low-price strategies
Management accounting practices for cost leadership firms should help identify areas
of waste and track cost reduction efforts. To do this, they should identify specific activities
and related drivers that can be used to drive down costs (Porter 1985, 1996). Although
Chenhall and Langfield-Smith (1998) hypothesized ABCM would be used by higher-
performing, low-price oriented firms. The highest-performing low-price cluster did show
stronger benefits from various practices including ABCM. However, as discussed earlier, it is

12
hard to make conclusions from the Chenhall and Langfield-Smith (1998) study because the
clusters had mixed strategic priorities.
In this study, we test whether firms with differentiated low-price strategic priorities
and relatively strong usage of ABCM have higher performance than low-price firms with low
usage of ABCM. On the cost side, ABCM should be helpful for simplifying processes,
eliminating nonvalue-added costs, and then monitoring cost reduction efforts to achieve low
costs. This in turn should allow these firms to be able to charge the targeted low price for
products and services. Firms with a low-price strategy may need to use ABCM with other
practices to gain performance benefits. In the CLS study, the highest-performing low-price
cluster also reported much stronger benefits from the following practices: quality information
systems, manufacturing systems innovations, improving existing processes, benchmarking,
ABCM, and strategic planning.
Quality information systems. Low-price firms will typically have strong integrated
systems to help provide the detailed information needed for process improvement (CLS
1998). For ABCM to be effective for these firms, it may require a highly accessible, wide
array of real-time process data coming from integrated systems to identify and make process
improvements.
Strong budgeting practices. CLS proposed that low-price firms would benefit from
strong budgeting practices (referred to as “traditional accounting techniques”) but found that
they did not differentiate high and low performers in this strategy group. Strong budgeting
practices used in conjunction with ABCM may help these low-price firms allocate their
scarce resources more prudently. Kaplan and Cooper (1998, 302) state, “Activity-based
budgeting gives organizations the opportunity to authorize and control the resources they

13
supply based on the anticipated demands for the activities performed by the resources.” Prior
research has found that budgeting is a common reason for using ABCM and that information
is more likely to be used for decision making when it is part of the budgeting system
(Krumwiede 1998b). Perhaps this combination will also lead to higher firm performance with
a low-price strategy through better resource management.
Profitability analysis. To motivate cost reduction at low price-oriented firms, the
performance measurement and control systems will emphasize profitability analysis (CLS),
which includes customer and product profitability analysis. Profitability analysis should
improve with the better cost drivers and rates provided with ABCM. This combination may
in turn improve product line, customer, process, and other business decisions.
Implementing new processes. As stated earlier, low-price strategy firms will focus
on ensuring production processes are highly cost efficient. To do this, they will look for ways
to improve existing processes through downsizing, reengineering, or trying new process or
manufacturing methods. Using ABCM to identify areas of waste, implement new processes,
and then monitor cost reduction efforts using ABCM may be an effective combination for
driving down costs.
Based on the preceding analysis, the following hypotheses will be tested:
H2: Firms with a high commitment to a low-price strategy will have higher performance with
stronger usage of ABCM than those with weaker usage, especially firms that use the
following practices:
Quality information systems (H2a)
Strong budgeting practices (H2b)
Profitability analysis (H2c)
Implementing new processes (H2d)

14
ABCM & flexibility strategies
Flexible companies need to be able to adapt to changing product and demand
characteristics. Management accounting systems can help firms be more flexible by
providing better understanding of inter-relationships between manufacturing processes,
demand uncertainty, and product complexity. This understanding allows plant managers to
direct relevant process improvements which facilitate implementing flexible practices such as
JIT (Fullerton and McWatters 2002). Practices such as JIT and use of teams allow firms to
make changes quickly and can support a flexibility strategy (Monden 1993). Banker et al.
(2008) suggest that ABC is an enabler for the development of process-centric capabilities
required to successfully implement world-class manufacturing practices like JIT, TQM, and
competitive benchmarking (Ittner and Larcker 1997; Anderson et al. 2002; Cooper and
Kaplan 1991).
One factor that Banker et al. (2008) do not include in their study is strategic focus.
Contingency theory suggests that a match between strategy and appropriate management
control system practices will lead to optimal performance outcomes. Perhaps firms following
a flexibility strategy and using ABCM to facilitate the implementation of flexible practices
will achieve better performance than those not using ABCM.
On the other hand, the prior research is mixed regarding whether an innovative or
prospector culture is associated with implementation of ABCM (Baird et al. 2004; Bhimani
et al. 2005), suggesting that ABCM may no longer be considered an innovative costing
approach. Also, the results of the Banker study suggest that ABCM is only beneficial for
firms who implement other flexible operational practices such as JIT and TQM. Hence,
15
ABCM may not provide a direct benefit to firms with a flexibility strategic focus. This study
will also test whether ABCM has an impact on performance for flexibility firms when these
other practices are used.
Flexible manufacturing practices (JIT and teams). Practices such as JIT and use of
teams allow firms to make changes quickly and can support a flexibility strategy (Monden
1993). Prior research also suggests that ABCM supports world-class manufacturing by
providing a better understanding of the underlying processes and helping to make process
improvements to help these firms be more profitable (Banker et al. 2008; Fullerton and
McWatters 2002; Cooper and Kaplan 1991). These process improvements enable JIT and
lean operation goals to be achieved and team structures to operate more smoothly. When
these firms also follow a flexibility strategy, they are better able to respond to changes in
demand, products, or services. Thus, it may be that ABCM will be most beneficial to
flexible-oriented firms when they also use world-class manufacturing practices such as JIT
and team structures.
Product profitability analysis. In addition, these firms often must assess the
profitability of new products quickly. ABCM may be especially useful here when used with
strong profitability analysis to get more accurate analysis. On the other hand, it is possible
that constantly changing organizational structures and product lines may make it more
difficult to implement ABCM.
Based on the preceding discussion, the following hypotheses are tested:
H3: Firms with a high commitment to a flexibility strategy will have higher performance with
stronger usage of ABCM than those with weaker usage, especially firms that use of the
following practices:
Just-in-time (JIT) practices (H3a)
Team structures (H3b)
Product profitability analysis (H3c)
16
RESEARCH METHOD
Working with the Institute of Management Accountants (IMA), we mailed a survey
to approximately 1,100 members of the IMA’s Cost Management Member Interest Group.
We used several techniques to maximize response rate (Dillman 2000; Young 1996).4
Respondents could either respond to the hardcopy survey or to an online version available on
the IMA website. A total of 307 surveys out of 1,100 members were received (61 online and
246 hardcopy). We excluded 43 surveys because of incomplete responses, leaving a total of
264 usable responses (24% of the original target population) for data analysis. In addition,
several respondents did not answer all of the practice or performance questions, lowering the
number of usable responses for certain tests. Nonresponse bias is always a concern with a
survey methodology (Young 1996). Yet we did not find evidence of non-response bias.5
Respondents included Controllers (29.3%), CFOs (22.1%), Accounting
Managers/Supervisors (25.2%), Accountants/Analysts (15%), and nonaccounting managers
(8.0%).
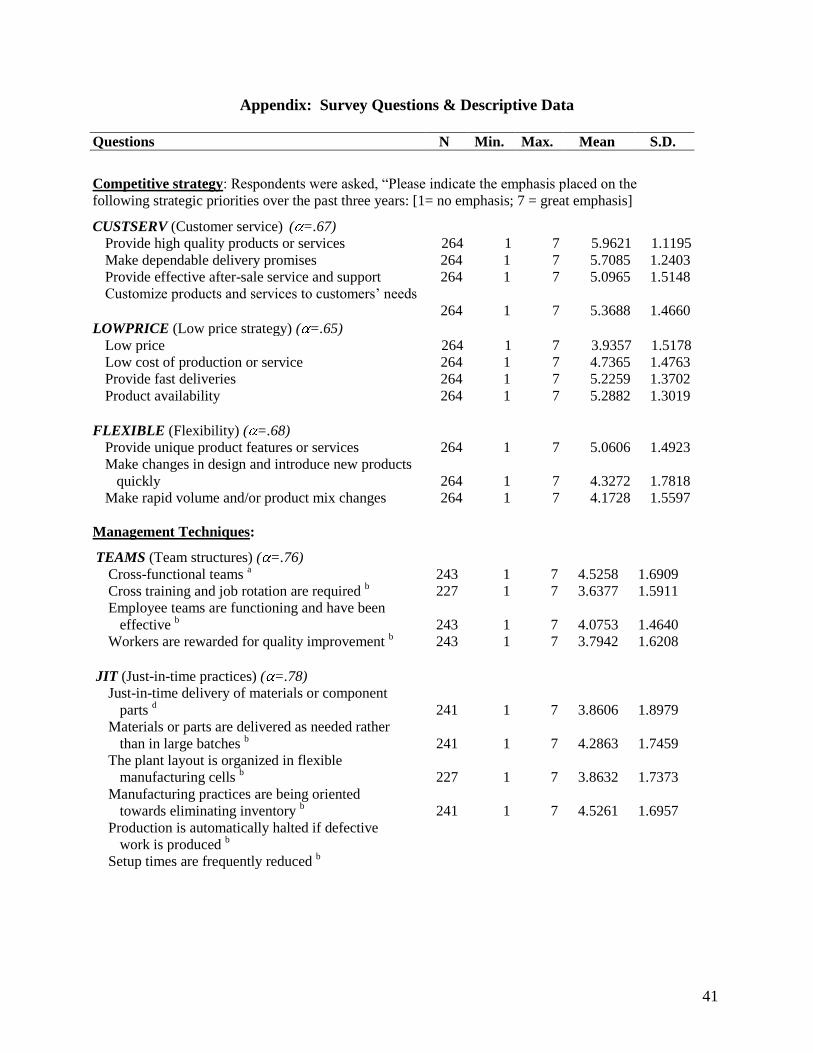
Competitive Strategy
Chenhall and Langfield-Smith (1998) used a single cluster analysis based on strategy,
management techniques, and management accounting practices. However, the resulting
clusters are somewhat difficult to interpret because they tend to mix strategic priorities.
Various methods have been used to classify firms into strategy categories and no one “best”
way has emerged (Campbell-Hunt 2000; Ketchen & Shook 1996). In this study, we use a
method similar to that used by Lillis and van Veen-Dirks (2008) based only on strategic
priorities to get more “pure” strategy groups. We started with the questions used by Chenhall
17
and Langfield-Smith (1998) to assess competitive strategy and modified two of the questions
to include “or services” for nonmanufacturing firms (see questions in Appendix). Also,
because some respondents did not answer all the strategic questions, we followed Ittner and
Larcker (1995, 1997) and Little (1992) and used a conditional mean imputation for missing
strategy data for 26 respondents using stepwise ordinary least squares. Thirty-three
respondents had more than one missing value for at least one competitive strategy category
and had to be dropped from further analysis, resulting in the 264 usable responses for
analysis involving firm strategy.
Next, we performed principal components factor analysis (with varimax rotation) on
all the strategy questions (Ketchen & Shook 1996; Hyvönen 2007; Lillis and van Veen-Dirks
2008). The resulting three factors (see Table 1) represent orthogonally independent
dimensions of strategy and represent the only dominant factors with eigenvalues over 1.0.
The factors have acceptable Cronbach alpha reliability scores ranging from .65 to .68
(Nunnally 1967) and explain 58% of total variance. These factors are also consistent with the
customer-service, flexibility, and low price strategic typology discussed earlier.6
[Insert Table 1 about here]
Next, using the factor loadings to generate a composite score for each of the three
strategic factor dimensions (mean of zero, standard deviation of one), we dichotomize each
of the strategy variables at zero to identify firms with high values (> zero) and low values (≤
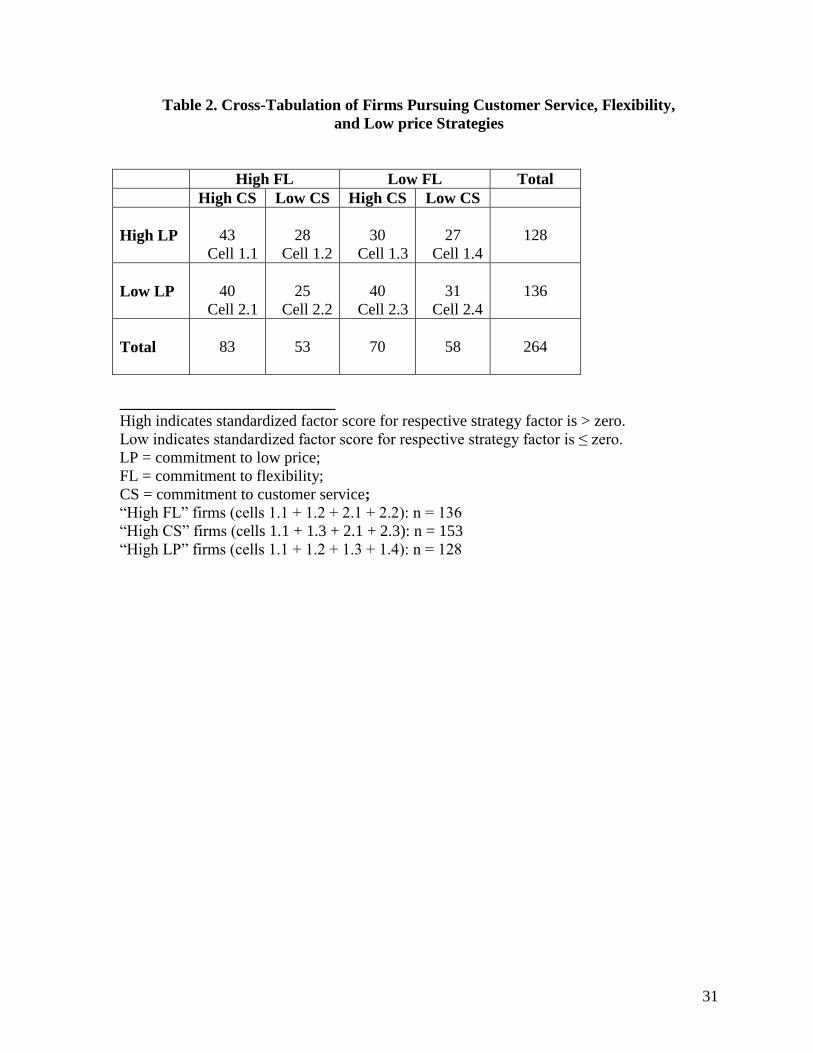
zero). Table 2 provides a cross-tabulation of how firms are categorized based on their
commitment to the three different strategic priorities: low price (LP), flexibility (FL), and
customer service (CS). In all, there are 153 “high CS” firms, 136 “high FL” firms, and 128
“high LP” firms. Like Lillis and van Veen-Dirks (2008), we find a small percentage of firms
18
with a higher emphasis on low price and a lower emphasis on both flexibility and customer
service (27 out of 264, or 10.2%, compared to 6% in the Lillis and van Veen-Dirks study).
Based on additional analysis, the strategic classifications seem reasonably valid and reliable.7
[Insert Table 2 about here]
ABCM and other management practices
We used factor analysis to combine an original list of 46 questions regarding usage of
ABCM and other management techniques and accounting practices into eight composite
factor scores for each firm. These eight practices are not intended to be all-inclusive, just
those needed to test the hypotheses. To create the list of practice questions, we started with
the list used by CLS (1998) and modified it based on other literature suggesting how they
have been linked to ABCM and to particular competitive strategies or to organizational
performance (much of this literature was discussed earlier). Because of the large number of
practice questions in the survey, 11 questions did not load sufficiently on a factor and were
dropped from further analysis. A second factor analysis was used to compute the final factor
scores. The resulting eight factors represent orthogonally independent practices and have
acceptable Cronbach alpha reliability scores ranging from .71 to .89 (Nunnally, 1967) and
explain 68% of total variance. The Appendix provides definitions and descriptive
information for both raw and standardized response data.
Firm Performance
To compute firm performance, we take a similar approach as Chenhall and Langfield-
Smith (1998) and use an instrument developed by Govindarajan (1988) and Govindarajan
and Fisher (1990) (see Appendix for questions and descriptive data). Respondents were
asked to assess their business unit’s performance (from 1=significantly below average to

19
7=significantly above average relative to their industry) over the last three years based on a
list of ten nonfinancial and financial metrics. Next, we asked each respondent to rank each
metric according to its relative importance in his or her business. The respective performance
and importance scores were multiplied, and a final performance score was computed for each
firm by taking an average of all ten metrics (MEANPERF). In addition, we used factor
analysis to reduce the ten different “performance x importance” metrics into three factors:
profitability performance (PROFPERF), quality performance (QUALPERF), and sales
performance (SALESPERF). The resulting three factors (see Table 3) represent orthogonally
independent dimensions of performance and have acceptable Cronbach alpha reliability
scores ranging from .66 to .83 (Nunnally 1967) and explain 66% of total variance.
[Insert Table 3 about here]
Control variables
Some firm characteristics need to be controlled for when investigating the use of
ABCM. First, there may be unique benefits of using ABCM to manufacturing firms
(Swenson 1995). In this study, manufacturing firms are designated with a dummy (0,1)
variable (MFG). Overall, about 82% of the firms in the data set are manufacturing firms.
Second, as an organization becomes larger, the need for managers to handle greater
quantities of information increases to a point where they have to implement more controls
(e.g., rules, documentation, specialized roles, greater decentralization, etc) (Chenhall 2003).
Prior studies have generally found a relationship between firm size and adoption of ABCM
(Innes and Mitchell 1995; Krumwiede 1998), but mixed results between size and
implementation success of ABCM (Krummwiede 1998a; Cagwin & Bouwman 2002).
Kallunki and Silvola (2008) suggest that it is life cycle phase rather than size that is

20
important. Even if ABCM is significantly more common among firms in the maturity and
revival life cycle phases than firms in the growth phase, firms in the former stages still tend
to be larger than firms in the growth stage. Size is measured in terms of number of
employees (NOEMPL).8
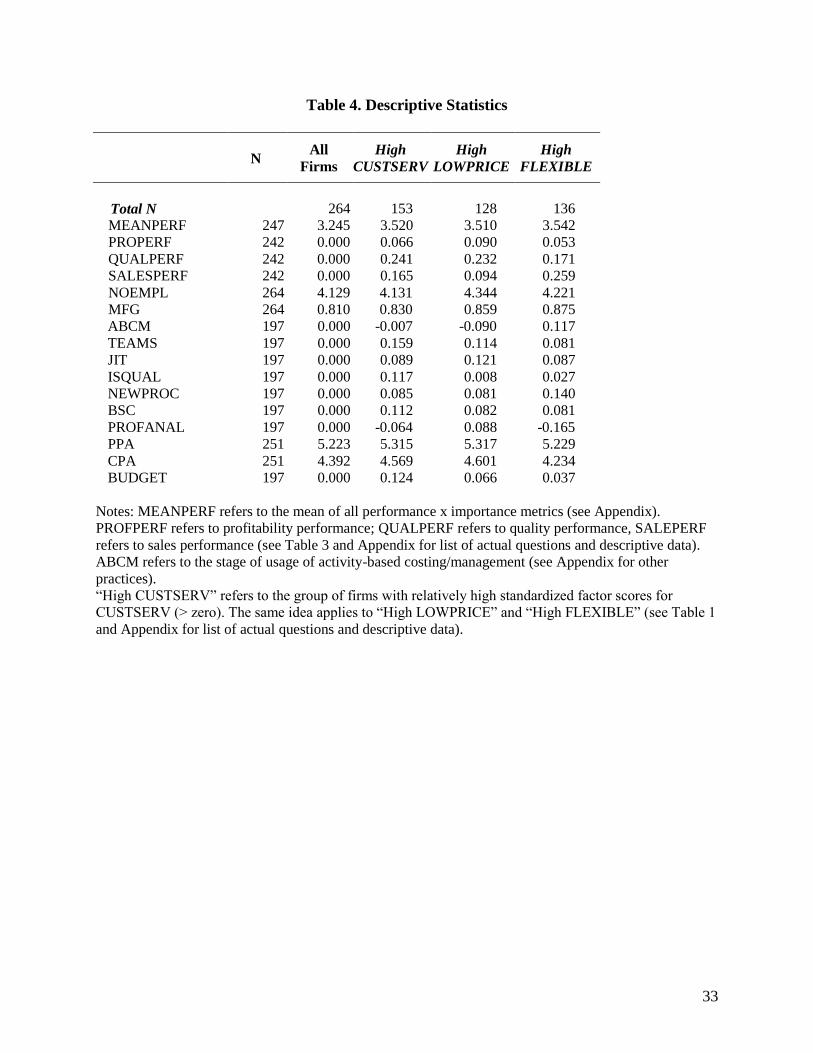
Table 4 provides descriptive statistics (means) for the performance measures, control
variables, ABCM, and other practices. The statistics are presented for all firms and for each
of the strategy types. As shown, ABCM usage does not appear to vary significantly among
the high commitment levels for each of the three strategy groups. However, firm
performance, especially as measured by MEANPERF, QUALPERF, and SALESPERF, tends
to be significantly higher for the “high” strategy groups. This result supports Porter’s (1980)
assertion that firms pursuing a clearly defined strategy will outperform those with no clear
strategy.
[Insert Table 4 about here]
RESULTS AND DISCUSSION
We tested our hypotheses by performing ANCOVA analyses and subsequent contrast
analyses using the four measures of firm performance (PROFPERF, QUALPERF,
SALESPERF, and MEANPERF) as the dependent variables. There were no statistically
significant results for SALESPERF, suggesting that the use of ABCM is not related to
increased sales revenues. Thus, the subsequent discussion will emphasize the other three
measures of firm performance. The main effects of each strategy type and ABCM on the
measures of firm performance are not reported in the tables. However, significant results are
mentioned below. Also, although full ANCOVA results are reported in Tables 5-7 (Panel A),
it is the specific contrast tests comparing the “high commitment” strategy groups that use
21
ABCM versus those that don’t use ABCM that directly test the hypotheses H1-H3. Panel B
for each table provides contrast analyses to test the hypotheses by comparing least squares
mean performance scores for the specific cells of interest in each interaction.
Hypothesis 1
The binary equivalent of CUSTSERV (CS01) as a main effect is statistically
significant in explaining QUALPERF, SALESPERF, and MEANPERF (all p=.000).9 The
binary equivalent of ABCM (ABCM01) is marginally significant in explaining PROFPERF
(p=.099) but not significant for the other measures of performance. As shown in Table 5
(Panel A), the interaction term CS01 x ABCM01 is significant in explaining PROFPERF
(p=.031) and marginally significant in explaining MEANPERF (p=.092), suggesting there
are differences in profitability performance when ABCM is used with a customer service
strategy.
[Insert Table 5 about here]
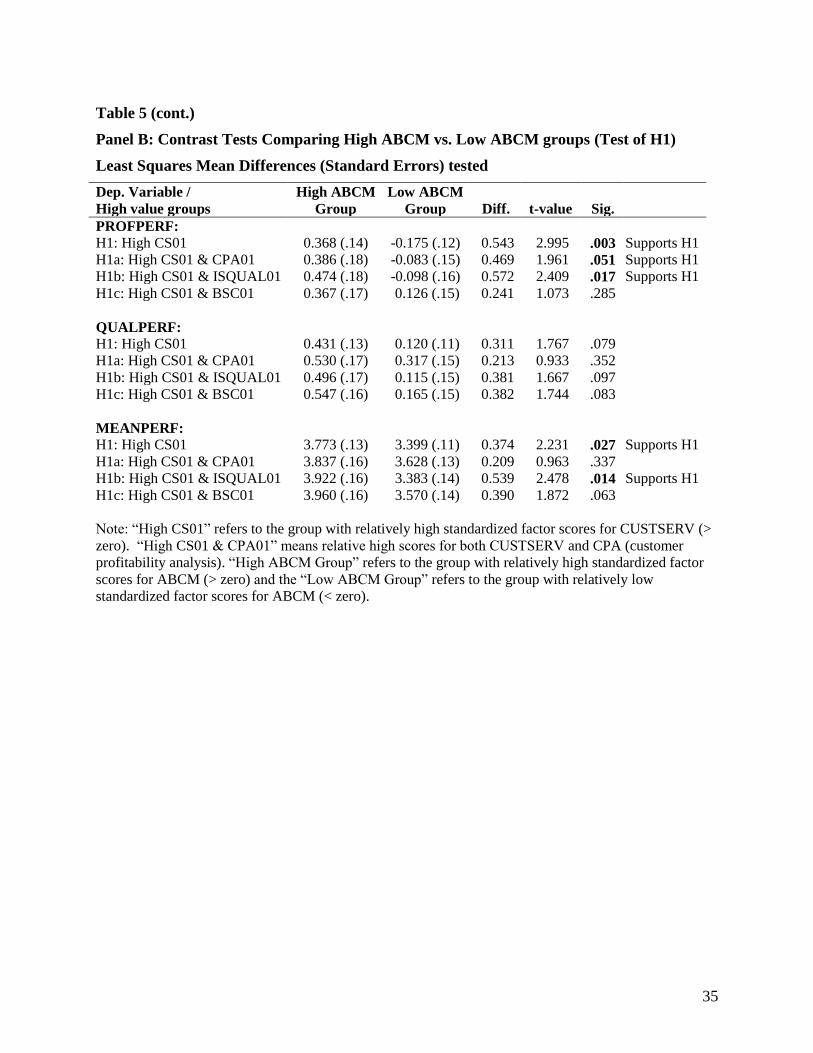
To test H1, we examine the impact of ABCM on the performance of firms focusing
on a customer-service strategy. As shown in Table 5 (Panel B), contrast analysis shows that
the “High-CUSTSERV/High-ABCM” has significantly higher PROFPERF (p=.003) and
MEANPERF (p=.027) than the “High-CUSTSERV/Low-ABCM” group. Thus, H1 is
supported for profitability and overall mean performance.
There is also evidence that high-customer service firms using ABCM with customer
profitability analysis (CPA) have higher PROFPERF (p=.051), but not for other types of
performance, so H1a is only partially supported. The strongest contributing practice for
high-customer service firms using ABCM is a quality information system (ISQUAL). Both
PROFPERF (p=.017) and MEANPERF (p=.014) were significantly higher when using this

22
combination, supporting H1b. The combined use of ABCM and balanced scorecard practices
by high-customer service firms is generally not significant at acceptable levels in explaining
firm performance, so H1c is not supported.
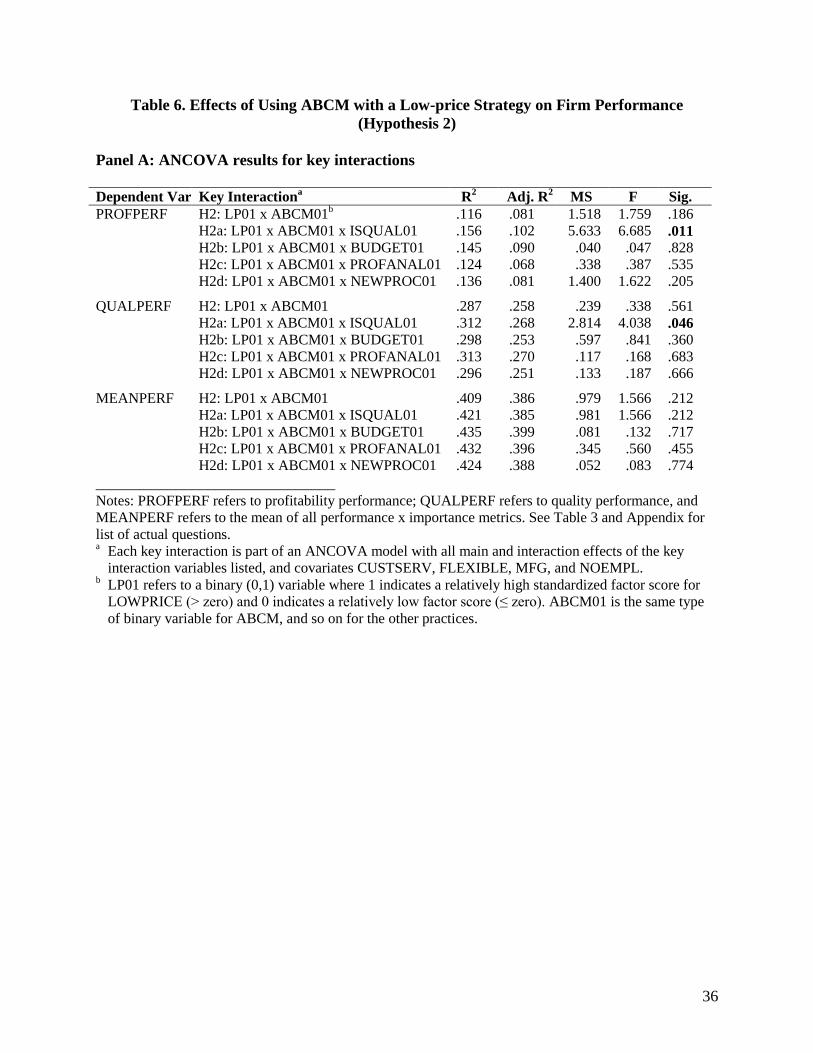
Hypothesis 2
As a main effect, the binary equivalent of LOWPRICE (LP01) is statistically
significant in explaining QUALPERF (p=.002) and MEANPERF (p=.000). ABCM’s binary
variable is significant for PROFPERF (p=.04) but not for the other performance measures.
BUDGET01 is significant only for MEANPERF (p=.03). PROFANAL01 is significant for
QUALPERF (p=.02). ISQUAL and NEWPROC are not statistically significant as main
effects for any of the performance measures.
Table 6 (Panel A) shows that the 3-way interaction of low-price strategy, ABCM, and
ISQUAL is statistically significant for PROFPERF and QUALPERF. Contrast analysis
(Panel B) shows that PROFPERF is statistically higher for low-price firms using ABCM
(p=.022). Also, the 3-way interaction of low-price strategy, ABCM, and ISQUAL is
statistically significant for PROFPERF (p=.004) but not for the other performance measures.
Panel B also shows that both PROFPERF and MEANPERF are statistically higher when
low-price firms use ABCM with strong budgeting practices. Thus, H2, H2a, and H2b are
supported primarily for profitability performance. Firms focusing on low price appear to
receive profitability benefits by using ABCM, especially when used with a quality
information system and strong budgeting practices. There is no evidence that these firms
receive any added benefit from profitability analysis or implementing new processes (H2c
and H2d not supported).

23
[Insert Table 6 about here]
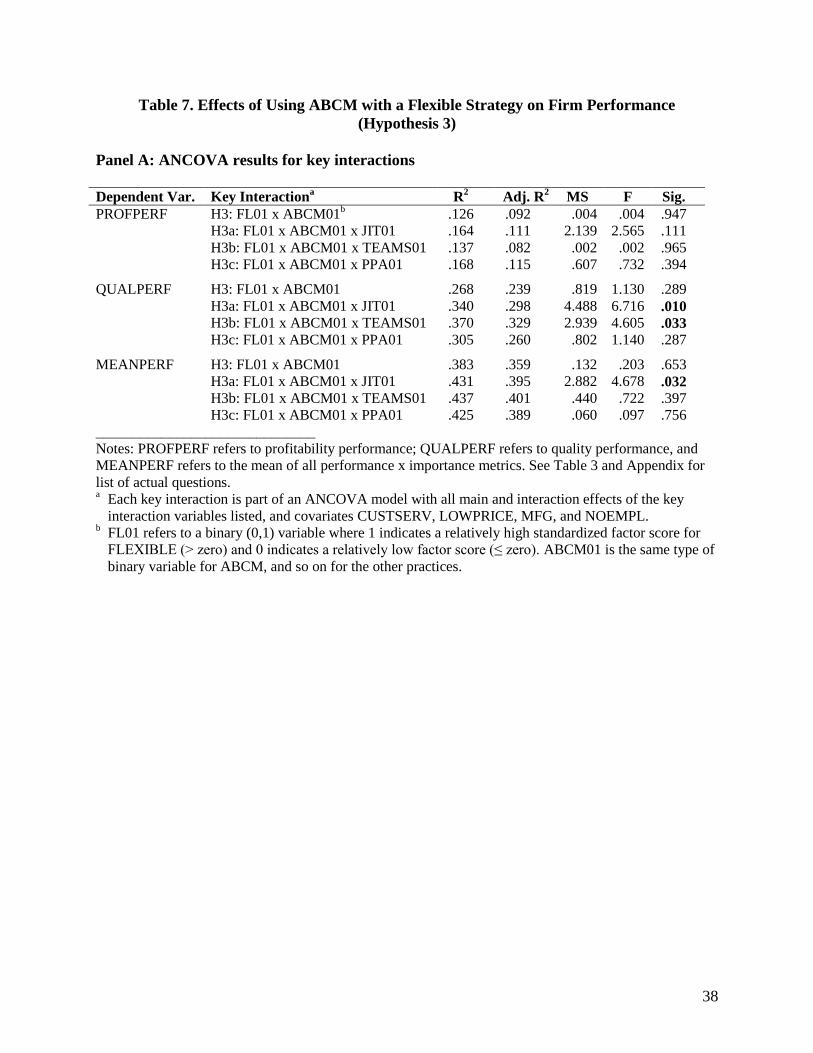
Hypothesis 3
Like CUSTSERV, the binary equivalent of FLEXIBLE (FL01) is statistically
significant as a main effect in explaining QUALPERF, SALESPERF, and MEANPERF.
ABCM is once again significant as a main effect only for PROFPERF. JIT and TEAMS are
significant for QUALPERF and MEANPERF. Product profitability analysis is statistically
significant for all but sales performance.
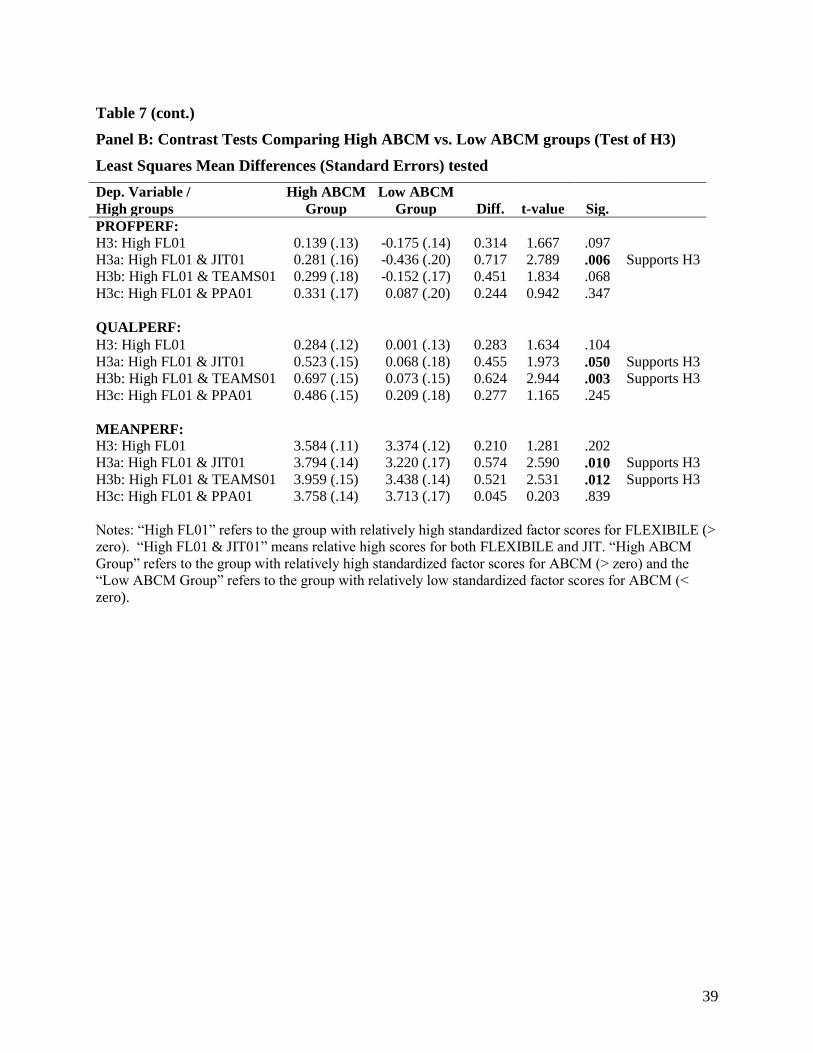
Table 7 (Panel A) suggests that firms focusing on a flexible strategy find that using
ABCM receive a significant impact on quality performance and overall mean performance,
especially when combined with flexible manufacturing practices. Contrast analysis (see
Table 7, Panel B) suggests that flexible-strategy firms using a combination of ABCM and JIT
have higher profitability, quality, and overall mean performance. And flexible firms using a
combination of ABCM and teams have higher quality and overall mean performance. These
findings support H3a and H3b. However, flexible firms using ABCM without JIT or teams
do not show higher performance. Nor do these firms have higher performance when also
using product profitability analysis. These findings do not support H3 or H3c.
[Insert Table 7 about here]
Additional analysis of low-strategy firms
In Panel B of Tables 5-7, we analyze the impact of ABCM usage for firms with a
relatively high level of strategy emphasis (e.g., “High CUSTSERV” firms). We next
performed the same analysis (not tabulated) for firms with relatively low level of strategy
emphasis (e.g., “Low CUSTSERV” firms). For all strategy types, there is no statistically
significant difference in performance between the high-ABCM and low-ABCM groups for
24
all measures of performance. In addition, we analyzed the impact of ABCM on performance
for the 31 firms in the study with low levels of all three strategic factors (see Table 2, cell
2.4). Again, we find no statistically significant difference in performance between the high-
ABCM and low-ABCM groups. This additional analysis suggests that ABCM is more
beneficial for firms with a stronger strategic emphasis than for firms with a weaker strategic
emphasis.
Discussion of Results
Table 8 summarizes the results from Tables 5-7 (Panel B). As shown, the strongest
impact of ABCM appears to be for firms pursuing a customer service strategy. Profitability,
quality, and overall firm performance appear to be improved when ABCM is used with a
customer service strategy. Profitability may improve as ABCM helps these firms better
measure and understand the costs of serving their customers and make better strategic
decisions about what they will do and will not do for them (Kaplan and Cooper 1998; Searcy
2004; Niraj et al. 2008; Van Veen-Dirks and Molenaar 2009). For example, firms may be
able to identify unprofitable segments and customers, appropriately charge customers for
services rendered, and decline unprofitable customer requests (Searcy 2004). Quality
performance, which includes internal process performance, customer satisfaction, and
employee satisfaction, may be improved through using ABCM to eliminate nonvalue-added
activities and improve processes. These actions help improve quality and the ability to meet
delivery dates.
[Insert Table 8 about here]
Interestingly, although ABCM and customer profitability analysis show some main
effects on performance, information system quality did not. When strong information system
25
quality is combined with a customer service strategy, high usage of ABCM showed
significantly higher firm performance than for those firms not using ABCM. These results
suggest that having the information available and accessible is not sufficient for higher firm
performance, it is what they do with it that matters.
H2 proposed that firms emphasizing a low price strategy will have higher
performance when they have stronger use of ABCM. Results suggest that these firms receive
a performance benefit by using ABCM, especially with a quality information system or
strong budgeting practices. This suggests that ABCM helps these firms identify high cost
activities and focus on reducing the cost or the activity. We found that ISQUAL does not
show a main effect on performance. But when ISQUAL is combined with a low price
strategy, firms using ABCM have higher performance than those who do not. Strong
budgeting practices along with ABCM (i.e., activity-based budgeting) suggests that resources
are allocated and controlled more appropriately (Kaplan and Cooper 1998). Prior research
has found evidence that ABCM is more likely to be used for decision making when it is also
used as part of the budgeting process (Krumwiede 1998b). The results of this study also
suggest this combination with a low-price strategy helps firms be more profitable.
The results of testing H3 suggest that firms implementing a flexibility strategy do
benefit from ABCM, but only when used along with flexible manufacturing practices such as
JIT and team structures. These firms strive to be able to provide unique products or services
and make quick design or production changes. Perhaps ABCM helps these firms eliminate
waste so they can be more flexible. It may also help provide some control to help these firms
from being too flexible or too innovative in an unprofitable way. These firms are frequently
developing new products and so have increased need for product profitability analysis.

26
Although product profitability analysis along with ABCM was not found to significantly
increase performance, it may be that ABCM enables better product profitability analysis that
leads to performance benefits when used along with flexible manufacturing practices.
These results add to Chenhall and Langfield-Smith’s (1998) findings which suggested
that the benefits of ABCM are highest for firms with a mixed customer-service/flexibility
strategic focus. This study clarifies the strategy groups and suggests that ABCM contributes
most directly to firms with a customer service or low-price strategic focus and not as much to
those with a flexibility focus.
The results of this study suggest that ABCM is often a good fit for firms pursuing
customer-service strategies, especially when used with quality information systems. Firms
emphasizing a low price strategy have higher profitability performance with stronger use of
ABCM, especially with strong information systems and budgeting practices. ABCM can help
these firms identify high cost activities, improve process efficiency by eliminating nonvalue-
added activities, and monitor cost reduction efforts. Thus, they are better able to meet their
low-price targets and be competitive in their industries.
Firms following a flexibility strategy do not appear to benefit as much from ABCM,
at least directly. These firms appear to benefit most from ABCM only when using it to help
implement flexible management practices. There may be other business practices that affect
the strategic benefits of ABCM as well. (Banker et al. 2008). Banker et al. (2008) suggest
that ABCM is an “enabler” for these flexible manufacturing practices which mediate its
impact on operational performance. These firms strive to be able to provide unique products
or services and make quick design or production changes. Without the other flexible

27
operational practices (e.g., JIT), perhaps the dynamic flexible environment makes
implementing ABCM difficult and it becomes an inhibitor instead of an enabler.
Contributions and limitations
Many firms today implement a variety of management tools, hoping each one will
“add value.” This study contributes to the literature in several ways. This is the first study to
link ABCM to firm performance for differentiated strategic groups. Various aspects of firm
performance, especially profitability, are shown to be higher with the use of ABCM and a
high commitment to customer service or low-price strategies. Firms with flexibility strategies
do not appear to benefit from ABCM directly as much as with other strategies. Also, firms
without a strong commitment to any strategy do not seem to benefit significantly from
ABCM.
Prior studies tying the use of ABCM to firm performance have had conflicting results
(Gordon and Silvester 1999; Ittner and Larcker 2001; Kennedy and Afflack-Graves 2001;
Ittner et al. 2002; Cagwin and Bouwman 2002; Banker et al. 2008). The only other study to
find a direct impact on outcomes is the Kennedy and Afflack-Graves (2001) study, which
found significant superior stock returns for ABCM firms over non-adopting firms after a 2-3
year delay. It also found that the ABCM firms had higher operating profit and return on
equity than the non-adopting firms. This study adds to these results by suggesting the profit
impact of ABCM is greatest for firms emphasizing customer service and low price strategies.
There is also strong evidence of an indirect impact of ABCM on firm performance for each
of the three strategy types when used with certain other management control practices. This
study supports contingency theory and helps meet Chenhall’s (2003) call for research linking
management control system practices and firm strategy with organizational outcomes.

28
The results of this study should be considered in light of several possible limitations.
First, categorizing firms into generic strategy groups is challenging and open to debate.
Using three different factor scores to classify firms appears reasonable based on
classifications in other studies, but each company’s competitive strategy is unique. Second,
the responses by manufacturing firms exceeded those by nonmanufacturing firms by a 4:1
ratio. Although we attempt to control for this issue with a dummy (0,1) variable in the
analysis, the lower number of nonmanufacturing firms limited the analysis of this subset of
firms. The impact of ABCM may be different for manufacturing than nonmanufacturing
firms. There may also be more specific industry differences that we were unable to test with
the cross-sectional data set. Third, there may be other management techniques and
management accounting practices not considered for this study that complement the use of
ABCM and may affect performance for individual firms. The fourth limitation is that because
most of the responses are anonymous and come from various organizational levels, we are
not able to validate performance ratings using superiors’ ratings or publicly available
financial data. Prior research has found evidence that subordinates’ self-assessment tends to
correlate with both objective assessments and with superiors’ assessments (Chenhall 2003).
Fifth, a potential explanation for the differences in the amount of variance explained in the
different criterion variables is that the measures were all filled out by the same person, and
thus may share common method variance (Cote and Buckley 1987; Podsakoff and Organ
1986). However, using instruments already established in the literature and the range of
strategy and individual performance scales used made it more difficult to respond to the
questions similarly (Lillis and van Veen-Dirks 2008). Finally, although the survey method
and broad range of firms enhances the external validity and generalizability of the study, the
29
lack of variable manipulation means that “cause” cannot be inferred from the study (Young
1996; Birnberg, Shields, & Young 1990).
Not addressed in this study is whether firms pursuing a combined differentiation-low
price strategy will have a higher performance impact from using ABCM than will the groups
pursuing an single strategy. It may be that that ABCM helps curb “excessive differentiation”
for these joint strategy firms (Lillis and van Veen-Dirks 2008).
The results of this study contribute to the cost management and strategy literatures.
Using more homogenous classifications of differentiation and cost leadership strategies, we
are able to identify a performance impact of ABCM in two of three strategy environments.
Future research should examine more specifically how ABCM contributes to performance
when used with complementary practices and different (or joint) strategic priorities.

30
Table 1. Focus of the competitive strategy
Rotated Component Matrix
Customer
Service
Low Price
Flexibility
High quality products/services .727 .070 .048
Dependable delivery promises .689 .346 .084
Effective service and support .751 .097 .008
Customize to customers’ needs .577 -.201 .170
Low price -.112 .677 -.017
Low cost of production/service .073 .759 .082
Fast deliveries .384 .557 .246
Product availability .491 .539 .228
Unique features or services .464 -.204 .622
Quick design changes .099 .085 .860
Rapid volume/mix changes -.038 .323 .761
Eigenvalue 2.5 2.0 1.9
Variance explained 23% 18% 17%
Coefficient alpha .67 .65 .68
______________________________
Extraction method: Principal component analysis
Rotation method: Varimax with Kaiser normalization
Bold indicates the factor loadings of the items that represent the factor.
See Appendix for list of actual questions. (N=264).
31
Table 2. Cross-Tabulation of Firms Pursuing Customer Service, Flexibility,
and Low price Strategies
High FL Low FL Total
High CS Low CS High CS Low CS
High LP
43
Cell 1.1
28
Cell 1.2
30
Cell 1.3
27
Cell 1.4
128
Low LP
40
Cell 2.1
25
Cell 2.2
40
Cell 2.3
31
Cell 2.4
136
Total
83
53
70
58
264
___________________________
High indicates standardized factor score for respective strategy factor is > zero.
Low indicates standardized factor score for respective strategy factor is ≤ zero.
LP = commitment to low price;
FL = commitment to flexibility;
CS = commitment to customer service;
“High FL” firms (cells 1.1 + 1.2 + 2.1 + 2.2): n = 136
“High CS” firms (cells 1.1 + 1.3 + 2.1 + 2.3): n = 153
“High LP” firms (cells 1.1 + 1.2 + 1.3 + 1.4): n = 128

32
Table 3. Firm Performance Factors
Rotated Component Matrix
PROFPERF
QUALPERF
SALESPERF
Return on investment .837 .125 .085
Profit .859 .145 .241
Cash flow from operations .756 .244 .114
Cost control .434 .589 -.081
Customer satisfaction -.007 .680 .398
Employee satisfaction .154 .771 .159
Internal process performance .331 .750 .136
Development of new products -.027 .356 .564
Sales volume .252 -.040 .819
Market share .160 .208 .791
Eigenvalue 2.4 2.2 1.9
Variance explained 24% 22% 19%
Coefficient alpha .83 .75 .66
______________________________
Extraction method: Principal component analysis
Rotation method: Varimax with Kaiser normalization
Bold indicates the factor loadings of the items that represent the factor. Data based on
performance rating times the importance rating for each metric.
See Appendix for list of actual questions.
33
Table 4. Descriptive Statistics
N All
Firms
High
CUSTSERV
High
LOWPRICE
High
FLEXIBLE
Total N 264 153 128 136
MEANPERF
247 3.245 3.520 3.510 3.542
PROPERF
242 0.000 0.066 0.090 0.053
QUALPERF 242 0.000 0.241 0.232 0.171
SALESPERF
242 0.000 0.165 0.094 0.259
NOEMPL 264 4.129 4.131 4.344 4.221
MFG 264 0.810 0.830 0.859 0.875
ABCM 197 0.000 -0.007 -0.090 0.117
TEAMS 197 0.000 0.159 0.114 0.081
JIT 197 0.000 0.089 0.121 0.087
ISQUAL 197 0.000 0.117 0.008 0.027
NEWPROC 197 0.000 0.085 0.081 0.140
BSC 197 0.000 0.112 0.082 0.081
PROFANAL 197 0.000 -0.064 0.088 -0.165
PPA 251 5.223 5.315 5.317 5.229
CPA 251 4.392 4.569 4.601 4.234
BUDGET 197 0.000 0.124 0.066 0.037
Notes: MEANPERF refers to the mean of all performance x importance metrics (see Appendix).
PROFPERF refers to profitability performance; QUALPERF refers to quality performance, SALEPERF
refers to sales performance (see Table 3 and Appendix for list of actual questions and descriptive data).
ABCM refers to the stage of usage of activity-based costing/management (see Appendix for other
practices).
“High CUSTSERV” refers to the group of firms with relatively high standardized factor scores for
CUSTSERV (> zero). The same idea applies to “High LOWPRICE” and “High FLEXIBLE” (see Table 1
and Appendix for list of actual questions and descriptive data).

34
Table 5. Effects of Using ABCM with a Customer-service Strategy on Firm Performance
(Hypothesis 1)
Panel A: ANCOVA results for key interactions
Dependent Var. Key Interactiona R
2 Adj. R
2 MS F Sig.
PROFPERF H1: CS01 x ABCM01b .124 .089 4.051 4.737 .031
H1a: CS01 x ABCM01 x CPA01 .131 .075 .195 .225 .636
H1b: CS01 x ABCM01 x ISQUAL01 .137 .082 .364 .422 .517
H1c: CS01 x ABCM01 x BSC01 .179 .126 4.175 5.092 .025
QUALPERF H1: CS01 x ABCM01 .187 .155 1.127 1.402 .238
H1a: CS01 x ABCM01 x CPA01 .220 .171 .291 .369 .692
H1b: CS01 x ABCM01 x ISQUAL01 .213 .163 2.994 3.760 .054
H1c: CS01 x ABCM01 x BSC01 .231 .182 .579 .744 .390
MEANPERF H1: CS01 x ABCM01 .305 .278 2.117 2.878 .092
H1a: CS01 x ABCM01 x CPA01 .334 .293 .512 .710 .401
H1b: CS01 x ABCM01 x ISQUAL01 .332 .290 3.981 5.502 .020
H1c: CS01 x ABCM01 x BSC01 .349 .308 .036 .051 .822
______________________________
Notes: PROFPERF refers to profitability performance; QUALPERF refers to quality performance, and
MEANPERF refers to the mean of all performance x importance metrics. See Table 3 and Appendix for
list of actual questions. a Each key interaction is part of an ANCOVA model with all main and interaction effects of the key
interaction variables listed, and covariates FLEXIBLE, LOWPRICE, MFG, and NOEMPL. b CS01 refers to a binary (0,1) variable where 1 indicates a relatively high standardized factor score for
CUSTSERV (> zero) and 0 indicates a relatively low factor score (≤ zero). ABCM01 is the same type
of binary variable for ABCM, and so on for the other practices.
35
Table 5 (cont.)
Panel B: Contrast Tests Comparing High ABCM vs. Low ABCM groups (Test of H1)
Least Squares Mean Differences (Standard Errors) tested
Dep. Variable /
High value groups
High ABCM
Group
Low ABCM
Group
Diff.
t-value
Sig.
PROFPERF:
H1: High CS01 0.368 (.14) -0.175 (.12) 0.543 2.995 .003 Supports H1
H1a: High CS01 & CPA01 0.386 (.18) -0.083 (.15) 0.469 1.961 .051 Supports H1
H1b: High CS01 & ISQUAL01 0.474 (.18) -0.098 (.16) 0.572 2.409 .017 Supports H1
H1c: High CS01 & BSC01 0.367 (.17) 0.126 (.15) 0.241 1.073 .285
QUALPERF:
H1: High CS01 0.431 (.13) 0.120 (.11) 0.311 1.767 .079
H1a: High CS01 & CPA01 0.530 (.17) 0.317 (.15) 0.213 0.933 .352
H1b: High CS01 & ISQUAL01 0.496 (.17) 0.115 (.15) 0.381 1.667 .097
H1c: High CS01 & BSC01 0.547 (.16) 0.165 (.15) 0.382 1.744 .083
MEANPERF:
H1: High CS01 3.773 (.13) 3.399 (.11) 0.374 2.231 .027 Supports H1
H1a: High CS01 & CPA01 3.837 (.16) 3.628 (.13) 0.209 0.963 .337
H1b: High CS01 & ISQUAL01 3.922 (.16) 3.383 (.14) 0.539 2.478 .014 Supports H1
H1c: High CS01 & BSC01 3.960 (.16) 3.570 (.14) 0.390 1.872 .063
Note: “High CS01” refers to the group with relatively high standardized factor scores for CUSTSERV (>
zero). “High CS01 & CPA01” means relative high scores for both CUSTSERV and CPA (customer
profitability analysis). “High ABCM Group” refers to the group with relatively high standardized factor
scores for ABCM (> zero) and the “Low ABCM Group” refers to the group with relatively low
standardized factor scores for ABCM (< zero).
36
Table 6. Effects of Using ABCM with a Low-price Strategy on Firm Performance
(Hypothesis 2)
Panel A: ANCOVA results for key interactions
Dependent Var. Key Interactiona R
2 Adj. R
2 MS F Sig.
PROFPERF H2: LP01 x ABCM01b .116 .081 1.518 1.759 .186
H2a: LP01 x ABCM01 x ISQUAL01 .156 .102 5.633 6.685 .011
H2b: LP01 x ABCM01 x BUDGET01 .145 .090 .040 .047 .828
H2c: LP01 x ABCM01 x PROFANAL01 .124 .068 .338 .387 .535
H2d: LP01 x ABCM01 x NEWPROC01 .136 .081 1.400 1.622 .205
QUALPERF H2: LP01 x ABCM01 .287 .258 .239 .338 .561
H2a: LP01 x ABCM01 x ISQUAL01 .312 .268 2.814 4.038 .046
H2b: LP01 x ABCM01 x BUDGET01 .298 .253 .597 .841 .360
H2c: LP01 x ABCM01 x PROFANAL01 .313 .270 .117 .168 .683
H2d: LP01 x ABCM01 x NEWPROC01 .296 .251 .133 .187 .666
MEANPERF H2: LP01 x ABCM01 .409 .386 .979 1.566 .212
H2a: LP01 x ABCM01 x ISQUAL01 .421 .385 .981 1.566 .212
H2b: LP01 x ABCM01 x BUDGET01 .435 .399 .081 .132 .717
H2c: LP01 x ABCM01 x PROFANAL01 .432 .396 .345 .560 .455
H2d: LP01 x ABCM01 x NEWPROC01 .424 .388 .052 .083 .774
______________________________ Notes: PROFPERF refers to profitability performance; QUALPERF refers to quality performance, and
MEANPERF refers to the mean of all performance x importance metrics. See Table 3 and Appendix for
list of actual questions. a Each key interaction is part of an ANCOVA model with all main and interaction effects of the key
interaction variables listed, and covariates CUSTSERV, FLEXIBLE, MFG, and NOEMPL. b LP01 refers to a binary (0,1) variable where 1 indicates a relatively high standardized factor score for
LOWPRICE (> zero) and 0 indicates a relatively low factor score (≤ zero). ABCM01 is the same type
of binary variable for ABCM, and so on for the other practices.

37
Table 6 (cont.)
Panel B: Contrast Tests Comparing High ABCM vs. Low ABCM groups (Test of H2)
Least Squares Mean Differences (Standard Errors) tested
Dep. Variable /
High groups
High ABCM
Group
Low ABCM
Group
Diff.
t-value
Sig.
PROFPERF:
H2: High LP01 0.351 (.15) -0.115 (.13) 0.466 2.306 .022 Supports H2
H2a: High LP01 & ISQUAL01 0.569 (.19) -0.223 (.19) 0.792 2.955 .004 Supports H2
H2b: High LP01 & BUDGET01 0.409 (.19) -0.119 (.19) 0.528 1.949 .053 Supports H2
H2c: High LP01 & PROFANAL01 0.361 (.23) -0.015 (.16) 0.376 1.346 .179
H2d: High LP01 & NEWPROC01 0.296 (.22) -0.037 (.20) 0.333 1.135 .258
QUALPERF:
H2: High LP01 0.333 (.14) 0.109 (.12) 0.224 1.225 .222
H2a: High LP01 & ISQUAL01 0.144 (.18) 0.275 (.17) -0.131 -0.541 .589
H2b: High LP01 & BUDGET01 0.386 (.18) 0.272 (.17) 0.114 0.462 .644
H2c: High LP01 & PROFANAL01 0.452 (.20) 0.206 (.14) 0.246 0.995 .321
H2d: High LP01 & NEWPROC01 0.409 (.20) -0.049 (.18) 0.458 1.718 .088
MEANPERF:
H2: High LP01 3.631 (.13) 3.329 (.11) 0.302 1.770 .078
H2a: High LP01 & ISQUAL01 3.692 (.17) 3.291 (.16) 0.401 1.734 .085
H2b: High LP01 & BUDGET01 3.741 (.16) 3.285 (.16) 0.456 2.008 .046 Supports H2
H2c: High LP01 & PROFANAL01 3.701 (.19) 3.505 (.13) 0.196 0.843 .400
H2d: High LP01 & NEWPROC01 3.664 (.19) 3.251 (.17) 0.413 1.657 .099
Note: “High LP01” refers to the group with relatively high standardized factor scores for LOWPRICE (>
zero). “High LP01 & ISQUAL01” means relative high scores for both CUSTSERV and ISQUAL. “High
ABCM Group” refers to the group with relatively high standardized factor scores for ABCM (> zero) and
the “Low ABCM Group” refers to the group with relatively low standardized factor scores for ABCM (<
zero).
38
Table 7. Effects of Using ABCM with a Flexible Strategy on Firm Performance
(Hypothesis 3)
Panel A: ANCOVA results for key interactions
Dependent Var. Key Interactiona R
2 Adj. R
2 MS F Sig.
PROFPERF H3: FL01 x ABCM01b .126 .092 .004 .004 .947
H3a: FL01 x ABCM01 x JIT01 .164 .111 2.139 2.565 .111
H3b: FL01 x ABCM01 x TEAMS01 .137 .082 .002 .002 .965
H3c: FL01 x ABCM01 x PPA01 .168 .115 .607 .732 .394
QUALPERF H3: FL01 x ABCM01 .268 .239 .819 1.130 .289
H3a: FL01 x ABCM01 x JIT01 .340 .298 4.488 6.716 .010
H3b: FL01 x ABCM01 x TEAMS01 .370 .329 2.939 4.605 .033
H3c: FL01 x ABCM01 x PPA01 .305 .260 .802 1.140 .287
MEANPERF H3: FL01 x ABCM01 .383 .359 .132 .203 .653
H3a: FL01 x ABCM01 x JIT01 .431 .395 2.882 4.678 .032
H3b: FL01 x ABCM01 x TEAMS01 .437 .401 .440 .722 .397
H3c: FL01 x ABCM01 x PPA01 .425 .389 .060 .097 .756
______________________________
Notes: PROFPERF refers to profitability performance; QUALPERF refers to quality performance, and
MEANPERF refers to the mean of all performance x importance metrics. See Table 3 and Appendix for
list of actual questions. a Each key interaction is part of an ANCOVA model with all main and interaction effects of the key
interaction variables listed, and covariates CUSTSERV, LOWPRICE, MFG, and NOEMPL. b FL01 refers to a binary (0,1) variable where 1 indicates a relatively high standardized factor score for
FLEXIBLE (> zero) and 0 indicates a relatively low factor score (≤ zero). ABCM01 is the same type of
binary variable for ABCM, and so on for the other practices.
39
Table 7 (cont.)
Panel B: Contrast Tests Comparing High ABCM vs. Low ABCM groups (Test of H3)
Least Squares Mean Differences (Standard Errors) tested
Dep. Variable /
High groups
High ABCM
Group
Low ABCM
Group
Diff.
t-value
Sig.
PROFPERF:
H3: High FL01 0.139 (.13) -0.175 (.14) 0.314 1.667 .097
H3a: High FL01 & JIT01 0.281 (.16) -0.436 (.20) 0.717 2.789 .006 Supports H3
H3b: High FL01 & TEAMS01 0.299 (.18) -0.152 (.17) 0.451 1.834 .068
H3c: High FL01 & PPA01 0.331 (.17) 0.087 (.20) 0.244 0.942 .347
QUALPERF:
H3: High FL01 0.284 (.12) 0.001 (.13) 0.283 1.634 .104
H3a: High FL01 & JIT01 0.523 (.15) 0.068 (.18) 0.455 1.973 .050 Supports H3
H3b: High FL01 & TEAMS01 0.697 (.15) 0.073 (.15) 0.624 2.944 .003 Supports H3
H3c: High FL01 & PPA01 0.486 (.15) 0.209 (.18) 0.277 1.165 .245
MEANPERF:
H3: High FL01 3.584 (.11) 3.374 (.12) 0.210 1.281 .202
H3a: High FL01 & JIT01 3.794 (.14) 3.220 (.17) 0.574 2.590 .010 Supports H3
H3b: High FL01 & TEAMS01 3.959 (.15) 3.438 (.14) 0.521 2.531 .012 Supports H3
H3c: High FL01 & PPA01 3.758 (.14) 3.713 (.17) 0.045 0.203 .839
Notes: “High FL01” refers to the group with relatively high standardized factor scores for FLEXIBILE (>
zero). “High FL01 & JIT01” means relative high scores for both FLEXIBILE and JIT. “High ABCM
Group” refers to the group with relatively high standardized factor scores for ABCM (> zero) and the
“Low ABCM Group” refers to the group with relatively low standardized factor scores for ABCM (<
zero).

40
Table 8. Summary of Hypotheses Testing
(p-values from Tables 5-7, Panel B)
Dependent Variables
Hypothesis PROFPERF QUALPERF MEANPERF
Archetypal strategies:
H1: CS & ABCM .003 .079 .027 Supports H1
H1a: CS, ABCM, & CPA .051 ns ns
H1b: CS, ABCM, & ISQUAL .017 .097 .014 Supports H1b
H1c: CS, ABCM, & BSC ns .083 .063
H2: LP & ABCM .022 ns .078 Supports H2
H2a: LP, ABCM, & ISQUAL .004 ns .085 Supports H2a
H2b: LP, ABCM, & BUDGET .053 ns .046 Supports H2b
H2c: LP, ABCM, & PROFANL ns ns ns
H2d: LP, ABCM, & NEWPROC ns .088 .099
H3: FL & ABCM ns ns ns
H3a: FL, ABCM, & JIT .006 .050 .010 Supports H3a
H3b: FL, ABCM, & TEAMS .068 .003 .012 Supports H3b
H3c: FL, ABCM, & PPA ns ns ns
Note: p-values based on comparison tests reported in Panel B of Tables 5-7. A significant p-
value suggests a statistically significant difference in firm performance between the group with
relatively high commitment to the indicated strategy and high usage of ABCM and the group
with relatively high commitment to the indicated strategy and low usage of ABCM.
“ns” = not statistically significant (p > .10)
41
Appendix: Survey Questions & Descriptive Data
Questions N Min. Max. Mean S.D.
Competitive strategy: Respondents were asked, “Please indicate the emphasis placed on the
following strategic priorities over the past three years: [1= no emphasis; 7 = great emphasis]
CUSTSERV (Customer service) ( =.67)
Provide high quality products or services 264 1 7 5.9621 1.1195
Make dependable delivery promises
264 1 7 5.7085 1.2403
Provide effective after-sale service and support
264 1 7 5.0965 1.5148
Customize products and services to customers’ needs
264
1
7
5.3688
1.4660
LOWPRICE (Low price strategy) ( =.65)
Low price
264 1 7 3.9357 1.5178
Low cost of production or service
264 1 7 4.7365 1.4763
Provide fast deliveries
264 1 7 5.2259 1.3702
Product availability
264 1 7 5.2882 1.3019
FLEXIBLE (Flexibility) ( =.68)
Provide unique product features or services
264 1 7 5.0606 1.4923
Make changes in design and introduce new products
quickly
264
1
7
4.3272
1.7818
Make rapid volume and/or product mix changes
264 1 7 4.1728 1.5597
Management Techniques:
TEAMS (Team structures) ( =.76)
Cross-functional teams a
243 1 7 4.5258 1.6909
Cross training and job rotation are required b
227 1 7 3.6377 1.5911
Employee teams are functioning and have been
effective b
243
1
7
4.0753
1.4640
Workers are rewarded for quality improvement b
243 1 7 3.7942 1.6208
JIT (Just-in-time practices) ( =.78)
Just-in-time delivery of materials or component
parts d
241
1
7
3.8606
1.8979
Materials or parts are delivered as needed rather
than in large batches b
241
1
7
4.2863
1.7459
The plant layout is organized in flexible
manufacturing cells b
227
1
7
3.8632
1.7373
Manufacturing practices are being oriented
towards eliminating inventory b
241
1
7
4.5261
1.6957
Production is automatically halted if defective
work is produced b
Setup times are frequently reduced b

42
Questions N Min. Max. Mean S.D.
ISQUAL (Info. system quality) ( =.88)
Information systems across functions (sales,
operations, etc.) are highly integratedc
256
1
7
4.3086
1.8392
Information systems within operations or
manufacturing are highly integratedc
256
1
7
4.5211
1.7330
Overall, the information system offers user-friendly
query capability to various usersc
256
1
7
3.6250
1.6473
A wide array of cost and performance data is
available in the information systemc
256
1
7
3.9805
1.7387
Most data in the system are updated “real time”
rather than periodicallyc
256
1
7
4.1364
1.9528
The quality of our current cost management
information system is excellentc
256
1
7
3.4364
1.6410
NEWPROC (New processes) ( =.71)
Implementing new process or manufacturing
methods a
261
1
7
4.6210
1.6426
Reengineering existing manufacturing or operating
processes a
261
1
7
4.7110
1.5750
Management Accounting Practices:
ABCM (Activity-based costing/management) ( =.83)
Activity-based costingd
245 1 7 2.8624 1.8892
Activity-based managementd 245 1 7 2.6042 1.7677
Value chain analysisd 236 1 7 2.8517 1.9327
BSC (Balanced scorecard) ( =.88)
Balanced scorecarde
250 1 7 2.9624 2.1636
Benchmark product characteristicsd
245 1 7 3.5925 2.0506
Benchmark operational processesd
245 1 7 3.5804 1.9366
Benchmark strategic prioritiese 250 1 7 3.1880 1.8237
Benchmark management processese 250 1 7 3.0480 1.7395
Benchmarking with other companies is tracked
PROFANAL (Profitability analysis) ( =.71)
Product profitability analysisd
251 1 7 5.2234 1.6192
Customer profitability analysisd
251 1 7 4.3922 1.9201
BUDGET (Level of budgeting) ( =.89)
Long range planninge
253 1 7 4.4585 1.7804
Budgeting for evaluating managers’ performancee
254 1 7 4.0869 1.8926
Budgeting systems for planning cash flowse
254 1 7 4.4844 1.8018
Budgeting systems for planning financial positione
254 1 7 4.6982 1.7087
Budgeting systems for controlling costse
254 1 7 4.8252 1.7603
Full participation of managers at all levels in
developing budgetse
254
1
7
4.5827
1.9436

43
Questions N Min. Max. Mean S.D.
Firm performance ratings: Respondents were asked, “Please assess your business unit’s
performance relative to your industry competitors over the last three years across the following
dimensions:” [1= significantly below average; 7 = significantly above average]
Return on investment 244 1 7 4.5451 1.3646
Profit 247 1 7 4.6194 1.3678
Cash flow from operations 246 1 7 4.7927 1.4090
Cost control 248 1 7 4.3750 1.3135
Development of new products 244 1 7 4.2951 1.4298
Sales volume 249 1 7 4.6064 1.1904
Market share 245 2 7 4.7265 1.2523
Customer satisfaction 251 2 7 5.2430 1.1067
Employee satisfaction 247 1 7 4.4980 1.3491
Internal process performance 246 1 7 4.1748 1.3271
Overall mean performance rating 251 1 7 4.5916 0.8703
Importance ratings: Respondents were asked, “Please rate the importance placed by top
management on the following dimensions when evaluating the performance of your business unit:”
[1= not important; 7 = extremely important]
Return on investment 260 1 7 5.0716 1.5975
Profit 260 1 7 5.9619 1.0196
Cash flow from operations 261 1 7 5.4966 1.4637
Cost control 260 1 7 5.2192 1.3901
Development of new products 260 1 7 4.4263 1.6732
Sales volume 260 1 7 5.6024 1.1862
Market share 260 1 7 4.8850 1.4005
Customer satisfaction 260 1 7 5.7268 1.2545
Employee satisfaction 258 1 7 4.2209 1.5562
Internal process performance 258 1 7 4.4496 1.4277
Overall mean importance rating 261 1 7 5.0998 0.8229
Notes: a
“Please indicate the extent of usage of each of the following operating initiatives over the past three
years:” [1= not used; 7 = high usage] b
“Please evaluate the following statements about your operating techniques for your business unit:” [1=
strongly disagree; 7 = strongly agree] c
“Please evaluate the following statements about your business unit’s information system for your
business unit:” [1 = strongly disagree; 7 = strongly agree] d “
For each of the following cost management practices, please indicate the stage of usage over the past
three years using the following scale: 1 = not considered seriously; 2 = rejected/abandoned; 3 =
considering implementation; 4 = implementation has begun; 5 = use somewhat; 6 = use
moderately; 7 = use extensively” e
“Please indicate the extent of usage of each of the following strategic planning and control activities
over the past three years:” [1= not used; 7 = high usage]

44
References
Anderson, S. W. 1995. A framework for assessing cost management system changes: the case of
activity based costing implementation at General Motors, 1986-1993. Journal of Management
Accounting Research 7: 1-51.
Anderson, S. W., J. Hesford, and S. M. Young. 2002. Factors influencing the performance of
activity-based costing team: A field study of ABC model development time in the automobile
industry. Accounting, Organizations, and Society 27: 195-211.
Anderson, S. W., and S. M. Young. 1999. The impact of contextual and process factors on the
evaluation of activity-based costing systems. Accounting, Organizations, and Society 24: 525-
559.
Baird, K. M., G. L. Harrison, R. C. Reeve. 2004. Adoption of activity management practices: a
note on the extent of adoption and the influence of organizational and cultural factors.
Management Accounting Research 15: 383-399.
Banker, R. D., I. R. Bardhan, and T.Y. Chen. 2008. The role of manufacturing practices in
mediating the impact of activity-based costing on plant performance. Accounting, Organizations
and Society 33: 1-19.
Bhimani, A., M. Gosselin, and M. Ncube. 2005. Strategy and activity based costing: a cross
national study of process and outcome contingencies. International Journal of Accounting,
Auditing and Performance Evaluation 2 (3): 187-205.
Birnberg, J. G., M. D. Shields, and S. M. Young. 1990. The case for multiple methods in
empirical management accounting research (With an illustration from budget setting). Journal of
Management Accounting Research 2: 33-66.
Bisbe, J. and D. Otley. 2004. The effects of the interactive use of management control systems
on product innovation. Accounting, Organizations and Society 29 (8): 709-737.
Blocher, E. J., D. E. Stout, and G. Cokins. 2010. Cost Management: A Strategic Emphasis. New
York, NY: McGraw-Hill/Irwin.
Cagwin, D., and M. J. Bouwman. 2002. The association between activity-based costing and
improvement in financial performance. Management Accounting Research 13: 1-39.
Campbell-Hunt, C. 2000. What have we learned about generic competitive strategy? A meta-
analysis. Strategic Management Journal 21 (2): 127-154.
Chenhall, R. H. 2003. Management control systems design within its organizational context:
findings from contingency-based research and directions for the future. Accounting,
Organizations and Society 28: 127-168.
45
Chenhall, R. H. and K. Langfield-Smith. 1998. The relationship between strategic priorities,
management techniques and management accounting: an empirical investigation using a systems
approach. Accounting, Organizations and Society 23 (3): 243-264.
Cooper, R., and R. S. Kaplan. 1988. Measure costs right: Make the right decisions. Harvard
Business Review 66 (5): 96-103.
Cooper, R., and R. S. Kaplan. 1991. Profit priorities from activity-based costing. Harvard
Business Review 69 (3): 130-135.
Cooper, R., R. S. Kaplan, L. Maisel, E. Morrissey, and R. Oehm. 1992. Moving from analysis to
action: Implementing activity-based cost management. Montvale, NJ: Institute of Management
Accountants.
Cote, J. A., and M. R. Buckley. 1987. Estimating Trait, Method, and Error Variance:
Generalizing Across Seventy Construct Validation Studies. Journal of Marketing Research, 26
(August): 315 - 318.
Dillman, D. A. 2000. Mail and Internet Surveys: The Tailored Design Method. New York, NY:
Wiley.
Drucker, P. F. 1995. The information executives truly need. Harvard Business Review 73 (1):
54-62.
England, H., and J. Gerdin. 2008. Transferring knowledge across sub-genres of the ABCM
implementation literature. Management Accounting Research 19: 149-162.
Foster, G., and D. W. Swenson. 1997. Measuring the success of activity-based cost management
and its determinants. Journal of Management Accounting Research 9: 109-141.
Fullerton, R. R., and C. S. McWatters. 2002. The role of performance measures and incentive
systems in relation to the degree of JIT implementation. Accounting, Organizations and Society
27 (8): 711-735.
Gordon, L. A., and K. J. Silvester. 1999. Stock market reactions to activity-based costing
adoptions. Journal of Accounting and Public Policy 18: 229-251.
Gosselin, M. 1997. The effect of strategy and organizational structure on the adoption and
implementation of activity-based costing. Accounting, Organizations and Society 22 (2): 105-
122.
Govindarajan, V. 1986. Decentralization, strategy, and effectiveness of strategic business units in
multibusiness organizations. Academy of Management Review 11(4): 844-856.

46
Govindarajan, V. 1988. A contingency approach to strategy implementation at the business-unit
level: Integrating administrative mechanisms with strategy. Academy of Management Journal.
31(4): 828-853.
Govindarajan, V. and Fisher, J. 1990. Strategy, control systems, and resource sharing: effects on
business-unit performance. Academy of Management Journal 33, 259-285.
Horngren, C. T., S. M. Datar, G. Foster, M. V. Rajan, and C. Ittner. 2009. Cost Accounting: A
Managerial Emphasis, 13th
ed. Upper Saddle River, NJ: Pearson Prentice Hall.
Hyvönen, L. 2007. Strategy, performance measurement techniques and information technology
of the firm and their links to organizational performance. Management Accounting Research 18:
343-366.
Innes, J. and F. Mitchell. 1995. A survey of activity-based costing in the U.K.’s largest
companies. Management Accounting Research 6: 137-153.
Ittner, C., and D. Larcker. 1995. Total quality management and the choice of information and
reward systems. Journal of Accounting Research 33:1-34.
Ittner, C., and D. Larcker. 1997. Quality strategy, strategic control systems, and organizational
performance. Accounting, Organizations and Society 22 (3/4): 293-314.
Ittner, C., and D. Larcker. 2001. Assessing empirical research in managerial accounting: A
value-based management perspective. Journal of Accounting and Economics 32: 349-410.
Ittner, C., W. Lanen, and D. Larcker. 2002. The association between activity-based costing and
manufacturing performance. Journal of Accounting Research 40(3): 711-726.
Kallunki, J., and H. Silvola. 2008. The effect of organizational life cycle stage on the use of
activity-based costing. Management Accounting Research 19: 62-79.
Kaplan, R. S. and R. Cooper. 1998. Cost & Effect. Harvard Business School Press: Boston, MA.
Kennedy, T. and J. Affleck-Graves. 2001. The impact of activity-based costing techniques on
firm performance. Journal of Management Accounting Research. 13: 19-45.
Ketchen, D.J. and C.L. Shook. 1996. The application of cluster analysis in strategic management
research: An analysis and critique. Strategic Management Journal. 17(6): 441-458.
Krumwiede, K. R. 1998. The implementation stages of activity-based costing and the impact of
contextual and organizational factors. Journal of Management Accounting Research 10: 239-
277.

47
Lillis, A. M., and P. M. G. van Veen-Dirks. 2008. Performance measurement system design in
joint strategy settings. Journal of Management Accounting Research 20: 25-57.
Little, R. J. A. 1992. Regression with missing X’s: a review. Journal of the American Statistical
Association 87 (420): 1227-1237.
Miles, R. E., and C. C. Snow. 1978. Organizational Strategy, Structure and Process. New York:
McGraw-Hill.
Monden, Y. 1993. Toyota Production System. 2nd
ed. Norcross, GA: Industrial Engineering and
Management Press.
Morton, W. 2002. The unprofitable customers: How you can separate the wheat from the chaff.
Wall Street Journal Oct. 28: R7.
Niraj, R., G. Foster, M. R. Gupta, and C. Narasimhan. 2008. Understanding customer level
profitability implications of satisfaction programs. Journal of Business & Industrial Marketing
23 (7) 454-463.
Nunnally, J. C. 1967. Psychometric Theory. New York, NY: McGraw-Hill.
Perrow, C. 1967. A Framework for the Comparative Analysis of Organizations. American
Sociological Review: 194-208.
Podsakoff, P. M., and D. W. Organ. 1986. Self-reports in organizational research: Problems and
Prospects. Journal of Management 12 (4): 531-544.
Porter, M.E. 1980. Competitive Strategy. New York, NY: The Free Press.
Porter, M.E. 1985. Competitive Advantage. New York, NY: The Free Press.
Porter, M. E. 1996. What is strategy? Harvard Business Review (November-December): 61-78.
Searcy, D. L. 2004. Using Activity-based costing to assess channel/customer profitability.
Management accounting Quarterly 4 (2): 51-60
Shields, M. D. 1995. An empirical analysis of firms’ implementation experiences with activity-
based costing. Journal of Management Accounting Research 7: 1-28.
Simons, R. 1987. Accounting control systems and business strategy: an empirical analysis.
Accounting, Organizations and Society 12 (4): 357-374.
Swenson, D. W. 1995. The benefits of activity-based cost management to the manufacturing
industry. Journal of Management Accounting Research 7: 167-180.

48
Treacy, M., and F. Wiersema. 1995. The Discipline of Market Leaders: Choose Your Customers,
Narrow Your Focus, Dominate Your Market. Reading, MA: Addison-Wesley.
Turney, P. B. B. 1992. Activity-based management. Management Accounting 73 (7): 20-25.
Van Veen-Dirks, P., R. Molenaar. 2009. Customer Profitability Pricing. Cost Management
(May/June): 32-45.
Walker, O. C., and R. W. Ruekert. 1987. Marketing’s role in the implementation of business
strategies: A critical review and conceptual framework. Journal of Marketing 51 (July): 15-33.
Young, S. Mark. 1996. Survey research in management accounting: A critical assessment. In
Research Methods in Accounting: Issues and Debates, edited by Alan Richardson, 55-68.
Vancouver, B.C.: CGA-Canada Research Foundation.
49
Endnotes
1 Kaplan and Cooper (1998, 137) define activity-based management as “the entire set of actions
that can be taken, on a better informed basis, with activity-based cost information.”
2 Prospectors take an aggressive new product-market position within broadly defined markets
and tend to be industry pioneers in the creation and development of new technologies. Defenders
often take a conservative view of new product development and attempt to maintain a secure
market position in a narrower segment of the market, competing on price or quality and rarely
introduce new technologies to the market. Analyzers represent elements of both prospector and
defenders strategies, maintaining a secure market position within a core market but also seeking
new market positions through product development . Reactors are characterized by the absence
of any well-developed plan for competing within an industry. For a good discussions comparing
the Miles and Snow (1978) prospector-defender typology and the Porter (1980) differentiation-
cost leadership typology, see Govindarajan (1986) and Walker and Ruekert (1987).
3 Because the “focus” approach includes one or both of the other two approaches but aimed at a
particular target segment, prior research using this framework typically uses only the first two
approaches (i.e., differentiation and cost leadership) (Chenhall and Langfield-Smith (1998).
4 Techniques included hand-addressing and stamping envelopes, hand-signing the cover letters
and reply cards, attaching a hand-written, personalized note requesting the individual’s
participation in the study, and mailing a “friendly reminder” postcard (after two weeks) and a
second survey (after four weeks) to individuals who had not returned the reply card from the first
mailing. The two survey mailings in late 2001 included a reply card separate from the survey,
asking the individual to indicate whether the survey was completed or why he/she was unable to
complete the survey. The information from the reply cards allowed the second survey mailing to
50
be sent only to individuals who had not returned the reply card from the first mailing. In
addition, the reply cards provide information about the nonrespondents.
5 First, we analyzed the 99 individuals who did not respond to the survey but returned the reply
card. Forty-nine said they are either a consultant, full-time professor, unemployed, or retired. Of
the rest, 28 said their company has a policy against responding to surveys, and 22 either did not
have the information, felt the survey was not applicable or helpful to them, or had changed
employment. Second, a comparison was made of the survey respondents with known
characteristics of the CMG membership (industry and job title). No significant differences were
found. Third, the early responses were compared with the later responses for firm characteristics
including contextual factors, ABCM usage, and firm performance. No significant differences at
the p<0.05 level were found between early and late respondents.
6 Although we generally use the same strategy questions as Chenhall and Langfield-Smith
(1998), we classify the questions somewhat differently. They used factor analysis to determine
which questions loaded together and labeled the resulting three groups as Customer service, Low
price, and Flexibility. Some of the questions in the resulting groups seemed out of place. For
instance, “Low cost of production or service” was included in the Flexibility group and “Product
availability” was in the Low Price group. We also used factor analysis and found both questions
loaded with the “low price” factor (see Table 1). We also tested the same groupings used by
Chenhall and Langfield-Smith (1998) and the resulting Cronbach alphas were all lower than the
factor groupings used in this study and below accepted reliability norms (Nunnally 1967). The
resulting groupings are also slightly different than those in Hyvonen (2007), which also differ
somewhat from Chenhall and Langfield-Smith (1998).
51
7 To test for external validity, we compared the percentage of firms in each group with the
percentages in the Chenhall and Langfield-Smith (CLS) (1998) and Lillis and van Veen-Dirks
(LVD) (2008) studies. The results are as follows:
Group CLS LVD Current study
Joint strategies 9 (13%) 33 (39%) 101 (38%)
Archetypal-differentiation 34 (47%) 44 (52%) 105 (40%)
Archetypal-low price 9 (13%) 5 ( 6%) 27 (10%)
Neither 20 (27%) 2 ( 2%) 31 (12%)
72 (100%) 84 (100%) 264 (100%)
The categorization compares fairly closely to that of LVD overall. It should be noted the table
above differs from LVD’s Table 5, which defined differentiation firms as volume flexibility
only. The table above defines differentiation as including all three of their differentiation
strategies. In LVD’s Table 5, the percentages were 27%, 30%, 18%, and 25%, respectively. The
LVD study had relatively more archetypal-differentiation firms (52% vs. 40%) and fewer
archetypal-low price strategy firms (6% vs. 10%) and fewer “neither” firms (2% vs. 12%). There
are some differences between the three studies that should be noted here. First, both the CLS and
LVD studies were of manufacturing firms only while this study includes both manufacturing and
non-manufacturing firms. It also used different strategy questions than the current study. Finally,
the CLS classifications are based on cluster analysis along with non-strategy factors, so the
classifications are not “pure” strategy groups. In addition, we also conducted post-survey
telephone or email interviews with 21 survey respondents (who provided their name and contact
information) to validate our classifications of their firm’s strategic focus. The literature suggests
that each method of classifying strategies provides a somewhat different result, and no standard
exists for a satisfactory level of consistency (Ketchen & Shook 1996).
8 The question used to measure number of employees had seven categories: [1] Under 50 (22
firms), [2] 51-100 (27 firms), [3] 101-200 (46 firms), [4] 201-500 (56 firms), [5] 501-1,000 (41
52
firms), [6] 1,001-10,000 (57 firms), [7] Over 10,000 (15 firms). The average response was 4.13
(s.d. 1.69).
9 Note that the number of firms included in the analysis in Tables 5-7 are less (N=185 to 187)
than the total number of firms in the study (N=264). As shown in Table 4 and Appendix, several
respondents did not answer all of the ABCM or performance questions.