the use of atomic force microscopy to evaluate warm mix ...€¦ · the use of atomic force...
TRANSCRIPT

The Use of Atomic Force Microscopy to Evaluate Warm Mix Asphalt
Munir D. Nazzal, Ph.D., P.E.
Lana Abu Qtaish Department of Civil Engineering
Ohio University Athens, OH 45701
for the
Ohio Department of Transportation Office of Statewide Planning and Research
and the
U. S. Department of Transportation Federal Highway Administration
State Job Number 134626
January 2013

1. Report No.
FHWA/OH-2012/19
2. Government Accession No.
3. Recipient’s Catalog No.
4. Title and subtitle
The Use of Atomic Force Microscopy to Evaluate Warm Mix Asphalt
5. Report Date
January 2013
6. Performing Organization Code
7. Author(s)
Munir D. Nazzal, Lana Abu Qtaish
8. Performing Organization Report No.
10. Work Unit No. (TRAIS)
9. Performing Organization Name and Address
Ohio University
141 Stocker Center
Athens, OH 45701-2979
11. Contract or Grant No.
State Job No. 134626
13. Type of Report and Period Covered
Final Report
12. Sponsoring Agency Name and Address
Ohio Department of Transportation
1980 West Broad Street
Columbus, OH 43223
14. Sponsoring Agency Code
15. Supplementary Notes
16. Abstract: The main objective of this study was to use the Atomic Force Microscopy (AFM) to examine the moisture susceptibility
and healing characteristics of Warm Mix Asphalt (WMA) and compare it with those of conventional Hot Mix Asphalt (HMA). To
this end, different AFM techniques such as the tapping mode imaging and force spectroscopy experiments were conducted on two
types of asphalt binders produced using various WMA technologies as well as a conventional HMA. The considered WMA
technologies included: Advera, Evotherm M1, Sasobit, and foamed WMA. Dynamic Shear Rheometer (DSR) tests were conducted on
the evaluated binders, and AASHTO T283 test was performed on mixtures prepared using those binders. The results of the AFM
imaging showed that while the Sasobit additive has reduced the dimensions of the so called ‘bee-like’ structures within the neat and
polymer modified asphalt binders, the other WMA technologies did not have any significant effect on these structures. In addition, the
Sasobit resulted in increasing the relative stiffness of dispersed domains containing the ‘bee-like’ structure in comparison with the flat
asphalt matrix for both types of binders, which explained the higher shear modulus values obtained in the DSR test for binders with
this WMA additive. The results of the AFM force spectroscopy experiments indicated that all WMA technologies resulted in
increasing the nano-scale adhesive forces for both types of asphalt binders prior to moisture conditioning. Advera and foamed WMA
had the highest improvement to these forces, while the Sasobit had the least. This might be the cause for the lower indirect tensile
strength value that was obtained for the Sasobit mixtures in comparison to other WMA mixtures. The AFM results also showed that
the adhesive forces were significantly reduced due to moisture conditioning of the control and WMA 64-22 binders. However, the
control and Evotherm WMA binders exhibited the least reduction, while the Advera WMA binder had the highest decrease, which
may have contributed to reducing the tensile strength ratio values of the Advera 64-22 mixture. The Sasobit and Advera was also
found to reduce the nano-scale cohesive forces within the considered asphalt binders upon moisture conditioning, indicating that it
might adversely affect the cohesive bonds within the asphalt binder. The results of the AFM force spectroscopy experiments also
suggested that the AASHTO T283 test results primarily depend on the adhesive forces between the aggregate and the binder. The
AFM healing experiments indicated that all WMA technologies except the Sasobit resulted in improving the micro-crack closure rate
in both types of asphalt binders considered in this study. In addition, only the Sasobit resulted in significant decrease in the cohesive
bonding energy; indicating that it might adversely affect the intrinsic healing of the considered asphalt binders. On the contrary, the
other WMA technologies improved the –OH cohesive bonding energy and did not significantly influence the –COOH cohesive
bonding energy for both asphalt binders. Finally, the results of this study indicated that the AFM is a viable device to study the
moisture damage and healing phenomena in asphalt materials.
17. Key Words
Warm mix asphalt, moisture induced damage, healing
AFM, nanotechnology
18. Distribution Statement
No restrictions. This document is available to the public
through the National Technical Information Service,
Springfield, Virginia 22161
19. Security Classif. (of this report)
Unclassified
20. Security Classif. (of this page)
Unclassified
21. No. of Pages
108
22. Price
Form DOT F 1700.7 (8-72) Reproduction of completed pages authorized

Final Report
State Job No. 134626
The Use of Atomic Force Microscopy to Evaluate Warm Mix Asphalt
Prepared by:
Munir D. Nazzal, Ph.D., P.E.
Department of Civil Engineering
Ohio University
Athens, OH 45701
&
Lana Abu-Qtaish
Department of Civil Engineering
Ohio University
Athens, OH 45701
Prepared in Cooperation with
The Ohio Department of Transportation
&
The U. S. Department of Transportation
Federal Highway Administration
January 2013

ii
DISCLAIMER
The contents of this report reflect the views of the authors who are responsible for the
facts and accuracy of the data presented herein. The contents do not necessarily reflect the
official views or policies of the Ohio Department of Transportation (ODOT) or the Federal
Highway Administration (FHWA). This report does not constitute a standard, specification or
regulation.
ACKNOWLEDGEMENTS
The researchers would like to thank the Ohio Department of Transportation (ODOT) and
the Federal Highway Administration (FHWA) for sponsoring this study. The researchers would
like to extend their thanks to ODOT technical liaison, Mr. David Powers, for his valuable
contributions to this report. Without his assistance, this work would not have been possible. The
researchers would like also to thank Dr. Savas Kaya of School of Electrical Engineering and
Computer Science at Ohio University and Dr. Ala Abbas of the Department of Civil Engineering
at the University of Akron for allowing us to use equipment needed for the completion of this
research work and for all of their helpful comments and suggestions. Finally, the researchers
would like to thank Mr. Ed Morrison and Shelly and Sands, Inc. and Mar-Zane, Inc. for
donating the asphalt binders and aggregates used in this study

i
TABLE OF CONTENTS
ABSTRACT ..............................................................................................................................1
Chapter 1 INTRODUCTION ....................................................................................................3
1.1 Problem Statement ..................................................................................3
1.2 Objectives of the Study ..........................................................................4
1.3 Report Organization ...............................................................................4
Chapter 2 LITERATURE REVIEW ........................................................................................5
2.1 Warm Mix Asphalt ................................................................................5
2.2 Moisture-Induced Damage of Asphalt Mixtures Pavements .................6
2.3 Healing In Asphalt Materials .................................................................14
2.4 Atomic Force Microscopy .....................................................................14
Chapter 3 MATERIAL DESCRIPTION .................................................................................19
3.1 Binders ..................................................................................................19
3.2 Aggregates ............................................................................................20
3.3 WMA Technologies ..............................................................................21
3.4 Mix Design Verfication ........................................................................25
Chapter 4 TESTING PROGRAM ............................................................................................29
4.1 Introduction ............................................................................................29
4.2 Sample Preparation for AASHTO T283 ................................................29
4.3 AFM Sample Preparation ......................................................................30
4.4 Macro-Scale Charecterization of Asphalt Mixtures ..............................32
4.5 Micro & Nano-Scale Characterization...................................................34
Chapter 5 TEST RESULTS AND DATA ANALYSIS ...........................................................39
5.1 Introduction ............................................................................................39
5.2 AASHTO T283 Test Results ................................................................39
5.3 Results of DSR ......................................................................................47
5.4 Results of AFM Imaging ......................................................................49
5.5 Results of Force Spectroscopy Experiments ........................................57
5.6 Comparison Between The Results Of Nano And Macro-Scale Tests ..75
5.7 Results of Healing Experiments............................................................76
Chapter 6 CONCLUSIONS AND RECOMMENDATIONS ..................................................88
6.1 Summary and Conclusions ...................................................................88
6.2 Study Limitations ..................................................................................92
6.3 Recommendations for Further Study ....................................................92
6.4 Recommendations for Implementation .................................................92
REFERENCES .........................................................................................................................94

ii
LIST OF TABLES
Table 3.1: Properties of asphalt binders. ....................................................................................... 19
Table 3.2: Aggregates gradation. .................................................................................................. 20
Table 3.3: Consensus properties of coarse and fine aggregates.................................................... 20
Table 3.4: Evotherm M1 properties. ............................................................................................. 23
Table 3.5: Superpave mix design parameters for the evaluated mixtures. ................................... 27
Table 4.1: Production temperatures for WMA mixtures. ............................................................. 30
Table 5.1: Results of ANOVA analysis on ITS of 70-22M mixtures. .......................................... 42
Table 5.2: Results of Post ANOVA LSM analyses on ITS of 70-22M mixtures. ........................ 42
Table 5.3: Results of ANOVA analysis on the ITS of 64-22 mixtures. ....................................... 45
Table 5.4: Results of Post ANOVA analyses on the ITS of 64-22 mixtures. ............................... 46
Table 5.5: Results of multi-factor ANOVA analyses on ITS values. ........................................... 47
Table 5.6: ANOVA results for adhesive & cohesive forces of unconditioned 70-22M samples. 63
Table 5.7: Post ANOVA results for adhesive & cohesive forces of unconditioned 70-22M
samples .......................................................................................................................................... 63
Table 5.8: ANOVA results for adhesive & cohesive forces of conditioned 70-22M samples. .... 66
Table 5.9: Post ANOVA results for adhesive & cohesive forces of conditioned 70-22M samples.
....................................................................................................................................................... 66
Table 5.10: ANOVA results for adhesive & cohesive forces of unconditioned 64-22 samples .. 70
Table 5.11: Post ANOVA results for adhesive & cohesive forces of unconditioned 64-22 samples
....................................................................................................................................................... 70
Table 5.12: ANOVA results for adhesive & cohesive forces of conditioned 64-22 samples. ..... 73
Table 5.13: Post ANOVA results for adhesive & cohesive forces of conditioned 64-22 samples
....................................................................................................................................................... 73
Table 5.14: Multi-Factor ANOVA results for adhesive forces..................................................... 75
Table 5.15: Multi-Factor ANOVA results for –OH cohesive forces. ........................................... 75
Table 5.16: Multi-Factor ANOVA results for –COOH cohesive forces. ..................................... 76
iii
LIST OF FIGURES
Figure 2.1: Moisture damage mechanisms in asphalt mixtures ...................................................... 7
Figure 2.2: Schematic diagram of AFM, adapted from (Agilent Inc. 2006) ................................ 15
Figure 3.1: Advera powder ........................................................................................................... 22
Figure 3.2: Evotherm M1 ............................................................................................................. 22
Figure 3.3: Sasobit WMA Additive .............................................................................................. 23
Figure 3.4: Multi-Nozzle foaming device (after Astec, Inc.) ....................................................... 24
Figure 3.5: Wirtgen WLB10 asphalt foaming device (Abbas et al. 2011) ................................... 25
Figure 3.6: Aggregate blend gradation ......................................................................................... 26
Figure 4.1: Preparation of AFM samples using method I. ............................................................ 31
Figure 4.2 Preparation of AFM samples using method II. ........................................................... 32
Figure 4.3: AFM testing setup. ..................................................................................................... 35
Figure 4.4 Screenshot of Agilent software ................................................................................... 37
Figure 5.1: ITS of dry HMA and WMA 70-22M samples. .......................................................... 40
Figure 5.2: ITS of conditioned HMA and WMA 70-22M samples. ............................................. 40
Figure 5.3: TSR values for HMA and WMA 70-22M mixtures................................................... 41
Figure 5.4: ITS of dry HMA and WMA 64-22 samples. .............................................................. 43
Figure 5.5: ITS of conditioned HMA and WMA 64-22 samples. ................................................ 44
Figure 5.6: TSR values for HMA and WMA 64-22 mixtures. ..................................................... 44
Figure 5.7: Master curve for 70-22M binders ............................................................................... 48
Figure 5.8: Master curve for 64-22 binders .................................................................................. 49
Figure 5.9: AFM images of 70-22M binder: (a) Topographical images (b) Phase images .......... 50
Figure 5.10: AFM images of 70-Advera binder: (a) Topographical images (b) Phase images .... 50
Figure 5.11: AFM images of 70-Evotherrm binder: (a) Topographical images (b) Phase images
....................................................................................................................................................... 51
Figure 5.12: AFM images of 70-Sasobit binder: (a) Topographical images (b) Phase images .... 51
Figure 5.13: AFM images of 70-Foamed binder: (a) Topographical images (b) Phase images ... 52
Figure 5.14 AFM images of control 64-22 asphalt binder: (a) Topographical images (b) Phase
images ........................................................................................................................................... 54
Figure 5.15: AFM images of 64-Advera binder: (a) Topographical images (b) Phase images .... 54
Figure 5.16: AFM images of 64-Evotherrm binder: (a) Topographical images (b) Phase images
....................................................................................................................................................... 55
Figure 5.17: AFM images of 64-Sasobit binder: (a) Topographical images (b) Phase images .... 55
Figure 5.18: AFM images of 64-Foamed binder: (a) Topographical images (b) Phase images ... 56
Figure 5.19: Average roughness of AFM images for 70-22M binders......................................... 57
Figure 5.20: Average roughness of AFM images for 64-22 binders. ........................................... 58
Figure 5.21: Typical Force-Distance Curves Obtained From Force Spectroscopy Experiments . 59
Figure 5.22:Adhesive force for unconditioned dry 70-22M samples. .......................................... 60
Figure 5.23: Cohesive forces for unconditioned dry 70-22M samples using –OH tip. ................ 60
Figure 5.24: Cohesion forces for unconditioned dry 70-22M samples using –COOH tip. .......... 61
Figure 5.25: Adhesive force for conditioned 70-22M binders ..................................................... 64
Figure 5.26: Cohesive force for conditioned 70-22M binders using –OH tips. ........................... 64
Figure 5.27: Cohesive force for conditioned 70-22M binders using –COOH tips. ...................... 65
Figure 5.28: Adhesive force for unconditioned dry 64-22 samples.............................................. 68
Figure 5.29: Cohesive forces for unconditioned dry 64-22 samples using –OH tip. .................... 68

iv
Figure 5.30: Cohesive forces for unconditioned dry 64-22 samples using –COOH tip. .............. 69
Figure 5.31: Adhesive forces for conditioned dry 64-22 samples. ............................................... 71
Figure 5.32: Cohesive forces for conditioned 64-22 samples using –OH tip. .............................. 71
Figure 5.33: Cohesive forces for conditioned 64-22 samples using –COOH tip. ........................ 72
Figure 5.34: Relationship between Adhesive forces ITS for 70-22M materials: a) unconditioned
....................................................................................................................................................... 77
Figure 5.35: Relationship between –OH Cohesive forces ITS for 70-22M materials: ................. 77
Figure 5.36: Relationship between –COOH Cohesive forces ITS for 70-22M materials: ........... 77
Figure 5.37: Relationship between Adhesive forces ITS for 64-22 materials: a) unconditioned . 78
Figure 5.38: Relationship between –OH Cohesive forces ITS for 64-22 materials: .................... 78
Figure 5.39: Relationship between –COOH Cohesive forces ITS for 64-22 materials: ............... 78
Figure 5.40: AFM topographical images: a) Directly before probing b) 163 sec after probing c)
350 sec after probing d) 800 sec after probing ............................................................................ 80
Figure 5.41: Crack volume decrease with time for 70-22M samples ........................................... 81
Figure 5.42: Crack closure rate for 70-22M samples. .................................................................. 81
Figure 5.43: Crack closure rate vs. –OH Cohesive Force for 70-22M samples. .......................... 82
Figure 5.44: Crack Volume Decrease with time for 64-22 samples. ............................................ 82
Figure 5.45: Crack closure rate for 4-22 samples. ........................................................................ 83
Figure 5.46: Crack closure rate vs. –OH Cohesive Force for 70-22M samples. .......................... 83
Figure 5.47: Determining cohesive bonding energy. .................................................................... 84
Figure 5.48: Cohesive bonding energy using –OH tips for 70-22M samples. ............................. 85
Figure 5.49: Cohesive bonding energy using –COOH tips for 70-22M samples. ........................ 85
Figure 5.50: Crack closure rate vs. –OH cohesive force for 64-22 samples. ............................... 86
Figure 5.51: Cohesive bonding energy using –COOH tips for 64-22 samples. ........................... 87

1
THE USE OF ATOMIC FORCE MICROSCOPY
TO EVALUATE WARM MIX ASPHALT
ABSTRACT
The main objective of this study was to use the Atomic Force Microscopy (AFM) to
examine the moisture susceptibility and healing characteristics of Warm Mix Asphalt (WMA)
and compare it with those of conventional Hot Mix Asphalt (HMA). To this end, different AFM
techniques such as the tapping mode imaging and force spectroscopy experiments were
conducted on two types of asphalt binders produced using various WMA technologies as well as
a conventional HMA. The considered WMA technologies included: Advera, Evotherm M1,
Sasobit, and foamed WMA. Dynamic Shear Rheometer (DSR) test was conducted on the
evaluated binders, and AASHTO T283 test was performed on mixtures prepared using those
binders. The results of the AFM imaging showed that while the Sasobit additive has reduced the
dimensions of the so called ‘bee-like’ structures within the neat and polymer modified asphalt
binders, the other WMA technologies did not have any significant effect on these structures. In
addition, the Sasobit resulted in increasing the relative stiffness of dispersed domains containing
the ‘bee-like’ structure in comparison with the flat asphalt matrix for both types of binders,
which explained the higher shear modulus values obtained in the DSR test for binders with this
WMA additive. The results of the AFM force spectroscopy experiments indicated that all WMA
technologies resulted in increasing the nano-scale adhesive forces for both types of asphalt
binders prior to moisture conditioning. Advera and foamed WMA had the highest improvement
to these forces, while the Sasobit had the least. This might be the cause for the lower indirect
tensile strength value that was obtained for the Sasobit mixtures in comparison to other WMA
mixtures. The AFM results also showed that the adhesive forces were significantly reduced due
to moisture conditioning of the control and WMA 64-22 binders. However, the control and
Evotherm WMA binders exhibited the least reduction, while the Advera WMA binder had the
highest decrease, which may have contributed to reducing the tensile strength ratio values of the
Advera 64-22 mixture. The Sasobit and Advera was also found to reduce the nano-scale
cohesive forces within the considered asphalt binders upon moisture conditioning, indicating that
it might adversely affect the cohesive bonds within the asphalt binder. The results of the AFM
2
force spectroscopy experiments also suggested that the AASHTO T283 test results primarily
depend on the adhesive forces between the aggregate and the binder. The AFM healing
experiments indicated that all WMA technologies except the Sasobit resulted in improving the
micro-crack closure rate in both types of asphalt binders considered in this study. In addition,
only the Sasobit resulted in significant decrease in the cohesive bonding energy; indicating that it
might adversely affect the intrinsic healing of the considered asphalt binders. On the contrary,
the other WMA technologies improved the –OH cohesive bonding energy and did not
significantly influence the –COOH cohesive bonding energy for both asphalt binders. Finally,
the results of this study indicated that the AFM is a viable device to study the moisture damage
and healing phenomena in asphalt materials.

3
Chapter 1 INTRODUCTION
1.1 Problem Statement
Warm Mix Asphalt (WMA) has received considerable attention in past few years due to
its benefits in reducing energy consumption and pollutant emissions during production and
placement of asphalt mixtures, and as a compaction aid during the construction process.
However, many concerns and questions are still unanswered regarding the performance and
durability of WMA. One key issue is the moisture susceptibility of WMA. Although the results
of standard laboratory tests indicated that WMA may be more susceptible to moisture damage
than Hot Mix Asphalt (HMA), data obtained from the field does not support those results. Some
data also suggests that the resistance of WMA to moisture damage improves with time and may
ultimately be equivalent to that of HMA. In addition, the healing characteristics of WMA have
not yet been studied nor evaluated in a methodical, scientific manner. Therefore, research is
needed to determine if the degree of healing in WMA is sufficient to increase their resistance to
damage, and hence enhance their long term durability.
The fundamental understanding and evaluation of the moisture damage and healing
characteristics of WMA requires careful consideration of the micro-mechanisms that influence
the adhesive bonds between the asphalt binder and the aggregate, and the cohesive bonds within
the asphalt binder. However, all standard laboratory tests that have been used to evaluate the
WMA examine their integral, macro-scale behavior only. Therefore, those tests are limited in
their ability to validate the moisture damage and healing mechanisms in an asphalt system, as
they cannot examine and determine factors contributing to its response at the micro-scale.
This research aims at investigating a paradigm shift in the characterization of WMA such
that the recent progress in nano-mechanics and material science can be utilized to study the
moisture damage resistance and healing characteristics of WMA, and compare them to those of
conventional HMA. The novelty of the pursued approach is to examine the nano-scale behavior
for WMA using the Atomic Force Microscopy (AFM) and to identify nano-scale parameters that
can be used to interpret the macro-scale field performance. The practical outcome of this project
is an improved nano-to-macro understanding of WMA that can facilitate the successful
4
implementation of WMA in Ohio, and lead to the development of sustainable pavement
structures.
1.2 Objectives of the Study
The main objective of this research project is to study the micro-scale behavior of WMA
using the Atomic Force Microscopy (AFM). The specific objectives of this study include:
Develop sample preparation procedure and testing protocols for nano-scale AFM testing
on asphalt materials.
Identify the AFM testing parameters that can be utilized in the evaluation of moisture
susceptibility and healing characteristics of asphalt materials.
Quantify the nano-scale level adhesive and cohesive forces in a WMA system under dry
and wet conditions using AFM and compare it to that in a control HMA.
Evaluate the influence of WMA technologies on the healing characteristics of asphalt
binders.
1.3 Report Organization
This report is organized into six chapters. Chapter 2 presents a literature review of
subjects pertinent to this study. It provides an overview of the results of studies that evaluated the
moisture induced damage and healing of WMA and HMA mixtures. Chapter 3 presents the
aggregate and asphalt materials as well as the different WMA technologies investigated this
study, followed by a discussion of the mix design verification procedure. Chapter 4 provides a
detailed description of the experimental testing program conducted in this study. Chapter 5
presents the results of the experiments as well as the outcome of the statistical analysis. Finally,
Chapter 6 presents the main conclusions and recommendations for future study.

5
Chapter 2 LITERATURE REVIEW
This chapter summarizes the main findings of previous studies that have been performed to
evaluate the moisture sensitivity and healing characteristics of WMA mixtures at the macro and
micro-scale levels. In addition, a background on atomic force microscopy and its application to
asphalt materials is also provided.
2.1 Warm Mix Asphalt
WMA is a generic term used to describe asphalt mixtures that are produced and
compacted at temperatures lower than those used for the traditional HMA mixes. It was
developed in Europe with the aim of reducing greenhouse gases produced by manufacturing
industries (Moulthrop, 2007). While heat is used to reduce asphalt viscosity and to dry aggregate
during mixing of conventional asphalt mixtures, WMA reduces asphalt viscosity by including
special organic or chemical additives or introducing cool water into the heated molten asphalt
under controlled temperature and pressure conditions, resulting in so-called foamed asphalt
binder. The reduction in viscosity still allows the asphalt binder to adequately coat the
aggregates during mixing.
Various WMA technologies have been proposed and used during the past decade. Those
technologies can be classified into two main types. The first type uses some form of organic or
chemical additives to produce WMA. Examples on this type include: Sasobit, Evotherm DAT,
Evotherm 3G, Rediset WMX, and Cecabase RT. The second type of WMA technologies is
produced by foaming the asphalt binder, which is achieved by adding a small amount of water to
the binder, either via a foaming nozzle or a hydrophilic material such as Aspha-min. Examples
on foaming systems used in the asphalt plants include: Terex, Ultrafoam GX, and Astec Double
Barrel Green systems.
Several studies have been conducted in the last decade to evaluate the performance of
WMA mixtures and characterize its properties (e.g. Bonaquist, 2011, Nazzal et al. 2011, Abbas
et al. 2012, Kvasnak et al. 2010, Kanitpong et al., 2007, Kristjansdottir et al., 2007, Hurley and
Prowell, 2006, Hurley and Prowell, 2005). These studies revealed several benefits for using

6
WMA technology, which included: significant reduction in the green gas emission due to the
lower temperatures, reduction in the fuel cost, longer paving season, longer haul distances, and
less oxidative hardening of the asphalt mixture resulting in a reduction of block and thermal
cracking in the pavements.
Despite the advantages of using WMA, there are still concerns about its long-term
performance and durability. Specifically, one of the major concerns with WMA is its ability to
resist moisture induced damage. The WMA resistance to moisture damage was evaluated in
several studies. The proceeding sections introduce the moisture induced damage phenomenon in
asphalt materials and summarizes the findings of studies performed to evaluate the moisture
susceptibility of different types of WMA.
2.2 Moisture-Induced Damage of Asphalt Mixtures Pavements
Moisture-induced damage is one of the most significant problems in asphalt mixtures. It is
considered one of the main causes of distress and premature failure in asphalt pavement, which
result in significant maintenance and rehabilitation costs (Copeland, 2005). Moisture damage is
caused by the failure in the adhesive bonds between the binder and aggregates or by the failure in
the cohesive bonds within the binder itself due to the presence of moisture in the mixture
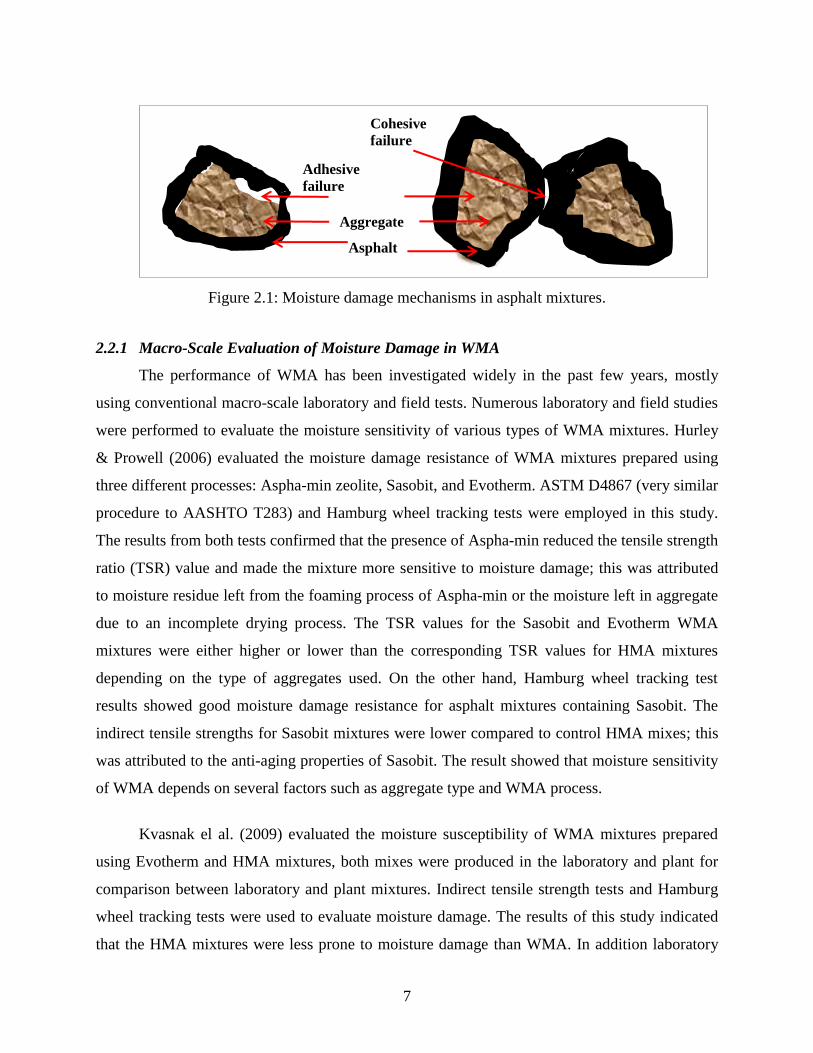
(Tarefder & Zaman, 2010). Figure 2.1 shows the moisture damage mechanisms in an asphalt
mixture. Several factors have been recognized as causes of moisture damage, these include:
aggregate type and chemical composition, chemical and physical properties of the asphalt binder,
asphalt content, asphalt mixtures properties, the nature of water the mix is being exposed to, and
the climate and traffic conditions (Abu Al-Rub et al., 2010).
Over the past decade, several studies were conducted to evaluate moisture induced
damage resistance of WMA and compare it to that of HMA asphalt mixtures. Most of these
studies used macro-scale tests such as: modified Lottman (AASHTO T283), dynamic modulus,
and Hamburg wheel tracking tests. Some studies have also used micro-mechanical approaches
such as the surface energy methods and the dynamic mechanical analyzer to examine the
moisture susceptibility of WMA (e.g., Estakhri et al., 2010; Wasiuddin et al., 2008; Bhasin et al.,
2006). A summary of the results of the different studies that have been performed to assess
moisture susceptibility of WMA is provided in the proceeding sections.
7
Figure 2.1: Moisture damage mechanisms in asphalt mixtures.
2.2.1 Macro-Scale Evaluation of Moisture Damage in WMA
The performance of WMA has been investigated widely in the past few years, mostly
using conventional macro-scale laboratory and field tests. Numerous laboratory and field studies
were performed to evaluate the moisture sensitivity of various types of WMA mixtures. Hurley
& Prowell (2006) evaluated the moisture damage resistance of WMA mixtures prepared using
three different processes: Aspha-min zeolite, Sasobit, and Evotherm. ASTM D4867 (very similar
procedure to AASHTO T283) and Hamburg wheel tracking tests were employed in this study.
The results from both tests confirmed that the presence of Aspha-min reduced the tensile strength
ratio (TSR) value and made the mixture more sensitive to moisture damage; this was attributed
to moisture residue left from the foaming process of Aspha-min or the moisture left in aggregate
due to an incomplete drying process. The TSR values for the Sasobit and Evotherm WMA
mixtures were either higher or lower than the corresponding TSR values for HMA mixtures
depending on the type of aggregates used. On the other hand, Hamburg wheel tracking test
results showed good moisture damage resistance for asphalt mixtures containing Sasobit. The
indirect tensile strengths for Sasobit mixtures were lower compared to control HMA mixes; this
was attributed to the anti-aging properties of Sasobit. The result showed that moisture sensitivity
of WMA depends on several factors such as aggregate type and WMA process.
Kvasnak el al. (2009) evaluated the moisture susceptibility of WMA mixtures prepared
using Evotherm and HMA mixtures, both mixes were produced in the laboratory and plant for
comparison between laboratory and plant mixtures. Indirect tensile strength tests and Hamburg
wheel tracking tests were used to evaluate moisture damage. The results of this study indicated
that the HMA mixtures were less prone to moisture damage than WMA. In addition laboratory
Adhesive
failure
Asphalt
Cohesive
failure
Aggregate

8
produced WMA mixtures were more susceptible to moisture damage compared to plant
mixtures.
Bonaquist (2011) has completed a study for National Cooperative Highway Research
Program (NCHRP 9-43) to develop a mix design procedure for the current WMA technologies in
the different states and to evaluate their performance as compared to conventional HMA mixes.
The moisture sensitivity for the WMA mixtures was examined in this study using the AASHTO
T283 test. The study concluded that the TSR values of WMA mixtures containing anti-strip
remained the same as HMA or improved in 67% of the evaluated mixtures. Nevertheless, TSR
values did not improve and decreased in 79% of the WMA mixtures that did not contain any
anti-strip additives. The results of the project mainly showed that the moisture susceptibility of
the WMA mixtures is mainly dependent on the type of the WMA technology used.
Aschenbrener et al. (2011) conducted a study to evaluate the laboratory and field
performance of different types of WMA in comparison to control HMA mixes. The types of
WMA used were: Advera, Evotherm, and Sasobit. Moisture Damage was evaluated using the
AASHTO T283 test. The results of the laboratory test indicated that WMA mixtures may be
more susceptible to moisture damage when compared to HMA mixtures. Dynamic modulus and
flow number tests were done to evaluate stiffness of mixture; the results showed that HMA
mixes were slightly stiffer than WMA. This indicated that WMA sections might be me more
susceptible to rutting. However, field performance for WMA was excellent and comparable to
HMA and the tensile strength for cores taken after two and three years showed no difference
between HMA control sections and WMA sections. WMA sections performed as well as HMA
control sections in terms of resistance to rutting, cracking and raveling.
Buss et al. (2011) reported the results of a study to evaluate the performance of mixtures
produced using four types of WMA technologies and compare it with that of HMA mixes. The
considered WMA technologies included: Evotherm 3G, Revix, Sasobit, and Double Barrel Green
foaming. Field compacted and reheated field samples were produced and tested. The mix testing
included the AASHTO T283, dynamic modulus, and flow number tests. The results of this study
showed that the foamed WMA mixtures had the best performance in the dynamic modulus and
flow number tests. In addition, the TSR values for all WMA mixtures except the foamed WMA

9
were less than these of the HMA for both field and laboratory compacted specimens. However,
these values were greater than the passing criteria of 0.80. Buss et al. (2011) demonstrated that
WMA technologies may impact the mixture response to moisture conditioning and
recommended that the use of foaming technology should be further investigated under a higher
degree of control.
Alavi et al. (2012) studied the effect of WMA additives and the production temperature on
the moisture damage and adhesive properties of WMA materials. The adhesion properties were
evaluated using a new experimental testing procedure called bitumen bond strength (BBS). In
this test a pull stub adhered to an aggregate substrate is subjected to a normal force created by
increasing pneumatic pressure, the bond strength is the maximum pull off pressure excreted by
the machine. This test was used to measure the strength of bond at the aggregate/asphalt interface
and evaluate the effect of WMA on this bond for dry/wet conditioned samples to determine the
bond strength ratio (BSR). The moisture susceptibility of mixtures was evaluated using the
dynamic modulus (|E*|) test after subjecting the asphalt samples to multiple freeze and thaw
cycles. The dynamic modulus stiffness ratio (ESR) was determined by taking the ratio between
the |E*| for moisture conditioned samples to and that of control unconditioned samples and was
used as a parameter for evaluating moisture susceptibility. Different types of materials were used
for the evaluated mixtures. These included two types of asphalt binders: namely, PG 64-22 and
PG 76-22M, three types of WMA additives: Advera, Rediset and VR-1, and two aggregates
types: granite and rhyolite. The results showed that the dry bond strength was significantly
impacted by the aggregate type; however the wet bond strength was mainly affected by the
presence of WMA additives. The |E*| data showed a potential moisture damage problem for
Advera mixtures when used with granite; however, better results were obtained when it was used
with rhyolite. An increase in moisture resistance was observed in some of the mixtures that used
Rediset and VR-1. It was concluded from both the BBS and |E*| tests results that the right
selection of WMA additive in the mix design process could potentially enhance the moisture
damage resistance and mitigate the effect of lower production temperatures.
2.2.2 Micro-Scale Evaluation Of Moisture Damage In WMA
During the past decade, micro-scale approaches have also been employed to evaluate the
moisture damage susceptibility of WMA (Cheng et al., 2002; Wasiuddin et al., 2008; Mogawer

10
et al., 2011). The used techniques include: surface free energy method, dynamic mechanical
analyzer, and dynamic shear rheometer based techniques. Surface energy of the asphalt binder
and aggregate has been empirically related to the moisture-susceptibility of asphalt mixtures
(Wasiuddin et al., 2008). While the Wilhelmy plate method has been typically used to quantify
the asphalt surface energy, aggregate surface energy has been measured using the universal
sorption method. Wasiuddin et al. (2008) investigated the effect of using Aspha-Min and Sasobit
on the adhesion and wettability of WMA mixtures using surface energy method. Adhesion and
wettability properties were then used to explain moisture susceptibility in WMA mixtures using
these two additives. Two types of asphalt binders were used in this study, namely, PG 64-22 and
a SBS polymer modified PG 76-28M binders. In addition, two aggregate types were
investigated: sandstone and limestone. It was found that the Sasobit increased the wettability
between the binder and the aggregates significantly. Nevertheless, Sasobit decreased the
adhesion between binders and aggregates. Moisture induced damage remained unaffected by the
addition of Sasobit for neat PG 64-22 binder; however it increased for PG 76-28M. Aspha-Min
did not significantly affect the wettability. However, for the PG 76-28M binder, Aspha-Min
increased the adhesion and thus enhanced the moisture resistance.
The Sasobit influence on the performance of asphalt was also investigated by Wei et al.
(2010) using the surface energy method. Surface energy for the binder was determined by
measuring the contact angle between asphalt and the liquid. Sasobit increased the contact angle
between the binder and water; therefore, it resulted in reducing the surface free energy of the
asphalt binder. The reduction of the surface energy may improve the wettability of the asphalt
binder on the aggregate, hence increasing the adhesion and improving the moisture resistance.
However, this conclusion may be debated due to the lack of surface free energy measurements
for the aggregates.
The dynamic mechanical analyzer (DMA) has also been employed to examine the
moisture damage in WMA mixtures. This test involves applying cyclic torsional strain controlled
load to cylindrical asphalt mixture prepared using fine aggregates and asphalt binder to examine
their fatigue life of asphalt mixtures under dry and wet conditions and predict the moisture
susceptibility of asphalt mixtures. Mogawer et al. (2011) investigated the fracture characteristics
of WMA mixtures under dry and wet conditions using the DMA. The testing specimens had

11
different aging time and temperature to evaluate the effect of aging on moisture damage. The
tested specimen included control, Advera, and SonneWarmix (Wax) mixtures. A crack growth
index for each specimen was calculated using a fracture model for viscoelastic materials and the
data obtained from the DMA test. The results showed that the crack growth index for
conditioned sample was higher than that for dry samples indicating damage due to the presence
of moisture. The WMA mixtures using Advera were more susceptible to moisture damage
compared to control samples. However, the increase in aging time for the WMA mixture
improved their moisture damage resistance as the results were more comparable to the control
mix. Estakhri et al. (2010) also used the DMA to estimate the fatigue life for wet and dry HMA
and WMA mixtures. The dry WMA mixtures had higher fatigue life compared to HMA
mixtures. However the fatigue life for wet WMA specimens decreased drastically as it was much
lower than the fatigue life for dry WMA specimens indicating that WMA mixtures are more
prone to moisture damage than HMA mixtures.
In summary, there is no consensus on the effect of WMA on the moisture susceptibility of
asphalt mixtures; while some studies showed that the HMA had better moisture damage
resistance than the WMA; other studies found that the indirect tensile strength and tensile
strength ratio values obtained in AASHTO T283 test were not significantly affected by the use of
WMA technologies. Furthermore, the type of WMA technology was reported to be one of the
factors affecting the moisture resistance in asphalt mixtures. Despite the number of studies
conducted in the past on WMA, previous studies have failed to provide a good understanding of
the moisture damage phenomenon in WMA mixtures since they did not examine it mechanisms.
Macro and micro-scale tests such as AASHTO T283 test and DMA examine the overall behavior
but do not differentiate between the cohesive or adhesive failures within the asphalt system. In
addition, the surface free energy method fails to distinguish between the actions of the asphalt
binder chemical groups under wet conditions. It also does not evaluate the interaction between
the WMA additives and the asphalt constituents. Also, the Wilhelmy plate method used in
measuring the surface free energy of asphalt binder does not capture the effect of amine anti-strip
additives. Moreover, the universal sorption method involves vacuum degas preconditioning that
does not represent the atmosphere in the asphalt plant. Finally, the previous studies did not
investigate the changes that WMA brings to the asphalt binder micro-structure.

12
2.3 Healing In Asphalt Materials
Although the results of some laboratory studies suggested that the WMA may be more
susceptible to moisture damage than HMA, field data did not show to date an inferior
performance of WMA as compared to HMA (Aschenbrener et al., 2011). The healing
characteristic of WMA is an important factor that has a significant impact on its performance,
and might partially explain the differences observed between the laboratory and the field test
results. Healing, in this context, can be briefly defined as the process by which the crack growth
in asphalt binders or mixtures, which occurs due to repeated loading, is partially or completely
reversed. The healing phenomenon in asphalt materials consists of two main mechanisms:
wetting and intrinsic healing (Bhasin et al., 2011). Wetting is the mechanism in which cracked
surfaces come into contact with each other. It depends on the mechanical properties (including
viscoelastic properties) and work of cohesion for the asphalt binder. In addition, the intrinsic
healing is the strength gained by a wetted crack interface. The intrinsic healing is dictated by the
cohesive forces with asphalt binder.
During the past few years, several studies were conducted to investigate the healing
characteristics of asphalt material (e.g. Bhasin el al., 2011; Estakhri et al., 2010; Bhasin et al.,
2008; Qui et al., 2009; Shen et al., 2010). However, the healing characteristics of WMA have not
been widely studied yet. Hence, in order to interpret the healing characteristics of WMA
mixtures a thorough understanding of the healing properties of both WMA and HMA should be
acquired.
Bhasin et al. (2008) introduced a framework to predict the effect of healing on the
performance of asphalt by combining the mechanical and material properties of the asphalt. The
study proposed a model that describes healing in asphalt materials. The model was based on
previous work done on polymers healing by Wool and O’Connor (1981) and assumed that
healing in asphalt occurs due to two main processes: wetting process, which occurs due to the
wetting of the two surfaces of the micro crack, and intrinsic healing process that occurs due to
the immediate gain in the strength caused by the interfacial cohesion between the crack phases,
and a long term gain in the strength that occurs due to the dispersion of molecules from one face
to the other. The wetting process was presented by the wetting function and it directly depends

13
on the mechanical properties of the material, Poisson’s ratio, length of the healing process area,
work of cohesion (surface energy) and the tensile strength that bond the two faces. The intrinsic
healing process depends on the surface energy of the binder and self-diffusion of the asphalt
molecules at the crack interface. DSR and surface energy methods were used to estimate the
parameters for these two functions. This study provided a novel method to evaluate healing and
the authors managed to provide a better interpretation for the healing process. However
estimation for two of the wetting function parameters, the bonding tensile strength and the length
of healing process zone, was not provided.
Shen et al. (2010) investigated the cohesive healing within the asphalt binder by
employing the ratio of dissipated energy change (RDEC) approach. In this approach, the changes
in the dissipated energy in the asphalt binder were investigated during the process of applying
external loading. Two types of asphalt binders were tested; PG 64-22 and PG 70-28M. The
Dynamic shear rheometer was used to conduct the healing testing on the binders. The binders
were tested at two different temperatures (59F (15C) and 77F (25C)) and various stress and
strain levels to evaluate the effect of the temperature, stress and strain on healing rates. In order
to simulate loading conditions similar to that in the field, rest periods that ranged between 0-6
seconds were used every 10 load cycles. The results of this study showed that the neat asphalt
binder had lower healing rate compared to the polymer modified binder, the lower temperature
decreased the healing rate for the binders while the higher temperature improved the healing.
The strain level was inversely related to the healing rate. Nevertheless, the stress level was not
clearly related to the healing rate.
Although previous studies contributed significantly to advancing the knowledge of the
moisture susceptibility and healing characteristics of WMA materials, they have used tests that
cannot examine the moisture damage and healing mechanisms in an asphalt system. In addition,
most of these tests cannot evaluate the asphalt material response at the micro-scale.
Understanding the behavior at this scale is important as the typical asphalt binder thickness
coating aggregates in an asphalt mixture is in the order of a few microns. The use of nano-
mechanical techniques can help in solving this problem by providing an enhanced
characterization and modeling tool for the interfacial properties between the aggregate and the
binder as well as the mechanical properties of the asphalt binder itself.

14
2.4 Atomic Force Microscopy
One of the nanotechnology techniques that has received increasing attention for
examining the behavior of different materials is the Atomic Force Microscopy (AFM)
(Figure 2.2). AFM is a flexible high-resolution scanning probe microscopy technique, which
uses a laser-tracked cantilever with a sharp underside tip (probe) to raster over while interacting
with the sample. AFM is an ideal tool for measuring nano and micro-scale forces within a
composite material (Beach et al. 2002; Nguyen et al., 2005). It has been widely used in high-tech
materials, polymer, rubber, paint, biomaterials, and paper industries. The forces that can be
measured in AFM include, but are not limited to, mechanical contact force, friction, van der
Waals forces, capillary forces, chemical bonding, electrostatic and magnetic forces. The modern
AFM systems can accurately map a particular force in various imaging modes with nano meter
resolution or track the dependence of different components as a function of tip-surface distance
with sub-nanometer resolution.
Force measurement using the AFM has been broadly used in previous studies. Many
investigators applied AFM to measure adhesive forces between AFM tip and different materials
(Abraham, Christendat, Karan, Xu, and Masliyah, 2002; Beach, Tormoen, & Drelich, 2002;
Eastman & Zhu, 1996). Eastman & Zhu (1996) measured the adhesive forces between a mica
surface and AFM tips coated with different materials. The force-distance curves were plotted
using the AFM; the forces that were measured were the van der Waals for hydrophobic tips and
capillary forces for hydrophilic tips. Another study that was performed by Beach et al. (2001)
measured the pull-off feces between hexadecanethiol self-assembled monolayers tips and gold
coated silicon wafer.
Bhushan & Qi (2003) studied the sources of phase contrast in AFM images and the effect
of the free amplitude and set point on this contrast by testing nanocomposites and molecularly
thick lubricant films. The authors wanted to develop a technique to map surface composition of
polymer nanocomposites and lubricant film thickness. Tapping mode was used in imaging the
samples. The results showed that the phase contrast becomes very poor at high free amplitude or
set point. For given free amplitude, phase angle contrast decreases with decreasing set point.
Hence, to study the adhesion properties low free amplitude and set-point should be used for best

15
results. However, high free amplitude and set-point are more suitable for studying viscoelastic
properties of the samples.
Figure 2.2: Schematic diagram of AFM, adapted from (Agilent Inc. 2006).
During the past few years some research studies have also used AFM to study the
asphalt materials behavior (i.e. Nguyen et al., 2005; Huang et al 2005; Tarefder & Zaman, 2010).
The Western Research Institute (WRI) had evaluated different techniques for measuring
adhesive properties in eight different types of asphalt binders. AFM was used to measure the
surface force of asphalt cast onto glass substrates. Glass bead tips were used in the AFM

16
experiments conducted in this study. The measured forces were used to determine the work of
adhesion between asphalt binder and aggregates. There results showed that the moisture damage
in the asphalt binder correlate with polyaromatic hydrocarbon concentration (Huang et al., 2005).
Jager et al. (2004) identified four material phases in bitumen using the AFM. The bitumen
specimens were scanned using two modes, namely, non-contact mode and pulse-force mode to
identify the surface topography and mechanical properties of bitumen. Five different types of
bitumen were tested. Images using the non-contact mode showed “bee-like” structures that
formed due to peaks and depressions in the topography of the bitumen, the “bee-shaped”
structures were surrounded by relatively flat matrix. The matrix had two domains that could be
differentiated by a slight difference in the topography. Thus, the authors have identified four
phases in the tested bitumen; the lower and higher parts of the bee structures and two phases in
the surrounding matrix. Pulse-force mode (PFM) measurements were conducted to assess if the
identified four topographic phases poses different mechanical properties. PFM measurements
provided an insight into the stiffness properties for the four different topographic domains
through the data collected from the cantilever deflection. The peaks in the “bee-like” structure
had the highest relative stiffness value while the depression in this structure had the lowest
relative stiffness. The flat matrix also exhibited same behavior as the “bee-like” structure. The
authors assumed that the “bee-like” structure contains asphaltene and resins since it had the
highest stiffness values. On the other hand, the soft part of the matrix may contain saturates and
aromatics. The study helped in relating topographic groups in asphalt to chemical groups.
However, the research did not include phase image analysis which has been widely used to
evaluate mechanical properties of materials.
Masson et al. (2006) investigated the morphology of 13 types of asphalt binders by
studying the images obtained by AFM. However, this study did not include any mechanical
characterization of the considered asphalt binders. The results of the AFM images obtained in
this study showed that an asphalt binder could possibly have up to four phases of different
rheology and composition. The asphalt binders were classified into three groups ruled by the
variation in stiffness of the fused-aromatic rings in them. The first group included asphalt binders
with fine domains about 0.1-0.7µm in size dispersed in the homogeneous asphalt matrix. In

17
addition, the asphalt binders in the second group had 1µm flake-like dispersions. Finally, the
third group included asphalt binders with up to four different phases with different sizes.
Tarefder & Zaman (2010) recently studied the moisture damage in neat and polymer
modified asphalt binders at a nano-scale level using the AFM. The adhesive and cohesive forces
within the asphalt mix were measured by employing the AFM force spectroscopy experiments.
In order to evaluate moisture damage, the forces were measured for dry and moisture
conditioned asphalt binder samples. The results of this study demonstrated the ability of the
AFM to measure the adhesive and cohesive forces within an asphalt material. The results of
AFM experiments showed that the polymer modification for the asphalt binder enhanced its
resistance to moisture-induced damage. Furthermore, three percent polymer content was found
to yield the optimum performance for both SB and SBS polymers.
Recently, researchers have also used the AFM to study the influence of aging on the
microstructure and morphology of various types of asphalt binders (Zhang et al., 2011; Zu et al.,
2010; Scarpas et al., 2010). Zhang et al. (2011) used the AFM imaging technique to examine the
morphology of unmodified and organo-montmorillonite modified (OMMT) asphalt binder before
and aging. The results of their study indicated that after aging, the dimension and the amount of
‘bee-like’ structures were reduced, and the contrast between the flat asphalt matrix and the
dispersed domains was decreased. Finally, recent studies have also developed computational
models for studying the healing of asphalt binders that were based on images obtained using the
AFM (Kringos et al., 2012).

18

19
Chapter 3 MATERIAL DESCRIPTION
In this chapter a description of all the materials that were used in this research is
provided. These include the asphalt binders, WMA additives and the aggregate used in the mix
design procedure.
3.1 Binders
Two types of asphalt binders that are typically used in the production of asphalt mixtures
in Ohio were considered in this study. This included a styrene-butadiene-styrene (SBS) polymer
modified asphalt binder meeting specifications for PG 70-22M and one neat asphalt binder
meeting PG 64-22 specifications. Table 3.1 presents the binder properties for each of those
binders.
Table 3.1: Properties of asphalt binders.
PG 70-22M PG 64-22
Test Property Spec Sample
Result Spec
Sample
Result
Original Binder
Rotational
Viscosity @135C Pa.s ≤3.0 0.9375 ≤3.0 0.4375
G*/ Sin δ, kPa ≥1.00
@70oC
1.440
@70oC
≥1.00
@64 oC
1.230
@64 oC
Tests on RTFO Residue
G*/Sin δ, kPa ≥2.20
4.030 ≥2.20
3.070 @70
oC @64
oC
Elastic Recovery, 25C,
10 cm ≥ 60% 72.5% N/A N/A
Tests on PAV Residue
G* Sin δ, kPa ≤5000
@28 oC
2270
@28 oC
≤5000
@25 oC
3740
@25 oC
Bending Beam Creep
Stiffness, Smax, MPa,
tested at -12 oC
≤300 150 ≤300 190
Bending Beam Creep, m
value tested at -12 oC
≥0.300 0.311 ≥0.300 0.308

20
3.2 Aggregates
The aggregates used in the mix design were obtained from one of ODOT’s approved
aggregate suppliers, Stocker S & G – Gnadenhutten. The aggregate blend consisted of four types
of aggregates: crushed gravel No. 9, crushed gravel No.8, Natural sand, and manufactured sand.
Table 3.2 shows the gradation for each type of aggregate as provided by the supplier.
Table 3.2: Aggregates gradation.
Crushed gravel
No.8
Crushed gravel
No. 9
Natural sand Manufactured
sand
Sieve % Passing % Passing % Passing % Passing
1/2" (12.5) 100.0 100.0 100.0 100.0
3/8" (9.5) 95.0 100.0 100.0 100.0
#4 (4.75) 20.0 100.0 98.0 100.0
#8 (2.36) 2.0 59.0 87.0 99.0
#16 (1.18) 2.0 10.0 73.0 92.0
#30 (0.6) 2.0 2.0 47.0 72.0
#50 (0.3) 2.0 2.0 14.0 57.0
#100 (0.15) 2.0 2.0 2.0 30.0
#200 (0.075) 2.0 2.2 2.6 10.5
The aggregates that were used in the Superpave mix design met the material requirement
in terms of the course aggregate angularity (% fractured) and fine aggregate angularity (FAA).
The bulk specific gravity for each type was obtained from ODOT. Table 3.3 shows the coarse
and fine aggregate properties as provided by the supplier.
Table 3.3: Consensus properties of coarse and fine aggregates.
Coarse aggregates
Aggregate type % in blend % fractured ODOT Gsb
Crushed Gravel #9 53 92.2 2.561
Crushed Gravel #8 18 69 2.466

21
Fine aggregates
Aggregate type % in blend % FAA ODOT Gsb
Natural Sand 15 41 2.609
Manufactured Sand 14 50 2.588
3.3 WMA Technologies
Four types of WMA technologies were evaluated in this study, which included: Sasobit,
Evotherm M1, Advera, and foamed WMA produced by the water injection method. Each type of
the asphalt binders considered in this study was produced using the selected types of WMA
technologies as well as a conventional HMA. A description of the evaluated WMA technologies
is provided in below.
3.3.1 Advera
Advera is a WMA additive that is manufactured in the US by PQ Corporation, Malvern,
PA. It is an aluminosilicate or hydrated zeolite powder that contains 18-20% of chemically and
structurally bounded water in its porous crystalline structure. Advera has a form of free flowing
powder with a white color as shown in Figure 3.1. During production the trapped water in
Advera is released in the form of finely dispersed water vapor, which creates a volume expansion
of the binder that results in the formation of asphalt foam. This increases the wettability and
workability of the binder and enhances the aggregate coating at lower temperature allowing for
the reduction in production and compaction of asphalt mixtures by up to 50-70 F.
3.3.2 Evotherm M1
Evotherm M1 is one type of Evotherm 3G (third generation) that was developed by a
partnership between MeadWestvaco Paragon Technical Services and Mathy Technology &
Engineering. It is a water-free low viscosity liquid with a dark amber color (Figure 3.2) that is
introduced at the asphalt plant or asphalt terminal and blends easily with asphalt binder.
Evotherm M1 contains additives and agents that improve the workability, coating and
compaction. It also includes surfactants that increase the adhesion between the asphalt and
aggregates. When used in the production of WMA Evotherm M1 can reduce the mixing and
compaction temperature by 63 to 90 F compared to HMA. It can be used with different types of

22
asphalt including polymer modified asphalt without affecting its performance grade. The
manufacturer recommended dosage rate for Evotherm M1 ranges from 0.25 percent to 0.75
percent by the weight of asphalt cement. The typical properties of Evotherm M1 are shown in
Table 3.4.
Figure 3.1: Advera powder
Figure 3.2: Evotherm M1

23
Table 3.4: Evotherm M1 properties.
Property Typical value
Density at 77°F 0.97
Specific gravity at 77°F 2.2
Viscosity at 80 °F (centipoises) 280-560
3.3.3 Sasobit
Sasobit is a paraffin wax produced from coal gasification using the Fischer Tropsch (FT)
process, Figure 3.3. It is a fine crystalline, hydrophobic, long-chained aliphatic hydrocarbon.
Therefore, the addition of this wax to an asphalt binder causes the binder to become more
hydrophobic (Sasol Wax Co., 2008). Sasobit dissolves in the asphalt at a temperature of 248F or
above; it has longer chains length compared to the natural occurring waxes in bitumen causing it
to have lower melting point. Therefore, the addition of Sasobit results in a reduction in the
binder’s viscosity, allowing for lower production temperatures. Sasobite manufacturer, Sasol
wax, recommends adding Sasobit into the binder using a rate between 0.8 and 3 percent by
weight of binder.
Figure 3.3: Sasobit WMA Additive

24
3.3.4 Foamed WMA
Foamed WMA is produced by injecting small amount of cold water into the heated
asphalt via a foaming nozzle device. The added water turns to steam and expands upon contact
with asphalt. This results in a reduction of viscosity due to the expansion of the liquid asphalt
binder, which allows mixing and compaction of the asphalt at lower temperature. This
technology allows the production of WMA through a one-time mechanical plant modification by
attaching a foaming device such as Astec, Gencor, and Terex to the end of the asphalt binder
line, which minimize the impact of increased material costs identified with other WMA
technologies. Figure 3.4 shows a typical Astec foaming device commonly used with their Double
Barrel Green system.
Figure 3.4: Multi-Nozzle foaming device (after Astec, Inc.).
Foamed WMA can also be produced using a laboratory scale asphalt binder foaming
device such as the Wirtgen WLB10 (Figure 3.5), which was used in this study. This device
utilizes a process similar to that used by the foaming devices used in the field. As shown in
Figure 3.5, the WLB10 device consists of an asphalt binder tank, a water tank, an air tank, an
asphalt pump, heating components, a foaming nozzle, air and water pressure regulators, and a
control panel. The asphalt binder for the foamed WMA is heated to the standard mixing

25
temperature used for the HMA to ensure pumpability within the foaming device. The foaming
rate was 1.8 percent of the total weight of the asphalt binder.
Figure 3.5: Wirtgen WLB10 asphalt foaming device (Abbas et al. 2011).
3.4 Mix Design Verfication
In this project, the moisture susceptibility of HMA and WMA mixtures was evaluated at
a macro-scale level using AASHTO T283 test method. The considered asphalt mixtures had a ½
inch (12.5 mm) nominal maximum aggregate size (NMAS) and were designed to meet ODOT
specification for Item 442 Type B for heavy traffic surface mixtures. The job mix formula for the
asphalt mixtures was obtained from Shelly and Sands, Inc. and Mar-Zane, Inc. but was verified
by the research team as described below.
3.4.1 Aggregate blend
The four aggregate types (i.e. crushed gravel#9, crushed gravel #8, natural sand,
manufactured sand) were blended to produce the gradation that meets the ODOT requirement for
Superpave mixtures. Figure 3.6 shows the 0.45-power chart for the selected aggregate
gradations.
Foaming
Nozzle
Binder
Tank
Air
Tank
Water
Tank
Control
Panel

26
Figure 3.6: Aggregate blend gradation.
3.4.2 Optimum Asphalt Content
Superpave mix design was performed to verify the optimum asphalt content for the
selected aggregate gradation provided by the asphalt contractor. The optimum asphalt content
was found for the HMA only as some studies proved that there are no significant differences in
the volumetric properties between HMA and WMA mixtures (Bonaquist, 2011). It is worth
noting that the optimum asphalt content provided by Shelly and Sands, Inc. and Mar-Zane, Inc.
was provided for the PG 70-22M binder only, and it was 5.8 percent. The verification process
involved evaluating the volumetric properties of mixtures prepared at four different asphalt
contents ranging between 5.3 to 6.3 percent. Two samples were prepared for each asphalt binder
content. To prepare each sample, the binder and aggregate were first heated overnight at a
temperature 15°C higher than the mixing temperature. In addition, the asphalt binder was heated
for three hours at the specified mixing temperature for each type of binder. The asphalt binder
and the aggregates were then mixed using the Humboldt mixing machine. The mixture was aged
19
12
.5
9.5
4.7
5
2.3
6
1.1
8
0.6
00
0.3
00
0.1
50
0
.07
5
0
10
20
30
40
50
60
70
80
90
100P
erce
nt
Pa
ssin
g (
%)
Sieve Size, mm
ODOT Spec Limit
Max Density
Aggregate Blend

27
in the oven for two hours at the compaction temperature. The aged mix was then compacted in a
gyratory compactor. The design number of gyration used was 65 according to ODOT
Specification for item 442. Some of the prepared mixture was left loose and was used to
determine the mix maximum specific gravity.
The maximum specific gravity Gmm, mix bulk specific gravity Gmb, VTM, VMA, VFA,
% Gmm @ Ndesign, and % Gmm @ Ninitial were computed for the prepared samples. The data were
then analyzed to select the optimum asphalt binder content that corresponds to an air void of 4
percent. A summary of the mix design results for the 70-22M and 64-22 mixtures is presented in
Table 3.5.
Table 3.5: Superpave mix design parameters for the evaluated mixtures.
Mix property 70-22M Mix 64-22 Mix Specification
% binder 5.9 6.1 >5.7%
Air Void % 4 4 4
VMA 15.2 15.45 15
VFA 70 72 -
%Gmm @Nini 89 88.8 -
%Gmm @Ndesign 95.8 95.7 96
Dust /binder ratio 0.67 0.6-1.6
Unit weight (pcf) 138.4 138.2 -

28

29
Chapter 4 TESTING PROGRAM
4.1 Introduction
Nano and macro-scale experiments were used to study the effect of various WMA
technologies on the moisture susceptibility and healing characteristic of asphalt materials. The
macro-scale experiments included conducting AASHTO T283 and the dynamic shear rheometer
tests. In addition, different AFM based techniques were used to study the behavior of the WMA
and HMA asphalt binders at the micro and nano-scale. The following sections provides a
description of the employed testing experiments and approaches as well as the preparation
procedures developed and used to prepare representative samples for these experiments.
4.2 Sample Preparation for AASHTO T283
The AASHTO T283 was the macro-scale test used in this study to evaluate the moisture
susceptibility of the HMA and WMA mixtures. Cylindrical samples 4 inch (100 mm) in diameter
and about 2.5 inch (63.4 mm) high were used in those tests. The samples were compacted using a
Superpave gyratory compactor at target air void of 7.0 0.5 percent. For preparing the Advera,
Evotherm, and Sasobit WMA samples, the asphalt binder was first heated to the mixing
temperature for three hours. WMA additives where then added slowly to the heated binder while
it was stirred using a laboratory mixer. The loading rates used in this study for the Advera,
Evotherm M1, and the Sasobit were 4.5 percent, 0.5 percent, and 2 percent of the asphalt binder
weight, respectively. This was selected based on the recommendation by the manufacturers of
these WMA additives. To prepare the foamed WMA samples, the Wirtgen WLB10 laboratory
scale foaming device was used to produce the foamed asphalt binder. The amount of water used
to foam the asphalt binder was 1.8 percent of the total weight of the asphalt binder. This quantity
represents the maximum water content permitted by ODOT in the production of foamed WMA
mixtures. To produce foamed WMA mixtures, the foaming device was first calibrated; the
foamed asphalt binder was then discharged from the foaming nozzle into a mixing bowl that
contains the aggregates, which has been preheated to the prescribed mixing temperature. Finally,
the mixing bowl was then transferred to a mechanical mixer for mixing.

30
All WMA mixtures were mixed at a temperature 30°F lower than that of the HMA to
ensure consistent comparison between the different types of WMA mixtures. In accordance with
ODOT test protocol, the HMA and WMA mixtures were aged for four hours in the oven at a
temperature of 275°F (135°C). After aging, the WMA and HMA mixtures were heated for 15
minutes at the required compaction temperature. Table 4.1 presents the mixing and compaction
temperatures used for the WMA and HMA mixtures.
Table 4.1: Production temperatures for WMA mixtures.
Binder type WMA technology Mixing temperature Compaction temperature
(°F) (°C) (°F) (°C)
70-22M Control 325.4 163.0 309.2 154.0
Advera 294.8 146.0 278.6 137.0
Evotherm 294.8 146.0 278.6 137.0
Sasobit 296.6 147.0 280.4 138.0
Foamed 294.8 146.0 278.6 137.0
64-22
Control 309.2 154.0 291.2 144.0
Advera 278.6 137.0 260.6 127.0
Evotherm 278.6 137.0 260.6 127.0
Sasobit 278.6 137.0 260.6 127.0
Foamed 278.6 137.0 260.6 127.0
4.3 AFM Sample Preparation
Prior to mixing the asphalt binder with the aggregate for each HMA and WMA mixture,
samples of the asphalt binder were obtained and used for preparation of the AFM slides. Two
different preparation methods were evaluated. The proceeding section provides a description of
those methods.
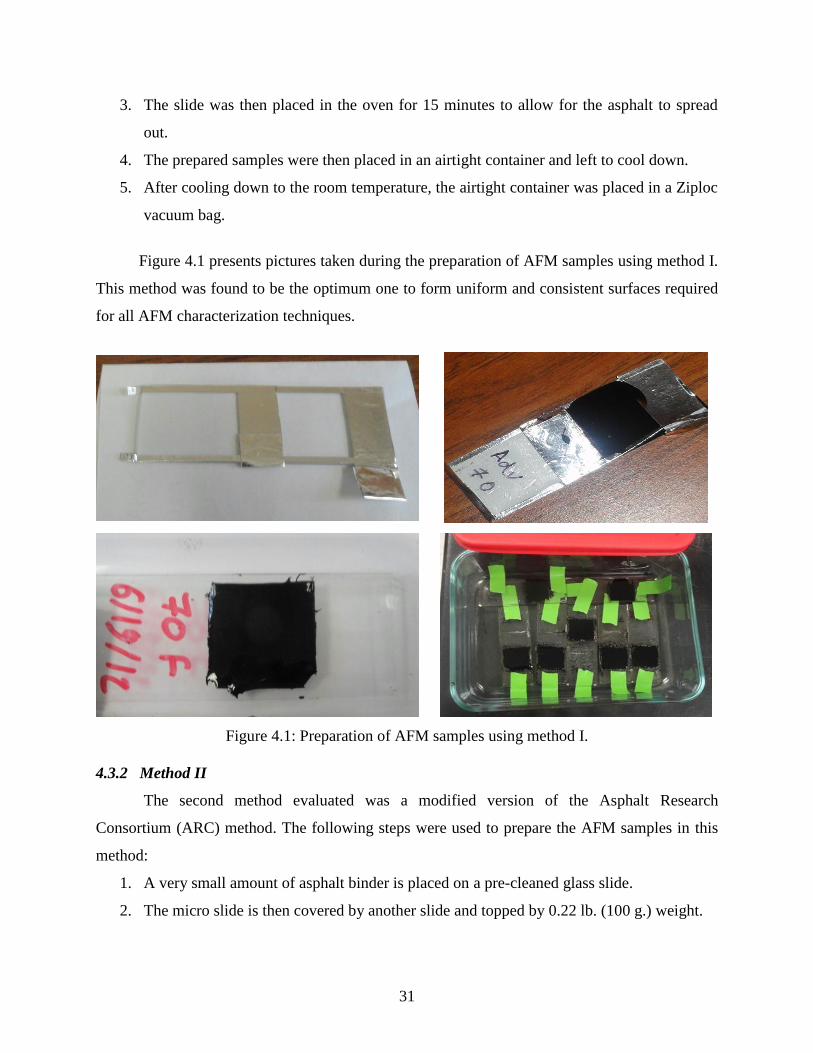
4.3.1 Method I
The first method evaluated was similar to that presented by Tarefder & Zaman in (2010).
The following steps were used to prepare the AFM samples in this method:
1. Two strips of tape were placed in parallel one inch apart on the top surface of a pre-
cleaned glass slide.
2. A syringe was used to place about 0.5 ml of hot asphalt binder that was obtained during
preparation of asphalt mixtures between the two strips of tape.
31
3. The slide was then placed in the oven for 15 minutes to allow for the asphalt to spread
out.
4. The prepared samples were then placed in an airtight container and left to cool down.
5. After cooling down to the room temperature, the airtight container was placed in a Ziploc
vacuum bag.
Figure 4.1 presents pictures taken during the preparation of AFM samples using method I.
This method was found to be the optimum one to form uniform and consistent surfaces required
for all AFM characterization techniques.
Figure 4.1: Preparation of AFM samples using method I.
4.3.2 Method II
The second method evaluated was a modified version of the Asphalt Research
Consortium (ARC) method. The following steps were used to prepare the AFM samples in this
method:
1. A very small amount of asphalt binder is placed on a pre-cleaned glass slide.
2. The micro slide is then covered by another slide and topped by 0.22 lb. (100 g.) weight.

32
3. The whole stack is then placed in the oven at a temperature of 248°F (120°C) for 20
minutes to ensure an equal distribution of the asphalt binder.
4. The two slides are then separated by sliding them.
5. Each of the two slides was finally placed in the oven for 15 minutes to allow for the
asphalt to spread out.
Figure 4.2 illustrates the preparation of AFM samples using method II. This method
creates a thin film of asphalt and is used to get good images for the asphalt surface. However,
the thickness of the asphalt films might not be consistent through the sample, which might
influence the results of the AFM force spectroscopy experiments due to boundary effects.
Figure 4.2: Preparation of AFM samples using method II.
4.4 Macro-Scale Charecterization of Asphalt Mixtures
4.4.1 AASHTO T283 Test
The moisture susceptibility of HMA and WMA samples was evaluated using the
AASHTO T283 test procedure modified according to the standard practices implemented in the
State of Ohio. At least six samples were prepared for each WMA and HMA mixture. The
samples were then divided into two groups. The first group, control samples, was wrapped with
33
Saran-Wrap and stored at room temperature for testing in the dry condition. In addition, the
second group was conditioned. The conditioning procedure involved partially saturating the
samples to a level between 70 to 80 percent in a water bath under a 2.9 psi (20 kPa) vacuum
pressure for approximately two to three minutes. The partially saturated samples were then
wrapped and placed in a plastic bag, and 10 ml of water was added to the bag. The samples were
then subjected to a freezing cycle by placing them for 16 hours in an environmental chamber set
at a temperature of 0°F (–18C). After the freezing cycle, the samples are thawed in a water bath
at 140°F (60°C) for about 24 hours. Finally, the samples were conditioned for 2 hours in a water
bath at a temperature of 77°F (25°C) before testing.
The indirect tensile strength test was conducted on the dry and conditioned wet samples.
In this test, the cylindrical sample is loaded to failure at a deformation rate of 2 inch /min (50.8
mm/min) using a MTS 810 machine. The maximum peak load required to break he sample is
recorded and used to compute the indirect tensile strength using the following equation:
2PITS
DT (4.1)
where,
P = the peak load, lb.
D = specimen diameter, inch
T = specimen thickness, inch
The tensile strength ratio (TSR) was then computed as the ratio between the average
indirect tensile strength of the wet conditioned specimens to average indirect tensile strength of
the dry unconditioned specimens. The TSR ratio is a measure of the resistance of the asphalt
mixture to moisture damage. The higher the TSR ratio is, the better the resistance of the asphalt
mixture to moisture-induced damage.
4.4.2 Dynamic Shear Rheometer (DSR)
Dynamic shear rheometer (DSR) test was conducted on all considered WMA and HMA
binders to evaluate their viscoelastic behavior at the intermediate and high service temperatures.
The binder samples for this test were obtained during the preparation of mixtures for AASHTO

34
T283 test. Temperature and frequency sweeps were conducted using a research grade DSR
device from Rheometric Scientific. The frequency range used was between 0.1 to 100 Hz, while
the temperatures ranged from 40 o
F to 130oF (5
oC to 54.4
oC). The dynamic shear modulus, |G*|,
and phase angle, , were computed at different each loading frequency and testing temperatures.
The rheological properties of the binders were examined by constructing a master curve for
different binders. The master curve provides a relationship between binder stiffness (G*) and the
reduced frequency over a range of temperatures and frequencies. Accordingly, the master curve
makes it possible to estimate the viscoelastic properties over a wide frequency and temperature
ranges, beyond those actually measured in the DSR test.
4.5 Micro & Nano-Scale Characterization
Various AFM based techniques were conducted on the prepared thin films of WMA and
HMA asphalt binders to study their nano/micro-structure and evaluate their moisture
susceptibility and healing characteristics. The following sections provide a detailed description
of the used AFM equipment as well as the experiments conducted in this study.
4.5.1 AFM Equipment
The Agilent 5500LS AFM (Figure 4.3) was used to perform all the AFM experiments in
this study. This device has a large, motorized stage that enables fast, accurate probe positioning
for imaging and mapping large samples at nanometer-scale resolution. This stage is ideal for
imaging large samples in air and fluids providing a versatile tool for characterization of different
material. Samples up to six inch in diameter are easily scanned without rotation or
repositioning. Agilent 5500 LS AFM can be operated with many different contact and non-
contact imaging modes allowing elastic (contact), viscoelastic (FMM), magnetic (MFM),
electrostatic (EFM), lateral-force (LFM) and friction (FFM) forces to be mapped. All aspects of
this AFM including alignment, imaging, and calibration are controlled by PicoView software
package. This software can be also used for post processing of the obtained AFM images and
data. In this study PicoView software version 1.8.2 was used. Figure 4.4 presents a screenshot of
this software.

35
Agilent 5500LS AFM AFM Scanner
Figure 4.3: AFM testing setup.
4.5.2 AFM Imaging Technique
AFM imaging was performed on the prepared HMA and WMA samples using tapping
mode to characterize their nano/micro-structure. The AFM tapping mode imaging technique is a
versatile and powerful tool for scanning the surfaces of soft materials because it was developed
to minimize sample deformation and avoid the surface and/or tip damage found in contact mode
AFM. In this technique, the AFM cantilever/tip system is oscillated at its resonant frequency and
Dual screens AFM controllers
Temperature
controller
Dynamic Vibration Isolation

36
the piezo-driver is adjusted using feedback control to maintain a constant tip-to-sample distance
(setpoint) (Bhushan and Qi, 2003). The amplitude of the resultant oscillations changes as the tip
scans over the features on the surface. Thus, topographical characteristics of the sample can be
obtained. However, in addition to the amplitude changes, the cantilever will also exhibit a phase
lag in comparison with the piezo signal that drives the cantilever/tip assembly. This phase-shift is
analogous to that obtained during rheological measurements where tan(ϕ)= loss modulus/storage
modulus (Ferry, 1999).
One generally accepted theory is that phase contrast arises from differences in the energy
dissipation between the tip and the sample (Cleveland et al., 1998; Tamayo and Garcia, 1998).
According to this theory, the relation between the phase angle (ϕ) and the energy dissipated by
the tip–sample interactions (Edis) per period can be described using Equation 4.2.
t dis
0 0 0 t
A ( ) QEsin
A kA A ( )
(4.2)
where
k: is the cantilever spring constant,
ω0: is the natural resonance frequency,
Q: is the quality factor driven at a frequency ω,
A0: is the free amplitude, and
At: is the tapping amplitude defined as the setpoint times the free amplitude.
Equation 4.3 only provides the dependence of phase angle on the total energy dissipation
of the tip–sample interaction. However, energy dissipation occurs as a result of viscoelastic
properties and interfacial adhesion (Garcia et al., 1999). Bhushan and Qi (2003) showed that
when using high free amplitude or setpoint values the viscoelastic properties are the main source
of the phase angle contrast. On the contrary, the effect of adhesion on phase angle contrast
becomes more pronounced at low free amplitudes or setpoints. In this study, a relatively high
set-point of 88% and free amplitude of 240 nm were selected to detect the discrepancies in the
viscoelastic properties within the asphalt binder and map out domains with different viscoelastic
properties.

37
Figure 4.4: Screenshot of PicoView software.
4.5.3 Force Spectroscopy Experiments
Force spectroscopy experiments were conducted at a temperature of 77F (25C) on the
prepared asphalt samples to measure the cohesive forces within an asphalt system. These
experiments involved measuring the contact forces between the AFM tip and the sample as the
tip approaches, probes, and withdraws from sample surface. The penetration depth was selected
deep enough to minimize the surface effect, but was less than 10% of the film thickness so that
measurements are not be affected by the glass substrate below the asphalt film. The same
indentation depth and speed (350 nm/s) was used for all the experiments.
In this study, the force spectroscopy experiments were conducted with silicon nitride tips
to examine adhesive forces between the asphalt and gravel aggregate. Furthermore, the
interaction between asphalt molecules (i.e. cohesive forces) was examined by using tips that are
chemically functionalized by two of the main chemical groups found in asphalt binders, namely

38
Hydroxyl (-OH) and carboxyl (-COOH) group. The tip functionalization was performed at
Novascan Technologies in Ames, Iowa. The cantilevers used in this study had the same
properties: 125μm long with a drive frequency ranging between 120 kHz and 160 kHz and spring
constant of 4 N/m.
Force spectroscopy experiments were conducted on unconditioned and moisture-
conditioned samples. Samples were conditioned by placing them in a bath of tap water at a
temperature of 77F (25C) for 24 hours. The samples were then removed and were left to dry
out for 24 hours in a dry chamber. Nitrogen gas was then used to ensure complete dryness of the
surface. Unconditioned samples were also kept inside a dry chamber at the same temperature to
maintain equal testing conditions.
4.5.4 AFM Experiments for Healing
An AFM-based approach that was developed in a previous work by the principle
investigator (Nazzal et al. 2012) was employed in this study to examine the healing
characteristics of HMA and WMA binder. The healing phenomena in asphalt materials can be
described as a combination of two mechanisms: the wetting and intrinsic healing. The employed
approach evaluates the wetting mechanism of the healing process, by probing (indenting) the
asphalt sample using the AFM tip at a fixed location and indentation depth, to create a nano-
crack in the sample. AFM images are then continually taken to record the asphalt crack recovery
with time. The AFM imaging is done using tapping (intermittent-contact) mode. The
topographical images are post-processed and analyzed to measure the closure of the initiated
crack with time, which can be used to evaluate the wetting rate for the tested asphalt materials.
The employed approach also evaluates the intrinsic healing, which is the mechanism in which
the strength is gained by the wetted crack interface. This is done by determining the energy
required to overcome the cohesion bonds within the asphalt material, referred to as the cohesive
bonding energy, by utilizing the results of the force spectroscopy experiments performed using
tips functionalized with –OH and –COOH.

39
Chapter 5 TEST RESULTS AND DATA ANALYSIS
5.1 Introduction
This chapter presents the results of the macro-scale tests and the different AFM
experiments that were conducted on the WMA and HMA materials to evaluate their micro-
structure, moisture susceptibility, and healing characteristics. A comparison between the results
obtained in macro-scale tests and AFM experiments is also provided. The chapter is divided into
several sections. The layout of each section includes first the presentation and discussion of the
test results. This is followed by summarizing the outcome of the statistical analyses that were
conducted on the experimental data.
5.2 AASHTO T283 Test Results
AASHTO T283 was the macro-scale test employed in this study to evaluate the moisture
susceptibility of WMA and HMA mixtures. The test was conducted on dry and wet conditioned
samples, and the indirect tensile strength was determined for those samples. The tensile strength
ratio (TSR) was also computed by dividing the average ITS value of the wet conditioned samples
by that of the dry samples. The proceeding section provides the results for WMA and HMA
mixtures considered in this study.
5.2.1 Results of 70-22M Mixtures
Figure 5.1 presents the average and standard deviation of the ITS values for the dry
WMA and HMA mixtures prepared using the PG 70-22M binder. It is noted that all WMA
mixtures except the foamed WMA mixture had lower ITS value. The Sasobit had the least value
among all other WMA mixtures. Previous researchers attributed the lower ITS values in WMA
mixtures to the reduction in mixing and compaction temperature, which may result in less aging
of those mixtures as compared to the HMA. In addition, the influence of WMA technologies on
the asphalt binder properties have been used to explain the decrease in the ITS value. This
influence was evaluated in this study using the AFM experiments as discussed in the proceeding
sections.

40
Figure 5.1: ITS of dry HMA and WMA 70-22M samples.
Figure 5.2: ITS of conditioned HMA and WMA 70-22M samples.
0
20
40
60
80
100
120
140
160
180
200
70-22M 70-Advera 70-Evotherm 70-Sasobit 70-Foamed
ITS
(p
si)
0
20
40
60
80
100
120
140
160
180
200
70-22M 70-Advera 70-Evotherm 70-Sasobit 70-Foamed
ITS
(p
si)
Dry
Wet
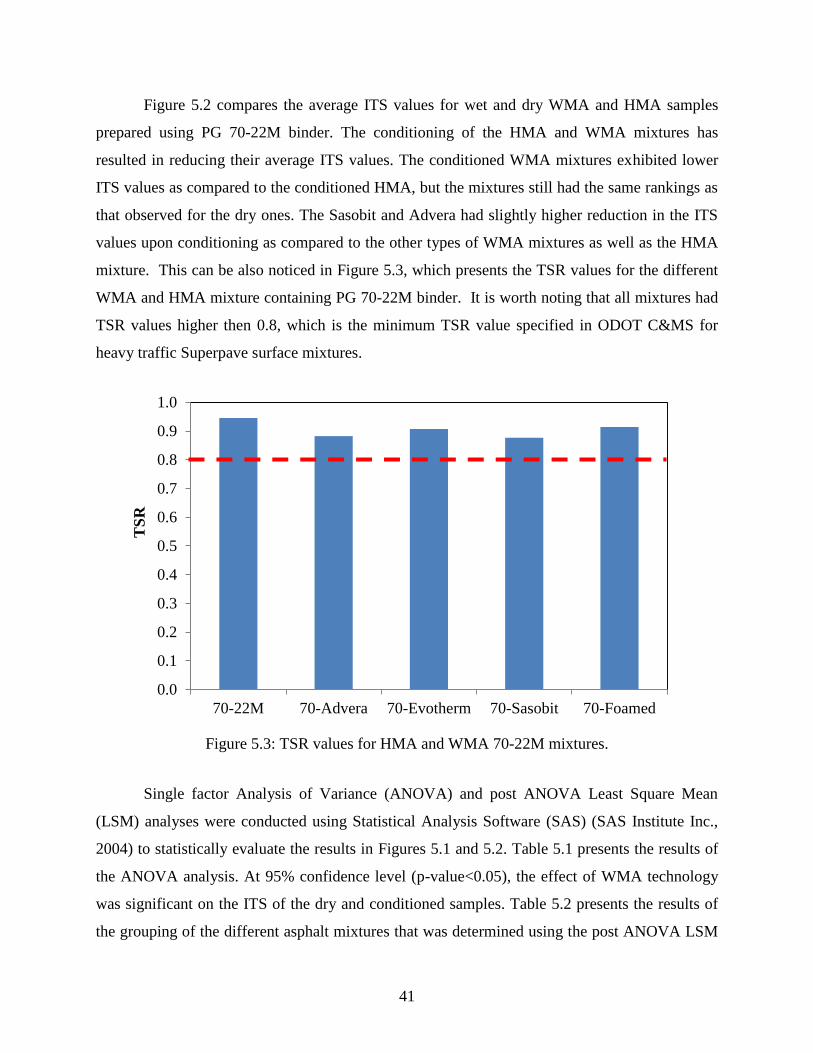
41
Figure 5.2 compares the average ITS values for wet and dry WMA and HMA samples
prepared using PG 70-22M binder. The conditioning of the HMA and WMA mixtures has
resulted in reducing their average ITS values. The conditioned WMA mixtures exhibited lower
ITS values as compared to the conditioned HMA, but the mixtures still had the same rankings as
that observed for the dry ones. The Sasobit and Advera had slightly higher reduction in the ITS
values upon conditioning as compared to the other types of WMA mixtures as well as the HMA
mixture. This can be also noticed in Figure 5.3, which presents the TSR values for the different
WMA and HMA mixture containing PG 70-22M binder. It is worth noting that all mixtures had
TSR values higher then 0.8, which is the minimum TSR value specified in ODOT C&MS for
heavy traffic Superpave surface mixtures.
Figure 5.3: TSR values for HMA and WMA 70-22M mixtures.
Single factor Analysis of Variance (ANOVA) and post ANOVA Least Square Mean
(LSM) analyses were conducted using Statistical Analysis Software (SAS) (SAS Institute Inc.,
2004) to statistically evaluate the results in Figures 5.1 and 5.2. Table 5.1 presents the results of
the ANOVA analysis. At 95% confidence level (p-value<0.05), the effect of WMA technology
was significant on the ITS of the dry and conditioned samples. Table 5.2 presents the results of
the grouping of the different asphalt mixtures that was determined using the post ANOVA LSM
0.0
0.1
0.2
0.3
0.4
0.5
0.6
0.7
0.8
0.9
1.0
70-22M 70-Advera 70-Evotherm 70-Sasobit 70-Foamed
TS
R

42
analysis. In this table, the groups are listed in descending order with the letter “A” assigned to
the highest mean followed by the other letters in appropriate order. In addition, groups with same
letter next to them are not significantly different. It is noted that the for dry mixtures, 70-Sasobit
mixture had statistically lower ITS values than the control HMA mix, while others were
statistically indistinguishable from it. In addition, for the conditioned mixtures, the ITS values of
all WMA mixes were statistically similar except for the foamed one that had higher value, which
was statistically similar to that of the control HMA mix.
Table 5.1: Results of ANOVA analysis on ITS of 70-22M mixtures.
Effect F Value p-value
WMA Technology - Dry Samples 17.26 <.0001
WMA Technology - Conditioned Samples 13.78 <.0001
Table 5.2: Results of Post ANOVA LSM analyses on ITS of 70-22M mixtures.
Grouping Of Dry 70-22M Mixtures
WMA Technology ITS (psi) Letter Group
70-Foamed 177.29 A
70-22M (Control) 166.60 AB
70-Advera 154.67 BC
70-Evotherm 145.76 C
70-Sasobit 138.96 D
Grouping Of Conditioned 70-22M Mixtures
Mixture Type ITS (psi) Letter Group
70-Foamed 167.61 A
70-22M (Control) 157.68 A
70-Advera 136.51 B
70-Evotherm 132.31 B
70-Sasobit 121.86 B

43
5.2.2 Results of 64-22 Mixtures
Figure 5.4 presents the average ITS values for the dry WMA and HMA mixtures
containing the PG 64-22 binder, respectively. The ITS values of those mixtures shows the same
trend and rankings observed for the mixtures containing PG 70-22M binder, such that the
foamed WMA mixture had the highest average ITS value that was similar to that of the HMA,
while the Sasobit WMA had the lowest value. Figure 5.5 shows the average ITS values for
conditioned and dry WMA and HMA samples prepared using PG 64-22 binder. The average ITS
values of conditioned HMA and WMA samples were lower than those of the dry ones. In
addition, the conditioned WMA mixtures showed lower ITS values as compared to the
conditioned control HMA. The Advera and Sasobit had much more pronounced reduction in the
ITS values upon conditioning as compared to the other WMA and HMA. Figure 5.6, shows the
TSR values for different WMA and HMA mixtures. It is noted that the TSR values of the WMA
and HMA mixtures prepared with the PG 64-22 binder are lower than those prepared with the
PG 70-22M binder. Furthermore, the Advera had the lowest TSR value among all WMA and
HMA mixtures, while the Evotherm had highest value. This high TSR value of the Evotherm
might be attributed to the anti-strip liquid that this type of WMA technology contains.
Figure 5.4: ITS of dry HMA and WMA 64-22 samples.
0
20
40
60
80
100
120
140
160
64-22 64-Advera 64-Evotherm 64-Sasobit 64-Foamed
ITS
(p
si)

44
Figure 5.5: ITS of conditioned HMA and WMA 64-22 samples.
Figure 5.6: TSR values for HMA and WMA 64-22 mixtures.
0
20
40
60
80
100
120
140
160
64-22 64-Advera 64-Evotherm 64-Sasobit 64-Foamed
ITS
(p
si)
Dry Wet
0.0
0.1
0.2
0.3
0.4
0.5
0.6
0.7
0.8
0.9
1.0
64-22 64-Advera 64-Evotherm 64-Sasobit 64-Foamed
TS
R

45
A single factor ANOVA analyses were conducted to statistically evaluate the effects of
the mixture type on the ITS values of dry and conditioned samples. Table 5.3 presents the results
of the ANOVA analyses. The effect of WMA technology on the ITS values of dry and
conditioned samples was significant at 95% confidence level (p-value<0.05). However, the
WMA technology had more pronounced effect on the conditioned samples, as indicated by the
F-value. This suggests that the use of some WMA technologies may significantly affect the
moisture sensitivity of asphalt mixtures. Table 5.4 provides the ranking of the different asphalt
mixtures that was determined using the post ANOVA LSM analyses. It is noted that the for dry
unconditioned mixtures, only the 64-Sasobit mixture had statistically lower ITS value than the
control HMA mix, while the other WMA mixtures had statistically similar ITS values. On the
other hand, for conditioned mixtures, the ITS values of the Advera and Sasobit WMA mixture
exhibited statistically lower ITS values than that of the HMA control mixture. The Evotherm and
foamed WMA had statistically indistinguishable ITS values from that of the control HMA mix.
Table 5.3: Results of ANOVA analysis on the ITS of 64-22 mixtures.
Effect F-value p-value
WMA Technology - Dry Samples 5.44 0.0137
WMA Technology - Conditioned Samples 16.31 0.0002
5.2.3 Influence of Different Factors on ITS
Multi-factor ANOVA analysis was conducted on AASHTO T283 test results for all
mixtures prepared with the different binders to examine effect of binder type, WMA technology,
conditioning and their interactions on the ITS value. A linear Completely Random Design (CRD)
model presented Equation 5.1 was used in this analysis. The dependent variable used in the
analysis was the ITS.
1i 2j 3k 1 2ij 1 3ik 2 3jk 1 2 3ijk ijklITS = µ + + + + + + + + 5.1
where
µ: is the overall mean
:1i is the effect of binder type

46
:2 j is the effect of WMA technology
3k : is the effect of conditioning
: is effect of the interaction between the binder type and WMA technology
ik31 :is effect of the interaction between the binder type and conditioning
:32 ik is effect of the interaction between the WMA technology and conditioning
:321 ijk is effect of the interaction between the binder type, WMA technology and conditioning
єijkl
: is the random sampling variation.
Table 5.4: Results of Post ANOVA analyses on the ITS of 64-22 mixtures.
Grouping Of Dry 64-22 Mixtures
WMA Technology ITS (psi) Letter Group
64-Foamed 142.71 A
64-22 136.31 AB
64-Advera 122.46 ABC
64-Evotherm 117.97 BC
64-Sasobit 112.12 C
Grouping Of Conditioned 64-22 Mixtures
WMA Technology ITS (psi) Letter Group
64-Foamed 126.24 A
64-22 111.26 AB
64-Evotherm 100.51 BC
64-Sasobit 88.56 C
64-Advera 85.82 C
Table 5.5 presents the results of the multi-factor ANOVA analysis. It is noted that, at a
95% confidence level, the binder type, WMA technology and conditioning had significant effect
on the ITS value. The binder type was the most significant factor affecting the ITS values, as
indicated by the F-value. The binder type and conditioning interaction ( ) effect was
significant at 95% confidence level. This suggests that the influence of moisture conditioning
ij21
ij21

47
varies between the two types of binders, which is expected as the use of polymer modified binder
improves the moisture susceptibility of the asphalt mixture. Furthermore, the results in Table 5.5
indicates that the WMA technology -binder type interaction had significant effect at a confidence
level of 91% only. This may suggest that the effect of WMA technology depends to a certain
extent on the type of binder used.
Table 5.5: Results of multi-factor ANOVA analyses on ITS values.
Effect F Value p-value
Binder type 332.42 <.0001
WMA technology 45.43 <.0001
Binder* WMA technology 2.15 0.0895
Conditioning 95.01 <.0001
Binder*Conditioning 8.25 0.0061
WMA technology*Conditioning 1.77 0.1500
Binder*WMA technology*Conditioning 0.46 0.7671
5.3 Results of DSR
The shear modulus (G*) values obtained from the DSR test results were used to construct
the master curves of all considered polymer modified and neat asphalt binders. The master curve
provides the relationship of the G* as a function of the reduced frequency (r). In this study, the
Christensen-Anderson model (Equation 5.2) was used to develop the master curve at a reference
temperature of 77F (25C), which is the temperature at which all other tests were conducted.
2log2log
1)(*
R
R
r
cgGG
(5.2)
where,
G*(): is the complex shear modulus
Gg : is the glass modulus assumed equal to 1GPa
r : is the reduced frequency at the defining temperature, rad/sec

48
c : is the cross over frequency at the defining temperature, rad/sec
: is the frequency, rad/sec
R : is the rheological index
Figure 5.7 presents the master curves obtained for the control and WMA 70-22M binders.
It is noted that the foamed WMA binder had lower G* values as compared to the control PG 70-
22M binder. On the other hand, the Sasobit had higher G* values, particularly at lower reduced
frequency values and hence at high temperature and low frequency values. Finally, the Advera
and Evotherm did not show any significant effect on the stiffness of the PG 70-22M binder.
Figure 5.8 shows the master curves for the different PG 64-22 binders. It is clear that the
Sasobit have stiffened the PG 64-22 asphalt binder and resulted in higher G* modulus values.
Furthermore, the Evotherm had resulted in a slight increase in the G*. However, the Advera
resulted in a decrease in the G* of the PG 64-22 binder. Finally, the foaming of the PG 64-22
binder did not have a significant effect on its G* values and hence its stiffness.
Figure 5.7: Master curve for 70-22M binders.
1.E+00
1.E+01
1.E+02
1.E+03
1.E+04
1.E+05
1.E+06
1.E+07
1.E+08
1.E-06 1.E-04 1.E-02 1.E+00 1.E+02 1.E+04 1.E+06
G* (
Pa)
Reduced Frequency (rad/sec)
70-22M
70-Advera
70-Evotherm
70-Sasobit
70-Foamed

49
Figure 5.8: Master curve for 64-22 binders.
5.4 Results of AFM Imaging
5.4.1 Micro & Nano-Structure Characterization of 70-22M Binders
The images obtained using the tapping AFM mode was used to examine the effects of the
WMA additives on the nano/micro-structure of the PG 70-22M asphalt binder. Figures 5.9
through 5.13 present the topographical and phase images of control 70-22M, Advera, Evotherm,
Sasobit, and foamed asphalt binders, respectively. It is noted that those images are representative
of many similar scans that were consistently observed across the prepared samples. Asphalt
binder is a mixture of hydrocarbons but contain a variety of functional groups such as
heteroatoms of carbon and hydrogen, and metals like vanadium and nickel. The phase images
show that the investigated asphalt materials are not perfectly homogeneous and that not all the
hydrocarbons are mutually soluble at room temperature. In these images there is a flat
background in which another phase characterized by a darker color is dispersed. Included in this
darker phase is an elongated structure identified by succession of pale and dark lines, which is
often called ‘bee-like’ structure. Previous researchers have attributed the appearance of the ‘bee-
like’ structure to the asphaltene content (Loeber et al., 1998). Asphaltene is the high-molecular
1.E+00
1.E+01
1.E+02
1.E+03
1.E+04
1.E+05
1.E+06
1.E+07
1.E+08
1.E-06 1.E-04 1.E-02 1.E+00 1.E+02 1.E+04 1.E+06
G* (
Pa)
Reduced Frequency (rad/sec)
64-22
64-Advera
64-Evotherm
64-Sasobit
64-Foamed

50
weight component of an asphalt binder that is insoluble in aliphatic solvents, but soluble in
aromatic solvents (e.g. in toluene or benzene) and have the highly polar molecular structure
(Petersen, 1984).
Figure 5.9: AFM images of control 70-22M binder: (a) Topographical images (b) Phase images.
Figure 5.10: AFM images of 70-Advera binder: (a) Topographical images (b) Phase images.
1.8µm 1.8µm
1.8µm 1.8µm
‘Bee-like‘
Structure
Dispersed
domain
Flat matrix

51
Figure 5.11: AFM images of 70-Evotherrm binder: (a) Topographical images (b) Phase images.
Figure 5.12: AFM images of 70-Sasobit binder: (a) Topographical images (b) Phase images.
1.8µm 1.8µm
1.8µm 1.8µm
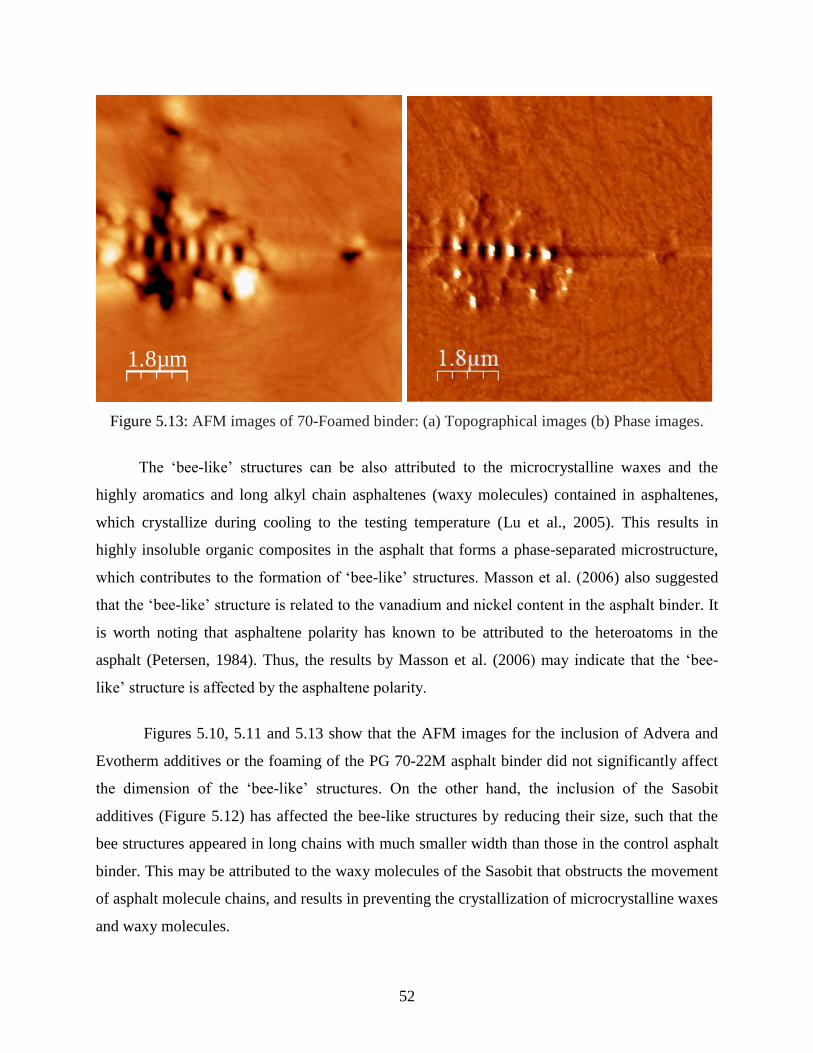
52
Figure 5.13: AFM images of 70-Foamed binder: (a) Topographical images (b) Phase images.
The ‘bee-like’ structures can be also attributed to the microcrystalline waxes and the
highly aromatics and long alkyl chain asphaltenes (waxy molecules) contained in asphaltenes,
which crystallize during cooling to the testing temperature (Lu et al., 2005). This results in
highly insoluble organic composites in the asphalt that forms a phase-separated microstructure,
which contributes to the formation of ‘bee-like’ structures. Masson et al. (2006) also suggested
that the ‘bee-like’ structure is related to the vanadium and nickel content in the asphalt binder. It
is worth noting that asphaltene polarity has known to be attributed to the heteroatoms in the
asphalt (Petersen, 1984). Thus, the results by Masson et al. (2006) may indicate that the ‘bee-
like’ structure is affected by the asphaltene polarity.
Figures 5.10, 5.11 and 5.13 show that the AFM images for the inclusion of Advera and
Evotherm additives or the foaming of the PG 70-22M asphalt binder did not significantly affect
the dimension of the ‘bee-like’ structures. On the other hand, the inclusion of the Sasobit
additives (Figure 5.12) has affected the bee-like structures by reducing their size, such that the
bee structures appeared in long chains with much smaller width than those in the control asphalt
binder. This may be attributed to the waxy molecules of the Sasobit that obstructs the movement
of asphalt molecule chains, and results in preventing the crystallization of microcrystalline waxes
and waxy molecules.
1.8µm

53
By comparing phase images obtained for the control asphalt binder (Figure 5.9) with
those WMA modified asphalt binder (Figures 5.10-5.13), it is noted that the phase contrast
between the dispersed domains and the flat asphalt matrix is inverted upon the inclusion of the
Advera additive. This result may indicate that the Advera resulted in reducing the stiffness of the
dispersed domain, such that the relative difference between the stiffness of those domains and
the flat asphalt matrix is reversed. Furthermore, the Evotherm did not have a significant
influence on the phase contrast observed in the control binder. Finally, the phase contrast
between the dispersed domains and the flat matrix is increased with the inclusion of the Sasobit.
According to the phase contrast changes between the dispersed domains and the matrix, the
dispersed domains will be stiffer after adding the Sasobit material. The stiffer domains may
result in enhancing of the stiffness properties of the Sasobit modified asphalt as compared to the
control asphalt binder. This is consistent with the DSR test results that were conducted on the
different binders and showed that the 70-Sasobit binder had the highest G* values and hence
stiffness. Finally, Figure 5.13 is showing that the phase contrast difference between the
dispersed domain and flat matrix observed in the control 70-22M binder was reduced due to the
foaming; indicating that relative stiffness of the dispersed domain was reduced. It is worth
noting that the 70-foamed binder had lower G* values as compared to the other 70-22M binders,
which may be explained by the changes in the micro-structure noticed in the AFM images.
5.4.2 Micro & Nano-Structure Characterization of 64-22 Binders
Figures 5.14 through 5.18 present the topographical and phase images for the control and
WMA 64-22 binders. These figures are also indicating that these binders are not perfectly
homogeneous such that not all the hydrocarbons are mutually soluble at testing temperature.
Similar to the 70-22M binder, the 64-22 binder is characterized by a flat asphalt matrix with
dispersed domains that contain the so called ‘bee-like’ structures. However, phase difference
between the flat asphalt matrix and the dispersed domains is reduced when compared to the 70-
22M binder. This is expected as the 70-22M binder is a stiffer, as indicated by the DSR test
results. In general, all the WMA technologies except the Sasobit did not affect the dimensions of
the ‘bee-like’ structures. Similar to the 70-22M binder, the Sasobit reduced the width of these
structures in the 64-22 binder, which may be explained by its waxy molecules that restrains the
movements of the asphalt molecules.

54
Figure 5.14: AFM images of control 64-22 asphalt binder: (a) Topographical images (b) Phase
images.
Figure 5.15: AFM images of 64-Advera binder: (a) Topographical images (b) Phase images.
1.8µm 1.8µm
1.8µm

55
Figure 5.16: AFM images of 64-Evotherrm binder: (a) Topographical images (b) Phase images.
Figure 5.17: AFM images of 64-Sasobit binder: (a) Topographical images (b) Phase images.
1.8µm
1.8µm

56
Figure 5.18: AFM images of 64-Foamed binder: (a) Topographical images (b) Phase images.
The phase images in Figure 5.15 are showing that the phase contrast between flat asphalt
matrix and dispersed domain inverted due the inclusion of the Advera, which is similar to that
observed in the PG 70-22M binder. Figure 5.16 indicates that the phase image was not
significantly affected by the Evotherm. On the other hand, Figure 5.17, is clearly showing an
increase in the phase contrast due to the Sasobit inclusion, which may suggest an increase in the
binder stiffness. This is in agreement with the results obtained in the DSR test. Finally, the phase
image in Figure 5.18 shows that the phase contrast between the flat matrix and the dispersed
domains remained unchanged due to the foaming of the PG 64-22 asphalt binder.
5.4.3 AFM Samples Surface Roughness
The surface roughness of each of the scanned samples was evaluated by conducting
roughness analysis using WSxM version 5.0 software (Horcas et al.,2007) on the obtained
topographical images. In this analysis, the absolute mean of the difference between the average
height and the height of each single point of the sample is computed and used to measure the
average roughness. The average of values obtained from the analysis conducted on all samples
for each of the control and WMA 70-22M binders is presented in Figure 5.19. It is noted that all
values were less than 10 nm. In addition, it is clear that the Advera, Evotherm, and foamed
WMA samples had lower average roughness value in comparison with those of the control 70-
22M asphalt binder. On the contrary, the Sasobit samples had much higher the roughness.
1.8µm 1.8µm

57
Figure 5.20 presents the average roughness value for the control and WMA 64-22 samples. The
control and WMA 64-22 samples had lower average roughness values as compared to its
corresponding 70-22M samples. This indicates that the 64-22 samples had smoother surface. The
surface roughness results are clearly indicating that the method used in preparing the AFM
samples yields smooth asphalt films with consistent thickness. This is essential for the AFM
force spectroscopy and healing experiments.
5.5 Results of Force Spectroscopy Experiments
Force distance curve is the main result obtained from force spectroscopy experiments.
This curve presents a plot of the forces acting on the sample as a function of piezo-driver
displacement. The forces are calculated based on the cantilever deflection using Hook’s law:
F=-kc d (5.3)
where
F: is the acting force on the sample
d: is the deflection
kc : is the cantilever spring constant
Figure 5.19: Average roughness of AFM images for 70-22M binders.
0
1
2
3
4
5
6
7
8
9
70-22M 70-Advera 70-Evotherm 70-Sasobit 70-Foamed
Aver
age
Ro
ugh
nes
s (n
m)

58
Figure 5.20: Average roughness of AFM images for 64-22 binders.
Figure 5.21 presents typical force distance curves for the investigated 70-22M asphalt
materials. This curve can be divided into two regions the approaching region where the tip is
brought close to the sample until a contact between the tip and sample occurs and the retracting
region where the tip starts to pull away from the sample. In the former region, the tip starts to
approach the sample surface by moving towards the sample. Initially, the tip will be far away
from the sample and no deflection will happen until it is brought close enough to the surface
where it start to deflect due to the repulsive force. The repulsive force increases until reaching to
a specified depth of indentation. In the retracting region, initially the repulsive force, hence the
deflection is reduced. However, as the retraction continues, the tip sticks to the sample surface
due to the attractive forces for a certain time till it finally snaps off the surface and springs back
to its original position. The maximum force needed to pull the tip away from the sample is called
the pull-off force, which is also the adhesive force between the tip and the tested sample.
Force spectroscopy experiments were conducted on at least 20 points for each asphalt
sample. The obtained force distance curves were post-processed to allow appropriate
normalization of the raw data, and to obtain the maximum pull-off forces in each force
0
0.05
0.1
0.15
0.2
0.25
0.3
64-22 64-Advera 64-evotherm 64-Sasobit 64-Foamed
Aver
age
Rou
gh
nes
s (n
m)

59
spectroscopy experiment. The following sections present the results of the force spectroscopy
experiments conducted in this study.
Figure 5.21: Typical force-distance curves obtained from force spectroscopy experiments.
5.5.1 Results of Unconditioned 70-22M samples
Figure 5.22 compares the average adhesive force values of the WMA binders with that of
the control asphalt binder, which were obtained in experiments, conducted using silicon nitride
tips. It is noted that the inclusion of the WMA additives enhanced the adhesive forces. This
improvement will induce effects on the corresponding work of adhesion for the asphalt aggregate
system. The Evotherm and foamed WMA resulted in the highest improvement; while the sasobit
WMA had the least improvement.
The -OH and –COOH functionalized tips were used to evaluate the cohesive forces of the
different binders. Figures 5.23 and 5.24 compare the maximum pull-off force for the WMA
binders with that of the control one when using –OH and –COOH functionalized tips,
respectively. It is noted that different trends were obtained for these tips. For the –OH tip, the
Evotherm and Advera WMA additives had resulted in an increase in the interaction forces
-300.0
-200.0
-100.0
0.0
100.0
200.0
300.0
400.0
0 200 400 600 800 1000 1200
Forc
e (n
N)
Distance (nm)
70-22M
70-Advera
70-Sasobit
70-Evotherm
70-Foamed

60
Figure 5.22:Adhesive force for unconditioned dry 70-22M samples.
Figure 5.23: Cohesive forces for unconditioned dry 70-22M samples using –OH tip.
0
50
100
150
200
250
70-22M 70-Advera 70-Evotherm 70-Sasobit 70-Foamed
Ad
hes
ive
Forc
e (n
N)
0
50
100
150
200
250
300
350
400
450
70-22M 70-Advera 70-Evotherm 70-Sasobit 70-Foamed
Coh
esiv
e F
orc
e (n
N)

61
Figure 5.24: Cohesion forces for unconditioned dry 70-22M samples using –COOH tip.
between asphalt binder and -OH tip. The Sasobit and foamed WMA resulted in a decrease in
those forces; however, that decrease was much more pronounced in the 70-Sasobit binder. On
the other hand, while the inclusion of the Evotherm resulted in a slight decrease in the interaction
forces with the –COOH group, the Advera and foamed WMA had similar values as the control
70-22M binder. Furthermore, as with –OH group, the tests with the –COOH functionalized tips
showed a significant reduction in the cohesive forces within the asphalt binder due to the
addition of the Sasobit. This reduction is attributed to the increase in the hydrophobicity of the
asphalt binder caused by the Sasobit (Sasol Wax Co., 2008), which reduced the interaction forces
between the hydrophilic –OH and –COOH chemical groups and the asphalt binder.
In an effort to provide additional insight for the force spectroscopy experiments on dry
samples, ANOVA and post ANOVA LSM analyses were conducted using SAS software to
statistically evaluate the results in Figures 5.22 through 5.24. Table 5.6 presents the results of
this analysis. At 95% confidence level (p-value < 0.05), the effect of binder type was significant.
This suggests that the WMA additives had significant effect on the binder adhesive and cohesive
forces. Table 5.7 presents the results of the grouping of the asphalt binders that was determined
using the post ANOVA LSM analyses conducted on the results of force spectroscopy
0
50
100
150
200
250
300
350
70-22M 70-Advera 70-Evotherm 70-Sasobit 70-Foamed
Coh
esiv
e F
orc
e (n
N)

62
experiments using the different types of tips. It is noted that all WMA binders had significantly
higher adhesive forces. The foamed WMA had the highest value among all other asphalt
binders. This may have contributed to the high ITS value of the dry foamed 70-22M mixture
obtained in the AASHTO T283 test. While the Evotherm and Advera WMA had significantly
higher interaction forces with –OH tip, the inclusion of Sasobit additive significantly reduced
those forces. The foamed WMA had statistically similar cohesive force values to that of the
control 70-22M binder. Finally, the results of the post ANOVA-LSM analyses showed that the
interaction between the asphalt binder and –COOH chemical group is not significantly affected
by the Advera, Evotherm, or foamed WMA. However, the inclusion of the Sasobit had an
adverse effect on this interaction.
5.5.2 Results of Conditioned 70-22M samples
Force spectroscopy experiments using different functionalized tips were also conducted
on the conditioned samples of control and WMA asphalt binders. Figure 5.25 compares the
average maximum pull-off force and standard error obtained in those experiments. The average
adhesive force for conditioned samples of the control polymer modified asphalt binder was
higher than that of the unconditioned dry samples. Tarefder and Zaman (2010) reported similar
results. They suggested that the action of water has induced polarization by a repulsion of
negatively charged electron clouds in nonpolar polymer modified asphalt molecules creating
temporary dipoles in those asphalt samples, which has resulted in a larger Van der Waals
attraction force in the asphalt binder system, and hence higher forces for the conditioned control
and WMA samples. The results in Figure 5.25 also indicate that the conditioned samples
Evotherm and Advera had average adhesive force values similar to that of the control. On the
other hand, the Sasobit had a lower value. Figures 5.26 and 5.27 present the average cohesive
forces for 70-22M asphalt binders that are obtained from force spectroscopy experiments
conducted using –OH and –COOH functionalized tips, respectively. The cohesive forces of the
control conditioned samples had higher values than the dry unconditioned ones. The Advera and
Sasobit WMA exhibited lower cohesive forces than the control asphalt binder. However, the
Evotherm had a slightly higher interaction forces with –OH group, but lower value with –COOH
group.

63
Table 5.6: ANOVA results for adhesive & cohesive forces of unconditioned 70-22M samples.
Effect F-value p-value
WMA Technology -Silicon Nitride Tip 46.20 <.0001
WMA Technology - -OH Tip 22.49 <.0001
WMA Technology - -COOH Tip 62.90 <.0001
Table 5.7: Post ANOVA results for adhesive & cohesive forces of unconditioned 70-22M
samples.
Grouping of Binders for Silicon Nitride Tip
WMA Technology Force Estimate (nN) Letter Group
70-Foamed 200.36 A
70-Evotherm 173.71 B
70-Advera 149.66 C
70-Sasobit 126.29 D
70-22M (control) 91.65 E
Grouping of Binders for -OH Tip
WMA Technology Force Estimate (nN) Letter Group
70-Evotherm 352.93 A
70-Advera 320.63 B
70-22M (control) 268.90 C
70-Foamed 260.28 C
70-Sasobit 123.53 D
Grouping of Binders for -COOH Tip
WMA Technology Force Estimate (nN) Letter Group
70-Foamed 261.26 A
70-22M (control) 254.99 A
70-Advera 253.89 A
70-Evotherm 247.00 A
70-Sasobit 160.94 B

64
Figure 5.25: Adhesive force for conditioned 70-22M binders.
Figure 5.26: Cohesive force for conditioned 70-22M binders using –OH tips.
0
50
100
150
200
250
300
350
70-22M 70-Advera 70-Evotherm 70-Sasobit 70-Foamed
Ad
hes
ive
Forc
e (n
N)
Unconditioned
Conditioned
0
50
100
150
200
250
300
350
400
450
70-22M 70-Advera 70-Evotherm 70-Sasobit 70-Foamed
Coh
esiv
e F
orc
e (n
N)
Unconditioned
Conditioned

65
Figure 5.27: Cohesive force for conditioned 70-22M binders using –COOH tips.
Single factor ANOVA and post ANOVA-LSM analyses were conducted to statistically
examine the results presented in Figures 5.25 through 5.27. Table 5.8 presents the results of these
ANOVA analyses. At 95% confidence level (p-value < 0.05), the WMA technology had a
significant effect on the conditioned samples adhesive and cohesive forces. Table 5.9 presents
the results of the grouping of the conditioned asphalt binders. While the conditioned Advera,
Evotherm, and foamed WMA had statistically indistinguishable adhesive force values from that
of the conditioned control 70-22M binder, the Sasobit had significantly lower value. In addition,
the conditioned Evotherm and foamed WMA had statistically similar –COOH and –OH
interaction forces to that of the conditioned control 70-22M binder. On the contrary, the
conditioned Advera and Sasobit had statistically lower cohesive force values than the
conditioned control binder. Thus, the results are suggesting that the Evotherm WMA will have
the best resistance to moisture induced damage among all WMA technologies evaluated in this
study, which is similar to that of the control binder. This may be attributed to the anti-strip
additive that Evotherm contains. This result is consistent with that of the macro-scale test (i.e.
AASHTO T283) that was performed in this study.
0
50
100
150
200
250
300
350
400
450
70-22M 70-Advera 70-Evotherm 70-Sasobit 70-Foamed
Coh
esiv
e F
orc
e (n
N)
Unconditioned
Conditioned

66
Table 5.8: ANOVA results for adhesive & cohesive forces of conditioned 70-22M samples.
Effect F-value p-value
WMA Technology -Silicon Nitride Tip 27.55 <.0001
WMA Technology - -OH Tip 231.14 <.0001
WMA Technology - -COOH Tip 62.90 <.0001
Table 5.9: Post ANOVA results for adhesive & cohesive forces of conditioned 70-22M samples.
Grouping of Binders for Silicon Nitride Tips
WMA Technology Force Estimate (nN) Letter Group
70-Foamed 271.58 A
70-Evotherm 267.19 A
70-Advera 254.20 A
70-22M (control) 249.84 A
70-Sasobit 194.57 B
Grouping of Binders for -OH Tip
WMA Technology Force Estimate (nN) Letter Group
70-Evotherm 371.74 A
70-22M (control) 348.12 AB
70-Foamed 336.00 B
70-Advera 301.01 C
70-Sasobit 151.69 D
Grouping of Binders for -COOH Tip
WMA Technology Force Estimate (nN) Letter Group
70-22M (control) 375.50 A
70-Evotherm 338.96 AB
70-Foamed 314.68 B
70-Advera 240.17 C
70-Sasobit 201.07 D

67
5.5.3 Results of Unconditioned 64-22 Samples
Figure 5.28 presents the average values and standard deviation values of the adhesive
force of the WMA and control 64-22 binders. As with the 70-22M binders, the different WMA
technologies enhanced the adhesive force of the asphalt binder. The foamed WMA technology
resulted in the greatest improvement; while the Sasobit WMA had the least improvement.
Figures 5.29 and 5.30 show the average value of the cohesive forces for the different binders that
were measured using –OH, –COOH tips, respectively. While the Evotherm and foamed WMA
had higher cohesive forces than the 64-22 binder, the Sasobit had lower average value. For the –
COOH tip, all WMA technologies reduced the interaction forces. However, the Advera and
Sasobit had the largest reduction in these forces. As previously stated, the reduction in the
Sasobit is attributed to its tendency to increase the hydrophobicity of the asphalt binder. It is
worth noting that the reduction of the cohesive forces due to the inclusion of the Sasobit is less
pronounced in the 64-22 binder as compared to 70-22M binder.
ANOVA and post ANOVA LSM analyses were conducted to statistically evaluate the
results of force spectroscopy test conducted on the unconditioned control and WMA 64-22
samples. Table 5.11 presents the results of the ANOVA analysis. It is noted that at 95%
confidence level (p-value < 0.05) the effect of the WMA technologies was significant. This
suggests that the WMA technologies had significant influence on the adhesive and cohesive
forces of the 64-22 binder. Table 5.11 provides the grouping of the asphalt binders that was
determined using the post ANOVA LSM analyses. It is noted that only the Advera and foamed
WMA had significantly higher adhesive forces than the control 64-22 binder. While the Advera
and Sasobit had significantly lower interaction forces with –OH tip, the foamed WMA had
statistically similar value. On the contrary, the Evotherm resulted in significant increase in the
interaction force with –OH. Finally, only the Evotherm and foamed WMA had statistically
similar –COOH interaction forces as that of the control 64-22 binder, while the other WMA
technologies resulted in significant decrease in these forces.
5.5.4 Results of Conditioned 64-22 Samples
Figures 5.31 through 5.33 present the results of the force spectroscopy experiments
conducted using the silicon nitride tip and the -COOH and –OH functionalized tips, respectively,

68
Figure 5.28: Adhesive force for unconditioned dry 64-22 samples.
Figure 5.29: Cohesive forces for unconditioned dry 64-22 samples using –OH tip.
0
50
100
150
200
250
300
350
64-22 64-Advera 64-Evotherm 64-Sasobit 64-Foamed
Ad
hes
ive
Forc
e (n
N)
0
50
100
150
200
250
300
350
400
450
64-22 64-Advera 64-Evotherm 64-Sasobit 64-Foamed
Coh
esiv
e F
orc
e (n
N)

69
Figure 5.30: Cohesive forces for unconditioned dry 64-22 samples using –COOH tip.
on the conditioned control and WMA 64-22 samples. It is clear that the adhesive forces were
significantly decreased due to conditioning. This behavior was different than that observed for
the polymer modified 70-22M binder, which indicates that the neat 64-22 binder is more
susceptible to moisture damage. This is consistent with the AASHTO T283 test results, where
the WMA and HMA 70-22M mixtures showed higher TSR values as compared to their
corresponding 64-22 mixtures. Figure 5.31 is also showing that while the control and Evotherm
64-22 binders exhibited the least reduction in the adhesive forces, the Advera binder had the
highest decrease after conditioning. It is worth noting that the Advera 64-22 mixture had the
lowest TSR values among all other WMA and HMA mixtures.
The results in Figure 5.32 indicate that there was a reduction in the interaction forces with
–OH upon conditioning, but it was less pronounced than that observed for the adhesive forces.
Furthermore, the Sasobit had the largest decrease. Finally, all conditioned HMA and WMA 64-
22 samples except the Evotherm had lower interaction cohesive forces with –COOH chemical
group as compared to the unconditioned dry ones, Figure 5.33. The Advera and Sasobit showed
the highest reduction and least interaction force values.
0
100
200
300
400
500
600
64-22 64-Advera 64-Evotherm 64-Sasobit 64-Foamed
Coh
esiv
e F
orc
e (n
N)

70
Table 5.10: ANOVA results for adhesive & cohesive forces of unconditioned 64-22
samples.
Effect F-value p-value
WMA Technology -Silicon Nitride Tip 39.70 <.0001
WMA Technology - -OH Tip 231.14 <.0001
WMA Technology - -COOH Tip 62.90 <.0001
Table 5.11: Post ANOVA results for adhesive & cohesive forces of unconditioned 64-22
samples.
Grouping of Binders for Silicon Nitride Tips
WMA Technology Force Estimate (nN) Letter Group
64-Foamed 254.76 A
64-Advera 216.77 B
64-Evotherm 207.56 BC
64-Sasobit 191.84 CD
64-22 (control) 183.24 D
Grouping of Binders for -OH Tip
WMA Technology Force Estimate (nN) Letter Group
64-Evotherm 384.60 A
64-Foamed 276.28 B
64-22 (control) 258.22 BC
64-Advera 254.79 C
64-Sasobit 188.63 D
Grouping of Binders for -COOH Tip
WMA Technology Force Estimate (nN) Letter Group
64-22 (control) 503.60 A
64-Foamed 479.17 AB
64-Evotherm 473.56 AB
64-Advera 430.36 BC
64-Sasobit 398.79 C
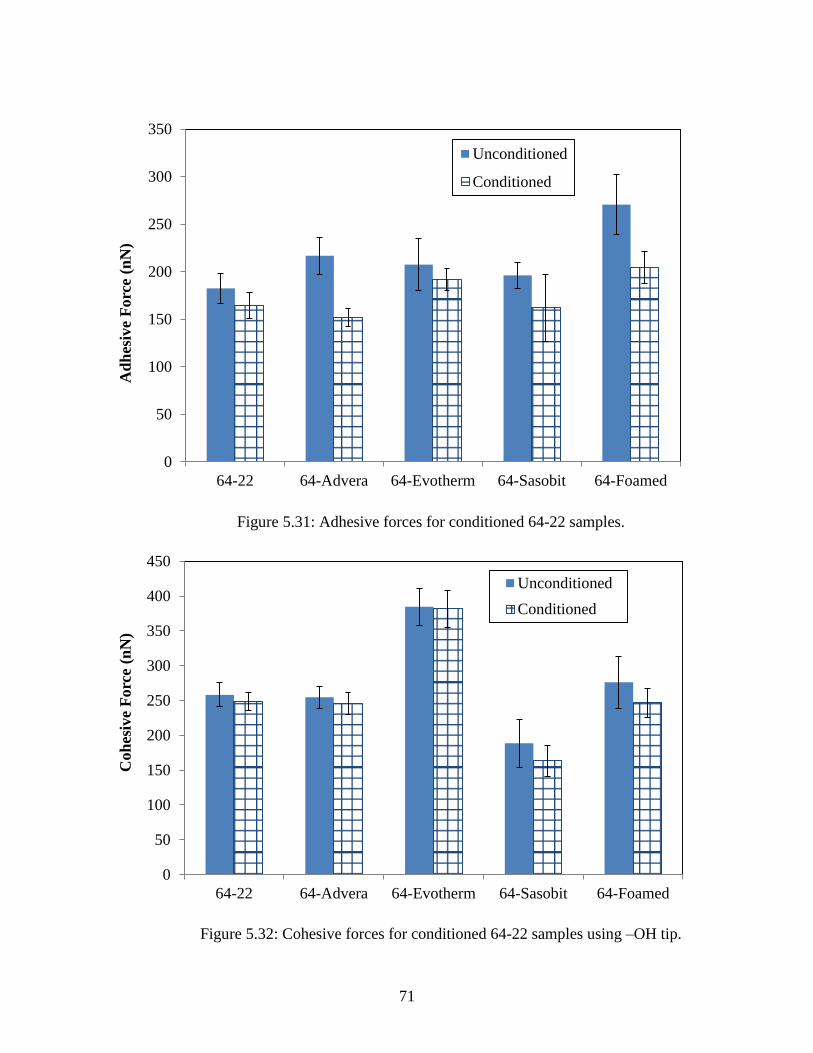
71
Figure 5.31: Adhesive forces for conditioned 64-22 samples.
Figure 5.32: Cohesive forces for conditioned 64-22 samples using –OH tip.
0
50
100
150
200
250
300
350
64-22 64-Advera 64-Evotherm 64-Sasobit 64-Foamed
Ad
hes
ive
Forc
e (n
N)
Unconditioned
Conditioned
0
50
100
150
200
250
300
350
400
450
64-22 64-Advera 64-Evotherm 64-Sasobit 64-Foamed
Coh
esiv
e F
orc
e (n
N)
Unconditioned
Conditioned

72
Figure 5.33: Cohesive forces for conditioned 64-22 samples using –COOH tip.
Single factor ANOVA and post ANOVA LSM analyses were conducted on the data
obtained from force spectroscopy experiments performed on the conditioned WMA and HMA
64-22 samples. Table 5.12 presents the results of the ANOVA analysis. The WMA technologies
have a significant effect on the conditioned samples adhesive and cohesive forces at 95%
confidence level (p-value < 0.05). The F-value for adhesive forces of the conditioned samples
was higher than that of the unconditioned samples (Table 5.10), which suggests that the WMA
technologies effect was more pronounced upon conditioning. However, similar to the
unconditioned samples, the greatest effect of WMA technologies was on the –OH interaction
cohesive forces, as indicated by the F-values.
Table 5.13 presents the results of the grouping of the conditioned 64-22 asphalt samples.
The conditioned foamed WMA and Evotherm had significantly higher adhesive forces than the
conditioned 64-22; however, the conditioned Sasobit and Advera had statistically similar values
to it. The results in Table 5.13 are indicating that based on the tests done using –OH tip, only the
conditioned Evotherm and Sasobit had statistically higher and lower cohesive forces than the
conditioned 64-22 samples, respectively. Finally, the conditioned Evotherm and foamed binders
had statistically similar interaction forces with the –COOH group to that of the conditioned
0
100
200
300
400
500
600
64-22 64-Advera 64-Evotherm 64-Sasobit 64-Foamed
Coh
esiv
e F
orc
e (n
N)
Unconditioned
Conditioned

73
control PG 64-22 binder. Furthermore, the conditioned Advera and Sasobit had similar cohesive
force values, which were statistically lower than that of the conditioned PG 64-22 binder.
Table 5.12: ANOVA results for adhesive & cohesive forces of conditioned 64-22 samples.
Effect F Value p-value
WMA Technology -Silicon Nitride Tip 54.17 <.0001
WMA Technology - –OH Tip 231.14 <.0001
WMA Technology - –COOH Tip 62.90 <.0001
Table 5.13: Post ANOVA results for adhesive & cohesive forces of conditioned 64-22
samples.
Grouping of Binders for Silicon Nitride Tips
WMA Technology Force Estimate (nN) Letter Group
64-Foamed 204.21 A
64-Evotherm 191.86 A
64-22 (control) 164.31 B
64-Sasobit 162.07 B
64-Advera 151.94 B
Grouping of Binders for –OH Tip
WMA Technology Force Estimate (nN) Letter Group
64-Evotherm 362.93 A
64-22 (control) 248.73 B
64-Foamed 246.79 B
64-Advera 245.87 B
64-Sasobit 163.62 C
Grouping of Binders for –COOH Tip
WMA Technology Force Estimate (nN) Letter Group
64-Evotherm 476.36 A
64-22 (control) 468.44 AB
64-Foamed 440.25 B
64-Advera 363.07 C
64-Sasobit 354.62 C

74
The results of the AFM force spectroscopy tests on 64-22 binders are indicating that the
Evotherm and foamed WMA have the best resistance to moisture induced damage among all
WMA technologies evaluated in this study and they did not show any adverse effects on
cohesive or adhesive bonds upon moisture conditioning. This result is consistent with AASHTO
T283 results, which indicated that the Evotherm and foamed WMA mixtures had TSR values
similar to that of the control PG 64-22 mixture. In addition, the Advera and Sasobit had greater
reduction in the adhesive and cohesive forces and exhibited the lowest values upon conditioning.
This is may explain the lower TSR values that their mixtures possessed. It is worth noting that
although the Advera and foamed WMA technologies results in foaming of the asphalt binder,
they have different effects on its adhesive and cohesive properties upon conditioning. This may
be attributed to the fact that the Advera is a hydrophilic material (attracts water) and may results
in an increase in the hydrophilicity of the asphalt binder.
5.5.5 Influence of Different Factors on Adhesive And Cohesive Forces
Multi-factor ANOVA analyses were also performed on all force spectroscopy test results
for the 64-22 and 70-22M binders to examine the effect of binder type, WMA technology,
conditioning and their interactions on the adhesive as well as the –OH and –COOH cohesive
forces. A linear CRD model similar to that presented Equation 5.1 was used in this analysis;
however, the dependent variables used in the analysis were adhesive and the –OH and –COOH
cohesive forces. Table 5.14 presents the results of the multi-factor ANOVA analysis that was
performed on adhesive forces measured in the force spectroscopy tests using silicon nitride tips.
It is noted that the effects of binder type, WMA technology and conditioning and their
interactions were significant at a 95% confidence level. The conditioning effect and its
interaction with the binder type were the most significant factors affecting the adhesive force
values, as indicated by the F-value. The significance of the interaction between the binder type,
WMA technology, and conditioning interaction suggests that the effect of WMA depends on the
binder type and conditioning.
Tables 5.15 and 5.16 present the summary of the results of the multi-factor ANOVA
analyses that was conducted on the –OH and –COOH cohesive forces, respectively. At a
confidence level of 95%, all three factors and their interactions have affected significantly both
types of cohesive forces. However, as indicated by the F-factor values, the factors significance

75
on the cohesive forces varied. While WMA technologies had the most significant effect on –OH
cohesive forces, the binder type was the most influential factor for the –COOH cohesive force.
This suggests that factors affecting the different cohesive forces within asphalt are not the same.
Therefore, the evaluation of any modification performed on an asphalt binder requires examining
the interaction forces with the different asphalt chemical groups.
Table 5.14: Multi-Factor ANOVA results for adhesive forces.
Effect F-value p-value
Binder type 5.88 0.0158
WMA Technology 74.49 <.0001
Binder type * WMA Technology 8.36 <.0001
Conditioning 154.64 <.0001
Binder type * Conditioning 675.92 <.0001
WMA Technology * Conditioning 15.46 <.0001
Binder type * WMA Technology * Conditioning 11.74 <.0001
Table 5.15: Multi-Factor ANOVA results for –OH cohesive forces.
Effect F-value p-value
Binder type 41.34 <.0001
WMA Technology 348.28 <.0001
Binder type * WMA Technology 32.25 <.0001
Conditioning 11.34 0.0008
Binder type * Conditioning 75.66 <.0001
WMA Technology * Conditioning 9.11 <.0001
Binder type * WMA Technology * Conditioning 12.05 <.0001
5.6 Comparison Between The Results Of Nano And Macro-Scale Tests
The results of the different AFM force spectroscopy test were compared to those obtained
from the AASHTO T283 macro-scale test. Figures 5.34 a,b present the relationship between the
adhesive forces and ITS values for the unconditioned and conditioned WMA 70-22M samples,
respectively. It is worth noting that only the results of WMA mixtures were used since they were

76
all prepared at the same temperature, which was lower than the HMA. As indicated by the R2
value, a relatively good correlation exists between the adhesive forces and the ITS values
particularly for the dry unconditioned samples. The relationship between the cohesive forces
measured in AFM experiments and ITS samples for unconditioned and conditioned samples was
also evaluated, as shown in Figure 5.35 and Figure 5.36. In general, poor correlations exist
between cohesive forces and ITS values especially those related to the –COOH chemical group.
Table 5.16: Multi-Factor ANOVA results for –COOH cohesive forces.
Effect F Value p-value
Binder type 1510.28 <.0001
WMA Technology 122.33 <.0001
Binder type * WMA Technology 15.96 <.0001
Conditioning 16.61 <.0001
Binder type * Conditioning 157.77 <.0001
WMA Technology * Conditioning 14.02 <.0001
Binder type * WMA Technology * Conditioning 4.34 0.0019
Figure 5.37a,b compare the adhesive forces and the ITS values for the unconditioned and
conditioned WMA 64-22 samples. The adhesive forces have an excellent correlation with the
ITS values. On the contrary, as shown in Figure 5.38 and Figure 5.39 poor correlations exist
between the cohesive forces and the ITS. This result is similar to that obtained with 70-22M
samples, which suggests that ITS values are more affected by the adhesive forces than the
cohesive forces. This is consistent by previous experimental and numerical studies on indirect
tensile strength test, which suggested that sample’s cracking in the indirect tensile strength test
has more tendency to occur at the interface between the aggregate and the binder (i.e., adhesive
failure) due to the high stress concentration (Abbas et al., 2008; Lytton et al., 2004).
5.7 Results of Healing Experiments
The results of AFM experiments were analyzed to evaluate the two mechanisms of
healing in the different binders considered in this study: wetting and intrinsic healing. The
proceeding sections present the results of the conducted analyses.

77
Figure 5.34: Relationship between Adhesive forces ITS for 70-22M materials: a) unconditioned
samples; b) conditioned samples.
Figure 5.35: Relationship between –OH Cohesive forces ITS for 70-22M materials:
a) unconditioned samples; b) conditioned samples.
Figure 5.36: Relationship between –COOH Cohesive forces ITS for 70-22M materials:
a) unconditioned samples; b) conditioned samples.
R² = 0.6922
0
30
60
90
120
150
180
210
100 130 160 190 220
ITS
(p
si)
Adhesive Force (nN)
a. R² = 0.5053
0
30
60
90
120
150
180
100 140 180 220 260 300
ITS
(p
si)
Adhesive Force (nN)
b.
R² = 0.4774
0
30
60
90
120
150
180
210
100 130 160 190 220 250 280
ITS
(p
si)
-OH Cohesive Force (nN)
a.
R² = 0.3127
0
30
60
90
120
150
180
100 150 200 250 300 350 400
ITS
(p
si)
-OH Cohesive Force (nN)
b.
R² = 0.0663
0
50
100
150
200
100 150 200 250 300 350 400
ITS
(p
si)
-COOH Cohesive Force (nN)
a.
R² = 0.3301
0
30
60
90
120
150
180
100 150 200 250 300 350 400
ITS
(p
si)
-COOH Cohesive Force (nN)
b.

78
Figure 5.37: Relationship between Adhesive forces ITS for 64-22 materials: a) unconditioned
samples; b) conditioned samples.
Figure 5.38: Relationship between –OH Cohesive forces ITS for 64-22 materials:
a) unconditioned samples; b) conditioned samples.
Figure 5.39: Relationship between –COOH Cohesive forces ITS for 64-22 materials:
a) unconditioned samples; b) conditioned samples.
R² = 0.9998
0
30
60
90
120
150
100 130 160 190 220 250 280
ITS
(p
si)
Adhesive Force (nN)
a.
R² = 0.9393
0
30
60
90
120
150
100 120 140 160 180 200 220
ITS
(p
si)
Adhesive Force (nN)
b.
R² = 0.0167
0
30
60
90
120
150
100 150 200 250 300 350 400
ITS
(p
si)
-OH Cohesive Force (nN)
a.
R² = 0.1242
0
30
60
90
120
150
100 150 200 250 300 350 400
ITS
(p
si)
-OH Cohesive Force (nN)
b.
R² = 0.47
0
30
60
90
120
150
100 180 260 340 420 500
ITS
(p
si)
-COOH Cohesive Force (nN)
a.
R² = 0.587
0
30
60
90
120
150
100 170 240 310 380 450 520
ITS
(p
si)
-COOH Cohesive Force (nN)
b.

79
5.7.1 Evaluation of Wetting Mechanism
To evaluate the wetting mechanism, a crack was initiated in the asphalt binder and the
closure of the crack with time was monitored by continuously taking AFM images. Figure 5.40
presents the topographical images that were taken before and after the 70-22M asphalt sample
was probed. As it can be noted, a relatively flat spot was identified and indented; this resulted in
a nano-crack as shown in Figure 5.40b, which mitigated with time, Figure 5.40c,d. To evaluate
the closure rate (wetting), the images were post-processed and analyzed to determine how the
crack volume changed with time for the different tested points for each sample.
5.7.1.1 Wetting of 70-22M Binders
Figure 5.41 present a typical plot of the crack volume as a function of time for the
control and WMA 70-22M samples. It is noted that the volume decreases with time nonlinearly
for all asphalt binders evaluated. However, the rate of decrease for each binder is different. To
examine that, a power function was fitted through the obtained data as shown in Figure 5.41.
Figure 5.42 presents the power coefficients of the fitted functions for the control and WMA 70-
22M binders. It is noted that all the Evotherm, Advera, and foamed WMA technologies had
resulted in increasing the magnitude of the power function coefficient and hence in improving
the rate of micro-crack closure. On the contrary, Sasobit caused a decrease in the power function
coefficient value. By comparing the results in Figure 5.42 with those in Figure 5.22 through
Figure 5.24 it can be noticed that the power function coefficient trend was very similar to that for
the –OH cohesive interaction forces, such that the Evotherm and Sasobit had the highest and
lowest values in both figures. This suggests that the interaction in –OH chemical is related to the
micro-crack closure rate and to the wetting mechanisms in asphalt binders. Figure 5.43 evaluate
the relationship between these two parameters for all 70-22M binders. It is noted that a fair
correlation exists. This result is consistent with the model proposed by Bhasin et al. (2008).
5.7.1.2 Wetting of 64-22 Binders
Figure 5.44 shows an example of the change of the crack volume with time for the
control and WMA 64-22 samples. The results in Figure 5.44 were analyzed to determine the
coefficient of power function that can fit each of the rate of crack volume change with time
curves. Figure 5.45 presents the coefficients of the fitted power function for the HMA and WMA

80
64-22 samples. It is noted that all 64-22 binders had higher power function coefficient values and
better closure rate than the 70-22M. However, as with 70-22M binders, only the Sasobit had
reduced the power function coefficient and decreased the rate of micro-crack closure, while the
other WMA technologies had improved it. Figure 5.46 shows the relationship between the
obtained power function coefficients and –OH cohesive forces for control and WMA 64-22
binders. It is noted a good correlation exists between those two parameters.
Figure 5.40: AFM topographical images: a) Directly before probing b) 163 sec after probing
c) 350 sec after probing d) 800 sec after probing.
a. b.
c. d.

81
Figure 5.41: Crack Volume Decrease with time for 70-22M samples.
Figure 5.42: Crack closure rate for 70-22M samples.
0.E+00
1.E+06
2.E+06
3.E+06
4.E+06
5.E+06
6.E+06
7.E+06
8.E+06
9.E+06
0 100 200 300 400 500 600
Volu
me
(nm
3)
Time (sec)
70-22M
70-Advera
70-Evotherm
70-Sasobit
70-Foamed
-1.4
-1.2
-1
-0.8
-0.6
-0.4
-0.2
0
70-22M 70-Advera 70-Evotherm 70-Sasobit 70-Foamed
Pow
er C
oef
fici
ent

82
Figure 5.43: Crack closure rate vs. –OH Cohesive Force for 70-22M samples.
Figure 5.44: Crack Volume Decrease with time for 64-22 samples.
R² = 0.58
0.0
0.2
0.4
0.6
0.8
1.0
1.2
1.4
0 100 200 300 400
Pow
er C
oef
fcie
nt
-OH Cohesive Force (nN)
0.E+00
1.E+06
2.E+06
3.E+06
4.E+06
5.E+06
6.E+06
0 50 100 150 200 250
Volu
me
(nm
3)
Time (sec)
64-22
64 Advera
64-Evotherm
64-Saso
64-Foamed

83
Figure 5.45: Crack closure rate for 64-22 samples.
Figure 5.46: Crack closure rate vs. –OH Cohesive Force for 64-22 samples.
5.8.2 Intrinsic Healing
The strength gained by the wetted crack interface, referred to as the intrinsic healing, is
another important mechanism in the healing phenomena in asphalt binders. This depends on the
-1.6
-1.4
-1.2
-1.0
-0.8
-0.6
-0.4
-0.2
0.0
64-22 64-Advera 64-Evotherm 64-Sasobit 64-Foamed
Po
wer
Co
effc
ien
t
R² = 0.695
0.0
0.2
0.4
0.6
0.8
1.0
1.2
1.4
1.6
0 100 200 300 400 500
Pow
er C
oef
fcie
nt
-OH Cohesive Force (nN)

84
cohesive bonds within the asphalt binder. In this cohesive bonding energy of the asphalt binder
was used to evaluate intrinsic healing of asphalt binders, which is the energy required to
overcome cohesion bonds within a material. To obtain this parameter, the shaded area under the
retraction curve of the force spectroscopy experiment performed using tips functionalized with –
OH and –COOH was computed as shown in Figure 5.47.
Figures 5.48 and 5.49 compare the average bonding energy values of the different WMA
and HMA 70-22M binders obtained from experiments conducted using –OH and –COOH
functionalized tips, respectively. It is noted that for the –OH chemical group, only the Sasobit
resulted in a significant decrease in the cohesive bonding energy with 70-22M binder. The
Sasobit also had the least bonding energy when –COOH functionalized tips were used. However,
the other WMA technologies resulted in a reduction in the bonding energy, but this reduction
was much less pronounced. Thus, the results suggests that the Sasobit might have an adverse
effect on the intrinsic healing of the 70-22M binder, while the other WMA technologies improve
or won’t influence this property.
Figure 5.47: Determining Cohesive Bonding Energy.
Forc
e (n
N)
Distance (nm)
Ebonding

85
Figure 5.48: Cohesive Bonding Energy using –OH tips for 70-22M samples.
Figure 5.49: Cohesive Bonding Energy using –COOH tips for 70-22M samples.
0
15000
30000
45000
60000
75000
90000
105000
70-22M 70-Advera 70-Evotherm 70-Sasobit 70-Foamed
Bon
din
g E
ner
gy (
nN
.nm
)
0
20000
40000
60000
80000
100000
120000
70-22M 70-Advera 70-Evotherm 70-Sasobit 70-Foamed
Bon
din
g E
ner
gy (
nN
.nm
)

86
Figures 5.50 and 5.51 present the bonding energy values for the control and WMA 64-22
samples that were obtained from force spectroscopy experiments performed using –OH and –
COOH functionalized tips, respectively. All WMA technologies except the Sasobit improved the
–OH cohesive bonding energy of the 64-22 binder. This improvement was much more
pronounced in the case of the Evotherm. The results in Figure 5.51 are indicating that all WMA
technologies had similar –COOH cohesive bonding energy to that of the control 64-22. These
results suggest that the Evotherm have an improvement in the intrinsic healing of the 64-22
binder, while the addition of the Sasobit additive might adversely influence this property.
Advera and foamed WMA technologies does not have a significant effect on the intrinsic healing
of the 64-22M binder.
Figure 5.50: Cohesive Bonding Energy using –OH tips for 64-22 samples.
0
20000
40000
60000
80000
100000
120000
64-22 64-Advera 64-Evotherm 64-Sasobit 64-Foamed
Bon
din
g E
ner
gy (
nN
.nm
)
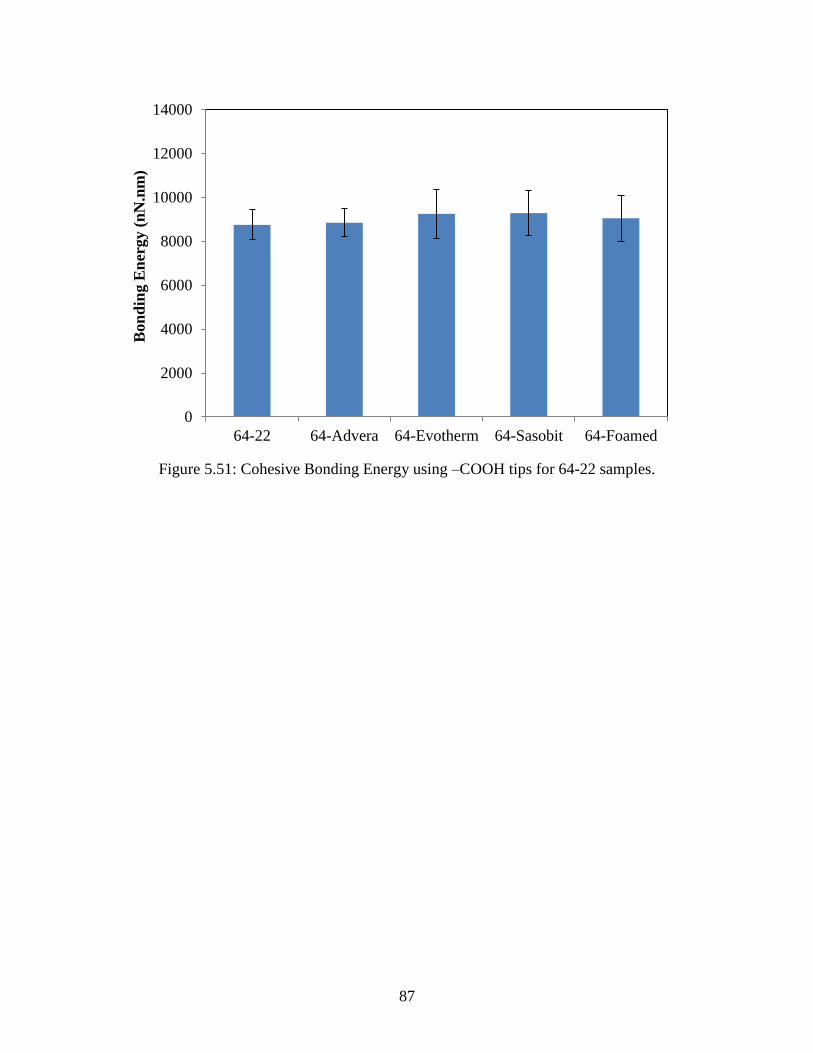
87
Figure 5.51: Cohesive Bonding Energy using –COOH tips for 64-22 samples.
0
2000
4000
6000
8000
10000
12000
14000
64-22 64-Advera 64-Evotherm 64-Sasobit 64-Foamed
Bon
din
g E
ner
gy (
nN
.nm
)

88
Chapter 6 CONCLUSIONS AND RECOMMENDATIONS
6.1 Summary and Conclusions
In this study, macro and nano-scale tests were conducted to evaluate the influence of
different WMA technologies on the moisture susceptibility and healing characteristics of two
types of asphalt binders commonly used in Ohio. Four types of WMA technologies were
considered, including: Advera, Evotherm, Sasobit, and foamed WMA. The macro-scale
experiments included conducting AASHTO T283 and dynamic shear rheometer tests. In
addition, different AFM based experiments were performed, including: AFM imaging, force
spectroscopy, and healing experiments. The following sections provide the main conclusions that
were made based on the results of the experimental tests and the findings of subsequent
statistical analyses.
6.1.1 AASHTO T283 Test
The addition of the Sasobit to the PG 70-22M and PG 64-22 binders had resulted in
significant reduction in the ITS values of the unconditioned mixtures.
In general, the Advera mixtures had the lowest TSR value among all WMA and HMA
mixtures, while the Evotherm had the highest value.
The Sasobit and Advera WMA 70-22M mixtures had slightly higher reduction in the ITS
values upon conditioning and lower TSR as compared to the other WMA and HMA 70-
22M mixtures. However, all mixtures had TSR higher than the minimum value of 0.8
specified in ODOT C&MS for heavy traffic surface mixtures.
The Advera and Sasobit 64-22 mixtures had much more pronounced reduction in the ITS
values upon conditioning as compared to the other WMA and HMA 64-22 mixtures.
Such that for conditioned 64-22 mixtures, the Advera and Sasobit WMA mixture
exhibited statistically lower ITS values than that of the HMA control mixture. The
Evotherm and foamed WMA had statistically similar values to that of the control HMA.
89
6.1.2 DSR Test
Sasobit stiffened the PG 64-22 and PG 70-22M asphalt binders and resulted in higher G*
modulus values.
The Evotherm resulted in a slight increase in the G* values of the PG 70-22M, but had no
significant effect on the G* values PG 64-22 binder.
The foaming of PG 70-22M binder resulted in a slight decrease in the G* values but did
not have any effect on these values for PG 64-22.
The Advera did not influence the G* values of the PG 70-22M, but decreased the
stiffness of PG 64-22 binder.
6.1.3 AFM Experiments
6.1.3.1 General Comments
The AFM was found to be a viable device to examine the moisture damage mechanisms
by conducting force spectroscopy experiments using chemically functionalized tips that
resembles the aggregates particles and asphalt molecules and measuring the adhesive and
cohesive forces using the procedure described in this report.
The AFM is an effective tool to examine the two main healing mechanisms in asphalt
materials, namely, wetting and intrinsic healing, using the method described in this
report.
Method-I described in this report is recommended to be used for preparing AFM samples,
since it was found to produce asphalt films with uniform and consistent thicknesses
required for all AFM characterization techniques.
6.1.3.2 AFM Imaging
The inclusion of the Sasobit WMA additive reduced the dimensions of the so called ‘bee-
like’ structures within the neat and polymer modified asphalt binders. However, the other
WMA technologies did not have any significant effects on the dimensions of these
structures.
The Sasobit additive resulted in increasing the relative stiffness of dispersed domains
containing the ‘bee-like’ structure in comparison with the flat asphalt matrix for both

90
types of binders. The stiffer domains resulted in enhancing of the stiffness properties of
the Sasobit modified asphalt binder as compared to the control asphalt binder, which
explains the higher G* value obtained in the DSR test for this binder.
The phase image showed that the inclusion of Evotherm did not have a significant effect
on the domains viscoelastic properties of the PG 70-22M and PG 64-22 binders. This is
consistent with DSR test results.
According to the AFM phase image, the foaming of the polymer modified asphalt binders
through adding Advera additive or by water injection resulted in reducing the relative
stiffness between the dispersed domains and the flat asphalt matrix.
The phase contrast between the flat matrix and dispersed domains remained unchanged
due to the foaming of the PG 64-22 binder.
6.1.3.3 Force Spectroscopy Experiments
Based on the results of the AFM force spectroscopy results, the indirect tensile strength
measured in the AASHTO T283 test was found to depend more on the adhesive bonds
(forces) between the aggregate and binder as compared to the cohesive bonds (forces)
within the binder itself.
For the unconditioned samples, all WMA technologies had resulted in increasing the
adhesive forces for both types of asphalt binders. Advera and foamed WMA had the
highest improvement to these forces, while the Sasobit had the least. This result may
explain the lower ITS values obtained due to the addition of the Sasobit.
For the unconditioned 70-22M samples, the inclusion of the Evotherm and Advera WMA
additives resulted in significantly increasing the interaction forces with –OH tip, but the
Sasobit additive significantly reduced these forces.
For the unconditioned samples, only the Sasobit has resulted in significant reduction in
the –COOH cohesive forces for both types of binders. However, the other WMA
technologies did not have any significant effect on these forces.
The adhesive forces were significantly decreased due to conditioning of the control and
WMA 64-22 binders. This behavior was different than that observed for the polymer

91
modified PG 70-22M binder, which indicates that the PG 64-22 binder is more
susceptible to moisture damage.
Upon conditioning of the PG 64-22 binder, the control and Evotherm WMA binders
exhibited the least reduction in the adhesive forces. Furthermore, the Advera binder had
the highest decrease after moisture conditioning. This is may explain the lower TSR
values that Advera 64-22 mixture exhibited.
The Sasobit and Advera led to a reduction in the cohesive forces within both types of
asphalt binders after moisture conditioning, indicating that it might adversely affect
cohesive bonds within the asphalt binder.
According to AFM tests, the Evotherm WMA will have the best resistance to moisture-
induced damage among all WMA technologies evaluated in this study, which is similar to
that of the control asphalt binder. This may be attributed to the anti-strip additive that
Evotherm contains.
6.1.3.4 Healing Experiments
The Evotherm, Advera, and foamed WMA technologies had resulted in improving the
rate of micro-crack closure rate in both types of binders considered in this study. On the
contrary, Sasobit had an adverse effect on this rate.
The micro-crack closure rate, and hence the wetting mechanisms is related to the
interaction forces with –OH chemical group in an asphalt binder.
Only the Sasobit resulted in significant decrease in the cohesive bonding energy;
indicating that it might adversely affect the intrinsic healing of the considered asphalt
binders.
All WMA technologies except the Sasobit improved the –OH cohesive bonding energy of
the both types of binders. This improvement was much more pronounced in the case of
the Evotherm.
All WMA technologies except the Sasobit had similar –COOH cohesive bonding energy
to that of the control asphalt binders.
The Evotherm might improve the intrinsic healing of the both asphalt binder, while the
addition of the Sasobit additive might adversely influence this property.

92
Advera and foamed WMA technologies do not have a significant effect on the intrinsic
healing of the considered asphalt binders.
6.2 Study Limitations
This study had a number of limitations, which include:
The use of only two types of asphalt binders and one type of aggregates.
The use of fully dried aggregates in preparing the asphalt mixtures.
Only one type of macro-scale test was used in this study to evaluate moisture
susceptibility of asphalt mixtures.
The foaming parameters, which include: foaming water content, air pressure, water
pressure, and foaming temperature, were not varied and thus their influence on moisture
susceptibility was not investigated.
6.3 Recommendations for Further Study
It is recommended that future work expands the current study to include other types of
aggregates and asphalt binders used in Ohio. In addition, future studies are needed to evaluate
the use of other macro-scale tests that has the capability to examine adhesive as well as cohesive
failures within an asphalt system. This will allow having a more fundamental and better
evaluation of the moisture susceptibility of asphalt materials. It is also recommended to conduct
a comprehensive evaluation of the effects of the foaming parameters on the moisture
susceptibility of WMA binders and mixtures.
The AFM was found to be a viable device in studying the moisture susceptibility and
healing characteristics of asphalt materials. However, there are other useful applications for this
device. Future research should explore the other AFM techniques such as the nano-indentation to
study other problems related to asphalt binders and mixtures.
6.4 Recommendations for Implementation
During the last few years, the amount of asphalt mixture produced using the foamed
WMA technology in Ohio has increased from 10,430 tons in 2008 to 2,800,000 tons in 2011,

93
which represents about 56% of the total amount of asphalt mixtures produced in the state. As
part of this study the influence of foamed WMA technology on the moisture susceptibility and
healing characteristics of asphalt binders was evaluated. The results showed that the foamed
WMA technology does not have any significant effect on the moisture susceptibility of the
considered asphalt binders. Furthermore, the foamed WMA technology was found to improve
the micro-crack closure rate of asphalt binders, but it did not influence their intrinsic healing
properties.
This study showed that the AASHTO T283 used by ODOT to evaluate moisture
susceptibility of asphalt mixtures depends on the adhesive bonds between the asphalt binder and
aggregate and may not predict moisture-induced damage problems in the mixture associated with
failures in the cohesive bonds within the asphalt binder itself. Thus, it is recommended to use an
additional test to supplement the AASHTO T283 and examine the cohesive failures within an
asphalt mixture.

94
REFERENCES
- AASHTO T283. Standard Method of Test for Resistance of Compacted Hot Mix Asphalt
(HMA) to Moisture-Induced Damage. American Association of State Highway and
Transportation Officials (AASHTO), 2007.
- Abbas, A. (2008), “Simulating the Deformation Behavior of Hot Mix Asphalt as Tested in
the Indirect Tension Test.” ASCE Geotechnical Special Publication No. 182, Geo-Institute,
Reston, VA, pp. 16-23
- Abu Al-Ru, R., Masad, E., and Graham, M. (2010). Physically Based Model for Predicting
the Susceptibility of Asphalt Pavements to Moisture-Induced Damage, Final Report,
Southwest University Transportation Center, Report # SWUTC/10/476660-0012-1.
- Agilent Technologies, Inc. (2008). Agilent 5500 LS AFM/SPM User Manual. Agilent
Technologies, Palo Alto, California.
- Ali, A., Abbas, A., and Nazzal, M. (2012) “Laboratory Evaluation of Foamed Warm Mix
Asphalt.” International Journal of Pavement Research and Technology.
- Astec, Inc. Webpage (http://www.astecinc.com/).
- Barthel, W. and M. von Devivere (2003). “Warm Asphalt Mixes by Adding Aspha-Min. A
Synthetic Zeolite.” Proceedings of the 48th
Annual Convention of the National Asphalt
Pavement Association (NAPA), San Diego, CA, January 11-17.
- Bhasin, A., Masad, E., Little, D., Lytton, R.: Limits on adhesive bond energy for improved
resistance of hot mix asphalt to moisture damage. Transportation Research Record 1970, 3-
13 (2006).
- Bhasin, A.: Development of methods to quantify bitumen-aggregate adhesion and loss of
adhesion due to water. PhD dissertation, Texas A&M University, College Station, Texas
(2006).
- Bhushan, B. and Qi, J., 2003. Phase contrast imaging of nanocomposites and molecularly
thick lubricant films in magnetic media. Nanotechnology, 14: 886-895.
- Bonaquist, R. (2011). NCHRP Project 9-43: Mix Design Practices for Warm Mix Asphalt.
Final Report Pending, Transportation Research Board, National Highway Research Council,
NCHRP, Washington, D.C.

95
- Buss, A., Williams, C., Schram, S., Kvasnak, A (2011). “Investigation of warm-mix asphalt
using Iowa aggregates.” Proceedings of the 90th
Transportation Research Board Annual
Meeting, Washington, D.C.
- Carbognani, L., DeLima, L., OreaM.&Ehrmann, U. , 2000. Studies of large crude oil alkanes.
II. Isolation and characterization of aromatic waxes and waxy asphaltenes. Petroleum
Science Technology, 18, 607–634.
- Caro, S., Masad, E., Bhasin, A., Little, D. (2008) Moisture susceptibility of asphalt mixtures,
Part 1: Mechanisms. International Journal of Pavement Engineering, 9, 81–98.
- Corrigan, M. (2010). “What’s New with WMA?” Presented at the North Central Asphalt
User/Producer Group (NCAUP) Hot Mix Asphalt Technical Conference, Overland Park,
KS, February 2-4.
- Csanyi, L. H. (1957). “Foamed Asphalt in Bituminous Pavements.” Highway Research
Board Bulletin, Vol. 10, No. 160, pp. 108-122.
- D’Angelo, J., Harm, E., Bartoszek, J., Baumgardner, G., Corrigan, M., Cowsert, J., Harman,
T., Jamshidi, M., Jones, W., Newcomb, D., Prowell, B., Sines, R., and B. Yeaton (2008).
Warm-Mix Asphalt: European Practice. Federal Highway Administration (FHWA), Report
No. FHWA-PL-08-007. Federal Highway Administration (FHWA) Warm Mix Asphalt
Webpage (http://www.fhwa.dot.gov/pavement/asphalt/wma.cfmb ).
- Davidson, J. K. (2007). “Warm Asphalt Mix Technology-The Canadian Perspective.”
Australian Asphalt Pavement Association.
- Ferry, J. D. 1980. Viscoelastic properties of polymers. John Wiley & Sons, New York.
- Fischer-Cripps AC, 2006. Critical review of analysis and interpretation of nanoindentation
test data. Surf. Coat Technol, 200:4153.
- Hodo, W., Kvasnak, A., and Brown, R. (2009). “Field and Laboratory Investigation of
Foamed Asphalt (Warm-Mix Asphalt) with High Recycled Asphalt Pavement Content for
Sustainment and Rehabilitation of Asphalt Pavement.” Proceedings of the 88th
Transportation Research Board Annual Meeting, Washington, D.C.
- Horcas, I., Fernandez, R., Gomez-Rodriguez, J.M. Colchero, J. Gomez-Herrero, J. and
Baro, A. M. Rev. Sci. Instrum. 78, 013705 (2007).

96
- Hurley, G. C. and B. D. Prowell (2005a). Evaluation of Aspha-Min Zeolite for Use in Warm
Mix Asphalt. National Center for Asphalt Technology (NCAT) Report 05-04.
- Hurley, G. C. and B. D. Prowell (2005). Evaluation of Sasobit for Use in Warm Mix Asphalt.
National Center for Asphalt Technology (NCAT) Report 05-06.
- Hurley, G. C. and B. D. Prowell (2006a). Evaluation of Evotherm for Use in Warm Mix
Asphalt. National Center for Asphalt Technology (NCAT) Report 06-02.
- Hurley, G. C. and B. D. Prowell (2006b). “Evaluation of Potential Processes for Use in
Warm Mix Asphalt.” Journal of the Association of Asphalt Paving Technologists, Vol. 75,
pp. 41-90.
- Hurley, G. C., and B.D. Prowel. (2005). “Evaluation of Aspha-min Zeolite for Use in Warm
Asphalt Mixes.” NCAT Report 05-04, National Center of Asphalt Technologiest, Auburn
University, Auburn, AL, June 2005.
- Hurley, G.C., and B.D. Prowell (2006). “Evaluation of Potential Processes for Use in Warm
Mix Asphalt,” Journal of the Association of Asphalt Paving Technologists, Volume 75,
Savannah, Georgia, 2006, pp. 41 - 90.
- Jenkins, K. J. and M. F. C. van de Ven (1999). “Mix Design Considerations for Foamed
Bitumen Mixtures.” Proceedings of the 7th
Conference on Asphalt Pavements for Southern
Africa, Victoria Falls, Zimbabwe.
- Jenkins, K. J., J. L. A. de Groot, A. A. A. Molenaar, and van de Ven (1999). “Half-Warm
Foamed Bitumen Treatement, a new process.” Proceedings of the 7th
Conference on Asphalt
Pavements for Southern Africa, Victoria Falls, Zimbabwe.
- Kanitpong, K., S. Sonthong, K. Nam, W. Martono, and H. Bahia (2007). “Laboratory Study
on Warm Mix Asphalt Additives,” Proceedings of 86th Annual Meeting of the
Transportation Research Board, National Academy of Sciences, Washington, D.C.
- Kiggundu B. M. and Roberts, F. L. (1988) “Stripping in HMA Mixtures: Stateof-The Art
And Critical Review of Test Methods.” NCAT, Auburn University, Auburn, Alabama,
Report No. 88-2.
- Kim, Y., Lee, H., and M. Heitzman (2007). “Experience of Developing and Validating a
New Mix Design Procedure for Cold In-Place Recycling Using Foamed Asphalt.”
Proceedings of the 2007 Mid-Continent Transportation Research Symposium, Amex, Iowa.

97
- Koenders, B. G., Stoker, D. A., Bowen, C., de Groot, P., Larsen, O., Hardy, D., and K. P.
Wilms (2000). “Innovative Process in Asphalt Production and Application to Obtain Lower
Operating Temperatures.” 2nd
Eurasphalt & Eurobitume Congress, Barcelona, Spain.
- Kringos, N., Pauli, T., Schmets, A. & Scarpas, T. (2012). Demonstration of a New
Computational Model to Simulate Healing in Bitumen. Journal of the Association of
Asphalt Paving Technologists.
- Kristjansdottir, O. (2006). Warm Mix Asphalt for Cold Weather Paving, Master Thesis,
Report No. WA-RD 650.1, University of Washington, Seattle, Washington.
- Kristjansdottir, O., Muench, S. T., Michael, L., and G. Burke (2007). “Assessing Potential
for Warm-Mix Asphalt Technology Adoption.” Journal of the Transportation Research
Board, Transportation Research Record 2040, pp. 91-99.LEA-CO Webpage
(http://www.lea-co.com/).
- Kvasnak, A., Taylor, A., Signore, J., and Bukhari, S. (2010). Evaluation of Gencor Green
Machine Ultrafoam GX. National Center for Asphalt Technology, NCAT Report 10-03.
- Kvasnak, A., West, R., Moore, J., Nelson, J., Turner, P., and Tran, N. (2009). “Case Study of
Warm Mix Asphalt Moisture Susceptibility in Birmingham.” Proceedings of the 88th
Transportation Research Board Annual Meeting, Washington, D.C.
- Loeber, L., Muller, G., Morel, J. & Sutton, O. Bitumen in colloidal science: a chemical,
structural and rheological approach. Fuel, 77, 1443–1450, 1998.
- Lu, X.H., Langton,M., Olofsson, P.&Redelius,P., 2005.Waxmorphology in bitumen. J.
Mater. Sci., 40: 1893–1900.
- Maccarrone, S., Holleran, G. and A. Ky (1994). “Cold Asphalt Systems as an Alternative to
Hot Mix.” Proceedings of the 9th
International Australian Asphalt Pavement Association
(AAPA) Conference, Queenland, Australia.
- Masson, J-F., Leblond, V. And Margeson, J. (2008). “Bitumen morphologies by phase
detection atomic force microscopy.” Journal of Microscopy, Vol. 221, pp. 17–29, 2006.
- MeadWestvaco. (2012). Evotherm M1 Product Data Bulletin. Retrieved July 7, 2012, from
Evotherm® Warm Mix Asphalt:
http://www.meadwestvaco.com/SpecialtyChemicals/AsphaltAdditives/MWV002106
- Middleton, B. and Forfylow, R.W. (2009). “Evaluation of Warm Mix Asphalt Produced
With the Double Barrel Green Process.” Journal of the Transportation Research Board,

98
- Moulthrop, J., McDaniel, R., McGennis, R., Mohammad, L. and Kluttz, R.(2007). “Asphalt
Mixture Innovations: State of the Practice and Vision for 2020 and Beyond,” TR News No.
253 Highway Design and Construction A 2020 Vision, pp.20-23.
- Muthen, K. M. (1998). Foamed Asphalt Mixes-Mix Design Procedure. Sabita Ltd. and CSIR
Transportek, Report CR-98/077, South Africa.
- Nazzal , M., Kaya, S., Abu-Qtaish, L. (2012) “Evaluation of the Healing Properties Of
Asphalt Binders Using Atomic Force Microscopy” The RILEM Book series, Vol. 4.
- Nazzal , M., Sargand, S. , and Al-Rawashdeh, A., (2010). Evaluation Of Warm Mix Asphalt
Mixtures Containing RAP Using Accelerated Loading Tests. ASTM Journal of Testing and
Evaluation, Vol. 39, No. 3.
- Nguyen, T., Gu, X., Fasolka, M., Briggman, K., Hwang, J., Karim, A., and Martin, J., 2005.
Mapping chemical heterogeneity of polymeric materials with chemical force microscopy.
Polym. Mater. Sci. Eng., 90: 141–143.
- ODOT CMS (2010), Construction and Material Specifications, Ohio Department of
Transportation, Columbus, Ohio.
- Pellinen, T. K. and Witczak, M. W. (2002). “Stress Dependent Master Curve Construction
for Dynamic (Complex) Modulus.” Journal of Association of Asphalt Paving Technologists,
Volume 71, pp. 281-309.
- Petersen, J. C., 1984. Chemical composition of asphalt as related to asphalt durability: state
of the art, Transportation Research Board , 999: 13-30.
- Prowell, B. D., Hurley, G. C., and Crews, E. (2007). “Field Performance of Warm-Mix
Asphalt at National Center for Asphalt Technology Test Track.” Journal of the
Transportation Research Board, Transportation Research Record 1998, pp. 96-102.
- Prowell, B.D., G.C. Hurley, and E. Crews (2007) “ Field Performance of Warm-Mix
Asphalt at the NCAT Test Track.” 86th
Transportation Research Board Annual Meeting,
Washington, D.C..
- Romier, A., Audeon, M., Jac, D., Martineau, Y., and F. Olard (2006). “Low-Energy Asphalt
with Performance of Hot-Mix Asphalt.” Journal of the Transportation Research Board,
Transportation Research Record 1962, pp. 101-112.
- Ruckel, P. J., Acott, S. M., and R. H. Bowering (1983). “Foamed-Asphalt Paving Mixtures:
Preparation of Design Mixes and Treatment of Test Specimens.” Journal of the

99
Transportation Research Board, Transportation Research Record 991, pp. 88-95.
- SAS Institute Inc. (2004). SAS OnlineDoc® 9.1.2. Cary, NC, SAS Institute Inc.
- Sasol Wax Webpage: (http://www.sasolwax.com/).
- Tarefder, R. & Zaman, A.(2010). “Nanoscale Evaluation of Moisture Damage in Elastomeric
Polymer Modified Asphalts”, ASCE Journal of Materials in Civil Engineering, 2010.
- Vavrik, W. R., Pine, W. J., and S. H. Carpenter (2002). “Aggregate Blending for Asphalt
Mix Design: Bailey Method.” Journal of the Transportation Research Board,
Transportation Research Record 1789, pp. 146-153.
- Warm Mix Asphalt Technical Working Group Webpage (http://www.warmmixasphalt.com/).
- Wasiuddin, N. M., Selvamohan, S., Zaman, M. M., and M. L. T. A. Guegan (2008).
“Comparative Laboratory Study of Sasobit and Aspha-Min Additives in Warm-Mix
Asphalt.” Journal of the Transportation Research Board, Transportation Research Record
1998, pp. 82-88.
- Wielinski, J., Hand, A., and Rausch, D. (2009). “Laboratory and Field Evaluations of
Foamed Warm-Mix Asphalt Projects.” Journal of the Transportation Research Board,
Volume 2126, pp. 125-131.
- Wu, S. P., Pang, L., Mo, L. T., Chen, Y. C., and Zhu, G. J. (2010). “Influence of Aging on
the Evolution of Structure, Morphology and Rheology of Base and SBS Modified Bitumen.”
Constr Build Mater, Vol. 23, pp. 1005–1010.
- Xiao, F., Amirkhanian, S., and Putman, B. (2009). “Evaluation of Rutting Resistance in
Warm Mix Asphalts Containing Moist Aggregate.” Journal of the Transportation Research
Board, Volume 2126, pp. 115-124.
- Zhang, H., Wang, H., Yu, J. (2011). “Effect of Aging on Morphology of Organo-
Montmorillonite Modified Bitumen by Atomic Force Microscopy.” Journal of Microscopy,
Vol. 242, pp. 37–45.