the use of cotionseed meal in animal feed...
TRANSCRIPT

THE USE OF COTIONSEED MEAL IN ANIMAL FEED RATIONS
A SURVEY OF FEED FORMUlATORS
Dr Gary W Williams Mr Jim Bob Ward
TAMRC Commodity Market Research Report No CM-2-91
October 1991
Report prepared under contract with the National Cottonseed Products Association
Memphis Tennessee
Professor and TAMRC Coordinator and Research Associate respectively Texas Agricultural Market Research Center Department of Agricultural Economics Texas AampM University College Station Texas
THE USE OF COTTONSEED MEAL IN ANIMAL FEED RATIONS A SURVEY OF FEED FORMUIATORS
Texas Agricultural Market Research Center (TAMRC) Commodity Market Research Report No CM-2-91 October 1991 Texas Agricultural Market Research Center Department of Agricultural Economics Texas AampM University College Station Texas 77843-2124
ABSTRACf This study is an assessment of potential problems and opportunities for expanding the use of cottonseed meal (CSM) as a feed ingredient The primary tool of analysis was a national survey of feed formulators to analyze the particular factors influencing their selection or non-selection of CSM as an ingredient in their feed formulations The survey results suggest possible opportunities for expanding CSM use Market development opportunities may be limited because of the nature of the CSM situation Improvements in CSM market efficiency through providing enhanced and more accurate information in specific areas identified in the study may be the most effective means of promoting expanded use of CSM
Thanks is due to Steve Martin who left NCPA while this study was in progress for extensive assistance in developing the survey questionnaire used The staff of NCPA provided invaluable support and assistance Dave Kinard in particular who took over as NCPA liaison for the study following Steve Martins departure provided enthusiastic assistance whenever requested Kent Hall Heather Rugeley Jennifer Mabe and Lyn Burkey of the TAMRC staff provided computer assistance andor clerical support The authors however are solely responsible for any errors or omissions in the report
The Texas Agricultural Market Research Center (TAMRC) has been providing timely unique and professional research on a wide range of issues relating to agricultural markets and commodities of importance to Texas and the nation for more than two decades TAMRC is a market research service of the Texas Agricultural Experiment Station and the Texas Agricultural Extension Service The main TAMRC objective is to conduct research leading to expanded and more efficient markets for Texas and US agricultural products Major TAMRC research divisions include International Market Research Consumer and Product Market Research Commodity Market Research and Contemporary Market Issues Research
THE USE OF COTfONSEED MEAL IN ANIMAL FEED RATIONS A SURVEY OF FEED FORMUlATORS
EXECUTIVE SUMMARY
The trends over time in the use of cottonseed meal (CSM) are rooted in the particular factors that influence the protein purchasing and use decisions of livestock feed formulators Whether or not CSM is included in the feed rations of a particular livestock feeding operation depends to a large extent on the decisions of the individual responsible for formulating the feeds Taken together the attitudes and perceptions of those individuals regarding the use of CSM in livestock feeds define the boundaries within which CSM use will be able to achieve any significant growth in the future At the same time those attitudes and perceptions are the key to understanding not only the problems facing CSM use but also the opportunities Consequently the primary goal of this study was an assessment of potential problems and opportunities for expanding the use of CSM as an animal feed ingredient through an analysis of the particular factors influencing feed formulators to include or not to include CSM in their animal feed rations
The primary tool of analysis was a national survey of feed formulators A survey sample of 1191 animal nutritionists was developed consisting of animal nutritionists employed by commercial feed manufacturers consulting animal nutritionists and produceranimal nutritionists After some screening of the sample based on willingness to participate and whether or not the sample member was actually a practicing commercial feed formulator the original sample yielded 470 qualified sample members (395) A surprising 258 participated by returning completed surveys however (549 of qualified sample members and 217 of original sample) Normal returns for similar studies are in the 10-15 range The combined completed surveys represented the CSM use perceptions of 123 beef cattle feed formulators 143 dairy cattle feed formulators 55 poultry feed formulators and 12 catfish feed formulators The total number of feed formulators (333) adds to more than the 258 individuals who returned completed surveys because a given feed formulator could formulate feed for more than one animal specie and therefore could return a completed survey for more than one animal specie
The results of the cottonseed meal use survey are summarized into three main sections in the report 1) combined survey results across all animal species 2) results by particular animal species (beef cattle dairy cattle poultry and catfish) and 3) a comparison of results among animal species The major findings include the following
bull Quality is the most important factor affecting the choice of dietary proteins by feed formulators followed by consistency availability and price in last place
bull Once feed formulators have set the general parameters for use of dietary proteins in their formulations however price is the most important factor determining the choice among alternative dietary proteins to satisfy the general parameters for dietary protein use in feed formulations
111
bull The nutritional factors of most concern to formulators of feed containing CSM for nonshyruminant animals (poultry and catfish) appear to be protein-related For formulators of ruminant (beef and dairy cattle) feeds aflatoxin level and rumen degradability are the most important nutritional factors
bull The most important non-nutritional factors affecting the use of CSM in feed rations include 1) price 2) availability 3) consistent quality and 4) palatability in that order
bull Non-nutritional factors are more important than nutritional factors in the choice of CSM over alternative protein feeds
bull Price and availability were cited as the characteristics that most need to change in order for CSM to be selected as a feed ingredient more frequently
bull CSM is generally considered to be inferior to higher protein feedstuffs and superior to lower protein feedstuffs
bull The survey responses generally indicate that CSM is normally available when feed formulators perceive that it needs to be available
bull There is a tremendous disparity in the perception of respondents regarding the appropriate levels of several key nutrition-related factors for specific livestock rations including energy levels fat levels gossypol levels and escape values (ruminants only) for cottonseed meal Feed formulators generally lack adequate and reliable information on many factors which are crucial in efficient feed formulation and which have a significant impact on the choice of CSM as a feed ingredient
Major problems that would hinder efforts to expand cottonseed meal use identified in the study include primarily the following
bull Price and availability of CSM are the major factors affecting the selection or non-selection of CSM as an ingredient of feed formulations regardless of animal specie Unfortunately neither the price nor the availability of CSM can be controlled or altered substantially or directly by market expansion programs
bull CSM is perceived to be inferior in an overall sense to a number of key protein feeds
bull Gossypol level is one of the top reasons that CSM is not used more frequently particularly in non-ruminant feed rations The level of gossypol is a unique characteristic of CSM that obviously cannot be changed through market expansion activities
bull Several other specific characteristics of CSM would likely need to change for CSM to be selected more frequently as a feed ingredient including amino acid balance energy level aflatoxin level and protein quality As with gossypol changes in these characteristics are out of the realm of market expansion programs
bull The use of CSM in livestock feed rations is likely restricted by a wide disparity in the perception of feed formulators regarding the appropriate levels of several key nutrition-related factors for specific livestock rations
IV
bull Over 75 of dairy cattle feed formulators and nearly half of beef cattle feed formulators utilize whole fuzzy cottonseed to some extent in some of the feed rations they formulate
The survey results suggest that opportunities for expanding CSM use through market development andor enhancing market efficiency may exist Market development opportunities may be limited because of the nature of the CSM supply situation Nevertheless expansion of CSM use is possible through a reduction in direct feeding of cottonseed so that opportunities for expanding use through market development should not be discounted Efforts to enhance the adequacy and accuracy of information regarding the use of CSM as a feed ingredient however may be the most effective means of expanding the use and value of CSM in feed rations If there is any chance of successfully expanding the use of CSM the survey results suggest that the following components of market expansion strategy will be crucial
bull Product quality and consistency and an improved image of availability must be the major targets of promotion efforts
bull CSM use expansion efforts must focus to some extent on reducing the direct feeding of whole cottonseed to beef and dairy cattle
bull Separate CSM market promotion messages must be developed to address the very different needs and concerns of ruminant vs non-ruminant feed formulators
bull The nutrition-related content of CSM market promotion messages must emphasize primarily the positive aspects of CSM protein quality amino acid balance and amino acid availability as well as accurate information on acceptable gossypol and aflatoxin levels
bull The non-nutrition-related content of CSM market promotion messages may well be the most important and must emphasize primarily the positive aspects of price availability consistency of quality and storability
Perhaps the most cost-effective appropriate and useful means of enhancing the use of CSM would be a strategy aimed at improving the level and accuracy of information available regarding CSM and its use Lack of information or misinformation can easily discourage feed formulators from using CSM in their feed formulations The results of this study clearly indicate a number of critical needs for more accurate information in the feed formulating industry including
bull The quality consistency price palatability and availability of CSM
bull The ideal ratio of the price of CSM to other feeds like soybean meal
bull Protein-related factors for CSM use in non-ruminant feeds
bull CSM aflatoxin levels and rumen degradability particularly for beef and dairy cattle feed formulators
bull The feeding value of CSM relative to that of alternative protein feeds
bull The appropriate levels of several key parameters affecting the use of CSM in animal feed rations including energy levels fat levels gossypol levels and escape values (ruminants only J
v
The general conclusion of the study is an obvious one the use of CSM in feed formulations faces some major challenges in the future Chief among these include a perception among feed formulators that price availability quality and other key CSM characteristics are often obstacles precluding increased use of CSM in their feed formulations Perhaps the most important implication of the study is that a serious lack of adequate and accurate information among feed formulators regarding the characteristics parameters value and other aspects of cottonseed meal use in animal feed rations may be seriously restricting the market opportunities for cottonseed meal The development of alternative strategies to expand the use of CSM and enhance the accuracy and availability of information on all aspects of CSM use in feed formulations is beyond this study Nevertheless a few recommendations pertinent to the development of such alternative strategies are in order
bull Before adopting any approach to expand the use of CSM it would be useful first to conduct a detailed analysis of the costs and benefits involved Market promotion efforts through advertising can be extremely costly and yield relatively little There is often a tremendous lag between advertising and promotion expenditures and any associated returns Also it could take years of investment in such market expansion efforts before an accurate measurement of the actual return on investment could even be attempted
bull Consider developing first a detailed plan for information dissemination to the feed industry regarding all appropriate aspects of CSM use in feed rations as determined in this study A comprehensive assessment of the information needs and the information resources readily available will help set the research agenda for the industry to fill the critical existing information gaps
bull Initiate a study of final user attitudes and perceptions of CSM use as a guide to future market expansion efforts Feed formulators are often not the final users User preference was cited at times by some feed formulators as a factor determining whether or not CSM is included in their feed formulations The real decision-makers in the use of CSM in the market may well include many more individuals than adequately represented by feed formulators
TABLE OF CONTENTS
Abstract iII
E Sxecutlve ummary 11
Introduction 1
Objectives of the Study 2
Methodology of the Study 2
Respondent Profile and Feed Formulation Activities 3
Survey Results 5
Combined Results 5 Results by Animal Species 9 Comparisons Among Animal Species 22 Summary of Major Findings 25
Problems and Opportunities for Expanding Cottonseed Meal Use 26
Some Concluding Comments and Recommendations 31
References 32
Report Figures 33
Report Tables 34
Appendix The Survey Questionnaires and Related Materials 35
THE USE OF COITONSEED MEAL IN ANIMAL FEED RATIONS A SURVEY OF FEED FORMUlATORS
A rapid increase in the world demand for milk and meat products following World War II led to equally rapid technological advances in livestock feeding practices and in the numbers and sizes of production units of broilers laying hens beef and dairy cattle swine and other livestock species in the United States That growth in turn fostered growth of the compound feed industry and the demand for protein feed supplements Although more than 50 commodities in the world can be classified as protein and oil-bearing oilseeds have become the worlds foremost source of protein for animal feeds The use of oilseed meals in animal feeds has more than tripled since the late 1940s at an average annual growth rate of 33 (Figure I)
Cottonseed meal (CSM) quickly became a major source of the protein required for the new and expanding feed industry accounting for over 30 of the volume of oilseed meals fed to livestock immediately following World War II (Figure 2) Although cottonseed crushing in the United States dates back to the pre-Civil War era the primary interest was in the oil CSM was little more than a low value by-product before World War II Consequently CSM was well positioned as an immediately available low-cost source of the protein required for the growing feed formulating industry in the late 1940s
Unfortunately however CSM use not only failed to increase as a percentage of the rapidly growing oilseed meal market it actually declined from a high of 29 million tons in 1953 to just under an estimated 16 million tons in 1990 (USDA) The consequence of course has been that CSM now is only a minor protein feedstuff accounting for only about only about 6 of total oilseed meal use in livestock feeds (Figure 2)
As protein meal use has shifted more toward soybean meal over time the price of CSM (on a soybean meal protein equivalent basis) has tended to trade at more of a discount to soybean meal In the I 950s CSM generally sold at about a $4ton to $8ton premium over soybean meal (Figure 3) Its price slowly slipped relative to that of soybean meal over the following three decades so that by the 1980s CSM sold at a substantial and increasing discount to soybean meal in most years
Both nutritional and non-nutritional factors are often cited as the main causes of the decline in the use of CSM in animal feed formulations Nutritional factors often mentioned as significant constraints to expanded use of CSM include the presence of gossypol in the meal and the generally lower net energy protein and lysine content of CSM compared to those of soybean meal Nonshynutritional factors frequently mentioned include primarily price and availability
The specific reasons behind the decline in CSM use however are rooted in the particular factors that influence the protein purchasing and use decisions of livestock feed formulators Whether or not CSM is included in the feed rations of a particular livestock feeding operation depends to a large extent on the decisions of the individual responsible for formulating the feeds Taken together the attitudes and perceptions of those individuals regarding the use of CSM in livestock feeds define the boundaries within which CSM use will be able to achieve any significant growth in the future At the same time those attitudes and perceptions are the keys to understanding not only the problems facing CSM use but also the opportunities
2
OBJECTIVES OF THE STUDY
The overall goal of this study was an objective unbiased assessment of potential problems and opportunities for expanding the use of CSM as an animal feed ingredient The primary aim of the study was an analysis of the particular factors influencing feed formulators to use or not to use CSM as an ingredient in their animal feed rations The more specific objectives of the study included the following
bull Identify the most important factors influencing the choice of a dietary protein by feed formulators
bull Determine the extent to which CSM is considered by feed formulators to be inferior or superior to other protein feeds and the extent to which CSM is considered to be an alternative to other protein feeds in formulating feed rations
bull Identify the most important nutrition-related and non-nutrition-related factors influencing the choice of CSM by feed formulators as a feed component over alternatives
bull Determine and rank the primary reasons for which CSM is or is not included in formulated feeds and the specific characteristics of CSM that would have to change in order for it to be included more frequently in formulated feeds
bull Identify and evaluate the specific factors related to CSM use by selected major animal species including beef cattle dairy cattle poultry and catfish and
bull Determine the problems and opportunities for expanding CSM use based on the survey results
MffiTHODOLOGY OF THE STUDY
The primary tool of analysis was a national survey of feed formulators A survey sample of 1191 animal nutritionists was first developed consisting of animal nutritionists employed by commercial feed manufacturers consulting animal nutritionists and produceranimal nutritionists The sample was then screened by mailing business reply postcards to the each individual in the sample to determine if they were the appropriate one to complete the survey ie the person in the respective firms responsible for formulating feeds and for decisions regarding changes in feed formulations If not they were asked to provide the name of the individual in their firms responsible for feed formulations In such cases a screener postcard was then sent to the name provided by the individual in the original sample The postcard screening instrument also allowed individuals in the sample to decline to participate in the survey to save time and cost in later efforts to follow up on nonshyresponses Consequently only those who qualified as feed formulators responsible for changes in formulations and who also agreed to participate were included in the final sample The postcard also asked the individuals in the sample to indicate the animal species for which they formulated feeds in order to determine the appropriate survey questionnaire(s) to send to each qualifying sample member A follow-up letter and additional postcard were sent out to all members of the sample who
3
did not respond within the allotted time frame to encourage participation Copies of the postcard screener and the follow-up letter are included in the Appendix
The survey instrument mailed to each qualifying sample member contained three separate color-coded sections of questions I) general questions regarding the overall feed formulating activities of the sample members and the general operations of the firms for which they formulate feeds 2) general questions regarding feed formulation and the use of CSM with respect to various animal species and 3) questions specific to each animal specie regarding the use of CSM in feed formulations A pre-test was conducted by sending the survey to 7 prominent animal nutritionists across the country with considerable experience in formulating feeds for at least one of the animal species included in the survey After some adjustments based on the pre-test the survey instrument was sent to each member of the sample according to the specie type(s) for which each had indicated in the screening process that they were formulating feeds The final survey questionnaires mailed to the sample are included in the Appendix
All final sample members received the first section of questions (general activities) The second section of survey questions (general questions on cottonseed meal use in feed formulations) was also sent to all members of the sample Because the responses to the questions in this section were likely to differ to some extent depending on the animal specie for which the sample member formulated feeds sample members received a separate copy of second section of the survey to complete for each animal specie for which they indicated that they formulated feeds This section of the survey was color-coded by animal specie for ease in identifying responses by animal type The third section of the survey included questions specific to each animal type Sample members received the set (or sets) of survey questions for this third section corresponding to the animal specie(s) for which they formulated feeds The third section of the survey was also color-coded by animal specie Thus an individual sample member could have received from a minimum of 3 up to a maximum of 9 survey sections to complete depending on the number of animal species (beef cattle dairy cattle poultry and catfish) marked by the sample member on the screener postcard Three separate followshyup letters were sent at regular intervals to non-responding members of the final sample to encourage their participation and are included in the Appendix
RESPONDENT PROFILE AND FEED FORMULATION ACfIVITIES
The original population of 1191 animal nutritionists included in the sample and who received screener postcards yielded 470 qualified sample members (395) Of those 470 qualified sample members however a surprising 258 participated by returning completed surveys (549 of qualified sample members and 217 of original sample) Normally the rate of return is expected to be only 10-15 The combined completed surveys represented the CSM use perceptions of 123 beef cattle feed formulators 143 dairy cattle feed formulators 55 poultry feed formulators and 12 catfish feed formulators The total number of feed formulators (333) adds to more than the 258 individuals who returned completed surveys because a given feed formulator could formulate feed for more than one animal specie and therefore could return a survey for more than one animal specie Because not all respondents answered all questions or all parts of all questions the actual number of responses to a particular question or part of a question is usually less than the total number of possible responses This means that the total number of actual respondents may vary somewhat from question to question or from one part of a question to another in a given survey section and across sections of the survey Consequently the tables summarizing the responses to the survey questions which accompany the
4
discussion of the survey results in this report indicate a response rate which is the number of actual responses divided by the number of possible response to the respective questions in percentage terms
The survey respondents indicated that they formulate feeds for a wide variety of animal species not just those specifically included in the survey Dairy and beef cattle each accounted for about 20 of the animal species for which feeds are formulated (Figure 4) All others accounted for 10 or less of the animal species for which feeds are formulated The survey respondents indicated that they formulate feeds for dairy and beef cattle (about 60 of the respondents for each) followed by horses (31 ) sheep and goats (27) broilers (27) layers (26) other (23) pets (17) turkeys (17) swine (14) and catfish (9) (Figure 5) Various exotic animal species accounted for the largest share (38) of the other animal species for which respondents indicated they formulate feeds (Figure 6)
The survey respondents represented feed formulating activities in nearly every state (Figure 7) Although no state accounted for more than 9 of the feed formulating activities of the respondents the major states represented by the respondents included Texas (8) California (7) Iowa (7) Michigan (7) Kansas (6) and Minnesota (5) About 40 of the respondents had less than 10 years experience as a feed formulator (Figure 8) Nearly 30 had experience of 11 to 20 years with the remaining 30 indicating experience of up to 45 years in feed formulation
A little over 60 of the respondents were consulting nutritionists and the remaining nearly 40 were nutritionists employed by a particular feed manufacturer (Figure 9) The respondents also indicated the primary feed types they formulate by animal species (Figure 10) Feeds for beef cattle dairy cattle and swine were the predominant feed products (66) The feed manufacturer nutritionists responding to the survey formulated an average of approximately 400487 tons of all feed types in 1990 of which 8 included CSM as an ingredient and 64 included soybean meal (Figure II) The preponderance of those firms (65) however formulated less than a total of 200000 tons of all feed types in 1990 (Figure 12) An even higher percentage of those firms (91) formulated less than 200000 tons of feed that included CSM
The survey respondents also indicated the specific types of animals for which they were formulating CSM feeds and the particular types of CSM feeds formulated for those animal types The responding beef cattle nutritionists formulated feeds that included CSM for a wide range of feedlot and non-feedlot beef cattle (Figure 13) Over 60 of the respondents indicated that they formulate feeds for at least one of those two animal types Calves and feeders were the predominant feedlot beef cattle types for which feeds were formulated using CSM (22 and 20 respectively) (Table I) For beef cattle not fed in feedlots the split among types was somewhat more even with brood cows and stockers having a slight edge The number of nutritionists formulating feeds for feedlot beef cattle was about 25 more than those formulating for non-feedlot beef cattle
Tables 2 through 7 indicate the particular feeds formulated with CSM for the various types of beef cattle The predominant CSM feed formulated tor calves was a creep or starter feed (Table 2) For feeders however CSM was used primarily in protein supplements (Table 3) Range supplements range feeds range cubes and miscellaneous supplements were the primary CSM feeds formulated for stockers replacement heifers brood cows and bulls (Tables 4 5 6 and 7)
The largest number of dairy cattle feed nutritionists responding to the survey formulated CSM feeds for lactating cows (88) followed by heifers (75) dry cows (69) and calves (51) in the last 5-10 years (Figure 14) Lactating cows accounted for 32 of the CSM feeds formulated for dairy cattle followed by heifers (27) dry cows (24) and calves (17) (Table 8) Tables 9 through 12 indicate the particular feeds formulated with CSM for the various types of dairy cattle The predominant CSM feeds formulated for dairy calves were indicated by respondents to be calf grower
5
and starter feeds (Table 9) For dairy heifers the main feeds formulated with CSM included various supplements and grower feeds (Table 10) For lactating cows CSM was used predominantly in complete rations For dry cows supplements and complete rations were the predominant feeds formulated with CSM (Tables II and 12)
The responding poultry nutritionists formulated feeds for layers (44) broilers (38) turkeys (24) and breeding flocks (26) (Figure 15) Layers accounted for the largest share of the CSM poultry feeds formulated by the respondents (35) followed by broiler feeds (29) breeding flock feeds (19) and turkey feeds (17) (Table 13)
Two-thirds of the catfish respondents (8 of the 12 respondents) formulate feed for grow out stock (Table 14) Half the catfish respondents (6 of the 12 respondents) formulate feeds for brood stock and for fingerlings Five of the respondents (42) formulate feeds for fries Respondents reported formulating several types of feeds using CSM for catfish (Table 15)
SURVEY RESULTS
The results of the cottonseed meal use survey are summarized into three main sections I) combined results across all animal species 2) results by particular animal species (beef cattle dairy cattle poultry and catfish) and 3) a comparison of results among animal species Summary figures and tables of the results are presented at the end of the report
Combined Results
A Dumber of the same questions were asked of all members of the survey sample regardless of the particular animal types for which they were formulating feeds (second section of the survey) The responses to the questions for each animal type were first combined to facilitate an overall assessment of the perceptions of animal feed formulators regarding the use of cottonseed meal in their feed formulations Again because many of the feed formulators participating in the survey completed the questions in this section for more than one animal specie a given participating feed formulator could count as more than one respondent in the analysis of the combined results (ie over all animal species) The results by animal species are discussed in a later section
All respondents were probed for their perceptions in 6 general areas I) the particular factors affecting their choice of dietary proteins for formulated feeds 2) the extent to which CSM is considered to be an alternative to selected protein feeds 3) the importance of nutritional and nonshynutritional factors in their decisions to use CSM rather than alternative dietary proteins in their feed formulations 4) the seasonality of CSM availabilityS) the specific reasons for the selection and nonshyselection of CSM for use in the feeds they formulate and 6) the source of CSM chemical analyses used by the respondents
Factors Affecting Choice of Dietary Proteins
All members of the final sample were asked to rank the importance of the following 4 general factors in their choice of a dietary protein for their feed formulations on a scale of 1 to 7 (from
6
extremely unimportant to extremely important respectively) I) quality 2) price 3) availability and 4) consistency In addition they were provided an opportunity to list and rank other factors affecting their dietary feed protein choices An impressive 92 of the respondents indicated that the quality of the protein was either important or extremely important in their choice of dietary proteins (Table 16) Nearly two-thirds of the respondents ranked protein quality as extremely important An almost equal number of respondents (90) indicated that protein consistency was either important or extremely important Less than half the respondents however ranked consistency as an extremely important factor Although nearly SO of the respondents ranked price availability and other factors as either important or extremely important the majority of respondents ranked each of those factors as important rather than extremely important The primary other factors listed by the respondents included palatability flow characteristics the protein composition the value supplier service and storage and handling characteristics (Table 17) Various miscellaneous factors were also listed
Cottonseed Meal As An Alternative Protein Feed
The final sample members were asked two sets of questions to gain insight into the competitiveness of CSM as a protein feed and determine which other proteins are considered to be the main competitors of CSM in feed formulations They were first asked to rank various selected protein feeds on a scale of I to 7 as inferior or superior respectively to CSM in an overall sense for use in feed formulations A mean response of greater than 4 for a particular protein feed is an indication that on average the responding feed formulators considered the protein feed to be superior to CSM (ie CSM is considered to be an inferior protein source) On the other hand a mean response of less than 4 is an indication that the protein feed is inferior to CSM in the perception of the respondents on average (Le CSM is considered to be a superior protein source) A mean response of around 4 suggests that the respondents considered cottonseed meal to be equally acceptable to those particular feeds The second question required respondents to indicate whether or not they considered CSM to be an alternative to each of the 20 listed protein feeds
The results suggest that CSM meal is considered to be clearly superior to only 5 of the 20 listed protein feeds including (in order of perceived CSM superiority) urea safflower meal wheat middlings sunflower meal and feather meal (Table IS) CSM was considered to be clearly inferior to another 7 of the 20 listed protein feeds including (in order of perceived inferiority of CSM) fish meal dried skim milk dried whole milk blood meal soybean meal meat and bone meal and corn gluten meal The mean responses of the remaining S protein feeds were all close to 4 suggesting that the respondents considered CSM to be about the same as those protein feeds These included (in no particular order) tankage poultry by-product meal peanut meal linseed meal brewers dried grains distillers dried grains dehydrated alfalfa and canola meal
Respondents were quite evenly divided in their opinion as to whether CSM is a viable alternative protein feed for almost all of the listed protein feeds (Table IS) The only possible exceptions were dried skim milk fish meal dried whole milk and blood meal for which a larger percentage of respondents indicated that CSM is an alternative than suggested that CSM is not an alternative
The Importance of Nutritional and Non-Nutritional Factors
In response to an earlier question respondents ranked the importance of various factors in choosing any dietary protein for use in their feed formulations Later respondents were asked to rank the importance of a more detailed list of nutrition-related and non-nutrition-related factors in specifically choosing cottonseed meal as a component of the feeds they formulate again on a scale of extremely unimportant to extremely important (a scale of I to 7 respectively) They were also
7
allowed to list other factors that they considered important but were not on the list Interestingly the largest percentage of respondents (90) ranked aflatoxin as an important or extremely important factor in their choice of CSM as a feed component (Table 19) Nearly two-thirds ranked aflatoxin as extremely important a much higher percentage than for any other factor Protein quality was ranked as important or extremely important by 80 of respondents Gossypol level had the third highest mean response of any individual factor Only one listed factor was clearly considered to be unimportant in the choice of cottonseed meal as a feed component (vitamin level) as indicated by a mean response of substantially less than 4 The mineral level in cottonseed meal was considered to be neither important nor unimportant
The major non-nutrition-related factors influencing the choice of cottonseed meal as a feed component in the perception of the respondents included consistent quality price availability nutrient guarantees and palatability as indicated by their relatively higher mean ran kings (Table 20) Note that all of the listed non-nutrition-related factors were considered by the respondents to be at least somewhat important in their choice of cottonseed meal as a feed component That is none of them were considered to be unimportant The least important non-nutrition-related factors influencing the choice of CSM in the perception of the respondents included service from the CSM industry the need for a local supply of CSM special equipment requirements for using CSM and convenience in using CSM as a feed component
Seasonality of Cottonseed Meal Availability
The survey results indicate that CSM is least available in sufficient quantities for purchase as a feed component during the months of June through September of a typical year (Figure 16) However the results also indicated that those are also about the same months (April through August) in which there is the least need for CSM to be available to compete effectively with alternative protein feeds (Figure 17) One interpretation of this result is that on average the availability of CSM is generally not a problem during the year This is not entirely the case however as the responses to the next set of questions point out
Reasons for the Selection and Non-Selection of Cottonseed Meal
To obtain further insight into the primary motivating factors behind the selection or nonshyselection of CSM as an ingredient in feed formulations the sample members were asked three completely unaided questions ie the respondents did not have a list from which to choose in answering the questions They were first asked to list the top five reasons why they perceive that CSM is selected as a feed ingredient and then the top 5 reasons why CSM is Dot selected in order of importance Finally if CSM is Dot generally selected by a respondent heshe was asked to list the specific characteristics of CSM that would have to change for it to be selected more frequently again in order of importance The respondents simply needed to fill in blanks for each question (reasons that CSM is and is not selected and characteristics that would have to change) marked lst through 5th with their own ideas
By far the number one reason (63 of the respondents) listed for which CSM is selected as a feed ingredient was price (Table 21) Far behind price the number one choices of some respondents were proteinprotein quality (9 of the number one responses) availability (7) palatability (4) and quality (4) Listed most often as the second most important reason for selecting CSM was availability (31 of the number two responses) followed by price (20) proteinprotein quality (1I) palatability (7) and pelletabilitypellet quality (6) The three reasons most often listed third were availability (20 of the number three responses) palatability (16) and price (11) Based on the total number of times a reason was listed first second or third the top three reasons
8
given by respondents for which CSM is selected as a feed component were price availability and proteinprotein quality in that order
The respondents provided a much longer list of reasons for which CSM is Dot selected than for which CSM is selected as a feed ingredient (Table 22) Interestingly the most frequently listed number one reason (54 of the respondents) why CSM is Dot selected as a feed ingredient was again price Other number one choices included availability (16) gossypol (9) and protein protein quality (3) The reason most often listed second (30 of respondents) was availability followed by pricevalue (20) and gossypol (8) The reason most often listed third was pricevalue again (14 of respondents) and then availability (I 3) and gossypol (I 1) Again based on the total number of times a reason was listed first second or third the top three reasons given by respondents for which CSM is Dot selected as a feed component were price availability and gossypol in that order
The three most commonly listed specific characteristics of CSM that would have to change to be included more frequently in respondents feed formulations also were price availability and gossypol (Table 23) Other less frequently mentioned CSM characteristics that would need to change included amino acid balancelevel energy contentlevel aflatoxin contentlevel proteinprotein quality
In summary price and availability appear to be the two key factors affecting the use of CSM If price is low andor availability is adequate feed formulators are more likely to use CSM in their formulations On the other hand a high price andor poor availability is likely to discourage use of CSM Consequently there is very little loyalty by feed formulators to CSM because they appear to be quick to switch back and forth between CSM and alternative feeds as price changes Feed formulators do not appear to perceive that CSM is a feed ingredient with inherent characteristics for which they are willing to pay a premium if necessary in order to continue using it as an ingredient in the feeds they formulate That is the primary consideration in deciding whether or not to use CSM is its price rather than some nutritional characteristic for example Thus when price rises they perceive little reason to continue using CSM as part of their formulations
The availability of CSM appears also to work both for and against the use of CSM Responses to the specific questions on seasonality seemed to indicate that availability of CSM is not generally a problem during the year But when CSM is not selected as a feed ingredient availability is one of the major reasons During certain times of the year in certain parts of the country availability may be a positive factor motivating the use of CSM
Source of Chemical Analyses for Cottonseed Meal
Nearly 90 of the respondents routinely perform crude protein analyses (Table 24) About two-thirds perform their own fat and fiber analyses as well Surprisingly however less than half the respondents routinely test for aflatoxin even though nearly all respondents indicated aflatoxin to be an important or extremely important factor affecting their choice of CSM as a feed component Only 18 of the respondents routinely test for gossypol Even though nearly all respondents performed their own crude protein analyses CSM suppliers apparently provide analytical values for crude protein to over 40 of respondents (Table 25) CSM suppliers provided fat and fiber analytical values to about a third of the respondents CSM suppliers appear to provide analytical values for gossypol to very few feed formulators
9
Results by Animal Species
The responses in the previous section are indicative of the overall perceptions of feed formulators of the use of CSM as a feed component Those results however may mask some important differences in perceptions among formulators of feeds for the various animal species There are also issues regarding the use of CSM as a feed component that are unique to the various animal species Consequently salient dissimilarities in the responses of formulators of different animal feeds from the combined responses (over all animal types) discussed in the previous section are highlighted in this section Also the results of the questions asked specifically of formulators of feeds for particular animal species are discussed in this section in detail as well
BeeCattle
There are few major differences in the perceptions of beef cattle feed formulator respondents concerning the use of cottonseed meal from those discussed in the previous section for all survey respondents This may reflect the larger number of respondents formulating feed for beef cattle (and for ruminants in general) than for other animal species The salient differences in the 6 general question areas include the following
bull Factors affecting choice 0 dietary proteins The only major difference in the responses to these questions was a somewhat greater concern by responding beef cattle feed formulators for other factors influencing the choice of a dietary protein such as palatability and rumen degradability (Table 26)
bull Cottonseed meal as an alternative protein feed The results for beef cattle are roughly similar to those from the combined responses (Table 27) Major differences include I) a lower percentage of beef cattle survey respondents consider blood meal to be superior to CSM in beef cattle feeds 2) a large majority of respondents feel that CSM is not an alternative to dried skim milk and dried whole milk in beef cattle feeds and 3) an overwhelming majority of respondents consider CSM to be an alternative to the remaining protein feeds for use in beef cattle feeds except perhaps for fish meal and blood meal
bull The importance 0 nutritional and non-nutritionalactors Again the responses are generally the same as for the combined responses The beef cattle survey respondents however tended to rank nutrition-related factors as less important and non-nutrition-related more important than was the case for the combined responses On average beef cattle feed formulators ranked protein quality amino acid balance amino acid availability fat level fiber level and gossypol level as less important factors in the choice of CSM than was the case for the combined responses (Tables 28 and 29) Of the non-nutrition-related factors respondents ranked palatability the need for a local supply equipment requirements convenience and CSM industry service as all slightly more important in the choice of CSM than was the case for the combined responses (Tables 30 and 31)
bull Seasonality 0 cottonseed meal availability The results for the beef cattle respondents are virtually identical to those from the combined responses (Tables 32 and 33)
bull Reasons lor the selection and non-selection 0 cottonseed meal The top three reasons for which CSM is and is not selected as a feed ingredient are exactly the same for the beef cattle responses as for the combined responses (Tables 34 and 35) Also price availability and
10
gossypol level are cited as the three most important factors that would have to change for CSM to be used more frequently as was the case with the combined responses (Table 36)
bull Source 0 chemical analyses lor cottonseed meal No major differences appear in either the analyses routinely performed by the responding beef cattle feed formulators or the analytical values provided to them by CSM suppliers (Tables 37 38 39 and 40)
Beef cattle sample members were also asked several questions specifically regarding the use of CSM in beef cattle feed formulations in 5 general areas I) problems resulting from feeding a ration with CSM to the various beef cattle types 2) details on particular feed formulations for beef cattle 3) sources of information utilized regarding formulating beef cattle feeds 4) protein-related factors considered when balancing rations for beef cattle and 5) an open-ended question soliciting suggestions to improve the usefulness or value of CSM for beef cattle feed formulations
Problems from Feeding CSM Rations to Beef Cattle
Few respondents indicted knowledge of any problems resulting from feeding a ration containing cottonseed meal to either feedlot or other beef cattle (Table 40 The most frequently mentioned problems concerned feedlot bulls and calves The majority of the problems reported involved supplements and starter feeds (Table 42) The main problems reported had to do with gossypol beef cattle performance when fed rations containing CSM and reproduction The low number of respondents indicating problems of any type however suggests that the problems reported were likely isolated cases
Details on Particular Feed Formulations for Beef Cattle
The sample members were also asked to provide information regarding creep feeds for calves and supplements for stockers that they formulate as well as information regarding the use of whole or delinted cottonseed in beef cattle feed rations Nearly 75 of all beef cattle respondents formulate creep feeds for calves and over 80 formulate supplements for stockers (Figure 18) Traditional creep feeds represented two-thirds of the creep feeds formulated (Table 43) Over half the respondents indicated that they formulate traditional creep feeds Fewer respondents formulated high protein creep feeds
Nearly half the beef cattle respondents formulate some feeds using whole fuzzy cottonseed (Table 44) Only a little less than a third formulate any feeds using delinted cottonseed however Also only about a quarter of the respondents formulate any rations that include both CSM and whole cottonseed (Table 45) For those who formulate rations that include both the mix of the two in the rations varies widely Respondents reported that the share of such rations accounted for by CSM ranged from 1 to 100 with a mean of 19 (Table 46) The share of those rations accounted for by whole cottonseed ranged from 0 up to a maximum of 25 with a mean of 102 (Table 47)
Sources of Information Utilized on Formulating Beef Cattle Feeds
The largest number of respondents (110 of 123 respondents) indicated that they utilize university research of some type to obtain information on formulating feeds for beef cattle (Table 48) Only slightly fewer (91 respondents) indicated that industry publications are a source of feed formulation information for beef cattle University extension and government agencies were also listed as important information sources A few respondents listed other sources of information
II
including primarily the results of research performed in their own companies their own personal experience and their own private research (Table 49)
Protein-Related Factors Considered for Balancing Beef Cattle Rations
Nearly 70 of the respondents indicated that rumen degradability is a protein-related factor that they consider when balancing beef cattle rations (Figure 19) Respondents also consider crude protein level (16) and other protein factors (11) Only 4 indicated concern for the amino acid value when balancing beef cattle feed rations The two main other protein-related factors the respondents indicated as having a bearing on balancing beef cattle feed rations were the digestibility of the protein and the protein ingredients (Table 50)
Respondents indicated a wide range of escape values (or by-pass values) that they are using for CSM from less than 20 to over 50 (Table 51) At the same time however they are unsure as to the reliability of the escape values they are using Nearly 70 indicated that the escape values they are using are neither reliable or unreliable or only somewhat reliable (Table 52) The principal single method or source used by respondents for the escape value was the National Research Council (Committee on Animal Nutrition National Academy of Sciences) (Table 53) Universities were the next most frequently mentioned single source of CSM escape values The largest number of respondents (32) simply indicated that several sources were consulted for escape values Finally almost all respondents indicated an interest in obtaining information on escape values for CSM as processed by different methods (Table 54) There appears to be a lack of reliable information on CSM escape values in the perception of beef cattle feed formulators
Suggestions for Improling the Usefulness of Cottonseed Meal
Only 16 of the beef cattle feed formulators that returned surveys provided suggestions that might improve the value or usefulness of CSM in feed rations (Table 55) Some of the more noteworthy suggestions included improving the consistency of cottonseed meal various types of needed research more data on CSM and increased availability of CSM
Dairy Cattle
There are few major differences in the perceptions of dairy cattle feed formulator respondents concerning the use of cottonseed meal from the combined responses over all survey respondents and the beef cattle responses Again this may reflect the larger number of respondents formulating feed for dairy cattle (and for ruminants in general) than for other animal species The salient differences in responses by dairy cattle feed formulators in the 6 general question areas include the following
bull Factors affecting choice of dietary proteins There is virtually no differences in the responses of dairy cattle respondents from the combined responses for any of the listed factors (quality price availability consistency and other) affecting the choice of dietary protein (Table 56) A large majority of dairy cattle feed formulators ranked all factors as either important or extremely important
bull Cottonseed meal as an alternative protein feed The results for dairy cattle are roughly similar to those from the combined responses (Table 57) The two major differences include I) a large majority of respondents feel that CSM is not an alternative to dried skim milk fish
12
meal dried whole milk and blood meal in dairy cattle feeds and 2) an overwhelming majority of respondents consider CSM to be an alternative to nearly all the remaining protein feeds for use in dairy cattle rations
bull The importance of nutritional and non-nutritional factors Again the responses are generally the same As was the case for beef cattle respondents however dairy cattle respondents tended to rank the listed non-nutrition-related factors as relatively more important than the listed nutrition-related factors On average dairy cattle feed formulators ranked amino acid balance fiber level and gossypol level as less important factors in the choice of CSM than was the case for the combined responses (Tables 58 and 59) As in the case of both the combined and beef cattle responses aflatoxin was ranked at a higher level of importance than any other single nutrition-related factor Of the non-nutrition-related factors respondents ranked most factors as all slightly more important in the choice of CSM than was the case for the combined responses (Tables 60 and 61)
bull Seasonality of cottonseed meal allailability The results for the dairy cattle respondents are highly consistent with those for both the combined responses and for the beef cattle responses The months of May through September are the months of least availability of CSM which are also the months indicated when CSM is least needed to be available in the perception of dairy cattle respondents (Tables 62 and 63) Again the suggestion is one of little problem of CSM availability although this is not totally the case as indicated by dairy cattle respondents in later questions
bull Reasons for the selection and non-selection of cottonseed meal While price and availability are also the top two reasons that dairy cattle respondents perceived that CSM is selected as a feed ingredient protein contentquality ranked third on their list followed closely by palatability (Table 64) The top two reasons the CSM is not selected according to the dairy cattle respondents were price and availability as with both the combined responses and the beef cattle responses The third reason given by the dairy cattle respondents however was protein qualitylevel followed in fourth place by gossypol (Table 65) Again price was the key CSM characteristic that dairy cattle respondents indicated that must change in order to be used more frequently in dairy cattle rations (Table 66) Availability and gossypol levels were ranked as the second and third CSM characteristics that must change as was the case for the combined responses
bull Source of chemical analyses for cottonseed meal The results for the chemical analyses performed by dairy cattle respondents are virtually identical to those of both the combined results and those of the beef cattle results The primary analysis routinely performed by the dairy cattle respondents is crude protein (121 of the 143 respondents) followed by fiber (94 respondents) and fat (83 respondents) (Tables 67 and 68) The primary analytical values supplied to the dairy cattle respondents also include crude protein (62 respondents) fiber (50 respondents) and fat (47 respondents) (Tables 69 and 70) It is interesting to note that although aflatoxin was ranked at a higher level of importance than any other nutrition-related factor affecting the choice of CSM as feed component only a third of the dairy cattle respondents routinely perform analyses for aflatoxin and only 11 respondents are provided aflatoxin values by their CSM suppliers The story is about the same for both the combined and the beef cattle responses
Dairy cattle sample members were also asked several questions specifically regarding the use of CSM in dairy cattle feed formulations in 6 general areas I) problems resulting from feeding a
13
ration with CSM to the various dairy cattle types 2) details on dairy cattle feed formulations containing whole cottonseed 3) sources of information utilized on formulating dairy cattle feeds 4) protein-related factors considered when balancing rations for dairy cattle 5) gossypol levels considered to be safe for mature dairy cattle and pre-ruminant calves and 6) an open-ended question soliciting suggestions to improve the usefulness or value of CSM for dairy feed formulations
Problems from Feeding CSM Rations to Dairy Cattle
Again very few respondents indicted knowledge of any problems resulting from feeding a ration containing CSM to dairy cattle (Table 71) Only 24 of the respondents indicated problems with calves and only 18 for lactating cows as the result of feeding rations with CSM Only about 3 of the respondents mentioned problems with either dairy heifers or dry cows The number one problem reported was gossypol toxicity primarily in creep feeds and complete rations (Table 72) Both palatability and poor performance problems for various feed types were also frequently mentioned Again however the low number of respondents indicating problems of any type suggests that the problems reported were likely isolated cases
Details on Dairy Cattle Feed Formulations Containing Whole Cottonseed
Over 75 of dairy cattle respondents formulate feeds using whole fuzzy cottonseed a much higher percentage than was the case for beef cattle Less than half of the dairy cattle respondents however utilize delinted cottonseed in their feeds more in line with the beef cattle results (Table 73) Less than half the respondents formulate rations that include both CSM and whole cottonseed (Table 74) For those who formulate rations that include both the mix of the two in the rations varies widely Respondents reported that the share of such rations accounted for by CSM ranged from 1 to 30 with a mean of 85 (Table 75) The share of those rations accounted for by whole cottonseed ranged from 3 to 100 with a mean of 16 (Table 76) It appears therefore that on average dairy feeds formulated with both CSM and whole cottonseed contain a higher percentage of whole cottonseed than of CSM This is just the opposite of the situation for beef cattle
Sources of Information Utilized on Formulating Dairy Cattle Feeds
Over 80 of the dairy cattle respondents indicated that they were familiar with research on feeding CSM to mature dairy cattle (Table 71) Only half however indicated familiarity with such research for pre-ruminant calves Less than 10 of the respondents listed any other research on feeding CSM to other types of dairy cattle (Table 78) The largest number of respondents (137 of 143 respondents) indicated that they utilize university research to obtain information on formulating feeds for dairy cattle followed by industry publications of some type (121 respondents) and university extension service (83 respondents) (Table 79) Only 36 respondents listed other sources of information including primarily personal experience and research (Table 80)
Protein-Related Factors Considered for Balancing Dairy Cattle Rations
Nearly 100 of the dairy cattle respondents indicated that both crude protein level and rumen degradability are factors they consider when balancing rations for dairy cattle a much higher level than is the case for beef cattle (Table 81) Less than half consider amino acid values (61 of 143 respondents) Only 19 respondents indicated that they consider other factors like protein solubility (Table 82)
Dairy cattle respondents indicated a even wider range of escape values (or by-pass values) that they are using for CSM than did beef cattle respondents from 0 to over 80 (Table 83) The mean escape value calculated from the responses is 40 Dairy cattle respondents indicated slightly more
14
confidence in the escape values they are using than was the case for beef (Table 84) Only 22 respondents however considered those escape values to be reliable or extremely reliable The principal single method or source used by respondents for the escape value they use was again the National Research Council (Committee on Animal Nutrition National Academy of Sciences) (Table 85) Book values was the next most frequently mentioned single source of CSM escape values (23) Finally nearly 100 of the respondents indicated an interest in obtaining information on escape values for CSM as processed by different methods (Table 86) The conclusion from the dairy cattle responses is the same as for beef cattle That is there appears to be a lack of reliable information on CSM escape values in the perception of dairy cattle feed formulators and that they are highly interested in obtaining more information in this regard
Gossypol Level Considered Safe for Mature Dairy Cattle and Pre-Ruminant Calves
Dairy cattle respondents appear to have little idea of what the safe levels are for gossypol in mature dairy cattle and pre-ruminant calf feeds First of all only one-third of those who returned surveys even attempted to provide numbers for safe gossypol levels (Tables 87 and 88) Many respondents simply wrote comments such as dont know or not aware of research on safe gossypol level in the margin of the survey beside the question Second those who attempted to answer the questions provided an amazingly wide range of safe gossypol levels from 0 parts per million (ppm) to 7500 ppm for mature dairy cattle and from 0 ppm to 1000 ppm for pre-ruminant calves The mean safe gossypol levels were 609 ppm for mature dairy cattle and 121 ppm for pre-ruminant calves The responses were spread quite evenly between the extremes around the means It should be noted that the research team checked and rechecked the data set for this question to insure there were no errors in data entry
Suggestions for Improving the Usefulness of Cottonseed Meal
Only about 22 of the dairy cattle feed formulators that returned surveys provided suggestions that might improve the value or usefulness of CSM in dairy cattle feed rations (Table 89) Some of the more frequent suggestions dealt with improving the consistency and availability of CSM Several respondents suggested the need for more information on gossypol a worthy suggestion given the results of the previous question
Poultry
The perceptions of poultry feed formulator respondents concerning the use of cottonseed meal differ importantly in many respects from the combined responses over all survey respondents and from those of beef and dairy cattle Many of the differences are likely the result of the distinct dietary needs of ruminant as opposed to non-ruminant animals The salient differences in responses by poultry feed formulators in the 6 general question areas include the following
bull Factors affecting choice of dietary proteins Surprisingly there was little difference in the responses of those indicating that they formulate feed for poultry than for the combined results (or for beef and dairy cattle) regarding the importance of the listed factors (quality price availability consistency and other) affecting the choice of dietary protein (Table 90) A large majority of poultry feed formulators ranked all factors as either important or extremely important The only exception is that consistency was ranked slightly less important by poultry respondents than by respondents in general
bull Cottonseed meal as an alternative protein feed Poultry respondents ranked more protein feeds as higher on the superior-to-CSM scale than was the case for the combined responses
15
(Table 91) In fact the mean rank of all but three of the protein feeds were all at least somewhat higher than was the case for the combined responses The mean rank of several of the other protein feeds as determined by the poultry respondents was much higher than for the combined responses including fish meal poultry by-product meal and soybean meal Poultry by-product meal changed from an inferior to a superior protein feed compared to CSM The protein feed judged by poultry respondents to be most superior to CSM for poultry rations was soybean meal while urea was ranked as most inferior Poultry respondents also appeared to have stronger opinions about whether or not CSM is an alternative to the other listed protein feeds than was the case for the combined responses They overwhelmingly perceived that CSM is not an alternative to many of the other protein feeds including fish meal dried skim milk dried whole milk poultry by-product meal blood meal tankage and urea A larger percentage of poultry respondents than was the case for dairy and beef cattle perceived however that CSM is a definite alternative to many other protein feeds including safflower meal sunflower meal linseed meal peanut meal canola meal feather meal distillers dried grains brewers dried grains and even soybean meal
bull The importance of nutritional and non-nutritional factors Poultry respondents ranked all but two of the listed nutrition-related factors as more important in the choice of CSM over alternative protein feeds for poultry rations than was the case for the combined responses on average (Le comparing mean responses) (Table 92) The highest percentage of poultry respondents ranked gossypol level (62 of the respondents) amino acid balance (59) aflatoxin (58) protein quality (57) and amino acid availability (57) as extremely important in the choice of CSM over alternative protein feeds Only about 5 of the respondents listed other important nutrition-related factors (Table 93) There are few differences however in the poultry responses as compared to the combined responses regarding the importance of non-nutrition-related factors (Table 94) The major difference is a much lower ranking of the importance of palatability in choosing CSM over alternative protein feeds Also a somewhat higher percentage of poultry respondents ranked price as an extremely important non-nutrition-related factor Few other non-nutrition-related factors were listed by the respondents (Table 95)
bull Seasonality of cottonseed meal availability The results for the poultry respondents regarding the months of the year when CSM is not available are highly consistent with those for the combined responses and those for the beef and dairy cattle responses Poultry respondents indicated that May through September are the months of least availability of CSM (Table 96) But likely because of the shorter production cycle for poultry than for cattle poultry respondents indicated that CSM needs to be available in almost every month (but slightly less so in August and September) for CSM to compete effectively with alternative protein feeds (Table 97) For poultry therefore the indication is that poultry feed formulators may perceive an availability problem which inhibits greater use of CSM in poultry rations to some extent
bull Reasons for the selection and non-selection of cottonseed meal Again price and availability are the number one and number two reasons respectively cited by poultry respondents for which CSM is selected as a feed ingredient (Table 98) Protein quality ranked third on their list followed closely by phosphorous content The top reason that CSM is not selected according to the poultry respondents was pricevalue (Table 99) About tied for second place were gossypol content and availability More respondents ranked availability as the second reason than for gossypol content but more respondents listed gossypol first The amino acid level was listed as a distant fourth reason for which CSM is not selected as a feed ingredient Price is again the key CSM characteristic that poultry respondents indicated must change in
16
order for CSM to be used more frequently in poultry rations (Table 100) Gossypol was clearly considered to be the second most important characteristic that must change Availability was ranked as either first or second by all respondents who listed it as a characteristic that must change
bull Source of chemical analyses for cottonseed meal The results for the chemical analyses performed by poultry respondents are similar to those of both the combined results and those of the beef and dairy cattle results The primary analysis routinely performed by the poultry respondents is crude protein (51 of 55 respondents) followed by fat (40 respondents) fiber (37 respondents) and aflatoxin (31 respondents) (Tables 101 and 102) The primary analytical values supplied to the poultry respondents also included crude protein fiber and fat (Table 103) A third of the poultry respondents indicated that their CSM supplier does not provide them with any analytical values Once again even though aflatoxin was ranked as an extremely important nutrition-related factor in the choice of CSM as a feed component only I respondent obtains an analytical value for aflatoxin from his CSM supplier and only a little over half routinely perform their own aflatoxin analyses
Poultry sample members were asked some specific questions regarding the use of CSM in poultry feed formulations in 5 general areas I) problems resulting from feeding a ration with CSM to the various poultry types 2) specific information on several key nutrition-related factors affecting the use of CSM in poultry rations 3) sources of information utilized on formulating poultry feeds 4) CSM price and value and 5) an open-ended question soliciting suggestions to improve the usefulness or value of CSM for poultry feed formulations
Problems from Feeding CSM Rations to Poultry
The majority of poultry respondents indicated no knowledge of any problems associated with feeding a ration containing CSM to poultry (Table 104) Only 14 of the respondents indicated problems with broilers less than 7 for breeding flocks and about 3 for turkeys Over a third however indicated that they had knowledge of such problems with layers The number one problem reported was yolk molting and discoloration primarily in layer rations (Table 105) A few respondents indicated problems with depressed growth associated with broiler feeds containing CSM
Information on Key Nutrition-Related Factors for Poultry Rations
The survey sample members were asked to respond to a number of specific questions related to nutritional factors that affect the use of CSM in poultry rations including protein energy fat gossypol and synthetic amino acids They were then asked to indicate their perception of the overall feeding value of a standard 41 protein CSM compared to that of a standard 44 protein soybean meal The questions were designed primarily to determine the extent of knowledge among feed formulators concerning these factors as they relate to the use of CSM and the relative feeding value of CSM
Sample members were asked to respond to two questions regarding protein in poultry feed rations They were first asked to indicate the specific protein-related factors that they consider when balancing rations for poultry They were given a list of three factors (crude protein level amino acid content and amino acid availability) They were also allowed to specify any other protein-related factors they consider when balancing poultry rations They were then asked to indicate the crude protein levels they would prefer for cottonseed meal and were given a choice of four levels (3641 (standard) 44 and 48) and allowed to suggest any other preference for crude protein level
17
Almost all poultry respondents indicated that they consider amino acid content and availability when balancing feed rations with fewer responding that they consider the crude protein level (Table 106) Other protein-related factors listed by the respondents included amino acid balance protein digestibility and energy levels (Table 107) With regard to preferred crude protein level for CSM over half of the poultry respondents indicated a preference for 48 crude protein (Table 108) About 27 of the respondents were satisfied with the standard 41 level and 20 indicated a preference for a 44 protein CSM No respondents preferred anything less than the standard 41
With respect to energy levels the sample members were asked to indicate what they considered to be the normal maximum and minimum energy levels for protein feeds for broilers layers turkeys and breeding flock As Table 109 indicates the responses varied widely with little or no indication of a mode (most frequent response) in most cases For broilers the maximum (in K Cals DE per pound) ranged from 0 to 1800 and the minimum from 850 to 1700 with a mean maximum of 1436 and a mean minimum of 1276 For layers the maximum (in K Cals DE per pound) ranged from 1000 to 1800 and the minimum from 800 to 1500 with a mean maximum of 1347 and a mean minimum of 1187 For turkeys the maximum (in K Cals DE per pound) ranged from 1100 to 1725 and the minimum from 850 to 1700 with a mean maximum of 1334 and a mean minimum of 1261 For breeding flocks the maximum (in K Cals DE per pound) ranged from 1000 to 1600 and the minimum from 750 to 1600 with a mean maximum of 1328 and a mean minimum of 1159 Given the disparity in the responses it seems clear that there is little common concept of the normal maximum and minimum energy levels for protein feeds
Sample members similarly were asked to indicate the minimum and maximum fat levels they considered critical for protein feeds Although the range of responses was still quite wide there appeared to be more uniformity in responses to this question than the one for energy (Table 110) The maximum fat levels (ether extract as fed basis) indicated by the respondents ranged from 1 to 15 or 20 for most poultry types The minimums ranged from 0 to 15 The mean minimum levels of fat for all poultry types was about 3 The mean maximum ranged from 6 to 82 depending on the poultry type
Sample members were asked to indicate the level of gossypol they considered safe for poultry rations The responses again varied widely from a low of 0 ppm up to a high of 300 ppm for all poultry types (Table III) The highest mean level of gossypol as calculated from the responses to the question were 104 ppm for broilers and 91 ppm for turkeys For layers and breeding flocks the mean levels were much lower at 57 ppm and 54 ppm respectively
The questionnaire also asked the sample members to indicate if they use or would use synthetic amino acids where economical The response was that nearly 100 of all poultry respondents indicated that they have or would use synthetic amino acids in this situation (Table 112) This suggests little real aversion on the part of feed formulators to utilize synthetic amino acids in least cost poultry formulations
To obtain some insight on the general perception of poultry formulators regarding CSM the sample members were asked to indicate the overall feeding value of a standard 41 protein CSM compared to that of a standard 44 protein soybean meal in their opinion on percentage basis They were given the choice of 5 ranges from under 70 to over 100 in 10 increments (see Table 113 for the actual ranges used) Nearly 80 of the respondents indicated that CSM has an overall feeding value of under 90 of that of soybean meal Given the five choices offered to respondents the mean feeding value was around 80
18
Sources of Information Utilized on Formulating Poultry Feeds
About two-thirds of the poultry respondents indicated that they were familiar with research on feeding CSM to broilers and layers (Table 114) Only half however indicated familiarity with such research for turkeys and only a little over a third for breeding flocks Less than 10 of the respondents listed any other research on feeding CSM to other types of poultry (Table 115) To obtain information on formulating feeds for poultry the largest number of respondents (52 of the 55 respondents) indicated that they utilize university research followed by industry publications of some type (45 respondents) university extension services (26 respondents) and government agencies (20 respondents) (Table 116) Only 17 respondents listed other sources of information including primarily personal experience and research (Table 117)
Cottonseed Meal Price and Value
To get some idea concerning the poultry respondents perceptions of the value of CSM particularly with respect to soybean meal sample members were asked 1) if they would be willing to pay a premium per unit of protein for CSM with more than a standard 41 protein and 2) if gossypol and fiber were sufficiently low on average what percent of the cost of soybean meal they would be willing to pay for CSM
With respect to the first question only about half the respondents indicated a willingness to pay a premium for a CSM with more than 41 protein despite the fact that 75 of them indicated earlier that they would prefer a CSM with a higher crude protein level (Table 118) Thus at least 25 of the respondents prefer a higher protein level CSM but would not be willing to pay a premium to get it
In response to the second question poultry respondents indicated that they would only be willing to pay an average of about 76 of the cost of soybean meal for a CSM with a sufficiently low level of gossypol and fiber (Table 119) The range around that average however was fairly large from 50 to 95 Because CSM has traded at about 91 of the value of soybean meal on the market on a protein equivalent basis and about 85 on an unadjusted basis on average in each year since 1984 either poultry respondents are currently unaware of the historical CSM to soybean meal price relationship or they are indicating that the current CSM market price relative to that of soybean meal is substantially above the levels that most find acceptable
Suggestions for Improving the Usefulness of Cottonseed Meal
Only about 27 of the poultry feed formulators that returned surveys provided suggestions that might improve the value or usefulness of CSM in poultry feed rations (Table 120) Some of the more frequent suggestions included the need for more information on the use of CSM in poultry rations increased availability of CSM and nutrient guarantees
Catfish
The perceptions of catfish feed formulator respondents concerning the use of cottonseed meal correspond closely to those of the poultry respondents likely because of the similar dietary needs of non-ruminant animals The salient differences in responses by catfish feed formulators in the 6 general question areas included on this section of the surveys include the following
bull Factors affecting choice of dietary proteins There were no differences in the responses of those indicating that they formulate feed for catfish than for poultry regarding the importance
19
of the listed factors (quality price availability consistency and other) affecting the choice of dietary protein (Table 121) A large majority of catfish respondents ranked all factors as either important or extremely important as did poultry respondents
bull Cottonseed meal as an alternative protein feed As was the case for poultry catfish respondents ranked more protein feeds as higher on the superior-to-CSM scale than was the case for the combined responses (Table 122) Catfish feeders however ranked meat and bone meal and blood meal as even more superior to CSM than did poultry respondents The protein feeds that catfish respondents ranked as roughly similar to CSM included tankage feather meal peanut meal linseed meal corn gluten meal brewers dried grains distillers dried grains sunflower meal safflower meal and canola meal Catfish respondents also appeared to have nearly as strong views about whether or not CSM is an alternative to the other listed protein feeds as did poultry respondents They perceived that CSM is not an alternative to many of the other protein feeds including blood meal dried whole milk meat and bone meal and dried skim milk Catfish respondents also perceived however that CSM is a definite alternative to many other protein feeds including safflower meal canola meal peanut meal sunflower meal linseed meal distillers dried grains brewers dried grains tankage soybean meal wheat middlings corn gluten meal urea and feather meal
bull The importance of nutritional and non-nutritional factors The responses for catfish with regard to the importance of nutrition-related and non-nutrition-related factors in choosing CSM as a component of catfish feeds were roughly similar to those for poultry (Table 123) The salient differences were that a larger percentage of catfish respondents ranked energy level fat level and fiber level as important or extremely important and a much larger percentage ranked aflatoxin as extremely important One major difference of the catfish responses regarding the importance of non-nutrition-related factors from those of poultry is that palatability is much mOre of a concern to catfish feeders (Table 124) Bin space is less important to catfish respondents and service from the CSM industry is more important to them
bull Seasonality of cottonseed meal availability The results for the catfish respondents regarding the months of the year when CSM is not available were generally consistent with those for poultry except that May and June were perceived as less problematic for obtaining CSM supplies by the catfish respondents (Table 125) Catfish formulators perceive that CSM needs to be more available in April through October than during the rest of the year to be competitive with other protein feeds (Table 126) This suggests the perception on the part of catfish feed formulators of a CSM availability problem during about the first half of any given year
bull Reasons for the selection and non-selection of cottonseed meal Pricevalue is the number one reason cited by catfish respondents for which CSM is selected as a feed ingredient followed by protein quality and palatability (Table 127) The top reason that CSM is not selected according to the catfish respondents is pricevalue followed by quality and gossypol level (Table 128) Gossypol level is the key CSM characteristic that catfish respondents indicated must change in order for CSM to be used more frequently in catfish rations (Table 129) Quality was clearly considered to be the second most important characteristic that must change followed by aflatoxin level This is the only animal species for which price was not the number one characteristic cited that would have to change and was not even listed among the top three responses The implication is that catfish feed formulators may not consider the price of cottonseed meal to be out of line with their needs and thus do not consider price to be a particular problem for the use of CSM in catfish rations A word of caution is in order
20
to avoid taking this conclusion too far because of the relatively few number of catfish feed formulators in the sample
bull Source of chemical analyses for cottonseed meal The results for the chemical analyses performed by poultry respondents are similar to those of poultry as well as those of both the combined results and the beef and dairy cattle results The primary analysis routinely performed by the catfish respondents is crude protein followed by fat fiber aflatoxin and gossypol (Tables 130 and 131) The primary analytical values supplied to the catfish respondents also included crude protein fiber and fat (Table 132) Only 2 of the II catfish respondents indicated that their CSM supplier does not provide them with any analytical values Even though gossypol was ranked as an extremely important nutrition-related factor in the choice of CSM as a feed component and the number one CSM characteristic that needs to change only 5 of the II respondents routinely perform gossypol analyses None of catfish respondents obtain analytical values for aflatoxin from their CSM supplier
As for poultry catfish sample members were asked some specific Questions regarding the use of CSM in catfish feed formulations in 5 general areas 1) problems resulting from feeding a ration with CSM to the various catfish types 2) specific information on several key nutrition-related factors affecting the use of CSM in catfish rations 3) sources of information utilized on formulating catfish feeds 4) CSM price and value and 5) an open-ended Question soliciting suggestions to improve the usefulness or value of CSM for catfish feed formulations
Problems from Feeding CSM Rations to Catfish
Absolutely no catfish respondents indicated any knowledge of any problems associated with feeding a ration containing CSM to catfish (Table 133)
Information on Key Nutrition-Related Factors for Catfish Rations
As for poultry the survey sample members were asked to respond to a number of specific Questions related to nutritional factors that affect the use of CSM in catfish rations including protein energy fat gossypol and synthetic amino acids They were then asked to indicate their perception of the overall feeding value of a standard 41 protein CSM compared to that of a standard 44 protein soybean meal Just as for poultry these Questions were designed primarily to determine the extent of knowledge among catfish feed formulators concerning these factors as they relate to the use of CSM and the relative feeding value of CSM
Sample members were asked to respond to two Questions regarding protein in catfish feed rations They were first asked to indicate the specific protein-related factors that they consider when balancing rations for catfish They were given the same list of three factors (crude protein level amino acid content and amino acid availability) to choose from that the poultry sample members were given Again they were also allowed to specify any other protein-related factors they consider when balancing catfish rations They were then asked to indicate the crude protein levels they would prefer for CSM and were given the same choice of four levels as the poultry sample members (36 41 (standard) 44 and 48) and allowed to suggest any other preference for crude protein level In contrast to poultry the largest percentage of catfish respondents indicated that they consider amino acid availability (10 of the 11 catfish respondents) rather than the content when balancing catfish rations (Table 134) The second largest percentage consider crude protein level (9 respondents) also a different result from poultry
21
With regard to the crude protein level for CSM preferred by catfish respondents about 43 indicated a preference for 48 crude protein (Table 135) About 20 of the respondents were satisfied with the standard 41 level and nearly 30 indicated a preference for a 44 protein CSM No respondents preferred anything less than the standard 41 The mean preferred crude protein level was about 42
With respect to energy levels the catfish sample members were asked to indicate what they considered to be the normal maximum and minimum energy levels for protein feeds for fingerlings grow out stock brood stock and fries Despite the low number of catfish respondents the answers to this question were widely divergent (Table 136) For fingerlings the maximum (in K Cals DE per pound) ranged from 1250 to 1800 and the minimum from 2 to 1500 with a mean maximum of 1525 and a mean minimum of 834 For grow out stock the maximum (in K Cals DE per pound) ranged from only 1500 to 1600 and the minimum from 1 to 1300 with a mean maximum of 1550 and a mean minimum of 750 For catfish brood stock the maximum (in K Cals DE per pound) ranged from 1300 to 1700 and the minimum from 1200 to 1400 with a mean maximum of 1500 and a mean minimum of 1300 For fries the maximum (in K Cals DE per pound) ranged from 1250 to 1800 and the minimum from 900 to 1500 with a mean maximum of 1525 and a mean minimum of 1200 Given the disparity in these responses it seems clear again for catfish feed formulators that there is little common concept of the normal maximum and minimum energy levels for protein feeds
Catfish sample members similarly were asked to indicate the minimum and maximum fat levels they considered critical for protein feeds As with poultry the range of responses was still quite wide but there also appeared to be more uniformity in responses to this question than the one for energy level (Table 137) The maximum fat levels (ether extract as fed basis) indicated by the respondents again ranged from 1 to 15 for most catfish types as was the case for poultry The mean minimum levels of fat for all catfish types ranged from about 3 to 5 The mean maximum ranged from 6 to 10 aCrOSS the different catfish types
Catfish sample members were also asked to indicate the level of gossypol they considered safe for catfish rations The responses again varied widely from a low of 0 ppm up to a high of 300 ppm for some catfish types (Table 138) The two highest mean safe levels of gossypol were 97 ppm for grow out stock and 83 ppm for brood stock For fingerlings and fries the safe maximum mean levels were much lower at 44 ppm and 23 ppm respectively
The questionnaire also asked the sample members to indicate if they use or would use synthetic amino acids where economical The response was that 83 (all but 2) of the catfish respondents indicated that they have or would use synthetic amino acids in this situation (Table 139) This suggests little real aversion on the part of feed formulators to utilize synthetic amino acids in least cost catfish formulations
To obtain some insight on the general perception of catfish formulators regarding CSM the sample members were asked to indicate their opinion of the overall feeding value of a standard 41 protein CSM compared to that of a standard 44 protein soybean meal expressed on a percentage basis They were given a choice of 5 ranges from under 70 of the feeding value of soybean meal to over 100 in 10 increments (see Table 140 for the actual ranges used) All but one of the catfish respondents indicated that CSM has an overall feeding value of under 90 of that of soybean meal Given the five choices offered to respondents the mean feeding value of CSM relative to that of soybean meal was around 80
22
Sources of Information UtiJized on Formulating Catfish Feeds
Only about half of the catfish respondents indicated that they were familiar with research on feeding CSM to grow out stock and only a third were familiar with research on fingerlings (Table 141) Only 2 respondents were familiar with any research on feeding CSM to brood stock and fries To obtain information on formulating feeds for catfish the largest number of respondents indicated that they utilize university research and industry publications of some type (Table 142)
Cottonseed Meal Price and Value
Catfish sample members were also asked two Questions to get some idea concerning their perception of the value of CSM particularly with respect to soybean meal 1) if they would be willing to pay a premium per unit of protein for CSM with more than a standard 41 protein and 2) if gossypol and fiber were sufficiently low on average what percent of the cost of soybean meal would they be willing to pay for CSM
With respect to the first Question 75 of the catfish respondents indicated a willingness to pay a premium for a CSM with more than 41 protein which is consistent with their earlier responses that they would prefer a CSM with a higher crude protein level (Table 143)
In response to the second Question catfish respondents indicated that they would only be willing to pay an average of about 82 of the cost of soybean meal for a CSM with a sufficiently low level of gossypol and fiber (Table 144) The range around that average was more narrow than for poultry from 70 to 100 This is more consistent with the ratio of CSM price to soybean meal price that has existed over the last 7 or 8 years on average
Suggestions for Improving the Usefulness of Cottonseed Meal
Only three catfish respondents offered suggestions for improving the usefulness or value of CSM for catfish rations The three suggestions included I) providing a more consistent product in price and Quality 2) providing a premium Quality toxin-free high protein low-fat product superior to soybean meal and 3) eliminating the CHO fraction (Table 145)
Comparisons Among Animal Species
In order to highlight the salient differences in responses with respect to the various animal species the mean responses to Questions that are common among all surveys regarding CSM use as a feed ingredient were compared and analyzed An analysis of variance (ANOY A) was also done to detect statistically significant differences in the mean responses to each Question by animal specie Comparisons are made among the mean responses to all Questions in the 6 general areas to which all sample members were asked to respond regardless of the animal specie(s) for which they formulate feeds 1) the particular factors affecting their choice of dietary proteins for formulated feeds 2) the extent to which CSM is considered to be an alternative to selected protein feeds 3) the importance of nutritional and non-nutritional factors in their decisions to use CSM rather than alternative dietary proteins in their feed formulations 4) the seasonality of CSM availability 5) the specific reasons for the selection and non-selection of CSM for use in the feeds they formulate and 6) the source of CSM chemical analyses used by the respondents Where appropriate ANOY A results are also indicated
23
Factors Affecting Choice of Dietary Proteins
As discussed earlier all members of the final sample regardless of the animal species for which they formulate feeds were asked to rank the importance of four general factors in their choice of a dietary protein for their feed formulations on a scale of I to 7 (from extremely unimportant to extremely important respectively) 1) quality 2) price 3) availability and 4) consistency Comparing the results across animal types reveals few significant differences in the importance attached to any of the four factors by the responding formulators of the various animal specie feeds (ie comparing results horizontally in Table 146) But as pointed out in an earlier section the mean rankings for quality are all higher than those for the other factors while the mean rankings of price are all lower than those for most other factors across all animal types In other words the respondents consistently ranked quality highest on the scale of importance followed in order by consistency availability and price
Cottonseed Meal As An Alternative Protein Feed
Recall that the sample members were asked to rank various selected protein feeds on a scale of 1 to 7 as inferior or superior to CSM in an overall sense for use in feed formulations A second question required respondents to indicate whether or not they considered CSM to be an alternative to each of the 20 listed protein feeds A comparison of the mean ran kings and ANOV A results across animal types indicates substantial agreement among the respondents regarding the ranking of CSM as an alternative to some animal feeds and substantial disagreement with respect to CSM as an alternative to many others (Table 147) Respondents over all animal types tended to agree that certain feeds and in particular the higher crude-protein-content feeds are clearly superior to CSM including dried skim milk meat and bone meal fish meal blood meal soybean meal dried whole milk and corn gluten feed There was a statistically different deviation in the extent to which respondents for some animal species regarded those meals as superior however For example catfish respondents ranked meat and bone meal fish meal poultry by-products blood meal soybean meal and corn gluten meal higher than did respondents for the ruminant animals The same was roughly the case for poultry Beef and dairy cattle respondents tended to rank all other protein feeds as less superior (ie more inferior) to CSM There was also substantial agreement that CSM was about the same as tankage peanut meal linseed meal and brewers and distillers dried grains but superior to some extent over the other feeds particularly those lower in crude protein including dehydrated alfalfa sunflower meal wheat middlings safflower meal canola meal feather meal and urea Beef and dairy cattle respondents agreed that CSM can be considered an alternative to nearly all the protein feeds except perhaps skim and whole dried milk Poultry and catfish respondents indicated CSM is an alternative to fewer of the other protein feeds
The Importance of Nutritional and Non-Nutritional Factors
Respondents also ranked the importance of specific nutrition-related and non-nutritionshyrelated factors in choosing cottonseed meal as a component of the feeds they formulate on a scale of extremely unimportant to extremely important (a scale of I to 7 respectively) Comparing the mean rankings by the respondents reveals that poultry and catfish feed formulators clearly consider proteinshyrelated factors and gossypol level to be more important than do beef and dairy feed formulators (Table 148) Fiber level is also of more importance to formulators of catfish feed Interestingly the importance of fiber was not ranked significantly higher by poultry feed formulators than by beef and dairy cattle feed formulators At the same time aflatoxin was clearly ranked by all respondents as the most important factor affecting the choice of CSM as a feed ingredient irrespective of the animal specie for which the ration is intended
24
For the non-nutritional factors an analysis of the mean rankings indicates few significant differences in the responses across animal species with respect to each individual factor listed (Table 149) The most notable exception is that poultry respondents ranked palatability significantly less important than did any of the other respondents for the other animal species Finally catfish respondents perceived that service by the CSM industry was more important for them than did the respondents for the other animal species
Seasonality of Cottonseed Meal Availability
The respondents across all animal species indicated that CSM is least available between about May and October likely reflecting the increasing shortages of cottonseed meal supply just prior to the cotton harvest in the fall (Figure 20) At the same time however the beef cattle dairy cattle and poultry respondents all indicated that there is less need for CSM to be available during approximately those same months in order to compete effectively with other protein feeds (Figure 21) This suggest that the seasonality of supply may not represent an important constraint to competitiveness and growth possibilities of CSM as a feed ingredient Interestingly catfish respondents suggested a largely inverse pattern of the times of the year when CSM needs to be available to compete effectively with other protein feeds as a catfish feed ingredient Possible explanations of this phenomenon include I) the protein feed needs of catfish feed formulators peak in the late spring and summer months when supply is less available 2) catfish feed formulators are located such that CSM is not easily obtainable particularly during short supply years or 3) formulators of feed for other animal species have longer experience in using CSM and have adjusted their formulation to the pattern of CSM supply availability In any case it should be remembered that there are relatively few catfish feed formulators in the sample so that their joint responses may not be truly representative of all catfish feed formulators In this case this difference in their responses may mean little
Reasons for the Selection and Non-Selection of Cottonseed Meal
Respondents across animal species were quite consistent in their ranking of the top reasons that CSM is included in feed formulations (Table 150) They overwhelmingly ranked price as the top reason followed generally by availability and protein quality Catfish respondents differed somewhat from that order ranking protein quality second and palatability as third Availability was ranked fourth by catfish respondents The top reason all respondents listed for which CSM is not included in feed formulations was also price (Table lSI) Beef and cattle respondents ranked availability as second but poultry respondents ranked gossypol second while catfish respondents ranked protein quality second A vailability ranked only as the third reason that CSM is not selected by poultry respondents and fourth by catfish respondents Gossypol ranked either third or fourth for all animal species except poultry for which gossypol appears to be a more important reason for not including CSM in poultry feed formulations The question regarding the characteristics of CSM that would have to change in order for it to be selected more frequently as a feed ingredient elicited about the same responses as those for the previous question concerning why CSM is not included in feed formulations (Table 152) The top characteristic that would have to change in the opinion of most respondents is price Catfish respondents however listed price extremely low on their list suggesting that other factors are more of a constraint to CSM use in their opinion They ranked gossypol as the number one characteristic that would have to change Availability appeared to be more of a concern to beef and dairy feed formulators than for poultry and catfish formulators
25
Source of Chemical Analyses for Cottonseed Meal
About the same percentage of respondents across animal species perform analytical tests for aflatoxin crude protein fat fiber and gossypol (Figure 22) The only noticeable differences were for aflatoxin and gossypol for which about half the percentage of dairy and beef respondents compared to catfish respondents reported that they routinely perform tests A higher percentage of poultry respondents also appear to perform tests for aflatoxin and gossypol than is the case for beef or cattle respondents Crude protein is tested for by the highest percentage of respondents for all animal species while gossypol is tested for by the smallest percentage of all respondent groups except catfish CSM suppliers are more likely to provide feed formulators with analytical values for crude protein fat and fiber than for aflatoxin or gossypol (Figure 23) A sizeable percentage of the respondents across all animal types reported that their CSM supplier provides no analytical values whatsoever
Summary ofMajor Findings
Of the reams of information normally provided by a study like this relatively little is usually new or profound And of what can be found that appears important only some is little more than interesting or particularly useful Before turning to a discussion of the implications of the study results the major findings across animal groups are briefly summarized first Sifting through the many tables figures and data sets the main findings of the study appear to be the following
bull Quality is the most important factor affecting the choice of dietary proteins by feed formulators followed by consistency and availability Price is the least important of the four factors in making general decisions regarding dietary proteins for animal diets
bull Once feed formulators have set the general parameters for use of dietary proteins in their formulations however price is the most important factor determining the choice among alternative dietary proteins to satisfy the general parameters for dietary protein use in feed formulations
bull When considering whether or not to use CSM as the dietary protein in feeds the nutritional factors of most concern to formulators of feed for non-ruminant animals (poultry and catfish) appear to be protein-related For formulators of ruminant (beef and dairy cattle) feeds aflatoxin level and rumen degradability are the most important nutritional factors
bull The most important non-nutritional factors affecting feed formulators decisions regarding whether or not to use CSM are I) price 2) availability 3) consistent quality and 4) palatability in that order
bull Non-nutritional factors are more important than nutritional factors in the choice of CSM over alternative feeds to fill the dietary protein requirements of feed formulations In general price and availability were ranked above protein quality and other nutrition-related factors as reasons why CSM is and is not chosen as a feed ingredient over alternatives Price and availability were also cited as the characteristics that most need to change in order for CSM to be selected as a feed ingredient more frequently
bull CSM is generally considered to be inferior to higher protein feedstuffs and superior to lower protein feedstuffs This generalization however does not hold for all feeds and all animal types Formulators of ruminant animal feeds ranked many of the higher protein feeds more on a par with CSM than did formulators of non-ruminant animal feeds
26
bull The seasonality of CSM availability is both a positive and a negative factor affecting the use of CSM rather than alternative protein feeds in animal feed rations That is CSM is obviously more likely to be selected as a feed ingredient during months of greater availability than during the months of lower availability In general however the survey responses indicate that CSM is normally available when feed formulators perceive that it needs to be available One word of caution It may be that a higher percentage of CSM users agreed to participate in this survey than those who are currently not using CSM Those who are current CSM users may well have already adjusted their feed purchasing patterns and operations to reflect the seasonal changes in the availability of CSM Consequently current CSM users may perceive less of an availability problem than those who are not currently using CSM In this case the responses to these questions may not be truly representative of the perception of the availability of CSM by feed formulators in general
bull There is a tremendous disparity in the perception of respondents as to the appropriate levels of several key nutrition-related factors for specific livestock rations including energy levels fat levels gossypol levels and escape values (ruminants only) for cottonseed meal For each animal specie the range of variation in the perceived acceptable levels of each of these factors was extremely wide The obvious conclusion is that feed formulators generally lack adequate and reliable information on many factors which are crucial in efficient feed formulation and which have a significant impact on the choice of CSM as a feed ingredient
PROBLEMS AND OPPORTUNITIES FOR EXPANDING COTTONSEED MEAL USE
CSM is somewhat unique among vegetable protein meals in that it is the product of a byshyproduct The volume of the by-product cottonseed available for crushing and the potential supply of CSM depend more on the dynamics of cotton supply and demand than on forces specific to CSM markets This mean that market signals from feed formulators and livestock feeders regarding desired values and characteristics of protein meals likely have little impact on the potential CSM market supply
Since the mid-1970s the share of the annual production of cottonseed fed directly to ruminant livestock has increased steadily from about 5 in 1974 to nearly 40 in 1990 (Figure 24) The consequence has been a marked decline both in the share of the available supply of cottonseed that is crushed and in the ratio of actual to potential cottonseed meal output An increase in the demand for CSM therefore will either bid up the market price of CSM with no additional volume actually used or increase the cottonseed crush to feed use ratio (or some combination thereof) There will be little or no effect on the total amount of cottonseed available
The intent of efforts to expand the market for any commodity is to effect an increase in sales at a higher price For a commodity with a relatively fixed supply the major result of an expansion in demand is solely an increase in price because supply cannot increase to allow an increase in use For a commodity with an unlimited supply successful market expansion efforts simply increase use to the extent of the promotion with no increase in price For a commodity with a supply somewhere in between those two extremes successful market expansion will increase both the price and quantity used Although the situation for cottonseed meal is closer to the fixed supply end of the spectrum market expansion efforts can increase the use of cottonseed meal through an increase in the crush-toshy
27
feed cottonseed use ratio This ratio will increase as the profitability of crushing vs alternative uses of the seed increase
The results of this survey however indicate both some problems and possible opportunities for expanding cottonseed meal use After briefly summarizing the major obstacles as identified in the study the major opportunities for expanding use of cottonseed meal will be discussed
Problems for Expanding Cottonseed Meal Use
The major problems for expanding CSM use are generally well known and verified by the survey results The major problems that would hinder efforts to expand cottonseed meal use identified in the study included primarily the following
bull Price and availability of CSM are the major factors affecting the selection or non-selection of CSM as an ingredient of feed formulations regardless of animal specie These nonshynutritional factors were judged to be more important than nutritional factors in selecting CSM as a feed ingredient Unfortunately neither the price nor the availability of CSM can be controlled or altered substantially or directly by market expansion efforts Some efforts to improve availability may be possible as discussed in the next section
bull CSM is perceived to be inferior in an overall sense to a number of key protein feeds CSM was judged by the survey respondents to be clearly superior in aggregate to only 5 of 20 potential alternate protein feeds Such an image could work against efforts to expand CSM use
bull Gossypol level is one of the top reasons that CSM is not used more frequently particularly in non-ruminant feed rations The level of gossypol is a unique characteristic of CSM that obviously cannot be changed through market expansion activities
bull Several other specific characteristics of CSM would likely need to change for CSM to be selected more frequently as a feed ingredient including amino acid balance energy level aflatoxin level and protein quality As with gossypol changes in these characteristics are out of the realm of market expansion programs
bull Feed formulators generally lack adequate and reliable information on many factors which are crucial in efficient feed formulation and which likely have a significant impact on the choice of protein feedstuffs The use of CSM in livestock feed rations is likely restricted by the wide disparity in the perception of feed formulators regarding the appropriate levels of several key nutrition-related factors for specific livestock rations including energy levels fat levels gossypol levels and escape values (ruminants only) for cottonseed meal
bull Over 75 of dairy cattle feed formulators and nearly half of beef cattle feed formulators utilize whole fuzzy cottonseed to some extent in some of the feed rations they formulate Relatively few reported using utilizing both CSM and whole cottonseed in the same ration A main attraction of the use of whole fuzzy cottonseed as opposed to cottonseed meal is the fiber content Indeed the use of whole delinted cottonseed in cattle feed rations is much lower
28
Opportunities for Expanding Use of Cottonseed Meal
There are essentially only two basic tools to expand the market for any commodity l market development and 2) enhancing the efficiency of the marketing system Market development involves a wide range of activities including primarily new product development and product differentiation In new product development the effort is to develop new products or characteristics of products that appeal to different segments of consumers An example might be research leading to the elimination of gossypol in cottonseed meal which could further open up the non-ruminant feed industry to cottonseed meal
Product differentiation on the other hand encompasses those activities designed to create a user preference for or loyalty to a commodity Product differentiation occurs in two major forms 1) advertising and 2) variation in design and quality of product The primary purpose of advertising is to create user preference for a commodity and convince users of the superiority of a product over competing products Actual physical differences in the product are not necessary to successfully differentiate it from competing products It is sufficient only that users believe that some superiority exists Advertising often intends to create an image of superior quality because such images are harder to imitate or successfully counter than physically unique features Successful differentiation of a product means that users become less sensitive to price changes more willing to pay a higher price for the same quantity because they prefer the product and are loyal to it in the face of price increases In other words users are willing to pay more for the same amount because advertising if successful creates a preference for the product over competing products
Variations in quality and design are usually used along with advertising to differentiate the product of one seller from that of another Such variations are often necessary to help create the superior images desired andor attract new sets of consumers
Often barriers exist in a marketing system that hinder the efficient functioning of the market and restrict the flow of commodities from sellers to users Enhancing the efficiency of the marketing system through eliminating such barriers can lead to an expansion in the use of a commodity One of the primary requirements of an efficiently functioning market is that sellers and users possess adequate and accurate information regarding the product its characteristics availability sources uses and value among other things Inadequate or inaccurate information regarding a particular product and other market characteristics can divert demand to alternative products with which users may be more familiar regardless of whether or not those products are better in some sense
The concept and importance of enhancing market efficiency in this regard can be illustrated by comparing the flow of information about a product and market conditions with a radio broadcasting system The efficiency of such a system depends on how accurately the microphone and other equipment record sound how accurately and rapidly that sound is transmitted to a radio receiver and how accurately the receiver brings sound to the listener A breakdown anywhere along the line in that system will simply mean that the message of the broadcast does not get from the radio station to the listener Also if the message gets through but static interferes with the transmission the listener might only receive part of the message or a garbled message The listeners impressions and actions consequently might be quite different than if he had received the message intended In quite the same manner the flow of a commodity from producers to users is affected by how rapidly and accurately market information is evaluated and how accurately and rapidly this information is transmitted to and among producers and users Any breakdown or static in the system would result in a smaller and more obstructed flow of the commodity to users than if the market operated more efficiently
29
The survey results suggests possible opportunities for expanding CSM use through market development and enhancing market efficiency Market development opportunities may be limited because of the nature of the CSM supply situation Nevertheless expansion of CSM use is possible through a reduction in direct feeding of cottonseed so that opportunities for expanding use through market expansion efforts should not be discounted Efforts to enhance the adequacy and accuracy of information regarding the use of CSM as a feed ingredient however may well be the most effective means of promoting an expansion of use or enhancement of the value of CSM
Opportunities for Expansion through Market Development
Although many product development opportunities likely exist for CSM the survey basically focused on the image of CSM in the perception of feed formulators If a market development approach to expanding the use of CSM as an ingredient of animal feed formulations has any chance of success the survey results suggest that the following components of such a strategy will be crucial
bull Product quality and consistency and an improved image of availability must be the major targets of promotion efforts The survey responses across all animal types unequivocally indicated that these three factors are the prime considerations in making general decisions regarding dietary proteins for animal rations Price only becomes a factor in specific decisions regarding the particular protein feed to use to fill the dietary protein requirements of feed formulations after these general concerns are addressed Creating an image of quality consistency and availability for CSM is a necessary first step to expanding use and enhancing value
bull CSM use expansion efforts must focus to some extent on reducing the direct feeding of whole cottonseed to beef and dairy cattle Reductions in direct feeding is the only chance for an increase in supply of CSM to fuel expanded use in newer markets such as catfish and poultry feeding Also because beef and dairy cattle are major users of cottonseed meal a decrease in feeding of whole cottonseed in favor of CSM would significantly expand use
bull Separate CSM market promotion messages must be developed to address the very different needs and concerns of ruminant vs non-ruminant feed formulators The survey results clearly indicate that many nutritional and non-nutritional factors are more important for nonshyruminant feed formulators than for ruminant feed formulators and vice versa
bull The nutrition-related content of CSM market promotion messages must emphasize primarily positive aspects of CSM protein quality amino acid balance and amino acid availability as well as an accurate understanding of appropriate gossypol and aflatoxin levels Many of these factors however are more important for non-ruminant rather than ruminant feed formulators which must be accounted for in designing appropriate messages for feed formulators of each animal type
bull The non-nutrition-related content of CSM market promotion messages may well be the most important and must emphasize primarily the positive aspects of price availability consistency of quality and storability The survey results attached a relatively high level of importance also to nutrient guarantees Although not scoring particularly high in the responses services available from the CSM industry may also be a helpful component of CSM use promotion messages
30
Opportunities for Expansion through Market Emciency Enhancement
Even though some gains in CSM use and market value can reasonably be expected through market expansion efforts the cost involved could easily outweigh any benefits in terms of enhanced profits to the CSM industry Perhaps the most cost-effective appropriate and useful means of enhancing the use of CSM would be a strategy aimed at improving the level and accuracy of information available regarding CSM and its use Lack of information or misinformation can easily discourage feed formulators from using CSM in their feed formulations Strategies to enhance the quantity and accuracy of appropriate information can take on many forms from media advertising to market news letters Although it is beyond the scope of this study to develop alternative information strategies the results of this study clearly indicate a number of areas in which enhanced and more accurate information is a critical need These include the following
bull The overall quality of CSM The study suggests that the negative aspects of CSM are well known Less well known are the specific positive aspects of CSM that may give it an edge in some sense over other protein feeds
bull The ideal ratio of the price of CSM to other feeds like soybean meal The study results indicate that feed formulators may not be adequately informed about what the ideal market value of CSM is relative to soybean meal given the differences in feeding value As a consequence CSM may currently be less used in relation to soybean meal than current market price ratios suggest should be the case
bull Protein-related factors for CSM use in non-ruminant feeds These factors are a major concern in the decisions of feed formulators to include or exclude CSM in feed rations
bull The relationship of aflatoxin to CSM and the rumen degradability of CSM particularly for beef and dairy cattle feed formulators These were the nutritional factors of greatest concern to ruminant feed formulators in the decision to include CSM in their feed formulations
bull CSM price availability consistency and palatability These were indicated to be the most important non-nutritional factors affecting feed formulators decisions regarding whether or not to use CSM The study indicates that information on non-nutritional factors may be more important in the decision to use CSM over alternative feeds to fill dietary protein requirements of feed rations than information on nutritional factors
bull The feeding value of CSM relative to alternative protein feeds An accurate and detailed assessment of the extent to which CSM may be superior as an alternative to other standard protein feeds would help position CSM appropriately in the market
bull The appropriate and acceptable levels of several key parameters affecting the use of CSM in animal feed rations including energy levels fat levels gossypol levels and escape values (ruminants only) Feed formulators generally lack adequate and reliable information on these and likely other parameters not included in the study which are crucial in efficient feed formulation and which have a significant impact on the choice of protein feedstuffs Although it appears that nearly all feed formulators routinely perform crude protein analyses few perform analyses for aflatoxin gossypol fat fiber and other parameters Also CSM suppliers are apparently doing an inadequate job currently of providing such information to feed formulators
31
SOME CONCLUDING COMMENTS AND RECOMMENDATIONS
This study assessed the potential problems and opportunities for expanding the use of CSM through an analysis of the perceptions of feed formulators regarding the use of CSM as an animal feed ingredient The perceptions of feed formulators regarding CSM as a protein feed largely define the boundaries within which CSM use will be able to achieve any significant growth in the future Their perceptions right or wrong are the key to understanding not only the problems facing CSM use but also the opportunities
The general conclusion of the study is an obvious one the use of CSM in feed formulations faces some major challenges in the future Chief among these include a perception among feed formulators that price availability quality and other key CSM characteristics are often obstacles precluding increased use of CSM in their feed formulations Perhaps the most important implication of the study is that a serious lack of adequate and accurate information among feed formulators regarding the characteristics parameters value and other aspects of cottonseed meal use in animal feed rations may be seriously restricting the market opportunities for cottonseed meal U nfortunately the development of alternative strategies to expand the use of CSM and enhance the efficient functioning of CSM markets through more accurate and available information on all aspects of CSM use in feed formulations is beyond this study Nevertheless a few recommendations pertinent to the development of such alternative strategies are in order
bull Before adopting any approach to expand the use of CSM it would be useful first to conduct a detailed analysis of the costs and benefits involved Market promotion efforts through advertising can be extremely costly and yield relatively little Research has also shown that there is often a tremendous lag between advertising and promotion expenditures and any associated returns It could take years of investment in such market expansion efforts before an accurate measurement of the actual return on investment could even be attempted
bull Consider developing first a detailed plan for information dissemination to the feed industry regarding all appropriate aspects of CSM use in feed rations as determined in this study An important part of this process would be a comprehensive assessment of the information needs and the information resources readily available The gap discovered in this way between needs and resources will help set the research agenda for the industry to fill the critical existing information gaps
bull Initiate a study of final user attitudes and perceptions of CSM use as a guide to future market expansion efforts This study considered only the perceptions of feed formulators regarding the use of CSM But feed formulators are often not the final users Consulting nutritionists for example often include or exclude certain feeds and feed types from their formulations as requested by feed users At least a few of the respondents to the survey conducted for this study indicated that user preferences are major factors determining whether or not CSM is included in their feed formulations Indeed markets operate as the interaction of supply and demand to determine prices The preferences of final users ultimately will be expressed in the market values of any product in any market unless sufficient obstacles exist to prevent the market from functioning properly Therefore the real decision-makers in the use CSM in the market may well include many more individuals than adequately represented by feed formulators
32
REFERENCES
US Department of Agriculture (USDAa) Feed Situation and Outlook Report Economic Research Service FDS series various issues
US Department of Agriculture (USDA b) Oil Crops Situation and Outlook Yearbook Economic Research Service OCS Series various issues
Figure 1 Quantity of Oilseed Meals Fed to Livestock 194849 - 198590 (Average)
(1000 Tons)
25000 0-1-----------------------shy
20000 I-~
15000
10000
5000
o L 1 J tJ t tmiddotmiddotmiddot 1 oj 1 to bullbull 1 L_ n __LLL I 1 bullbull I V I
1948-49 1950-54 1955-59 1960-64 1965-69 1970-74 1975-79 1980-84 1985-90
(Years)
n iflu Soybean Meal bull Cottonseed Meal Other Oilseed Meals
Source USDA
c
8 c a CD
en ~
--I _ scg ~CD 01)-- en - () mg0 s 0
JCD enOJ CD_CD en 0
sCDCD 0 OJ shyo OJ r Jlt- 0 m CJ) 0 0lt o 0shyCD OJ J
~s ~m cpCJ) r co OJco ~m a
Figure 3 Price Premium (+) or Discount (-) of Cottonseed Meal Relative to Soybean Meal 1956-1990
~~ ~
o I ~ I I
-20 f---
-40
-60
1~1~1~1~1~1~1~1~1~1~1~1~1~1~1~1~1~1~
Cottonseed meal price is adjusted to a soybean meal protein equivalent basis
~I------------------------------------------------------
l l A
I~middotmiddot--- --------
Figure 4 Animal Species for which Respondents Formulate Feeds
DAIRY CATILE
BEEFCATILE
HORSES
SHEEP
BROILERS
LAYERS
OTHER
PETS
TURKEY
SWINE
CATFISH
210
21000
0 5 1000 15 20 25
Figure 5 Respondents Formulating Feeds for the Various Animal Species
0 20 40 60 80
Figure 6 Other Animal Species for Which Respondents Formulate Feeds
DAIRY CATTLE
BEEF CATTLE
HORSES
SHEEP
BROILERS
LAYERS
OTHER
PETS
TURKEY
SWINE
CATFISH
632
Exotics
Trout
Alligators
KOI
Breeding Hens
Wildlife
Rabbits
Avian
Shrimp
Salmon
Ducks
Fish
Gamebirds
Hybrid Bass
379
~--~----~--~----~----~--~----~--~----~--~
0 10 20 30 40 50
Figure 7 Respondent Feed Formulation Activities by State
( of Respondents)
o 00 middot15 16 -30 31 middot45Cgt 46 -60 61 - 75 - 76 -90
Table 8 Respondent Experience as an Animal Nutritionist
( of Respondents) 30 r---shy
25 t-middotmiddotmiddotmiddotmiddotmiddotmiddotmiddotmiddotmiddotmiddotmiddotmiddot-middot ---_ _
20 -_ -nNItshy
15
10
5
0 1-5 6-10 11-15 16-20 21-25 26-30 31-35 36-40 41-45
(Years Of Experience)
-it sa 0 m 8 l 0 CD l g
_ cc c -s CD CObull
-0 -s- 3 Dl ~ IJ CD (fJ
C 0 l C CD l -+
raquo Sl_ lt_ -+_ CD (fJ
Figure 10 Respondent Primary Feed Formulations
by Animal Type 1990 (Percent)
30 I--------------------------------------------------------shy
25 r- middotmiddotmiddotmiddotmiddotmiddot231middotmiddotmiddotmiddot
20
15
10
5
0 Beef Dairy Swine Poultry Horses Pets Aqua- Sheep Exotics
Cattle Cattle culture amp Goats
(Animal Type)
Figure 11 Percent of CSM and S8M Used in Formulations by Feed Manufacturer Respondents 1990
( of Average Feed Ration)
Figure 12 Tons of Feed Formulated by Feed Manufacturer Respondents 1990
65
91
6 9
17
Total Formulations Formulations With CSM
II Less than 200000 Tons
II 200000 - 400000 Tons bullbullbull I bullbullbullbullbullbull ~ 3 ~ 400000 - 600000 Tons
5 rn 600 000 - 800 000 Tonsru 1
[] 800000 - 1000000 Tons9 4
I ~ 1 More Than 1000000 Tons
Formulations With S8M
Figure 13 Percent middotof Beef Cattle Respondents Formulating CSM Feeds for Specific Beef Cattle Types
( of Respondents)
25 ~I------------------------------------------------------~
-Isectig Feedlot-II 223
20
15
10
5
0
bull Other
~ middotmiddotmiddotmiddotmiddotmiddotmiddot middotmiddot _middotmiddotmiddotmiddot-=middotmiddotmiddotccmiddotcmiddotmiddot
Brood Cows Bulls Calves Feeder Heifer Stocker
(Animal Type)
Figure 14 Percent of Dairy Cattle Respondents Formulating CSM Feeds for Specific Dairy Cattle Types
( of Respondents)
120 ----------------------
100 88
80
60
40
20
0 Calves Heifers Lactating Cows Dry Cows
(Animal Type)
Figure 1-5 Percent of Poultry Respondents Formulating CSM Feeds for Specific Poultry Types
( of Respondents)
OO~I--------------------------------------------~-
50 1-laquolaquolt--laquolaquolaquo -lt - lt - lt -lt laquo lt
44
40
30
20
10
0
f-
~laquolaquolaquolaquo
~laquolaquolaquolaquolaquolaquo
Broilers Layers Turkeys Breeding Flocks
(Animal Type)
Figure 16~ Combined Responses Months of the Year When CSM IS NOT Available
( of Respondents) 16 i ---
14 12~8
12
10
87373 7
6
4
2
0 ~~ ~s ~( ~( ~0( ~0(~~~ ~~ ~t ~1 u~ ~g n0~ ad-o N0~ ~a~
~Y ~o Q~lmiddotr
(Month)
Figure 17 Combined Responses Months of the Year When CSM Needs to Be Available
( of Respondents) 12 ---------------------------
10
8
6
4
2
0
goA 9
~ui ~s ~Ot X)Ot ~Ot X)Ot~0SV~0~~erl ~iSclt ~f ~~1 ~v~ ug ~o~ o~o NO~ co~0 0lt609 ~o
(Month)
Figure 18 Beef Cattle Responses Percent of Respondents Formulating Creep Feed for Calves or Supplements for Stockers
733
832
0 20 40 60 80 100 120
( of Respondents)
Figure 19 Beef Cattle Responses Protein-Related Factors Considered When Balancing Rations
Other Protein Factors 110
Rumen
Degradability 686
Crude Protein Level 161
Amino Acid
Values 42
( of Respondents)
Figure 21 Comparison of Responses Months When CSM Needs to Be Available
( of Respondents) 94 ---------------------------shy
92
9
88
86
84
82 8
78
76
74
72
7
68
66
~ euroI - It
64 -t----------------------------------- -----------t
JAN FEB MAR APR MAY JUN JUL AUG SEP OCT NOV DEC
(Month)
bull Beef Cattle -t Dairy Cattle ltgt Poultry Catfish
Figure 20 Comparison of Responses Months When CSM Is Not Available
( of Respondents)
16 t 15
14
13
12
11
10
9
8ltl amp
7
6
5 I JAN
I
FEB I
MAR I
APR I
MAY I
JUN I
JUL I
AUG SEP I
OCT NOV I
DEC
(Month)
bull Beef Cattle -t Dairy Cattle ltgt PouHry b Catfish
Figure 22 Comparison of Responses Analyses Routinely Performed
( of Respondents)
100~-----------------------------------------------
90
80
70
60
50
40
30
20
10
o I ~
AFLATOXIN C PROTEIN FAT FIBER GOSSYPOL OTHER NONE
(Analyses)
bull Beef Cattle Dairy Cattle o Poultry Catfish-t fj
Figure 23 Comparison of Responses Analytical Values Provided by Supplier
( of Respondents)
60shy
50
4)
30
20
10
o amp ~
AFLATOXIN C PROTEIN FAT FIBER GOSSYPOL OTHER NONE
(Analyses)
bull Beef Cattle -t Dairy cattle o Poultry b Catfish
Figure 24 Share of Cottonseed Use Crush vs Feed Use
( of Respondents)
100 I
90
CRUSH 80
70
60
50
40
30
20
FEED USE 10
o 1~ 1~ 1~ 1m 1m 1~ 1~ 1~ 1~ 1~ 1~ 1~ 1~ 1~
(Year)
Source USDAb
Table 1 Percentage of Beef Cattle Feeds Formula ted Table 2 CSM Feeds Formulated for Beef Cattle CSMmiddot Calvesmiddot
middotAverage Response Rate (feedlot=51 other=41) middotResponse Rate = 39
Table 3 CSM Feeds Formulated for Beef Cattle Table 4 CSM Feeds Formulated for Beef Cattle Stockersmiddot
middotResponse Rate = 40
Response Rate =37
Table 5 CSM Feeds Formulated for Beef Cattle Table 6 CSM Feeds Formulated for Beef Cattle
middotResponse Rate =33
middotResponse Rate = 37
Table 8 Percentage of Dairy Cattle Feeds Formulated CSM
Average Response Rate =88
middotResponse Rate = 37
Table 9 CSM Feeds Formulated for Dairy Cattle Table 10 CSM Feeds Formulated for Dairy Cattle
RespooseRate 24
middotResponse Rate = 34
Table 11 CSM Feeds Formulated for Dairy Cattle Table 12 CSM Feeds Formulated for Dairy Cattle
Response Rate = 31 Response Rate = 45
Table 13 Percentage of Poultry Feeds Formulated Using CSMmiddot
bullAverage Response Rate = 79
Table 14 Percentage of Catfish Feeds Formulated Using CSMmiddot
bullAverage Response Rate =67
Table 15 CSM Feeds Formulated for Catfishmiddot )middoti middot fteq~
bullAverage Response Rate = 17
Table 16 Combined Responses Importance of Specific Factors in Choice of Dietary Protein ( of
bullAverage Response Rate =g]
Table 17 Combined Responses Other Important Factors in
bullAverage Response Rate = 22
bullAverage Response Rate =91
-Average Response Rate =90
Table 20 Combined Responses Importance of Non - Nutrition -Related Factors in Choice of CSM over Alternative Protein Feeds ( of
-Average Response Rate = 87
Table 22 Combined Responses Top S Reasons Why CSM IS NOT Selected as a Feed
Table 23 Combined Responses Top 5 Specific Characteristics That Would Have to Change for CSM to be Selected as a Feed
Table 24 Combined Responses Analysis Routinely Performed
Table 25 Combined Responses Analysis Values Provided
CSM
267 067 333 333 1400 S333
467 000 067 067 1400 4867 --shy
467 000 000 067 400 4333 --shy -- shy -- shy
250 000 000 000 1250 4000 -- shy --shy
313R 4733 62 ------ shy~ - shy ~-
4S00 62
bullAverage Response Rate = 100
bullAverage Response Rate = 87
Table 28 Beef Cattle Responses Imponance of Nutrition-Related Factors in Choice of CSM Over Alternative Protein Feeds
Average Response Rate = 91
Table 29 Beef Cattle Responses Other Nutrition - Related
Fact~~~~~~~~~~~~~~~~~~~
Response Rate =7
Table 30 Beef Cattle Responses Imponance of Non - Nutrition - Related Factors in Choice of CSM Over Alternative Protein Feeds
middotAverage Response Rate = 87
middotResponse Rate = 5
bullAverage Response Rate =14
Table 33 Beef Cattle Responses Months of the Year When CSM Needs to Be AvaiJable I ii middot middot1
bullAverage Response Rate =53
10 U
-Moy
JIIJ
All
so
0_ -
to
--I No
Moy
10 -so shy
0_ _ 0-
Table 35 Beef Cattle Responses Top 5 Reasons Why CSM Is Not Selected as a Feed
Average Response Rate =100 Response Rate = 24
Response Rate =28
Average Response Rate = 98
Response Rate = 17
middotResponse Rate =9
Table 43 Beef cattle Responses Type of Creep Feed
middotResponse Rate = 81
middotResponse Rate =26
Table 45 Beef cattle Responses Respondents Formulating Rations With CSM and Whole
middotResponse Rate = 68
Table 47 Beef cattle Responses Percentage of Whole Cottonseed Respondents Mix in Rations Containing Both CSM and Whole Cottonseedmiddot tCmiddotHiitjt~ middotmiddotmiddotmiddot1
middotResponse Rate =25
middotResponse Rate = 30
bull Response Rate = 98
Response Rate =11
Table 51 Beef Cattle Responses Escape Value Respondents Are Using for Rumen Degradabilitymiddot
1~iiii middotb~r~~fgtD zq436imiddotmiddotmiddotmiddotmiddotmiddotmiddot 004bullbullbullbullbullbullbullbullbullbull1----22--+----31-4
I~~I 23 329
middotResponse Rate = 57
Table 53 Beef Cattle Responses Methods or Sources Respondents Used to Calculate CSM
Table 52 Beef Cattle Responses Reliability of Escape Values Used
Table 54 Beef Cattle Responses Interested in Knowing Escape Values for CSM Processed
Valuemiddot
middotResponse Rate =98
)
I Mean ~nse
63 57S19 228381 Q-L_uu ~139 59468 32306 139bullII1 1 061 06
1 1 44 430 614431-------- 57t 001 001 middot-1
==~=-__~~1c9 00 _ 06 _ 001_ 38 133 323 63
Average Response Rate =100
Response Rate = 89
Table 58 Dairy Cattle Responses Importance of Nutrition - Related Factors in Choice ofCSM Over Alternative Protein Feeds (ofbmiddotNmiddotmiddotmiddotmiddotmiddotmiddot
Response Rate =88
Table 59 Dairy Cattle Responses Other Nutrition-Related Factors
Indicated br~~P211dents
Response Rate =10
Table 60 Dairy Cattle Responses Importance of Non- Nutrition - Related Factors in Choice of CSM Over Alternative
Protein Feeds ( ofResPOndents~dd
Response Rate = 88
Response Rate = 3
--
Average Response Rate = 51
Table 62 Dairy Cattle Responses Months in the Year When CSM IS NOT Available
10 u
J -- AIIIi
--~ shy
loOoIMr _ 0-
bullAverage Response Rate =69
--- AIIIi
--~ soM
0
0-_
10
Table 65 Dairy Cattle Responses Top 5 Reasons Why CSM IS NOT Selected as a Peed
Table 66 Dairy Cattle Responses Top 5 Specific Characteristics That Would Have to ro1 ____ for CSM to be Selected as a Feed
Table 67 Dairy Cattle Responses Analyses Routinely Performed fmiddotmiddotmiddotmiddot
Response Rate =96
Response Rate =56
Table 68 Dairy Cattle Responses Other Analyses
Response Rate =25
Table 70 Dairy Cattle Other Analytical Values CSM
Response Rate =4
Average Response Rate =81
Average Response Rate = 15
Table 73 Dairy Cattle Responses Respondents Formulating Feeds With Whole andor Delinted
Cottonseed bull
bullAverage Response Rate =92
middotResponse Rate = 40
Table 74 Dairy Cattle Responses Respondents Formulating Rations with Cottonseed Meal and Whole Cottonseed in the Same Rationmiddot
middotResponse Rate = 97
Table 76 Dairy Cattle Responses Percentage of Whole Cottonseed Respondents Mix in Rations
ltltJIltainin(a0th CSM and WhoeCottonseedmiddot Mean
middotResponse Rate = 42
Table 77 Dairy Cattle Responses Knowledge of Research on Feedine CSM
~~~~
Average Response Rate = 68
Response Rate =7
Average Response Rate =59
Response Rate =25
Average Response Rate =63
Response Rate = 13
middotResponse Rate = 92
Response Rate =82
Table 85 Dairy Cattle Responses Methods or Sources Used to Calculate CSM
Response Rate = 73
Table 86 Dairy Cattle Responses Respondents Interested in Knowing Escape Values for CSM Processed from Different Methodsmiddot fmiddotmiddotmiddotmiddotmiddotmiddot
Response Rate = 92
Response Rate = 34
Table 89 Dairy Cattle Responses Suggestions for CSM
Response Rate =33 Response Rate =22
-----
64 139 24815 00 36 511 5751
5951 131 438 35015 00 15 I-~~~~~
6200 15 423 51151 00 00 ~~~ -~~~ -~~~ ~~~-~~ --~~ ~ ~ ~~-~ ~
292 55125 00 00 125 45800
bullAverage Response Rate =99
Average Response Rate =85
Table 92 Poultry Responses Importance of Nutrition - Related Factors in Choice of CSM Over Alternative Protein Feeds (of
Average Response Rate =85
Table 93 Poultry Responses Other Nutrition-Related Factors Indicated
200
200
Response Rate = 5
Table 94 Poultry Responses Importance of Non - Nutrition - Related Factors in Choice of CSM Over Alternative Protein
Feeds~~~~~~~~~~5=~~~~~T7~~
00 Average Response Rate =83
Response Rate =4
Average Response Rate = 17
Table 97 Poultry Responses Months in the
J
p
April
lao
A
shy-- 0
ft
April
_
Average Response Rate = 43
=1 g L
0
Table 99 Poultry Responses Top 5 Reasons Why CSM IS NOT Selected as a Feed
Table 100 Poultry Responses Top 5 Specific Characteristics That Would Have to Change for
CSM to be Selected as a Feed Inoredient
Table 101 Poultry Responses Analyses Routinely
middotResponse Rate = 93
Table 102 Poultry Responses Other Analyses Routinely
Performed
middotResponse Rate = 27
Table 103 Poultry Responses Analytical Values Provided
middotResponse Rate =73
Table 104 Poultry Responses Knowledge of Problems
bullAverage Response Rate = 62
Average Response Rate = 14
Table 106 Poultry Responses Protein - Related Factors
Average Response Rate = 64
Table 107 Poultry Responses Other Protein - Related
Response Rate =11
Table 108 Poultry Responses Crude Protein Levels
Preferred for CSM
Response Rate = 55
Table 111 Poultry Responses Gossypol Levels Considered
Safe
Table 112 Poultry Responses Would or Do Use Table 113 Poultry Responses Relative Feeding Value of CSM Comoared to 44 SBMmiddot
middotResponse Rate = 96
bull Response Rate = 100
Table 114 Poultry Responses Knowledge of Table 115 Poultry Responses Familiarity with Other Feedino CSMmiddot
middotResponse Rate =7 bull Response Rate = 73
middotResponseRate = 31
bullAverage Response Rate = 58
Table 118 Poultry Responses Willingness to Pay
a Premium Per Unit of Protein for CSM With More
Than 41 Protein
bullResponse Rate =91
Table 119 Poultry Responses Percent of Cost of SBM Respondents Willing to Pay for CSM with
Response Rate =27
Response Rate =64
00 00 87 43 478 304 57 00 00
----shy I--~~
00 ~-~
43 522 348 59 ----shy
62~ 00 00 00 261 ----shy
652 ------shy
00 00 00 00 667 333 63 AverageResponseRate = 99
bullAverage Response Rate = 73
Table 123 Catfish Responses Importance of Nutrition - Related Factors in Choice of CSM Over Alternative Protein Feeds
Average Response Rate =83
Table 124 Catfish Responses Importance of Non- Nutrition - Related Factors in Choice of CSM Over Alternative Protein
Feeds
Average Response Rate = 90
bullAverage Response Rate = 13
Igt 20
s_
Pshy s
--s
H_
_
gt 7 bull bull bull bull bull
1 fsI plusmn -
haMr
N__
shy
bullAverage Response Rate =54
Table 128 Catfish Responses Top 5 Reasons Why CSM IS NOT Selected as a Feed
Table 129 Catfish Responses Top 5 Specific Characteristics That Would Have to Change for CSM to Be Selected as a Feed-_
Table 130 Catfish Responses Analyses Routinely Table 131 Catfish Responses Other Analyses Routinely Performed
middotResponse Rate = 25
middotResponse Rate =92
bullAverage Response Rate = 18
Table 133 Catfish Responses Knowledge of Problems Feedine CSM to CatflSh
Average Response Rate =100
Table 134 Catfish Responses Protein - Related Factors Considered i
Response Rate = 83
Table 135 Catfish Responses Crude Protein Levels Preferred for CSM
Response Rate = 100
Table 139 Catfish Responses Would or Do Use Table 140 Catfish Responses Relative Feeding
Value ofCSM Compared to 44~ Lmiddotmiddotmiddotmiddotmiddotmiddotmiddotmiddotmiddotmiddotmiddotmiddotmiddotmiddotmiddotmiddotmiddotmiddotmiddot _
Response Rate = 100
Response Rate = 100
Table 141 Catfish Responses Knowledge of Research on Table 142 Catfish Responses Sources ofInformation
Average Response Rate = 83
bullAverage Response Rate = 44
Table 143 Catfish Responses Willingness to Pay A Premium Per Unit of Protein for CSM with More Than
middotResponse Rate = 100
Table 144 Catfish Responses Percent of Cost of SBM Respondents Willing to Pay for CSM with Sufficiently Low Goscvnol and Fiber Levelsmiddot
middotResponse Rate = 83
middotResponse Rate = 25
Table 146 Comparison of Mean Responses and Analysis of Variance (ANOVA) Importance of Specific
bull Scale of 1 (extremely unimportant) to 7 (extremely important) for the mean ranking a Mean significantly larger across animal types at the 5 significance level otherwise no difference b Mean significantly lower across animal types at the 5 significance level otherwise no difference
Table 147 Comparison of Mean Responses and Analysis of Variance (ANOVA) Ranking of Other Protein
bull Scale of 1 (CSM inferior to respective feed) to 7 (CSM superior to respective feed) for the mean ranking
a Mean significantly larger across animal types at the 5 significance level otherwise no difference
b Mean significantly lower across animal types at the 5 significance level otherwise no difference
Table 148 Comparison ofMean Responses and Analysis of Variance (ANOVA) Importance of Nutritionshy
Related Factors in Choice ofCSM Over Alternativesmiddot
bull Scale of 1 (extremely unimportant) to 7 (extremely important) for the mean ranking a Mean significantly larger across animal types at the 5 significance level otherwise no difference
b Mean significantly lower across animal types at the 5 significance level otherwise no difference
Table 149 Comparison of Mean Responses and Analysis of Variance (ANOVA) Importance of Nonshy
Nutrition- Related Factors in Choice of CSM Over Alternativesmiddot
bull Scale of 1 (extremely unimportant) to 7 (extremely important) for the mean ranking
a Mean significantly larger across animal types at the 5 significance level otherwise no difference
b Mean significantly lower across animal types at the 5 significance level otherwise no difference
- = Not mentioned or ranked lower than 4th place
Table 151 Comparison of Responses Top Responses Why CSM IS NOT Selected as a Feed
- = Not mentioned or ranked lower than 5th place
Table 152 Comparison of Responses Top Characteristics that Have to Change for CSM to Be
- = Not mentioned or ranked lower than 5th place

2
OBJECTIVES OF THE STUDY
The overall goal of this study was an objective unbiased assessment of potential problems and opportunities for expanding the use of CSM as an animal feed ingredient The primary aim of the study was an analysis of the particular factors influencing feed formulators to use or not to use CSM as an ingredient in their animal feed rations The more specific objectives of the study included the following
bull Identify the most important factors influencing the choice of a dietary protein by feed formulators
bull Determine the extent to which CSM is considered by feed formulators to be inferior or superior to other protein feeds and the extent to which CSM is considered to be an alternative to other protein feeds in formulating feed rations
bull Identify the most important nutrition-related and non-nutrition-related factors influencing the choice of CSM by feed formulators as a feed component over alternatives
bull Determine and rank the primary reasons for which CSM is or is not included in formulated feeds and the specific characteristics of CSM that would have to change in order for it to be included more frequently in formulated feeds
bull Identify and evaluate the specific factors related to CSM use by selected major animal species including beef cattle dairy cattle poultry and catfish and
bull Determine the problems and opportunities for expanding CSM use based on the survey results
MffiTHODOLOGY OF THE STUDY
The primary tool of analysis was a national survey of feed formulators A survey sample of 1191 animal nutritionists was first developed consisting of animal nutritionists employed by commercial feed manufacturers consulting animal nutritionists and produceranimal nutritionists The sample was then screened by mailing business reply postcards to the each individual in the sample to determine if they were the appropriate one to complete the survey ie the person in the respective firms responsible for formulating feeds and for decisions regarding changes in feed formulations If not they were asked to provide the name of the individual in their firms responsible for feed formulations In such cases a screener postcard was then sent to the name provided by the individual in the original sample The postcard screening instrument also allowed individuals in the sample to decline to participate in the survey to save time and cost in later efforts to follow up on nonshyresponses Consequently only those who qualified as feed formulators responsible for changes in formulations and who also agreed to participate were included in the final sample The postcard also asked the individuals in the sample to indicate the animal species for which they formulated feeds in order to determine the appropriate survey questionnaire(s) to send to each qualifying sample member A follow-up letter and additional postcard were sent out to all members of the sample who
3
did not respond within the allotted time frame to encourage participation Copies of the postcard screener and the follow-up letter are included in the Appendix
The survey instrument mailed to each qualifying sample member contained three separate color-coded sections of questions I) general questions regarding the overall feed formulating activities of the sample members and the general operations of the firms for which they formulate feeds 2) general questions regarding feed formulation and the use of CSM with respect to various animal species and 3) questions specific to each animal specie regarding the use of CSM in feed formulations A pre-test was conducted by sending the survey to 7 prominent animal nutritionists across the country with considerable experience in formulating feeds for at least one of the animal species included in the survey After some adjustments based on the pre-test the survey instrument was sent to each member of the sample according to the specie type(s) for which each had indicated in the screening process that they were formulating feeds The final survey questionnaires mailed to the sample are included in the Appendix
All final sample members received the first section of questions (general activities) The second section of survey questions (general questions on cottonseed meal use in feed formulations) was also sent to all members of the sample Because the responses to the questions in this section were likely to differ to some extent depending on the animal specie for which the sample member formulated feeds sample members received a separate copy of second section of the survey to complete for each animal specie for which they indicated that they formulated feeds This section of the survey was color-coded by animal specie for ease in identifying responses by animal type The third section of the survey included questions specific to each animal type Sample members received the set (or sets) of survey questions for this third section corresponding to the animal specie(s) for which they formulated feeds The third section of the survey was also color-coded by animal specie Thus an individual sample member could have received from a minimum of 3 up to a maximum of 9 survey sections to complete depending on the number of animal species (beef cattle dairy cattle poultry and catfish) marked by the sample member on the screener postcard Three separate followshyup letters were sent at regular intervals to non-responding members of the final sample to encourage their participation and are included in the Appendix
RESPONDENT PROFILE AND FEED FORMULATION ACfIVITIES
The original population of 1191 animal nutritionists included in the sample and who received screener postcards yielded 470 qualified sample members (395) Of those 470 qualified sample members however a surprising 258 participated by returning completed surveys (549 of qualified sample members and 217 of original sample) Normally the rate of return is expected to be only 10-15 The combined completed surveys represented the CSM use perceptions of 123 beef cattle feed formulators 143 dairy cattle feed formulators 55 poultry feed formulators and 12 catfish feed formulators The total number of feed formulators (333) adds to more than the 258 individuals who returned completed surveys because a given feed formulator could formulate feed for more than one animal specie and therefore could return a survey for more than one animal specie Because not all respondents answered all questions or all parts of all questions the actual number of responses to a particular question or part of a question is usually less than the total number of possible responses This means that the total number of actual respondents may vary somewhat from question to question or from one part of a question to another in a given survey section and across sections of the survey Consequently the tables summarizing the responses to the survey questions which accompany the
4
discussion of the survey results in this report indicate a response rate which is the number of actual responses divided by the number of possible response to the respective questions in percentage terms
The survey respondents indicated that they formulate feeds for a wide variety of animal species not just those specifically included in the survey Dairy and beef cattle each accounted for about 20 of the animal species for which feeds are formulated (Figure 4) All others accounted for 10 or less of the animal species for which feeds are formulated The survey respondents indicated that they formulate feeds for dairy and beef cattle (about 60 of the respondents for each) followed by horses (31 ) sheep and goats (27) broilers (27) layers (26) other (23) pets (17) turkeys (17) swine (14) and catfish (9) (Figure 5) Various exotic animal species accounted for the largest share (38) of the other animal species for which respondents indicated they formulate feeds (Figure 6)
The survey respondents represented feed formulating activities in nearly every state (Figure 7) Although no state accounted for more than 9 of the feed formulating activities of the respondents the major states represented by the respondents included Texas (8) California (7) Iowa (7) Michigan (7) Kansas (6) and Minnesota (5) About 40 of the respondents had less than 10 years experience as a feed formulator (Figure 8) Nearly 30 had experience of 11 to 20 years with the remaining 30 indicating experience of up to 45 years in feed formulation
A little over 60 of the respondents were consulting nutritionists and the remaining nearly 40 were nutritionists employed by a particular feed manufacturer (Figure 9) The respondents also indicated the primary feed types they formulate by animal species (Figure 10) Feeds for beef cattle dairy cattle and swine were the predominant feed products (66) The feed manufacturer nutritionists responding to the survey formulated an average of approximately 400487 tons of all feed types in 1990 of which 8 included CSM as an ingredient and 64 included soybean meal (Figure II) The preponderance of those firms (65) however formulated less than a total of 200000 tons of all feed types in 1990 (Figure 12) An even higher percentage of those firms (91) formulated less than 200000 tons of feed that included CSM
The survey respondents also indicated the specific types of animals for which they were formulating CSM feeds and the particular types of CSM feeds formulated for those animal types The responding beef cattle nutritionists formulated feeds that included CSM for a wide range of feedlot and non-feedlot beef cattle (Figure 13) Over 60 of the respondents indicated that they formulate feeds for at least one of those two animal types Calves and feeders were the predominant feedlot beef cattle types for which feeds were formulated using CSM (22 and 20 respectively) (Table I) For beef cattle not fed in feedlots the split among types was somewhat more even with brood cows and stockers having a slight edge The number of nutritionists formulating feeds for feedlot beef cattle was about 25 more than those formulating for non-feedlot beef cattle
Tables 2 through 7 indicate the particular feeds formulated with CSM for the various types of beef cattle The predominant CSM feed formulated tor calves was a creep or starter feed (Table 2) For feeders however CSM was used primarily in protein supplements (Table 3) Range supplements range feeds range cubes and miscellaneous supplements were the primary CSM feeds formulated for stockers replacement heifers brood cows and bulls (Tables 4 5 6 and 7)
The largest number of dairy cattle feed nutritionists responding to the survey formulated CSM feeds for lactating cows (88) followed by heifers (75) dry cows (69) and calves (51) in the last 5-10 years (Figure 14) Lactating cows accounted for 32 of the CSM feeds formulated for dairy cattle followed by heifers (27) dry cows (24) and calves (17) (Table 8) Tables 9 through 12 indicate the particular feeds formulated with CSM for the various types of dairy cattle The predominant CSM feeds formulated for dairy calves were indicated by respondents to be calf grower
5
and starter feeds (Table 9) For dairy heifers the main feeds formulated with CSM included various supplements and grower feeds (Table 10) For lactating cows CSM was used predominantly in complete rations For dry cows supplements and complete rations were the predominant feeds formulated with CSM (Tables II and 12)
The responding poultry nutritionists formulated feeds for layers (44) broilers (38) turkeys (24) and breeding flocks (26) (Figure 15) Layers accounted for the largest share of the CSM poultry feeds formulated by the respondents (35) followed by broiler feeds (29) breeding flock feeds (19) and turkey feeds (17) (Table 13)
Two-thirds of the catfish respondents (8 of the 12 respondents) formulate feed for grow out stock (Table 14) Half the catfish respondents (6 of the 12 respondents) formulate feeds for brood stock and for fingerlings Five of the respondents (42) formulate feeds for fries Respondents reported formulating several types of feeds using CSM for catfish (Table 15)
SURVEY RESULTS
The results of the cottonseed meal use survey are summarized into three main sections I) combined results across all animal species 2) results by particular animal species (beef cattle dairy cattle poultry and catfish) and 3) a comparison of results among animal species Summary figures and tables of the results are presented at the end of the report
Combined Results
A Dumber of the same questions were asked of all members of the survey sample regardless of the particular animal types for which they were formulating feeds (second section of the survey) The responses to the questions for each animal type were first combined to facilitate an overall assessment of the perceptions of animal feed formulators regarding the use of cottonseed meal in their feed formulations Again because many of the feed formulators participating in the survey completed the questions in this section for more than one animal specie a given participating feed formulator could count as more than one respondent in the analysis of the combined results (ie over all animal species) The results by animal species are discussed in a later section
All respondents were probed for their perceptions in 6 general areas I) the particular factors affecting their choice of dietary proteins for formulated feeds 2) the extent to which CSM is considered to be an alternative to selected protein feeds 3) the importance of nutritional and nonshynutritional factors in their decisions to use CSM rather than alternative dietary proteins in their feed formulations 4) the seasonality of CSM availabilityS) the specific reasons for the selection and nonshyselection of CSM for use in the feeds they formulate and 6) the source of CSM chemical analyses used by the respondents
Factors Affecting Choice of Dietary Proteins
All members of the final sample were asked to rank the importance of the following 4 general factors in their choice of a dietary protein for their feed formulations on a scale of 1 to 7 (from
6
extremely unimportant to extremely important respectively) I) quality 2) price 3) availability and 4) consistency In addition they were provided an opportunity to list and rank other factors affecting their dietary feed protein choices An impressive 92 of the respondents indicated that the quality of the protein was either important or extremely important in their choice of dietary proteins (Table 16) Nearly two-thirds of the respondents ranked protein quality as extremely important An almost equal number of respondents (90) indicated that protein consistency was either important or extremely important Less than half the respondents however ranked consistency as an extremely important factor Although nearly SO of the respondents ranked price availability and other factors as either important or extremely important the majority of respondents ranked each of those factors as important rather than extremely important The primary other factors listed by the respondents included palatability flow characteristics the protein composition the value supplier service and storage and handling characteristics (Table 17) Various miscellaneous factors were also listed
Cottonseed Meal As An Alternative Protein Feed
The final sample members were asked two sets of questions to gain insight into the competitiveness of CSM as a protein feed and determine which other proteins are considered to be the main competitors of CSM in feed formulations They were first asked to rank various selected protein feeds on a scale of I to 7 as inferior or superior respectively to CSM in an overall sense for use in feed formulations A mean response of greater than 4 for a particular protein feed is an indication that on average the responding feed formulators considered the protein feed to be superior to CSM (ie CSM is considered to be an inferior protein source) On the other hand a mean response of less than 4 is an indication that the protein feed is inferior to CSM in the perception of the respondents on average (Le CSM is considered to be a superior protein source) A mean response of around 4 suggests that the respondents considered cottonseed meal to be equally acceptable to those particular feeds The second question required respondents to indicate whether or not they considered CSM to be an alternative to each of the 20 listed protein feeds
The results suggest that CSM meal is considered to be clearly superior to only 5 of the 20 listed protein feeds including (in order of perceived CSM superiority) urea safflower meal wheat middlings sunflower meal and feather meal (Table IS) CSM was considered to be clearly inferior to another 7 of the 20 listed protein feeds including (in order of perceived inferiority of CSM) fish meal dried skim milk dried whole milk blood meal soybean meal meat and bone meal and corn gluten meal The mean responses of the remaining S protein feeds were all close to 4 suggesting that the respondents considered CSM to be about the same as those protein feeds These included (in no particular order) tankage poultry by-product meal peanut meal linseed meal brewers dried grains distillers dried grains dehydrated alfalfa and canola meal
Respondents were quite evenly divided in their opinion as to whether CSM is a viable alternative protein feed for almost all of the listed protein feeds (Table IS) The only possible exceptions were dried skim milk fish meal dried whole milk and blood meal for which a larger percentage of respondents indicated that CSM is an alternative than suggested that CSM is not an alternative
The Importance of Nutritional and Non-Nutritional Factors
In response to an earlier question respondents ranked the importance of various factors in choosing any dietary protein for use in their feed formulations Later respondents were asked to rank the importance of a more detailed list of nutrition-related and non-nutrition-related factors in specifically choosing cottonseed meal as a component of the feeds they formulate again on a scale of extremely unimportant to extremely important (a scale of I to 7 respectively) They were also
7
allowed to list other factors that they considered important but were not on the list Interestingly the largest percentage of respondents (90) ranked aflatoxin as an important or extremely important factor in their choice of CSM as a feed component (Table 19) Nearly two-thirds ranked aflatoxin as extremely important a much higher percentage than for any other factor Protein quality was ranked as important or extremely important by 80 of respondents Gossypol level had the third highest mean response of any individual factor Only one listed factor was clearly considered to be unimportant in the choice of cottonseed meal as a feed component (vitamin level) as indicated by a mean response of substantially less than 4 The mineral level in cottonseed meal was considered to be neither important nor unimportant
The major non-nutrition-related factors influencing the choice of cottonseed meal as a feed component in the perception of the respondents included consistent quality price availability nutrient guarantees and palatability as indicated by their relatively higher mean ran kings (Table 20) Note that all of the listed non-nutrition-related factors were considered by the respondents to be at least somewhat important in their choice of cottonseed meal as a feed component That is none of them were considered to be unimportant The least important non-nutrition-related factors influencing the choice of CSM in the perception of the respondents included service from the CSM industry the need for a local supply of CSM special equipment requirements for using CSM and convenience in using CSM as a feed component
Seasonality of Cottonseed Meal Availability
The survey results indicate that CSM is least available in sufficient quantities for purchase as a feed component during the months of June through September of a typical year (Figure 16) However the results also indicated that those are also about the same months (April through August) in which there is the least need for CSM to be available to compete effectively with alternative protein feeds (Figure 17) One interpretation of this result is that on average the availability of CSM is generally not a problem during the year This is not entirely the case however as the responses to the next set of questions point out
Reasons for the Selection and Non-Selection of Cottonseed Meal
To obtain further insight into the primary motivating factors behind the selection or nonshyselection of CSM as an ingredient in feed formulations the sample members were asked three completely unaided questions ie the respondents did not have a list from which to choose in answering the questions They were first asked to list the top five reasons why they perceive that CSM is selected as a feed ingredient and then the top 5 reasons why CSM is Dot selected in order of importance Finally if CSM is Dot generally selected by a respondent heshe was asked to list the specific characteristics of CSM that would have to change for it to be selected more frequently again in order of importance The respondents simply needed to fill in blanks for each question (reasons that CSM is and is not selected and characteristics that would have to change) marked lst through 5th with their own ideas
By far the number one reason (63 of the respondents) listed for which CSM is selected as a feed ingredient was price (Table 21) Far behind price the number one choices of some respondents were proteinprotein quality (9 of the number one responses) availability (7) palatability (4) and quality (4) Listed most often as the second most important reason for selecting CSM was availability (31 of the number two responses) followed by price (20) proteinprotein quality (1I) palatability (7) and pelletabilitypellet quality (6) The three reasons most often listed third were availability (20 of the number three responses) palatability (16) and price (11) Based on the total number of times a reason was listed first second or third the top three reasons
8
given by respondents for which CSM is selected as a feed component were price availability and proteinprotein quality in that order
The respondents provided a much longer list of reasons for which CSM is Dot selected than for which CSM is selected as a feed ingredient (Table 22) Interestingly the most frequently listed number one reason (54 of the respondents) why CSM is Dot selected as a feed ingredient was again price Other number one choices included availability (16) gossypol (9) and protein protein quality (3) The reason most often listed second (30 of respondents) was availability followed by pricevalue (20) and gossypol (8) The reason most often listed third was pricevalue again (14 of respondents) and then availability (I 3) and gossypol (I 1) Again based on the total number of times a reason was listed first second or third the top three reasons given by respondents for which CSM is Dot selected as a feed component were price availability and gossypol in that order
The three most commonly listed specific characteristics of CSM that would have to change to be included more frequently in respondents feed formulations also were price availability and gossypol (Table 23) Other less frequently mentioned CSM characteristics that would need to change included amino acid balancelevel energy contentlevel aflatoxin contentlevel proteinprotein quality
In summary price and availability appear to be the two key factors affecting the use of CSM If price is low andor availability is adequate feed formulators are more likely to use CSM in their formulations On the other hand a high price andor poor availability is likely to discourage use of CSM Consequently there is very little loyalty by feed formulators to CSM because they appear to be quick to switch back and forth between CSM and alternative feeds as price changes Feed formulators do not appear to perceive that CSM is a feed ingredient with inherent characteristics for which they are willing to pay a premium if necessary in order to continue using it as an ingredient in the feeds they formulate That is the primary consideration in deciding whether or not to use CSM is its price rather than some nutritional characteristic for example Thus when price rises they perceive little reason to continue using CSM as part of their formulations
The availability of CSM appears also to work both for and against the use of CSM Responses to the specific questions on seasonality seemed to indicate that availability of CSM is not generally a problem during the year But when CSM is not selected as a feed ingredient availability is one of the major reasons During certain times of the year in certain parts of the country availability may be a positive factor motivating the use of CSM
Source of Chemical Analyses for Cottonseed Meal
Nearly 90 of the respondents routinely perform crude protein analyses (Table 24) About two-thirds perform their own fat and fiber analyses as well Surprisingly however less than half the respondents routinely test for aflatoxin even though nearly all respondents indicated aflatoxin to be an important or extremely important factor affecting their choice of CSM as a feed component Only 18 of the respondents routinely test for gossypol Even though nearly all respondents performed their own crude protein analyses CSM suppliers apparently provide analytical values for crude protein to over 40 of respondents (Table 25) CSM suppliers provided fat and fiber analytical values to about a third of the respondents CSM suppliers appear to provide analytical values for gossypol to very few feed formulators
9
Results by Animal Species
The responses in the previous section are indicative of the overall perceptions of feed formulators of the use of CSM as a feed component Those results however may mask some important differences in perceptions among formulators of feeds for the various animal species There are also issues regarding the use of CSM as a feed component that are unique to the various animal species Consequently salient dissimilarities in the responses of formulators of different animal feeds from the combined responses (over all animal types) discussed in the previous section are highlighted in this section Also the results of the questions asked specifically of formulators of feeds for particular animal species are discussed in this section in detail as well
BeeCattle
There are few major differences in the perceptions of beef cattle feed formulator respondents concerning the use of cottonseed meal from those discussed in the previous section for all survey respondents This may reflect the larger number of respondents formulating feed for beef cattle (and for ruminants in general) than for other animal species The salient differences in the 6 general question areas include the following
bull Factors affecting choice 0 dietary proteins The only major difference in the responses to these questions was a somewhat greater concern by responding beef cattle feed formulators for other factors influencing the choice of a dietary protein such as palatability and rumen degradability (Table 26)
bull Cottonseed meal as an alternative protein feed The results for beef cattle are roughly similar to those from the combined responses (Table 27) Major differences include I) a lower percentage of beef cattle survey respondents consider blood meal to be superior to CSM in beef cattle feeds 2) a large majority of respondents feel that CSM is not an alternative to dried skim milk and dried whole milk in beef cattle feeds and 3) an overwhelming majority of respondents consider CSM to be an alternative to the remaining protein feeds for use in beef cattle feeds except perhaps for fish meal and blood meal
bull The importance 0 nutritional and non-nutritionalactors Again the responses are generally the same as for the combined responses The beef cattle survey respondents however tended to rank nutrition-related factors as less important and non-nutrition-related more important than was the case for the combined responses On average beef cattle feed formulators ranked protein quality amino acid balance amino acid availability fat level fiber level and gossypol level as less important factors in the choice of CSM than was the case for the combined responses (Tables 28 and 29) Of the non-nutrition-related factors respondents ranked palatability the need for a local supply equipment requirements convenience and CSM industry service as all slightly more important in the choice of CSM than was the case for the combined responses (Tables 30 and 31)
bull Seasonality 0 cottonseed meal availability The results for the beef cattle respondents are virtually identical to those from the combined responses (Tables 32 and 33)
bull Reasons lor the selection and non-selection 0 cottonseed meal The top three reasons for which CSM is and is not selected as a feed ingredient are exactly the same for the beef cattle responses as for the combined responses (Tables 34 and 35) Also price availability and
10
gossypol level are cited as the three most important factors that would have to change for CSM to be used more frequently as was the case with the combined responses (Table 36)
bull Source 0 chemical analyses lor cottonseed meal No major differences appear in either the analyses routinely performed by the responding beef cattle feed formulators or the analytical values provided to them by CSM suppliers (Tables 37 38 39 and 40)
Beef cattle sample members were also asked several questions specifically regarding the use of CSM in beef cattle feed formulations in 5 general areas I) problems resulting from feeding a ration with CSM to the various beef cattle types 2) details on particular feed formulations for beef cattle 3) sources of information utilized regarding formulating beef cattle feeds 4) protein-related factors considered when balancing rations for beef cattle and 5) an open-ended question soliciting suggestions to improve the usefulness or value of CSM for beef cattle feed formulations
Problems from Feeding CSM Rations to Beef Cattle
Few respondents indicted knowledge of any problems resulting from feeding a ration containing cottonseed meal to either feedlot or other beef cattle (Table 40 The most frequently mentioned problems concerned feedlot bulls and calves The majority of the problems reported involved supplements and starter feeds (Table 42) The main problems reported had to do with gossypol beef cattle performance when fed rations containing CSM and reproduction The low number of respondents indicating problems of any type however suggests that the problems reported were likely isolated cases
Details on Particular Feed Formulations for Beef Cattle
The sample members were also asked to provide information regarding creep feeds for calves and supplements for stockers that they formulate as well as information regarding the use of whole or delinted cottonseed in beef cattle feed rations Nearly 75 of all beef cattle respondents formulate creep feeds for calves and over 80 formulate supplements for stockers (Figure 18) Traditional creep feeds represented two-thirds of the creep feeds formulated (Table 43) Over half the respondents indicated that they formulate traditional creep feeds Fewer respondents formulated high protein creep feeds
Nearly half the beef cattle respondents formulate some feeds using whole fuzzy cottonseed (Table 44) Only a little less than a third formulate any feeds using delinted cottonseed however Also only about a quarter of the respondents formulate any rations that include both CSM and whole cottonseed (Table 45) For those who formulate rations that include both the mix of the two in the rations varies widely Respondents reported that the share of such rations accounted for by CSM ranged from 1 to 100 with a mean of 19 (Table 46) The share of those rations accounted for by whole cottonseed ranged from 0 up to a maximum of 25 with a mean of 102 (Table 47)
Sources of Information Utilized on Formulating Beef Cattle Feeds
The largest number of respondents (110 of 123 respondents) indicated that they utilize university research of some type to obtain information on formulating feeds for beef cattle (Table 48) Only slightly fewer (91 respondents) indicated that industry publications are a source of feed formulation information for beef cattle University extension and government agencies were also listed as important information sources A few respondents listed other sources of information
II
including primarily the results of research performed in their own companies their own personal experience and their own private research (Table 49)
Protein-Related Factors Considered for Balancing Beef Cattle Rations
Nearly 70 of the respondents indicated that rumen degradability is a protein-related factor that they consider when balancing beef cattle rations (Figure 19) Respondents also consider crude protein level (16) and other protein factors (11) Only 4 indicated concern for the amino acid value when balancing beef cattle feed rations The two main other protein-related factors the respondents indicated as having a bearing on balancing beef cattle feed rations were the digestibility of the protein and the protein ingredients (Table 50)
Respondents indicated a wide range of escape values (or by-pass values) that they are using for CSM from less than 20 to over 50 (Table 51) At the same time however they are unsure as to the reliability of the escape values they are using Nearly 70 indicated that the escape values they are using are neither reliable or unreliable or only somewhat reliable (Table 52) The principal single method or source used by respondents for the escape value was the National Research Council (Committee on Animal Nutrition National Academy of Sciences) (Table 53) Universities were the next most frequently mentioned single source of CSM escape values The largest number of respondents (32) simply indicated that several sources were consulted for escape values Finally almost all respondents indicated an interest in obtaining information on escape values for CSM as processed by different methods (Table 54) There appears to be a lack of reliable information on CSM escape values in the perception of beef cattle feed formulators
Suggestions for Improling the Usefulness of Cottonseed Meal
Only 16 of the beef cattle feed formulators that returned surveys provided suggestions that might improve the value or usefulness of CSM in feed rations (Table 55) Some of the more noteworthy suggestions included improving the consistency of cottonseed meal various types of needed research more data on CSM and increased availability of CSM
Dairy Cattle
There are few major differences in the perceptions of dairy cattle feed formulator respondents concerning the use of cottonseed meal from the combined responses over all survey respondents and the beef cattle responses Again this may reflect the larger number of respondents formulating feed for dairy cattle (and for ruminants in general) than for other animal species The salient differences in responses by dairy cattle feed formulators in the 6 general question areas include the following
bull Factors affecting choice of dietary proteins There is virtually no differences in the responses of dairy cattle respondents from the combined responses for any of the listed factors (quality price availability consistency and other) affecting the choice of dietary protein (Table 56) A large majority of dairy cattle feed formulators ranked all factors as either important or extremely important
bull Cottonseed meal as an alternative protein feed The results for dairy cattle are roughly similar to those from the combined responses (Table 57) The two major differences include I) a large majority of respondents feel that CSM is not an alternative to dried skim milk fish
12
meal dried whole milk and blood meal in dairy cattle feeds and 2) an overwhelming majority of respondents consider CSM to be an alternative to nearly all the remaining protein feeds for use in dairy cattle rations
bull The importance of nutritional and non-nutritional factors Again the responses are generally the same As was the case for beef cattle respondents however dairy cattle respondents tended to rank the listed non-nutrition-related factors as relatively more important than the listed nutrition-related factors On average dairy cattle feed formulators ranked amino acid balance fiber level and gossypol level as less important factors in the choice of CSM than was the case for the combined responses (Tables 58 and 59) As in the case of both the combined and beef cattle responses aflatoxin was ranked at a higher level of importance than any other single nutrition-related factor Of the non-nutrition-related factors respondents ranked most factors as all slightly more important in the choice of CSM than was the case for the combined responses (Tables 60 and 61)
bull Seasonality of cottonseed meal allailability The results for the dairy cattle respondents are highly consistent with those for both the combined responses and for the beef cattle responses The months of May through September are the months of least availability of CSM which are also the months indicated when CSM is least needed to be available in the perception of dairy cattle respondents (Tables 62 and 63) Again the suggestion is one of little problem of CSM availability although this is not totally the case as indicated by dairy cattle respondents in later questions
bull Reasons for the selection and non-selection of cottonseed meal While price and availability are also the top two reasons that dairy cattle respondents perceived that CSM is selected as a feed ingredient protein contentquality ranked third on their list followed closely by palatability (Table 64) The top two reasons the CSM is not selected according to the dairy cattle respondents were price and availability as with both the combined responses and the beef cattle responses The third reason given by the dairy cattle respondents however was protein qualitylevel followed in fourth place by gossypol (Table 65) Again price was the key CSM characteristic that dairy cattle respondents indicated that must change in order to be used more frequently in dairy cattle rations (Table 66) Availability and gossypol levels were ranked as the second and third CSM characteristics that must change as was the case for the combined responses
bull Source of chemical analyses for cottonseed meal The results for the chemical analyses performed by dairy cattle respondents are virtually identical to those of both the combined results and those of the beef cattle results The primary analysis routinely performed by the dairy cattle respondents is crude protein (121 of the 143 respondents) followed by fiber (94 respondents) and fat (83 respondents) (Tables 67 and 68) The primary analytical values supplied to the dairy cattle respondents also include crude protein (62 respondents) fiber (50 respondents) and fat (47 respondents) (Tables 69 and 70) It is interesting to note that although aflatoxin was ranked at a higher level of importance than any other nutrition-related factor affecting the choice of CSM as feed component only a third of the dairy cattle respondents routinely perform analyses for aflatoxin and only 11 respondents are provided aflatoxin values by their CSM suppliers The story is about the same for both the combined and the beef cattle responses
Dairy cattle sample members were also asked several questions specifically regarding the use of CSM in dairy cattle feed formulations in 6 general areas I) problems resulting from feeding a
13
ration with CSM to the various dairy cattle types 2) details on dairy cattle feed formulations containing whole cottonseed 3) sources of information utilized on formulating dairy cattle feeds 4) protein-related factors considered when balancing rations for dairy cattle 5) gossypol levels considered to be safe for mature dairy cattle and pre-ruminant calves and 6) an open-ended question soliciting suggestions to improve the usefulness or value of CSM for dairy feed formulations
Problems from Feeding CSM Rations to Dairy Cattle
Again very few respondents indicted knowledge of any problems resulting from feeding a ration containing CSM to dairy cattle (Table 71) Only 24 of the respondents indicated problems with calves and only 18 for lactating cows as the result of feeding rations with CSM Only about 3 of the respondents mentioned problems with either dairy heifers or dry cows The number one problem reported was gossypol toxicity primarily in creep feeds and complete rations (Table 72) Both palatability and poor performance problems for various feed types were also frequently mentioned Again however the low number of respondents indicating problems of any type suggests that the problems reported were likely isolated cases
Details on Dairy Cattle Feed Formulations Containing Whole Cottonseed
Over 75 of dairy cattle respondents formulate feeds using whole fuzzy cottonseed a much higher percentage than was the case for beef cattle Less than half of the dairy cattle respondents however utilize delinted cottonseed in their feeds more in line with the beef cattle results (Table 73) Less than half the respondents formulate rations that include both CSM and whole cottonseed (Table 74) For those who formulate rations that include both the mix of the two in the rations varies widely Respondents reported that the share of such rations accounted for by CSM ranged from 1 to 30 with a mean of 85 (Table 75) The share of those rations accounted for by whole cottonseed ranged from 3 to 100 with a mean of 16 (Table 76) It appears therefore that on average dairy feeds formulated with both CSM and whole cottonseed contain a higher percentage of whole cottonseed than of CSM This is just the opposite of the situation for beef cattle
Sources of Information Utilized on Formulating Dairy Cattle Feeds
Over 80 of the dairy cattle respondents indicated that they were familiar with research on feeding CSM to mature dairy cattle (Table 71) Only half however indicated familiarity with such research for pre-ruminant calves Less than 10 of the respondents listed any other research on feeding CSM to other types of dairy cattle (Table 78) The largest number of respondents (137 of 143 respondents) indicated that they utilize university research to obtain information on formulating feeds for dairy cattle followed by industry publications of some type (121 respondents) and university extension service (83 respondents) (Table 79) Only 36 respondents listed other sources of information including primarily personal experience and research (Table 80)
Protein-Related Factors Considered for Balancing Dairy Cattle Rations
Nearly 100 of the dairy cattle respondents indicated that both crude protein level and rumen degradability are factors they consider when balancing rations for dairy cattle a much higher level than is the case for beef cattle (Table 81) Less than half consider amino acid values (61 of 143 respondents) Only 19 respondents indicated that they consider other factors like protein solubility (Table 82)
Dairy cattle respondents indicated a even wider range of escape values (or by-pass values) that they are using for CSM than did beef cattle respondents from 0 to over 80 (Table 83) The mean escape value calculated from the responses is 40 Dairy cattle respondents indicated slightly more
14
confidence in the escape values they are using than was the case for beef (Table 84) Only 22 respondents however considered those escape values to be reliable or extremely reliable The principal single method or source used by respondents for the escape value they use was again the National Research Council (Committee on Animal Nutrition National Academy of Sciences) (Table 85) Book values was the next most frequently mentioned single source of CSM escape values (23) Finally nearly 100 of the respondents indicated an interest in obtaining information on escape values for CSM as processed by different methods (Table 86) The conclusion from the dairy cattle responses is the same as for beef cattle That is there appears to be a lack of reliable information on CSM escape values in the perception of dairy cattle feed formulators and that they are highly interested in obtaining more information in this regard
Gossypol Level Considered Safe for Mature Dairy Cattle and Pre-Ruminant Calves
Dairy cattle respondents appear to have little idea of what the safe levels are for gossypol in mature dairy cattle and pre-ruminant calf feeds First of all only one-third of those who returned surveys even attempted to provide numbers for safe gossypol levels (Tables 87 and 88) Many respondents simply wrote comments such as dont know or not aware of research on safe gossypol level in the margin of the survey beside the question Second those who attempted to answer the questions provided an amazingly wide range of safe gossypol levels from 0 parts per million (ppm) to 7500 ppm for mature dairy cattle and from 0 ppm to 1000 ppm for pre-ruminant calves The mean safe gossypol levels were 609 ppm for mature dairy cattle and 121 ppm for pre-ruminant calves The responses were spread quite evenly between the extremes around the means It should be noted that the research team checked and rechecked the data set for this question to insure there were no errors in data entry
Suggestions for Improving the Usefulness of Cottonseed Meal
Only about 22 of the dairy cattle feed formulators that returned surveys provided suggestions that might improve the value or usefulness of CSM in dairy cattle feed rations (Table 89) Some of the more frequent suggestions dealt with improving the consistency and availability of CSM Several respondents suggested the need for more information on gossypol a worthy suggestion given the results of the previous question
Poultry
The perceptions of poultry feed formulator respondents concerning the use of cottonseed meal differ importantly in many respects from the combined responses over all survey respondents and from those of beef and dairy cattle Many of the differences are likely the result of the distinct dietary needs of ruminant as opposed to non-ruminant animals The salient differences in responses by poultry feed formulators in the 6 general question areas include the following
bull Factors affecting choice of dietary proteins Surprisingly there was little difference in the responses of those indicating that they formulate feed for poultry than for the combined results (or for beef and dairy cattle) regarding the importance of the listed factors (quality price availability consistency and other) affecting the choice of dietary protein (Table 90) A large majority of poultry feed formulators ranked all factors as either important or extremely important The only exception is that consistency was ranked slightly less important by poultry respondents than by respondents in general
bull Cottonseed meal as an alternative protein feed Poultry respondents ranked more protein feeds as higher on the superior-to-CSM scale than was the case for the combined responses
15
(Table 91) In fact the mean rank of all but three of the protein feeds were all at least somewhat higher than was the case for the combined responses The mean rank of several of the other protein feeds as determined by the poultry respondents was much higher than for the combined responses including fish meal poultry by-product meal and soybean meal Poultry by-product meal changed from an inferior to a superior protein feed compared to CSM The protein feed judged by poultry respondents to be most superior to CSM for poultry rations was soybean meal while urea was ranked as most inferior Poultry respondents also appeared to have stronger opinions about whether or not CSM is an alternative to the other listed protein feeds than was the case for the combined responses They overwhelmingly perceived that CSM is not an alternative to many of the other protein feeds including fish meal dried skim milk dried whole milk poultry by-product meal blood meal tankage and urea A larger percentage of poultry respondents than was the case for dairy and beef cattle perceived however that CSM is a definite alternative to many other protein feeds including safflower meal sunflower meal linseed meal peanut meal canola meal feather meal distillers dried grains brewers dried grains and even soybean meal
bull The importance of nutritional and non-nutritional factors Poultry respondents ranked all but two of the listed nutrition-related factors as more important in the choice of CSM over alternative protein feeds for poultry rations than was the case for the combined responses on average (Le comparing mean responses) (Table 92) The highest percentage of poultry respondents ranked gossypol level (62 of the respondents) amino acid balance (59) aflatoxin (58) protein quality (57) and amino acid availability (57) as extremely important in the choice of CSM over alternative protein feeds Only about 5 of the respondents listed other important nutrition-related factors (Table 93) There are few differences however in the poultry responses as compared to the combined responses regarding the importance of non-nutrition-related factors (Table 94) The major difference is a much lower ranking of the importance of palatability in choosing CSM over alternative protein feeds Also a somewhat higher percentage of poultry respondents ranked price as an extremely important non-nutrition-related factor Few other non-nutrition-related factors were listed by the respondents (Table 95)
bull Seasonality of cottonseed meal availability The results for the poultry respondents regarding the months of the year when CSM is not available are highly consistent with those for the combined responses and those for the beef and dairy cattle responses Poultry respondents indicated that May through September are the months of least availability of CSM (Table 96) But likely because of the shorter production cycle for poultry than for cattle poultry respondents indicated that CSM needs to be available in almost every month (but slightly less so in August and September) for CSM to compete effectively with alternative protein feeds (Table 97) For poultry therefore the indication is that poultry feed formulators may perceive an availability problem which inhibits greater use of CSM in poultry rations to some extent
bull Reasons for the selection and non-selection of cottonseed meal Again price and availability are the number one and number two reasons respectively cited by poultry respondents for which CSM is selected as a feed ingredient (Table 98) Protein quality ranked third on their list followed closely by phosphorous content The top reason that CSM is not selected according to the poultry respondents was pricevalue (Table 99) About tied for second place were gossypol content and availability More respondents ranked availability as the second reason than for gossypol content but more respondents listed gossypol first The amino acid level was listed as a distant fourth reason for which CSM is not selected as a feed ingredient Price is again the key CSM characteristic that poultry respondents indicated must change in
16
order for CSM to be used more frequently in poultry rations (Table 100) Gossypol was clearly considered to be the second most important characteristic that must change Availability was ranked as either first or second by all respondents who listed it as a characteristic that must change
bull Source of chemical analyses for cottonseed meal The results for the chemical analyses performed by poultry respondents are similar to those of both the combined results and those of the beef and dairy cattle results The primary analysis routinely performed by the poultry respondents is crude protein (51 of 55 respondents) followed by fat (40 respondents) fiber (37 respondents) and aflatoxin (31 respondents) (Tables 101 and 102) The primary analytical values supplied to the poultry respondents also included crude protein fiber and fat (Table 103) A third of the poultry respondents indicated that their CSM supplier does not provide them with any analytical values Once again even though aflatoxin was ranked as an extremely important nutrition-related factor in the choice of CSM as a feed component only I respondent obtains an analytical value for aflatoxin from his CSM supplier and only a little over half routinely perform their own aflatoxin analyses
Poultry sample members were asked some specific questions regarding the use of CSM in poultry feed formulations in 5 general areas I) problems resulting from feeding a ration with CSM to the various poultry types 2) specific information on several key nutrition-related factors affecting the use of CSM in poultry rations 3) sources of information utilized on formulating poultry feeds 4) CSM price and value and 5) an open-ended question soliciting suggestions to improve the usefulness or value of CSM for poultry feed formulations
Problems from Feeding CSM Rations to Poultry
The majority of poultry respondents indicated no knowledge of any problems associated with feeding a ration containing CSM to poultry (Table 104) Only 14 of the respondents indicated problems with broilers less than 7 for breeding flocks and about 3 for turkeys Over a third however indicated that they had knowledge of such problems with layers The number one problem reported was yolk molting and discoloration primarily in layer rations (Table 105) A few respondents indicated problems with depressed growth associated with broiler feeds containing CSM
Information on Key Nutrition-Related Factors for Poultry Rations
The survey sample members were asked to respond to a number of specific questions related to nutritional factors that affect the use of CSM in poultry rations including protein energy fat gossypol and synthetic amino acids They were then asked to indicate their perception of the overall feeding value of a standard 41 protein CSM compared to that of a standard 44 protein soybean meal The questions were designed primarily to determine the extent of knowledge among feed formulators concerning these factors as they relate to the use of CSM and the relative feeding value of CSM
Sample members were asked to respond to two questions regarding protein in poultry feed rations They were first asked to indicate the specific protein-related factors that they consider when balancing rations for poultry They were given a list of three factors (crude protein level amino acid content and amino acid availability) They were also allowed to specify any other protein-related factors they consider when balancing poultry rations They were then asked to indicate the crude protein levels they would prefer for cottonseed meal and were given a choice of four levels (3641 (standard) 44 and 48) and allowed to suggest any other preference for crude protein level
17
Almost all poultry respondents indicated that they consider amino acid content and availability when balancing feed rations with fewer responding that they consider the crude protein level (Table 106) Other protein-related factors listed by the respondents included amino acid balance protein digestibility and energy levels (Table 107) With regard to preferred crude protein level for CSM over half of the poultry respondents indicated a preference for 48 crude protein (Table 108) About 27 of the respondents were satisfied with the standard 41 level and 20 indicated a preference for a 44 protein CSM No respondents preferred anything less than the standard 41
With respect to energy levels the sample members were asked to indicate what they considered to be the normal maximum and minimum energy levels for protein feeds for broilers layers turkeys and breeding flock As Table 109 indicates the responses varied widely with little or no indication of a mode (most frequent response) in most cases For broilers the maximum (in K Cals DE per pound) ranged from 0 to 1800 and the minimum from 850 to 1700 with a mean maximum of 1436 and a mean minimum of 1276 For layers the maximum (in K Cals DE per pound) ranged from 1000 to 1800 and the minimum from 800 to 1500 with a mean maximum of 1347 and a mean minimum of 1187 For turkeys the maximum (in K Cals DE per pound) ranged from 1100 to 1725 and the minimum from 850 to 1700 with a mean maximum of 1334 and a mean minimum of 1261 For breeding flocks the maximum (in K Cals DE per pound) ranged from 1000 to 1600 and the minimum from 750 to 1600 with a mean maximum of 1328 and a mean minimum of 1159 Given the disparity in the responses it seems clear that there is little common concept of the normal maximum and minimum energy levels for protein feeds
Sample members similarly were asked to indicate the minimum and maximum fat levels they considered critical for protein feeds Although the range of responses was still quite wide there appeared to be more uniformity in responses to this question than the one for energy (Table 110) The maximum fat levels (ether extract as fed basis) indicated by the respondents ranged from 1 to 15 or 20 for most poultry types The minimums ranged from 0 to 15 The mean minimum levels of fat for all poultry types was about 3 The mean maximum ranged from 6 to 82 depending on the poultry type
Sample members were asked to indicate the level of gossypol they considered safe for poultry rations The responses again varied widely from a low of 0 ppm up to a high of 300 ppm for all poultry types (Table III) The highest mean level of gossypol as calculated from the responses to the question were 104 ppm for broilers and 91 ppm for turkeys For layers and breeding flocks the mean levels were much lower at 57 ppm and 54 ppm respectively
The questionnaire also asked the sample members to indicate if they use or would use synthetic amino acids where economical The response was that nearly 100 of all poultry respondents indicated that they have or would use synthetic amino acids in this situation (Table 112) This suggests little real aversion on the part of feed formulators to utilize synthetic amino acids in least cost poultry formulations
To obtain some insight on the general perception of poultry formulators regarding CSM the sample members were asked to indicate the overall feeding value of a standard 41 protein CSM compared to that of a standard 44 protein soybean meal in their opinion on percentage basis They were given the choice of 5 ranges from under 70 to over 100 in 10 increments (see Table 113 for the actual ranges used) Nearly 80 of the respondents indicated that CSM has an overall feeding value of under 90 of that of soybean meal Given the five choices offered to respondents the mean feeding value was around 80
18
Sources of Information Utilized on Formulating Poultry Feeds
About two-thirds of the poultry respondents indicated that they were familiar with research on feeding CSM to broilers and layers (Table 114) Only half however indicated familiarity with such research for turkeys and only a little over a third for breeding flocks Less than 10 of the respondents listed any other research on feeding CSM to other types of poultry (Table 115) To obtain information on formulating feeds for poultry the largest number of respondents (52 of the 55 respondents) indicated that they utilize university research followed by industry publications of some type (45 respondents) university extension services (26 respondents) and government agencies (20 respondents) (Table 116) Only 17 respondents listed other sources of information including primarily personal experience and research (Table 117)
Cottonseed Meal Price and Value
To get some idea concerning the poultry respondents perceptions of the value of CSM particularly with respect to soybean meal sample members were asked 1) if they would be willing to pay a premium per unit of protein for CSM with more than a standard 41 protein and 2) if gossypol and fiber were sufficiently low on average what percent of the cost of soybean meal they would be willing to pay for CSM
With respect to the first question only about half the respondents indicated a willingness to pay a premium for a CSM with more than 41 protein despite the fact that 75 of them indicated earlier that they would prefer a CSM with a higher crude protein level (Table 118) Thus at least 25 of the respondents prefer a higher protein level CSM but would not be willing to pay a premium to get it
In response to the second question poultry respondents indicated that they would only be willing to pay an average of about 76 of the cost of soybean meal for a CSM with a sufficiently low level of gossypol and fiber (Table 119) The range around that average however was fairly large from 50 to 95 Because CSM has traded at about 91 of the value of soybean meal on the market on a protein equivalent basis and about 85 on an unadjusted basis on average in each year since 1984 either poultry respondents are currently unaware of the historical CSM to soybean meal price relationship or they are indicating that the current CSM market price relative to that of soybean meal is substantially above the levels that most find acceptable
Suggestions for Improving the Usefulness of Cottonseed Meal
Only about 27 of the poultry feed formulators that returned surveys provided suggestions that might improve the value or usefulness of CSM in poultry feed rations (Table 120) Some of the more frequent suggestions included the need for more information on the use of CSM in poultry rations increased availability of CSM and nutrient guarantees
Catfish
The perceptions of catfish feed formulator respondents concerning the use of cottonseed meal correspond closely to those of the poultry respondents likely because of the similar dietary needs of non-ruminant animals The salient differences in responses by catfish feed formulators in the 6 general question areas included on this section of the surveys include the following
bull Factors affecting choice of dietary proteins There were no differences in the responses of those indicating that they formulate feed for catfish than for poultry regarding the importance
19
of the listed factors (quality price availability consistency and other) affecting the choice of dietary protein (Table 121) A large majority of catfish respondents ranked all factors as either important or extremely important as did poultry respondents
bull Cottonseed meal as an alternative protein feed As was the case for poultry catfish respondents ranked more protein feeds as higher on the superior-to-CSM scale than was the case for the combined responses (Table 122) Catfish feeders however ranked meat and bone meal and blood meal as even more superior to CSM than did poultry respondents The protein feeds that catfish respondents ranked as roughly similar to CSM included tankage feather meal peanut meal linseed meal corn gluten meal brewers dried grains distillers dried grains sunflower meal safflower meal and canola meal Catfish respondents also appeared to have nearly as strong views about whether or not CSM is an alternative to the other listed protein feeds as did poultry respondents They perceived that CSM is not an alternative to many of the other protein feeds including blood meal dried whole milk meat and bone meal and dried skim milk Catfish respondents also perceived however that CSM is a definite alternative to many other protein feeds including safflower meal canola meal peanut meal sunflower meal linseed meal distillers dried grains brewers dried grains tankage soybean meal wheat middlings corn gluten meal urea and feather meal
bull The importance of nutritional and non-nutritional factors The responses for catfish with regard to the importance of nutrition-related and non-nutrition-related factors in choosing CSM as a component of catfish feeds were roughly similar to those for poultry (Table 123) The salient differences were that a larger percentage of catfish respondents ranked energy level fat level and fiber level as important or extremely important and a much larger percentage ranked aflatoxin as extremely important One major difference of the catfish responses regarding the importance of non-nutrition-related factors from those of poultry is that palatability is much mOre of a concern to catfish feeders (Table 124) Bin space is less important to catfish respondents and service from the CSM industry is more important to them
bull Seasonality of cottonseed meal availability The results for the catfish respondents regarding the months of the year when CSM is not available were generally consistent with those for poultry except that May and June were perceived as less problematic for obtaining CSM supplies by the catfish respondents (Table 125) Catfish formulators perceive that CSM needs to be more available in April through October than during the rest of the year to be competitive with other protein feeds (Table 126) This suggests the perception on the part of catfish feed formulators of a CSM availability problem during about the first half of any given year
bull Reasons for the selection and non-selection of cottonseed meal Pricevalue is the number one reason cited by catfish respondents for which CSM is selected as a feed ingredient followed by protein quality and palatability (Table 127) The top reason that CSM is not selected according to the catfish respondents is pricevalue followed by quality and gossypol level (Table 128) Gossypol level is the key CSM characteristic that catfish respondents indicated must change in order for CSM to be used more frequently in catfish rations (Table 129) Quality was clearly considered to be the second most important characteristic that must change followed by aflatoxin level This is the only animal species for which price was not the number one characteristic cited that would have to change and was not even listed among the top three responses The implication is that catfish feed formulators may not consider the price of cottonseed meal to be out of line with their needs and thus do not consider price to be a particular problem for the use of CSM in catfish rations A word of caution is in order
20
to avoid taking this conclusion too far because of the relatively few number of catfish feed formulators in the sample
bull Source of chemical analyses for cottonseed meal The results for the chemical analyses performed by poultry respondents are similar to those of poultry as well as those of both the combined results and the beef and dairy cattle results The primary analysis routinely performed by the catfish respondents is crude protein followed by fat fiber aflatoxin and gossypol (Tables 130 and 131) The primary analytical values supplied to the catfish respondents also included crude protein fiber and fat (Table 132) Only 2 of the II catfish respondents indicated that their CSM supplier does not provide them with any analytical values Even though gossypol was ranked as an extremely important nutrition-related factor in the choice of CSM as a feed component and the number one CSM characteristic that needs to change only 5 of the II respondents routinely perform gossypol analyses None of catfish respondents obtain analytical values for aflatoxin from their CSM supplier
As for poultry catfish sample members were asked some specific Questions regarding the use of CSM in catfish feed formulations in 5 general areas 1) problems resulting from feeding a ration with CSM to the various catfish types 2) specific information on several key nutrition-related factors affecting the use of CSM in catfish rations 3) sources of information utilized on formulating catfish feeds 4) CSM price and value and 5) an open-ended Question soliciting suggestions to improve the usefulness or value of CSM for catfish feed formulations
Problems from Feeding CSM Rations to Catfish
Absolutely no catfish respondents indicated any knowledge of any problems associated with feeding a ration containing CSM to catfish (Table 133)
Information on Key Nutrition-Related Factors for Catfish Rations
As for poultry the survey sample members were asked to respond to a number of specific Questions related to nutritional factors that affect the use of CSM in catfish rations including protein energy fat gossypol and synthetic amino acids They were then asked to indicate their perception of the overall feeding value of a standard 41 protein CSM compared to that of a standard 44 protein soybean meal Just as for poultry these Questions were designed primarily to determine the extent of knowledge among catfish feed formulators concerning these factors as they relate to the use of CSM and the relative feeding value of CSM
Sample members were asked to respond to two Questions regarding protein in catfish feed rations They were first asked to indicate the specific protein-related factors that they consider when balancing rations for catfish They were given the same list of three factors (crude protein level amino acid content and amino acid availability) to choose from that the poultry sample members were given Again they were also allowed to specify any other protein-related factors they consider when balancing catfish rations They were then asked to indicate the crude protein levels they would prefer for CSM and were given the same choice of four levels as the poultry sample members (36 41 (standard) 44 and 48) and allowed to suggest any other preference for crude protein level In contrast to poultry the largest percentage of catfish respondents indicated that they consider amino acid availability (10 of the 11 catfish respondents) rather than the content when balancing catfish rations (Table 134) The second largest percentage consider crude protein level (9 respondents) also a different result from poultry
21
With regard to the crude protein level for CSM preferred by catfish respondents about 43 indicated a preference for 48 crude protein (Table 135) About 20 of the respondents were satisfied with the standard 41 level and nearly 30 indicated a preference for a 44 protein CSM No respondents preferred anything less than the standard 41 The mean preferred crude protein level was about 42
With respect to energy levels the catfish sample members were asked to indicate what they considered to be the normal maximum and minimum energy levels for protein feeds for fingerlings grow out stock brood stock and fries Despite the low number of catfish respondents the answers to this question were widely divergent (Table 136) For fingerlings the maximum (in K Cals DE per pound) ranged from 1250 to 1800 and the minimum from 2 to 1500 with a mean maximum of 1525 and a mean minimum of 834 For grow out stock the maximum (in K Cals DE per pound) ranged from only 1500 to 1600 and the minimum from 1 to 1300 with a mean maximum of 1550 and a mean minimum of 750 For catfish brood stock the maximum (in K Cals DE per pound) ranged from 1300 to 1700 and the minimum from 1200 to 1400 with a mean maximum of 1500 and a mean minimum of 1300 For fries the maximum (in K Cals DE per pound) ranged from 1250 to 1800 and the minimum from 900 to 1500 with a mean maximum of 1525 and a mean minimum of 1200 Given the disparity in these responses it seems clear again for catfish feed formulators that there is little common concept of the normal maximum and minimum energy levels for protein feeds
Catfish sample members similarly were asked to indicate the minimum and maximum fat levels they considered critical for protein feeds As with poultry the range of responses was still quite wide but there also appeared to be more uniformity in responses to this question than the one for energy level (Table 137) The maximum fat levels (ether extract as fed basis) indicated by the respondents again ranged from 1 to 15 for most catfish types as was the case for poultry The mean minimum levels of fat for all catfish types ranged from about 3 to 5 The mean maximum ranged from 6 to 10 aCrOSS the different catfish types
Catfish sample members were also asked to indicate the level of gossypol they considered safe for catfish rations The responses again varied widely from a low of 0 ppm up to a high of 300 ppm for some catfish types (Table 138) The two highest mean safe levels of gossypol were 97 ppm for grow out stock and 83 ppm for brood stock For fingerlings and fries the safe maximum mean levels were much lower at 44 ppm and 23 ppm respectively
The questionnaire also asked the sample members to indicate if they use or would use synthetic amino acids where economical The response was that 83 (all but 2) of the catfish respondents indicated that they have or would use synthetic amino acids in this situation (Table 139) This suggests little real aversion on the part of feed formulators to utilize synthetic amino acids in least cost catfish formulations
To obtain some insight on the general perception of catfish formulators regarding CSM the sample members were asked to indicate their opinion of the overall feeding value of a standard 41 protein CSM compared to that of a standard 44 protein soybean meal expressed on a percentage basis They were given a choice of 5 ranges from under 70 of the feeding value of soybean meal to over 100 in 10 increments (see Table 140 for the actual ranges used) All but one of the catfish respondents indicated that CSM has an overall feeding value of under 90 of that of soybean meal Given the five choices offered to respondents the mean feeding value of CSM relative to that of soybean meal was around 80
22
Sources of Information UtiJized on Formulating Catfish Feeds
Only about half of the catfish respondents indicated that they were familiar with research on feeding CSM to grow out stock and only a third were familiar with research on fingerlings (Table 141) Only 2 respondents were familiar with any research on feeding CSM to brood stock and fries To obtain information on formulating feeds for catfish the largest number of respondents indicated that they utilize university research and industry publications of some type (Table 142)
Cottonseed Meal Price and Value
Catfish sample members were also asked two Questions to get some idea concerning their perception of the value of CSM particularly with respect to soybean meal 1) if they would be willing to pay a premium per unit of protein for CSM with more than a standard 41 protein and 2) if gossypol and fiber were sufficiently low on average what percent of the cost of soybean meal would they be willing to pay for CSM
With respect to the first Question 75 of the catfish respondents indicated a willingness to pay a premium for a CSM with more than 41 protein which is consistent with their earlier responses that they would prefer a CSM with a higher crude protein level (Table 143)
In response to the second Question catfish respondents indicated that they would only be willing to pay an average of about 82 of the cost of soybean meal for a CSM with a sufficiently low level of gossypol and fiber (Table 144) The range around that average was more narrow than for poultry from 70 to 100 This is more consistent with the ratio of CSM price to soybean meal price that has existed over the last 7 or 8 years on average
Suggestions for Improving the Usefulness of Cottonseed Meal
Only three catfish respondents offered suggestions for improving the usefulness or value of CSM for catfish rations The three suggestions included I) providing a more consistent product in price and Quality 2) providing a premium Quality toxin-free high protein low-fat product superior to soybean meal and 3) eliminating the CHO fraction (Table 145)
Comparisons Among Animal Species
In order to highlight the salient differences in responses with respect to the various animal species the mean responses to Questions that are common among all surveys regarding CSM use as a feed ingredient were compared and analyzed An analysis of variance (ANOY A) was also done to detect statistically significant differences in the mean responses to each Question by animal specie Comparisons are made among the mean responses to all Questions in the 6 general areas to which all sample members were asked to respond regardless of the animal specie(s) for which they formulate feeds 1) the particular factors affecting their choice of dietary proteins for formulated feeds 2) the extent to which CSM is considered to be an alternative to selected protein feeds 3) the importance of nutritional and non-nutritional factors in their decisions to use CSM rather than alternative dietary proteins in their feed formulations 4) the seasonality of CSM availability 5) the specific reasons for the selection and non-selection of CSM for use in the feeds they formulate and 6) the source of CSM chemical analyses used by the respondents Where appropriate ANOY A results are also indicated
23
Factors Affecting Choice of Dietary Proteins
As discussed earlier all members of the final sample regardless of the animal species for which they formulate feeds were asked to rank the importance of four general factors in their choice of a dietary protein for their feed formulations on a scale of I to 7 (from extremely unimportant to extremely important respectively) 1) quality 2) price 3) availability and 4) consistency Comparing the results across animal types reveals few significant differences in the importance attached to any of the four factors by the responding formulators of the various animal specie feeds (ie comparing results horizontally in Table 146) But as pointed out in an earlier section the mean rankings for quality are all higher than those for the other factors while the mean rankings of price are all lower than those for most other factors across all animal types In other words the respondents consistently ranked quality highest on the scale of importance followed in order by consistency availability and price
Cottonseed Meal As An Alternative Protein Feed
Recall that the sample members were asked to rank various selected protein feeds on a scale of 1 to 7 as inferior or superior to CSM in an overall sense for use in feed formulations A second question required respondents to indicate whether or not they considered CSM to be an alternative to each of the 20 listed protein feeds A comparison of the mean ran kings and ANOV A results across animal types indicates substantial agreement among the respondents regarding the ranking of CSM as an alternative to some animal feeds and substantial disagreement with respect to CSM as an alternative to many others (Table 147) Respondents over all animal types tended to agree that certain feeds and in particular the higher crude-protein-content feeds are clearly superior to CSM including dried skim milk meat and bone meal fish meal blood meal soybean meal dried whole milk and corn gluten feed There was a statistically different deviation in the extent to which respondents for some animal species regarded those meals as superior however For example catfish respondents ranked meat and bone meal fish meal poultry by-products blood meal soybean meal and corn gluten meal higher than did respondents for the ruminant animals The same was roughly the case for poultry Beef and dairy cattle respondents tended to rank all other protein feeds as less superior (ie more inferior) to CSM There was also substantial agreement that CSM was about the same as tankage peanut meal linseed meal and brewers and distillers dried grains but superior to some extent over the other feeds particularly those lower in crude protein including dehydrated alfalfa sunflower meal wheat middlings safflower meal canola meal feather meal and urea Beef and dairy cattle respondents agreed that CSM can be considered an alternative to nearly all the protein feeds except perhaps skim and whole dried milk Poultry and catfish respondents indicated CSM is an alternative to fewer of the other protein feeds
The Importance of Nutritional and Non-Nutritional Factors
Respondents also ranked the importance of specific nutrition-related and non-nutritionshyrelated factors in choosing cottonseed meal as a component of the feeds they formulate on a scale of extremely unimportant to extremely important (a scale of I to 7 respectively) Comparing the mean rankings by the respondents reveals that poultry and catfish feed formulators clearly consider proteinshyrelated factors and gossypol level to be more important than do beef and dairy feed formulators (Table 148) Fiber level is also of more importance to formulators of catfish feed Interestingly the importance of fiber was not ranked significantly higher by poultry feed formulators than by beef and dairy cattle feed formulators At the same time aflatoxin was clearly ranked by all respondents as the most important factor affecting the choice of CSM as a feed ingredient irrespective of the animal specie for which the ration is intended
24
For the non-nutritional factors an analysis of the mean rankings indicates few significant differences in the responses across animal species with respect to each individual factor listed (Table 149) The most notable exception is that poultry respondents ranked palatability significantly less important than did any of the other respondents for the other animal species Finally catfish respondents perceived that service by the CSM industry was more important for them than did the respondents for the other animal species
Seasonality of Cottonseed Meal Availability
The respondents across all animal species indicated that CSM is least available between about May and October likely reflecting the increasing shortages of cottonseed meal supply just prior to the cotton harvest in the fall (Figure 20) At the same time however the beef cattle dairy cattle and poultry respondents all indicated that there is less need for CSM to be available during approximately those same months in order to compete effectively with other protein feeds (Figure 21) This suggest that the seasonality of supply may not represent an important constraint to competitiveness and growth possibilities of CSM as a feed ingredient Interestingly catfish respondents suggested a largely inverse pattern of the times of the year when CSM needs to be available to compete effectively with other protein feeds as a catfish feed ingredient Possible explanations of this phenomenon include I) the protein feed needs of catfish feed formulators peak in the late spring and summer months when supply is less available 2) catfish feed formulators are located such that CSM is not easily obtainable particularly during short supply years or 3) formulators of feed for other animal species have longer experience in using CSM and have adjusted their formulation to the pattern of CSM supply availability In any case it should be remembered that there are relatively few catfish feed formulators in the sample so that their joint responses may not be truly representative of all catfish feed formulators In this case this difference in their responses may mean little
Reasons for the Selection and Non-Selection of Cottonseed Meal
Respondents across animal species were quite consistent in their ranking of the top reasons that CSM is included in feed formulations (Table 150) They overwhelmingly ranked price as the top reason followed generally by availability and protein quality Catfish respondents differed somewhat from that order ranking protein quality second and palatability as third Availability was ranked fourth by catfish respondents The top reason all respondents listed for which CSM is not included in feed formulations was also price (Table lSI) Beef and cattle respondents ranked availability as second but poultry respondents ranked gossypol second while catfish respondents ranked protein quality second A vailability ranked only as the third reason that CSM is not selected by poultry respondents and fourth by catfish respondents Gossypol ranked either third or fourth for all animal species except poultry for which gossypol appears to be a more important reason for not including CSM in poultry feed formulations The question regarding the characteristics of CSM that would have to change in order for it to be selected more frequently as a feed ingredient elicited about the same responses as those for the previous question concerning why CSM is not included in feed formulations (Table 152) The top characteristic that would have to change in the opinion of most respondents is price Catfish respondents however listed price extremely low on their list suggesting that other factors are more of a constraint to CSM use in their opinion They ranked gossypol as the number one characteristic that would have to change Availability appeared to be more of a concern to beef and dairy feed formulators than for poultry and catfish formulators
25
Source of Chemical Analyses for Cottonseed Meal
About the same percentage of respondents across animal species perform analytical tests for aflatoxin crude protein fat fiber and gossypol (Figure 22) The only noticeable differences were for aflatoxin and gossypol for which about half the percentage of dairy and beef respondents compared to catfish respondents reported that they routinely perform tests A higher percentage of poultry respondents also appear to perform tests for aflatoxin and gossypol than is the case for beef or cattle respondents Crude protein is tested for by the highest percentage of respondents for all animal species while gossypol is tested for by the smallest percentage of all respondent groups except catfish CSM suppliers are more likely to provide feed formulators with analytical values for crude protein fat and fiber than for aflatoxin or gossypol (Figure 23) A sizeable percentage of the respondents across all animal types reported that their CSM supplier provides no analytical values whatsoever
Summary ofMajor Findings
Of the reams of information normally provided by a study like this relatively little is usually new or profound And of what can be found that appears important only some is little more than interesting or particularly useful Before turning to a discussion of the implications of the study results the major findings across animal groups are briefly summarized first Sifting through the many tables figures and data sets the main findings of the study appear to be the following
bull Quality is the most important factor affecting the choice of dietary proteins by feed formulators followed by consistency and availability Price is the least important of the four factors in making general decisions regarding dietary proteins for animal diets
bull Once feed formulators have set the general parameters for use of dietary proteins in their formulations however price is the most important factor determining the choice among alternative dietary proteins to satisfy the general parameters for dietary protein use in feed formulations
bull When considering whether or not to use CSM as the dietary protein in feeds the nutritional factors of most concern to formulators of feed for non-ruminant animals (poultry and catfish) appear to be protein-related For formulators of ruminant (beef and dairy cattle) feeds aflatoxin level and rumen degradability are the most important nutritional factors
bull The most important non-nutritional factors affecting feed formulators decisions regarding whether or not to use CSM are I) price 2) availability 3) consistent quality and 4) palatability in that order
bull Non-nutritional factors are more important than nutritional factors in the choice of CSM over alternative feeds to fill the dietary protein requirements of feed formulations In general price and availability were ranked above protein quality and other nutrition-related factors as reasons why CSM is and is not chosen as a feed ingredient over alternatives Price and availability were also cited as the characteristics that most need to change in order for CSM to be selected as a feed ingredient more frequently
bull CSM is generally considered to be inferior to higher protein feedstuffs and superior to lower protein feedstuffs This generalization however does not hold for all feeds and all animal types Formulators of ruminant animal feeds ranked many of the higher protein feeds more on a par with CSM than did formulators of non-ruminant animal feeds
26
bull The seasonality of CSM availability is both a positive and a negative factor affecting the use of CSM rather than alternative protein feeds in animal feed rations That is CSM is obviously more likely to be selected as a feed ingredient during months of greater availability than during the months of lower availability In general however the survey responses indicate that CSM is normally available when feed formulators perceive that it needs to be available One word of caution It may be that a higher percentage of CSM users agreed to participate in this survey than those who are currently not using CSM Those who are current CSM users may well have already adjusted their feed purchasing patterns and operations to reflect the seasonal changes in the availability of CSM Consequently current CSM users may perceive less of an availability problem than those who are not currently using CSM In this case the responses to these questions may not be truly representative of the perception of the availability of CSM by feed formulators in general
bull There is a tremendous disparity in the perception of respondents as to the appropriate levels of several key nutrition-related factors for specific livestock rations including energy levels fat levels gossypol levels and escape values (ruminants only) for cottonseed meal For each animal specie the range of variation in the perceived acceptable levels of each of these factors was extremely wide The obvious conclusion is that feed formulators generally lack adequate and reliable information on many factors which are crucial in efficient feed formulation and which have a significant impact on the choice of CSM as a feed ingredient
PROBLEMS AND OPPORTUNITIES FOR EXPANDING COTTONSEED MEAL USE
CSM is somewhat unique among vegetable protein meals in that it is the product of a byshyproduct The volume of the by-product cottonseed available for crushing and the potential supply of CSM depend more on the dynamics of cotton supply and demand than on forces specific to CSM markets This mean that market signals from feed formulators and livestock feeders regarding desired values and characteristics of protein meals likely have little impact on the potential CSM market supply
Since the mid-1970s the share of the annual production of cottonseed fed directly to ruminant livestock has increased steadily from about 5 in 1974 to nearly 40 in 1990 (Figure 24) The consequence has been a marked decline both in the share of the available supply of cottonseed that is crushed and in the ratio of actual to potential cottonseed meal output An increase in the demand for CSM therefore will either bid up the market price of CSM with no additional volume actually used or increase the cottonseed crush to feed use ratio (or some combination thereof) There will be little or no effect on the total amount of cottonseed available
The intent of efforts to expand the market for any commodity is to effect an increase in sales at a higher price For a commodity with a relatively fixed supply the major result of an expansion in demand is solely an increase in price because supply cannot increase to allow an increase in use For a commodity with an unlimited supply successful market expansion efforts simply increase use to the extent of the promotion with no increase in price For a commodity with a supply somewhere in between those two extremes successful market expansion will increase both the price and quantity used Although the situation for cottonseed meal is closer to the fixed supply end of the spectrum market expansion efforts can increase the use of cottonseed meal through an increase in the crush-toshy
27
feed cottonseed use ratio This ratio will increase as the profitability of crushing vs alternative uses of the seed increase
The results of this survey however indicate both some problems and possible opportunities for expanding cottonseed meal use After briefly summarizing the major obstacles as identified in the study the major opportunities for expanding use of cottonseed meal will be discussed
Problems for Expanding Cottonseed Meal Use
The major problems for expanding CSM use are generally well known and verified by the survey results The major problems that would hinder efforts to expand cottonseed meal use identified in the study included primarily the following
bull Price and availability of CSM are the major factors affecting the selection or non-selection of CSM as an ingredient of feed formulations regardless of animal specie These nonshynutritional factors were judged to be more important than nutritional factors in selecting CSM as a feed ingredient Unfortunately neither the price nor the availability of CSM can be controlled or altered substantially or directly by market expansion efforts Some efforts to improve availability may be possible as discussed in the next section
bull CSM is perceived to be inferior in an overall sense to a number of key protein feeds CSM was judged by the survey respondents to be clearly superior in aggregate to only 5 of 20 potential alternate protein feeds Such an image could work against efforts to expand CSM use
bull Gossypol level is one of the top reasons that CSM is not used more frequently particularly in non-ruminant feed rations The level of gossypol is a unique characteristic of CSM that obviously cannot be changed through market expansion activities
bull Several other specific characteristics of CSM would likely need to change for CSM to be selected more frequently as a feed ingredient including amino acid balance energy level aflatoxin level and protein quality As with gossypol changes in these characteristics are out of the realm of market expansion programs
bull Feed formulators generally lack adequate and reliable information on many factors which are crucial in efficient feed formulation and which likely have a significant impact on the choice of protein feedstuffs The use of CSM in livestock feed rations is likely restricted by the wide disparity in the perception of feed formulators regarding the appropriate levels of several key nutrition-related factors for specific livestock rations including energy levels fat levels gossypol levels and escape values (ruminants only) for cottonseed meal
bull Over 75 of dairy cattle feed formulators and nearly half of beef cattle feed formulators utilize whole fuzzy cottonseed to some extent in some of the feed rations they formulate Relatively few reported using utilizing both CSM and whole cottonseed in the same ration A main attraction of the use of whole fuzzy cottonseed as opposed to cottonseed meal is the fiber content Indeed the use of whole delinted cottonseed in cattle feed rations is much lower
28
Opportunities for Expanding Use of Cottonseed Meal
There are essentially only two basic tools to expand the market for any commodity l market development and 2) enhancing the efficiency of the marketing system Market development involves a wide range of activities including primarily new product development and product differentiation In new product development the effort is to develop new products or characteristics of products that appeal to different segments of consumers An example might be research leading to the elimination of gossypol in cottonseed meal which could further open up the non-ruminant feed industry to cottonseed meal
Product differentiation on the other hand encompasses those activities designed to create a user preference for or loyalty to a commodity Product differentiation occurs in two major forms 1) advertising and 2) variation in design and quality of product The primary purpose of advertising is to create user preference for a commodity and convince users of the superiority of a product over competing products Actual physical differences in the product are not necessary to successfully differentiate it from competing products It is sufficient only that users believe that some superiority exists Advertising often intends to create an image of superior quality because such images are harder to imitate or successfully counter than physically unique features Successful differentiation of a product means that users become less sensitive to price changes more willing to pay a higher price for the same quantity because they prefer the product and are loyal to it in the face of price increases In other words users are willing to pay more for the same amount because advertising if successful creates a preference for the product over competing products
Variations in quality and design are usually used along with advertising to differentiate the product of one seller from that of another Such variations are often necessary to help create the superior images desired andor attract new sets of consumers
Often barriers exist in a marketing system that hinder the efficient functioning of the market and restrict the flow of commodities from sellers to users Enhancing the efficiency of the marketing system through eliminating such barriers can lead to an expansion in the use of a commodity One of the primary requirements of an efficiently functioning market is that sellers and users possess adequate and accurate information regarding the product its characteristics availability sources uses and value among other things Inadequate or inaccurate information regarding a particular product and other market characteristics can divert demand to alternative products with which users may be more familiar regardless of whether or not those products are better in some sense
The concept and importance of enhancing market efficiency in this regard can be illustrated by comparing the flow of information about a product and market conditions with a radio broadcasting system The efficiency of such a system depends on how accurately the microphone and other equipment record sound how accurately and rapidly that sound is transmitted to a radio receiver and how accurately the receiver brings sound to the listener A breakdown anywhere along the line in that system will simply mean that the message of the broadcast does not get from the radio station to the listener Also if the message gets through but static interferes with the transmission the listener might only receive part of the message or a garbled message The listeners impressions and actions consequently might be quite different than if he had received the message intended In quite the same manner the flow of a commodity from producers to users is affected by how rapidly and accurately market information is evaluated and how accurately and rapidly this information is transmitted to and among producers and users Any breakdown or static in the system would result in a smaller and more obstructed flow of the commodity to users than if the market operated more efficiently
29
The survey results suggests possible opportunities for expanding CSM use through market development and enhancing market efficiency Market development opportunities may be limited because of the nature of the CSM supply situation Nevertheless expansion of CSM use is possible through a reduction in direct feeding of cottonseed so that opportunities for expanding use through market expansion efforts should not be discounted Efforts to enhance the adequacy and accuracy of information regarding the use of CSM as a feed ingredient however may well be the most effective means of promoting an expansion of use or enhancement of the value of CSM
Opportunities for Expansion through Market Development
Although many product development opportunities likely exist for CSM the survey basically focused on the image of CSM in the perception of feed formulators If a market development approach to expanding the use of CSM as an ingredient of animal feed formulations has any chance of success the survey results suggest that the following components of such a strategy will be crucial
bull Product quality and consistency and an improved image of availability must be the major targets of promotion efforts The survey responses across all animal types unequivocally indicated that these three factors are the prime considerations in making general decisions regarding dietary proteins for animal rations Price only becomes a factor in specific decisions regarding the particular protein feed to use to fill the dietary protein requirements of feed formulations after these general concerns are addressed Creating an image of quality consistency and availability for CSM is a necessary first step to expanding use and enhancing value
bull CSM use expansion efforts must focus to some extent on reducing the direct feeding of whole cottonseed to beef and dairy cattle Reductions in direct feeding is the only chance for an increase in supply of CSM to fuel expanded use in newer markets such as catfish and poultry feeding Also because beef and dairy cattle are major users of cottonseed meal a decrease in feeding of whole cottonseed in favor of CSM would significantly expand use
bull Separate CSM market promotion messages must be developed to address the very different needs and concerns of ruminant vs non-ruminant feed formulators The survey results clearly indicate that many nutritional and non-nutritional factors are more important for nonshyruminant feed formulators than for ruminant feed formulators and vice versa
bull The nutrition-related content of CSM market promotion messages must emphasize primarily positive aspects of CSM protein quality amino acid balance and amino acid availability as well as an accurate understanding of appropriate gossypol and aflatoxin levels Many of these factors however are more important for non-ruminant rather than ruminant feed formulators which must be accounted for in designing appropriate messages for feed formulators of each animal type
bull The non-nutrition-related content of CSM market promotion messages may well be the most important and must emphasize primarily the positive aspects of price availability consistency of quality and storability The survey results attached a relatively high level of importance also to nutrient guarantees Although not scoring particularly high in the responses services available from the CSM industry may also be a helpful component of CSM use promotion messages
30
Opportunities for Expansion through Market Emciency Enhancement
Even though some gains in CSM use and market value can reasonably be expected through market expansion efforts the cost involved could easily outweigh any benefits in terms of enhanced profits to the CSM industry Perhaps the most cost-effective appropriate and useful means of enhancing the use of CSM would be a strategy aimed at improving the level and accuracy of information available regarding CSM and its use Lack of information or misinformation can easily discourage feed formulators from using CSM in their feed formulations Strategies to enhance the quantity and accuracy of appropriate information can take on many forms from media advertising to market news letters Although it is beyond the scope of this study to develop alternative information strategies the results of this study clearly indicate a number of areas in which enhanced and more accurate information is a critical need These include the following
bull The overall quality of CSM The study suggests that the negative aspects of CSM are well known Less well known are the specific positive aspects of CSM that may give it an edge in some sense over other protein feeds
bull The ideal ratio of the price of CSM to other feeds like soybean meal The study results indicate that feed formulators may not be adequately informed about what the ideal market value of CSM is relative to soybean meal given the differences in feeding value As a consequence CSM may currently be less used in relation to soybean meal than current market price ratios suggest should be the case
bull Protein-related factors for CSM use in non-ruminant feeds These factors are a major concern in the decisions of feed formulators to include or exclude CSM in feed rations
bull The relationship of aflatoxin to CSM and the rumen degradability of CSM particularly for beef and dairy cattle feed formulators These were the nutritional factors of greatest concern to ruminant feed formulators in the decision to include CSM in their feed formulations
bull CSM price availability consistency and palatability These were indicated to be the most important non-nutritional factors affecting feed formulators decisions regarding whether or not to use CSM The study indicates that information on non-nutritional factors may be more important in the decision to use CSM over alternative feeds to fill dietary protein requirements of feed rations than information on nutritional factors
bull The feeding value of CSM relative to alternative protein feeds An accurate and detailed assessment of the extent to which CSM may be superior as an alternative to other standard protein feeds would help position CSM appropriately in the market
bull The appropriate and acceptable levels of several key parameters affecting the use of CSM in animal feed rations including energy levels fat levels gossypol levels and escape values (ruminants only) Feed formulators generally lack adequate and reliable information on these and likely other parameters not included in the study which are crucial in efficient feed formulation and which have a significant impact on the choice of protein feedstuffs Although it appears that nearly all feed formulators routinely perform crude protein analyses few perform analyses for aflatoxin gossypol fat fiber and other parameters Also CSM suppliers are apparently doing an inadequate job currently of providing such information to feed formulators
31
SOME CONCLUDING COMMENTS AND RECOMMENDATIONS
This study assessed the potential problems and opportunities for expanding the use of CSM through an analysis of the perceptions of feed formulators regarding the use of CSM as an animal feed ingredient The perceptions of feed formulators regarding CSM as a protein feed largely define the boundaries within which CSM use will be able to achieve any significant growth in the future Their perceptions right or wrong are the key to understanding not only the problems facing CSM use but also the opportunities
The general conclusion of the study is an obvious one the use of CSM in feed formulations faces some major challenges in the future Chief among these include a perception among feed formulators that price availability quality and other key CSM characteristics are often obstacles precluding increased use of CSM in their feed formulations Perhaps the most important implication of the study is that a serious lack of adequate and accurate information among feed formulators regarding the characteristics parameters value and other aspects of cottonseed meal use in animal feed rations may be seriously restricting the market opportunities for cottonseed meal U nfortunately the development of alternative strategies to expand the use of CSM and enhance the efficient functioning of CSM markets through more accurate and available information on all aspects of CSM use in feed formulations is beyond this study Nevertheless a few recommendations pertinent to the development of such alternative strategies are in order
bull Before adopting any approach to expand the use of CSM it would be useful first to conduct a detailed analysis of the costs and benefits involved Market promotion efforts through advertising can be extremely costly and yield relatively little Research has also shown that there is often a tremendous lag between advertising and promotion expenditures and any associated returns It could take years of investment in such market expansion efforts before an accurate measurement of the actual return on investment could even be attempted
bull Consider developing first a detailed plan for information dissemination to the feed industry regarding all appropriate aspects of CSM use in feed rations as determined in this study An important part of this process would be a comprehensive assessment of the information needs and the information resources readily available The gap discovered in this way between needs and resources will help set the research agenda for the industry to fill the critical existing information gaps
bull Initiate a study of final user attitudes and perceptions of CSM use as a guide to future market expansion efforts This study considered only the perceptions of feed formulators regarding the use of CSM But feed formulators are often not the final users Consulting nutritionists for example often include or exclude certain feeds and feed types from their formulations as requested by feed users At least a few of the respondents to the survey conducted for this study indicated that user preferences are major factors determining whether or not CSM is included in their feed formulations Indeed markets operate as the interaction of supply and demand to determine prices The preferences of final users ultimately will be expressed in the market values of any product in any market unless sufficient obstacles exist to prevent the market from functioning properly Therefore the real decision-makers in the use CSM in the market may well include many more individuals than adequately represented by feed formulators
32
REFERENCES
US Department of Agriculture (USDAa) Feed Situation and Outlook Report Economic Research Service FDS series various issues
US Department of Agriculture (USDA b) Oil Crops Situation and Outlook Yearbook Economic Research Service OCS Series various issues
Figure 1 Quantity of Oilseed Meals Fed to Livestock 194849 - 198590 (Average)
(1000 Tons)
25000 0-1-----------------------shy
20000 I-~
15000
10000
5000
o L 1 J tJ t tmiddotmiddotmiddot 1 oj 1 to bullbull 1 L_ n __LLL I 1 bullbull I V I
1948-49 1950-54 1955-59 1960-64 1965-69 1970-74 1975-79 1980-84 1985-90
(Years)
n iflu Soybean Meal bull Cottonseed Meal Other Oilseed Meals
Source USDA
c
8 c a CD
en ~
--I _ scg ~CD 01)-- en - () mg0 s 0
JCD enOJ CD_CD en 0
sCDCD 0 OJ shyo OJ r Jlt- 0 m CJ) 0 0lt o 0shyCD OJ J
~s ~m cpCJ) r co OJco ~m a
Figure 3 Price Premium (+) or Discount (-) of Cottonseed Meal Relative to Soybean Meal 1956-1990
~~ ~
o I ~ I I
-20 f---
-40
-60
1~1~1~1~1~1~1~1~1~1~1~1~1~1~1~1~1~1~
Cottonseed meal price is adjusted to a soybean meal protein equivalent basis
~I------------------------------------------------------
l l A
I~middotmiddot--- --------
Figure 4 Animal Species for which Respondents Formulate Feeds
DAIRY CATILE
BEEFCATILE
HORSES
SHEEP
BROILERS
LAYERS
OTHER
PETS
TURKEY
SWINE
CATFISH
210
21000
0 5 1000 15 20 25
Figure 5 Respondents Formulating Feeds for the Various Animal Species
0 20 40 60 80
Figure 6 Other Animal Species for Which Respondents Formulate Feeds
DAIRY CATTLE
BEEF CATTLE
HORSES
SHEEP
BROILERS
LAYERS
OTHER
PETS
TURKEY
SWINE
CATFISH
632
Exotics
Trout
Alligators
KOI
Breeding Hens
Wildlife
Rabbits
Avian
Shrimp
Salmon
Ducks
Fish
Gamebirds
Hybrid Bass
379
~--~----~--~----~----~--~----~--~----~--~
0 10 20 30 40 50
Figure 7 Respondent Feed Formulation Activities by State
( of Respondents)
o 00 middot15 16 -30 31 middot45Cgt 46 -60 61 - 75 - 76 -90
Table 8 Respondent Experience as an Animal Nutritionist
( of Respondents) 30 r---shy
25 t-middotmiddotmiddotmiddotmiddotmiddotmiddotmiddotmiddotmiddotmiddotmiddotmiddot-middot ---_ _
20 -_ -nNItshy
15
10
5
0 1-5 6-10 11-15 16-20 21-25 26-30 31-35 36-40 41-45
(Years Of Experience)
-it sa 0 m 8 l 0 CD l g
_ cc c -s CD CObull
-0 -s- 3 Dl ~ IJ CD (fJ
C 0 l C CD l -+
raquo Sl_ lt_ -+_ CD (fJ
Figure 10 Respondent Primary Feed Formulations
by Animal Type 1990 (Percent)
30 I--------------------------------------------------------shy
25 r- middotmiddotmiddotmiddotmiddotmiddot231middotmiddotmiddotmiddot
20
15
10
5
0 Beef Dairy Swine Poultry Horses Pets Aqua- Sheep Exotics
Cattle Cattle culture amp Goats
(Animal Type)
Figure 11 Percent of CSM and S8M Used in Formulations by Feed Manufacturer Respondents 1990
( of Average Feed Ration)
Figure 12 Tons of Feed Formulated by Feed Manufacturer Respondents 1990
65
91
6 9
17
Total Formulations Formulations With CSM
II Less than 200000 Tons
II 200000 - 400000 Tons bullbullbull I bullbullbullbullbullbull ~ 3 ~ 400000 - 600000 Tons
5 rn 600 000 - 800 000 Tonsru 1
[] 800000 - 1000000 Tons9 4
I ~ 1 More Than 1000000 Tons
Formulations With S8M
Figure 13 Percent middotof Beef Cattle Respondents Formulating CSM Feeds for Specific Beef Cattle Types
( of Respondents)
25 ~I------------------------------------------------------~
-Isectig Feedlot-II 223
20
15
10
5
0
bull Other
~ middotmiddotmiddotmiddotmiddotmiddotmiddot middotmiddot _middotmiddotmiddotmiddot-=middotmiddotmiddotccmiddotcmiddotmiddot
Brood Cows Bulls Calves Feeder Heifer Stocker
(Animal Type)
Figure 14 Percent of Dairy Cattle Respondents Formulating CSM Feeds for Specific Dairy Cattle Types
( of Respondents)
120 ----------------------
100 88
80
60
40
20
0 Calves Heifers Lactating Cows Dry Cows
(Animal Type)
Figure 1-5 Percent of Poultry Respondents Formulating CSM Feeds for Specific Poultry Types
( of Respondents)
OO~I--------------------------------------------~-
50 1-laquolaquolt--laquolaquolaquo -lt - lt - lt -lt laquo lt
44
40
30
20
10
0
f-
~laquolaquolaquolaquo
~laquolaquolaquolaquolaquolaquo
Broilers Layers Turkeys Breeding Flocks
(Animal Type)
Figure 16~ Combined Responses Months of the Year When CSM IS NOT Available
( of Respondents) 16 i ---
14 12~8
12
10
87373 7
6
4
2
0 ~~ ~s ~( ~( ~0( ~0(~~~ ~~ ~t ~1 u~ ~g n0~ ad-o N0~ ~a~
~Y ~o Q~lmiddotr
(Month)
Figure 17 Combined Responses Months of the Year When CSM Needs to Be Available
( of Respondents) 12 ---------------------------
10
8
6
4
2
0
goA 9
~ui ~s ~Ot X)Ot ~Ot X)Ot~0SV~0~~erl ~iSclt ~f ~~1 ~v~ ug ~o~ o~o NO~ co~0 0lt609 ~o
(Month)
Figure 18 Beef Cattle Responses Percent of Respondents Formulating Creep Feed for Calves or Supplements for Stockers
733
832
0 20 40 60 80 100 120
( of Respondents)
Figure 19 Beef Cattle Responses Protein-Related Factors Considered When Balancing Rations
Other Protein Factors 110
Rumen
Degradability 686
Crude Protein Level 161
Amino Acid
Values 42
( of Respondents)
Figure 21 Comparison of Responses Months When CSM Needs to Be Available
( of Respondents) 94 ---------------------------shy
92
9
88
86
84
82 8
78
76
74
72
7
68
66
~ euroI - It
64 -t----------------------------------- -----------t
JAN FEB MAR APR MAY JUN JUL AUG SEP OCT NOV DEC
(Month)
bull Beef Cattle -t Dairy Cattle ltgt Poultry Catfish
Figure 20 Comparison of Responses Months When CSM Is Not Available
( of Respondents)
16 t 15
14
13
12
11
10
9
8ltl amp
7
6
5 I JAN
I
FEB I
MAR I
APR I
MAY I
JUN I
JUL I
AUG SEP I
OCT NOV I
DEC
(Month)
bull Beef Cattle -t Dairy Cattle ltgt PouHry b Catfish
Figure 22 Comparison of Responses Analyses Routinely Performed
( of Respondents)
100~-----------------------------------------------
90
80
70
60
50
40
30
20
10
o I ~
AFLATOXIN C PROTEIN FAT FIBER GOSSYPOL OTHER NONE
(Analyses)
bull Beef Cattle Dairy Cattle o Poultry Catfish-t fj
Figure 23 Comparison of Responses Analytical Values Provided by Supplier
( of Respondents)
60shy
50
4)
30
20
10
o amp ~
AFLATOXIN C PROTEIN FAT FIBER GOSSYPOL OTHER NONE
(Analyses)
bull Beef Cattle -t Dairy cattle o Poultry b Catfish
Figure 24 Share of Cottonseed Use Crush vs Feed Use
( of Respondents)
100 I
90
CRUSH 80
70
60
50
40
30
20
FEED USE 10
o 1~ 1~ 1~ 1m 1m 1~ 1~ 1~ 1~ 1~ 1~ 1~ 1~ 1~
(Year)
Source USDAb
Table 1 Percentage of Beef Cattle Feeds Formula ted Table 2 CSM Feeds Formulated for Beef Cattle CSMmiddot Calvesmiddot
middotAverage Response Rate (feedlot=51 other=41) middotResponse Rate = 39
Table 3 CSM Feeds Formulated for Beef Cattle Table 4 CSM Feeds Formulated for Beef Cattle Stockersmiddot
middotResponse Rate = 40
Response Rate =37
Table 5 CSM Feeds Formulated for Beef Cattle Table 6 CSM Feeds Formulated for Beef Cattle
middotResponse Rate =33
middotResponse Rate = 37
Table 8 Percentage of Dairy Cattle Feeds Formulated CSM
Average Response Rate =88
middotResponse Rate = 37
Table 9 CSM Feeds Formulated for Dairy Cattle Table 10 CSM Feeds Formulated for Dairy Cattle
RespooseRate 24
middotResponse Rate = 34
Table 11 CSM Feeds Formulated for Dairy Cattle Table 12 CSM Feeds Formulated for Dairy Cattle
Response Rate = 31 Response Rate = 45
Table 13 Percentage of Poultry Feeds Formulated Using CSMmiddot
bullAverage Response Rate = 79
Table 14 Percentage of Catfish Feeds Formulated Using CSMmiddot
bullAverage Response Rate =67
Table 15 CSM Feeds Formulated for Catfishmiddot )middoti middot fteq~
bullAverage Response Rate = 17
Table 16 Combined Responses Importance of Specific Factors in Choice of Dietary Protein ( of
bullAverage Response Rate =g]
Table 17 Combined Responses Other Important Factors in
bullAverage Response Rate = 22
bullAverage Response Rate =91
-Average Response Rate =90
Table 20 Combined Responses Importance of Non - Nutrition -Related Factors in Choice of CSM over Alternative Protein Feeds ( of
-Average Response Rate = 87
Table 22 Combined Responses Top S Reasons Why CSM IS NOT Selected as a Feed
Table 23 Combined Responses Top 5 Specific Characteristics That Would Have to Change for CSM to be Selected as a Feed
Table 24 Combined Responses Analysis Routinely Performed
Table 25 Combined Responses Analysis Values Provided
CSM
267 067 333 333 1400 S333
467 000 067 067 1400 4867 --shy
467 000 000 067 400 4333 --shy -- shy -- shy
250 000 000 000 1250 4000 -- shy --shy
313R 4733 62 ------ shy~ - shy ~-
4S00 62
bullAverage Response Rate = 100
bullAverage Response Rate = 87
Table 28 Beef Cattle Responses Imponance of Nutrition-Related Factors in Choice of CSM Over Alternative Protein Feeds
Average Response Rate = 91
Table 29 Beef Cattle Responses Other Nutrition - Related
Fact~~~~~~~~~~~~~~~~~~~
Response Rate =7
Table 30 Beef Cattle Responses Imponance of Non - Nutrition - Related Factors in Choice of CSM Over Alternative Protein Feeds
middotAverage Response Rate = 87
middotResponse Rate = 5
bullAverage Response Rate =14
Table 33 Beef Cattle Responses Months of the Year When CSM Needs to Be AvaiJable I ii middot middot1
bullAverage Response Rate =53
10 U
-Moy
JIIJ
All
so
0_ -
to
--I No
Moy
10 -so shy
0_ _ 0-
Table 35 Beef Cattle Responses Top 5 Reasons Why CSM Is Not Selected as a Feed
Average Response Rate =100 Response Rate = 24
Response Rate =28
Average Response Rate = 98
Response Rate = 17
middotResponse Rate =9
Table 43 Beef cattle Responses Type of Creep Feed
middotResponse Rate = 81
middotResponse Rate =26
Table 45 Beef cattle Responses Respondents Formulating Rations With CSM and Whole
middotResponse Rate = 68
Table 47 Beef cattle Responses Percentage of Whole Cottonseed Respondents Mix in Rations Containing Both CSM and Whole Cottonseedmiddot tCmiddotHiitjt~ middotmiddotmiddotmiddot1
middotResponse Rate =25
middotResponse Rate = 30
bull Response Rate = 98
Response Rate =11
Table 51 Beef Cattle Responses Escape Value Respondents Are Using for Rumen Degradabilitymiddot
1~iiii middotb~r~~fgtD zq436imiddotmiddotmiddotmiddotmiddotmiddotmiddot 004bullbullbullbullbullbullbullbullbullbull1----22--+----31-4
I~~I 23 329
middotResponse Rate = 57
Table 53 Beef Cattle Responses Methods or Sources Respondents Used to Calculate CSM
Table 52 Beef Cattle Responses Reliability of Escape Values Used
Table 54 Beef Cattle Responses Interested in Knowing Escape Values for CSM Processed
Valuemiddot
middotResponse Rate =98
)
I Mean ~nse
63 57S19 228381 Q-L_uu ~139 59468 32306 139bullII1 1 061 06
1 1 44 430 614431-------- 57t 001 001 middot-1
==~=-__~~1c9 00 _ 06 _ 001_ 38 133 323 63
Average Response Rate =100
Response Rate = 89
Table 58 Dairy Cattle Responses Importance of Nutrition - Related Factors in Choice ofCSM Over Alternative Protein Feeds (ofbmiddotNmiddotmiddotmiddotmiddotmiddotmiddot
Response Rate =88
Table 59 Dairy Cattle Responses Other Nutrition-Related Factors
Indicated br~~P211dents
Response Rate =10
Table 60 Dairy Cattle Responses Importance of Non- Nutrition - Related Factors in Choice of CSM Over Alternative
Protein Feeds ( ofResPOndents~dd
Response Rate = 88
Response Rate = 3
--
Average Response Rate = 51
Table 62 Dairy Cattle Responses Months in the Year When CSM IS NOT Available
10 u
J -- AIIIi
--~ shy
loOoIMr _ 0-
bullAverage Response Rate =69
--- AIIIi
--~ soM
0
0-_
10
Table 65 Dairy Cattle Responses Top 5 Reasons Why CSM IS NOT Selected as a Peed
Table 66 Dairy Cattle Responses Top 5 Specific Characteristics That Would Have to ro1 ____ for CSM to be Selected as a Feed
Table 67 Dairy Cattle Responses Analyses Routinely Performed fmiddotmiddotmiddotmiddot
Response Rate =96
Response Rate =56
Table 68 Dairy Cattle Responses Other Analyses
Response Rate =25
Table 70 Dairy Cattle Other Analytical Values CSM
Response Rate =4
Average Response Rate =81
Average Response Rate = 15
Table 73 Dairy Cattle Responses Respondents Formulating Feeds With Whole andor Delinted
Cottonseed bull
bullAverage Response Rate =92
middotResponse Rate = 40
Table 74 Dairy Cattle Responses Respondents Formulating Rations with Cottonseed Meal and Whole Cottonseed in the Same Rationmiddot
middotResponse Rate = 97
Table 76 Dairy Cattle Responses Percentage of Whole Cottonseed Respondents Mix in Rations
ltltJIltainin(a0th CSM and WhoeCottonseedmiddot Mean
middotResponse Rate = 42
Table 77 Dairy Cattle Responses Knowledge of Research on Feedine CSM
~~~~
Average Response Rate = 68
Response Rate =7
Average Response Rate =59
Response Rate =25
Average Response Rate =63
Response Rate = 13
middotResponse Rate = 92
Response Rate =82
Table 85 Dairy Cattle Responses Methods or Sources Used to Calculate CSM
Response Rate = 73
Table 86 Dairy Cattle Responses Respondents Interested in Knowing Escape Values for CSM Processed from Different Methodsmiddot fmiddotmiddotmiddotmiddotmiddotmiddot
Response Rate = 92
Response Rate = 34
Table 89 Dairy Cattle Responses Suggestions for CSM
Response Rate =33 Response Rate =22
-----
64 139 24815 00 36 511 5751
5951 131 438 35015 00 15 I-~~~~~
6200 15 423 51151 00 00 ~~~ -~~~ -~~~ ~~~-~~ --~~ ~ ~ ~~-~ ~
292 55125 00 00 125 45800
bullAverage Response Rate =99
Average Response Rate =85
Table 92 Poultry Responses Importance of Nutrition - Related Factors in Choice of CSM Over Alternative Protein Feeds (of
Average Response Rate =85
Table 93 Poultry Responses Other Nutrition-Related Factors Indicated
200
200
Response Rate = 5
Table 94 Poultry Responses Importance of Non - Nutrition - Related Factors in Choice of CSM Over Alternative Protein
Feeds~~~~~~~~~~5=~~~~~T7~~
00 Average Response Rate =83
Response Rate =4
Average Response Rate = 17
Table 97 Poultry Responses Months in the
J
p
April
lao
A
shy-- 0
ft
April
_
Average Response Rate = 43
=1 g L
0
Table 99 Poultry Responses Top 5 Reasons Why CSM IS NOT Selected as a Feed
Table 100 Poultry Responses Top 5 Specific Characteristics That Would Have to Change for
CSM to be Selected as a Feed Inoredient
Table 101 Poultry Responses Analyses Routinely
middotResponse Rate = 93
Table 102 Poultry Responses Other Analyses Routinely
Performed
middotResponse Rate = 27
Table 103 Poultry Responses Analytical Values Provided
middotResponse Rate =73
Table 104 Poultry Responses Knowledge of Problems
bullAverage Response Rate = 62
Average Response Rate = 14
Table 106 Poultry Responses Protein - Related Factors
Average Response Rate = 64
Table 107 Poultry Responses Other Protein - Related
Response Rate =11
Table 108 Poultry Responses Crude Protein Levels
Preferred for CSM
Response Rate = 55
Table 111 Poultry Responses Gossypol Levels Considered
Safe
Table 112 Poultry Responses Would or Do Use Table 113 Poultry Responses Relative Feeding Value of CSM Comoared to 44 SBMmiddot
middotResponse Rate = 96
bull Response Rate = 100
Table 114 Poultry Responses Knowledge of Table 115 Poultry Responses Familiarity with Other Feedino CSMmiddot
middotResponse Rate =7 bull Response Rate = 73
middotResponseRate = 31
bullAverage Response Rate = 58
Table 118 Poultry Responses Willingness to Pay
a Premium Per Unit of Protein for CSM With More
Than 41 Protein
bullResponse Rate =91
Table 119 Poultry Responses Percent of Cost of SBM Respondents Willing to Pay for CSM with
Response Rate =27
Response Rate =64
00 00 87 43 478 304 57 00 00
----shy I--~~
00 ~-~
43 522 348 59 ----shy
62~ 00 00 00 261 ----shy
652 ------shy
00 00 00 00 667 333 63 AverageResponseRate = 99
bullAverage Response Rate = 73
Table 123 Catfish Responses Importance of Nutrition - Related Factors in Choice of CSM Over Alternative Protein Feeds
Average Response Rate =83
Table 124 Catfish Responses Importance of Non- Nutrition - Related Factors in Choice of CSM Over Alternative Protein
Feeds
Average Response Rate = 90
bullAverage Response Rate = 13
Igt 20
s_
Pshy s
--s
H_
_
gt 7 bull bull bull bull bull
1 fsI plusmn -
haMr
N__
shy
bullAverage Response Rate =54
Table 128 Catfish Responses Top 5 Reasons Why CSM IS NOT Selected as a Feed
Table 129 Catfish Responses Top 5 Specific Characteristics That Would Have to Change for CSM to Be Selected as a Feed-_
Table 130 Catfish Responses Analyses Routinely Table 131 Catfish Responses Other Analyses Routinely Performed
middotResponse Rate = 25
middotResponse Rate =92
bullAverage Response Rate = 18
Table 133 Catfish Responses Knowledge of Problems Feedine CSM to CatflSh
Average Response Rate =100
Table 134 Catfish Responses Protein - Related Factors Considered i
Response Rate = 83
Table 135 Catfish Responses Crude Protein Levels Preferred for CSM
Response Rate = 100
Table 139 Catfish Responses Would or Do Use Table 140 Catfish Responses Relative Feeding
Value ofCSM Compared to 44~ Lmiddotmiddotmiddotmiddotmiddotmiddotmiddotmiddotmiddotmiddotmiddotmiddotmiddotmiddotmiddotmiddotmiddotmiddotmiddot _
Response Rate = 100
Response Rate = 100
Table 141 Catfish Responses Knowledge of Research on Table 142 Catfish Responses Sources ofInformation
Average Response Rate = 83
bullAverage Response Rate = 44
Table 143 Catfish Responses Willingness to Pay A Premium Per Unit of Protein for CSM with More Than
middotResponse Rate = 100
Table 144 Catfish Responses Percent of Cost of SBM Respondents Willing to Pay for CSM with Sufficiently Low Goscvnol and Fiber Levelsmiddot
middotResponse Rate = 83
middotResponse Rate = 25
Table 146 Comparison of Mean Responses and Analysis of Variance (ANOVA) Importance of Specific
bull Scale of 1 (extremely unimportant) to 7 (extremely important) for the mean ranking a Mean significantly larger across animal types at the 5 significance level otherwise no difference b Mean significantly lower across animal types at the 5 significance level otherwise no difference
Table 147 Comparison of Mean Responses and Analysis of Variance (ANOVA) Ranking of Other Protein
bull Scale of 1 (CSM inferior to respective feed) to 7 (CSM superior to respective feed) for the mean ranking
a Mean significantly larger across animal types at the 5 significance level otherwise no difference
b Mean significantly lower across animal types at the 5 significance level otherwise no difference
Table 148 Comparison ofMean Responses and Analysis of Variance (ANOVA) Importance of Nutritionshy
Related Factors in Choice ofCSM Over Alternativesmiddot
bull Scale of 1 (extremely unimportant) to 7 (extremely important) for the mean ranking a Mean significantly larger across animal types at the 5 significance level otherwise no difference
b Mean significantly lower across animal types at the 5 significance level otherwise no difference
Table 149 Comparison of Mean Responses and Analysis of Variance (ANOVA) Importance of Nonshy
Nutrition- Related Factors in Choice of CSM Over Alternativesmiddot
bull Scale of 1 (extremely unimportant) to 7 (extremely important) for the mean ranking
a Mean significantly larger across animal types at the 5 significance level otherwise no difference
b Mean significantly lower across animal types at the 5 significance level otherwise no difference
- = Not mentioned or ranked lower than 4th place
Table 151 Comparison of Responses Top Responses Why CSM IS NOT Selected as a Feed
- = Not mentioned or ranked lower than 5th place
Table 152 Comparison of Responses Top Characteristics that Have to Change for CSM to Be
- = Not mentioned or ranked lower than 5th place

4
discussion of the survey results in this report indicate a response rate which is the number of actual responses divided by the number of possible response to the respective questions in percentage terms
The survey respondents indicated that they formulate feeds for a wide variety of animal species not just those specifically included in the survey Dairy and beef cattle each accounted for about 20 of the animal species for which feeds are formulated (Figure 4) All others accounted for 10 or less of the animal species for which feeds are formulated The survey respondents indicated that they formulate feeds for dairy and beef cattle (about 60 of the respondents for each) followed by horses (31 ) sheep and goats (27) broilers (27) layers (26) other (23) pets (17) turkeys (17) swine (14) and catfish (9) (Figure 5) Various exotic animal species accounted for the largest share (38) of the other animal species for which respondents indicated they formulate feeds (Figure 6)
The survey respondents represented feed formulating activities in nearly every state (Figure 7) Although no state accounted for more than 9 of the feed formulating activities of the respondents the major states represented by the respondents included Texas (8) California (7) Iowa (7) Michigan (7) Kansas (6) and Minnesota (5) About 40 of the respondents had less than 10 years experience as a feed formulator (Figure 8) Nearly 30 had experience of 11 to 20 years with the remaining 30 indicating experience of up to 45 years in feed formulation
A little over 60 of the respondents were consulting nutritionists and the remaining nearly 40 were nutritionists employed by a particular feed manufacturer (Figure 9) The respondents also indicated the primary feed types they formulate by animal species (Figure 10) Feeds for beef cattle dairy cattle and swine were the predominant feed products (66) The feed manufacturer nutritionists responding to the survey formulated an average of approximately 400487 tons of all feed types in 1990 of which 8 included CSM as an ingredient and 64 included soybean meal (Figure II) The preponderance of those firms (65) however formulated less than a total of 200000 tons of all feed types in 1990 (Figure 12) An even higher percentage of those firms (91) formulated less than 200000 tons of feed that included CSM
The survey respondents also indicated the specific types of animals for which they were formulating CSM feeds and the particular types of CSM feeds formulated for those animal types The responding beef cattle nutritionists formulated feeds that included CSM for a wide range of feedlot and non-feedlot beef cattle (Figure 13) Over 60 of the respondents indicated that they formulate feeds for at least one of those two animal types Calves and feeders were the predominant feedlot beef cattle types for which feeds were formulated using CSM (22 and 20 respectively) (Table I) For beef cattle not fed in feedlots the split among types was somewhat more even with brood cows and stockers having a slight edge The number of nutritionists formulating feeds for feedlot beef cattle was about 25 more than those formulating for non-feedlot beef cattle
Tables 2 through 7 indicate the particular feeds formulated with CSM for the various types of beef cattle The predominant CSM feed formulated tor calves was a creep or starter feed (Table 2) For feeders however CSM was used primarily in protein supplements (Table 3) Range supplements range feeds range cubes and miscellaneous supplements were the primary CSM feeds formulated for stockers replacement heifers brood cows and bulls (Tables 4 5 6 and 7)
The largest number of dairy cattle feed nutritionists responding to the survey formulated CSM feeds for lactating cows (88) followed by heifers (75) dry cows (69) and calves (51) in the last 5-10 years (Figure 14) Lactating cows accounted for 32 of the CSM feeds formulated for dairy cattle followed by heifers (27) dry cows (24) and calves (17) (Table 8) Tables 9 through 12 indicate the particular feeds formulated with CSM for the various types of dairy cattle The predominant CSM feeds formulated for dairy calves were indicated by respondents to be calf grower
5
and starter feeds (Table 9) For dairy heifers the main feeds formulated with CSM included various supplements and grower feeds (Table 10) For lactating cows CSM was used predominantly in complete rations For dry cows supplements and complete rations were the predominant feeds formulated with CSM (Tables II and 12)
The responding poultry nutritionists formulated feeds for layers (44) broilers (38) turkeys (24) and breeding flocks (26) (Figure 15) Layers accounted for the largest share of the CSM poultry feeds formulated by the respondents (35) followed by broiler feeds (29) breeding flock feeds (19) and turkey feeds (17) (Table 13)
Two-thirds of the catfish respondents (8 of the 12 respondents) formulate feed for grow out stock (Table 14) Half the catfish respondents (6 of the 12 respondents) formulate feeds for brood stock and for fingerlings Five of the respondents (42) formulate feeds for fries Respondents reported formulating several types of feeds using CSM for catfish (Table 15)
SURVEY RESULTS
The results of the cottonseed meal use survey are summarized into three main sections I) combined results across all animal species 2) results by particular animal species (beef cattle dairy cattle poultry and catfish) and 3) a comparison of results among animal species Summary figures and tables of the results are presented at the end of the report
Combined Results
A Dumber of the same questions were asked of all members of the survey sample regardless of the particular animal types for which they were formulating feeds (second section of the survey) The responses to the questions for each animal type were first combined to facilitate an overall assessment of the perceptions of animal feed formulators regarding the use of cottonseed meal in their feed formulations Again because many of the feed formulators participating in the survey completed the questions in this section for more than one animal specie a given participating feed formulator could count as more than one respondent in the analysis of the combined results (ie over all animal species) The results by animal species are discussed in a later section
All respondents were probed for their perceptions in 6 general areas I) the particular factors affecting their choice of dietary proteins for formulated feeds 2) the extent to which CSM is considered to be an alternative to selected protein feeds 3) the importance of nutritional and nonshynutritional factors in their decisions to use CSM rather than alternative dietary proteins in their feed formulations 4) the seasonality of CSM availabilityS) the specific reasons for the selection and nonshyselection of CSM for use in the feeds they formulate and 6) the source of CSM chemical analyses used by the respondents
Factors Affecting Choice of Dietary Proteins
All members of the final sample were asked to rank the importance of the following 4 general factors in their choice of a dietary protein for their feed formulations on a scale of 1 to 7 (from
6
extremely unimportant to extremely important respectively) I) quality 2) price 3) availability and 4) consistency In addition they were provided an opportunity to list and rank other factors affecting their dietary feed protein choices An impressive 92 of the respondents indicated that the quality of the protein was either important or extremely important in their choice of dietary proteins (Table 16) Nearly two-thirds of the respondents ranked protein quality as extremely important An almost equal number of respondents (90) indicated that protein consistency was either important or extremely important Less than half the respondents however ranked consistency as an extremely important factor Although nearly SO of the respondents ranked price availability and other factors as either important or extremely important the majority of respondents ranked each of those factors as important rather than extremely important The primary other factors listed by the respondents included palatability flow characteristics the protein composition the value supplier service and storage and handling characteristics (Table 17) Various miscellaneous factors were also listed
Cottonseed Meal As An Alternative Protein Feed
The final sample members were asked two sets of questions to gain insight into the competitiveness of CSM as a protein feed and determine which other proteins are considered to be the main competitors of CSM in feed formulations They were first asked to rank various selected protein feeds on a scale of I to 7 as inferior or superior respectively to CSM in an overall sense for use in feed formulations A mean response of greater than 4 for a particular protein feed is an indication that on average the responding feed formulators considered the protein feed to be superior to CSM (ie CSM is considered to be an inferior protein source) On the other hand a mean response of less than 4 is an indication that the protein feed is inferior to CSM in the perception of the respondents on average (Le CSM is considered to be a superior protein source) A mean response of around 4 suggests that the respondents considered cottonseed meal to be equally acceptable to those particular feeds The second question required respondents to indicate whether or not they considered CSM to be an alternative to each of the 20 listed protein feeds
The results suggest that CSM meal is considered to be clearly superior to only 5 of the 20 listed protein feeds including (in order of perceived CSM superiority) urea safflower meal wheat middlings sunflower meal and feather meal (Table IS) CSM was considered to be clearly inferior to another 7 of the 20 listed protein feeds including (in order of perceived inferiority of CSM) fish meal dried skim milk dried whole milk blood meal soybean meal meat and bone meal and corn gluten meal The mean responses of the remaining S protein feeds were all close to 4 suggesting that the respondents considered CSM to be about the same as those protein feeds These included (in no particular order) tankage poultry by-product meal peanut meal linseed meal brewers dried grains distillers dried grains dehydrated alfalfa and canola meal
Respondents were quite evenly divided in their opinion as to whether CSM is a viable alternative protein feed for almost all of the listed protein feeds (Table IS) The only possible exceptions were dried skim milk fish meal dried whole milk and blood meal for which a larger percentage of respondents indicated that CSM is an alternative than suggested that CSM is not an alternative
The Importance of Nutritional and Non-Nutritional Factors
In response to an earlier question respondents ranked the importance of various factors in choosing any dietary protein for use in their feed formulations Later respondents were asked to rank the importance of a more detailed list of nutrition-related and non-nutrition-related factors in specifically choosing cottonseed meal as a component of the feeds they formulate again on a scale of extremely unimportant to extremely important (a scale of I to 7 respectively) They were also
7
allowed to list other factors that they considered important but were not on the list Interestingly the largest percentage of respondents (90) ranked aflatoxin as an important or extremely important factor in their choice of CSM as a feed component (Table 19) Nearly two-thirds ranked aflatoxin as extremely important a much higher percentage than for any other factor Protein quality was ranked as important or extremely important by 80 of respondents Gossypol level had the third highest mean response of any individual factor Only one listed factor was clearly considered to be unimportant in the choice of cottonseed meal as a feed component (vitamin level) as indicated by a mean response of substantially less than 4 The mineral level in cottonseed meal was considered to be neither important nor unimportant
The major non-nutrition-related factors influencing the choice of cottonseed meal as a feed component in the perception of the respondents included consistent quality price availability nutrient guarantees and palatability as indicated by their relatively higher mean ran kings (Table 20) Note that all of the listed non-nutrition-related factors were considered by the respondents to be at least somewhat important in their choice of cottonseed meal as a feed component That is none of them were considered to be unimportant The least important non-nutrition-related factors influencing the choice of CSM in the perception of the respondents included service from the CSM industry the need for a local supply of CSM special equipment requirements for using CSM and convenience in using CSM as a feed component
Seasonality of Cottonseed Meal Availability
The survey results indicate that CSM is least available in sufficient quantities for purchase as a feed component during the months of June through September of a typical year (Figure 16) However the results also indicated that those are also about the same months (April through August) in which there is the least need for CSM to be available to compete effectively with alternative protein feeds (Figure 17) One interpretation of this result is that on average the availability of CSM is generally not a problem during the year This is not entirely the case however as the responses to the next set of questions point out
Reasons for the Selection and Non-Selection of Cottonseed Meal
To obtain further insight into the primary motivating factors behind the selection or nonshyselection of CSM as an ingredient in feed formulations the sample members were asked three completely unaided questions ie the respondents did not have a list from which to choose in answering the questions They were first asked to list the top five reasons why they perceive that CSM is selected as a feed ingredient and then the top 5 reasons why CSM is Dot selected in order of importance Finally if CSM is Dot generally selected by a respondent heshe was asked to list the specific characteristics of CSM that would have to change for it to be selected more frequently again in order of importance The respondents simply needed to fill in blanks for each question (reasons that CSM is and is not selected and characteristics that would have to change) marked lst through 5th with their own ideas
By far the number one reason (63 of the respondents) listed for which CSM is selected as a feed ingredient was price (Table 21) Far behind price the number one choices of some respondents were proteinprotein quality (9 of the number one responses) availability (7) palatability (4) and quality (4) Listed most often as the second most important reason for selecting CSM was availability (31 of the number two responses) followed by price (20) proteinprotein quality (1I) palatability (7) and pelletabilitypellet quality (6) The three reasons most often listed third were availability (20 of the number three responses) palatability (16) and price (11) Based on the total number of times a reason was listed first second or third the top three reasons
8
given by respondents for which CSM is selected as a feed component were price availability and proteinprotein quality in that order
The respondents provided a much longer list of reasons for which CSM is Dot selected than for which CSM is selected as a feed ingredient (Table 22) Interestingly the most frequently listed number one reason (54 of the respondents) why CSM is Dot selected as a feed ingredient was again price Other number one choices included availability (16) gossypol (9) and protein protein quality (3) The reason most often listed second (30 of respondents) was availability followed by pricevalue (20) and gossypol (8) The reason most often listed third was pricevalue again (14 of respondents) and then availability (I 3) and gossypol (I 1) Again based on the total number of times a reason was listed first second or third the top three reasons given by respondents for which CSM is Dot selected as a feed component were price availability and gossypol in that order
The three most commonly listed specific characteristics of CSM that would have to change to be included more frequently in respondents feed formulations also were price availability and gossypol (Table 23) Other less frequently mentioned CSM characteristics that would need to change included amino acid balancelevel energy contentlevel aflatoxin contentlevel proteinprotein quality
In summary price and availability appear to be the two key factors affecting the use of CSM If price is low andor availability is adequate feed formulators are more likely to use CSM in their formulations On the other hand a high price andor poor availability is likely to discourage use of CSM Consequently there is very little loyalty by feed formulators to CSM because they appear to be quick to switch back and forth between CSM and alternative feeds as price changes Feed formulators do not appear to perceive that CSM is a feed ingredient with inherent characteristics for which they are willing to pay a premium if necessary in order to continue using it as an ingredient in the feeds they formulate That is the primary consideration in deciding whether or not to use CSM is its price rather than some nutritional characteristic for example Thus when price rises they perceive little reason to continue using CSM as part of their formulations
The availability of CSM appears also to work both for and against the use of CSM Responses to the specific questions on seasonality seemed to indicate that availability of CSM is not generally a problem during the year But when CSM is not selected as a feed ingredient availability is one of the major reasons During certain times of the year in certain parts of the country availability may be a positive factor motivating the use of CSM
Source of Chemical Analyses for Cottonseed Meal
Nearly 90 of the respondents routinely perform crude protein analyses (Table 24) About two-thirds perform their own fat and fiber analyses as well Surprisingly however less than half the respondents routinely test for aflatoxin even though nearly all respondents indicated aflatoxin to be an important or extremely important factor affecting their choice of CSM as a feed component Only 18 of the respondents routinely test for gossypol Even though nearly all respondents performed their own crude protein analyses CSM suppliers apparently provide analytical values for crude protein to over 40 of respondents (Table 25) CSM suppliers provided fat and fiber analytical values to about a third of the respondents CSM suppliers appear to provide analytical values for gossypol to very few feed formulators
9
Results by Animal Species
The responses in the previous section are indicative of the overall perceptions of feed formulators of the use of CSM as a feed component Those results however may mask some important differences in perceptions among formulators of feeds for the various animal species There are also issues regarding the use of CSM as a feed component that are unique to the various animal species Consequently salient dissimilarities in the responses of formulators of different animal feeds from the combined responses (over all animal types) discussed in the previous section are highlighted in this section Also the results of the questions asked specifically of formulators of feeds for particular animal species are discussed in this section in detail as well
BeeCattle
There are few major differences in the perceptions of beef cattle feed formulator respondents concerning the use of cottonseed meal from those discussed in the previous section for all survey respondents This may reflect the larger number of respondents formulating feed for beef cattle (and for ruminants in general) than for other animal species The salient differences in the 6 general question areas include the following
bull Factors affecting choice 0 dietary proteins The only major difference in the responses to these questions was a somewhat greater concern by responding beef cattle feed formulators for other factors influencing the choice of a dietary protein such as palatability and rumen degradability (Table 26)
bull Cottonseed meal as an alternative protein feed The results for beef cattle are roughly similar to those from the combined responses (Table 27) Major differences include I) a lower percentage of beef cattle survey respondents consider blood meal to be superior to CSM in beef cattle feeds 2) a large majority of respondents feel that CSM is not an alternative to dried skim milk and dried whole milk in beef cattle feeds and 3) an overwhelming majority of respondents consider CSM to be an alternative to the remaining protein feeds for use in beef cattle feeds except perhaps for fish meal and blood meal
bull The importance 0 nutritional and non-nutritionalactors Again the responses are generally the same as for the combined responses The beef cattle survey respondents however tended to rank nutrition-related factors as less important and non-nutrition-related more important than was the case for the combined responses On average beef cattle feed formulators ranked protein quality amino acid balance amino acid availability fat level fiber level and gossypol level as less important factors in the choice of CSM than was the case for the combined responses (Tables 28 and 29) Of the non-nutrition-related factors respondents ranked palatability the need for a local supply equipment requirements convenience and CSM industry service as all slightly more important in the choice of CSM than was the case for the combined responses (Tables 30 and 31)
bull Seasonality 0 cottonseed meal availability The results for the beef cattle respondents are virtually identical to those from the combined responses (Tables 32 and 33)
bull Reasons lor the selection and non-selection 0 cottonseed meal The top three reasons for which CSM is and is not selected as a feed ingredient are exactly the same for the beef cattle responses as for the combined responses (Tables 34 and 35) Also price availability and
10
gossypol level are cited as the three most important factors that would have to change for CSM to be used more frequently as was the case with the combined responses (Table 36)
bull Source 0 chemical analyses lor cottonseed meal No major differences appear in either the analyses routinely performed by the responding beef cattle feed formulators or the analytical values provided to them by CSM suppliers (Tables 37 38 39 and 40)
Beef cattle sample members were also asked several questions specifically regarding the use of CSM in beef cattle feed formulations in 5 general areas I) problems resulting from feeding a ration with CSM to the various beef cattle types 2) details on particular feed formulations for beef cattle 3) sources of information utilized regarding formulating beef cattle feeds 4) protein-related factors considered when balancing rations for beef cattle and 5) an open-ended question soliciting suggestions to improve the usefulness or value of CSM for beef cattle feed formulations
Problems from Feeding CSM Rations to Beef Cattle
Few respondents indicted knowledge of any problems resulting from feeding a ration containing cottonseed meal to either feedlot or other beef cattle (Table 40 The most frequently mentioned problems concerned feedlot bulls and calves The majority of the problems reported involved supplements and starter feeds (Table 42) The main problems reported had to do with gossypol beef cattle performance when fed rations containing CSM and reproduction The low number of respondents indicating problems of any type however suggests that the problems reported were likely isolated cases
Details on Particular Feed Formulations for Beef Cattle
The sample members were also asked to provide information regarding creep feeds for calves and supplements for stockers that they formulate as well as information regarding the use of whole or delinted cottonseed in beef cattle feed rations Nearly 75 of all beef cattle respondents formulate creep feeds for calves and over 80 formulate supplements for stockers (Figure 18) Traditional creep feeds represented two-thirds of the creep feeds formulated (Table 43) Over half the respondents indicated that they formulate traditional creep feeds Fewer respondents formulated high protein creep feeds
Nearly half the beef cattle respondents formulate some feeds using whole fuzzy cottonseed (Table 44) Only a little less than a third formulate any feeds using delinted cottonseed however Also only about a quarter of the respondents formulate any rations that include both CSM and whole cottonseed (Table 45) For those who formulate rations that include both the mix of the two in the rations varies widely Respondents reported that the share of such rations accounted for by CSM ranged from 1 to 100 with a mean of 19 (Table 46) The share of those rations accounted for by whole cottonseed ranged from 0 up to a maximum of 25 with a mean of 102 (Table 47)
Sources of Information Utilized on Formulating Beef Cattle Feeds
The largest number of respondents (110 of 123 respondents) indicated that they utilize university research of some type to obtain information on formulating feeds for beef cattle (Table 48) Only slightly fewer (91 respondents) indicated that industry publications are a source of feed formulation information for beef cattle University extension and government agencies were also listed as important information sources A few respondents listed other sources of information
II
including primarily the results of research performed in their own companies their own personal experience and their own private research (Table 49)
Protein-Related Factors Considered for Balancing Beef Cattle Rations
Nearly 70 of the respondents indicated that rumen degradability is a protein-related factor that they consider when balancing beef cattle rations (Figure 19) Respondents also consider crude protein level (16) and other protein factors (11) Only 4 indicated concern for the amino acid value when balancing beef cattle feed rations The two main other protein-related factors the respondents indicated as having a bearing on balancing beef cattle feed rations were the digestibility of the protein and the protein ingredients (Table 50)
Respondents indicated a wide range of escape values (or by-pass values) that they are using for CSM from less than 20 to over 50 (Table 51) At the same time however they are unsure as to the reliability of the escape values they are using Nearly 70 indicated that the escape values they are using are neither reliable or unreliable or only somewhat reliable (Table 52) The principal single method or source used by respondents for the escape value was the National Research Council (Committee on Animal Nutrition National Academy of Sciences) (Table 53) Universities were the next most frequently mentioned single source of CSM escape values The largest number of respondents (32) simply indicated that several sources were consulted for escape values Finally almost all respondents indicated an interest in obtaining information on escape values for CSM as processed by different methods (Table 54) There appears to be a lack of reliable information on CSM escape values in the perception of beef cattle feed formulators
Suggestions for Improling the Usefulness of Cottonseed Meal
Only 16 of the beef cattle feed formulators that returned surveys provided suggestions that might improve the value or usefulness of CSM in feed rations (Table 55) Some of the more noteworthy suggestions included improving the consistency of cottonseed meal various types of needed research more data on CSM and increased availability of CSM
Dairy Cattle
There are few major differences in the perceptions of dairy cattle feed formulator respondents concerning the use of cottonseed meal from the combined responses over all survey respondents and the beef cattle responses Again this may reflect the larger number of respondents formulating feed for dairy cattle (and for ruminants in general) than for other animal species The salient differences in responses by dairy cattle feed formulators in the 6 general question areas include the following
bull Factors affecting choice of dietary proteins There is virtually no differences in the responses of dairy cattle respondents from the combined responses for any of the listed factors (quality price availability consistency and other) affecting the choice of dietary protein (Table 56) A large majority of dairy cattle feed formulators ranked all factors as either important or extremely important
bull Cottonseed meal as an alternative protein feed The results for dairy cattle are roughly similar to those from the combined responses (Table 57) The two major differences include I) a large majority of respondents feel that CSM is not an alternative to dried skim milk fish
12
meal dried whole milk and blood meal in dairy cattle feeds and 2) an overwhelming majority of respondents consider CSM to be an alternative to nearly all the remaining protein feeds for use in dairy cattle rations
bull The importance of nutritional and non-nutritional factors Again the responses are generally the same As was the case for beef cattle respondents however dairy cattle respondents tended to rank the listed non-nutrition-related factors as relatively more important than the listed nutrition-related factors On average dairy cattle feed formulators ranked amino acid balance fiber level and gossypol level as less important factors in the choice of CSM than was the case for the combined responses (Tables 58 and 59) As in the case of both the combined and beef cattle responses aflatoxin was ranked at a higher level of importance than any other single nutrition-related factor Of the non-nutrition-related factors respondents ranked most factors as all slightly more important in the choice of CSM than was the case for the combined responses (Tables 60 and 61)
bull Seasonality of cottonseed meal allailability The results for the dairy cattle respondents are highly consistent with those for both the combined responses and for the beef cattle responses The months of May through September are the months of least availability of CSM which are also the months indicated when CSM is least needed to be available in the perception of dairy cattle respondents (Tables 62 and 63) Again the suggestion is one of little problem of CSM availability although this is not totally the case as indicated by dairy cattle respondents in later questions
bull Reasons for the selection and non-selection of cottonseed meal While price and availability are also the top two reasons that dairy cattle respondents perceived that CSM is selected as a feed ingredient protein contentquality ranked third on their list followed closely by palatability (Table 64) The top two reasons the CSM is not selected according to the dairy cattle respondents were price and availability as with both the combined responses and the beef cattle responses The third reason given by the dairy cattle respondents however was protein qualitylevel followed in fourth place by gossypol (Table 65) Again price was the key CSM characteristic that dairy cattle respondents indicated that must change in order to be used more frequently in dairy cattle rations (Table 66) Availability and gossypol levels were ranked as the second and third CSM characteristics that must change as was the case for the combined responses
bull Source of chemical analyses for cottonseed meal The results for the chemical analyses performed by dairy cattle respondents are virtually identical to those of both the combined results and those of the beef cattle results The primary analysis routinely performed by the dairy cattle respondents is crude protein (121 of the 143 respondents) followed by fiber (94 respondents) and fat (83 respondents) (Tables 67 and 68) The primary analytical values supplied to the dairy cattle respondents also include crude protein (62 respondents) fiber (50 respondents) and fat (47 respondents) (Tables 69 and 70) It is interesting to note that although aflatoxin was ranked at a higher level of importance than any other nutrition-related factor affecting the choice of CSM as feed component only a third of the dairy cattle respondents routinely perform analyses for aflatoxin and only 11 respondents are provided aflatoxin values by their CSM suppliers The story is about the same for both the combined and the beef cattle responses
Dairy cattle sample members were also asked several questions specifically regarding the use of CSM in dairy cattle feed formulations in 6 general areas I) problems resulting from feeding a
13
ration with CSM to the various dairy cattle types 2) details on dairy cattle feed formulations containing whole cottonseed 3) sources of information utilized on formulating dairy cattle feeds 4) protein-related factors considered when balancing rations for dairy cattle 5) gossypol levels considered to be safe for mature dairy cattle and pre-ruminant calves and 6) an open-ended question soliciting suggestions to improve the usefulness or value of CSM for dairy feed formulations
Problems from Feeding CSM Rations to Dairy Cattle
Again very few respondents indicted knowledge of any problems resulting from feeding a ration containing CSM to dairy cattle (Table 71) Only 24 of the respondents indicated problems with calves and only 18 for lactating cows as the result of feeding rations with CSM Only about 3 of the respondents mentioned problems with either dairy heifers or dry cows The number one problem reported was gossypol toxicity primarily in creep feeds and complete rations (Table 72) Both palatability and poor performance problems for various feed types were also frequently mentioned Again however the low number of respondents indicating problems of any type suggests that the problems reported were likely isolated cases
Details on Dairy Cattle Feed Formulations Containing Whole Cottonseed
Over 75 of dairy cattle respondents formulate feeds using whole fuzzy cottonseed a much higher percentage than was the case for beef cattle Less than half of the dairy cattle respondents however utilize delinted cottonseed in their feeds more in line with the beef cattle results (Table 73) Less than half the respondents formulate rations that include both CSM and whole cottonseed (Table 74) For those who formulate rations that include both the mix of the two in the rations varies widely Respondents reported that the share of such rations accounted for by CSM ranged from 1 to 30 with a mean of 85 (Table 75) The share of those rations accounted for by whole cottonseed ranged from 3 to 100 with a mean of 16 (Table 76) It appears therefore that on average dairy feeds formulated with both CSM and whole cottonseed contain a higher percentage of whole cottonseed than of CSM This is just the opposite of the situation for beef cattle
Sources of Information Utilized on Formulating Dairy Cattle Feeds
Over 80 of the dairy cattle respondents indicated that they were familiar with research on feeding CSM to mature dairy cattle (Table 71) Only half however indicated familiarity with such research for pre-ruminant calves Less than 10 of the respondents listed any other research on feeding CSM to other types of dairy cattle (Table 78) The largest number of respondents (137 of 143 respondents) indicated that they utilize university research to obtain information on formulating feeds for dairy cattle followed by industry publications of some type (121 respondents) and university extension service (83 respondents) (Table 79) Only 36 respondents listed other sources of information including primarily personal experience and research (Table 80)
Protein-Related Factors Considered for Balancing Dairy Cattle Rations
Nearly 100 of the dairy cattle respondents indicated that both crude protein level and rumen degradability are factors they consider when balancing rations for dairy cattle a much higher level than is the case for beef cattle (Table 81) Less than half consider amino acid values (61 of 143 respondents) Only 19 respondents indicated that they consider other factors like protein solubility (Table 82)
Dairy cattle respondents indicated a even wider range of escape values (or by-pass values) that they are using for CSM than did beef cattle respondents from 0 to over 80 (Table 83) The mean escape value calculated from the responses is 40 Dairy cattle respondents indicated slightly more
14
confidence in the escape values they are using than was the case for beef (Table 84) Only 22 respondents however considered those escape values to be reliable or extremely reliable The principal single method or source used by respondents for the escape value they use was again the National Research Council (Committee on Animal Nutrition National Academy of Sciences) (Table 85) Book values was the next most frequently mentioned single source of CSM escape values (23) Finally nearly 100 of the respondents indicated an interest in obtaining information on escape values for CSM as processed by different methods (Table 86) The conclusion from the dairy cattle responses is the same as for beef cattle That is there appears to be a lack of reliable information on CSM escape values in the perception of dairy cattle feed formulators and that they are highly interested in obtaining more information in this regard
Gossypol Level Considered Safe for Mature Dairy Cattle and Pre-Ruminant Calves
Dairy cattle respondents appear to have little idea of what the safe levels are for gossypol in mature dairy cattle and pre-ruminant calf feeds First of all only one-third of those who returned surveys even attempted to provide numbers for safe gossypol levels (Tables 87 and 88) Many respondents simply wrote comments such as dont know or not aware of research on safe gossypol level in the margin of the survey beside the question Second those who attempted to answer the questions provided an amazingly wide range of safe gossypol levels from 0 parts per million (ppm) to 7500 ppm for mature dairy cattle and from 0 ppm to 1000 ppm for pre-ruminant calves The mean safe gossypol levels were 609 ppm for mature dairy cattle and 121 ppm for pre-ruminant calves The responses were spread quite evenly between the extremes around the means It should be noted that the research team checked and rechecked the data set for this question to insure there were no errors in data entry
Suggestions for Improving the Usefulness of Cottonseed Meal
Only about 22 of the dairy cattle feed formulators that returned surveys provided suggestions that might improve the value or usefulness of CSM in dairy cattle feed rations (Table 89) Some of the more frequent suggestions dealt with improving the consistency and availability of CSM Several respondents suggested the need for more information on gossypol a worthy suggestion given the results of the previous question
Poultry
The perceptions of poultry feed formulator respondents concerning the use of cottonseed meal differ importantly in many respects from the combined responses over all survey respondents and from those of beef and dairy cattle Many of the differences are likely the result of the distinct dietary needs of ruminant as opposed to non-ruminant animals The salient differences in responses by poultry feed formulators in the 6 general question areas include the following
bull Factors affecting choice of dietary proteins Surprisingly there was little difference in the responses of those indicating that they formulate feed for poultry than for the combined results (or for beef and dairy cattle) regarding the importance of the listed factors (quality price availability consistency and other) affecting the choice of dietary protein (Table 90) A large majority of poultry feed formulators ranked all factors as either important or extremely important The only exception is that consistency was ranked slightly less important by poultry respondents than by respondents in general
bull Cottonseed meal as an alternative protein feed Poultry respondents ranked more protein feeds as higher on the superior-to-CSM scale than was the case for the combined responses
15
(Table 91) In fact the mean rank of all but three of the protein feeds were all at least somewhat higher than was the case for the combined responses The mean rank of several of the other protein feeds as determined by the poultry respondents was much higher than for the combined responses including fish meal poultry by-product meal and soybean meal Poultry by-product meal changed from an inferior to a superior protein feed compared to CSM The protein feed judged by poultry respondents to be most superior to CSM for poultry rations was soybean meal while urea was ranked as most inferior Poultry respondents also appeared to have stronger opinions about whether or not CSM is an alternative to the other listed protein feeds than was the case for the combined responses They overwhelmingly perceived that CSM is not an alternative to many of the other protein feeds including fish meal dried skim milk dried whole milk poultry by-product meal blood meal tankage and urea A larger percentage of poultry respondents than was the case for dairy and beef cattle perceived however that CSM is a definite alternative to many other protein feeds including safflower meal sunflower meal linseed meal peanut meal canola meal feather meal distillers dried grains brewers dried grains and even soybean meal
bull The importance of nutritional and non-nutritional factors Poultry respondents ranked all but two of the listed nutrition-related factors as more important in the choice of CSM over alternative protein feeds for poultry rations than was the case for the combined responses on average (Le comparing mean responses) (Table 92) The highest percentage of poultry respondents ranked gossypol level (62 of the respondents) amino acid balance (59) aflatoxin (58) protein quality (57) and amino acid availability (57) as extremely important in the choice of CSM over alternative protein feeds Only about 5 of the respondents listed other important nutrition-related factors (Table 93) There are few differences however in the poultry responses as compared to the combined responses regarding the importance of non-nutrition-related factors (Table 94) The major difference is a much lower ranking of the importance of palatability in choosing CSM over alternative protein feeds Also a somewhat higher percentage of poultry respondents ranked price as an extremely important non-nutrition-related factor Few other non-nutrition-related factors were listed by the respondents (Table 95)
bull Seasonality of cottonseed meal availability The results for the poultry respondents regarding the months of the year when CSM is not available are highly consistent with those for the combined responses and those for the beef and dairy cattle responses Poultry respondents indicated that May through September are the months of least availability of CSM (Table 96) But likely because of the shorter production cycle for poultry than for cattle poultry respondents indicated that CSM needs to be available in almost every month (but slightly less so in August and September) for CSM to compete effectively with alternative protein feeds (Table 97) For poultry therefore the indication is that poultry feed formulators may perceive an availability problem which inhibits greater use of CSM in poultry rations to some extent
bull Reasons for the selection and non-selection of cottonseed meal Again price and availability are the number one and number two reasons respectively cited by poultry respondents for which CSM is selected as a feed ingredient (Table 98) Protein quality ranked third on their list followed closely by phosphorous content The top reason that CSM is not selected according to the poultry respondents was pricevalue (Table 99) About tied for second place were gossypol content and availability More respondents ranked availability as the second reason than for gossypol content but more respondents listed gossypol first The amino acid level was listed as a distant fourth reason for which CSM is not selected as a feed ingredient Price is again the key CSM characteristic that poultry respondents indicated must change in
16
order for CSM to be used more frequently in poultry rations (Table 100) Gossypol was clearly considered to be the second most important characteristic that must change Availability was ranked as either first or second by all respondents who listed it as a characteristic that must change
bull Source of chemical analyses for cottonseed meal The results for the chemical analyses performed by poultry respondents are similar to those of both the combined results and those of the beef and dairy cattle results The primary analysis routinely performed by the poultry respondents is crude protein (51 of 55 respondents) followed by fat (40 respondents) fiber (37 respondents) and aflatoxin (31 respondents) (Tables 101 and 102) The primary analytical values supplied to the poultry respondents also included crude protein fiber and fat (Table 103) A third of the poultry respondents indicated that their CSM supplier does not provide them with any analytical values Once again even though aflatoxin was ranked as an extremely important nutrition-related factor in the choice of CSM as a feed component only I respondent obtains an analytical value for aflatoxin from his CSM supplier and only a little over half routinely perform their own aflatoxin analyses
Poultry sample members were asked some specific questions regarding the use of CSM in poultry feed formulations in 5 general areas I) problems resulting from feeding a ration with CSM to the various poultry types 2) specific information on several key nutrition-related factors affecting the use of CSM in poultry rations 3) sources of information utilized on formulating poultry feeds 4) CSM price and value and 5) an open-ended question soliciting suggestions to improve the usefulness or value of CSM for poultry feed formulations
Problems from Feeding CSM Rations to Poultry
The majority of poultry respondents indicated no knowledge of any problems associated with feeding a ration containing CSM to poultry (Table 104) Only 14 of the respondents indicated problems with broilers less than 7 for breeding flocks and about 3 for turkeys Over a third however indicated that they had knowledge of such problems with layers The number one problem reported was yolk molting and discoloration primarily in layer rations (Table 105) A few respondents indicated problems with depressed growth associated with broiler feeds containing CSM
Information on Key Nutrition-Related Factors for Poultry Rations
The survey sample members were asked to respond to a number of specific questions related to nutritional factors that affect the use of CSM in poultry rations including protein energy fat gossypol and synthetic amino acids They were then asked to indicate their perception of the overall feeding value of a standard 41 protein CSM compared to that of a standard 44 protein soybean meal The questions were designed primarily to determine the extent of knowledge among feed formulators concerning these factors as they relate to the use of CSM and the relative feeding value of CSM
Sample members were asked to respond to two questions regarding protein in poultry feed rations They were first asked to indicate the specific protein-related factors that they consider when balancing rations for poultry They were given a list of three factors (crude protein level amino acid content and amino acid availability) They were also allowed to specify any other protein-related factors they consider when balancing poultry rations They were then asked to indicate the crude protein levels they would prefer for cottonseed meal and were given a choice of four levels (3641 (standard) 44 and 48) and allowed to suggest any other preference for crude protein level
17
Almost all poultry respondents indicated that they consider amino acid content and availability when balancing feed rations with fewer responding that they consider the crude protein level (Table 106) Other protein-related factors listed by the respondents included amino acid balance protein digestibility and energy levels (Table 107) With regard to preferred crude protein level for CSM over half of the poultry respondents indicated a preference for 48 crude protein (Table 108) About 27 of the respondents were satisfied with the standard 41 level and 20 indicated a preference for a 44 protein CSM No respondents preferred anything less than the standard 41
With respect to energy levels the sample members were asked to indicate what they considered to be the normal maximum and minimum energy levels for protein feeds for broilers layers turkeys and breeding flock As Table 109 indicates the responses varied widely with little or no indication of a mode (most frequent response) in most cases For broilers the maximum (in K Cals DE per pound) ranged from 0 to 1800 and the minimum from 850 to 1700 with a mean maximum of 1436 and a mean minimum of 1276 For layers the maximum (in K Cals DE per pound) ranged from 1000 to 1800 and the minimum from 800 to 1500 with a mean maximum of 1347 and a mean minimum of 1187 For turkeys the maximum (in K Cals DE per pound) ranged from 1100 to 1725 and the minimum from 850 to 1700 with a mean maximum of 1334 and a mean minimum of 1261 For breeding flocks the maximum (in K Cals DE per pound) ranged from 1000 to 1600 and the minimum from 750 to 1600 with a mean maximum of 1328 and a mean minimum of 1159 Given the disparity in the responses it seems clear that there is little common concept of the normal maximum and minimum energy levels for protein feeds
Sample members similarly were asked to indicate the minimum and maximum fat levels they considered critical for protein feeds Although the range of responses was still quite wide there appeared to be more uniformity in responses to this question than the one for energy (Table 110) The maximum fat levels (ether extract as fed basis) indicated by the respondents ranged from 1 to 15 or 20 for most poultry types The minimums ranged from 0 to 15 The mean minimum levels of fat for all poultry types was about 3 The mean maximum ranged from 6 to 82 depending on the poultry type
Sample members were asked to indicate the level of gossypol they considered safe for poultry rations The responses again varied widely from a low of 0 ppm up to a high of 300 ppm for all poultry types (Table III) The highest mean level of gossypol as calculated from the responses to the question were 104 ppm for broilers and 91 ppm for turkeys For layers and breeding flocks the mean levels were much lower at 57 ppm and 54 ppm respectively
The questionnaire also asked the sample members to indicate if they use or would use synthetic amino acids where economical The response was that nearly 100 of all poultry respondents indicated that they have or would use synthetic amino acids in this situation (Table 112) This suggests little real aversion on the part of feed formulators to utilize synthetic amino acids in least cost poultry formulations
To obtain some insight on the general perception of poultry formulators regarding CSM the sample members were asked to indicate the overall feeding value of a standard 41 protein CSM compared to that of a standard 44 protein soybean meal in their opinion on percentage basis They were given the choice of 5 ranges from under 70 to over 100 in 10 increments (see Table 113 for the actual ranges used) Nearly 80 of the respondents indicated that CSM has an overall feeding value of under 90 of that of soybean meal Given the five choices offered to respondents the mean feeding value was around 80
18
Sources of Information Utilized on Formulating Poultry Feeds
About two-thirds of the poultry respondents indicated that they were familiar with research on feeding CSM to broilers and layers (Table 114) Only half however indicated familiarity with such research for turkeys and only a little over a third for breeding flocks Less than 10 of the respondents listed any other research on feeding CSM to other types of poultry (Table 115) To obtain information on formulating feeds for poultry the largest number of respondents (52 of the 55 respondents) indicated that they utilize university research followed by industry publications of some type (45 respondents) university extension services (26 respondents) and government agencies (20 respondents) (Table 116) Only 17 respondents listed other sources of information including primarily personal experience and research (Table 117)
Cottonseed Meal Price and Value
To get some idea concerning the poultry respondents perceptions of the value of CSM particularly with respect to soybean meal sample members were asked 1) if they would be willing to pay a premium per unit of protein for CSM with more than a standard 41 protein and 2) if gossypol and fiber were sufficiently low on average what percent of the cost of soybean meal they would be willing to pay for CSM
With respect to the first question only about half the respondents indicated a willingness to pay a premium for a CSM with more than 41 protein despite the fact that 75 of them indicated earlier that they would prefer a CSM with a higher crude protein level (Table 118) Thus at least 25 of the respondents prefer a higher protein level CSM but would not be willing to pay a premium to get it
In response to the second question poultry respondents indicated that they would only be willing to pay an average of about 76 of the cost of soybean meal for a CSM with a sufficiently low level of gossypol and fiber (Table 119) The range around that average however was fairly large from 50 to 95 Because CSM has traded at about 91 of the value of soybean meal on the market on a protein equivalent basis and about 85 on an unadjusted basis on average in each year since 1984 either poultry respondents are currently unaware of the historical CSM to soybean meal price relationship or they are indicating that the current CSM market price relative to that of soybean meal is substantially above the levels that most find acceptable
Suggestions for Improving the Usefulness of Cottonseed Meal
Only about 27 of the poultry feed formulators that returned surveys provided suggestions that might improve the value or usefulness of CSM in poultry feed rations (Table 120) Some of the more frequent suggestions included the need for more information on the use of CSM in poultry rations increased availability of CSM and nutrient guarantees
Catfish
The perceptions of catfish feed formulator respondents concerning the use of cottonseed meal correspond closely to those of the poultry respondents likely because of the similar dietary needs of non-ruminant animals The salient differences in responses by catfish feed formulators in the 6 general question areas included on this section of the surveys include the following
bull Factors affecting choice of dietary proteins There were no differences in the responses of those indicating that they formulate feed for catfish than for poultry regarding the importance
19
of the listed factors (quality price availability consistency and other) affecting the choice of dietary protein (Table 121) A large majority of catfish respondents ranked all factors as either important or extremely important as did poultry respondents
bull Cottonseed meal as an alternative protein feed As was the case for poultry catfish respondents ranked more protein feeds as higher on the superior-to-CSM scale than was the case for the combined responses (Table 122) Catfish feeders however ranked meat and bone meal and blood meal as even more superior to CSM than did poultry respondents The protein feeds that catfish respondents ranked as roughly similar to CSM included tankage feather meal peanut meal linseed meal corn gluten meal brewers dried grains distillers dried grains sunflower meal safflower meal and canola meal Catfish respondents also appeared to have nearly as strong views about whether or not CSM is an alternative to the other listed protein feeds as did poultry respondents They perceived that CSM is not an alternative to many of the other protein feeds including blood meal dried whole milk meat and bone meal and dried skim milk Catfish respondents also perceived however that CSM is a definite alternative to many other protein feeds including safflower meal canola meal peanut meal sunflower meal linseed meal distillers dried grains brewers dried grains tankage soybean meal wheat middlings corn gluten meal urea and feather meal
bull The importance of nutritional and non-nutritional factors The responses for catfish with regard to the importance of nutrition-related and non-nutrition-related factors in choosing CSM as a component of catfish feeds were roughly similar to those for poultry (Table 123) The salient differences were that a larger percentage of catfish respondents ranked energy level fat level and fiber level as important or extremely important and a much larger percentage ranked aflatoxin as extremely important One major difference of the catfish responses regarding the importance of non-nutrition-related factors from those of poultry is that palatability is much mOre of a concern to catfish feeders (Table 124) Bin space is less important to catfish respondents and service from the CSM industry is more important to them
bull Seasonality of cottonseed meal availability The results for the catfish respondents regarding the months of the year when CSM is not available were generally consistent with those for poultry except that May and June were perceived as less problematic for obtaining CSM supplies by the catfish respondents (Table 125) Catfish formulators perceive that CSM needs to be more available in April through October than during the rest of the year to be competitive with other protein feeds (Table 126) This suggests the perception on the part of catfish feed formulators of a CSM availability problem during about the first half of any given year
bull Reasons for the selection and non-selection of cottonseed meal Pricevalue is the number one reason cited by catfish respondents for which CSM is selected as a feed ingredient followed by protein quality and palatability (Table 127) The top reason that CSM is not selected according to the catfish respondents is pricevalue followed by quality and gossypol level (Table 128) Gossypol level is the key CSM characteristic that catfish respondents indicated must change in order for CSM to be used more frequently in catfish rations (Table 129) Quality was clearly considered to be the second most important characteristic that must change followed by aflatoxin level This is the only animal species for which price was not the number one characteristic cited that would have to change and was not even listed among the top three responses The implication is that catfish feed formulators may not consider the price of cottonseed meal to be out of line with their needs and thus do not consider price to be a particular problem for the use of CSM in catfish rations A word of caution is in order
20
to avoid taking this conclusion too far because of the relatively few number of catfish feed formulators in the sample
bull Source of chemical analyses for cottonseed meal The results for the chemical analyses performed by poultry respondents are similar to those of poultry as well as those of both the combined results and the beef and dairy cattle results The primary analysis routinely performed by the catfish respondents is crude protein followed by fat fiber aflatoxin and gossypol (Tables 130 and 131) The primary analytical values supplied to the catfish respondents also included crude protein fiber and fat (Table 132) Only 2 of the II catfish respondents indicated that their CSM supplier does not provide them with any analytical values Even though gossypol was ranked as an extremely important nutrition-related factor in the choice of CSM as a feed component and the number one CSM characteristic that needs to change only 5 of the II respondents routinely perform gossypol analyses None of catfish respondents obtain analytical values for aflatoxin from their CSM supplier
As for poultry catfish sample members were asked some specific Questions regarding the use of CSM in catfish feed formulations in 5 general areas 1) problems resulting from feeding a ration with CSM to the various catfish types 2) specific information on several key nutrition-related factors affecting the use of CSM in catfish rations 3) sources of information utilized on formulating catfish feeds 4) CSM price and value and 5) an open-ended Question soliciting suggestions to improve the usefulness or value of CSM for catfish feed formulations
Problems from Feeding CSM Rations to Catfish
Absolutely no catfish respondents indicated any knowledge of any problems associated with feeding a ration containing CSM to catfish (Table 133)
Information on Key Nutrition-Related Factors for Catfish Rations
As for poultry the survey sample members were asked to respond to a number of specific Questions related to nutritional factors that affect the use of CSM in catfish rations including protein energy fat gossypol and synthetic amino acids They were then asked to indicate their perception of the overall feeding value of a standard 41 protein CSM compared to that of a standard 44 protein soybean meal Just as for poultry these Questions were designed primarily to determine the extent of knowledge among catfish feed formulators concerning these factors as they relate to the use of CSM and the relative feeding value of CSM
Sample members were asked to respond to two Questions regarding protein in catfish feed rations They were first asked to indicate the specific protein-related factors that they consider when balancing rations for catfish They were given the same list of three factors (crude protein level amino acid content and amino acid availability) to choose from that the poultry sample members were given Again they were also allowed to specify any other protein-related factors they consider when balancing catfish rations They were then asked to indicate the crude protein levels they would prefer for CSM and were given the same choice of four levels as the poultry sample members (36 41 (standard) 44 and 48) and allowed to suggest any other preference for crude protein level In contrast to poultry the largest percentage of catfish respondents indicated that they consider amino acid availability (10 of the 11 catfish respondents) rather than the content when balancing catfish rations (Table 134) The second largest percentage consider crude protein level (9 respondents) also a different result from poultry
21
With regard to the crude protein level for CSM preferred by catfish respondents about 43 indicated a preference for 48 crude protein (Table 135) About 20 of the respondents were satisfied with the standard 41 level and nearly 30 indicated a preference for a 44 protein CSM No respondents preferred anything less than the standard 41 The mean preferred crude protein level was about 42
With respect to energy levels the catfish sample members were asked to indicate what they considered to be the normal maximum and minimum energy levels for protein feeds for fingerlings grow out stock brood stock and fries Despite the low number of catfish respondents the answers to this question were widely divergent (Table 136) For fingerlings the maximum (in K Cals DE per pound) ranged from 1250 to 1800 and the minimum from 2 to 1500 with a mean maximum of 1525 and a mean minimum of 834 For grow out stock the maximum (in K Cals DE per pound) ranged from only 1500 to 1600 and the minimum from 1 to 1300 with a mean maximum of 1550 and a mean minimum of 750 For catfish brood stock the maximum (in K Cals DE per pound) ranged from 1300 to 1700 and the minimum from 1200 to 1400 with a mean maximum of 1500 and a mean minimum of 1300 For fries the maximum (in K Cals DE per pound) ranged from 1250 to 1800 and the minimum from 900 to 1500 with a mean maximum of 1525 and a mean minimum of 1200 Given the disparity in these responses it seems clear again for catfish feed formulators that there is little common concept of the normal maximum and minimum energy levels for protein feeds
Catfish sample members similarly were asked to indicate the minimum and maximum fat levels they considered critical for protein feeds As with poultry the range of responses was still quite wide but there also appeared to be more uniformity in responses to this question than the one for energy level (Table 137) The maximum fat levels (ether extract as fed basis) indicated by the respondents again ranged from 1 to 15 for most catfish types as was the case for poultry The mean minimum levels of fat for all catfish types ranged from about 3 to 5 The mean maximum ranged from 6 to 10 aCrOSS the different catfish types
Catfish sample members were also asked to indicate the level of gossypol they considered safe for catfish rations The responses again varied widely from a low of 0 ppm up to a high of 300 ppm for some catfish types (Table 138) The two highest mean safe levels of gossypol were 97 ppm for grow out stock and 83 ppm for brood stock For fingerlings and fries the safe maximum mean levels were much lower at 44 ppm and 23 ppm respectively
The questionnaire also asked the sample members to indicate if they use or would use synthetic amino acids where economical The response was that 83 (all but 2) of the catfish respondents indicated that they have or would use synthetic amino acids in this situation (Table 139) This suggests little real aversion on the part of feed formulators to utilize synthetic amino acids in least cost catfish formulations
To obtain some insight on the general perception of catfish formulators regarding CSM the sample members were asked to indicate their opinion of the overall feeding value of a standard 41 protein CSM compared to that of a standard 44 protein soybean meal expressed on a percentage basis They were given a choice of 5 ranges from under 70 of the feeding value of soybean meal to over 100 in 10 increments (see Table 140 for the actual ranges used) All but one of the catfish respondents indicated that CSM has an overall feeding value of under 90 of that of soybean meal Given the five choices offered to respondents the mean feeding value of CSM relative to that of soybean meal was around 80
22
Sources of Information UtiJized on Formulating Catfish Feeds
Only about half of the catfish respondents indicated that they were familiar with research on feeding CSM to grow out stock and only a third were familiar with research on fingerlings (Table 141) Only 2 respondents were familiar with any research on feeding CSM to brood stock and fries To obtain information on formulating feeds for catfish the largest number of respondents indicated that they utilize university research and industry publications of some type (Table 142)
Cottonseed Meal Price and Value
Catfish sample members were also asked two Questions to get some idea concerning their perception of the value of CSM particularly with respect to soybean meal 1) if they would be willing to pay a premium per unit of protein for CSM with more than a standard 41 protein and 2) if gossypol and fiber were sufficiently low on average what percent of the cost of soybean meal would they be willing to pay for CSM
With respect to the first Question 75 of the catfish respondents indicated a willingness to pay a premium for a CSM with more than 41 protein which is consistent with their earlier responses that they would prefer a CSM with a higher crude protein level (Table 143)
In response to the second Question catfish respondents indicated that they would only be willing to pay an average of about 82 of the cost of soybean meal for a CSM with a sufficiently low level of gossypol and fiber (Table 144) The range around that average was more narrow than for poultry from 70 to 100 This is more consistent with the ratio of CSM price to soybean meal price that has existed over the last 7 or 8 years on average
Suggestions for Improving the Usefulness of Cottonseed Meal
Only three catfish respondents offered suggestions for improving the usefulness or value of CSM for catfish rations The three suggestions included I) providing a more consistent product in price and Quality 2) providing a premium Quality toxin-free high protein low-fat product superior to soybean meal and 3) eliminating the CHO fraction (Table 145)
Comparisons Among Animal Species
In order to highlight the salient differences in responses with respect to the various animal species the mean responses to Questions that are common among all surveys regarding CSM use as a feed ingredient were compared and analyzed An analysis of variance (ANOY A) was also done to detect statistically significant differences in the mean responses to each Question by animal specie Comparisons are made among the mean responses to all Questions in the 6 general areas to which all sample members were asked to respond regardless of the animal specie(s) for which they formulate feeds 1) the particular factors affecting their choice of dietary proteins for formulated feeds 2) the extent to which CSM is considered to be an alternative to selected protein feeds 3) the importance of nutritional and non-nutritional factors in their decisions to use CSM rather than alternative dietary proteins in their feed formulations 4) the seasonality of CSM availability 5) the specific reasons for the selection and non-selection of CSM for use in the feeds they formulate and 6) the source of CSM chemical analyses used by the respondents Where appropriate ANOY A results are also indicated
23
Factors Affecting Choice of Dietary Proteins
As discussed earlier all members of the final sample regardless of the animal species for which they formulate feeds were asked to rank the importance of four general factors in their choice of a dietary protein for their feed formulations on a scale of I to 7 (from extremely unimportant to extremely important respectively) 1) quality 2) price 3) availability and 4) consistency Comparing the results across animal types reveals few significant differences in the importance attached to any of the four factors by the responding formulators of the various animal specie feeds (ie comparing results horizontally in Table 146) But as pointed out in an earlier section the mean rankings for quality are all higher than those for the other factors while the mean rankings of price are all lower than those for most other factors across all animal types In other words the respondents consistently ranked quality highest on the scale of importance followed in order by consistency availability and price
Cottonseed Meal As An Alternative Protein Feed
Recall that the sample members were asked to rank various selected protein feeds on a scale of 1 to 7 as inferior or superior to CSM in an overall sense for use in feed formulations A second question required respondents to indicate whether or not they considered CSM to be an alternative to each of the 20 listed protein feeds A comparison of the mean ran kings and ANOV A results across animal types indicates substantial agreement among the respondents regarding the ranking of CSM as an alternative to some animal feeds and substantial disagreement with respect to CSM as an alternative to many others (Table 147) Respondents over all animal types tended to agree that certain feeds and in particular the higher crude-protein-content feeds are clearly superior to CSM including dried skim milk meat and bone meal fish meal blood meal soybean meal dried whole milk and corn gluten feed There was a statistically different deviation in the extent to which respondents for some animal species regarded those meals as superior however For example catfish respondents ranked meat and bone meal fish meal poultry by-products blood meal soybean meal and corn gluten meal higher than did respondents for the ruminant animals The same was roughly the case for poultry Beef and dairy cattle respondents tended to rank all other protein feeds as less superior (ie more inferior) to CSM There was also substantial agreement that CSM was about the same as tankage peanut meal linseed meal and brewers and distillers dried grains but superior to some extent over the other feeds particularly those lower in crude protein including dehydrated alfalfa sunflower meal wheat middlings safflower meal canola meal feather meal and urea Beef and dairy cattle respondents agreed that CSM can be considered an alternative to nearly all the protein feeds except perhaps skim and whole dried milk Poultry and catfish respondents indicated CSM is an alternative to fewer of the other protein feeds
The Importance of Nutritional and Non-Nutritional Factors
Respondents also ranked the importance of specific nutrition-related and non-nutritionshyrelated factors in choosing cottonseed meal as a component of the feeds they formulate on a scale of extremely unimportant to extremely important (a scale of I to 7 respectively) Comparing the mean rankings by the respondents reveals that poultry and catfish feed formulators clearly consider proteinshyrelated factors and gossypol level to be more important than do beef and dairy feed formulators (Table 148) Fiber level is also of more importance to formulators of catfish feed Interestingly the importance of fiber was not ranked significantly higher by poultry feed formulators than by beef and dairy cattle feed formulators At the same time aflatoxin was clearly ranked by all respondents as the most important factor affecting the choice of CSM as a feed ingredient irrespective of the animal specie for which the ration is intended
24
For the non-nutritional factors an analysis of the mean rankings indicates few significant differences in the responses across animal species with respect to each individual factor listed (Table 149) The most notable exception is that poultry respondents ranked palatability significantly less important than did any of the other respondents for the other animal species Finally catfish respondents perceived that service by the CSM industry was more important for them than did the respondents for the other animal species
Seasonality of Cottonseed Meal Availability
The respondents across all animal species indicated that CSM is least available between about May and October likely reflecting the increasing shortages of cottonseed meal supply just prior to the cotton harvest in the fall (Figure 20) At the same time however the beef cattle dairy cattle and poultry respondents all indicated that there is less need for CSM to be available during approximately those same months in order to compete effectively with other protein feeds (Figure 21) This suggest that the seasonality of supply may not represent an important constraint to competitiveness and growth possibilities of CSM as a feed ingredient Interestingly catfish respondents suggested a largely inverse pattern of the times of the year when CSM needs to be available to compete effectively with other protein feeds as a catfish feed ingredient Possible explanations of this phenomenon include I) the protein feed needs of catfish feed formulators peak in the late spring and summer months when supply is less available 2) catfish feed formulators are located such that CSM is not easily obtainable particularly during short supply years or 3) formulators of feed for other animal species have longer experience in using CSM and have adjusted their formulation to the pattern of CSM supply availability In any case it should be remembered that there are relatively few catfish feed formulators in the sample so that their joint responses may not be truly representative of all catfish feed formulators In this case this difference in their responses may mean little
Reasons for the Selection and Non-Selection of Cottonseed Meal
Respondents across animal species were quite consistent in their ranking of the top reasons that CSM is included in feed formulations (Table 150) They overwhelmingly ranked price as the top reason followed generally by availability and protein quality Catfish respondents differed somewhat from that order ranking protein quality second and palatability as third Availability was ranked fourth by catfish respondents The top reason all respondents listed for which CSM is not included in feed formulations was also price (Table lSI) Beef and cattle respondents ranked availability as second but poultry respondents ranked gossypol second while catfish respondents ranked protein quality second A vailability ranked only as the third reason that CSM is not selected by poultry respondents and fourth by catfish respondents Gossypol ranked either third or fourth for all animal species except poultry for which gossypol appears to be a more important reason for not including CSM in poultry feed formulations The question regarding the characteristics of CSM that would have to change in order for it to be selected more frequently as a feed ingredient elicited about the same responses as those for the previous question concerning why CSM is not included in feed formulations (Table 152) The top characteristic that would have to change in the opinion of most respondents is price Catfish respondents however listed price extremely low on their list suggesting that other factors are more of a constraint to CSM use in their opinion They ranked gossypol as the number one characteristic that would have to change Availability appeared to be more of a concern to beef and dairy feed formulators than for poultry and catfish formulators
25
Source of Chemical Analyses for Cottonseed Meal
About the same percentage of respondents across animal species perform analytical tests for aflatoxin crude protein fat fiber and gossypol (Figure 22) The only noticeable differences were for aflatoxin and gossypol for which about half the percentage of dairy and beef respondents compared to catfish respondents reported that they routinely perform tests A higher percentage of poultry respondents also appear to perform tests for aflatoxin and gossypol than is the case for beef or cattle respondents Crude protein is tested for by the highest percentage of respondents for all animal species while gossypol is tested for by the smallest percentage of all respondent groups except catfish CSM suppliers are more likely to provide feed formulators with analytical values for crude protein fat and fiber than for aflatoxin or gossypol (Figure 23) A sizeable percentage of the respondents across all animal types reported that their CSM supplier provides no analytical values whatsoever
Summary ofMajor Findings
Of the reams of information normally provided by a study like this relatively little is usually new or profound And of what can be found that appears important only some is little more than interesting or particularly useful Before turning to a discussion of the implications of the study results the major findings across animal groups are briefly summarized first Sifting through the many tables figures and data sets the main findings of the study appear to be the following
bull Quality is the most important factor affecting the choice of dietary proteins by feed formulators followed by consistency and availability Price is the least important of the four factors in making general decisions regarding dietary proteins for animal diets
bull Once feed formulators have set the general parameters for use of dietary proteins in their formulations however price is the most important factor determining the choice among alternative dietary proteins to satisfy the general parameters for dietary protein use in feed formulations
bull When considering whether or not to use CSM as the dietary protein in feeds the nutritional factors of most concern to formulators of feed for non-ruminant animals (poultry and catfish) appear to be protein-related For formulators of ruminant (beef and dairy cattle) feeds aflatoxin level and rumen degradability are the most important nutritional factors
bull The most important non-nutritional factors affecting feed formulators decisions regarding whether or not to use CSM are I) price 2) availability 3) consistent quality and 4) palatability in that order
bull Non-nutritional factors are more important than nutritional factors in the choice of CSM over alternative feeds to fill the dietary protein requirements of feed formulations In general price and availability were ranked above protein quality and other nutrition-related factors as reasons why CSM is and is not chosen as a feed ingredient over alternatives Price and availability were also cited as the characteristics that most need to change in order for CSM to be selected as a feed ingredient more frequently
bull CSM is generally considered to be inferior to higher protein feedstuffs and superior to lower protein feedstuffs This generalization however does not hold for all feeds and all animal types Formulators of ruminant animal feeds ranked many of the higher protein feeds more on a par with CSM than did formulators of non-ruminant animal feeds
26
bull The seasonality of CSM availability is both a positive and a negative factor affecting the use of CSM rather than alternative protein feeds in animal feed rations That is CSM is obviously more likely to be selected as a feed ingredient during months of greater availability than during the months of lower availability In general however the survey responses indicate that CSM is normally available when feed formulators perceive that it needs to be available One word of caution It may be that a higher percentage of CSM users agreed to participate in this survey than those who are currently not using CSM Those who are current CSM users may well have already adjusted their feed purchasing patterns and operations to reflect the seasonal changes in the availability of CSM Consequently current CSM users may perceive less of an availability problem than those who are not currently using CSM In this case the responses to these questions may not be truly representative of the perception of the availability of CSM by feed formulators in general
bull There is a tremendous disparity in the perception of respondents as to the appropriate levels of several key nutrition-related factors for specific livestock rations including energy levels fat levels gossypol levels and escape values (ruminants only) for cottonseed meal For each animal specie the range of variation in the perceived acceptable levels of each of these factors was extremely wide The obvious conclusion is that feed formulators generally lack adequate and reliable information on many factors which are crucial in efficient feed formulation and which have a significant impact on the choice of CSM as a feed ingredient
PROBLEMS AND OPPORTUNITIES FOR EXPANDING COTTONSEED MEAL USE
CSM is somewhat unique among vegetable protein meals in that it is the product of a byshyproduct The volume of the by-product cottonseed available for crushing and the potential supply of CSM depend more on the dynamics of cotton supply and demand than on forces specific to CSM markets This mean that market signals from feed formulators and livestock feeders regarding desired values and characteristics of protein meals likely have little impact on the potential CSM market supply
Since the mid-1970s the share of the annual production of cottonseed fed directly to ruminant livestock has increased steadily from about 5 in 1974 to nearly 40 in 1990 (Figure 24) The consequence has been a marked decline both in the share of the available supply of cottonseed that is crushed and in the ratio of actual to potential cottonseed meal output An increase in the demand for CSM therefore will either bid up the market price of CSM with no additional volume actually used or increase the cottonseed crush to feed use ratio (or some combination thereof) There will be little or no effect on the total amount of cottonseed available
The intent of efforts to expand the market for any commodity is to effect an increase in sales at a higher price For a commodity with a relatively fixed supply the major result of an expansion in demand is solely an increase in price because supply cannot increase to allow an increase in use For a commodity with an unlimited supply successful market expansion efforts simply increase use to the extent of the promotion with no increase in price For a commodity with a supply somewhere in between those two extremes successful market expansion will increase both the price and quantity used Although the situation for cottonseed meal is closer to the fixed supply end of the spectrum market expansion efforts can increase the use of cottonseed meal through an increase in the crush-toshy
27
feed cottonseed use ratio This ratio will increase as the profitability of crushing vs alternative uses of the seed increase
The results of this survey however indicate both some problems and possible opportunities for expanding cottonseed meal use After briefly summarizing the major obstacles as identified in the study the major opportunities for expanding use of cottonseed meal will be discussed
Problems for Expanding Cottonseed Meal Use
The major problems for expanding CSM use are generally well known and verified by the survey results The major problems that would hinder efforts to expand cottonseed meal use identified in the study included primarily the following
bull Price and availability of CSM are the major factors affecting the selection or non-selection of CSM as an ingredient of feed formulations regardless of animal specie These nonshynutritional factors were judged to be more important than nutritional factors in selecting CSM as a feed ingredient Unfortunately neither the price nor the availability of CSM can be controlled or altered substantially or directly by market expansion efforts Some efforts to improve availability may be possible as discussed in the next section
bull CSM is perceived to be inferior in an overall sense to a number of key protein feeds CSM was judged by the survey respondents to be clearly superior in aggregate to only 5 of 20 potential alternate protein feeds Such an image could work against efforts to expand CSM use
bull Gossypol level is one of the top reasons that CSM is not used more frequently particularly in non-ruminant feed rations The level of gossypol is a unique characteristic of CSM that obviously cannot be changed through market expansion activities
bull Several other specific characteristics of CSM would likely need to change for CSM to be selected more frequently as a feed ingredient including amino acid balance energy level aflatoxin level and protein quality As with gossypol changes in these characteristics are out of the realm of market expansion programs
bull Feed formulators generally lack adequate and reliable information on many factors which are crucial in efficient feed formulation and which likely have a significant impact on the choice of protein feedstuffs The use of CSM in livestock feed rations is likely restricted by the wide disparity in the perception of feed formulators regarding the appropriate levels of several key nutrition-related factors for specific livestock rations including energy levels fat levels gossypol levels and escape values (ruminants only) for cottonseed meal
bull Over 75 of dairy cattle feed formulators and nearly half of beef cattle feed formulators utilize whole fuzzy cottonseed to some extent in some of the feed rations they formulate Relatively few reported using utilizing both CSM and whole cottonseed in the same ration A main attraction of the use of whole fuzzy cottonseed as opposed to cottonseed meal is the fiber content Indeed the use of whole delinted cottonseed in cattle feed rations is much lower
28
Opportunities for Expanding Use of Cottonseed Meal
There are essentially only two basic tools to expand the market for any commodity l market development and 2) enhancing the efficiency of the marketing system Market development involves a wide range of activities including primarily new product development and product differentiation In new product development the effort is to develop new products or characteristics of products that appeal to different segments of consumers An example might be research leading to the elimination of gossypol in cottonseed meal which could further open up the non-ruminant feed industry to cottonseed meal
Product differentiation on the other hand encompasses those activities designed to create a user preference for or loyalty to a commodity Product differentiation occurs in two major forms 1) advertising and 2) variation in design and quality of product The primary purpose of advertising is to create user preference for a commodity and convince users of the superiority of a product over competing products Actual physical differences in the product are not necessary to successfully differentiate it from competing products It is sufficient only that users believe that some superiority exists Advertising often intends to create an image of superior quality because such images are harder to imitate or successfully counter than physically unique features Successful differentiation of a product means that users become less sensitive to price changes more willing to pay a higher price for the same quantity because they prefer the product and are loyal to it in the face of price increases In other words users are willing to pay more for the same amount because advertising if successful creates a preference for the product over competing products
Variations in quality and design are usually used along with advertising to differentiate the product of one seller from that of another Such variations are often necessary to help create the superior images desired andor attract new sets of consumers
Often barriers exist in a marketing system that hinder the efficient functioning of the market and restrict the flow of commodities from sellers to users Enhancing the efficiency of the marketing system through eliminating such barriers can lead to an expansion in the use of a commodity One of the primary requirements of an efficiently functioning market is that sellers and users possess adequate and accurate information regarding the product its characteristics availability sources uses and value among other things Inadequate or inaccurate information regarding a particular product and other market characteristics can divert demand to alternative products with which users may be more familiar regardless of whether or not those products are better in some sense
The concept and importance of enhancing market efficiency in this regard can be illustrated by comparing the flow of information about a product and market conditions with a radio broadcasting system The efficiency of such a system depends on how accurately the microphone and other equipment record sound how accurately and rapidly that sound is transmitted to a radio receiver and how accurately the receiver brings sound to the listener A breakdown anywhere along the line in that system will simply mean that the message of the broadcast does not get from the radio station to the listener Also if the message gets through but static interferes with the transmission the listener might only receive part of the message or a garbled message The listeners impressions and actions consequently might be quite different than if he had received the message intended In quite the same manner the flow of a commodity from producers to users is affected by how rapidly and accurately market information is evaluated and how accurately and rapidly this information is transmitted to and among producers and users Any breakdown or static in the system would result in a smaller and more obstructed flow of the commodity to users than if the market operated more efficiently
29
The survey results suggests possible opportunities for expanding CSM use through market development and enhancing market efficiency Market development opportunities may be limited because of the nature of the CSM supply situation Nevertheless expansion of CSM use is possible through a reduction in direct feeding of cottonseed so that opportunities for expanding use through market expansion efforts should not be discounted Efforts to enhance the adequacy and accuracy of information regarding the use of CSM as a feed ingredient however may well be the most effective means of promoting an expansion of use or enhancement of the value of CSM
Opportunities for Expansion through Market Development
Although many product development opportunities likely exist for CSM the survey basically focused on the image of CSM in the perception of feed formulators If a market development approach to expanding the use of CSM as an ingredient of animal feed formulations has any chance of success the survey results suggest that the following components of such a strategy will be crucial
bull Product quality and consistency and an improved image of availability must be the major targets of promotion efforts The survey responses across all animal types unequivocally indicated that these three factors are the prime considerations in making general decisions regarding dietary proteins for animal rations Price only becomes a factor in specific decisions regarding the particular protein feed to use to fill the dietary protein requirements of feed formulations after these general concerns are addressed Creating an image of quality consistency and availability for CSM is a necessary first step to expanding use and enhancing value
bull CSM use expansion efforts must focus to some extent on reducing the direct feeding of whole cottonseed to beef and dairy cattle Reductions in direct feeding is the only chance for an increase in supply of CSM to fuel expanded use in newer markets such as catfish and poultry feeding Also because beef and dairy cattle are major users of cottonseed meal a decrease in feeding of whole cottonseed in favor of CSM would significantly expand use
bull Separate CSM market promotion messages must be developed to address the very different needs and concerns of ruminant vs non-ruminant feed formulators The survey results clearly indicate that many nutritional and non-nutritional factors are more important for nonshyruminant feed formulators than for ruminant feed formulators and vice versa
bull The nutrition-related content of CSM market promotion messages must emphasize primarily positive aspects of CSM protein quality amino acid balance and amino acid availability as well as an accurate understanding of appropriate gossypol and aflatoxin levels Many of these factors however are more important for non-ruminant rather than ruminant feed formulators which must be accounted for in designing appropriate messages for feed formulators of each animal type
bull The non-nutrition-related content of CSM market promotion messages may well be the most important and must emphasize primarily the positive aspects of price availability consistency of quality and storability The survey results attached a relatively high level of importance also to nutrient guarantees Although not scoring particularly high in the responses services available from the CSM industry may also be a helpful component of CSM use promotion messages
30
Opportunities for Expansion through Market Emciency Enhancement
Even though some gains in CSM use and market value can reasonably be expected through market expansion efforts the cost involved could easily outweigh any benefits in terms of enhanced profits to the CSM industry Perhaps the most cost-effective appropriate and useful means of enhancing the use of CSM would be a strategy aimed at improving the level and accuracy of information available regarding CSM and its use Lack of information or misinformation can easily discourage feed formulators from using CSM in their feed formulations Strategies to enhance the quantity and accuracy of appropriate information can take on many forms from media advertising to market news letters Although it is beyond the scope of this study to develop alternative information strategies the results of this study clearly indicate a number of areas in which enhanced and more accurate information is a critical need These include the following
bull The overall quality of CSM The study suggests that the negative aspects of CSM are well known Less well known are the specific positive aspects of CSM that may give it an edge in some sense over other protein feeds
bull The ideal ratio of the price of CSM to other feeds like soybean meal The study results indicate that feed formulators may not be adequately informed about what the ideal market value of CSM is relative to soybean meal given the differences in feeding value As a consequence CSM may currently be less used in relation to soybean meal than current market price ratios suggest should be the case
bull Protein-related factors for CSM use in non-ruminant feeds These factors are a major concern in the decisions of feed formulators to include or exclude CSM in feed rations
bull The relationship of aflatoxin to CSM and the rumen degradability of CSM particularly for beef and dairy cattle feed formulators These were the nutritional factors of greatest concern to ruminant feed formulators in the decision to include CSM in their feed formulations
bull CSM price availability consistency and palatability These were indicated to be the most important non-nutritional factors affecting feed formulators decisions regarding whether or not to use CSM The study indicates that information on non-nutritional factors may be more important in the decision to use CSM over alternative feeds to fill dietary protein requirements of feed rations than information on nutritional factors
bull The feeding value of CSM relative to alternative protein feeds An accurate and detailed assessment of the extent to which CSM may be superior as an alternative to other standard protein feeds would help position CSM appropriately in the market
bull The appropriate and acceptable levels of several key parameters affecting the use of CSM in animal feed rations including energy levels fat levels gossypol levels and escape values (ruminants only) Feed formulators generally lack adequate and reliable information on these and likely other parameters not included in the study which are crucial in efficient feed formulation and which have a significant impact on the choice of protein feedstuffs Although it appears that nearly all feed formulators routinely perform crude protein analyses few perform analyses for aflatoxin gossypol fat fiber and other parameters Also CSM suppliers are apparently doing an inadequate job currently of providing such information to feed formulators
31
SOME CONCLUDING COMMENTS AND RECOMMENDATIONS
This study assessed the potential problems and opportunities for expanding the use of CSM through an analysis of the perceptions of feed formulators regarding the use of CSM as an animal feed ingredient The perceptions of feed formulators regarding CSM as a protein feed largely define the boundaries within which CSM use will be able to achieve any significant growth in the future Their perceptions right or wrong are the key to understanding not only the problems facing CSM use but also the opportunities
The general conclusion of the study is an obvious one the use of CSM in feed formulations faces some major challenges in the future Chief among these include a perception among feed formulators that price availability quality and other key CSM characteristics are often obstacles precluding increased use of CSM in their feed formulations Perhaps the most important implication of the study is that a serious lack of adequate and accurate information among feed formulators regarding the characteristics parameters value and other aspects of cottonseed meal use in animal feed rations may be seriously restricting the market opportunities for cottonseed meal U nfortunately the development of alternative strategies to expand the use of CSM and enhance the efficient functioning of CSM markets through more accurate and available information on all aspects of CSM use in feed formulations is beyond this study Nevertheless a few recommendations pertinent to the development of such alternative strategies are in order
bull Before adopting any approach to expand the use of CSM it would be useful first to conduct a detailed analysis of the costs and benefits involved Market promotion efforts through advertising can be extremely costly and yield relatively little Research has also shown that there is often a tremendous lag between advertising and promotion expenditures and any associated returns It could take years of investment in such market expansion efforts before an accurate measurement of the actual return on investment could even be attempted
bull Consider developing first a detailed plan for information dissemination to the feed industry regarding all appropriate aspects of CSM use in feed rations as determined in this study An important part of this process would be a comprehensive assessment of the information needs and the information resources readily available The gap discovered in this way between needs and resources will help set the research agenda for the industry to fill the critical existing information gaps
bull Initiate a study of final user attitudes and perceptions of CSM use as a guide to future market expansion efforts This study considered only the perceptions of feed formulators regarding the use of CSM But feed formulators are often not the final users Consulting nutritionists for example often include or exclude certain feeds and feed types from their formulations as requested by feed users At least a few of the respondents to the survey conducted for this study indicated that user preferences are major factors determining whether or not CSM is included in their feed formulations Indeed markets operate as the interaction of supply and demand to determine prices The preferences of final users ultimately will be expressed in the market values of any product in any market unless sufficient obstacles exist to prevent the market from functioning properly Therefore the real decision-makers in the use CSM in the market may well include many more individuals than adequately represented by feed formulators
32
REFERENCES
US Department of Agriculture (USDAa) Feed Situation and Outlook Report Economic Research Service FDS series various issues
US Department of Agriculture (USDA b) Oil Crops Situation and Outlook Yearbook Economic Research Service OCS Series various issues
Figure 1 Quantity of Oilseed Meals Fed to Livestock 194849 - 198590 (Average)
(1000 Tons)
25000 0-1-----------------------shy
20000 I-~
15000
10000
5000
o L 1 J tJ t tmiddotmiddotmiddot 1 oj 1 to bullbull 1 L_ n __LLL I 1 bullbull I V I
1948-49 1950-54 1955-59 1960-64 1965-69 1970-74 1975-79 1980-84 1985-90
(Years)
n iflu Soybean Meal bull Cottonseed Meal Other Oilseed Meals
Source USDA
c
8 c a CD
en ~
--I _ scg ~CD 01)-- en - () mg0 s 0
JCD enOJ CD_CD en 0
sCDCD 0 OJ shyo OJ r Jlt- 0 m CJ) 0 0lt o 0shyCD OJ J
~s ~m cpCJ) r co OJco ~m a
Figure 3 Price Premium (+) or Discount (-) of Cottonseed Meal Relative to Soybean Meal 1956-1990
~~ ~
o I ~ I I
-20 f---
-40
-60
1~1~1~1~1~1~1~1~1~1~1~1~1~1~1~1~1~1~
Cottonseed meal price is adjusted to a soybean meal protein equivalent basis
~I------------------------------------------------------
l l A
I~middotmiddot--- --------
Figure 4 Animal Species for which Respondents Formulate Feeds
DAIRY CATILE
BEEFCATILE
HORSES
SHEEP
BROILERS
LAYERS
OTHER
PETS
TURKEY
SWINE
CATFISH
210
21000
0 5 1000 15 20 25
Figure 5 Respondents Formulating Feeds for the Various Animal Species
0 20 40 60 80
Figure 6 Other Animal Species for Which Respondents Formulate Feeds
DAIRY CATTLE
BEEF CATTLE
HORSES
SHEEP
BROILERS
LAYERS
OTHER
PETS
TURKEY
SWINE
CATFISH
632
Exotics
Trout
Alligators
KOI
Breeding Hens
Wildlife
Rabbits
Avian
Shrimp
Salmon
Ducks
Fish
Gamebirds
Hybrid Bass
379
~--~----~--~----~----~--~----~--~----~--~
0 10 20 30 40 50
Figure 7 Respondent Feed Formulation Activities by State
( of Respondents)
o 00 middot15 16 -30 31 middot45Cgt 46 -60 61 - 75 - 76 -90
Table 8 Respondent Experience as an Animal Nutritionist
( of Respondents) 30 r---shy
25 t-middotmiddotmiddotmiddotmiddotmiddotmiddotmiddotmiddotmiddotmiddotmiddotmiddot-middot ---_ _
20 -_ -nNItshy
15
10
5
0 1-5 6-10 11-15 16-20 21-25 26-30 31-35 36-40 41-45
(Years Of Experience)
-it sa 0 m 8 l 0 CD l g
_ cc c -s CD CObull
-0 -s- 3 Dl ~ IJ CD (fJ
C 0 l C CD l -+
raquo Sl_ lt_ -+_ CD (fJ
Figure 10 Respondent Primary Feed Formulations
by Animal Type 1990 (Percent)
30 I--------------------------------------------------------shy
25 r- middotmiddotmiddotmiddotmiddotmiddot231middotmiddotmiddotmiddot
20
15
10
5
0 Beef Dairy Swine Poultry Horses Pets Aqua- Sheep Exotics
Cattle Cattle culture amp Goats
(Animal Type)
Figure 11 Percent of CSM and S8M Used in Formulations by Feed Manufacturer Respondents 1990
( of Average Feed Ration)
Figure 12 Tons of Feed Formulated by Feed Manufacturer Respondents 1990
65
91
6 9
17
Total Formulations Formulations With CSM
II Less than 200000 Tons
II 200000 - 400000 Tons bullbullbull I bullbullbullbullbullbull ~ 3 ~ 400000 - 600000 Tons
5 rn 600 000 - 800 000 Tonsru 1
[] 800000 - 1000000 Tons9 4
I ~ 1 More Than 1000000 Tons
Formulations With S8M
Figure 13 Percent middotof Beef Cattle Respondents Formulating CSM Feeds for Specific Beef Cattle Types
( of Respondents)
25 ~I------------------------------------------------------~
-Isectig Feedlot-II 223
20
15
10
5
0
bull Other
~ middotmiddotmiddotmiddotmiddotmiddotmiddot middotmiddot _middotmiddotmiddotmiddot-=middotmiddotmiddotccmiddotcmiddotmiddot
Brood Cows Bulls Calves Feeder Heifer Stocker
(Animal Type)
Figure 14 Percent of Dairy Cattle Respondents Formulating CSM Feeds for Specific Dairy Cattle Types
( of Respondents)
120 ----------------------
100 88
80
60
40
20
0 Calves Heifers Lactating Cows Dry Cows
(Animal Type)
Figure 1-5 Percent of Poultry Respondents Formulating CSM Feeds for Specific Poultry Types
( of Respondents)
OO~I--------------------------------------------~-
50 1-laquolaquolt--laquolaquolaquo -lt - lt - lt -lt laquo lt
44
40
30
20
10
0
f-
~laquolaquolaquolaquo
~laquolaquolaquolaquolaquolaquo
Broilers Layers Turkeys Breeding Flocks
(Animal Type)
Figure 16~ Combined Responses Months of the Year When CSM IS NOT Available
( of Respondents) 16 i ---
14 12~8
12
10
87373 7
6
4
2
0 ~~ ~s ~( ~( ~0( ~0(~~~ ~~ ~t ~1 u~ ~g n0~ ad-o N0~ ~a~
~Y ~o Q~lmiddotr
(Month)
Figure 17 Combined Responses Months of the Year When CSM Needs to Be Available
( of Respondents) 12 ---------------------------
10
8
6
4
2
0
goA 9
~ui ~s ~Ot X)Ot ~Ot X)Ot~0SV~0~~erl ~iSclt ~f ~~1 ~v~ ug ~o~ o~o NO~ co~0 0lt609 ~o
(Month)
Figure 18 Beef Cattle Responses Percent of Respondents Formulating Creep Feed for Calves or Supplements for Stockers
733
832
0 20 40 60 80 100 120
( of Respondents)
Figure 19 Beef Cattle Responses Protein-Related Factors Considered When Balancing Rations
Other Protein Factors 110
Rumen
Degradability 686
Crude Protein Level 161
Amino Acid
Values 42
( of Respondents)
Figure 21 Comparison of Responses Months When CSM Needs to Be Available
( of Respondents) 94 ---------------------------shy
92
9
88
86
84
82 8
78
76
74
72
7
68
66
~ euroI - It
64 -t----------------------------------- -----------t
JAN FEB MAR APR MAY JUN JUL AUG SEP OCT NOV DEC
(Month)
bull Beef Cattle -t Dairy Cattle ltgt Poultry Catfish
Figure 20 Comparison of Responses Months When CSM Is Not Available
( of Respondents)
16 t 15
14
13
12
11
10
9
8ltl amp
7
6
5 I JAN
I
FEB I
MAR I
APR I
MAY I
JUN I
JUL I
AUG SEP I
OCT NOV I
DEC
(Month)
bull Beef Cattle -t Dairy Cattle ltgt PouHry b Catfish
Figure 22 Comparison of Responses Analyses Routinely Performed
( of Respondents)
100~-----------------------------------------------
90
80
70
60
50
40
30
20
10
o I ~
AFLATOXIN C PROTEIN FAT FIBER GOSSYPOL OTHER NONE
(Analyses)
bull Beef Cattle Dairy Cattle o Poultry Catfish-t fj
Figure 23 Comparison of Responses Analytical Values Provided by Supplier
( of Respondents)
60shy
50
4)
30
20
10
o amp ~
AFLATOXIN C PROTEIN FAT FIBER GOSSYPOL OTHER NONE
(Analyses)
bull Beef Cattle -t Dairy cattle o Poultry b Catfish
Figure 24 Share of Cottonseed Use Crush vs Feed Use
( of Respondents)
100 I
90
CRUSH 80
70
60
50
40
30
20
FEED USE 10
o 1~ 1~ 1~ 1m 1m 1~ 1~ 1~ 1~ 1~ 1~ 1~ 1~ 1~
(Year)
Source USDAb
Table 1 Percentage of Beef Cattle Feeds Formula ted Table 2 CSM Feeds Formulated for Beef Cattle CSMmiddot Calvesmiddot
middotAverage Response Rate (feedlot=51 other=41) middotResponse Rate = 39
Table 3 CSM Feeds Formulated for Beef Cattle Table 4 CSM Feeds Formulated for Beef Cattle Stockersmiddot
middotResponse Rate = 40
Response Rate =37
Table 5 CSM Feeds Formulated for Beef Cattle Table 6 CSM Feeds Formulated for Beef Cattle
middotResponse Rate =33
middotResponse Rate = 37
Table 8 Percentage of Dairy Cattle Feeds Formulated CSM
Average Response Rate =88
middotResponse Rate = 37
Table 9 CSM Feeds Formulated for Dairy Cattle Table 10 CSM Feeds Formulated for Dairy Cattle
RespooseRate 24
middotResponse Rate = 34
Table 11 CSM Feeds Formulated for Dairy Cattle Table 12 CSM Feeds Formulated for Dairy Cattle
Response Rate = 31 Response Rate = 45
Table 13 Percentage of Poultry Feeds Formulated Using CSMmiddot
bullAverage Response Rate = 79
Table 14 Percentage of Catfish Feeds Formulated Using CSMmiddot
bullAverage Response Rate =67
Table 15 CSM Feeds Formulated for Catfishmiddot )middoti middot fteq~
bullAverage Response Rate = 17
Table 16 Combined Responses Importance of Specific Factors in Choice of Dietary Protein ( of
bullAverage Response Rate =g]
Table 17 Combined Responses Other Important Factors in
bullAverage Response Rate = 22
bullAverage Response Rate =91
-Average Response Rate =90
Table 20 Combined Responses Importance of Non - Nutrition -Related Factors in Choice of CSM over Alternative Protein Feeds ( of
-Average Response Rate = 87
Table 22 Combined Responses Top S Reasons Why CSM IS NOT Selected as a Feed
Table 23 Combined Responses Top 5 Specific Characteristics That Would Have to Change for CSM to be Selected as a Feed
Table 24 Combined Responses Analysis Routinely Performed
Table 25 Combined Responses Analysis Values Provided
CSM
267 067 333 333 1400 S333
467 000 067 067 1400 4867 --shy
467 000 000 067 400 4333 --shy -- shy -- shy
250 000 000 000 1250 4000 -- shy --shy
313R 4733 62 ------ shy~ - shy ~-
4S00 62
bullAverage Response Rate = 100
bullAverage Response Rate = 87
Table 28 Beef Cattle Responses Imponance of Nutrition-Related Factors in Choice of CSM Over Alternative Protein Feeds
Average Response Rate = 91
Table 29 Beef Cattle Responses Other Nutrition - Related
Fact~~~~~~~~~~~~~~~~~~~
Response Rate =7
Table 30 Beef Cattle Responses Imponance of Non - Nutrition - Related Factors in Choice of CSM Over Alternative Protein Feeds
middotAverage Response Rate = 87
middotResponse Rate = 5
bullAverage Response Rate =14
Table 33 Beef Cattle Responses Months of the Year When CSM Needs to Be AvaiJable I ii middot middot1
bullAverage Response Rate =53
10 U
-Moy
JIIJ
All
so
0_ -
to
--I No
Moy
10 -so shy
0_ _ 0-
Table 35 Beef Cattle Responses Top 5 Reasons Why CSM Is Not Selected as a Feed
Average Response Rate =100 Response Rate = 24
Response Rate =28
Average Response Rate = 98
Response Rate = 17
middotResponse Rate =9
Table 43 Beef cattle Responses Type of Creep Feed
middotResponse Rate = 81
middotResponse Rate =26
Table 45 Beef cattle Responses Respondents Formulating Rations With CSM and Whole
middotResponse Rate = 68
Table 47 Beef cattle Responses Percentage of Whole Cottonseed Respondents Mix in Rations Containing Both CSM and Whole Cottonseedmiddot tCmiddotHiitjt~ middotmiddotmiddotmiddot1
middotResponse Rate =25
middotResponse Rate = 30
bull Response Rate = 98
Response Rate =11
Table 51 Beef Cattle Responses Escape Value Respondents Are Using for Rumen Degradabilitymiddot
1~iiii middotb~r~~fgtD zq436imiddotmiddotmiddotmiddotmiddotmiddotmiddot 004bullbullbullbullbullbullbullbullbullbull1----22--+----31-4
I~~I 23 329
middotResponse Rate = 57
Table 53 Beef Cattle Responses Methods or Sources Respondents Used to Calculate CSM
Table 52 Beef Cattle Responses Reliability of Escape Values Used
Table 54 Beef Cattle Responses Interested in Knowing Escape Values for CSM Processed
Valuemiddot
middotResponse Rate =98
)
I Mean ~nse
63 57S19 228381 Q-L_uu ~139 59468 32306 139bullII1 1 061 06
1 1 44 430 614431-------- 57t 001 001 middot-1
==~=-__~~1c9 00 _ 06 _ 001_ 38 133 323 63
Average Response Rate =100
Response Rate = 89
Table 58 Dairy Cattle Responses Importance of Nutrition - Related Factors in Choice ofCSM Over Alternative Protein Feeds (ofbmiddotNmiddotmiddotmiddotmiddotmiddotmiddot
Response Rate =88
Table 59 Dairy Cattle Responses Other Nutrition-Related Factors
Indicated br~~P211dents
Response Rate =10
Table 60 Dairy Cattle Responses Importance of Non- Nutrition - Related Factors in Choice of CSM Over Alternative
Protein Feeds ( ofResPOndents~dd
Response Rate = 88
Response Rate = 3
--
Average Response Rate = 51
Table 62 Dairy Cattle Responses Months in the Year When CSM IS NOT Available
10 u
J -- AIIIi
--~ shy
loOoIMr _ 0-
bullAverage Response Rate =69
--- AIIIi
--~ soM
0
0-_
10
Table 65 Dairy Cattle Responses Top 5 Reasons Why CSM IS NOT Selected as a Peed
Table 66 Dairy Cattle Responses Top 5 Specific Characteristics That Would Have to ro1 ____ for CSM to be Selected as a Feed
Table 67 Dairy Cattle Responses Analyses Routinely Performed fmiddotmiddotmiddotmiddot
Response Rate =96
Response Rate =56
Table 68 Dairy Cattle Responses Other Analyses
Response Rate =25
Table 70 Dairy Cattle Other Analytical Values CSM
Response Rate =4
Average Response Rate =81
Average Response Rate = 15
Table 73 Dairy Cattle Responses Respondents Formulating Feeds With Whole andor Delinted
Cottonseed bull
bullAverage Response Rate =92
middotResponse Rate = 40
Table 74 Dairy Cattle Responses Respondents Formulating Rations with Cottonseed Meal and Whole Cottonseed in the Same Rationmiddot
middotResponse Rate = 97
Table 76 Dairy Cattle Responses Percentage of Whole Cottonseed Respondents Mix in Rations
ltltJIltainin(a0th CSM and WhoeCottonseedmiddot Mean
middotResponse Rate = 42
Table 77 Dairy Cattle Responses Knowledge of Research on Feedine CSM
~~~~
Average Response Rate = 68
Response Rate =7
Average Response Rate =59
Response Rate =25
Average Response Rate =63
Response Rate = 13
middotResponse Rate = 92
Response Rate =82
Table 85 Dairy Cattle Responses Methods or Sources Used to Calculate CSM
Response Rate = 73
Table 86 Dairy Cattle Responses Respondents Interested in Knowing Escape Values for CSM Processed from Different Methodsmiddot fmiddotmiddotmiddotmiddotmiddotmiddot
Response Rate = 92
Response Rate = 34
Table 89 Dairy Cattle Responses Suggestions for CSM
Response Rate =33 Response Rate =22
-----
64 139 24815 00 36 511 5751
5951 131 438 35015 00 15 I-~~~~~
6200 15 423 51151 00 00 ~~~ -~~~ -~~~ ~~~-~~ --~~ ~ ~ ~~-~ ~
292 55125 00 00 125 45800
bullAverage Response Rate =99
Average Response Rate =85
Table 92 Poultry Responses Importance of Nutrition - Related Factors in Choice of CSM Over Alternative Protein Feeds (of
Average Response Rate =85
Table 93 Poultry Responses Other Nutrition-Related Factors Indicated
200
200
Response Rate = 5
Table 94 Poultry Responses Importance of Non - Nutrition - Related Factors in Choice of CSM Over Alternative Protein
Feeds~~~~~~~~~~5=~~~~~T7~~
00 Average Response Rate =83
Response Rate =4
Average Response Rate = 17
Table 97 Poultry Responses Months in the
J
p
April
lao
A
shy-- 0
ft
April
_
Average Response Rate = 43
=1 g L
0
Table 99 Poultry Responses Top 5 Reasons Why CSM IS NOT Selected as a Feed
Table 100 Poultry Responses Top 5 Specific Characteristics That Would Have to Change for
CSM to be Selected as a Feed Inoredient
Table 101 Poultry Responses Analyses Routinely
middotResponse Rate = 93
Table 102 Poultry Responses Other Analyses Routinely
Performed
middotResponse Rate = 27
Table 103 Poultry Responses Analytical Values Provided
middotResponse Rate =73
Table 104 Poultry Responses Knowledge of Problems
bullAverage Response Rate = 62
Average Response Rate = 14
Table 106 Poultry Responses Protein - Related Factors
Average Response Rate = 64
Table 107 Poultry Responses Other Protein - Related
Response Rate =11
Table 108 Poultry Responses Crude Protein Levels
Preferred for CSM
Response Rate = 55
Table 111 Poultry Responses Gossypol Levels Considered
Safe
Table 112 Poultry Responses Would or Do Use Table 113 Poultry Responses Relative Feeding Value of CSM Comoared to 44 SBMmiddot
middotResponse Rate = 96
bull Response Rate = 100
Table 114 Poultry Responses Knowledge of Table 115 Poultry Responses Familiarity with Other Feedino CSMmiddot
middotResponse Rate =7 bull Response Rate = 73
middotResponseRate = 31
bullAverage Response Rate = 58
Table 118 Poultry Responses Willingness to Pay
a Premium Per Unit of Protein for CSM With More
Than 41 Protein
bullResponse Rate =91
Table 119 Poultry Responses Percent of Cost of SBM Respondents Willing to Pay for CSM with
Response Rate =27
Response Rate =64
00 00 87 43 478 304 57 00 00
----shy I--~~
00 ~-~
43 522 348 59 ----shy
62~ 00 00 00 261 ----shy
652 ------shy
00 00 00 00 667 333 63 AverageResponseRate = 99
bullAverage Response Rate = 73
Table 123 Catfish Responses Importance of Nutrition - Related Factors in Choice of CSM Over Alternative Protein Feeds
Average Response Rate =83
Table 124 Catfish Responses Importance of Non- Nutrition - Related Factors in Choice of CSM Over Alternative Protein
Feeds
Average Response Rate = 90
bullAverage Response Rate = 13
Igt 20
s_
Pshy s
--s
H_
_
gt 7 bull bull bull bull bull
1 fsI plusmn -
haMr
N__
shy
bullAverage Response Rate =54
Table 128 Catfish Responses Top 5 Reasons Why CSM IS NOT Selected as a Feed
Table 129 Catfish Responses Top 5 Specific Characteristics That Would Have to Change for CSM to Be Selected as a Feed-_
Table 130 Catfish Responses Analyses Routinely Table 131 Catfish Responses Other Analyses Routinely Performed
middotResponse Rate = 25
middotResponse Rate =92
bullAverage Response Rate = 18
Table 133 Catfish Responses Knowledge of Problems Feedine CSM to CatflSh
Average Response Rate =100
Table 134 Catfish Responses Protein - Related Factors Considered i
Response Rate = 83
Table 135 Catfish Responses Crude Protein Levels Preferred for CSM
Response Rate = 100
Table 139 Catfish Responses Would or Do Use Table 140 Catfish Responses Relative Feeding
Value ofCSM Compared to 44~ Lmiddotmiddotmiddotmiddotmiddotmiddotmiddotmiddotmiddotmiddotmiddotmiddotmiddotmiddotmiddotmiddotmiddotmiddotmiddot _
Response Rate = 100
Response Rate = 100
Table 141 Catfish Responses Knowledge of Research on Table 142 Catfish Responses Sources ofInformation
Average Response Rate = 83
bullAverage Response Rate = 44
Table 143 Catfish Responses Willingness to Pay A Premium Per Unit of Protein for CSM with More Than
middotResponse Rate = 100
Table 144 Catfish Responses Percent of Cost of SBM Respondents Willing to Pay for CSM with Sufficiently Low Goscvnol and Fiber Levelsmiddot
middotResponse Rate = 83
middotResponse Rate = 25
Table 146 Comparison of Mean Responses and Analysis of Variance (ANOVA) Importance of Specific
bull Scale of 1 (extremely unimportant) to 7 (extremely important) for the mean ranking a Mean significantly larger across animal types at the 5 significance level otherwise no difference b Mean significantly lower across animal types at the 5 significance level otherwise no difference
Table 147 Comparison of Mean Responses and Analysis of Variance (ANOVA) Ranking of Other Protein
bull Scale of 1 (CSM inferior to respective feed) to 7 (CSM superior to respective feed) for the mean ranking
a Mean significantly larger across animal types at the 5 significance level otherwise no difference
b Mean significantly lower across animal types at the 5 significance level otherwise no difference
Table 148 Comparison ofMean Responses and Analysis of Variance (ANOVA) Importance of Nutritionshy
Related Factors in Choice ofCSM Over Alternativesmiddot
bull Scale of 1 (extremely unimportant) to 7 (extremely important) for the mean ranking a Mean significantly larger across animal types at the 5 significance level otherwise no difference
b Mean significantly lower across animal types at the 5 significance level otherwise no difference
Table 149 Comparison of Mean Responses and Analysis of Variance (ANOVA) Importance of Nonshy
Nutrition- Related Factors in Choice of CSM Over Alternativesmiddot
bull Scale of 1 (extremely unimportant) to 7 (extremely important) for the mean ranking
a Mean significantly larger across animal types at the 5 significance level otherwise no difference
b Mean significantly lower across animal types at the 5 significance level otherwise no difference
- = Not mentioned or ranked lower than 4th place
Table 151 Comparison of Responses Top Responses Why CSM IS NOT Selected as a Feed
- = Not mentioned or ranked lower than 5th place
Table 152 Comparison of Responses Top Characteristics that Have to Change for CSM to Be
- = Not mentioned or ranked lower than 5th place

5
and starter feeds (Table 9) For dairy heifers the main feeds formulated with CSM included various supplements and grower feeds (Table 10) For lactating cows CSM was used predominantly in complete rations For dry cows supplements and complete rations were the predominant feeds formulated with CSM (Tables II and 12)
The responding poultry nutritionists formulated feeds for layers (44) broilers (38) turkeys (24) and breeding flocks (26) (Figure 15) Layers accounted for the largest share of the CSM poultry feeds formulated by the respondents (35) followed by broiler feeds (29) breeding flock feeds (19) and turkey feeds (17) (Table 13)
Two-thirds of the catfish respondents (8 of the 12 respondents) formulate feed for grow out stock (Table 14) Half the catfish respondents (6 of the 12 respondents) formulate feeds for brood stock and for fingerlings Five of the respondents (42) formulate feeds for fries Respondents reported formulating several types of feeds using CSM for catfish (Table 15)
SURVEY RESULTS
The results of the cottonseed meal use survey are summarized into three main sections I) combined results across all animal species 2) results by particular animal species (beef cattle dairy cattle poultry and catfish) and 3) a comparison of results among animal species Summary figures and tables of the results are presented at the end of the report
Combined Results
A Dumber of the same questions were asked of all members of the survey sample regardless of the particular animal types for which they were formulating feeds (second section of the survey) The responses to the questions for each animal type were first combined to facilitate an overall assessment of the perceptions of animal feed formulators regarding the use of cottonseed meal in their feed formulations Again because many of the feed formulators participating in the survey completed the questions in this section for more than one animal specie a given participating feed formulator could count as more than one respondent in the analysis of the combined results (ie over all animal species) The results by animal species are discussed in a later section
All respondents were probed for their perceptions in 6 general areas I) the particular factors affecting their choice of dietary proteins for formulated feeds 2) the extent to which CSM is considered to be an alternative to selected protein feeds 3) the importance of nutritional and nonshynutritional factors in their decisions to use CSM rather than alternative dietary proteins in their feed formulations 4) the seasonality of CSM availabilityS) the specific reasons for the selection and nonshyselection of CSM for use in the feeds they formulate and 6) the source of CSM chemical analyses used by the respondents
Factors Affecting Choice of Dietary Proteins
All members of the final sample were asked to rank the importance of the following 4 general factors in their choice of a dietary protein for their feed formulations on a scale of 1 to 7 (from
6
extremely unimportant to extremely important respectively) I) quality 2) price 3) availability and 4) consistency In addition they were provided an opportunity to list and rank other factors affecting their dietary feed protein choices An impressive 92 of the respondents indicated that the quality of the protein was either important or extremely important in their choice of dietary proteins (Table 16) Nearly two-thirds of the respondents ranked protein quality as extremely important An almost equal number of respondents (90) indicated that protein consistency was either important or extremely important Less than half the respondents however ranked consistency as an extremely important factor Although nearly SO of the respondents ranked price availability and other factors as either important or extremely important the majority of respondents ranked each of those factors as important rather than extremely important The primary other factors listed by the respondents included palatability flow characteristics the protein composition the value supplier service and storage and handling characteristics (Table 17) Various miscellaneous factors were also listed
Cottonseed Meal As An Alternative Protein Feed
The final sample members were asked two sets of questions to gain insight into the competitiveness of CSM as a protein feed and determine which other proteins are considered to be the main competitors of CSM in feed formulations They were first asked to rank various selected protein feeds on a scale of I to 7 as inferior or superior respectively to CSM in an overall sense for use in feed formulations A mean response of greater than 4 for a particular protein feed is an indication that on average the responding feed formulators considered the protein feed to be superior to CSM (ie CSM is considered to be an inferior protein source) On the other hand a mean response of less than 4 is an indication that the protein feed is inferior to CSM in the perception of the respondents on average (Le CSM is considered to be a superior protein source) A mean response of around 4 suggests that the respondents considered cottonseed meal to be equally acceptable to those particular feeds The second question required respondents to indicate whether or not they considered CSM to be an alternative to each of the 20 listed protein feeds
The results suggest that CSM meal is considered to be clearly superior to only 5 of the 20 listed protein feeds including (in order of perceived CSM superiority) urea safflower meal wheat middlings sunflower meal and feather meal (Table IS) CSM was considered to be clearly inferior to another 7 of the 20 listed protein feeds including (in order of perceived inferiority of CSM) fish meal dried skim milk dried whole milk blood meal soybean meal meat and bone meal and corn gluten meal The mean responses of the remaining S protein feeds were all close to 4 suggesting that the respondents considered CSM to be about the same as those protein feeds These included (in no particular order) tankage poultry by-product meal peanut meal linseed meal brewers dried grains distillers dried grains dehydrated alfalfa and canola meal
Respondents were quite evenly divided in their opinion as to whether CSM is a viable alternative protein feed for almost all of the listed protein feeds (Table IS) The only possible exceptions were dried skim milk fish meal dried whole milk and blood meal for which a larger percentage of respondents indicated that CSM is an alternative than suggested that CSM is not an alternative
The Importance of Nutritional and Non-Nutritional Factors
In response to an earlier question respondents ranked the importance of various factors in choosing any dietary protein for use in their feed formulations Later respondents were asked to rank the importance of a more detailed list of nutrition-related and non-nutrition-related factors in specifically choosing cottonseed meal as a component of the feeds they formulate again on a scale of extremely unimportant to extremely important (a scale of I to 7 respectively) They were also
7
allowed to list other factors that they considered important but were not on the list Interestingly the largest percentage of respondents (90) ranked aflatoxin as an important or extremely important factor in their choice of CSM as a feed component (Table 19) Nearly two-thirds ranked aflatoxin as extremely important a much higher percentage than for any other factor Protein quality was ranked as important or extremely important by 80 of respondents Gossypol level had the third highest mean response of any individual factor Only one listed factor was clearly considered to be unimportant in the choice of cottonseed meal as a feed component (vitamin level) as indicated by a mean response of substantially less than 4 The mineral level in cottonseed meal was considered to be neither important nor unimportant
The major non-nutrition-related factors influencing the choice of cottonseed meal as a feed component in the perception of the respondents included consistent quality price availability nutrient guarantees and palatability as indicated by their relatively higher mean ran kings (Table 20) Note that all of the listed non-nutrition-related factors were considered by the respondents to be at least somewhat important in their choice of cottonseed meal as a feed component That is none of them were considered to be unimportant The least important non-nutrition-related factors influencing the choice of CSM in the perception of the respondents included service from the CSM industry the need for a local supply of CSM special equipment requirements for using CSM and convenience in using CSM as a feed component
Seasonality of Cottonseed Meal Availability
The survey results indicate that CSM is least available in sufficient quantities for purchase as a feed component during the months of June through September of a typical year (Figure 16) However the results also indicated that those are also about the same months (April through August) in which there is the least need for CSM to be available to compete effectively with alternative protein feeds (Figure 17) One interpretation of this result is that on average the availability of CSM is generally not a problem during the year This is not entirely the case however as the responses to the next set of questions point out
Reasons for the Selection and Non-Selection of Cottonseed Meal
To obtain further insight into the primary motivating factors behind the selection or nonshyselection of CSM as an ingredient in feed formulations the sample members were asked three completely unaided questions ie the respondents did not have a list from which to choose in answering the questions They were first asked to list the top five reasons why they perceive that CSM is selected as a feed ingredient and then the top 5 reasons why CSM is Dot selected in order of importance Finally if CSM is Dot generally selected by a respondent heshe was asked to list the specific characteristics of CSM that would have to change for it to be selected more frequently again in order of importance The respondents simply needed to fill in blanks for each question (reasons that CSM is and is not selected and characteristics that would have to change) marked lst through 5th with their own ideas
By far the number one reason (63 of the respondents) listed for which CSM is selected as a feed ingredient was price (Table 21) Far behind price the number one choices of some respondents were proteinprotein quality (9 of the number one responses) availability (7) palatability (4) and quality (4) Listed most often as the second most important reason for selecting CSM was availability (31 of the number two responses) followed by price (20) proteinprotein quality (1I) palatability (7) and pelletabilitypellet quality (6) The three reasons most often listed third were availability (20 of the number three responses) palatability (16) and price (11) Based on the total number of times a reason was listed first second or third the top three reasons
8
given by respondents for which CSM is selected as a feed component were price availability and proteinprotein quality in that order
The respondents provided a much longer list of reasons for which CSM is Dot selected than for which CSM is selected as a feed ingredient (Table 22) Interestingly the most frequently listed number one reason (54 of the respondents) why CSM is Dot selected as a feed ingredient was again price Other number one choices included availability (16) gossypol (9) and protein protein quality (3) The reason most often listed second (30 of respondents) was availability followed by pricevalue (20) and gossypol (8) The reason most often listed third was pricevalue again (14 of respondents) and then availability (I 3) and gossypol (I 1) Again based on the total number of times a reason was listed first second or third the top three reasons given by respondents for which CSM is Dot selected as a feed component were price availability and gossypol in that order
The three most commonly listed specific characteristics of CSM that would have to change to be included more frequently in respondents feed formulations also were price availability and gossypol (Table 23) Other less frequently mentioned CSM characteristics that would need to change included amino acid balancelevel energy contentlevel aflatoxin contentlevel proteinprotein quality
In summary price and availability appear to be the two key factors affecting the use of CSM If price is low andor availability is adequate feed formulators are more likely to use CSM in their formulations On the other hand a high price andor poor availability is likely to discourage use of CSM Consequently there is very little loyalty by feed formulators to CSM because they appear to be quick to switch back and forth between CSM and alternative feeds as price changes Feed formulators do not appear to perceive that CSM is a feed ingredient with inherent characteristics for which they are willing to pay a premium if necessary in order to continue using it as an ingredient in the feeds they formulate That is the primary consideration in deciding whether or not to use CSM is its price rather than some nutritional characteristic for example Thus when price rises they perceive little reason to continue using CSM as part of their formulations
The availability of CSM appears also to work both for and against the use of CSM Responses to the specific questions on seasonality seemed to indicate that availability of CSM is not generally a problem during the year But when CSM is not selected as a feed ingredient availability is one of the major reasons During certain times of the year in certain parts of the country availability may be a positive factor motivating the use of CSM
Source of Chemical Analyses for Cottonseed Meal
Nearly 90 of the respondents routinely perform crude protein analyses (Table 24) About two-thirds perform their own fat and fiber analyses as well Surprisingly however less than half the respondents routinely test for aflatoxin even though nearly all respondents indicated aflatoxin to be an important or extremely important factor affecting their choice of CSM as a feed component Only 18 of the respondents routinely test for gossypol Even though nearly all respondents performed their own crude protein analyses CSM suppliers apparently provide analytical values for crude protein to over 40 of respondents (Table 25) CSM suppliers provided fat and fiber analytical values to about a third of the respondents CSM suppliers appear to provide analytical values for gossypol to very few feed formulators
9
Results by Animal Species
The responses in the previous section are indicative of the overall perceptions of feed formulators of the use of CSM as a feed component Those results however may mask some important differences in perceptions among formulators of feeds for the various animal species There are also issues regarding the use of CSM as a feed component that are unique to the various animal species Consequently salient dissimilarities in the responses of formulators of different animal feeds from the combined responses (over all animal types) discussed in the previous section are highlighted in this section Also the results of the questions asked specifically of formulators of feeds for particular animal species are discussed in this section in detail as well
BeeCattle
There are few major differences in the perceptions of beef cattle feed formulator respondents concerning the use of cottonseed meal from those discussed in the previous section for all survey respondents This may reflect the larger number of respondents formulating feed for beef cattle (and for ruminants in general) than for other animal species The salient differences in the 6 general question areas include the following
bull Factors affecting choice 0 dietary proteins The only major difference in the responses to these questions was a somewhat greater concern by responding beef cattle feed formulators for other factors influencing the choice of a dietary protein such as palatability and rumen degradability (Table 26)
bull Cottonseed meal as an alternative protein feed The results for beef cattle are roughly similar to those from the combined responses (Table 27) Major differences include I) a lower percentage of beef cattle survey respondents consider blood meal to be superior to CSM in beef cattle feeds 2) a large majority of respondents feel that CSM is not an alternative to dried skim milk and dried whole milk in beef cattle feeds and 3) an overwhelming majority of respondents consider CSM to be an alternative to the remaining protein feeds for use in beef cattle feeds except perhaps for fish meal and blood meal
bull The importance 0 nutritional and non-nutritionalactors Again the responses are generally the same as for the combined responses The beef cattle survey respondents however tended to rank nutrition-related factors as less important and non-nutrition-related more important than was the case for the combined responses On average beef cattle feed formulators ranked protein quality amino acid balance amino acid availability fat level fiber level and gossypol level as less important factors in the choice of CSM than was the case for the combined responses (Tables 28 and 29) Of the non-nutrition-related factors respondents ranked palatability the need for a local supply equipment requirements convenience and CSM industry service as all slightly more important in the choice of CSM than was the case for the combined responses (Tables 30 and 31)
bull Seasonality 0 cottonseed meal availability The results for the beef cattle respondents are virtually identical to those from the combined responses (Tables 32 and 33)
bull Reasons lor the selection and non-selection 0 cottonseed meal The top three reasons for which CSM is and is not selected as a feed ingredient are exactly the same for the beef cattle responses as for the combined responses (Tables 34 and 35) Also price availability and
10
gossypol level are cited as the three most important factors that would have to change for CSM to be used more frequently as was the case with the combined responses (Table 36)
bull Source 0 chemical analyses lor cottonseed meal No major differences appear in either the analyses routinely performed by the responding beef cattle feed formulators or the analytical values provided to them by CSM suppliers (Tables 37 38 39 and 40)
Beef cattle sample members were also asked several questions specifically regarding the use of CSM in beef cattle feed formulations in 5 general areas I) problems resulting from feeding a ration with CSM to the various beef cattle types 2) details on particular feed formulations for beef cattle 3) sources of information utilized regarding formulating beef cattle feeds 4) protein-related factors considered when balancing rations for beef cattle and 5) an open-ended question soliciting suggestions to improve the usefulness or value of CSM for beef cattle feed formulations
Problems from Feeding CSM Rations to Beef Cattle
Few respondents indicted knowledge of any problems resulting from feeding a ration containing cottonseed meal to either feedlot or other beef cattle (Table 40 The most frequently mentioned problems concerned feedlot bulls and calves The majority of the problems reported involved supplements and starter feeds (Table 42) The main problems reported had to do with gossypol beef cattle performance when fed rations containing CSM and reproduction The low number of respondents indicating problems of any type however suggests that the problems reported were likely isolated cases
Details on Particular Feed Formulations for Beef Cattle
The sample members were also asked to provide information regarding creep feeds for calves and supplements for stockers that they formulate as well as information regarding the use of whole or delinted cottonseed in beef cattle feed rations Nearly 75 of all beef cattle respondents formulate creep feeds for calves and over 80 formulate supplements for stockers (Figure 18) Traditional creep feeds represented two-thirds of the creep feeds formulated (Table 43) Over half the respondents indicated that they formulate traditional creep feeds Fewer respondents formulated high protein creep feeds
Nearly half the beef cattle respondents formulate some feeds using whole fuzzy cottonseed (Table 44) Only a little less than a third formulate any feeds using delinted cottonseed however Also only about a quarter of the respondents formulate any rations that include both CSM and whole cottonseed (Table 45) For those who formulate rations that include both the mix of the two in the rations varies widely Respondents reported that the share of such rations accounted for by CSM ranged from 1 to 100 with a mean of 19 (Table 46) The share of those rations accounted for by whole cottonseed ranged from 0 up to a maximum of 25 with a mean of 102 (Table 47)
Sources of Information Utilized on Formulating Beef Cattle Feeds
The largest number of respondents (110 of 123 respondents) indicated that they utilize university research of some type to obtain information on formulating feeds for beef cattle (Table 48) Only slightly fewer (91 respondents) indicated that industry publications are a source of feed formulation information for beef cattle University extension and government agencies were also listed as important information sources A few respondents listed other sources of information
II
including primarily the results of research performed in their own companies their own personal experience and their own private research (Table 49)
Protein-Related Factors Considered for Balancing Beef Cattle Rations
Nearly 70 of the respondents indicated that rumen degradability is a protein-related factor that they consider when balancing beef cattle rations (Figure 19) Respondents also consider crude protein level (16) and other protein factors (11) Only 4 indicated concern for the amino acid value when balancing beef cattle feed rations The two main other protein-related factors the respondents indicated as having a bearing on balancing beef cattle feed rations were the digestibility of the protein and the protein ingredients (Table 50)
Respondents indicated a wide range of escape values (or by-pass values) that they are using for CSM from less than 20 to over 50 (Table 51) At the same time however they are unsure as to the reliability of the escape values they are using Nearly 70 indicated that the escape values they are using are neither reliable or unreliable or only somewhat reliable (Table 52) The principal single method or source used by respondents for the escape value was the National Research Council (Committee on Animal Nutrition National Academy of Sciences) (Table 53) Universities were the next most frequently mentioned single source of CSM escape values The largest number of respondents (32) simply indicated that several sources were consulted for escape values Finally almost all respondents indicated an interest in obtaining information on escape values for CSM as processed by different methods (Table 54) There appears to be a lack of reliable information on CSM escape values in the perception of beef cattle feed formulators
Suggestions for Improling the Usefulness of Cottonseed Meal
Only 16 of the beef cattle feed formulators that returned surveys provided suggestions that might improve the value or usefulness of CSM in feed rations (Table 55) Some of the more noteworthy suggestions included improving the consistency of cottonseed meal various types of needed research more data on CSM and increased availability of CSM
Dairy Cattle
There are few major differences in the perceptions of dairy cattle feed formulator respondents concerning the use of cottonseed meal from the combined responses over all survey respondents and the beef cattle responses Again this may reflect the larger number of respondents formulating feed for dairy cattle (and for ruminants in general) than for other animal species The salient differences in responses by dairy cattle feed formulators in the 6 general question areas include the following
bull Factors affecting choice of dietary proteins There is virtually no differences in the responses of dairy cattle respondents from the combined responses for any of the listed factors (quality price availability consistency and other) affecting the choice of dietary protein (Table 56) A large majority of dairy cattle feed formulators ranked all factors as either important or extremely important
bull Cottonseed meal as an alternative protein feed The results for dairy cattle are roughly similar to those from the combined responses (Table 57) The two major differences include I) a large majority of respondents feel that CSM is not an alternative to dried skim milk fish
12
meal dried whole milk and blood meal in dairy cattle feeds and 2) an overwhelming majority of respondents consider CSM to be an alternative to nearly all the remaining protein feeds for use in dairy cattle rations
bull The importance of nutritional and non-nutritional factors Again the responses are generally the same As was the case for beef cattle respondents however dairy cattle respondents tended to rank the listed non-nutrition-related factors as relatively more important than the listed nutrition-related factors On average dairy cattle feed formulators ranked amino acid balance fiber level and gossypol level as less important factors in the choice of CSM than was the case for the combined responses (Tables 58 and 59) As in the case of both the combined and beef cattle responses aflatoxin was ranked at a higher level of importance than any other single nutrition-related factor Of the non-nutrition-related factors respondents ranked most factors as all slightly more important in the choice of CSM than was the case for the combined responses (Tables 60 and 61)
bull Seasonality of cottonseed meal allailability The results for the dairy cattle respondents are highly consistent with those for both the combined responses and for the beef cattle responses The months of May through September are the months of least availability of CSM which are also the months indicated when CSM is least needed to be available in the perception of dairy cattle respondents (Tables 62 and 63) Again the suggestion is one of little problem of CSM availability although this is not totally the case as indicated by dairy cattle respondents in later questions
bull Reasons for the selection and non-selection of cottonseed meal While price and availability are also the top two reasons that dairy cattle respondents perceived that CSM is selected as a feed ingredient protein contentquality ranked third on their list followed closely by palatability (Table 64) The top two reasons the CSM is not selected according to the dairy cattle respondents were price and availability as with both the combined responses and the beef cattle responses The third reason given by the dairy cattle respondents however was protein qualitylevel followed in fourth place by gossypol (Table 65) Again price was the key CSM characteristic that dairy cattle respondents indicated that must change in order to be used more frequently in dairy cattle rations (Table 66) Availability and gossypol levels were ranked as the second and third CSM characteristics that must change as was the case for the combined responses
bull Source of chemical analyses for cottonseed meal The results for the chemical analyses performed by dairy cattle respondents are virtually identical to those of both the combined results and those of the beef cattle results The primary analysis routinely performed by the dairy cattle respondents is crude protein (121 of the 143 respondents) followed by fiber (94 respondents) and fat (83 respondents) (Tables 67 and 68) The primary analytical values supplied to the dairy cattle respondents also include crude protein (62 respondents) fiber (50 respondents) and fat (47 respondents) (Tables 69 and 70) It is interesting to note that although aflatoxin was ranked at a higher level of importance than any other nutrition-related factor affecting the choice of CSM as feed component only a third of the dairy cattle respondents routinely perform analyses for aflatoxin and only 11 respondents are provided aflatoxin values by their CSM suppliers The story is about the same for both the combined and the beef cattle responses
Dairy cattle sample members were also asked several questions specifically regarding the use of CSM in dairy cattle feed formulations in 6 general areas I) problems resulting from feeding a
13
ration with CSM to the various dairy cattle types 2) details on dairy cattle feed formulations containing whole cottonseed 3) sources of information utilized on formulating dairy cattle feeds 4) protein-related factors considered when balancing rations for dairy cattle 5) gossypol levels considered to be safe for mature dairy cattle and pre-ruminant calves and 6) an open-ended question soliciting suggestions to improve the usefulness or value of CSM for dairy feed formulations
Problems from Feeding CSM Rations to Dairy Cattle
Again very few respondents indicted knowledge of any problems resulting from feeding a ration containing CSM to dairy cattle (Table 71) Only 24 of the respondents indicated problems with calves and only 18 for lactating cows as the result of feeding rations with CSM Only about 3 of the respondents mentioned problems with either dairy heifers or dry cows The number one problem reported was gossypol toxicity primarily in creep feeds and complete rations (Table 72) Both palatability and poor performance problems for various feed types were also frequently mentioned Again however the low number of respondents indicating problems of any type suggests that the problems reported were likely isolated cases
Details on Dairy Cattle Feed Formulations Containing Whole Cottonseed
Over 75 of dairy cattle respondents formulate feeds using whole fuzzy cottonseed a much higher percentage than was the case for beef cattle Less than half of the dairy cattle respondents however utilize delinted cottonseed in their feeds more in line with the beef cattle results (Table 73) Less than half the respondents formulate rations that include both CSM and whole cottonseed (Table 74) For those who formulate rations that include both the mix of the two in the rations varies widely Respondents reported that the share of such rations accounted for by CSM ranged from 1 to 30 with a mean of 85 (Table 75) The share of those rations accounted for by whole cottonseed ranged from 3 to 100 with a mean of 16 (Table 76) It appears therefore that on average dairy feeds formulated with both CSM and whole cottonseed contain a higher percentage of whole cottonseed than of CSM This is just the opposite of the situation for beef cattle
Sources of Information Utilized on Formulating Dairy Cattle Feeds
Over 80 of the dairy cattle respondents indicated that they were familiar with research on feeding CSM to mature dairy cattle (Table 71) Only half however indicated familiarity with such research for pre-ruminant calves Less than 10 of the respondents listed any other research on feeding CSM to other types of dairy cattle (Table 78) The largest number of respondents (137 of 143 respondents) indicated that they utilize university research to obtain information on formulating feeds for dairy cattle followed by industry publications of some type (121 respondents) and university extension service (83 respondents) (Table 79) Only 36 respondents listed other sources of information including primarily personal experience and research (Table 80)
Protein-Related Factors Considered for Balancing Dairy Cattle Rations
Nearly 100 of the dairy cattle respondents indicated that both crude protein level and rumen degradability are factors they consider when balancing rations for dairy cattle a much higher level than is the case for beef cattle (Table 81) Less than half consider amino acid values (61 of 143 respondents) Only 19 respondents indicated that they consider other factors like protein solubility (Table 82)
Dairy cattle respondents indicated a even wider range of escape values (or by-pass values) that they are using for CSM than did beef cattle respondents from 0 to over 80 (Table 83) The mean escape value calculated from the responses is 40 Dairy cattle respondents indicated slightly more
14
confidence in the escape values they are using than was the case for beef (Table 84) Only 22 respondents however considered those escape values to be reliable or extremely reliable The principal single method or source used by respondents for the escape value they use was again the National Research Council (Committee on Animal Nutrition National Academy of Sciences) (Table 85) Book values was the next most frequently mentioned single source of CSM escape values (23) Finally nearly 100 of the respondents indicated an interest in obtaining information on escape values for CSM as processed by different methods (Table 86) The conclusion from the dairy cattle responses is the same as for beef cattle That is there appears to be a lack of reliable information on CSM escape values in the perception of dairy cattle feed formulators and that they are highly interested in obtaining more information in this regard
Gossypol Level Considered Safe for Mature Dairy Cattle and Pre-Ruminant Calves
Dairy cattle respondents appear to have little idea of what the safe levels are for gossypol in mature dairy cattle and pre-ruminant calf feeds First of all only one-third of those who returned surveys even attempted to provide numbers for safe gossypol levels (Tables 87 and 88) Many respondents simply wrote comments such as dont know or not aware of research on safe gossypol level in the margin of the survey beside the question Second those who attempted to answer the questions provided an amazingly wide range of safe gossypol levels from 0 parts per million (ppm) to 7500 ppm for mature dairy cattle and from 0 ppm to 1000 ppm for pre-ruminant calves The mean safe gossypol levels were 609 ppm for mature dairy cattle and 121 ppm for pre-ruminant calves The responses were spread quite evenly between the extremes around the means It should be noted that the research team checked and rechecked the data set for this question to insure there were no errors in data entry
Suggestions for Improving the Usefulness of Cottonseed Meal
Only about 22 of the dairy cattle feed formulators that returned surveys provided suggestions that might improve the value or usefulness of CSM in dairy cattle feed rations (Table 89) Some of the more frequent suggestions dealt with improving the consistency and availability of CSM Several respondents suggested the need for more information on gossypol a worthy suggestion given the results of the previous question
Poultry
The perceptions of poultry feed formulator respondents concerning the use of cottonseed meal differ importantly in many respects from the combined responses over all survey respondents and from those of beef and dairy cattle Many of the differences are likely the result of the distinct dietary needs of ruminant as opposed to non-ruminant animals The salient differences in responses by poultry feed formulators in the 6 general question areas include the following
bull Factors affecting choice of dietary proteins Surprisingly there was little difference in the responses of those indicating that they formulate feed for poultry than for the combined results (or for beef and dairy cattle) regarding the importance of the listed factors (quality price availability consistency and other) affecting the choice of dietary protein (Table 90) A large majority of poultry feed formulators ranked all factors as either important or extremely important The only exception is that consistency was ranked slightly less important by poultry respondents than by respondents in general
bull Cottonseed meal as an alternative protein feed Poultry respondents ranked more protein feeds as higher on the superior-to-CSM scale than was the case for the combined responses
15
(Table 91) In fact the mean rank of all but three of the protein feeds were all at least somewhat higher than was the case for the combined responses The mean rank of several of the other protein feeds as determined by the poultry respondents was much higher than for the combined responses including fish meal poultry by-product meal and soybean meal Poultry by-product meal changed from an inferior to a superior protein feed compared to CSM The protein feed judged by poultry respondents to be most superior to CSM for poultry rations was soybean meal while urea was ranked as most inferior Poultry respondents also appeared to have stronger opinions about whether or not CSM is an alternative to the other listed protein feeds than was the case for the combined responses They overwhelmingly perceived that CSM is not an alternative to many of the other protein feeds including fish meal dried skim milk dried whole milk poultry by-product meal blood meal tankage and urea A larger percentage of poultry respondents than was the case for dairy and beef cattle perceived however that CSM is a definite alternative to many other protein feeds including safflower meal sunflower meal linseed meal peanut meal canola meal feather meal distillers dried grains brewers dried grains and even soybean meal
bull The importance of nutritional and non-nutritional factors Poultry respondents ranked all but two of the listed nutrition-related factors as more important in the choice of CSM over alternative protein feeds for poultry rations than was the case for the combined responses on average (Le comparing mean responses) (Table 92) The highest percentage of poultry respondents ranked gossypol level (62 of the respondents) amino acid balance (59) aflatoxin (58) protein quality (57) and amino acid availability (57) as extremely important in the choice of CSM over alternative protein feeds Only about 5 of the respondents listed other important nutrition-related factors (Table 93) There are few differences however in the poultry responses as compared to the combined responses regarding the importance of non-nutrition-related factors (Table 94) The major difference is a much lower ranking of the importance of palatability in choosing CSM over alternative protein feeds Also a somewhat higher percentage of poultry respondents ranked price as an extremely important non-nutrition-related factor Few other non-nutrition-related factors were listed by the respondents (Table 95)
bull Seasonality of cottonseed meal availability The results for the poultry respondents regarding the months of the year when CSM is not available are highly consistent with those for the combined responses and those for the beef and dairy cattle responses Poultry respondents indicated that May through September are the months of least availability of CSM (Table 96) But likely because of the shorter production cycle for poultry than for cattle poultry respondents indicated that CSM needs to be available in almost every month (but slightly less so in August and September) for CSM to compete effectively with alternative protein feeds (Table 97) For poultry therefore the indication is that poultry feed formulators may perceive an availability problem which inhibits greater use of CSM in poultry rations to some extent
bull Reasons for the selection and non-selection of cottonseed meal Again price and availability are the number one and number two reasons respectively cited by poultry respondents for which CSM is selected as a feed ingredient (Table 98) Protein quality ranked third on their list followed closely by phosphorous content The top reason that CSM is not selected according to the poultry respondents was pricevalue (Table 99) About tied for second place were gossypol content and availability More respondents ranked availability as the second reason than for gossypol content but more respondents listed gossypol first The amino acid level was listed as a distant fourth reason for which CSM is not selected as a feed ingredient Price is again the key CSM characteristic that poultry respondents indicated must change in
16
order for CSM to be used more frequently in poultry rations (Table 100) Gossypol was clearly considered to be the second most important characteristic that must change Availability was ranked as either first or second by all respondents who listed it as a characteristic that must change
bull Source of chemical analyses for cottonseed meal The results for the chemical analyses performed by poultry respondents are similar to those of both the combined results and those of the beef and dairy cattle results The primary analysis routinely performed by the poultry respondents is crude protein (51 of 55 respondents) followed by fat (40 respondents) fiber (37 respondents) and aflatoxin (31 respondents) (Tables 101 and 102) The primary analytical values supplied to the poultry respondents also included crude protein fiber and fat (Table 103) A third of the poultry respondents indicated that their CSM supplier does not provide them with any analytical values Once again even though aflatoxin was ranked as an extremely important nutrition-related factor in the choice of CSM as a feed component only I respondent obtains an analytical value for aflatoxin from his CSM supplier and only a little over half routinely perform their own aflatoxin analyses
Poultry sample members were asked some specific questions regarding the use of CSM in poultry feed formulations in 5 general areas I) problems resulting from feeding a ration with CSM to the various poultry types 2) specific information on several key nutrition-related factors affecting the use of CSM in poultry rations 3) sources of information utilized on formulating poultry feeds 4) CSM price and value and 5) an open-ended question soliciting suggestions to improve the usefulness or value of CSM for poultry feed formulations
Problems from Feeding CSM Rations to Poultry
The majority of poultry respondents indicated no knowledge of any problems associated with feeding a ration containing CSM to poultry (Table 104) Only 14 of the respondents indicated problems with broilers less than 7 for breeding flocks and about 3 for turkeys Over a third however indicated that they had knowledge of such problems with layers The number one problem reported was yolk molting and discoloration primarily in layer rations (Table 105) A few respondents indicated problems with depressed growth associated with broiler feeds containing CSM
Information on Key Nutrition-Related Factors for Poultry Rations
The survey sample members were asked to respond to a number of specific questions related to nutritional factors that affect the use of CSM in poultry rations including protein energy fat gossypol and synthetic amino acids They were then asked to indicate their perception of the overall feeding value of a standard 41 protein CSM compared to that of a standard 44 protein soybean meal The questions were designed primarily to determine the extent of knowledge among feed formulators concerning these factors as they relate to the use of CSM and the relative feeding value of CSM
Sample members were asked to respond to two questions regarding protein in poultry feed rations They were first asked to indicate the specific protein-related factors that they consider when balancing rations for poultry They were given a list of three factors (crude protein level amino acid content and amino acid availability) They were also allowed to specify any other protein-related factors they consider when balancing poultry rations They were then asked to indicate the crude protein levels they would prefer for cottonseed meal and were given a choice of four levels (3641 (standard) 44 and 48) and allowed to suggest any other preference for crude protein level
17
Almost all poultry respondents indicated that they consider amino acid content and availability when balancing feed rations with fewer responding that they consider the crude protein level (Table 106) Other protein-related factors listed by the respondents included amino acid balance protein digestibility and energy levels (Table 107) With regard to preferred crude protein level for CSM over half of the poultry respondents indicated a preference for 48 crude protein (Table 108) About 27 of the respondents were satisfied with the standard 41 level and 20 indicated a preference for a 44 protein CSM No respondents preferred anything less than the standard 41
With respect to energy levels the sample members were asked to indicate what they considered to be the normal maximum and minimum energy levels for protein feeds for broilers layers turkeys and breeding flock As Table 109 indicates the responses varied widely with little or no indication of a mode (most frequent response) in most cases For broilers the maximum (in K Cals DE per pound) ranged from 0 to 1800 and the minimum from 850 to 1700 with a mean maximum of 1436 and a mean minimum of 1276 For layers the maximum (in K Cals DE per pound) ranged from 1000 to 1800 and the minimum from 800 to 1500 with a mean maximum of 1347 and a mean minimum of 1187 For turkeys the maximum (in K Cals DE per pound) ranged from 1100 to 1725 and the minimum from 850 to 1700 with a mean maximum of 1334 and a mean minimum of 1261 For breeding flocks the maximum (in K Cals DE per pound) ranged from 1000 to 1600 and the minimum from 750 to 1600 with a mean maximum of 1328 and a mean minimum of 1159 Given the disparity in the responses it seems clear that there is little common concept of the normal maximum and minimum energy levels for protein feeds
Sample members similarly were asked to indicate the minimum and maximum fat levels they considered critical for protein feeds Although the range of responses was still quite wide there appeared to be more uniformity in responses to this question than the one for energy (Table 110) The maximum fat levels (ether extract as fed basis) indicated by the respondents ranged from 1 to 15 or 20 for most poultry types The minimums ranged from 0 to 15 The mean minimum levels of fat for all poultry types was about 3 The mean maximum ranged from 6 to 82 depending on the poultry type
Sample members were asked to indicate the level of gossypol they considered safe for poultry rations The responses again varied widely from a low of 0 ppm up to a high of 300 ppm for all poultry types (Table III) The highest mean level of gossypol as calculated from the responses to the question were 104 ppm for broilers and 91 ppm for turkeys For layers and breeding flocks the mean levels were much lower at 57 ppm and 54 ppm respectively
The questionnaire also asked the sample members to indicate if they use or would use synthetic amino acids where economical The response was that nearly 100 of all poultry respondents indicated that they have or would use synthetic amino acids in this situation (Table 112) This suggests little real aversion on the part of feed formulators to utilize synthetic amino acids in least cost poultry formulations
To obtain some insight on the general perception of poultry formulators regarding CSM the sample members were asked to indicate the overall feeding value of a standard 41 protein CSM compared to that of a standard 44 protein soybean meal in their opinion on percentage basis They were given the choice of 5 ranges from under 70 to over 100 in 10 increments (see Table 113 for the actual ranges used) Nearly 80 of the respondents indicated that CSM has an overall feeding value of under 90 of that of soybean meal Given the five choices offered to respondents the mean feeding value was around 80
18
Sources of Information Utilized on Formulating Poultry Feeds
About two-thirds of the poultry respondents indicated that they were familiar with research on feeding CSM to broilers and layers (Table 114) Only half however indicated familiarity with such research for turkeys and only a little over a third for breeding flocks Less than 10 of the respondents listed any other research on feeding CSM to other types of poultry (Table 115) To obtain information on formulating feeds for poultry the largest number of respondents (52 of the 55 respondents) indicated that they utilize university research followed by industry publications of some type (45 respondents) university extension services (26 respondents) and government agencies (20 respondents) (Table 116) Only 17 respondents listed other sources of information including primarily personal experience and research (Table 117)
Cottonseed Meal Price and Value
To get some idea concerning the poultry respondents perceptions of the value of CSM particularly with respect to soybean meal sample members were asked 1) if they would be willing to pay a premium per unit of protein for CSM with more than a standard 41 protein and 2) if gossypol and fiber were sufficiently low on average what percent of the cost of soybean meal they would be willing to pay for CSM
With respect to the first question only about half the respondents indicated a willingness to pay a premium for a CSM with more than 41 protein despite the fact that 75 of them indicated earlier that they would prefer a CSM with a higher crude protein level (Table 118) Thus at least 25 of the respondents prefer a higher protein level CSM but would not be willing to pay a premium to get it
In response to the second question poultry respondents indicated that they would only be willing to pay an average of about 76 of the cost of soybean meal for a CSM with a sufficiently low level of gossypol and fiber (Table 119) The range around that average however was fairly large from 50 to 95 Because CSM has traded at about 91 of the value of soybean meal on the market on a protein equivalent basis and about 85 on an unadjusted basis on average in each year since 1984 either poultry respondents are currently unaware of the historical CSM to soybean meal price relationship or they are indicating that the current CSM market price relative to that of soybean meal is substantially above the levels that most find acceptable
Suggestions for Improving the Usefulness of Cottonseed Meal
Only about 27 of the poultry feed formulators that returned surveys provided suggestions that might improve the value or usefulness of CSM in poultry feed rations (Table 120) Some of the more frequent suggestions included the need for more information on the use of CSM in poultry rations increased availability of CSM and nutrient guarantees
Catfish
The perceptions of catfish feed formulator respondents concerning the use of cottonseed meal correspond closely to those of the poultry respondents likely because of the similar dietary needs of non-ruminant animals The salient differences in responses by catfish feed formulators in the 6 general question areas included on this section of the surveys include the following
bull Factors affecting choice of dietary proteins There were no differences in the responses of those indicating that they formulate feed for catfish than for poultry regarding the importance
19
of the listed factors (quality price availability consistency and other) affecting the choice of dietary protein (Table 121) A large majority of catfish respondents ranked all factors as either important or extremely important as did poultry respondents
bull Cottonseed meal as an alternative protein feed As was the case for poultry catfish respondents ranked more protein feeds as higher on the superior-to-CSM scale than was the case for the combined responses (Table 122) Catfish feeders however ranked meat and bone meal and blood meal as even more superior to CSM than did poultry respondents The protein feeds that catfish respondents ranked as roughly similar to CSM included tankage feather meal peanut meal linseed meal corn gluten meal brewers dried grains distillers dried grains sunflower meal safflower meal and canola meal Catfish respondents also appeared to have nearly as strong views about whether or not CSM is an alternative to the other listed protein feeds as did poultry respondents They perceived that CSM is not an alternative to many of the other protein feeds including blood meal dried whole milk meat and bone meal and dried skim milk Catfish respondents also perceived however that CSM is a definite alternative to many other protein feeds including safflower meal canola meal peanut meal sunflower meal linseed meal distillers dried grains brewers dried grains tankage soybean meal wheat middlings corn gluten meal urea and feather meal
bull The importance of nutritional and non-nutritional factors The responses for catfish with regard to the importance of nutrition-related and non-nutrition-related factors in choosing CSM as a component of catfish feeds were roughly similar to those for poultry (Table 123) The salient differences were that a larger percentage of catfish respondents ranked energy level fat level and fiber level as important or extremely important and a much larger percentage ranked aflatoxin as extremely important One major difference of the catfish responses regarding the importance of non-nutrition-related factors from those of poultry is that palatability is much mOre of a concern to catfish feeders (Table 124) Bin space is less important to catfish respondents and service from the CSM industry is more important to them
bull Seasonality of cottonseed meal availability The results for the catfish respondents regarding the months of the year when CSM is not available were generally consistent with those for poultry except that May and June were perceived as less problematic for obtaining CSM supplies by the catfish respondents (Table 125) Catfish formulators perceive that CSM needs to be more available in April through October than during the rest of the year to be competitive with other protein feeds (Table 126) This suggests the perception on the part of catfish feed formulators of a CSM availability problem during about the first half of any given year
bull Reasons for the selection and non-selection of cottonseed meal Pricevalue is the number one reason cited by catfish respondents for which CSM is selected as a feed ingredient followed by protein quality and palatability (Table 127) The top reason that CSM is not selected according to the catfish respondents is pricevalue followed by quality and gossypol level (Table 128) Gossypol level is the key CSM characteristic that catfish respondents indicated must change in order for CSM to be used more frequently in catfish rations (Table 129) Quality was clearly considered to be the second most important characteristic that must change followed by aflatoxin level This is the only animal species for which price was not the number one characteristic cited that would have to change and was not even listed among the top three responses The implication is that catfish feed formulators may not consider the price of cottonseed meal to be out of line with their needs and thus do not consider price to be a particular problem for the use of CSM in catfish rations A word of caution is in order
20
to avoid taking this conclusion too far because of the relatively few number of catfish feed formulators in the sample
bull Source of chemical analyses for cottonseed meal The results for the chemical analyses performed by poultry respondents are similar to those of poultry as well as those of both the combined results and the beef and dairy cattle results The primary analysis routinely performed by the catfish respondents is crude protein followed by fat fiber aflatoxin and gossypol (Tables 130 and 131) The primary analytical values supplied to the catfish respondents also included crude protein fiber and fat (Table 132) Only 2 of the II catfish respondents indicated that their CSM supplier does not provide them with any analytical values Even though gossypol was ranked as an extremely important nutrition-related factor in the choice of CSM as a feed component and the number one CSM characteristic that needs to change only 5 of the II respondents routinely perform gossypol analyses None of catfish respondents obtain analytical values for aflatoxin from their CSM supplier
As for poultry catfish sample members were asked some specific Questions regarding the use of CSM in catfish feed formulations in 5 general areas 1) problems resulting from feeding a ration with CSM to the various catfish types 2) specific information on several key nutrition-related factors affecting the use of CSM in catfish rations 3) sources of information utilized on formulating catfish feeds 4) CSM price and value and 5) an open-ended Question soliciting suggestions to improve the usefulness or value of CSM for catfish feed formulations
Problems from Feeding CSM Rations to Catfish
Absolutely no catfish respondents indicated any knowledge of any problems associated with feeding a ration containing CSM to catfish (Table 133)
Information on Key Nutrition-Related Factors for Catfish Rations
As for poultry the survey sample members were asked to respond to a number of specific Questions related to nutritional factors that affect the use of CSM in catfish rations including protein energy fat gossypol and synthetic amino acids They were then asked to indicate their perception of the overall feeding value of a standard 41 protein CSM compared to that of a standard 44 protein soybean meal Just as for poultry these Questions were designed primarily to determine the extent of knowledge among catfish feed formulators concerning these factors as they relate to the use of CSM and the relative feeding value of CSM
Sample members were asked to respond to two Questions regarding protein in catfish feed rations They were first asked to indicate the specific protein-related factors that they consider when balancing rations for catfish They were given the same list of three factors (crude protein level amino acid content and amino acid availability) to choose from that the poultry sample members were given Again they were also allowed to specify any other protein-related factors they consider when balancing catfish rations They were then asked to indicate the crude protein levels they would prefer for CSM and were given the same choice of four levels as the poultry sample members (36 41 (standard) 44 and 48) and allowed to suggest any other preference for crude protein level In contrast to poultry the largest percentage of catfish respondents indicated that they consider amino acid availability (10 of the 11 catfish respondents) rather than the content when balancing catfish rations (Table 134) The second largest percentage consider crude protein level (9 respondents) also a different result from poultry
21
With regard to the crude protein level for CSM preferred by catfish respondents about 43 indicated a preference for 48 crude protein (Table 135) About 20 of the respondents were satisfied with the standard 41 level and nearly 30 indicated a preference for a 44 protein CSM No respondents preferred anything less than the standard 41 The mean preferred crude protein level was about 42
With respect to energy levels the catfish sample members were asked to indicate what they considered to be the normal maximum and minimum energy levels for protein feeds for fingerlings grow out stock brood stock and fries Despite the low number of catfish respondents the answers to this question were widely divergent (Table 136) For fingerlings the maximum (in K Cals DE per pound) ranged from 1250 to 1800 and the minimum from 2 to 1500 with a mean maximum of 1525 and a mean minimum of 834 For grow out stock the maximum (in K Cals DE per pound) ranged from only 1500 to 1600 and the minimum from 1 to 1300 with a mean maximum of 1550 and a mean minimum of 750 For catfish brood stock the maximum (in K Cals DE per pound) ranged from 1300 to 1700 and the minimum from 1200 to 1400 with a mean maximum of 1500 and a mean minimum of 1300 For fries the maximum (in K Cals DE per pound) ranged from 1250 to 1800 and the minimum from 900 to 1500 with a mean maximum of 1525 and a mean minimum of 1200 Given the disparity in these responses it seems clear again for catfish feed formulators that there is little common concept of the normal maximum and minimum energy levels for protein feeds
Catfish sample members similarly were asked to indicate the minimum and maximum fat levels they considered critical for protein feeds As with poultry the range of responses was still quite wide but there also appeared to be more uniformity in responses to this question than the one for energy level (Table 137) The maximum fat levels (ether extract as fed basis) indicated by the respondents again ranged from 1 to 15 for most catfish types as was the case for poultry The mean minimum levels of fat for all catfish types ranged from about 3 to 5 The mean maximum ranged from 6 to 10 aCrOSS the different catfish types
Catfish sample members were also asked to indicate the level of gossypol they considered safe for catfish rations The responses again varied widely from a low of 0 ppm up to a high of 300 ppm for some catfish types (Table 138) The two highest mean safe levels of gossypol were 97 ppm for grow out stock and 83 ppm for brood stock For fingerlings and fries the safe maximum mean levels were much lower at 44 ppm and 23 ppm respectively
The questionnaire also asked the sample members to indicate if they use or would use synthetic amino acids where economical The response was that 83 (all but 2) of the catfish respondents indicated that they have or would use synthetic amino acids in this situation (Table 139) This suggests little real aversion on the part of feed formulators to utilize synthetic amino acids in least cost catfish formulations
To obtain some insight on the general perception of catfish formulators regarding CSM the sample members were asked to indicate their opinion of the overall feeding value of a standard 41 protein CSM compared to that of a standard 44 protein soybean meal expressed on a percentage basis They were given a choice of 5 ranges from under 70 of the feeding value of soybean meal to over 100 in 10 increments (see Table 140 for the actual ranges used) All but one of the catfish respondents indicated that CSM has an overall feeding value of under 90 of that of soybean meal Given the five choices offered to respondents the mean feeding value of CSM relative to that of soybean meal was around 80
22
Sources of Information UtiJized on Formulating Catfish Feeds
Only about half of the catfish respondents indicated that they were familiar with research on feeding CSM to grow out stock and only a third were familiar with research on fingerlings (Table 141) Only 2 respondents were familiar with any research on feeding CSM to brood stock and fries To obtain information on formulating feeds for catfish the largest number of respondents indicated that they utilize university research and industry publications of some type (Table 142)
Cottonseed Meal Price and Value
Catfish sample members were also asked two Questions to get some idea concerning their perception of the value of CSM particularly with respect to soybean meal 1) if they would be willing to pay a premium per unit of protein for CSM with more than a standard 41 protein and 2) if gossypol and fiber were sufficiently low on average what percent of the cost of soybean meal would they be willing to pay for CSM
With respect to the first Question 75 of the catfish respondents indicated a willingness to pay a premium for a CSM with more than 41 protein which is consistent with their earlier responses that they would prefer a CSM with a higher crude protein level (Table 143)
In response to the second Question catfish respondents indicated that they would only be willing to pay an average of about 82 of the cost of soybean meal for a CSM with a sufficiently low level of gossypol and fiber (Table 144) The range around that average was more narrow than for poultry from 70 to 100 This is more consistent with the ratio of CSM price to soybean meal price that has existed over the last 7 or 8 years on average
Suggestions for Improving the Usefulness of Cottonseed Meal
Only three catfish respondents offered suggestions for improving the usefulness or value of CSM for catfish rations The three suggestions included I) providing a more consistent product in price and Quality 2) providing a premium Quality toxin-free high protein low-fat product superior to soybean meal and 3) eliminating the CHO fraction (Table 145)
Comparisons Among Animal Species
In order to highlight the salient differences in responses with respect to the various animal species the mean responses to Questions that are common among all surveys regarding CSM use as a feed ingredient were compared and analyzed An analysis of variance (ANOY A) was also done to detect statistically significant differences in the mean responses to each Question by animal specie Comparisons are made among the mean responses to all Questions in the 6 general areas to which all sample members were asked to respond regardless of the animal specie(s) for which they formulate feeds 1) the particular factors affecting their choice of dietary proteins for formulated feeds 2) the extent to which CSM is considered to be an alternative to selected protein feeds 3) the importance of nutritional and non-nutritional factors in their decisions to use CSM rather than alternative dietary proteins in their feed formulations 4) the seasonality of CSM availability 5) the specific reasons for the selection and non-selection of CSM for use in the feeds they formulate and 6) the source of CSM chemical analyses used by the respondents Where appropriate ANOY A results are also indicated
23
Factors Affecting Choice of Dietary Proteins
As discussed earlier all members of the final sample regardless of the animal species for which they formulate feeds were asked to rank the importance of four general factors in their choice of a dietary protein for their feed formulations on a scale of I to 7 (from extremely unimportant to extremely important respectively) 1) quality 2) price 3) availability and 4) consistency Comparing the results across animal types reveals few significant differences in the importance attached to any of the four factors by the responding formulators of the various animal specie feeds (ie comparing results horizontally in Table 146) But as pointed out in an earlier section the mean rankings for quality are all higher than those for the other factors while the mean rankings of price are all lower than those for most other factors across all animal types In other words the respondents consistently ranked quality highest on the scale of importance followed in order by consistency availability and price
Cottonseed Meal As An Alternative Protein Feed
Recall that the sample members were asked to rank various selected protein feeds on a scale of 1 to 7 as inferior or superior to CSM in an overall sense for use in feed formulations A second question required respondents to indicate whether or not they considered CSM to be an alternative to each of the 20 listed protein feeds A comparison of the mean ran kings and ANOV A results across animal types indicates substantial agreement among the respondents regarding the ranking of CSM as an alternative to some animal feeds and substantial disagreement with respect to CSM as an alternative to many others (Table 147) Respondents over all animal types tended to agree that certain feeds and in particular the higher crude-protein-content feeds are clearly superior to CSM including dried skim milk meat and bone meal fish meal blood meal soybean meal dried whole milk and corn gluten feed There was a statistically different deviation in the extent to which respondents for some animal species regarded those meals as superior however For example catfish respondents ranked meat and bone meal fish meal poultry by-products blood meal soybean meal and corn gluten meal higher than did respondents for the ruminant animals The same was roughly the case for poultry Beef and dairy cattle respondents tended to rank all other protein feeds as less superior (ie more inferior) to CSM There was also substantial agreement that CSM was about the same as tankage peanut meal linseed meal and brewers and distillers dried grains but superior to some extent over the other feeds particularly those lower in crude protein including dehydrated alfalfa sunflower meal wheat middlings safflower meal canola meal feather meal and urea Beef and dairy cattle respondents agreed that CSM can be considered an alternative to nearly all the protein feeds except perhaps skim and whole dried milk Poultry and catfish respondents indicated CSM is an alternative to fewer of the other protein feeds
The Importance of Nutritional and Non-Nutritional Factors
Respondents also ranked the importance of specific nutrition-related and non-nutritionshyrelated factors in choosing cottonseed meal as a component of the feeds they formulate on a scale of extremely unimportant to extremely important (a scale of I to 7 respectively) Comparing the mean rankings by the respondents reveals that poultry and catfish feed formulators clearly consider proteinshyrelated factors and gossypol level to be more important than do beef and dairy feed formulators (Table 148) Fiber level is also of more importance to formulators of catfish feed Interestingly the importance of fiber was not ranked significantly higher by poultry feed formulators than by beef and dairy cattle feed formulators At the same time aflatoxin was clearly ranked by all respondents as the most important factor affecting the choice of CSM as a feed ingredient irrespective of the animal specie for which the ration is intended
24
For the non-nutritional factors an analysis of the mean rankings indicates few significant differences in the responses across animal species with respect to each individual factor listed (Table 149) The most notable exception is that poultry respondents ranked palatability significantly less important than did any of the other respondents for the other animal species Finally catfish respondents perceived that service by the CSM industry was more important for them than did the respondents for the other animal species
Seasonality of Cottonseed Meal Availability
The respondents across all animal species indicated that CSM is least available between about May and October likely reflecting the increasing shortages of cottonseed meal supply just prior to the cotton harvest in the fall (Figure 20) At the same time however the beef cattle dairy cattle and poultry respondents all indicated that there is less need for CSM to be available during approximately those same months in order to compete effectively with other protein feeds (Figure 21) This suggest that the seasonality of supply may not represent an important constraint to competitiveness and growth possibilities of CSM as a feed ingredient Interestingly catfish respondents suggested a largely inverse pattern of the times of the year when CSM needs to be available to compete effectively with other protein feeds as a catfish feed ingredient Possible explanations of this phenomenon include I) the protein feed needs of catfish feed formulators peak in the late spring and summer months when supply is less available 2) catfish feed formulators are located such that CSM is not easily obtainable particularly during short supply years or 3) formulators of feed for other animal species have longer experience in using CSM and have adjusted their formulation to the pattern of CSM supply availability In any case it should be remembered that there are relatively few catfish feed formulators in the sample so that their joint responses may not be truly representative of all catfish feed formulators In this case this difference in their responses may mean little
Reasons for the Selection and Non-Selection of Cottonseed Meal
Respondents across animal species were quite consistent in their ranking of the top reasons that CSM is included in feed formulations (Table 150) They overwhelmingly ranked price as the top reason followed generally by availability and protein quality Catfish respondents differed somewhat from that order ranking protein quality second and palatability as third Availability was ranked fourth by catfish respondents The top reason all respondents listed for which CSM is not included in feed formulations was also price (Table lSI) Beef and cattle respondents ranked availability as second but poultry respondents ranked gossypol second while catfish respondents ranked protein quality second A vailability ranked only as the third reason that CSM is not selected by poultry respondents and fourth by catfish respondents Gossypol ranked either third or fourth for all animal species except poultry for which gossypol appears to be a more important reason for not including CSM in poultry feed formulations The question regarding the characteristics of CSM that would have to change in order for it to be selected more frequently as a feed ingredient elicited about the same responses as those for the previous question concerning why CSM is not included in feed formulations (Table 152) The top characteristic that would have to change in the opinion of most respondents is price Catfish respondents however listed price extremely low on their list suggesting that other factors are more of a constraint to CSM use in their opinion They ranked gossypol as the number one characteristic that would have to change Availability appeared to be more of a concern to beef and dairy feed formulators than for poultry and catfish formulators
25
Source of Chemical Analyses for Cottonseed Meal
About the same percentage of respondents across animal species perform analytical tests for aflatoxin crude protein fat fiber and gossypol (Figure 22) The only noticeable differences were for aflatoxin and gossypol for which about half the percentage of dairy and beef respondents compared to catfish respondents reported that they routinely perform tests A higher percentage of poultry respondents also appear to perform tests for aflatoxin and gossypol than is the case for beef or cattle respondents Crude protein is tested for by the highest percentage of respondents for all animal species while gossypol is tested for by the smallest percentage of all respondent groups except catfish CSM suppliers are more likely to provide feed formulators with analytical values for crude protein fat and fiber than for aflatoxin or gossypol (Figure 23) A sizeable percentage of the respondents across all animal types reported that their CSM supplier provides no analytical values whatsoever
Summary ofMajor Findings
Of the reams of information normally provided by a study like this relatively little is usually new or profound And of what can be found that appears important only some is little more than interesting or particularly useful Before turning to a discussion of the implications of the study results the major findings across animal groups are briefly summarized first Sifting through the many tables figures and data sets the main findings of the study appear to be the following
bull Quality is the most important factor affecting the choice of dietary proteins by feed formulators followed by consistency and availability Price is the least important of the four factors in making general decisions regarding dietary proteins for animal diets
bull Once feed formulators have set the general parameters for use of dietary proteins in their formulations however price is the most important factor determining the choice among alternative dietary proteins to satisfy the general parameters for dietary protein use in feed formulations
bull When considering whether or not to use CSM as the dietary protein in feeds the nutritional factors of most concern to formulators of feed for non-ruminant animals (poultry and catfish) appear to be protein-related For formulators of ruminant (beef and dairy cattle) feeds aflatoxin level and rumen degradability are the most important nutritional factors
bull The most important non-nutritional factors affecting feed formulators decisions regarding whether or not to use CSM are I) price 2) availability 3) consistent quality and 4) palatability in that order
bull Non-nutritional factors are more important than nutritional factors in the choice of CSM over alternative feeds to fill the dietary protein requirements of feed formulations In general price and availability were ranked above protein quality and other nutrition-related factors as reasons why CSM is and is not chosen as a feed ingredient over alternatives Price and availability were also cited as the characteristics that most need to change in order for CSM to be selected as a feed ingredient more frequently
bull CSM is generally considered to be inferior to higher protein feedstuffs and superior to lower protein feedstuffs This generalization however does not hold for all feeds and all animal types Formulators of ruminant animal feeds ranked many of the higher protein feeds more on a par with CSM than did formulators of non-ruminant animal feeds
26
bull The seasonality of CSM availability is both a positive and a negative factor affecting the use of CSM rather than alternative protein feeds in animal feed rations That is CSM is obviously more likely to be selected as a feed ingredient during months of greater availability than during the months of lower availability In general however the survey responses indicate that CSM is normally available when feed formulators perceive that it needs to be available One word of caution It may be that a higher percentage of CSM users agreed to participate in this survey than those who are currently not using CSM Those who are current CSM users may well have already adjusted their feed purchasing patterns and operations to reflect the seasonal changes in the availability of CSM Consequently current CSM users may perceive less of an availability problem than those who are not currently using CSM In this case the responses to these questions may not be truly representative of the perception of the availability of CSM by feed formulators in general
bull There is a tremendous disparity in the perception of respondents as to the appropriate levels of several key nutrition-related factors for specific livestock rations including energy levels fat levels gossypol levels and escape values (ruminants only) for cottonseed meal For each animal specie the range of variation in the perceived acceptable levels of each of these factors was extremely wide The obvious conclusion is that feed formulators generally lack adequate and reliable information on many factors which are crucial in efficient feed formulation and which have a significant impact on the choice of CSM as a feed ingredient
PROBLEMS AND OPPORTUNITIES FOR EXPANDING COTTONSEED MEAL USE
CSM is somewhat unique among vegetable protein meals in that it is the product of a byshyproduct The volume of the by-product cottonseed available for crushing and the potential supply of CSM depend more on the dynamics of cotton supply and demand than on forces specific to CSM markets This mean that market signals from feed formulators and livestock feeders regarding desired values and characteristics of protein meals likely have little impact on the potential CSM market supply
Since the mid-1970s the share of the annual production of cottonseed fed directly to ruminant livestock has increased steadily from about 5 in 1974 to nearly 40 in 1990 (Figure 24) The consequence has been a marked decline both in the share of the available supply of cottonseed that is crushed and in the ratio of actual to potential cottonseed meal output An increase in the demand for CSM therefore will either bid up the market price of CSM with no additional volume actually used or increase the cottonseed crush to feed use ratio (or some combination thereof) There will be little or no effect on the total amount of cottonseed available
The intent of efforts to expand the market for any commodity is to effect an increase in sales at a higher price For a commodity with a relatively fixed supply the major result of an expansion in demand is solely an increase in price because supply cannot increase to allow an increase in use For a commodity with an unlimited supply successful market expansion efforts simply increase use to the extent of the promotion with no increase in price For a commodity with a supply somewhere in between those two extremes successful market expansion will increase both the price and quantity used Although the situation for cottonseed meal is closer to the fixed supply end of the spectrum market expansion efforts can increase the use of cottonseed meal through an increase in the crush-toshy
27
feed cottonseed use ratio This ratio will increase as the profitability of crushing vs alternative uses of the seed increase
The results of this survey however indicate both some problems and possible opportunities for expanding cottonseed meal use After briefly summarizing the major obstacles as identified in the study the major opportunities for expanding use of cottonseed meal will be discussed
Problems for Expanding Cottonseed Meal Use
The major problems for expanding CSM use are generally well known and verified by the survey results The major problems that would hinder efforts to expand cottonseed meal use identified in the study included primarily the following
bull Price and availability of CSM are the major factors affecting the selection or non-selection of CSM as an ingredient of feed formulations regardless of animal specie These nonshynutritional factors were judged to be more important than nutritional factors in selecting CSM as a feed ingredient Unfortunately neither the price nor the availability of CSM can be controlled or altered substantially or directly by market expansion efforts Some efforts to improve availability may be possible as discussed in the next section
bull CSM is perceived to be inferior in an overall sense to a number of key protein feeds CSM was judged by the survey respondents to be clearly superior in aggregate to only 5 of 20 potential alternate protein feeds Such an image could work against efforts to expand CSM use
bull Gossypol level is one of the top reasons that CSM is not used more frequently particularly in non-ruminant feed rations The level of gossypol is a unique characteristic of CSM that obviously cannot be changed through market expansion activities
bull Several other specific characteristics of CSM would likely need to change for CSM to be selected more frequently as a feed ingredient including amino acid balance energy level aflatoxin level and protein quality As with gossypol changes in these characteristics are out of the realm of market expansion programs
bull Feed formulators generally lack adequate and reliable information on many factors which are crucial in efficient feed formulation and which likely have a significant impact on the choice of protein feedstuffs The use of CSM in livestock feed rations is likely restricted by the wide disparity in the perception of feed formulators regarding the appropriate levels of several key nutrition-related factors for specific livestock rations including energy levels fat levels gossypol levels and escape values (ruminants only) for cottonseed meal
bull Over 75 of dairy cattle feed formulators and nearly half of beef cattle feed formulators utilize whole fuzzy cottonseed to some extent in some of the feed rations they formulate Relatively few reported using utilizing both CSM and whole cottonseed in the same ration A main attraction of the use of whole fuzzy cottonseed as opposed to cottonseed meal is the fiber content Indeed the use of whole delinted cottonseed in cattle feed rations is much lower
28
Opportunities for Expanding Use of Cottonseed Meal
There are essentially only two basic tools to expand the market for any commodity l market development and 2) enhancing the efficiency of the marketing system Market development involves a wide range of activities including primarily new product development and product differentiation In new product development the effort is to develop new products or characteristics of products that appeal to different segments of consumers An example might be research leading to the elimination of gossypol in cottonseed meal which could further open up the non-ruminant feed industry to cottonseed meal
Product differentiation on the other hand encompasses those activities designed to create a user preference for or loyalty to a commodity Product differentiation occurs in two major forms 1) advertising and 2) variation in design and quality of product The primary purpose of advertising is to create user preference for a commodity and convince users of the superiority of a product over competing products Actual physical differences in the product are not necessary to successfully differentiate it from competing products It is sufficient only that users believe that some superiority exists Advertising often intends to create an image of superior quality because such images are harder to imitate or successfully counter than physically unique features Successful differentiation of a product means that users become less sensitive to price changes more willing to pay a higher price for the same quantity because they prefer the product and are loyal to it in the face of price increases In other words users are willing to pay more for the same amount because advertising if successful creates a preference for the product over competing products
Variations in quality and design are usually used along with advertising to differentiate the product of one seller from that of another Such variations are often necessary to help create the superior images desired andor attract new sets of consumers
Often barriers exist in a marketing system that hinder the efficient functioning of the market and restrict the flow of commodities from sellers to users Enhancing the efficiency of the marketing system through eliminating such barriers can lead to an expansion in the use of a commodity One of the primary requirements of an efficiently functioning market is that sellers and users possess adequate and accurate information regarding the product its characteristics availability sources uses and value among other things Inadequate or inaccurate information regarding a particular product and other market characteristics can divert demand to alternative products with which users may be more familiar regardless of whether or not those products are better in some sense
The concept and importance of enhancing market efficiency in this regard can be illustrated by comparing the flow of information about a product and market conditions with a radio broadcasting system The efficiency of such a system depends on how accurately the microphone and other equipment record sound how accurately and rapidly that sound is transmitted to a radio receiver and how accurately the receiver brings sound to the listener A breakdown anywhere along the line in that system will simply mean that the message of the broadcast does not get from the radio station to the listener Also if the message gets through but static interferes with the transmission the listener might only receive part of the message or a garbled message The listeners impressions and actions consequently might be quite different than if he had received the message intended In quite the same manner the flow of a commodity from producers to users is affected by how rapidly and accurately market information is evaluated and how accurately and rapidly this information is transmitted to and among producers and users Any breakdown or static in the system would result in a smaller and more obstructed flow of the commodity to users than if the market operated more efficiently
29
The survey results suggests possible opportunities for expanding CSM use through market development and enhancing market efficiency Market development opportunities may be limited because of the nature of the CSM supply situation Nevertheless expansion of CSM use is possible through a reduction in direct feeding of cottonseed so that opportunities for expanding use through market expansion efforts should not be discounted Efforts to enhance the adequacy and accuracy of information regarding the use of CSM as a feed ingredient however may well be the most effective means of promoting an expansion of use or enhancement of the value of CSM
Opportunities for Expansion through Market Development
Although many product development opportunities likely exist for CSM the survey basically focused on the image of CSM in the perception of feed formulators If a market development approach to expanding the use of CSM as an ingredient of animal feed formulations has any chance of success the survey results suggest that the following components of such a strategy will be crucial
bull Product quality and consistency and an improved image of availability must be the major targets of promotion efforts The survey responses across all animal types unequivocally indicated that these three factors are the prime considerations in making general decisions regarding dietary proteins for animal rations Price only becomes a factor in specific decisions regarding the particular protein feed to use to fill the dietary protein requirements of feed formulations after these general concerns are addressed Creating an image of quality consistency and availability for CSM is a necessary first step to expanding use and enhancing value
bull CSM use expansion efforts must focus to some extent on reducing the direct feeding of whole cottonseed to beef and dairy cattle Reductions in direct feeding is the only chance for an increase in supply of CSM to fuel expanded use in newer markets such as catfish and poultry feeding Also because beef and dairy cattle are major users of cottonseed meal a decrease in feeding of whole cottonseed in favor of CSM would significantly expand use
bull Separate CSM market promotion messages must be developed to address the very different needs and concerns of ruminant vs non-ruminant feed formulators The survey results clearly indicate that many nutritional and non-nutritional factors are more important for nonshyruminant feed formulators than for ruminant feed formulators and vice versa
bull The nutrition-related content of CSM market promotion messages must emphasize primarily positive aspects of CSM protein quality amino acid balance and amino acid availability as well as an accurate understanding of appropriate gossypol and aflatoxin levels Many of these factors however are more important for non-ruminant rather than ruminant feed formulators which must be accounted for in designing appropriate messages for feed formulators of each animal type
bull The non-nutrition-related content of CSM market promotion messages may well be the most important and must emphasize primarily the positive aspects of price availability consistency of quality and storability The survey results attached a relatively high level of importance also to nutrient guarantees Although not scoring particularly high in the responses services available from the CSM industry may also be a helpful component of CSM use promotion messages
30
Opportunities for Expansion through Market Emciency Enhancement
Even though some gains in CSM use and market value can reasonably be expected through market expansion efforts the cost involved could easily outweigh any benefits in terms of enhanced profits to the CSM industry Perhaps the most cost-effective appropriate and useful means of enhancing the use of CSM would be a strategy aimed at improving the level and accuracy of information available regarding CSM and its use Lack of information or misinformation can easily discourage feed formulators from using CSM in their feed formulations Strategies to enhance the quantity and accuracy of appropriate information can take on many forms from media advertising to market news letters Although it is beyond the scope of this study to develop alternative information strategies the results of this study clearly indicate a number of areas in which enhanced and more accurate information is a critical need These include the following
bull The overall quality of CSM The study suggests that the negative aspects of CSM are well known Less well known are the specific positive aspects of CSM that may give it an edge in some sense over other protein feeds
bull The ideal ratio of the price of CSM to other feeds like soybean meal The study results indicate that feed formulators may not be adequately informed about what the ideal market value of CSM is relative to soybean meal given the differences in feeding value As a consequence CSM may currently be less used in relation to soybean meal than current market price ratios suggest should be the case
bull Protein-related factors for CSM use in non-ruminant feeds These factors are a major concern in the decisions of feed formulators to include or exclude CSM in feed rations
bull The relationship of aflatoxin to CSM and the rumen degradability of CSM particularly for beef and dairy cattle feed formulators These were the nutritional factors of greatest concern to ruminant feed formulators in the decision to include CSM in their feed formulations
bull CSM price availability consistency and palatability These were indicated to be the most important non-nutritional factors affecting feed formulators decisions regarding whether or not to use CSM The study indicates that information on non-nutritional factors may be more important in the decision to use CSM over alternative feeds to fill dietary protein requirements of feed rations than information on nutritional factors
bull The feeding value of CSM relative to alternative protein feeds An accurate and detailed assessment of the extent to which CSM may be superior as an alternative to other standard protein feeds would help position CSM appropriately in the market
bull The appropriate and acceptable levels of several key parameters affecting the use of CSM in animal feed rations including energy levels fat levels gossypol levels and escape values (ruminants only) Feed formulators generally lack adequate and reliable information on these and likely other parameters not included in the study which are crucial in efficient feed formulation and which have a significant impact on the choice of protein feedstuffs Although it appears that nearly all feed formulators routinely perform crude protein analyses few perform analyses for aflatoxin gossypol fat fiber and other parameters Also CSM suppliers are apparently doing an inadequate job currently of providing such information to feed formulators
31
SOME CONCLUDING COMMENTS AND RECOMMENDATIONS
This study assessed the potential problems and opportunities for expanding the use of CSM through an analysis of the perceptions of feed formulators regarding the use of CSM as an animal feed ingredient The perceptions of feed formulators regarding CSM as a protein feed largely define the boundaries within which CSM use will be able to achieve any significant growth in the future Their perceptions right or wrong are the key to understanding not only the problems facing CSM use but also the opportunities
The general conclusion of the study is an obvious one the use of CSM in feed formulations faces some major challenges in the future Chief among these include a perception among feed formulators that price availability quality and other key CSM characteristics are often obstacles precluding increased use of CSM in their feed formulations Perhaps the most important implication of the study is that a serious lack of adequate and accurate information among feed formulators regarding the characteristics parameters value and other aspects of cottonseed meal use in animal feed rations may be seriously restricting the market opportunities for cottonseed meal U nfortunately the development of alternative strategies to expand the use of CSM and enhance the efficient functioning of CSM markets through more accurate and available information on all aspects of CSM use in feed formulations is beyond this study Nevertheless a few recommendations pertinent to the development of such alternative strategies are in order
bull Before adopting any approach to expand the use of CSM it would be useful first to conduct a detailed analysis of the costs and benefits involved Market promotion efforts through advertising can be extremely costly and yield relatively little Research has also shown that there is often a tremendous lag between advertising and promotion expenditures and any associated returns It could take years of investment in such market expansion efforts before an accurate measurement of the actual return on investment could even be attempted
bull Consider developing first a detailed plan for information dissemination to the feed industry regarding all appropriate aspects of CSM use in feed rations as determined in this study An important part of this process would be a comprehensive assessment of the information needs and the information resources readily available The gap discovered in this way between needs and resources will help set the research agenda for the industry to fill the critical existing information gaps
bull Initiate a study of final user attitudes and perceptions of CSM use as a guide to future market expansion efforts This study considered only the perceptions of feed formulators regarding the use of CSM But feed formulators are often not the final users Consulting nutritionists for example often include or exclude certain feeds and feed types from their formulations as requested by feed users At least a few of the respondents to the survey conducted for this study indicated that user preferences are major factors determining whether or not CSM is included in their feed formulations Indeed markets operate as the interaction of supply and demand to determine prices The preferences of final users ultimately will be expressed in the market values of any product in any market unless sufficient obstacles exist to prevent the market from functioning properly Therefore the real decision-makers in the use CSM in the market may well include many more individuals than adequately represented by feed formulators
32
REFERENCES
US Department of Agriculture (USDAa) Feed Situation and Outlook Report Economic Research Service FDS series various issues
US Department of Agriculture (USDA b) Oil Crops Situation and Outlook Yearbook Economic Research Service OCS Series various issues
Figure 1 Quantity of Oilseed Meals Fed to Livestock 194849 - 198590 (Average)
(1000 Tons)
25000 0-1-----------------------shy
20000 I-~
15000
10000
5000
o L 1 J tJ t tmiddotmiddotmiddot 1 oj 1 to bullbull 1 L_ n __LLL I 1 bullbull I V I
1948-49 1950-54 1955-59 1960-64 1965-69 1970-74 1975-79 1980-84 1985-90
(Years)
n iflu Soybean Meal bull Cottonseed Meal Other Oilseed Meals
Source USDA
c
8 c a CD
en ~
--I _ scg ~CD 01)-- en - () mg0 s 0
JCD enOJ CD_CD en 0
sCDCD 0 OJ shyo OJ r Jlt- 0 m CJ) 0 0lt o 0shyCD OJ J
~s ~m cpCJ) r co OJco ~m a
Figure 3 Price Premium (+) or Discount (-) of Cottonseed Meal Relative to Soybean Meal 1956-1990
~~ ~
o I ~ I I
-20 f---
-40
-60
1~1~1~1~1~1~1~1~1~1~1~1~1~1~1~1~1~1~
Cottonseed meal price is adjusted to a soybean meal protein equivalent basis
~I------------------------------------------------------
l l A
I~middotmiddot--- --------
Figure 4 Animal Species for which Respondents Formulate Feeds
DAIRY CATILE
BEEFCATILE
HORSES
SHEEP
BROILERS
LAYERS
OTHER
PETS
TURKEY
SWINE
CATFISH
210
21000
0 5 1000 15 20 25
Figure 5 Respondents Formulating Feeds for the Various Animal Species
0 20 40 60 80
Figure 6 Other Animal Species for Which Respondents Formulate Feeds
DAIRY CATTLE
BEEF CATTLE
HORSES
SHEEP
BROILERS
LAYERS
OTHER
PETS
TURKEY
SWINE
CATFISH
632
Exotics
Trout
Alligators
KOI
Breeding Hens
Wildlife
Rabbits
Avian
Shrimp
Salmon
Ducks
Fish
Gamebirds
Hybrid Bass
379
~--~----~--~----~----~--~----~--~----~--~
0 10 20 30 40 50
Figure 7 Respondent Feed Formulation Activities by State
( of Respondents)
o 00 middot15 16 -30 31 middot45Cgt 46 -60 61 - 75 - 76 -90
Table 8 Respondent Experience as an Animal Nutritionist
( of Respondents) 30 r---shy
25 t-middotmiddotmiddotmiddotmiddotmiddotmiddotmiddotmiddotmiddotmiddotmiddotmiddot-middot ---_ _
20 -_ -nNItshy
15
10
5
0 1-5 6-10 11-15 16-20 21-25 26-30 31-35 36-40 41-45
(Years Of Experience)
-it sa 0 m 8 l 0 CD l g
_ cc c -s CD CObull
-0 -s- 3 Dl ~ IJ CD (fJ
C 0 l C CD l -+
raquo Sl_ lt_ -+_ CD (fJ
Figure 10 Respondent Primary Feed Formulations
by Animal Type 1990 (Percent)
30 I--------------------------------------------------------shy
25 r- middotmiddotmiddotmiddotmiddotmiddot231middotmiddotmiddotmiddot
20
15
10
5
0 Beef Dairy Swine Poultry Horses Pets Aqua- Sheep Exotics
Cattle Cattle culture amp Goats
(Animal Type)
Figure 11 Percent of CSM and S8M Used in Formulations by Feed Manufacturer Respondents 1990
( of Average Feed Ration)
Figure 12 Tons of Feed Formulated by Feed Manufacturer Respondents 1990
65
91
6 9
17
Total Formulations Formulations With CSM
II Less than 200000 Tons
II 200000 - 400000 Tons bullbullbull I bullbullbullbullbullbull ~ 3 ~ 400000 - 600000 Tons
5 rn 600 000 - 800 000 Tonsru 1
[] 800000 - 1000000 Tons9 4
I ~ 1 More Than 1000000 Tons
Formulations With S8M
Figure 13 Percent middotof Beef Cattle Respondents Formulating CSM Feeds for Specific Beef Cattle Types
( of Respondents)
25 ~I------------------------------------------------------~
-Isectig Feedlot-II 223
20
15
10
5
0
bull Other
~ middotmiddotmiddotmiddotmiddotmiddotmiddot middotmiddot _middotmiddotmiddotmiddot-=middotmiddotmiddotccmiddotcmiddotmiddot
Brood Cows Bulls Calves Feeder Heifer Stocker
(Animal Type)
Figure 14 Percent of Dairy Cattle Respondents Formulating CSM Feeds for Specific Dairy Cattle Types
( of Respondents)
120 ----------------------
100 88
80
60
40
20
0 Calves Heifers Lactating Cows Dry Cows
(Animal Type)
Figure 1-5 Percent of Poultry Respondents Formulating CSM Feeds for Specific Poultry Types
( of Respondents)
OO~I--------------------------------------------~-
50 1-laquolaquolt--laquolaquolaquo -lt - lt - lt -lt laquo lt
44
40
30
20
10
0
f-
~laquolaquolaquolaquo
~laquolaquolaquolaquolaquolaquo
Broilers Layers Turkeys Breeding Flocks
(Animal Type)
Figure 16~ Combined Responses Months of the Year When CSM IS NOT Available
( of Respondents) 16 i ---
14 12~8
12
10
87373 7
6
4
2
0 ~~ ~s ~( ~( ~0( ~0(~~~ ~~ ~t ~1 u~ ~g n0~ ad-o N0~ ~a~
~Y ~o Q~lmiddotr
(Month)
Figure 17 Combined Responses Months of the Year When CSM Needs to Be Available
( of Respondents) 12 ---------------------------
10
8
6
4
2
0
goA 9
~ui ~s ~Ot X)Ot ~Ot X)Ot~0SV~0~~erl ~iSclt ~f ~~1 ~v~ ug ~o~ o~o NO~ co~0 0lt609 ~o
(Month)
Figure 18 Beef Cattle Responses Percent of Respondents Formulating Creep Feed for Calves or Supplements for Stockers
733
832
0 20 40 60 80 100 120
( of Respondents)
Figure 19 Beef Cattle Responses Protein-Related Factors Considered When Balancing Rations
Other Protein Factors 110
Rumen
Degradability 686
Crude Protein Level 161
Amino Acid
Values 42
( of Respondents)
Figure 21 Comparison of Responses Months When CSM Needs to Be Available
( of Respondents) 94 ---------------------------shy
92
9
88
86
84
82 8
78
76
74
72
7
68
66
~ euroI - It
64 -t----------------------------------- -----------t
JAN FEB MAR APR MAY JUN JUL AUG SEP OCT NOV DEC
(Month)
bull Beef Cattle -t Dairy Cattle ltgt Poultry Catfish
Figure 20 Comparison of Responses Months When CSM Is Not Available
( of Respondents)
16 t 15
14
13
12
11
10
9
8ltl amp
7
6
5 I JAN
I
FEB I
MAR I
APR I
MAY I
JUN I
JUL I
AUG SEP I
OCT NOV I
DEC
(Month)
bull Beef Cattle -t Dairy Cattle ltgt PouHry b Catfish
Figure 22 Comparison of Responses Analyses Routinely Performed
( of Respondents)
100~-----------------------------------------------
90
80
70
60
50
40
30
20
10
o I ~
AFLATOXIN C PROTEIN FAT FIBER GOSSYPOL OTHER NONE
(Analyses)
bull Beef Cattle Dairy Cattle o Poultry Catfish-t fj
Figure 23 Comparison of Responses Analytical Values Provided by Supplier
( of Respondents)
60shy
50
4)
30
20
10
o amp ~
AFLATOXIN C PROTEIN FAT FIBER GOSSYPOL OTHER NONE
(Analyses)
bull Beef Cattle -t Dairy cattle o Poultry b Catfish
Figure 24 Share of Cottonseed Use Crush vs Feed Use
( of Respondents)
100 I
90
CRUSH 80
70
60
50
40
30
20
FEED USE 10
o 1~ 1~ 1~ 1m 1m 1~ 1~ 1~ 1~ 1~ 1~ 1~ 1~ 1~
(Year)
Source USDAb
Table 1 Percentage of Beef Cattle Feeds Formula ted Table 2 CSM Feeds Formulated for Beef Cattle CSMmiddot Calvesmiddot
middotAverage Response Rate (feedlot=51 other=41) middotResponse Rate = 39
Table 3 CSM Feeds Formulated for Beef Cattle Table 4 CSM Feeds Formulated for Beef Cattle Stockersmiddot
middotResponse Rate = 40
Response Rate =37
Table 5 CSM Feeds Formulated for Beef Cattle Table 6 CSM Feeds Formulated for Beef Cattle
middotResponse Rate =33
middotResponse Rate = 37
Table 8 Percentage of Dairy Cattle Feeds Formulated CSM
Average Response Rate =88
middotResponse Rate = 37
Table 9 CSM Feeds Formulated for Dairy Cattle Table 10 CSM Feeds Formulated for Dairy Cattle
RespooseRate 24
middotResponse Rate = 34
Table 11 CSM Feeds Formulated for Dairy Cattle Table 12 CSM Feeds Formulated for Dairy Cattle
Response Rate = 31 Response Rate = 45
Table 13 Percentage of Poultry Feeds Formulated Using CSMmiddot
bullAverage Response Rate = 79
Table 14 Percentage of Catfish Feeds Formulated Using CSMmiddot
bullAverage Response Rate =67
Table 15 CSM Feeds Formulated for Catfishmiddot )middoti middot fteq~
bullAverage Response Rate = 17
Table 16 Combined Responses Importance of Specific Factors in Choice of Dietary Protein ( of
bullAverage Response Rate =g]
Table 17 Combined Responses Other Important Factors in
bullAverage Response Rate = 22
bullAverage Response Rate =91
-Average Response Rate =90
Table 20 Combined Responses Importance of Non - Nutrition -Related Factors in Choice of CSM over Alternative Protein Feeds ( of
-Average Response Rate = 87
Table 22 Combined Responses Top S Reasons Why CSM IS NOT Selected as a Feed
Table 23 Combined Responses Top 5 Specific Characteristics That Would Have to Change for CSM to be Selected as a Feed
Table 24 Combined Responses Analysis Routinely Performed
Table 25 Combined Responses Analysis Values Provided
CSM
267 067 333 333 1400 S333
467 000 067 067 1400 4867 --shy
467 000 000 067 400 4333 --shy -- shy -- shy
250 000 000 000 1250 4000 -- shy --shy
313R 4733 62 ------ shy~ - shy ~-
4S00 62
bullAverage Response Rate = 100
bullAverage Response Rate = 87
Table 28 Beef Cattle Responses Imponance of Nutrition-Related Factors in Choice of CSM Over Alternative Protein Feeds
Average Response Rate = 91
Table 29 Beef Cattle Responses Other Nutrition - Related
Fact~~~~~~~~~~~~~~~~~~~
Response Rate =7
Table 30 Beef Cattle Responses Imponance of Non - Nutrition - Related Factors in Choice of CSM Over Alternative Protein Feeds
middotAverage Response Rate = 87
middotResponse Rate = 5
bullAverage Response Rate =14
Table 33 Beef Cattle Responses Months of the Year When CSM Needs to Be AvaiJable I ii middot middot1
bullAverage Response Rate =53
10 U
-Moy
JIIJ
All
so
0_ -
to
--I No
Moy
10 -so shy
0_ _ 0-
Table 35 Beef Cattle Responses Top 5 Reasons Why CSM Is Not Selected as a Feed
Average Response Rate =100 Response Rate = 24
Response Rate =28
Average Response Rate = 98
Response Rate = 17
middotResponse Rate =9
Table 43 Beef cattle Responses Type of Creep Feed
middotResponse Rate = 81
middotResponse Rate =26
Table 45 Beef cattle Responses Respondents Formulating Rations With CSM and Whole
middotResponse Rate = 68
Table 47 Beef cattle Responses Percentage of Whole Cottonseed Respondents Mix in Rations Containing Both CSM and Whole Cottonseedmiddot tCmiddotHiitjt~ middotmiddotmiddotmiddot1
middotResponse Rate =25
middotResponse Rate = 30
bull Response Rate = 98
Response Rate =11
Table 51 Beef Cattle Responses Escape Value Respondents Are Using for Rumen Degradabilitymiddot
1~iiii middotb~r~~fgtD zq436imiddotmiddotmiddotmiddotmiddotmiddotmiddot 004bullbullbullbullbullbullbullbullbullbull1----22--+----31-4
I~~I 23 329
middotResponse Rate = 57
Table 53 Beef Cattle Responses Methods or Sources Respondents Used to Calculate CSM
Table 52 Beef Cattle Responses Reliability of Escape Values Used
Table 54 Beef Cattle Responses Interested in Knowing Escape Values for CSM Processed
Valuemiddot
middotResponse Rate =98
)
I Mean ~nse
63 57S19 228381 Q-L_uu ~139 59468 32306 139bullII1 1 061 06
1 1 44 430 614431-------- 57t 001 001 middot-1
==~=-__~~1c9 00 _ 06 _ 001_ 38 133 323 63
Average Response Rate =100
Response Rate = 89
Table 58 Dairy Cattle Responses Importance of Nutrition - Related Factors in Choice ofCSM Over Alternative Protein Feeds (ofbmiddotNmiddotmiddotmiddotmiddotmiddotmiddot
Response Rate =88
Table 59 Dairy Cattle Responses Other Nutrition-Related Factors
Indicated br~~P211dents
Response Rate =10
Table 60 Dairy Cattle Responses Importance of Non- Nutrition - Related Factors in Choice of CSM Over Alternative
Protein Feeds ( ofResPOndents~dd
Response Rate = 88
Response Rate = 3
--
Average Response Rate = 51
Table 62 Dairy Cattle Responses Months in the Year When CSM IS NOT Available
10 u
J -- AIIIi
--~ shy
loOoIMr _ 0-
bullAverage Response Rate =69
--- AIIIi
--~ soM
0
0-_
10
Table 65 Dairy Cattle Responses Top 5 Reasons Why CSM IS NOT Selected as a Peed
Table 66 Dairy Cattle Responses Top 5 Specific Characteristics That Would Have to ro1 ____ for CSM to be Selected as a Feed
Table 67 Dairy Cattle Responses Analyses Routinely Performed fmiddotmiddotmiddotmiddot
Response Rate =96
Response Rate =56
Table 68 Dairy Cattle Responses Other Analyses
Response Rate =25
Table 70 Dairy Cattle Other Analytical Values CSM
Response Rate =4
Average Response Rate =81
Average Response Rate = 15
Table 73 Dairy Cattle Responses Respondents Formulating Feeds With Whole andor Delinted
Cottonseed bull
bullAverage Response Rate =92
middotResponse Rate = 40
Table 74 Dairy Cattle Responses Respondents Formulating Rations with Cottonseed Meal and Whole Cottonseed in the Same Rationmiddot
middotResponse Rate = 97
Table 76 Dairy Cattle Responses Percentage of Whole Cottonseed Respondents Mix in Rations
ltltJIltainin(a0th CSM and WhoeCottonseedmiddot Mean
middotResponse Rate = 42
Table 77 Dairy Cattle Responses Knowledge of Research on Feedine CSM
~~~~
Average Response Rate = 68
Response Rate =7
Average Response Rate =59
Response Rate =25
Average Response Rate =63
Response Rate = 13
middotResponse Rate = 92
Response Rate =82
Table 85 Dairy Cattle Responses Methods or Sources Used to Calculate CSM
Response Rate = 73
Table 86 Dairy Cattle Responses Respondents Interested in Knowing Escape Values for CSM Processed from Different Methodsmiddot fmiddotmiddotmiddotmiddotmiddotmiddot
Response Rate = 92
Response Rate = 34
Table 89 Dairy Cattle Responses Suggestions for CSM
Response Rate =33 Response Rate =22
-----
64 139 24815 00 36 511 5751
5951 131 438 35015 00 15 I-~~~~~
6200 15 423 51151 00 00 ~~~ -~~~ -~~~ ~~~-~~ --~~ ~ ~ ~~-~ ~
292 55125 00 00 125 45800
bullAverage Response Rate =99
Average Response Rate =85
Table 92 Poultry Responses Importance of Nutrition - Related Factors in Choice of CSM Over Alternative Protein Feeds (of
Average Response Rate =85
Table 93 Poultry Responses Other Nutrition-Related Factors Indicated
200
200
Response Rate = 5
Table 94 Poultry Responses Importance of Non - Nutrition - Related Factors in Choice of CSM Over Alternative Protein
Feeds~~~~~~~~~~5=~~~~~T7~~
00 Average Response Rate =83
Response Rate =4
Average Response Rate = 17
Table 97 Poultry Responses Months in the
J
p
April
lao
A
shy-- 0
ft
April
_
Average Response Rate = 43
=1 g L
0
Table 99 Poultry Responses Top 5 Reasons Why CSM IS NOT Selected as a Feed
Table 100 Poultry Responses Top 5 Specific Characteristics That Would Have to Change for
CSM to be Selected as a Feed Inoredient
Table 101 Poultry Responses Analyses Routinely
middotResponse Rate = 93
Table 102 Poultry Responses Other Analyses Routinely
Performed
middotResponse Rate = 27
Table 103 Poultry Responses Analytical Values Provided
middotResponse Rate =73
Table 104 Poultry Responses Knowledge of Problems
bullAverage Response Rate = 62
Average Response Rate = 14
Table 106 Poultry Responses Protein - Related Factors
Average Response Rate = 64
Table 107 Poultry Responses Other Protein - Related
Response Rate =11
Table 108 Poultry Responses Crude Protein Levels
Preferred for CSM
Response Rate = 55
Table 111 Poultry Responses Gossypol Levels Considered
Safe
Table 112 Poultry Responses Would or Do Use Table 113 Poultry Responses Relative Feeding Value of CSM Comoared to 44 SBMmiddot
middotResponse Rate = 96
bull Response Rate = 100
Table 114 Poultry Responses Knowledge of Table 115 Poultry Responses Familiarity with Other Feedino CSMmiddot
middotResponse Rate =7 bull Response Rate = 73
middotResponseRate = 31
bullAverage Response Rate = 58
Table 118 Poultry Responses Willingness to Pay
a Premium Per Unit of Protein for CSM With More
Than 41 Protein
bullResponse Rate =91
Table 119 Poultry Responses Percent of Cost of SBM Respondents Willing to Pay for CSM with
Response Rate =27
Response Rate =64
00 00 87 43 478 304 57 00 00
----shy I--~~
00 ~-~
43 522 348 59 ----shy
62~ 00 00 00 261 ----shy
652 ------shy
00 00 00 00 667 333 63 AverageResponseRate = 99
bullAverage Response Rate = 73
Table 123 Catfish Responses Importance of Nutrition - Related Factors in Choice of CSM Over Alternative Protein Feeds
Average Response Rate =83
Table 124 Catfish Responses Importance of Non- Nutrition - Related Factors in Choice of CSM Over Alternative Protein
Feeds
Average Response Rate = 90
bullAverage Response Rate = 13
Igt 20
s_
Pshy s
--s
H_
_
gt 7 bull bull bull bull bull
1 fsI plusmn -
haMr
N__
shy
bullAverage Response Rate =54
Table 128 Catfish Responses Top 5 Reasons Why CSM IS NOT Selected as a Feed
Table 129 Catfish Responses Top 5 Specific Characteristics That Would Have to Change for CSM to Be Selected as a Feed-_
Table 130 Catfish Responses Analyses Routinely Table 131 Catfish Responses Other Analyses Routinely Performed
middotResponse Rate = 25
middotResponse Rate =92
bullAverage Response Rate = 18
Table 133 Catfish Responses Knowledge of Problems Feedine CSM to CatflSh
Average Response Rate =100
Table 134 Catfish Responses Protein - Related Factors Considered i
Response Rate = 83
Table 135 Catfish Responses Crude Protein Levels Preferred for CSM
Response Rate = 100
Table 139 Catfish Responses Would or Do Use Table 140 Catfish Responses Relative Feeding
Value ofCSM Compared to 44~ Lmiddotmiddotmiddotmiddotmiddotmiddotmiddotmiddotmiddotmiddotmiddotmiddotmiddotmiddotmiddotmiddotmiddotmiddotmiddot _
Response Rate = 100
Response Rate = 100
Table 141 Catfish Responses Knowledge of Research on Table 142 Catfish Responses Sources ofInformation
Average Response Rate = 83
bullAverage Response Rate = 44
Table 143 Catfish Responses Willingness to Pay A Premium Per Unit of Protein for CSM with More Than
middotResponse Rate = 100
Table 144 Catfish Responses Percent of Cost of SBM Respondents Willing to Pay for CSM with Sufficiently Low Goscvnol and Fiber Levelsmiddot
middotResponse Rate = 83
middotResponse Rate = 25
Table 146 Comparison of Mean Responses and Analysis of Variance (ANOVA) Importance of Specific
bull Scale of 1 (extremely unimportant) to 7 (extremely important) for the mean ranking a Mean significantly larger across animal types at the 5 significance level otherwise no difference b Mean significantly lower across animal types at the 5 significance level otherwise no difference
Table 147 Comparison of Mean Responses and Analysis of Variance (ANOVA) Ranking of Other Protein
bull Scale of 1 (CSM inferior to respective feed) to 7 (CSM superior to respective feed) for the mean ranking
a Mean significantly larger across animal types at the 5 significance level otherwise no difference
b Mean significantly lower across animal types at the 5 significance level otherwise no difference
Table 148 Comparison ofMean Responses and Analysis of Variance (ANOVA) Importance of Nutritionshy
Related Factors in Choice ofCSM Over Alternativesmiddot
bull Scale of 1 (extremely unimportant) to 7 (extremely important) for the mean ranking a Mean significantly larger across animal types at the 5 significance level otherwise no difference
b Mean significantly lower across animal types at the 5 significance level otherwise no difference
Table 149 Comparison of Mean Responses and Analysis of Variance (ANOVA) Importance of Nonshy
Nutrition- Related Factors in Choice of CSM Over Alternativesmiddot
bull Scale of 1 (extremely unimportant) to 7 (extremely important) for the mean ranking
a Mean significantly larger across animal types at the 5 significance level otherwise no difference
b Mean significantly lower across animal types at the 5 significance level otherwise no difference
- = Not mentioned or ranked lower than 4th place
Table 151 Comparison of Responses Top Responses Why CSM IS NOT Selected as a Feed
- = Not mentioned or ranked lower than 5th place
Table 152 Comparison of Responses Top Characteristics that Have to Change for CSM to Be
- = Not mentioned or ranked lower than 5th place

6
extremely unimportant to extremely important respectively) I) quality 2) price 3) availability and 4) consistency In addition they were provided an opportunity to list and rank other factors affecting their dietary feed protein choices An impressive 92 of the respondents indicated that the quality of the protein was either important or extremely important in their choice of dietary proteins (Table 16) Nearly two-thirds of the respondents ranked protein quality as extremely important An almost equal number of respondents (90) indicated that protein consistency was either important or extremely important Less than half the respondents however ranked consistency as an extremely important factor Although nearly SO of the respondents ranked price availability and other factors as either important or extremely important the majority of respondents ranked each of those factors as important rather than extremely important The primary other factors listed by the respondents included palatability flow characteristics the protein composition the value supplier service and storage and handling characteristics (Table 17) Various miscellaneous factors were also listed
Cottonseed Meal As An Alternative Protein Feed
The final sample members were asked two sets of questions to gain insight into the competitiveness of CSM as a protein feed and determine which other proteins are considered to be the main competitors of CSM in feed formulations They were first asked to rank various selected protein feeds on a scale of I to 7 as inferior or superior respectively to CSM in an overall sense for use in feed formulations A mean response of greater than 4 for a particular protein feed is an indication that on average the responding feed formulators considered the protein feed to be superior to CSM (ie CSM is considered to be an inferior protein source) On the other hand a mean response of less than 4 is an indication that the protein feed is inferior to CSM in the perception of the respondents on average (Le CSM is considered to be a superior protein source) A mean response of around 4 suggests that the respondents considered cottonseed meal to be equally acceptable to those particular feeds The second question required respondents to indicate whether or not they considered CSM to be an alternative to each of the 20 listed protein feeds
The results suggest that CSM meal is considered to be clearly superior to only 5 of the 20 listed protein feeds including (in order of perceived CSM superiority) urea safflower meal wheat middlings sunflower meal and feather meal (Table IS) CSM was considered to be clearly inferior to another 7 of the 20 listed protein feeds including (in order of perceived inferiority of CSM) fish meal dried skim milk dried whole milk blood meal soybean meal meat and bone meal and corn gluten meal The mean responses of the remaining S protein feeds were all close to 4 suggesting that the respondents considered CSM to be about the same as those protein feeds These included (in no particular order) tankage poultry by-product meal peanut meal linseed meal brewers dried grains distillers dried grains dehydrated alfalfa and canola meal
Respondents were quite evenly divided in their opinion as to whether CSM is a viable alternative protein feed for almost all of the listed protein feeds (Table IS) The only possible exceptions were dried skim milk fish meal dried whole milk and blood meal for which a larger percentage of respondents indicated that CSM is an alternative than suggested that CSM is not an alternative
The Importance of Nutritional and Non-Nutritional Factors
In response to an earlier question respondents ranked the importance of various factors in choosing any dietary protein for use in their feed formulations Later respondents were asked to rank the importance of a more detailed list of nutrition-related and non-nutrition-related factors in specifically choosing cottonseed meal as a component of the feeds they formulate again on a scale of extremely unimportant to extremely important (a scale of I to 7 respectively) They were also
7
allowed to list other factors that they considered important but were not on the list Interestingly the largest percentage of respondents (90) ranked aflatoxin as an important or extremely important factor in their choice of CSM as a feed component (Table 19) Nearly two-thirds ranked aflatoxin as extremely important a much higher percentage than for any other factor Protein quality was ranked as important or extremely important by 80 of respondents Gossypol level had the third highest mean response of any individual factor Only one listed factor was clearly considered to be unimportant in the choice of cottonseed meal as a feed component (vitamin level) as indicated by a mean response of substantially less than 4 The mineral level in cottonseed meal was considered to be neither important nor unimportant
The major non-nutrition-related factors influencing the choice of cottonseed meal as a feed component in the perception of the respondents included consistent quality price availability nutrient guarantees and palatability as indicated by their relatively higher mean ran kings (Table 20) Note that all of the listed non-nutrition-related factors were considered by the respondents to be at least somewhat important in their choice of cottonseed meal as a feed component That is none of them were considered to be unimportant The least important non-nutrition-related factors influencing the choice of CSM in the perception of the respondents included service from the CSM industry the need for a local supply of CSM special equipment requirements for using CSM and convenience in using CSM as a feed component
Seasonality of Cottonseed Meal Availability
The survey results indicate that CSM is least available in sufficient quantities for purchase as a feed component during the months of June through September of a typical year (Figure 16) However the results also indicated that those are also about the same months (April through August) in which there is the least need for CSM to be available to compete effectively with alternative protein feeds (Figure 17) One interpretation of this result is that on average the availability of CSM is generally not a problem during the year This is not entirely the case however as the responses to the next set of questions point out
Reasons for the Selection and Non-Selection of Cottonseed Meal
To obtain further insight into the primary motivating factors behind the selection or nonshyselection of CSM as an ingredient in feed formulations the sample members were asked three completely unaided questions ie the respondents did not have a list from which to choose in answering the questions They were first asked to list the top five reasons why they perceive that CSM is selected as a feed ingredient and then the top 5 reasons why CSM is Dot selected in order of importance Finally if CSM is Dot generally selected by a respondent heshe was asked to list the specific characteristics of CSM that would have to change for it to be selected more frequently again in order of importance The respondents simply needed to fill in blanks for each question (reasons that CSM is and is not selected and characteristics that would have to change) marked lst through 5th with their own ideas
By far the number one reason (63 of the respondents) listed for which CSM is selected as a feed ingredient was price (Table 21) Far behind price the number one choices of some respondents were proteinprotein quality (9 of the number one responses) availability (7) palatability (4) and quality (4) Listed most often as the second most important reason for selecting CSM was availability (31 of the number two responses) followed by price (20) proteinprotein quality (1I) palatability (7) and pelletabilitypellet quality (6) The three reasons most often listed third were availability (20 of the number three responses) palatability (16) and price (11) Based on the total number of times a reason was listed first second or third the top three reasons
8
given by respondents for which CSM is selected as a feed component were price availability and proteinprotein quality in that order
The respondents provided a much longer list of reasons for which CSM is Dot selected than for which CSM is selected as a feed ingredient (Table 22) Interestingly the most frequently listed number one reason (54 of the respondents) why CSM is Dot selected as a feed ingredient was again price Other number one choices included availability (16) gossypol (9) and protein protein quality (3) The reason most often listed second (30 of respondents) was availability followed by pricevalue (20) and gossypol (8) The reason most often listed third was pricevalue again (14 of respondents) and then availability (I 3) and gossypol (I 1) Again based on the total number of times a reason was listed first second or third the top three reasons given by respondents for which CSM is Dot selected as a feed component were price availability and gossypol in that order
The three most commonly listed specific characteristics of CSM that would have to change to be included more frequently in respondents feed formulations also were price availability and gossypol (Table 23) Other less frequently mentioned CSM characteristics that would need to change included amino acid balancelevel energy contentlevel aflatoxin contentlevel proteinprotein quality
In summary price and availability appear to be the two key factors affecting the use of CSM If price is low andor availability is adequate feed formulators are more likely to use CSM in their formulations On the other hand a high price andor poor availability is likely to discourage use of CSM Consequently there is very little loyalty by feed formulators to CSM because they appear to be quick to switch back and forth between CSM and alternative feeds as price changes Feed formulators do not appear to perceive that CSM is a feed ingredient with inherent characteristics for which they are willing to pay a premium if necessary in order to continue using it as an ingredient in the feeds they formulate That is the primary consideration in deciding whether or not to use CSM is its price rather than some nutritional characteristic for example Thus when price rises they perceive little reason to continue using CSM as part of their formulations
The availability of CSM appears also to work both for and against the use of CSM Responses to the specific questions on seasonality seemed to indicate that availability of CSM is not generally a problem during the year But when CSM is not selected as a feed ingredient availability is one of the major reasons During certain times of the year in certain parts of the country availability may be a positive factor motivating the use of CSM
Source of Chemical Analyses for Cottonseed Meal
Nearly 90 of the respondents routinely perform crude protein analyses (Table 24) About two-thirds perform their own fat and fiber analyses as well Surprisingly however less than half the respondents routinely test for aflatoxin even though nearly all respondents indicated aflatoxin to be an important or extremely important factor affecting their choice of CSM as a feed component Only 18 of the respondents routinely test for gossypol Even though nearly all respondents performed their own crude protein analyses CSM suppliers apparently provide analytical values for crude protein to over 40 of respondents (Table 25) CSM suppliers provided fat and fiber analytical values to about a third of the respondents CSM suppliers appear to provide analytical values for gossypol to very few feed formulators
9
Results by Animal Species
The responses in the previous section are indicative of the overall perceptions of feed formulators of the use of CSM as a feed component Those results however may mask some important differences in perceptions among formulators of feeds for the various animal species There are also issues regarding the use of CSM as a feed component that are unique to the various animal species Consequently salient dissimilarities in the responses of formulators of different animal feeds from the combined responses (over all animal types) discussed in the previous section are highlighted in this section Also the results of the questions asked specifically of formulators of feeds for particular animal species are discussed in this section in detail as well
BeeCattle
There are few major differences in the perceptions of beef cattle feed formulator respondents concerning the use of cottonseed meal from those discussed in the previous section for all survey respondents This may reflect the larger number of respondents formulating feed for beef cattle (and for ruminants in general) than for other animal species The salient differences in the 6 general question areas include the following
bull Factors affecting choice 0 dietary proteins The only major difference in the responses to these questions was a somewhat greater concern by responding beef cattle feed formulators for other factors influencing the choice of a dietary protein such as palatability and rumen degradability (Table 26)
bull Cottonseed meal as an alternative protein feed The results for beef cattle are roughly similar to those from the combined responses (Table 27) Major differences include I) a lower percentage of beef cattle survey respondents consider blood meal to be superior to CSM in beef cattle feeds 2) a large majority of respondents feel that CSM is not an alternative to dried skim milk and dried whole milk in beef cattle feeds and 3) an overwhelming majority of respondents consider CSM to be an alternative to the remaining protein feeds for use in beef cattle feeds except perhaps for fish meal and blood meal
bull The importance 0 nutritional and non-nutritionalactors Again the responses are generally the same as for the combined responses The beef cattle survey respondents however tended to rank nutrition-related factors as less important and non-nutrition-related more important than was the case for the combined responses On average beef cattle feed formulators ranked protein quality amino acid balance amino acid availability fat level fiber level and gossypol level as less important factors in the choice of CSM than was the case for the combined responses (Tables 28 and 29) Of the non-nutrition-related factors respondents ranked palatability the need for a local supply equipment requirements convenience and CSM industry service as all slightly more important in the choice of CSM than was the case for the combined responses (Tables 30 and 31)
bull Seasonality 0 cottonseed meal availability The results for the beef cattle respondents are virtually identical to those from the combined responses (Tables 32 and 33)
bull Reasons lor the selection and non-selection 0 cottonseed meal The top three reasons for which CSM is and is not selected as a feed ingredient are exactly the same for the beef cattle responses as for the combined responses (Tables 34 and 35) Also price availability and
10
gossypol level are cited as the three most important factors that would have to change for CSM to be used more frequently as was the case with the combined responses (Table 36)
bull Source 0 chemical analyses lor cottonseed meal No major differences appear in either the analyses routinely performed by the responding beef cattle feed formulators or the analytical values provided to them by CSM suppliers (Tables 37 38 39 and 40)
Beef cattle sample members were also asked several questions specifically regarding the use of CSM in beef cattle feed formulations in 5 general areas I) problems resulting from feeding a ration with CSM to the various beef cattle types 2) details on particular feed formulations for beef cattle 3) sources of information utilized regarding formulating beef cattle feeds 4) protein-related factors considered when balancing rations for beef cattle and 5) an open-ended question soliciting suggestions to improve the usefulness or value of CSM for beef cattle feed formulations
Problems from Feeding CSM Rations to Beef Cattle
Few respondents indicted knowledge of any problems resulting from feeding a ration containing cottonseed meal to either feedlot or other beef cattle (Table 40 The most frequently mentioned problems concerned feedlot bulls and calves The majority of the problems reported involved supplements and starter feeds (Table 42) The main problems reported had to do with gossypol beef cattle performance when fed rations containing CSM and reproduction The low number of respondents indicating problems of any type however suggests that the problems reported were likely isolated cases
Details on Particular Feed Formulations for Beef Cattle
The sample members were also asked to provide information regarding creep feeds for calves and supplements for stockers that they formulate as well as information regarding the use of whole or delinted cottonseed in beef cattle feed rations Nearly 75 of all beef cattle respondents formulate creep feeds for calves and over 80 formulate supplements for stockers (Figure 18) Traditional creep feeds represented two-thirds of the creep feeds formulated (Table 43) Over half the respondents indicated that they formulate traditional creep feeds Fewer respondents formulated high protein creep feeds
Nearly half the beef cattle respondents formulate some feeds using whole fuzzy cottonseed (Table 44) Only a little less than a third formulate any feeds using delinted cottonseed however Also only about a quarter of the respondents formulate any rations that include both CSM and whole cottonseed (Table 45) For those who formulate rations that include both the mix of the two in the rations varies widely Respondents reported that the share of such rations accounted for by CSM ranged from 1 to 100 with a mean of 19 (Table 46) The share of those rations accounted for by whole cottonseed ranged from 0 up to a maximum of 25 with a mean of 102 (Table 47)
Sources of Information Utilized on Formulating Beef Cattle Feeds
The largest number of respondents (110 of 123 respondents) indicated that they utilize university research of some type to obtain information on formulating feeds for beef cattle (Table 48) Only slightly fewer (91 respondents) indicated that industry publications are a source of feed formulation information for beef cattle University extension and government agencies were also listed as important information sources A few respondents listed other sources of information
II
including primarily the results of research performed in their own companies their own personal experience and their own private research (Table 49)
Protein-Related Factors Considered for Balancing Beef Cattle Rations
Nearly 70 of the respondents indicated that rumen degradability is a protein-related factor that they consider when balancing beef cattle rations (Figure 19) Respondents also consider crude protein level (16) and other protein factors (11) Only 4 indicated concern for the amino acid value when balancing beef cattle feed rations The two main other protein-related factors the respondents indicated as having a bearing on balancing beef cattle feed rations were the digestibility of the protein and the protein ingredients (Table 50)
Respondents indicated a wide range of escape values (or by-pass values) that they are using for CSM from less than 20 to over 50 (Table 51) At the same time however they are unsure as to the reliability of the escape values they are using Nearly 70 indicated that the escape values they are using are neither reliable or unreliable or only somewhat reliable (Table 52) The principal single method or source used by respondents for the escape value was the National Research Council (Committee on Animal Nutrition National Academy of Sciences) (Table 53) Universities were the next most frequently mentioned single source of CSM escape values The largest number of respondents (32) simply indicated that several sources were consulted for escape values Finally almost all respondents indicated an interest in obtaining information on escape values for CSM as processed by different methods (Table 54) There appears to be a lack of reliable information on CSM escape values in the perception of beef cattle feed formulators
Suggestions for Improling the Usefulness of Cottonseed Meal
Only 16 of the beef cattle feed formulators that returned surveys provided suggestions that might improve the value or usefulness of CSM in feed rations (Table 55) Some of the more noteworthy suggestions included improving the consistency of cottonseed meal various types of needed research more data on CSM and increased availability of CSM
Dairy Cattle
There are few major differences in the perceptions of dairy cattle feed formulator respondents concerning the use of cottonseed meal from the combined responses over all survey respondents and the beef cattle responses Again this may reflect the larger number of respondents formulating feed for dairy cattle (and for ruminants in general) than for other animal species The salient differences in responses by dairy cattle feed formulators in the 6 general question areas include the following
bull Factors affecting choice of dietary proteins There is virtually no differences in the responses of dairy cattle respondents from the combined responses for any of the listed factors (quality price availability consistency and other) affecting the choice of dietary protein (Table 56) A large majority of dairy cattle feed formulators ranked all factors as either important or extremely important
bull Cottonseed meal as an alternative protein feed The results for dairy cattle are roughly similar to those from the combined responses (Table 57) The two major differences include I) a large majority of respondents feel that CSM is not an alternative to dried skim milk fish
12
meal dried whole milk and blood meal in dairy cattle feeds and 2) an overwhelming majority of respondents consider CSM to be an alternative to nearly all the remaining protein feeds for use in dairy cattle rations
bull The importance of nutritional and non-nutritional factors Again the responses are generally the same As was the case for beef cattle respondents however dairy cattle respondents tended to rank the listed non-nutrition-related factors as relatively more important than the listed nutrition-related factors On average dairy cattle feed formulators ranked amino acid balance fiber level and gossypol level as less important factors in the choice of CSM than was the case for the combined responses (Tables 58 and 59) As in the case of both the combined and beef cattle responses aflatoxin was ranked at a higher level of importance than any other single nutrition-related factor Of the non-nutrition-related factors respondents ranked most factors as all slightly more important in the choice of CSM than was the case for the combined responses (Tables 60 and 61)
bull Seasonality of cottonseed meal allailability The results for the dairy cattle respondents are highly consistent with those for both the combined responses and for the beef cattle responses The months of May through September are the months of least availability of CSM which are also the months indicated when CSM is least needed to be available in the perception of dairy cattle respondents (Tables 62 and 63) Again the suggestion is one of little problem of CSM availability although this is not totally the case as indicated by dairy cattle respondents in later questions
bull Reasons for the selection and non-selection of cottonseed meal While price and availability are also the top two reasons that dairy cattle respondents perceived that CSM is selected as a feed ingredient protein contentquality ranked third on their list followed closely by palatability (Table 64) The top two reasons the CSM is not selected according to the dairy cattle respondents were price and availability as with both the combined responses and the beef cattle responses The third reason given by the dairy cattle respondents however was protein qualitylevel followed in fourth place by gossypol (Table 65) Again price was the key CSM characteristic that dairy cattle respondents indicated that must change in order to be used more frequently in dairy cattle rations (Table 66) Availability and gossypol levels were ranked as the second and third CSM characteristics that must change as was the case for the combined responses
bull Source of chemical analyses for cottonseed meal The results for the chemical analyses performed by dairy cattle respondents are virtually identical to those of both the combined results and those of the beef cattle results The primary analysis routinely performed by the dairy cattle respondents is crude protein (121 of the 143 respondents) followed by fiber (94 respondents) and fat (83 respondents) (Tables 67 and 68) The primary analytical values supplied to the dairy cattle respondents also include crude protein (62 respondents) fiber (50 respondents) and fat (47 respondents) (Tables 69 and 70) It is interesting to note that although aflatoxin was ranked at a higher level of importance than any other nutrition-related factor affecting the choice of CSM as feed component only a third of the dairy cattle respondents routinely perform analyses for aflatoxin and only 11 respondents are provided aflatoxin values by their CSM suppliers The story is about the same for both the combined and the beef cattle responses
Dairy cattle sample members were also asked several questions specifically regarding the use of CSM in dairy cattle feed formulations in 6 general areas I) problems resulting from feeding a
13
ration with CSM to the various dairy cattle types 2) details on dairy cattle feed formulations containing whole cottonseed 3) sources of information utilized on formulating dairy cattle feeds 4) protein-related factors considered when balancing rations for dairy cattle 5) gossypol levels considered to be safe for mature dairy cattle and pre-ruminant calves and 6) an open-ended question soliciting suggestions to improve the usefulness or value of CSM for dairy feed formulations
Problems from Feeding CSM Rations to Dairy Cattle
Again very few respondents indicted knowledge of any problems resulting from feeding a ration containing CSM to dairy cattle (Table 71) Only 24 of the respondents indicated problems with calves and only 18 for lactating cows as the result of feeding rations with CSM Only about 3 of the respondents mentioned problems with either dairy heifers or dry cows The number one problem reported was gossypol toxicity primarily in creep feeds and complete rations (Table 72) Both palatability and poor performance problems for various feed types were also frequently mentioned Again however the low number of respondents indicating problems of any type suggests that the problems reported were likely isolated cases
Details on Dairy Cattle Feed Formulations Containing Whole Cottonseed
Over 75 of dairy cattle respondents formulate feeds using whole fuzzy cottonseed a much higher percentage than was the case for beef cattle Less than half of the dairy cattle respondents however utilize delinted cottonseed in their feeds more in line with the beef cattle results (Table 73) Less than half the respondents formulate rations that include both CSM and whole cottonseed (Table 74) For those who formulate rations that include both the mix of the two in the rations varies widely Respondents reported that the share of such rations accounted for by CSM ranged from 1 to 30 with a mean of 85 (Table 75) The share of those rations accounted for by whole cottonseed ranged from 3 to 100 with a mean of 16 (Table 76) It appears therefore that on average dairy feeds formulated with both CSM and whole cottonseed contain a higher percentage of whole cottonseed than of CSM This is just the opposite of the situation for beef cattle
Sources of Information Utilized on Formulating Dairy Cattle Feeds
Over 80 of the dairy cattle respondents indicated that they were familiar with research on feeding CSM to mature dairy cattle (Table 71) Only half however indicated familiarity with such research for pre-ruminant calves Less than 10 of the respondents listed any other research on feeding CSM to other types of dairy cattle (Table 78) The largest number of respondents (137 of 143 respondents) indicated that they utilize university research to obtain information on formulating feeds for dairy cattle followed by industry publications of some type (121 respondents) and university extension service (83 respondents) (Table 79) Only 36 respondents listed other sources of information including primarily personal experience and research (Table 80)
Protein-Related Factors Considered for Balancing Dairy Cattle Rations
Nearly 100 of the dairy cattle respondents indicated that both crude protein level and rumen degradability are factors they consider when balancing rations for dairy cattle a much higher level than is the case for beef cattle (Table 81) Less than half consider amino acid values (61 of 143 respondents) Only 19 respondents indicated that they consider other factors like protein solubility (Table 82)
Dairy cattle respondents indicated a even wider range of escape values (or by-pass values) that they are using for CSM than did beef cattle respondents from 0 to over 80 (Table 83) The mean escape value calculated from the responses is 40 Dairy cattle respondents indicated slightly more
14
confidence in the escape values they are using than was the case for beef (Table 84) Only 22 respondents however considered those escape values to be reliable or extremely reliable The principal single method or source used by respondents for the escape value they use was again the National Research Council (Committee on Animal Nutrition National Academy of Sciences) (Table 85) Book values was the next most frequently mentioned single source of CSM escape values (23) Finally nearly 100 of the respondents indicated an interest in obtaining information on escape values for CSM as processed by different methods (Table 86) The conclusion from the dairy cattle responses is the same as for beef cattle That is there appears to be a lack of reliable information on CSM escape values in the perception of dairy cattle feed formulators and that they are highly interested in obtaining more information in this regard
Gossypol Level Considered Safe for Mature Dairy Cattle and Pre-Ruminant Calves
Dairy cattle respondents appear to have little idea of what the safe levels are for gossypol in mature dairy cattle and pre-ruminant calf feeds First of all only one-third of those who returned surveys even attempted to provide numbers for safe gossypol levels (Tables 87 and 88) Many respondents simply wrote comments such as dont know or not aware of research on safe gossypol level in the margin of the survey beside the question Second those who attempted to answer the questions provided an amazingly wide range of safe gossypol levels from 0 parts per million (ppm) to 7500 ppm for mature dairy cattle and from 0 ppm to 1000 ppm for pre-ruminant calves The mean safe gossypol levels were 609 ppm for mature dairy cattle and 121 ppm for pre-ruminant calves The responses were spread quite evenly between the extremes around the means It should be noted that the research team checked and rechecked the data set for this question to insure there were no errors in data entry
Suggestions for Improving the Usefulness of Cottonseed Meal
Only about 22 of the dairy cattle feed formulators that returned surveys provided suggestions that might improve the value or usefulness of CSM in dairy cattle feed rations (Table 89) Some of the more frequent suggestions dealt with improving the consistency and availability of CSM Several respondents suggested the need for more information on gossypol a worthy suggestion given the results of the previous question
Poultry
The perceptions of poultry feed formulator respondents concerning the use of cottonseed meal differ importantly in many respects from the combined responses over all survey respondents and from those of beef and dairy cattle Many of the differences are likely the result of the distinct dietary needs of ruminant as opposed to non-ruminant animals The salient differences in responses by poultry feed formulators in the 6 general question areas include the following
bull Factors affecting choice of dietary proteins Surprisingly there was little difference in the responses of those indicating that they formulate feed for poultry than for the combined results (or for beef and dairy cattle) regarding the importance of the listed factors (quality price availability consistency and other) affecting the choice of dietary protein (Table 90) A large majority of poultry feed formulators ranked all factors as either important or extremely important The only exception is that consistency was ranked slightly less important by poultry respondents than by respondents in general
bull Cottonseed meal as an alternative protein feed Poultry respondents ranked more protein feeds as higher on the superior-to-CSM scale than was the case for the combined responses
15
(Table 91) In fact the mean rank of all but three of the protein feeds were all at least somewhat higher than was the case for the combined responses The mean rank of several of the other protein feeds as determined by the poultry respondents was much higher than for the combined responses including fish meal poultry by-product meal and soybean meal Poultry by-product meal changed from an inferior to a superior protein feed compared to CSM The protein feed judged by poultry respondents to be most superior to CSM for poultry rations was soybean meal while urea was ranked as most inferior Poultry respondents also appeared to have stronger opinions about whether or not CSM is an alternative to the other listed protein feeds than was the case for the combined responses They overwhelmingly perceived that CSM is not an alternative to many of the other protein feeds including fish meal dried skim milk dried whole milk poultry by-product meal blood meal tankage and urea A larger percentage of poultry respondents than was the case for dairy and beef cattle perceived however that CSM is a definite alternative to many other protein feeds including safflower meal sunflower meal linseed meal peanut meal canola meal feather meal distillers dried grains brewers dried grains and even soybean meal
bull The importance of nutritional and non-nutritional factors Poultry respondents ranked all but two of the listed nutrition-related factors as more important in the choice of CSM over alternative protein feeds for poultry rations than was the case for the combined responses on average (Le comparing mean responses) (Table 92) The highest percentage of poultry respondents ranked gossypol level (62 of the respondents) amino acid balance (59) aflatoxin (58) protein quality (57) and amino acid availability (57) as extremely important in the choice of CSM over alternative protein feeds Only about 5 of the respondents listed other important nutrition-related factors (Table 93) There are few differences however in the poultry responses as compared to the combined responses regarding the importance of non-nutrition-related factors (Table 94) The major difference is a much lower ranking of the importance of palatability in choosing CSM over alternative protein feeds Also a somewhat higher percentage of poultry respondents ranked price as an extremely important non-nutrition-related factor Few other non-nutrition-related factors were listed by the respondents (Table 95)
bull Seasonality of cottonseed meal availability The results for the poultry respondents regarding the months of the year when CSM is not available are highly consistent with those for the combined responses and those for the beef and dairy cattle responses Poultry respondents indicated that May through September are the months of least availability of CSM (Table 96) But likely because of the shorter production cycle for poultry than for cattle poultry respondents indicated that CSM needs to be available in almost every month (but slightly less so in August and September) for CSM to compete effectively with alternative protein feeds (Table 97) For poultry therefore the indication is that poultry feed formulators may perceive an availability problem which inhibits greater use of CSM in poultry rations to some extent
bull Reasons for the selection and non-selection of cottonseed meal Again price and availability are the number one and number two reasons respectively cited by poultry respondents for which CSM is selected as a feed ingredient (Table 98) Protein quality ranked third on their list followed closely by phosphorous content The top reason that CSM is not selected according to the poultry respondents was pricevalue (Table 99) About tied for second place were gossypol content and availability More respondents ranked availability as the second reason than for gossypol content but more respondents listed gossypol first The amino acid level was listed as a distant fourth reason for which CSM is not selected as a feed ingredient Price is again the key CSM characteristic that poultry respondents indicated must change in
16
order for CSM to be used more frequently in poultry rations (Table 100) Gossypol was clearly considered to be the second most important characteristic that must change Availability was ranked as either first or second by all respondents who listed it as a characteristic that must change
bull Source of chemical analyses for cottonseed meal The results for the chemical analyses performed by poultry respondents are similar to those of both the combined results and those of the beef and dairy cattle results The primary analysis routinely performed by the poultry respondents is crude protein (51 of 55 respondents) followed by fat (40 respondents) fiber (37 respondents) and aflatoxin (31 respondents) (Tables 101 and 102) The primary analytical values supplied to the poultry respondents also included crude protein fiber and fat (Table 103) A third of the poultry respondents indicated that their CSM supplier does not provide them with any analytical values Once again even though aflatoxin was ranked as an extremely important nutrition-related factor in the choice of CSM as a feed component only I respondent obtains an analytical value for aflatoxin from his CSM supplier and only a little over half routinely perform their own aflatoxin analyses
Poultry sample members were asked some specific questions regarding the use of CSM in poultry feed formulations in 5 general areas I) problems resulting from feeding a ration with CSM to the various poultry types 2) specific information on several key nutrition-related factors affecting the use of CSM in poultry rations 3) sources of information utilized on formulating poultry feeds 4) CSM price and value and 5) an open-ended question soliciting suggestions to improve the usefulness or value of CSM for poultry feed formulations
Problems from Feeding CSM Rations to Poultry
The majority of poultry respondents indicated no knowledge of any problems associated with feeding a ration containing CSM to poultry (Table 104) Only 14 of the respondents indicated problems with broilers less than 7 for breeding flocks and about 3 for turkeys Over a third however indicated that they had knowledge of such problems with layers The number one problem reported was yolk molting and discoloration primarily in layer rations (Table 105) A few respondents indicated problems with depressed growth associated with broiler feeds containing CSM
Information on Key Nutrition-Related Factors for Poultry Rations
The survey sample members were asked to respond to a number of specific questions related to nutritional factors that affect the use of CSM in poultry rations including protein energy fat gossypol and synthetic amino acids They were then asked to indicate their perception of the overall feeding value of a standard 41 protein CSM compared to that of a standard 44 protein soybean meal The questions were designed primarily to determine the extent of knowledge among feed formulators concerning these factors as they relate to the use of CSM and the relative feeding value of CSM
Sample members were asked to respond to two questions regarding protein in poultry feed rations They were first asked to indicate the specific protein-related factors that they consider when balancing rations for poultry They were given a list of three factors (crude protein level amino acid content and amino acid availability) They were also allowed to specify any other protein-related factors they consider when balancing poultry rations They were then asked to indicate the crude protein levels they would prefer for cottonseed meal and were given a choice of four levels (3641 (standard) 44 and 48) and allowed to suggest any other preference for crude protein level
17
Almost all poultry respondents indicated that they consider amino acid content and availability when balancing feed rations with fewer responding that they consider the crude protein level (Table 106) Other protein-related factors listed by the respondents included amino acid balance protein digestibility and energy levels (Table 107) With regard to preferred crude protein level for CSM over half of the poultry respondents indicated a preference for 48 crude protein (Table 108) About 27 of the respondents were satisfied with the standard 41 level and 20 indicated a preference for a 44 protein CSM No respondents preferred anything less than the standard 41
With respect to energy levels the sample members were asked to indicate what they considered to be the normal maximum and minimum energy levels for protein feeds for broilers layers turkeys and breeding flock As Table 109 indicates the responses varied widely with little or no indication of a mode (most frequent response) in most cases For broilers the maximum (in K Cals DE per pound) ranged from 0 to 1800 and the minimum from 850 to 1700 with a mean maximum of 1436 and a mean minimum of 1276 For layers the maximum (in K Cals DE per pound) ranged from 1000 to 1800 and the minimum from 800 to 1500 with a mean maximum of 1347 and a mean minimum of 1187 For turkeys the maximum (in K Cals DE per pound) ranged from 1100 to 1725 and the minimum from 850 to 1700 with a mean maximum of 1334 and a mean minimum of 1261 For breeding flocks the maximum (in K Cals DE per pound) ranged from 1000 to 1600 and the minimum from 750 to 1600 with a mean maximum of 1328 and a mean minimum of 1159 Given the disparity in the responses it seems clear that there is little common concept of the normal maximum and minimum energy levels for protein feeds
Sample members similarly were asked to indicate the minimum and maximum fat levels they considered critical for protein feeds Although the range of responses was still quite wide there appeared to be more uniformity in responses to this question than the one for energy (Table 110) The maximum fat levels (ether extract as fed basis) indicated by the respondents ranged from 1 to 15 or 20 for most poultry types The minimums ranged from 0 to 15 The mean minimum levels of fat for all poultry types was about 3 The mean maximum ranged from 6 to 82 depending on the poultry type
Sample members were asked to indicate the level of gossypol they considered safe for poultry rations The responses again varied widely from a low of 0 ppm up to a high of 300 ppm for all poultry types (Table III) The highest mean level of gossypol as calculated from the responses to the question were 104 ppm for broilers and 91 ppm for turkeys For layers and breeding flocks the mean levels were much lower at 57 ppm and 54 ppm respectively
The questionnaire also asked the sample members to indicate if they use or would use synthetic amino acids where economical The response was that nearly 100 of all poultry respondents indicated that they have or would use synthetic amino acids in this situation (Table 112) This suggests little real aversion on the part of feed formulators to utilize synthetic amino acids in least cost poultry formulations
To obtain some insight on the general perception of poultry formulators regarding CSM the sample members were asked to indicate the overall feeding value of a standard 41 protein CSM compared to that of a standard 44 protein soybean meal in their opinion on percentage basis They were given the choice of 5 ranges from under 70 to over 100 in 10 increments (see Table 113 for the actual ranges used) Nearly 80 of the respondents indicated that CSM has an overall feeding value of under 90 of that of soybean meal Given the five choices offered to respondents the mean feeding value was around 80
18
Sources of Information Utilized on Formulating Poultry Feeds
About two-thirds of the poultry respondents indicated that they were familiar with research on feeding CSM to broilers and layers (Table 114) Only half however indicated familiarity with such research for turkeys and only a little over a third for breeding flocks Less than 10 of the respondents listed any other research on feeding CSM to other types of poultry (Table 115) To obtain information on formulating feeds for poultry the largest number of respondents (52 of the 55 respondents) indicated that they utilize university research followed by industry publications of some type (45 respondents) university extension services (26 respondents) and government agencies (20 respondents) (Table 116) Only 17 respondents listed other sources of information including primarily personal experience and research (Table 117)
Cottonseed Meal Price and Value
To get some idea concerning the poultry respondents perceptions of the value of CSM particularly with respect to soybean meal sample members were asked 1) if they would be willing to pay a premium per unit of protein for CSM with more than a standard 41 protein and 2) if gossypol and fiber were sufficiently low on average what percent of the cost of soybean meal they would be willing to pay for CSM
With respect to the first question only about half the respondents indicated a willingness to pay a premium for a CSM with more than 41 protein despite the fact that 75 of them indicated earlier that they would prefer a CSM with a higher crude protein level (Table 118) Thus at least 25 of the respondents prefer a higher protein level CSM but would not be willing to pay a premium to get it
In response to the second question poultry respondents indicated that they would only be willing to pay an average of about 76 of the cost of soybean meal for a CSM with a sufficiently low level of gossypol and fiber (Table 119) The range around that average however was fairly large from 50 to 95 Because CSM has traded at about 91 of the value of soybean meal on the market on a protein equivalent basis and about 85 on an unadjusted basis on average in each year since 1984 either poultry respondents are currently unaware of the historical CSM to soybean meal price relationship or they are indicating that the current CSM market price relative to that of soybean meal is substantially above the levels that most find acceptable
Suggestions for Improving the Usefulness of Cottonseed Meal
Only about 27 of the poultry feed formulators that returned surveys provided suggestions that might improve the value or usefulness of CSM in poultry feed rations (Table 120) Some of the more frequent suggestions included the need for more information on the use of CSM in poultry rations increased availability of CSM and nutrient guarantees
Catfish
The perceptions of catfish feed formulator respondents concerning the use of cottonseed meal correspond closely to those of the poultry respondents likely because of the similar dietary needs of non-ruminant animals The salient differences in responses by catfish feed formulators in the 6 general question areas included on this section of the surveys include the following
bull Factors affecting choice of dietary proteins There were no differences in the responses of those indicating that they formulate feed for catfish than for poultry regarding the importance
19
of the listed factors (quality price availability consistency and other) affecting the choice of dietary protein (Table 121) A large majority of catfish respondents ranked all factors as either important or extremely important as did poultry respondents
bull Cottonseed meal as an alternative protein feed As was the case for poultry catfish respondents ranked more protein feeds as higher on the superior-to-CSM scale than was the case for the combined responses (Table 122) Catfish feeders however ranked meat and bone meal and blood meal as even more superior to CSM than did poultry respondents The protein feeds that catfish respondents ranked as roughly similar to CSM included tankage feather meal peanut meal linseed meal corn gluten meal brewers dried grains distillers dried grains sunflower meal safflower meal and canola meal Catfish respondents also appeared to have nearly as strong views about whether or not CSM is an alternative to the other listed protein feeds as did poultry respondents They perceived that CSM is not an alternative to many of the other protein feeds including blood meal dried whole milk meat and bone meal and dried skim milk Catfish respondents also perceived however that CSM is a definite alternative to many other protein feeds including safflower meal canola meal peanut meal sunflower meal linseed meal distillers dried grains brewers dried grains tankage soybean meal wheat middlings corn gluten meal urea and feather meal
bull The importance of nutritional and non-nutritional factors The responses for catfish with regard to the importance of nutrition-related and non-nutrition-related factors in choosing CSM as a component of catfish feeds were roughly similar to those for poultry (Table 123) The salient differences were that a larger percentage of catfish respondents ranked energy level fat level and fiber level as important or extremely important and a much larger percentage ranked aflatoxin as extremely important One major difference of the catfish responses regarding the importance of non-nutrition-related factors from those of poultry is that palatability is much mOre of a concern to catfish feeders (Table 124) Bin space is less important to catfish respondents and service from the CSM industry is more important to them
bull Seasonality of cottonseed meal availability The results for the catfish respondents regarding the months of the year when CSM is not available were generally consistent with those for poultry except that May and June were perceived as less problematic for obtaining CSM supplies by the catfish respondents (Table 125) Catfish formulators perceive that CSM needs to be more available in April through October than during the rest of the year to be competitive with other protein feeds (Table 126) This suggests the perception on the part of catfish feed formulators of a CSM availability problem during about the first half of any given year
bull Reasons for the selection and non-selection of cottonseed meal Pricevalue is the number one reason cited by catfish respondents for which CSM is selected as a feed ingredient followed by protein quality and palatability (Table 127) The top reason that CSM is not selected according to the catfish respondents is pricevalue followed by quality and gossypol level (Table 128) Gossypol level is the key CSM characteristic that catfish respondents indicated must change in order for CSM to be used more frequently in catfish rations (Table 129) Quality was clearly considered to be the second most important characteristic that must change followed by aflatoxin level This is the only animal species for which price was not the number one characteristic cited that would have to change and was not even listed among the top three responses The implication is that catfish feed formulators may not consider the price of cottonseed meal to be out of line with their needs and thus do not consider price to be a particular problem for the use of CSM in catfish rations A word of caution is in order
20
to avoid taking this conclusion too far because of the relatively few number of catfish feed formulators in the sample
bull Source of chemical analyses for cottonseed meal The results for the chemical analyses performed by poultry respondents are similar to those of poultry as well as those of both the combined results and the beef and dairy cattle results The primary analysis routinely performed by the catfish respondents is crude protein followed by fat fiber aflatoxin and gossypol (Tables 130 and 131) The primary analytical values supplied to the catfish respondents also included crude protein fiber and fat (Table 132) Only 2 of the II catfish respondents indicated that their CSM supplier does not provide them with any analytical values Even though gossypol was ranked as an extremely important nutrition-related factor in the choice of CSM as a feed component and the number one CSM characteristic that needs to change only 5 of the II respondents routinely perform gossypol analyses None of catfish respondents obtain analytical values for aflatoxin from their CSM supplier
As for poultry catfish sample members were asked some specific Questions regarding the use of CSM in catfish feed formulations in 5 general areas 1) problems resulting from feeding a ration with CSM to the various catfish types 2) specific information on several key nutrition-related factors affecting the use of CSM in catfish rations 3) sources of information utilized on formulating catfish feeds 4) CSM price and value and 5) an open-ended Question soliciting suggestions to improve the usefulness or value of CSM for catfish feed formulations
Problems from Feeding CSM Rations to Catfish
Absolutely no catfish respondents indicated any knowledge of any problems associated with feeding a ration containing CSM to catfish (Table 133)
Information on Key Nutrition-Related Factors for Catfish Rations
As for poultry the survey sample members were asked to respond to a number of specific Questions related to nutritional factors that affect the use of CSM in catfish rations including protein energy fat gossypol and synthetic amino acids They were then asked to indicate their perception of the overall feeding value of a standard 41 protein CSM compared to that of a standard 44 protein soybean meal Just as for poultry these Questions were designed primarily to determine the extent of knowledge among catfish feed formulators concerning these factors as they relate to the use of CSM and the relative feeding value of CSM
Sample members were asked to respond to two Questions regarding protein in catfish feed rations They were first asked to indicate the specific protein-related factors that they consider when balancing rations for catfish They were given the same list of three factors (crude protein level amino acid content and amino acid availability) to choose from that the poultry sample members were given Again they were also allowed to specify any other protein-related factors they consider when balancing catfish rations They were then asked to indicate the crude protein levels they would prefer for CSM and were given the same choice of four levels as the poultry sample members (36 41 (standard) 44 and 48) and allowed to suggest any other preference for crude protein level In contrast to poultry the largest percentage of catfish respondents indicated that they consider amino acid availability (10 of the 11 catfish respondents) rather than the content when balancing catfish rations (Table 134) The second largest percentage consider crude protein level (9 respondents) also a different result from poultry
21
With regard to the crude protein level for CSM preferred by catfish respondents about 43 indicated a preference for 48 crude protein (Table 135) About 20 of the respondents were satisfied with the standard 41 level and nearly 30 indicated a preference for a 44 protein CSM No respondents preferred anything less than the standard 41 The mean preferred crude protein level was about 42
With respect to energy levels the catfish sample members were asked to indicate what they considered to be the normal maximum and minimum energy levels for protein feeds for fingerlings grow out stock brood stock and fries Despite the low number of catfish respondents the answers to this question were widely divergent (Table 136) For fingerlings the maximum (in K Cals DE per pound) ranged from 1250 to 1800 and the minimum from 2 to 1500 with a mean maximum of 1525 and a mean minimum of 834 For grow out stock the maximum (in K Cals DE per pound) ranged from only 1500 to 1600 and the minimum from 1 to 1300 with a mean maximum of 1550 and a mean minimum of 750 For catfish brood stock the maximum (in K Cals DE per pound) ranged from 1300 to 1700 and the minimum from 1200 to 1400 with a mean maximum of 1500 and a mean minimum of 1300 For fries the maximum (in K Cals DE per pound) ranged from 1250 to 1800 and the minimum from 900 to 1500 with a mean maximum of 1525 and a mean minimum of 1200 Given the disparity in these responses it seems clear again for catfish feed formulators that there is little common concept of the normal maximum and minimum energy levels for protein feeds
Catfish sample members similarly were asked to indicate the minimum and maximum fat levels they considered critical for protein feeds As with poultry the range of responses was still quite wide but there also appeared to be more uniformity in responses to this question than the one for energy level (Table 137) The maximum fat levels (ether extract as fed basis) indicated by the respondents again ranged from 1 to 15 for most catfish types as was the case for poultry The mean minimum levels of fat for all catfish types ranged from about 3 to 5 The mean maximum ranged from 6 to 10 aCrOSS the different catfish types
Catfish sample members were also asked to indicate the level of gossypol they considered safe for catfish rations The responses again varied widely from a low of 0 ppm up to a high of 300 ppm for some catfish types (Table 138) The two highest mean safe levels of gossypol were 97 ppm for grow out stock and 83 ppm for brood stock For fingerlings and fries the safe maximum mean levels were much lower at 44 ppm and 23 ppm respectively
The questionnaire also asked the sample members to indicate if they use or would use synthetic amino acids where economical The response was that 83 (all but 2) of the catfish respondents indicated that they have or would use synthetic amino acids in this situation (Table 139) This suggests little real aversion on the part of feed formulators to utilize synthetic amino acids in least cost catfish formulations
To obtain some insight on the general perception of catfish formulators regarding CSM the sample members were asked to indicate their opinion of the overall feeding value of a standard 41 protein CSM compared to that of a standard 44 protein soybean meal expressed on a percentage basis They were given a choice of 5 ranges from under 70 of the feeding value of soybean meal to over 100 in 10 increments (see Table 140 for the actual ranges used) All but one of the catfish respondents indicated that CSM has an overall feeding value of under 90 of that of soybean meal Given the five choices offered to respondents the mean feeding value of CSM relative to that of soybean meal was around 80
22
Sources of Information UtiJized on Formulating Catfish Feeds
Only about half of the catfish respondents indicated that they were familiar with research on feeding CSM to grow out stock and only a third were familiar with research on fingerlings (Table 141) Only 2 respondents were familiar with any research on feeding CSM to brood stock and fries To obtain information on formulating feeds for catfish the largest number of respondents indicated that they utilize university research and industry publications of some type (Table 142)
Cottonseed Meal Price and Value
Catfish sample members were also asked two Questions to get some idea concerning their perception of the value of CSM particularly with respect to soybean meal 1) if they would be willing to pay a premium per unit of protein for CSM with more than a standard 41 protein and 2) if gossypol and fiber were sufficiently low on average what percent of the cost of soybean meal would they be willing to pay for CSM
With respect to the first Question 75 of the catfish respondents indicated a willingness to pay a premium for a CSM with more than 41 protein which is consistent with their earlier responses that they would prefer a CSM with a higher crude protein level (Table 143)
In response to the second Question catfish respondents indicated that they would only be willing to pay an average of about 82 of the cost of soybean meal for a CSM with a sufficiently low level of gossypol and fiber (Table 144) The range around that average was more narrow than for poultry from 70 to 100 This is more consistent with the ratio of CSM price to soybean meal price that has existed over the last 7 or 8 years on average
Suggestions for Improving the Usefulness of Cottonseed Meal
Only three catfish respondents offered suggestions for improving the usefulness or value of CSM for catfish rations The three suggestions included I) providing a more consistent product in price and Quality 2) providing a premium Quality toxin-free high protein low-fat product superior to soybean meal and 3) eliminating the CHO fraction (Table 145)
Comparisons Among Animal Species
In order to highlight the salient differences in responses with respect to the various animal species the mean responses to Questions that are common among all surveys regarding CSM use as a feed ingredient were compared and analyzed An analysis of variance (ANOY A) was also done to detect statistically significant differences in the mean responses to each Question by animal specie Comparisons are made among the mean responses to all Questions in the 6 general areas to which all sample members were asked to respond regardless of the animal specie(s) for which they formulate feeds 1) the particular factors affecting their choice of dietary proteins for formulated feeds 2) the extent to which CSM is considered to be an alternative to selected protein feeds 3) the importance of nutritional and non-nutritional factors in their decisions to use CSM rather than alternative dietary proteins in their feed formulations 4) the seasonality of CSM availability 5) the specific reasons for the selection and non-selection of CSM for use in the feeds they formulate and 6) the source of CSM chemical analyses used by the respondents Where appropriate ANOY A results are also indicated
23
Factors Affecting Choice of Dietary Proteins
As discussed earlier all members of the final sample regardless of the animal species for which they formulate feeds were asked to rank the importance of four general factors in their choice of a dietary protein for their feed formulations on a scale of I to 7 (from extremely unimportant to extremely important respectively) 1) quality 2) price 3) availability and 4) consistency Comparing the results across animal types reveals few significant differences in the importance attached to any of the four factors by the responding formulators of the various animal specie feeds (ie comparing results horizontally in Table 146) But as pointed out in an earlier section the mean rankings for quality are all higher than those for the other factors while the mean rankings of price are all lower than those for most other factors across all animal types In other words the respondents consistently ranked quality highest on the scale of importance followed in order by consistency availability and price
Cottonseed Meal As An Alternative Protein Feed
Recall that the sample members were asked to rank various selected protein feeds on a scale of 1 to 7 as inferior or superior to CSM in an overall sense for use in feed formulations A second question required respondents to indicate whether or not they considered CSM to be an alternative to each of the 20 listed protein feeds A comparison of the mean ran kings and ANOV A results across animal types indicates substantial agreement among the respondents regarding the ranking of CSM as an alternative to some animal feeds and substantial disagreement with respect to CSM as an alternative to many others (Table 147) Respondents over all animal types tended to agree that certain feeds and in particular the higher crude-protein-content feeds are clearly superior to CSM including dried skim milk meat and bone meal fish meal blood meal soybean meal dried whole milk and corn gluten feed There was a statistically different deviation in the extent to which respondents for some animal species regarded those meals as superior however For example catfish respondents ranked meat and bone meal fish meal poultry by-products blood meal soybean meal and corn gluten meal higher than did respondents for the ruminant animals The same was roughly the case for poultry Beef and dairy cattle respondents tended to rank all other protein feeds as less superior (ie more inferior) to CSM There was also substantial agreement that CSM was about the same as tankage peanut meal linseed meal and brewers and distillers dried grains but superior to some extent over the other feeds particularly those lower in crude protein including dehydrated alfalfa sunflower meal wheat middlings safflower meal canola meal feather meal and urea Beef and dairy cattle respondents agreed that CSM can be considered an alternative to nearly all the protein feeds except perhaps skim and whole dried milk Poultry and catfish respondents indicated CSM is an alternative to fewer of the other protein feeds
The Importance of Nutritional and Non-Nutritional Factors
Respondents also ranked the importance of specific nutrition-related and non-nutritionshyrelated factors in choosing cottonseed meal as a component of the feeds they formulate on a scale of extremely unimportant to extremely important (a scale of I to 7 respectively) Comparing the mean rankings by the respondents reveals that poultry and catfish feed formulators clearly consider proteinshyrelated factors and gossypol level to be more important than do beef and dairy feed formulators (Table 148) Fiber level is also of more importance to formulators of catfish feed Interestingly the importance of fiber was not ranked significantly higher by poultry feed formulators than by beef and dairy cattle feed formulators At the same time aflatoxin was clearly ranked by all respondents as the most important factor affecting the choice of CSM as a feed ingredient irrespective of the animal specie for which the ration is intended
24
For the non-nutritional factors an analysis of the mean rankings indicates few significant differences in the responses across animal species with respect to each individual factor listed (Table 149) The most notable exception is that poultry respondents ranked palatability significantly less important than did any of the other respondents for the other animal species Finally catfish respondents perceived that service by the CSM industry was more important for them than did the respondents for the other animal species
Seasonality of Cottonseed Meal Availability
The respondents across all animal species indicated that CSM is least available between about May and October likely reflecting the increasing shortages of cottonseed meal supply just prior to the cotton harvest in the fall (Figure 20) At the same time however the beef cattle dairy cattle and poultry respondents all indicated that there is less need for CSM to be available during approximately those same months in order to compete effectively with other protein feeds (Figure 21) This suggest that the seasonality of supply may not represent an important constraint to competitiveness and growth possibilities of CSM as a feed ingredient Interestingly catfish respondents suggested a largely inverse pattern of the times of the year when CSM needs to be available to compete effectively with other protein feeds as a catfish feed ingredient Possible explanations of this phenomenon include I) the protein feed needs of catfish feed formulators peak in the late spring and summer months when supply is less available 2) catfish feed formulators are located such that CSM is not easily obtainable particularly during short supply years or 3) formulators of feed for other animal species have longer experience in using CSM and have adjusted their formulation to the pattern of CSM supply availability In any case it should be remembered that there are relatively few catfish feed formulators in the sample so that their joint responses may not be truly representative of all catfish feed formulators In this case this difference in their responses may mean little
Reasons for the Selection and Non-Selection of Cottonseed Meal
Respondents across animal species were quite consistent in their ranking of the top reasons that CSM is included in feed formulations (Table 150) They overwhelmingly ranked price as the top reason followed generally by availability and protein quality Catfish respondents differed somewhat from that order ranking protein quality second and palatability as third Availability was ranked fourth by catfish respondents The top reason all respondents listed for which CSM is not included in feed formulations was also price (Table lSI) Beef and cattle respondents ranked availability as second but poultry respondents ranked gossypol second while catfish respondents ranked protein quality second A vailability ranked only as the third reason that CSM is not selected by poultry respondents and fourth by catfish respondents Gossypol ranked either third or fourth for all animal species except poultry for which gossypol appears to be a more important reason for not including CSM in poultry feed formulations The question regarding the characteristics of CSM that would have to change in order for it to be selected more frequently as a feed ingredient elicited about the same responses as those for the previous question concerning why CSM is not included in feed formulations (Table 152) The top characteristic that would have to change in the opinion of most respondents is price Catfish respondents however listed price extremely low on their list suggesting that other factors are more of a constraint to CSM use in their opinion They ranked gossypol as the number one characteristic that would have to change Availability appeared to be more of a concern to beef and dairy feed formulators than for poultry and catfish formulators
25
Source of Chemical Analyses for Cottonseed Meal
About the same percentage of respondents across animal species perform analytical tests for aflatoxin crude protein fat fiber and gossypol (Figure 22) The only noticeable differences were for aflatoxin and gossypol for which about half the percentage of dairy and beef respondents compared to catfish respondents reported that they routinely perform tests A higher percentage of poultry respondents also appear to perform tests for aflatoxin and gossypol than is the case for beef or cattle respondents Crude protein is tested for by the highest percentage of respondents for all animal species while gossypol is tested for by the smallest percentage of all respondent groups except catfish CSM suppliers are more likely to provide feed formulators with analytical values for crude protein fat and fiber than for aflatoxin or gossypol (Figure 23) A sizeable percentage of the respondents across all animal types reported that their CSM supplier provides no analytical values whatsoever
Summary ofMajor Findings
Of the reams of information normally provided by a study like this relatively little is usually new or profound And of what can be found that appears important only some is little more than interesting or particularly useful Before turning to a discussion of the implications of the study results the major findings across animal groups are briefly summarized first Sifting through the many tables figures and data sets the main findings of the study appear to be the following
bull Quality is the most important factor affecting the choice of dietary proteins by feed formulators followed by consistency and availability Price is the least important of the four factors in making general decisions regarding dietary proteins for animal diets
bull Once feed formulators have set the general parameters for use of dietary proteins in their formulations however price is the most important factor determining the choice among alternative dietary proteins to satisfy the general parameters for dietary protein use in feed formulations
bull When considering whether or not to use CSM as the dietary protein in feeds the nutritional factors of most concern to formulators of feed for non-ruminant animals (poultry and catfish) appear to be protein-related For formulators of ruminant (beef and dairy cattle) feeds aflatoxin level and rumen degradability are the most important nutritional factors
bull The most important non-nutritional factors affecting feed formulators decisions regarding whether or not to use CSM are I) price 2) availability 3) consistent quality and 4) palatability in that order
bull Non-nutritional factors are more important than nutritional factors in the choice of CSM over alternative feeds to fill the dietary protein requirements of feed formulations In general price and availability were ranked above protein quality and other nutrition-related factors as reasons why CSM is and is not chosen as a feed ingredient over alternatives Price and availability were also cited as the characteristics that most need to change in order for CSM to be selected as a feed ingredient more frequently
bull CSM is generally considered to be inferior to higher protein feedstuffs and superior to lower protein feedstuffs This generalization however does not hold for all feeds and all animal types Formulators of ruminant animal feeds ranked many of the higher protein feeds more on a par with CSM than did formulators of non-ruminant animal feeds
26
bull The seasonality of CSM availability is both a positive and a negative factor affecting the use of CSM rather than alternative protein feeds in animal feed rations That is CSM is obviously more likely to be selected as a feed ingredient during months of greater availability than during the months of lower availability In general however the survey responses indicate that CSM is normally available when feed formulators perceive that it needs to be available One word of caution It may be that a higher percentage of CSM users agreed to participate in this survey than those who are currently not using CSM Those who are current CSM users may well have already adjusted their feed purchasing patterns and operations to reflect the seasonal changes in the availability of CSM Consequently current CSM users may perceive less of an availability problem than those who are not currently using CSM In this case the responses to these questions may not be truly representative of the perception of the availability of CSM by feed formulators in general
bull There is a tremendous disparity in the perception of respondents as to the appropriate levels of several key nutrition-related factors for specific livestock rations including energy levels fat levels gossypol levels and escape values (ruminants only) for cottonseed meal For each animal specie the range of variation in the perceived acceptable levels of each of these factors was extremely wide The obvious conclusion is that feed formulators generally lack adequate and reliable information on many factors which are crucial in efficient feed formulation and which have a significant impact on the choice of CSM as a feed ingredient
PROBLEMS AND OPPORTUNITIES FOR EXPANDING COTTONSEED MEAL USE
CSM is somewhat unique among vegetable protein meals in that it is the product of a byshyproduct The volume of the by-product cottonseed available for crushing and the potential supply of CSM depend more on the dynamics of cotton supply and demand than on forces specific to CSM markets This mean that market signals from feed formulators and livestock feeders regarding desired values and characteristics of protein meals likely have little impact on the potential CSM market supply
Since the mid-1970s the share of the annual production of cottonseed fed directly to ruminant livestock has increased steadily from about 5 in 1974 to nearly 40 in 1990 (Figure 24) The consequence has been a marked decline both in the share of the available supply of cottonseed that is crushed and in the ratio of actual to potential cottonseed meal output An increase in the demand for CSM therefore will either bid up the market price of CSM with no additional volume actually used or increase the cottonseed crush to feed use ratio (or some combination thereof) There will be little or no effect on the total amount of cottonseed available
The intent of efforts to expand the market for any commodity is to effect an increase in sales at a higher price For a commodity with a relatively fixed supply the major result of an expansion in demand is solely an increase in price because supply cannot increase to allow an increase in use For a commodity with an unlimited supply successful market expansion efforts simply increase use to the extent of the promotion with no increase in price For a commodity with a supply somewhere in between those two extremes successful market expansion will increase both the price and quantity used Although the situation for cottonseed meal is closer to the fixed supply end of the spectrum market expansion efforts can increase the use of cottonseed meal through an increase in the crush-toshy
27
feed cottonseed use ratio This ratio will increase as the profitability of crushing vs alternative uses of the seed increase
The results of this survey however indicate both some problems and possible opportunities for expanding cottonseed meal use After briefly summarizing the major obstacles as identified in the study the major opportunities for expanding use of cottonseed meal will be discussed
Problems for Expanding Cottonseed Meal Use
The major problems for expanding CSM use are generally well known and verified by the survey results The major problems that would hinder efforts to expand cottonseed meal use identified in the study included primarily the following
bull Price and availability of CSM are the major factors affecting the selection or non-selection of CSM as an ingredient of feed formulations regardless of animal specie These nonshynutritional factors were judged to be more important than nutritional factors in selecting CSM as a feed ingredient Unfortunately neither the price nor the availability of CSM can be controlled or altered substantially or directly by market expansion efforts Some efforts to improve availability may be possible as discussed in the next section
bull CSM is perceived to be inferior in an overall sense to a number of key protein feeds CSM was judged by the survey respondents to be clearly superior in aggregate to only 5 of 20 potential alternate protein feeds Such an image could work against efforts to expand CSM use
bull Gossypol level is one of the top reasons that CSM is not used more frequently particularly in non-ruminant feed rations The level of gossypol is a unique characteristic of CSM that obviously cannot be changed through market expansion activities
bull Several other specific characteristics of CSM would likely need to change for CSM to be selected more frequently as a feed ingredient including amino acid balance energy level aflatoxin level and protein quality As with gossypol changes in these characteristics are out of the realm of market expansion programs
bull Feed formulators generally lack adequate and reliable information on many factors which are crucial in efficient feed formulation and which likely have a significant impact on the choice of protein feedstuffs The use of CSM in livestock feed rations is likely restricted by the wide disparity in the perception of feed formulators regarding the appropriate levels of several key nutrition-related factors for specific livestock rations including energy levels fat levels gossypol levels and escape values (ruminants only) for cottonseed meal
bull Over 75 of dairy cattle feed formulators and nearly half of beef cattle feed formulators utilize whole fuzzy cottonseed to some extent in some of the feed rations they formulate Relatively few reported using utilizing both CSM and whole cottonseed in the same ration A main attraction of the use of whole fuzzy cottonseed as opposed to cottonseed meal is the fiber content Indeed the use of whole delinted cottonseed in cattle feed rations is much lower
28
Opportunities for Expanding Use of Cottonseed Meal
There are essentially only two basic tools to expand the market for any commodity l market development and 2) enhancing the efficiency of the marketing system Market development involves a wide range of activities including primarily new product development and product differentiation In new product development the effort is to develop new products or characteristics of products that appeal to different segments of consumers An example might be research leading to the elimination of gossypol in cottonseed meal which could further open up the non-ruminant feed industry to cottonseed meal
Product differentiation on the other hand encompasses those activities designed to create a user preference for or loyalty to a commodity Product differentiation occurs in two major forms 1) advertising and 2) variation in design and quality of product The primary purpose of advertising is to create user preference for a commodity and convince users of the superiority of a product over competing products Actual physical differences in the product are not necessary to successfully differentiate it from competing products It is sufficient only that users believe that some superiority exists Advertising often intends to create an image of superior quality because such images are harder to imitate or successfully counter than physically unique features Successful differentiation of a product means that users become less sensitive to price changes more willing to pay a higher price for the same quantity because they prefer the product and are loyal to it in the face of price increases In other words users are willing to pay more for the same amount because advertising if successful creates a preference for the product over competing products
Variations in quality and design are usually used along with advertising to differentiate the product of one seller from that of another Such variations are often necessary to help create the superior images desired andor attract new sets of consumers
Often barriers exist in a marketing system that hinder the efficient functioning of the market and restrict the flow of commodities from sellers to users Enhancing the efficiency of the marketing system through eliminating such barriers can lead to an expansion in the use of a commodity One of the primary requirements of an efficiently functioning market is that sellers and users possess adequate and accurate information regarding the product its characteristics availability sources uses and value among other things Inadequate or inaccurate information regarding a particular product and other market characteristics can divert demand to alternative products with which users may be more familiar regardless of whether or not those products are better in some sense
The concept and importance of enhancing market efficiency in this regard can be illustrated by comparing the flow of information about a product and market conditions with a radio broadcasting system The efficiency of such a system depends on how accurately the microphone and other equipment record sound how accurately and rapidly that sound is transmitted to a radio receiver and how accurately the receiver brings sound to the listener A breakdown anywhere along the line in that system will simply mean that the message of the broadcast does not get from the radio station to the listener Also if the message gets through but static interferes with the transmission the listener might only receive part of the message or a garbled message The listeners impressions and actions consequently might be quite different than if he had received the message intended In quite the same manner the flow of a commodity from producers to users is affected by how rapidly and accurately market information is evaluated and how accurately and rapidly this information is transmitted to and among producers and users Any breakdown or static in the system would result in a smaller and more obstructed flow of the commodity to users than if the market operated more efficiently
29
The survey results suggests possible opportunities for expanding CSM use through market development and enhancing market efficiency Market development opportunities may be limited because of the nature of the CSM supply situation Nevertheless expansion of CSM use is possible through a reduction in direct feeding of cottonseed so that opportunities for expanding use through market expansion efforts should not be discounted Efforts to enhance the adequacy and accuracy of information regarding the use of CSM as a feed ingredient however may well be the most effective means of promoting an expansion of use or enhancement of the value of CSM
Opportunities for Expansion through Market Development
Although many product development opportunities likely exist for CSM the survey basically focused on the image of CSM in the perception of feed formulators If a market development approach to expanding the use of CSM as an ingredient of animal feed formulations has any chance of success the survey results suggest that the following components of such a strategy will be crucial
bull Product quality and consistency and an improved image of availability must be the major targets of promotion efforts The survey responses across all animal types unequivocally indicated that these three factors are the prime considerations in making general decisions regarding dietary proteins for animal rations Price only becomes a factor in specific decisions regarding the particular protein feed to use to fill the dietary protein requirements of feed formulations after these general concerns are addressed Creating an image of quality consistency and availability for CSM is a necessary first step to expanding use and enhancing value
bull CSM use expansion efforts must focus to some extent on reducing the direct feeding of whole cottonseed to beef and dairy cattle Reductions in direct feeding is the only chance for an increase in supply of CSM to fuel expanded use in newer markets such as catfish and poultry feeding Also because beef and dairy cattle are major users of cottonseed meal a decrease in feeding of whole cottonseed in favor of CSM would significantly expand use
bull Separate CSM market promotion messages must be developed to address the very different needs and concerns of ruminant vs non-ruminant feed formulators The survey results clearly indicate that many nutritional and non-nutritional factors are more important for nonshyruminant feed formulators than for ruminant feed formulators and vice versa
bull The nutrition-related content of CSM market promotion messages must emphasize primarily positive aspects of CSM protein quality amino acid balance and amino acid availability as well as an accurate understanding of appropriate gossypol and aflatoxin levels Many of these factors however are more important for non-ruminant rather than ruminant feed formulators which must be accounted for in designing appropriate messages for feed formulators of each animal type
bull The non-nutrition-related content of CSM market promotion messages may well be the most important and must emphasize primarily the positive aspects of price availability consistency of quality and storability The survey results attached a relatively high level of importance also to nutrient guarantees Although not scoring particularly high in the responses services available from the CSM industry may also be a helpful component of CSM use promotion messages
30
Opportunities for Expansion through Market Emciency Enhancement
Even though some gains in CSM use and market value can reasonably be expected through market expansion efforts the cost involved could easily outweigh any benefits in terms of enhanced profits to the CSM industry Perhaps the most cost-effective appropriate and useful means of enhancing the use of CSM would be a strategy aimed at improving the level and accuracy of information available regarding CSM and its use Lack of information or misinformation can easily discourage feed formulators from using CSM in their feed formulations Strategies to enhance the quantity and accuracy of appropriate information can take on many forms from media advertising to market news letters Although it is beyond the scope of this study to develop alternative information strategies the results of this study clearly indicate a number of areas in which enhanced and more accurate information is a critical need These include the following
bull The overall quality of CSM The study suggests that the negative aspects of CSM are well known Less well known are the specific positive aspects of CSM that may give it an edge in some sense over other protein feeds
bull The ideal ratio of the price of CSM to other feeds like soybean meal The study results indicate that feed formulators may not be adequately informed about what the ideal market value of CSM is relative to soybean meal given the differences in feeding value As a consequence CSM may currently be less used in relation to soybean meal than current market price ratios suggest should be the case
bull Protein-related factors for CSM use in non-ruminant feeds These factors are a major concern in the decisions of feed formulators to include or exclude CSM in feed rations
bull The relationship of aflatoxin to CSM and the rumen degradability of CSM particularly for beef and dairy cattle feed formulators These were the nutritional factors of greatest concern to ruminant feed formulators in the decision to include CSM in their feed formulations
bull CSM price availability consistency and palatability These were indicated to be the most important non-nutritional factors affecting feed formulators decisions regarding whether or not to use CSM The study indicates that information on non-nutritional factors may be more important in the decision to use CSM over alternative feeds to fill dietary protein requirements of feed rations than information on nutritional factors
bull The feeding value of CSM relative to alternative protein feeds An accurate and detailed assessment of the extent to which CSM may be superior as an alternative to other standard protein feeds would help position CSM appropriately in the market
bull The appropriate and acceptable levels of several key parameters affecting the use of CSM in animal feed rations including energy levels fat levels gossypol levels and escape values (ruminants only) Feed formulators generally lack adequate and reliable information on these and likely other parameters not included in the study which are crucial in efficient feed formulation and which have a significant impact on the choice of protein feedstuffs Although it appears that nearly all feed formulators routinely perform crude protein analyses few perform analyses for aflatoxin gossypol fat fiber and other parameters Also CSM suppliers are apparently doing an inadequate job currently of providing such information to feed formulators
31
SOME CONCLUDING COMMENTS AND RECOMMENDATIONS
This study assessed the potential problems and opportunities for expanding the use of CSM through an analysis of the perceptions of feed formulators regarding the use of CSM as an animal feed ingredient The perceptions of feed formulators regarding CSM as a protein feed largely define the boundaries within which CSM use will be able to achieve any significant growth in the future Their perceptions right or wrong are the key to understanding not only the problems facing CSM use but also the opportunities
The general conclusion of the study is an obvious one the use of CSM in feed formulations faces some major challenges in the future Chief among these include a perception among feed formulators that price availability quality and other key CSM characteristics are often obstacles precluding increased use of CSM in their feed formulations Perhaps the most important implication of the study is that a serious lack of adequate and accurate information among feed formulators regarding the characteristics parameters value and other aspects of cottonseed meal use in animal feed rations may be seriously restricting the market opportunities for cottonseed meal U nfortunately the development of alternative strategies to expand the use of CSM and enhance the efficient functioning of CSM markets through more accurate and available information on all aspects of CSM use in feed formulations is beyond this study Nevertheless a few recommendations pertinent to the development of such alternative strategies are in order
bull Before adopting any approach to expand the use of CSM it would be useful first to conduct a detailed analysis of the costs and benefits involved Market promotion efforts through advertising can be extremely costly and yield relatively little Research has also shown that there is often a tremendous lag between advertising and promotion expenditures and any associated returns It could take years of investment in such market expansion efforts before an accurate measurement of the actual return on investment could even be attempted
bull Consider developing first a detailed plan for information dissemination to the feed industry regarding all appropriate aspects of CSM use in feed rations as determined in this study An important part of this process would be a comprehensive assessment of the information needs and the information resources readily available The gap discovered in this way between needs and resources will help set the research agenda for the industry to fill the critical existing information gaps
bull Initiate a study of final user attitudes and perceptions of CSM use as a guide to future market expansion efforts This study considered only the perceptions of feed formulators regarding the use of CSM But feed formulators are often not the final users Consulting nutritionists for example often include or exclude certain feeds and feed types from their formulations as requested by feed users At least a few of the respondents to the survey conducted for this study indicated that user preferences are major factors determining whether or not CSM is included in their feed formulations Indeed markets operate as the interaction of supply and demand to determine prices The preferences of final users ultimately will be expressed in the market values of any product in any market unless sufficient obstacles exist to prevent the market from functioning properly Therefore the real decision-makers in the use CSM in the market may well include many more individuals than adequately represented by feed formulators
32
REFERENCES
US Department of Agriculture (USDAa) Feed Situation and Outlook Report Economic Research Service FDS series various issues
US Department of Agriculture (USDA b) Oil Crops Situation and Outlook Yearbook Economic Research Service OCS Series various issues
Figure 1 Quantity of Oilseed Meals Fed to Livestock 194849 - 198590 (Average)
(1000 Tons)
25000 0-1-----------------------shy
20000 I-~
15000
10000
5000
o L 1 J tJ t tmiddotmiddotmiddot 1 oj 1 to bullbull 1 L_ n __LLL I 1 bullbull I V I
1948-49 1950-54 1955-59 1960-64 1965-69 1970-74 1975-79 1980-84 1985-90
(Years)
n iflu Soybean Meal bull Cottonseed Meal Other Oilseed Meals
Source USDA
c
8 c a CD
en ~
--I _ scg ~CD 01)-- en - () mg0 s 0
JCD enOJ CD_CD en 0
sCDCD 0 OJ shyo OJ r Jlt- 0 m CJ) 0 0lt o 0shyCD OJ J
~s ~m cpCJ) r co OJco ~m a
Figure 3 Price Premium (+) or Discount (-) of Cottonseed Meal Relative to Soybean Meal 1956-1990
~~ ~
o I ~ I I
-20 f---
-40
-60
1~1~1~1~1~1~1~1~1~1~1~1~1~1~1~1~1~1~
Cottonseed meal price is adjusted to a soybean meal protein equivalent basis
~I------------------------------------------------------
l l A
I~middotmiddot--- --------
Figure 4 Animal Species for which Respondents Formulate Feeds
DAIRY CATILE
BEEFCATILE
HORSES
SHEEP
BROILERS
LAYERS
OTHER
PETS
TURKEY
SWINE
CATFISH
210
21000
0 5 1000 15 20 25
Figure 5 Respondents Formulating Feeds for the Various Animal Species
0 20 40 60 80
Figure 6 Other Animal Species for Which Respondents Formulate Feeds
DAIRY CATTLE
BEEF CATTLE
HORSES
SHEEP
BROILERS
LAYERS
OTHER
PETS
TURKEY
SWINE
CATFISH
632
Exotics
Trout
Alligators
KOI
Breeding Hens
Wildlife
Rabbits
Avian
Shrimp
Salmon
Ducks
Fish
Gamebirds
Hybrid Bass
379
~--~----~--~----~----~--~----~--~----~--~
0 10 20 30 40 50
Figure 7 Respondent Feed Formulation Activities by State
( of Respondents)
o 00 middot15 16 -30 31 middot45Cgt 46 -60 61 - 75 - 76 -90
Table 8 Respondent Experience as an Animal Nutritionist
( of Respondents) 30 r---shy
25 t-middotmiddotmiddotmiddotmiddotmiddotmiddotmiddotmiddotmiddotmiddotmiddotmiddot-middot ---_ _
20 -_ -nNItshy
15
10
5
0 1-5 6-10 11-15 16-20 21-25 26-30 31-35 36-40 41-45
(Years Of Experience)
-it sa 0 m 8 l 0 CD l g
_ cc c -s CD CObull
-0 -s- 3 Dl ~ IJ CD (fJ
C 0 l C CD l -+
raquo Sl_ lt_ -+_ CD (fJ
Figure 10 Respondent Primary Feed Formulations
by Animal Type 1990 (Percent)
30 I--------------------------------------------------------shy
25 r- middotmiddotmiddotmiddotmiddotmiddot231middotmiddotmiddotmiddot
20
15
10
5
0 Beef Dairy Swine Poultry Horses Pets Aqua- Sheep Exotics
Cattle Cattle culture amp Goats
(Animal Type)
Figure 11 Percent of CSM and S8M Used in Formulations by Feed Manufacturer Respondents 1990
( of Average Feed Ration)
Figure 12 Tons of Feed Formulated by Feed Manufacturer Respondents 1990
65
91
6 9
17
Total Formulations Formulations With CSM
II Less than 200000 Tons
II 200000 - 400000 Tons bullbullbull I bullbullbullbullbullbull ~ 3 ~ 400000 - 600000 Tons
5 rn 600 000 - 800 000 Tonsru 1
[] 800000 - 1000000 Tons9 4
I ~ 1 More Than 1000000 Tons
Formulations With S8M
Figure 13 Percent middotof Beef Cattle Respondents Formulating CSM Feeds for Specific Beef Cattle Types
( of Respondents)
25 ~I------------------------------------------------------~
-Isectig Feedlot-II 223
20
15
10
5
0
bull Other
~ middotmiddotmiddotmiddotmiddotmiddotmiddot middotmiddot _middotmiddotmiddotmiddot-=middotmiddotmiddotccmiddotcmiddotmiddot
Brood Cows Bulls Calves Feeder Heifer Stocker
(Animal Type)
Figure 14 Percent of Dairy Cattle Respondents Formulating CSM Feeds for Specific Dairy Cattle Types
( of Respondents)
120 ----------------------
100 88
80
60
40
20
0 Calves Heifers Lactating Cows Dry Cows
(Animal Type)
Figure 1-5 Percent of Poultry Respondents Formulating CSM Feeds for Specific Poultry Types
( of Respondents)
OO~I--------------------------------------------~-
50 1-laquolaquolt--laquolaquolaquo -lt - lt - lt -lt laquo lt
44
40
30
20
10
0
f-
~laquolaquolaquolaquo
~laquolaquolaquolaquolaquolaquo
Broilers Layers Turkeys Breeding Flocks
(Animal Type)
Figure 16~ Combined Responses Months of the Year When CSM IS NOT Available
( of Respondents) 16 i ---
14 12~8
12
10
87373 7
6
4
2
0 ~~ ~s ~( ~( ~0( ~0(~~~ ~~ ~t ~1 u~ ~g n0~ ad-o N0~ ~a~
~Y ~o Q~lmiddotr
(Month)
Figure 17 Combined Responses Months of the Year When CSM Needs to Be Available
( of Respondents) 12 ---------------------------
10
8
6
4
2
0
goA 9
~ui ~s ~Ot X)Ot ~Ot X)Ot~0SV~0~~erl ~iSclt ~f ~~1 ~v~ ug ~o~ o~o NO~ co~0 0lt609 ~o
(Month)
Figure 18 Beef Cattle Responses Percent of Respondents Formulating Creep Feed for Calves or Supplements for Stockers
733
832
0 20 40 60 80 100 120
( of Respondents)
Figure 19 Beef Cattle Responses Protein-Related Factors Considered When Balancing Rations
Other Protein Factors 110
Rumen
Degradability 686
Crude Protein Level 161
Amino Acid
Values 42
( of Respondents)
Figure 21 Comparison of Responses Months When CSM Needs to Be Available
( of Respondents) 94 ---------------------------shy
92
9
88
86
84
82 8
78
76
74
72
7
68
66
~ euroI - It
64 -t----------------------------------- -----------t
JAN FEB MAR APR MAY JUN JUL AUG SEP OCT NOV DEC
(Month)
bull Beef Cattle -t Dairy Cattle ltgt Poultry Catfish
Figure 20 Comparison of Responses Months When CSM Is Not Available
( of Respondents)
16 t 15
14
13
12
11
10
9
8ltl amp
7
6
5 I JAN
I
FEB I
MAR I
APR I
MAY I
JUN I
JUL I
AUG SEP I
OCT NOV I
DEC
(Month)
bull Beef Cattle -t Dairy Cattle ltgt PouHry b Catfish
Figure 22 Comparison of Responses Analyses Routinely Performed
( of Respondents)
100~-----------------------------------------------
90
80
70
60
50
40
30
20
10
o I ~
AFLATOXIN C PROTEIN FAT FIBER GOSSYPOL OTHER NONE
(Analyses)
bull Beef Cattle Dairy Cattle o Poultry Catfish-t fj
Figure 23 Comparison of Responses Analytical Values Provided by Supplier
( of Respondents)
60shy
50
4)
30
20
10
o amp ~
AFLATOXIN C PROTEIN FAT FIBER GOSSYPOL OTHER NONE
(Analyses)
bull Beef Cattle -t Dairy cattle o Poultry b Catfish
Figure 24 Share of Cottonseed Use Crush vs Feed Use
( of Respondents)
100 I
90
CRUSH 80
70
60
50
40
30
20
FEED USE 10
o 1~ 1~ 1~ 1m 1m 1~ 1~ 1~ 1~ 1~ 1~ 1~ 1~ 1~
(Year)
Source USDAb
Table 1 Percentage of Beef Cattle Feeds Formula ted Table 2 CSM Feeds Formulated for Beef Cattle CSMmiddot Calvesmiddot
middotAverage Response Rate (feedlot=51 other=41) middotResponse Rate = 39
Table 3 CSM Feeds Formulated for Beef Cattle Table 4 CSM Feeds Formulated for Beef Cattle Stockersmiddot
middotResponse Rate = 40
Response Rate =37
Table 5 CSM Feeds Formulated for Beef Cattle Table 6 CSM Feeds Formulated for Beef Cattle
middotResponse Rate =33
middotResponse Rate = 37
Table 8 Percentage of Dairy Cattle Feeds Formulated CSM
Average Response Rate =88
middotResponse Rate = 37
Table 9 CSM Feeds Formulated for Dairy Cattle Table 10 CSM Feeds Formulated for Dairy Cattle
RespooseRate 24
middotResponse Rate = 34
Table 11 CSM Feeds Formulated for Dairy Cattle Table 12 CSM Feeds Formulated for Dairy Cattle
Response Rate = 31 Response Rate = 45
Table 13 Percentage of Poultry Feeds Formulated Using CSMmiddot
bullAverage Response Rate = 79
Table 14 Percentage of Catfish Feeds Formulated Using CSMmiddot
bullAverage Response Rate =67
Table 15 CSM Feeds Formulated for Catfishmiddot )middoti middot fteq~
bullAverage Response Rate = 17
Table 16 Combined Responses Importance of Specific Factors in Choice of Dietary Protein ( of
bullAverage Response Rate =g]
Table 17 Combined Responses Other Important Factors in
bullAverage Response Rate = 22
bullAverage Response Rate =91
-Average Response Rate =90
Table 20 Combined Responses Importance of Non - Nutrition -Related Factors in Choice of CSM over Alternative Protein Feeds ( of
-Average Response Rate = 87
Table 22 Combined Responses Top S Reasons Why CSM IS NOT Selected as a Feed
Table 23 Combined Responses Top 5 Specific Characteristics That Would Have to Change for CSM to be Selected as a Feed
Table 24 Combined Responses Analysis Routinely Performed
Table 25 Combined Responses Analysis Values Provided
CSM
267 067 333 333 1400 S333
467 000 067 067 1400 4867 --shy
467 000 000 067 400 4333 --shy -- shy -- shy
250 000 000 000 1250 4000 -- shy --shy
313R 4733 62 ------ shy~ - shy ~-
4S00 62
bullAverage Response Rate = 100
bullAverage Response Rate = 87
Table 28 Beef Cattle Responses Imponance of Nutrition-Related Factors in Choice of CSM Over Alternative Protein Feeds
Average Response Rate = 91
Table 29 Beef Cattle Responses Other Nutrition - Related
Fact~~~~~~~~~~~~~~~~~~~
Response Rate =7
Table 30 Beef Cattle Responses Imponance of Non - Nutrition - Related Factors in Choice of CSM Over Alternative Protein Feeds
middotAverage Response Rate = 87
middotResponse Rate = 5
bullAverage Response Rate =14
Table 33 Beef Cattle Responses Months of the Year When CSM Needs to Be AvaiJable I ii middot middot1
bullAverage Response Rate =53
10 U
-Moy
JIIJ
All
so
0_ -
to
--I No
Moy
10 -so shy
0_ _ 0-
Table 35 Beef Cattle Responses Top 5 Reasons Why CSM Is Not Selected as a Feed
Average Response Rate =100 Response Rate = 24
Response Rate =28
Average Response Rate = 98
Response Rate = 17
middotResponse Rate =9
Table 43 Beef cattle Responses Type of Creep Feed
middotResponse Rate = 81
middotResponse Rate =26
Table 45 Beef cattle Responses Respondents Formulating Rations With CSM and Whole
middotResponse Rate = 68
Table 47 Beef cattle Responses Percentage of Whole Cottonseed Respondents Mix in Rations Containing Both CSM and Whole Cottonseedmiddot tCmiddotHiitjt~ middotmiddotmiddotmiddot1
middotResponse Rate =25
middotResponse Rate = 30
bull Response Rate = 98
Response Rate =11
Table 51 Beef Cattle Responses Escape Value Respondents Are Using for Rumen Degradabilitymiddot
1~iiii middotb~r~~fgtD zq436imiddotmiddotmiddotmiddotmiddotmiddotmiddot 004bullbullbullbullbullbullbullbullbullbull1----22--+----31-4
I~~I 23 329
middotResponse Rate = 57
Table 53 Beef Cattle Responses Methods or Sources Respondents Used to Calculate CSM
Table 52 Beef Cattle Responses Reliability of Escape Values Used
Table 54 Beef Cattle Responses Interested in Knowing Escape Values for CSM Processed
Valuemiddot
middotResponse Rate =98
)
I Mean ~nse
63 57S19 228381 Q-L_uu ~139 59468 32306 139bullII1 1 061 06
1 1 44 430 614431-------- 57t 001 001 middot-1
==~=-__~~1c9 00 _ 06 _ 001_ 38 133 323 63
Average Response Rate =100
Response Rate = 89
Table 58 Dairy Cattle Responses Importance of Nutrition - Related Factors in Choice ofCSM Over Alternative Protein Feeds (ofbmiddotNmiddotmiddotmiddotmiddotmiddotmiddot
Response Rate =88
Table 59 Dairy Cattle Responses Other Nutrition-Related Factors
Indicated br~~P211dents
Response Rate =10
Table 60 Dairy Cattle Responses Importance of Non- Nutrition - Related Factors in Choice of CSM Over Alternative
Protein Feeds ( ofResPOndents~dd
Response Rate = 88
Response Rate = 3
--
Average Response Rate = 51
Table 62 Dairy Cattle Responses Months in the Year When CSM IS NOT Available
10 u
J -- AIIIi
--~ shy
loOoIMr _ 0-
bullAverage Response Rate =69
--- AIIIi
--~ soM
0
0-_
10
Table 65 Dairy Cattle Responses Top 5 Reasons Why CSM IS NOT Selected as a Peed
Table 66 Dairy Cattle Responses Top 5 Specific Characteristics That Would Have to ro1 ____ for CSM to be Selected as a Feed
Table 67 Dairy Cattle Responses Analyses Routinely Performed fmiddotmiddotmiddotmiddot
Response Rate =96
Response Rate =56
Table 68 Dairy Cattle Responses Other Analyses
Response Rate =25
Table 70 Dairy Cattle Other Analytical Values CSM
Response Rate =4
Average Response Rate =81
Average Response Rate = 15
Table 73 Dairy Cattle Responses Respondents Formulating Feeds With Whole andor Delinted
Cottonseed bull
bullAverage Response Rate =92
middotResponse Rate = 40
Table 74 Dairy Cattle Responses Respondents Formulating Rations with Cottonseed Meal and Whole Cottonseed in the Same Rationmiddot
middotResponse Rate = 97
Table 76 Dairy Cattle Responses Percentage of Whole Cottonseed Respondents Mix in Rations
ltltJIltainin(a0th CSM and WhoeCottonseedmiddot Mean
middotResponse Rate = 42
Table 77 Dairy Cattle Responses Knowledge of Research on Feedine CSM
~~~~
Average Response Rate = 68
Response Rate =7
Average Response Rate =59
Response Rate =25
Average Response Rate =63
Response Rate = 13
middotResponse Rate = 92
Response Rate =82
Table 85 Dairy Cattle Responses Methods or Sources Used to Calculate CSM
Response Rate = 73
Table 86 Dairy Cattle Responses Respondents Interested in Knowing Escape Values for CSM Processed from Different Methodsmiddot fmiddotmiddotmiddotmiddotmiddotmiddot
Response Rate = 92
Response Rate = 34
Table 89 Dairy Cattle Responses Suggestions for CSM
Response Rate =33 Response Rate =22
-----
64 139 24815 00 36 511 5751
5951 131 438 35015 00 15 I-~~~~~
6200 15 423 51151 00 00 ~~~ -~~~ -~~~ ~~~-~~ --~~ ~ ~ ~~-~ ~
292 55125 00 00 125 45800
bullAverage Response Rate =99
Average Response Rate =85
Table 92 Poultry Responses Importance of Nutrition - Related Factors in Choice of CSM Over Alternative Protein Feeds (of
Average Response Rate =85
Table 93 Poultry Responses Other Nutrition-Related Factors Indicated
200
200
Response Rate = 5
Table 94 Poultry Responses Importance of Non - Nutrition - Related Factors in Choice of CSM Over Alternative Protein
Feeds~~~~~~~~~~5=~~~~~T7~~
00 Average Response Rate =83
Response Rate =4
Average Response Rate = 17
Table 97 Poultry Responses Months in the
J
p
April
lao
A
shy-- 0
ft
April
_
Average Response Rate = 43
=1 g L
0
Table 99 Poultry Responses Top 5 Reasons Why CSM IS NOT Selected as a Feed
Table 100 Poultry Responses Top 5 Specific Characteristics That Would Have to Change for
CSM to be Selected as a Feed Inoredient
Table 101 Poultry Responses Analyses Routinely
middotResponse Rate = 93
Table 102 Poultry Responses Other Analyses Routinely
Performed
middotResponse Rate = 27
Table 103 Poultry Responses Analytical Values Provided
middotResponse Rate =73
Table 104 Poultry Responses Knowledge of Problems
bullAverage Response Rate = 62
Average Response Rate = 14
Table 106 Poultry Responses Protein - Related Factors
Average Response Rate = 64
Table 107 Poultry Responses Other Protein - Related
Response Rate =11
Table 108 Poultry Responses Crude Protein Levels
Preferred for CSM
Response Rate = 55
Table 111 Poultry Responses Gossypol Levels Considered
Safe
Table 112 Poultry Responses Would or Do Use Table 113 Poultry Responses Relative Feeding Value of CSM Comoared to 44 SBMmiddot
middotResponse Rate = 96
bull Response Rate = 100
Table 114 Poultry Responses Knowledge of Table 115 Poultry Responses Familiarity with Other Feedino CSMmiddot
middotResponse Rate =7 bull Response Rate = 73
middotResponseRate = 31
bullAverage Response Rate = 58
Table 118 Poultry Responses Willingness to Pay
a Premium Per Unit of Protein for CSM With More
Than 41 Protein
bullResponse Rate =91
Table 119 Poultry Responses Percent of Cost of SBM Respondents Willing to Pay for CSM with
Response Rate =27
Response Rate =64
00 00 87 43 478 304 57 00 00
----shy I--~~
00 ~-~
43 522 348 59 ----shy
62~ 00 00 00 261 ----shy
652 ------shy
00 00 00 00 667 333 63 AverageResponseRate = 99
bullAverage Response Rate = 73
Table 123 Catfish Responses Importance of Nutrition - Related Factors in Choice of CSM Over Alternative Protein Feeds
Average Response Rate =83
Table 124 Catfish Responses Importance of Non- Nutrition - Related Factors in Choice of CSM Over Alternative Protein
Feeds
Average Response Rate = 90
bullAverage Response Rate = 13
Igt 20
s_
Pshy s
--s
H_
_
gt 7 bull bull bull bull bull
1 fsI plusmn -
haMr
N__
shy
bullAverage Response Rate =54
Table 128 Catfish Responses Top 5 Reasons Why CSM IS NOT Selected as a Feed
Table 129 Catfish Responses Top 5 Specific Characteristics That Would Have to Change for CSM to Be Selected as a Feed-_
Table 130 Catfish Responses Analyses Routinely Table 131 Catfish Responses Other Analyses Routinely Performed
middotResponse Rate = 25
middotResponse Rate =92
bullAverage Response Rate = 18
Table 133 Catfish Responses Knowledge of Problems Feedine CSM to CatflSh
Average Response Rate =100
Table 134 Catfish Responses Protein - Related Factors Considered i
Response Rate = 83
Table 135 Catfish Responses Crude Protein Levels Preferred for CSM
Response Rate = 100
Table 139 Catfish Responses Would or Do Use Table 140 Catfish Responses Relative Feeding
Value ofCSM Compared to 44~ Lmiddotmiddotmiddotmiddotmiddotmiddotmiddotmiddotmiddotmiddotmiddotmiddotmiddotmiddotmiddotmiddotmiddotmiddotmiddot _
Response Rate = 100
Response Rate = 100
Table 141 Catfish Responses Knowledge of Research on Table 142 Catfish Responses Sources ofInformation
Average Response Rate = 83
bullAverage Response Rate = 44
Table 143 Catfish Responses Willingness to Pay A Premium Per Unit of Protein for CSM with More Than
middotResponse Rate = 100
Table 144 Catfish Responses Percent of Cost of SBM Respondents Willing to Pay for CSM with Sufficiently Low Goscvnol and Fiber Levelsmiddot
middotResponse Rate = 83
middotResponse Rate = 25
Table 146 Comparison of Mean Responses and Analysis of Variance (ANOVA) Importance of Specific
bull Scale of 1 (extremely unimportant) to 7 (extremely important) for the mean ranking a Mean significantly larger across animal types at the 5 significance level otherwise no difference b Mean significantly lower across animal types at the 5 significance level otherwise no difference
Table 147 Comparison of Mean Responses and Analysis of Variance (ANOVA) Ranking of Other Protein
bull Scale of 1 (CSM inferior to respective feed) to 7 (CSM superior to respective feed) for the mean ranking
a Mean significantly larger across animal types at the 5 significance level otherwise no difference
b Mean significantly lower across animal types at the 5 significance level otherwise no difference
Table 148 Comparison ofMean Responses and Analysis of Variance (ANOVA) Importance of Nutritionshy
Related Factors in Choice ofCSM Over Alternativesmiddot
bull Scale of 1 (extremely unimportant) to 7 (extremely important) for the mean ranking a Mean significantly larger across animal types at the 5 significance level otherwise no difference
b Mean significantly lower across animal types at the 5 significance level otherwise no difference
Table 149 Comparison of Mean Responses and Analysis of Variance (ANOVA) Importance of Nonshy
Nutrition- Related Factors in Choice of CSM Over Alternativesmiddot
bull Scale of 1 (extremely unimportant) to 7 (extremely important) for the mean ranking
a Mean significantly larger across animal types at the 5 significance level otherwise no difference
b Mean significantly lower across animal types at the 5 significance level otherwise no difference
- = Not mentioned or ranked lower than 4th place
Table 151 Comparison of Responses Top Responses Why CSM IS NOT Selected as a Feed
- = Not mentioned or ranked lower than 5th place
Table 152 Comparison of Responses Top Characteristics that Have to Change for CSM to Be
- = Not mentioned or ranked lower than 5th place

7
allowed to list other factors that they considered important but were not on the list Interestingly the largest percentage of respondents (90) ranked aflatoxin as an important or extremely important factor in their choice of CSM as a feed component (Table 19) Nearly two-thirds ranked aflatoxin as extremely important a much higher percentage than for any other factor Protein quality was ranked as important or extremely important by 80 of respondents Gossypol level had the third highest mean response of any individual factor Only one listed factor was clearly considered to be unimportant in the choice of cottonseed meal as a feed component (vitamin level) as indicated by a mean response of substantially less than 4 The mineral level in cottonseed meal was considered to be neither important nor unimportant
The major non-nutrition-related factors influencing the choice of cottonseed meal as a feed component in the perception of the respondents included consistent quality price availability nutrient guarantees and palatability as indicated by their relatively higher mean ran kings (Table 20) Note that all of the listed non-nutrition-related factors were considered by the respondents to be at least somewhat important in their choice of cottonseed meal as a feed component That is none of them were considered to be unimportant The least important non-nutrition-related factors influencing the choice of CSM in the perception of the respondents included service from the CSM industry the need for a local supply of CSM special equipment requirements for using CSM and convenience in using CSM as a feed component
Seasonality of Cottonseed Meal Availability
The survey results indicate that CSM is least available in sufficient quantities for purchase as a feed component during the months of June through September of a typical year (Figure 16) However the results also indicated that those are also about the same months (April through August) in which there is the least need for CSM to be available to compete effectively with alternative protein feeds (Figure 17) One interpretation of this result is that on average the availability of CSM is generally not a problem during the year This is not entirely the case however as the responses to the next set of questions point out
Reasons for the Selection and Non-Selection of Cottonseed Meal
To obtain further insight into the primary motivating factors behind the selection or nonshyselection of CSM as an ingredient in feed formulations the sample members were asked three completely unaided questions ie the respondents did not have a list from which to choose in answering the questions They were first asked to list the top five reasons why they perceive that CSM is selected as a feed ingredient and then the top 5 reasons why CSM is Dot selected in order of importance Finally if CSM is Dot generally selected by a respondent heshe was asked to list the specific characteristics of CSM that would have to change for it to be selected more frequently again in order of importance The respondents simply needed to fill in blanks for each question (reasons that CSM is and is not selected and characteristics that would have to change) marked lst through 5th with their own ideas
By far the number one reason (63 of the respondents) listed for which CSM is selected as a feed ingredient was price (Table 21) Far behind price the number one choices of some respondents were proteinprotein quality (9 of the number one responses) availability (7) palatability (4) and quality (4) Listed most often as the second most important reason for selecting CSM was availability (31 of the number two responses) followed by price (20) proteinprotein quality (1I) palatability (7) and pelletabilitypellet quality (6) The three reasons most often listed third were availability (20 of the number three responses) palatability (16) and price (11) Based on the total number of times a reason was listed first second or third the top three reasons
8
given by respondents for which CSM is selected as a feed component were price availability and proteinprotein quality in that order
The respondents provided a much longer list of reasons for which CSM is Dot selected than for which CSM is selected as a feed ingredient (Table 22) Interestingly the most frequently listed number one reason (54 of the respondents) why CSM is Dot selected as a feed ingredient was again price Other number one choices included availability (16) gossypol (9) and protein protein quality (3) The reason most often listed second (30 of respondents) was availability followed by pricevalue (20) and gossypol (8) The reason most often listed third was pricevalue again (14 of respondents) and then availability (I 3) and gossypol (I 1) Again based on the total number of times a reason was listed first second or third the top three reasons given by respondents for which CSM is Dot selected as a feed component were price availability and gossypol in that order
The three most commonly listed specific characteristics of CSM that would have to change to be included more frequently in respondents feed formulations also were price availability and gossypol (Table 23) Other less frequently mentioned CSM characteristics that would need to change included amino acid balancelevel energy contentlevel aflatoxin contentlevel proteinprotein quality
In summary price and availability appear to be the two key factors affecting the use of CSM If price is low andor availability is adequate feed formulators are more likely to use CSM in their formulations On the other hand a high price andor poor availability is likely to discourage use of CSM Consequently there is very little loyalty by feed formulators to CSM because they appear to be quick to switch back and forth between CSM and alternative feeds as price changes Feed formulators do not appear to perceive that CSM is a feed ingredient with inherent characteristics for which they are willing to pay a premium if necessary in order to continue using it as an ingredient in the feeds they formulate That is the primary consideration in deciding whether or not to use CSM is its price rather than some nutritional characteristic for example Thus when price rises they perceive little reason to continue using CSM as part of their formulations
The availability of CSM appears also to work both for and against the use of CSM Responses to the specific questions on seasonality seemed to indicate that availability of CSM is not generally a problem during the year But when CSM is not selected as a feed ingredient availability is one of the major reasons During certain times of the year in certain parts of the country availability may be a positive factor motivating the use of CSM
Source of Chemical Analyses for Cottonseed Meal
Nearly 90 of the respondents routinely perform crude protein analyses (Table 24) About two-thirds perform their own fat and fiber analyses as well Surprisingly however less than half the respondents routinely test for aflatoxin even though nearly all respondents indicated aflatoxin to be an important or extremely important factor affecting their choice of CSM as a feed component Only 18 of the respondents routinely test for gossypol Even though nearly all respondents performed their own crude protein analyses CSM suppliers apparently provide analytical values for crude protein to over 40 of respondents (Table 25) CSM suppliers provided fat and fiber analytical values to about a third of the respondents CSM suppliers appear to provide analytical values for gossypol to very few feed formulators
9
Results by Animal Species
The responses in the previous section are indicative of the overall perceptions of feed formulators of the use of CSM as a feed component Those results however may mask some important differences in perceptions among formulators of feeds for the various animal species There are also issues regarding the use of CSM as a feed component that are unique to the various animal species Consequently salient dissimilarities in the responses of formulators of different animal feeds from the combined responses (over all animal types) discussed in the previous section are highlighted in this section Also the results of the questions asked specifically of formulators of feeds for particular animal species are discussed in this section in detail as well
BeeCattle
There are few major differences in the perceptions of beef cattle feed formulator respondents concerning the use of cottonseed meal from those discussed in the previous section for all survey respondents This may reflect the larger number of respondents formulating feed for beef cattle (and for ruminants in general) than for other animal species The salient differences in the 6 general question areas include the following
bull Factors affecting choice 0 dietary proteins The only major difference in the responses to these questions was a somewhat greater concern by responding beef cattle feed formulators for other factors influencing the choice of a dietary protein such as palatability and rumen degradability (Table 26)
bull Cottonseed meal as an alternative protein feed The results for beef cattle are roughly similar to those from the combined responses (Table 27) Major differences include I) a lower percentage of beef cattle survey respondents consider blood meal to be superior to CSM in beef cattle feeds 2) a large majority of respondents feel that CSM is not an alternative to dried skim milk and dried whole milk in beef cattle feeds and 3) an overwhelming majority of respondents consider CSM to be an alternative to the remaining protein feeds for use in beef cattle feeds except perhaps for fish meal and blood meal
bull The importance 0 nutritional and non-nutritionalactors Again the responses are generally the same as for the combined responses The beef cattle survey respondents however tended to rank nutrition-related factors as less important and non-nutrition-related more important than was the case for the combined responses On average beef cattle feed formulators ranked protein quality amino acid balance amino acid availability fat level fiber level and gossypol level as less important factors in the choice of CSM than was the case for the combined responses (Tables 28 and 29) Of the non-nutrition-related factors respondents ranked palatability the need for a local supply equipment requirements convenience and CSM industry service as all slightly more important in the choice of CSM than was the case for the combined responses (Tables 30 and 31)
bull Seasonality 0 cottonseed meal availability The results for the beef cattle respondents are virtually identical to those from the combined responses (Tables 32 and 33)
bull Reasons lor the selection and non-selection 0 cottonseed meal The top three reasons for which CSM is and is not selected as a feed ingredient are exactly the same for the beef cattle responses as for the combined responses (Tables 34 and 35) Also price availability and
10
gossypol level are cited as the three most important factors that would have to change for CSM to be used more frequently as was the case with the combined responses (Table 36)
bull Source 0 chemical analyses lor cottonseed meal No major differences appear in either the analyses routinely performed by the responding beef cattle feed formulators or the analytical values provided to them by CSM suppliers (Tables 37 38 39 and 40)
Beef cattle sample members were also asked several questions specifically regarding the use of CSM in beef cattle feed formulations in 5 general areas I) problems resulting from feeding a ration with CSM to the various beef cattle types 2) details on particular feed formulations for beef cattle 3) sources of information utilized regarding formulating beef cattle feeds 4) protein-related factors considered when balancing rations for beef cattle and 5) an open-ended question soliciting suggestions to improve the usefulness or value of CSM for beef cattle feed formulations
Problems from Feeding CSM Rations to Beef Cattle
Few respondents indicted knowledge of any problems resulting from feeding a ration containing cottonseed meal to either feedlot or other beef cattle (Table 40 The most frequently mentioned problems concerned feedlot bulls and calves The majority of the problems reported involved supplements and starter feeds (Table 42) The main problems reported had to do with gossypol beef cattle performance when fed rations containing CSM and reproduction The low number of respondents indicating problems of any type however suggests that the problems reported were likely isolated cases
Details on Particular Feed Formulations for Beef Cattle
The sample members were also asked to provide information regarding creep feeds for calves and supplements for stockers that they formulate as well as information regarding the use of whole or delinted cottonseed in beef cattle feed rations Nearly 75 of all beef cattle respondents formulate creep feeds for calves and over 80 formulate supplements for stockers (Figure 18) Traditional creep feeds represented two-thirds of the creep feeds formulated (Table 43) Over half the respondents indicated that they formulate traditional creep feeds Fewer respondents formulated high protein creep feeds
Nearly half the beef cattle respondents formulate some feeds using whole fuzzy cottonseed (Table 44) Only a little less than a third formulate any feeds using delinted cottonseed however Also only about a quarter of the respondents formulate any rations that include both CSM and whole cottonseed (Table 45) For those who formulate rations that include both the mix of the two in the rations varies widely Respondents reported that the share of such rations accounted for by CSM ranged from 1 to 100 with a mean of 19 (Table 46) The share of those rations accounted for by whole cottonseed ranged from 0 up to a maximum of 25 with a mean of 102 (Table 47)
Sources of Information Utilized on Formulating Beef Cattle Feeds
The largest number of respondents (110 of 123 respondents) indicated that they utilize university research of some type to obtain information on formulating feeds for beef cattle (Table 48) Only slightly fewer (91 respondents) indicated that industry publications are a source of feed formulation information for beef cattle University extension and government agencies were also listed as important information sources A few respondents listed other sources of information
II
including primarily the results of research performed in their own companies their own personal experience and their own private research (Table 49)
Protein-Related Factors Considered for Balancing Beef Cattle Rations
Nearly 70 of the respondents indicated that rumen degradability is a protein-related factor that they consider when balancing beef cattle rations (Figure 19) Respondents also consider crude protein level (16) and other protein factors (11) Only 4 indicated concern for the amino acid value when balancing beef cattle feed rations The two main other protein-related factors the respondents indicated as having a bearing on balancing beef cattle feed rations were the digestibility of the protein and the protein ingredients (Table 50)
Respondents indicated a wide range of escape values (or by-pass values) that they are using for CSM from less than 20 to over 50 (Table 51) At the same time however they are unsure as to the reliability of the escape values they are using Nearly 70 indicated that the escape values they are using are neither reliable or unreliable or only somewhat reliable (Table 52) The principal single method or source used by respondents for the escape value was the National Research Council (Committee on Animal Nutrition National Academy of Sciences) (Table 53) Universities were the next most frequently mentioned single source of CSM escape values The largest number of respondents (32) simply indicated that several sources were consulted for escape values Finally almost all respondents indicated an interest in obtaining information on escape values for CSM as processed by different methods (Table 54) There appears to be a lack of reliable information on CSM escape values in the perception of beef cattle feed formulators
Suggestions for Improling the Usefulness of Cottonseed Meal
Only 16 of the beef cattle feed formulators that returned surveys provided suggestions that might improve the value or usefulness of CSM in feed rations (Table 55) Some of the more noteworthy suggestions included improving the consistency of cottonseed meal various types of needed research more data on CSM and increased availability of CSM
Dairy Cattle
There are few major differences in the perceptions of dairy cattle feed formulator respondents concerning the use of cottonseed meal from the combined responses over all survey respondents and the beef cattle responses Again this may reflect the larger number of respondents formulating feed for dairy cattle (and for ruminants in general) than for other animal species The salient differences in responses by dairy cattle feed formulators in the 6 general question areas include the following
bull Factors affecting choice of dietary proteins There is virtually no differences in the responses of dairy cattle respondents from the combined responses for any of the listed factors (quality price availability consistency and other) affecting the choice of dietary protein (Table 56) A large majority of dairy cattle feed formulators ranked all factors as either important or extremely important
bull Cottonseed meal as an alternative protein feed The results for dairy cattle are roughly similar to those from the combined responses (Table 57) The two major differences include I) a large majority of respondents feel that CSM is not an alternative to dried skim milk fish
12
meal dried whole milk and blood meal in dairy cattle feeds and 2) an overwhelming majority of respondents consider CSM to be an alternative to nearly all the remaining protein feeds for use in dairy cattle rations
bull The importance of nutritional and non-nutritional factors Again the responses are generally the same As was the case for beef cattle respondents however dairy cattle respondents tended to rank the listed non-nutrition-related factors as relatively more important than the listed nutrition-related factors On average dairy cattle feed formulators ranked amino acid balance fiber level and gossypol level as less important factors in the choice of CSM than was the case for the combined responses (Tables 58 and 59) As in the case of both the combined and beef cattle responses aflatoxin was ranked at a higher level of importance than any other single nutrition-related factor Of the non-nutrition-related factors respondents ranked most factors as all slightly more important in the choice of CSM than was the case for the combined responses (Tables 60 and 61)
bull Seasonality of cottonseed meal allailability The results for the dairy cattle respondents are highly consistent with those for both the combined responses and for the beef cattle responses The months of May through September are the months of least availability of CSM which are also the months indicated when CSM is least needed to be available in the perception of dairy cattle respondents (Tables 62 and 63) Again the suggestion is one of little problem of CSM availability although this is not totally the case as indicated by dairy cattle respondents in later questions
bull Reasons for the selection and non-selection of cottonseed meal While price and availability are also the top two reasons that dairy cattle respondents perceived that CSM is selected as a feed ingredient protein contentquality ranked third on their list followed closely by palatability (Table 64) The top two reasons the CSM is not selected according to the dairy cattle respondents were price and availability as with both the combined responses and the beef cattle responses The third reason given by the dairy cattle respondents however was protein qualitylevel followed in fourth place by gossypol (Table 65) Again price was the key CSM characteristic that dairy cattle respondents indicated that must change in order to be used more frequently in dairy cattle rations (Table 66) Availability and gossypol levels were ranked as the second and third CSM characteristics that must change as was the case for the combined responses
bull Source of chemical analyses for cottonseed meal The results for the chemical analyses performed by dairy cattle respondents are virtually identical to those of both the combined results and those of the beef cattle results The primary analysis routinely performed by the dairy cattle respondents is crude protein (121 of the 143 respondents) followed by fiber (94 respondents) and fat (83 respondents) (Tables 67 and 68) The primary analytical values supplied to the dairy cattle respondents also include crude protein (62 respondents) fiber (50 respondents) and fat (47 respondents) (Tables 69 and 70) It is interesting to note that although aflatoxin was ranked at a higher level of importance than any other nutrition-related factor affecting the choice of CSM as feed component only a third of the dairy cattle respondents routinely perform analyses for aflatoxin and only 11 respondents are provided aflatoxin values by their CSM suppliers The story is about the same for both the combined and the beef cattle responses
Dairy cattle sample members were also asked several questions specifically regarding the use of CSM in dairy cattle feed formulations in 6 general areas I) problems resulting from feeding a
13
ration with CSM to the various dairy cattle types 2) details on dairy cattle feed formulations containing whole cottonseed 3) sources of information utilized on formulating dairy cattle feeds 4) protein-related factors considered when balancing rations for dairy cattle 5) gossypol levels considered to be safe for mature dairy cattle and pre-ruminant calves and 6) an open-ended question soliciting suggestions to improve the usefulness or value of CSM for dairy feed formulations
Problems from Feeding CSM Rations to Dairy Cattle
Again very few respondents indicted knowledge of any problems resulting from feeding a ration containing CSM to dairy cattle (Table 71) Only 24 of the respondents indicated problems with calves and only 18 for lactating cows as the result of feeding rations with CSM Only about 3 of the respondents mentioned problems with either dairy heifers or dry cows The number one problem reported was gossypol toxicity primarily in creep feeds and complete rations (Table 72) Both palatability and poor performance problems for various feed types were also frequently mentioned Again however the low number of respondents indicating problems of any type suggests that the problems reported were likely isolated cases
Details on Dairy Cattle Feed Formulations Containing Whole Cottonseed
Over 75 of dairy cattle respondents formulate feeds using whole fuzzy cottonseed a much higher percentage than was the case for beef cattle Less than half of the dairy cattle respondents however utilize delinted cottonseed in their feeds more in line with the beef cattle results (Table 73) Less than half the respondents formulate rations that include both CSM and whole cottonseed (Table 74) For those who formulate rations that include both the mix of the two in the rations varies widely Respondents reported that the share of such rations accounted for by CSM ranged from 1 to 30 with a mean of 85 (Table 75) The share of those rations accounted for by whole cottonseed ranged from 3 to 100 with a mean of 16 (Table 76) It appears therefore that on average dairy feeds formulated with both CSM and whole cottonseed contain a higher percentage of whole cottonseed than of CSM This is just the opposite of the situation for beef cattle
Sources of Information Utilized on Formulating Dairy Cattle Feeds
Over 80 of the dairy cattle respondents indicated that they were familiar with research on feeding CSM to mature dairy cattle (Table 71) Only half however indicated familiarity with such research for pre-ruminant calves Less than 10 of the respondents listed any other research on feeding CSM to other types of dairy cattle (Table 78) The largest number of respondents (137 of 143 respondents) indicated that they utilize university research to obtain information on formulating feeds for dairy cattle followed by industry publications of some type (121 respondents) and university extension service (83 respondents) (Table 79) Only 36 respondents listed other sources of information including primarily personal experience and research (Table 80)
Protein-Related Factors Considered for Balancing Dairy Cattle Rations
Nearly 100 of the dairy cattle respondents indicated that both crude protein level and rumen degradability are factors they consider when balancing rations for dairy cattle a much higher level than is the case for beef cattle (Table 81) Less than half consider amino acid values (61 of 143 respondents) Only 19 respondents indicated that they consider other factors like protein solubility (Table 82)
Dairy cattle respondents indicated a even wider range of escape values (or by-pass values) that they are using for CSM than did beef cattle respondents from 0 to over 80 (Table 83) The mean escape value calculated from the responses is 40 Dairy cattle respondents indicated slightly more
14
confidence in the escape values they are using than was the case for beef (Table 84) Only 22 respondents however considered those escape values to be reliable or extremely reliable The principal single method or source used by respondents for the escape value they use was again the National Research Council (Committee on Animal Nutrition National Academy of Sciences) (Table 85) Book values was the next most frequently mentioned single source of CSM escape values (23) Finally nearly 100 of the respondents indicated an interest in obtaining information on escape values for CSM as processed by different methods (Table 86) The conclusion from the dairy cattle responses is the same as for beef cattle That is there appears to be a lack of reliable information on CSM escape values in the perception of dairy cattle feed formulators and that they are highly interested in obtaining more information in this regard
Gossypol Level Considered Safe for Mature Dairy Cattle and Pre-Ruminant Calves
Dairy cattle respondents appear to have little idea of what the safe levels are for gossypol in mature dairy cattle and pre-ruminant calf feeds First of all only one-third of those who returned surveys even attempted to provide numbers for safe gossypol levels (Tables 87 and 88) Many respondents simply wrote comments such as dont know or not aware of research on safe gossypol level in the margin of the survey beside the question Second those who attempted to answer the questions provided an amazingly wide range of safe gossypol levels from 0 parts per million (ppm) to 7500 ppm for mature dairy cattle and from 0 ppm to 1000 ppm for pre-ruminant calves The mean safe gossypol levels were 609 ppm for mature dairy cattle and 121 ppm for pre-ruminant calves The responses were spread quite evenly between the extremes around the means It should be noted that the research team checked and rechecked the data set for this question to insure there were no errors in data entry
Suggestions for Improving the Usefulness of Cottonseed Meal
Only about 22 of the dairy cattle feed formulators that returned surveys provided suggestions that might improve the value or usefulness of CSM in dairy cattle feed rations (Table 89) Some of the more frequent suggestions dealt with improving the consistency and availability of CSM Several respondents suggested the need for more information on gossypol a worthy suggestion given the results of the previous question
Poultry
The perceptions of poultry feed formulator respondents concerning the use of cottonseed meal differ importantly in many respects from the combined responses over all survey respondents and from those of beef and dairy cattle Many of the differences are likely the result of the distinct dietary needs of ruminant as opposed to non-ruminant animals The salient differences in responses by poultry feed formulators in the 6 general question areas include the following
bull Factors affecting choice of dietary proteins Surprisingly there was little difference in the responses of those indicating that they formulate feed for poultry than for the combined results (or for beef and dairy cattle) regarding the importance of the listed factors (quality price availability consistency and other) affecting the choice of dietary protein (Table 90) A large majority of poultry feed formulators ranked all factors as either important or extremely important The only exception is that consistency was ranked slightly less important by poultry respondents than by respondents in general
bull Cottonseed meal as an alternative protein feed Poultry respondents ranked more protein feeds as higher on the superior-to-CSM scale than was the case for the combined responses
15
(Table 91) In fact the mean rank of all but three of the protein feeds were all at least somewhat higher than was the case for the combined responses The mean rank of several of the other protein feeds as determined by the poultry respondents was much higher than for the combined responses including fish meal poultry by-product meal and soybean meal Poultry by-product meal changed from an inferior to a superior protein feed compared to CSM The protein feed judged by poultry respondents to be most superior to CSM for poultry rations was soybean meal while urea was ranked as most inferior Poultry respondents also appeared to have stronger opinions about whether or not CSM is an alternative to the other listed protein feeds than was the case for the combined responses They overwhelmingly perceived that CSM is not an alternative to many of the other protein feeds including fish meal dried skim milk dried whole milk poultry by-product meal blood meal tankage and urea A larger percentage of poultry respondents than was the case for dairy and beef cattle perceived however that CSM is a definite alternative to many other protein feeds including safflower meal sunflower meal linseed meal peanut meal canola meal feather meal distillers dried grains brewers dried grains and even soybean meal
bull The importance of nutritional and non-nutritional factors Poultry respondents ranked all but two of the listed nutrition-related factors as more important in the choice of CSM over alternative protein feeds for poultry rations than was the case for the combined responses on average (Le comparing mean responses) (Table 92) The highest percentage of poultry respondents ranked gossypol level (62 of the respondents) amino acid balance (59) aflatoxin (58) protein quality (57) and amino acid availability (57) as extremely important in the choice of CSM over alternative protein feeds Only about 5 of the respondents listed other important nutrition-related factors (Table 93) There are few differences however in the poultry responses as compared to the combined responses regarding the importance of non-nutrition-related factors (Table 94) The major difference is a much lower ranking of the importance of palatability in choosing CSM over alternative protein feeds Also a somewhat higher percentage of poultry respondents ranked price as an extremely important non-nutrition-related factor Few other non-nutrition-related factors were listed by the respondents (Table 95)
bull Seasonality of cottonseed meal availability The results for the poultry respondents regarding the months of the year when CSM is not available are highly consistent with those for the combined responses and those for the beef and dairy cattle responses Poultry respondents indicated that May through September are the months of least availability of CSM (Table 96) But likely because of the shorter production cycle for poultry than for cattle poultry respondents indicated that CSM needs to be available in almost every month (but slightly less so in August and September) for CSM to compete effectively with alternative protein feeds (Table 97) For poultry therefore the indication is that poultry feed formulators may perceive an availability problem which inhibits greater use of CSM in poultry rations to some extent
bull Reasons for the selection and non-selection of cottonseed meal Again price and availability are the number one and number two reasons respectively cited by poultry respondents for which CSM is selected as a feed ingredient (Table 98) Protein quality ranked third on their list followed closely by phosphorous content The top reason that CSM is not selected according to the poultry respondents was pricevalue (Table 99) About tied for second place were gossypol content and availability More respondents ranked availability as the second reason than for gossypol content but more respondents listed gossypol first The amino acid level was listed as a distant fourth reason for which CSM is not selected as a feed ingredient Price is again the key CSM characteristic that poultry respondents indicated must change in
16
order for CSM to be used more frequently in poultry rations (Table 100) Gossypol was clearly considered to be the second most important characteristic that must change Availability was ranked as either first or second by all respondents who listed it as a characteristic that must change
bull Source of chemical analyses for cottonseed meal The results for the chemical analyses performed by poultry respondents are similar to those of both the combined results and those of the beef and dairy cattle results The primary analysis routinely performed by the poultry respondents is crude protein (51 of 55 respondents) followed by fat (40 respondents) fiber (37 respondents) and aflatoxin (31 respondents) (Tables 101 and 102) The primary analytical values supplied to the poultry respondents also included crude protein fiber and fat (Table 103) A third of the poultry respondents indicated that their CSM supplier does not provide them with any analytical values Once again even though aflatoxin was ranked as an extremely important nutrition-related factor in the choice of CSM as a feed component only I respondent obtains an analytical value for aflatoxin from his CSM supplier and only a little over half routinely perform their own aflatoxin analyses
Poultry sample members were asked some specific questions regarding the use of CSM in poultry feed formulations in 5 general areas I) problems resulting from feeding a ration with CSM to the various poultry types 2) specific information on several key nutrition-related factors affecting the use of CSM in poultry rations 3) sources of information utilized on formulating poultry feeds 4) CSM price and value and 5) an open-ended question soliciting suggestions to improve the usefulness or value of CSM for poultry feed formulations
Problems from Feeding CSM Rations to Poultry
The majority of poultry respondents indicated no knowledge of any problems associated with feeding a ration containing CSM to poultry (Table 104) Only 14 of the respondents indicated problems with broilers less than 7 for breeding flocks and about 3 for turkeys Over a third however indicated that they had knowledge of such problems with layers The number one problem reported was yolk molting and discoloration primarily in layer rations (Table 105) A few respondents indicated problems with depressed growth associated with broiler feeds containing CSM
Information on Key Nutrition-Related Factors for Poultry Rations
The survey sample members were asked to respond to a number of specific questions related to nutritional factors that affect the use of CSM in poultry rations including protein energy fat gossypol and synthetic amino acids They were then asked to indicate their perception of the overall feeding value of a standard 41 protein CSM compared to that of a standard 44 protein soybean meal The questions were designed primarily to determine the extent of knowledge among feed formulators concerning these factors as they relate to the use of CSM and the relative feeding value of CSM
Sample members were asked to respond to two questions regarding protein in poultry feed rations They were first asked to indicate the specific protein-related factors that they consider when balancing rations for poultry They were given a list of three factors (crude protein level amino acid content and amino acid availability) They were also allowed to specify any other protein-related factors they consider when balancing poultry rations They were then asked to indicate the crude protein levels they would prefer for cottonseed meal and were given a choice of four levels (3641 (standard) 44 and 48) and allowed to suggest any other preference for crude protein level
17
Almost all poultry respondents indicated that they consider amino acid content and availability when balancing feed rations with fewer responding that they consider the crude protein level (Table 106) Other protein-related factors listed by the respondents included amino acid balance protein digestibility and energy levels (Table 107) With regard to preferred crude protein level for CSM over half of the poultry respondents indicated a preference for 48 crude protein (Table 108) About 27 of the respondents were satisfied with the standard 41 level and 20 indicated a preference for a 44 protein CSM No respondents preferred anything less than the standard 41
With respect to energy levels the sample members were asked to indicate what they considered to be the normal maximum and minimum energy levels for protein feeds for broilers layers turkeys and breeding flock As Table 109 indicates the responses varied widely with little or no indication of a mode (most frequent response) in most cases For broilers the maximum (in K Cals DE per pound) ranged from 0 to 1800 and the minimum from 850 to 1700 with a mean maximum of 1436 and a mean minimum of 1276 For layers the maximum (in K Cals DE per pound) ranged from 1000 to 1800 and the minimum from 800 to 1500 with a mean maximum of 1347 and a mean minimum of 1187 For turkeys the maximum (in K Cals DE per pound) ranged from 1100 to 1725 and the minimum from 850 to 1700 with a mean maximum of 1334 and a mean minimum of 1261 For breeding flocks the maximum (in K Cals DE per pound) ranged from 1000 to 1600 and the minimum from 750 to 1600 with a mean maximum of 1328 and a mean minimum of 1159 Given the disparity in the responses it seems clear that there is little common concept of the normal maximum and minimum energy levels for protein feeds
Sample members similarly were asked to indicate the minimum and maximum fat levels they considered critical for protein feeds Although the range of responses was still quite wide there appeared to be more uniformity in responses to this question than the one for energy (Table 110) The maximum fat levels (ether extract as fed basis) indicated by the respondents ranged from 1 to 15 or 20 for most poultry types The minimums ranged from 0 to 15 The mean minimum levels of fat for all poultry types was about 3 The mean maximum ranged from 6 to 82 depending on the poultry type
Sample members were asked to indicate the level of gossypol they considered safe for poultry rations The responses again varied widely from a low of 0 ppm up to a high of 300 ppm for all poultry types (Table III) The highest mean level of gossypol as calculated from the responses to the question were 104 ppm for broilers and 91 ppm for turkeys For layers and breeding flocks the mean levels were much lower at 57 ppm and 54 ppm respectively
The questionnaire also asked the sample members to indicate if they use or would use synthetic amino acids where economical The response was that nearly 100 of all poultry respondents indicated that they have or would use synthetic amino acids in this situation (Table 112) This suggests little real aversion on the part of feed formulators to utilize synthetic amino acids in least cost poultry formulations
To obtain some insight on the general perception of poultry formulators regarding CSM the sample members were asked to indicate the overall feeding value of a standard 41 protein CSM compared to that of a standard 44 protein soybean meal in their opinion on percentage basis They were given the choice of 5 ranges from under 70 to over 100 in 10 increments (see Table 113 for the actual ranges used) Nearly 80 of the respondents indicated that CSM has an overall feeding value of under 90 of that of soybean meal Given the five choices offered to respondents the mean feeding value was around 80
18
Sources of Information Utilized on Formulating Poultry Feeds
About two-thirds of the poultry respondents indicated that they were familiar with research on feeding CSM to broilers and layers (Table 114) Only half however indicated familiarity with such research for turkeys and only a little over a third for breeding flocks Less than 10 of the respondents listed any other research on feeding CSM to other types of poultry (Table 115) To obtain information on formulating feeds for poultry the largest number of respondents (52 of the 55 respondents) indicated that they utilize university research followed by industry publications of some type (45 respondents) university extension services (26 respondents) and government agencies (20 respondents) (Table 116) Only 17 respondents listed other sources of information including primarily personal experience and research (Table 117)
Cottonseed Meal Price and Value
To get some idea concerning the poultry respondents perceptions of the value of CSM particularly with respect to soybean meal sample members were asked 1) if they would be willing to pay a premium per unit of protein for CSM with more than a standard 41 protein and 2) if gossypol and fiber were sufficiently low on average what percent of the cost of soybean meal they would be willing to pay for CSM
With respect to the first question only about half the respondents indicated a willingness to pay a premium for a CSM with more than 41 protein despite the fact that 75 of them indicated earlier that they would prefer a CSM with a higher crude protein level (Table 118) Thus at least 25 of the respondents prefer a higher protein level CSM but would not be willing to pay a premium to get it
In response to the second question poultry respondents indicated that they would only be willing to pay an average of about 76 of the cost of soybean meal for a CSM with a sufficiently low level of gossypol and fiber (Table 119) The range around that average however was fairly large from 50 to 95 Because CSM has traded at about 91 of the value of soybean meal on the market on a protein equivalent basis and about 85 on an unadjusted basis on average in each year since 1984 either poultry respondents are currently unaware of the historical CSM to soybean meal price relationship or they are indicating that the current CSM market price relative to that of soybean meal is substantially above the levels that most find acceptable
Suggestions for Improving the Usefulness of Cottonseed Meal
Only about 27 of the poultry feed formulators that returned surveys provided suggestions that might improve the value or usefulness of CSM in poultry feed rations (Table 120) Some of the more frequent suggestions included the need for more information on the use of CSM in poultry rations increased availability of CSM and nutrient guarantees
Catfish
The perceptions of catfish feed formulator respondents concerning the use of cottonseed meal correspond closely to those of the poultry respondents likely because of the similar dietary needs of non-ruminant animals The salient differences in responses by catfish feed formulators in the 6 general question areas included on this section of the surveys include the following
bull Factors affecting choice of dietary proteins There were no differences in the responses of those indicating that they formulate feed for catfish than for poultry regarding the importance
19
of the listed factors (quality price availability consistency and other) affecting the choice of dietary protein (Table 121) A large majority of catfish respondents ranked all factors as either important or extremely important as did poultry respondents
bull Cottonseed meal as an alternative protein feed As was the case for poultry catfish respondents ranked more protein feeds as higher on the superior-to-CSM scale than was the case for the combined responses (Table 122) Catfish feeders however ranked meat and bone meal and blood meal as even more superior to CSM than did poultry respondents The protein feeds that catfish respondents ranked as roughly similar to CSM included tankage feather meal peanut meal linseed meal corn gluten meal brewers dried grains distillers dried grains sunflower meal safflower meal and canola meal Catfish respondents also appeared to have nearly as strong views about whether or not CSM is an alternative to the other listed protein feeds as did poultry respondents They perceived that CSM is not an alternative to many of the other protein feeds including blood meal dried whole milk meat and bone meal and dried skim milk Catfish respondents also perceived however that CSM is a definite alternative to many other protein feeds including safflower meal canola meal peanut meal sunflower meal linseed meal distillers dried grains brewers dried grains tankage soybean meal wheat middlings corn gluten meal urea and feather meal
bull The importance of nutritional and non-nutritional factors The responses for catfish with regard to the importance of nutrition-related and non-nutrition-related factors in choosing CSM as a component of catfish feeds were roughly similar to those for poultry (Table 123) The salient differences were that a larger percentage of catfish respondents ranked energy level fat level and fiber level as important or extremely important and a much larger percentage ranked aflatoxin as extremely important One major difference of the catfish responses regarding the importance of non-nutrition-related factors from those of poultry is that palatability is much mOre of a concern to catfish feeders (Table 124) Bin space is less important to catfish respondents and service from the CSM industry is more important to them
bull Seasonality of cottonseed meal availability The results for the catfish respondents regarding the months of the year when CSM is not available were generally consistent with those for poultry except that May and June were perceived as less problematic for obtaining CSM supplies by the catfish respondents (Table 125) Catfish formulators perceive that CSM needs to be more available in April through October than during the rest of the year to be competitive with other protein feeds (Table 126) This suggests the perception on the part of catfish feed formulators of a CSM availability problem during about the first half of any given year
bull Reasons for the selection and non-selection of cottonseed meal Pricevalue is the number one reason cited by catfish respondents for which CSM is selected as a feed ingredient followed by protein quality and palatability (Table 127) The top reason that CSM is not selected according to the catfish respondents is pricevalue followed by quality and gossypol level (Table 128) Gossypol level is the key CSM characteristic that catfish respondents indicated must change in order for CSM to be used more frequently in catfish rations (Table 129) Quality was clearly considered to be the second most important characteristic that must change followed by aflatoxin level This is the only animal species for which price was not the number one characteristic cited that would have to change and was not even listed among the top three responses The implication is that catfish feed formulators may not consider the price of cottonseed meal to be out of line with their needs and thus do not consider price to be a particular problem for the use of CSM in catfish rations A word of caution is in order
20
to avoid taking this conclusion too far because of the relatively few number of catfish feed formulators in the sample
bull Source of chemical analyses for cottonseed meal The results for the chemical analyses performed by poultry respondents are similar to those of poultry as well as those of both the combined results and the beef and dairy cattle results The primary analysis routinely performed by the catfish respondents is crude protein followed by fat fiber aflatoxin and gossypol (Tables 130 and 131) The primary analytical values supplied to the catfish respondents also included crude protein fiber and fat (Table 132) Only 2 of the II catfish respondents indicated that their CSM supplier does not provide them with any analytical values Even though gossypol was ranked as an extremely important nutrition-related factor in the choice of CSM as a feed component and the number one CSM characteristic that needs to change only 5 of the II respondents routinely perform gossypol analyses None of catfish respondents obtain analytical values for aflatoxin from their CSM supplier
As for poultry catfish sample members were asked some specific Questions regarding the use of CSM in catfish feed formulations in 5 general areas 1) problems resulting from feeding a ration with CSM to the various catfish types 2) specific information on several key nutrition-related factors affecting the use of CSM in catfish rations 3) sources of information utilized on formulating catfish feeds 4) CSM price and value and 5) an open-ended Question soliciting suggestions to improve the usefulness or value of CSM for catfish feed formulations
Problems from Feeding CSM Rations to Catfish
Absolutely no catfish respondents indicated any knowledge of any problems associated with feeding a ration containing CSM to catfish (Table 133)
Information on Key Nutrition-Related Factors for Catfish Rations
As for poultry the survey sample members were asked to respond to a number of specific Questions related to nutritional factors that affect the use of CSM in catfish rations including protein energy fat gossypol and synthetic amino acids They were then asked to indicate their perception of the overall feeding value of a standard 41 protein CSM compared to that of a standard 44 protein soybean meal Just as for poultry these Questions were designed primarily to determine the extent of knowledge among catfish feed formulators concerning these factors as they relate to the use of CSM and the relative feeding value of CSM
Sample members were asked to respond to two Questions regarding protein in catfish feed rations They were first asked to indicate the specific protein-related factors that they consider when balancing rations for catfish They were given the same list of three factors (crude protein level amino acid content and amino acid availability) to choose from that the poultry sample members were given Again they were also allowed to specify any other protein-related factors they consider when balancing catfish rations They were then asked to indicate the crude protein levels they would prefer for CSM and were given the same choice of four levels as the poultry sample members (36 41 (standard) 44 and 48) and allowed to suggest any other preference for crude protein level In contrast to poultry the largest percentage of catfish respondents indicated that they consider amino acid availability (10 of the 11 catfish respondents) rather than the content when balancing catfish rations (Table 134) The second largest percentage consider crude protein level (9 respondents) also a different result from poultry
21
With regard to the crude protein level for CSM preferred by catfish respondents about 43 indicated a preference for 48 crude protein (Table 135) About 20 of the respondents were satisfied with the standard 41 level and nearly 30 indicated a preference for a 44 protein CSM No respondents preferred anything less than the standard 41 The mean preferred crude protein level was about 42
With respect to energy levels the catfish sample members were asked to indicate what they considered to be the normal maximum and minimum energy levels for protein feeds for fingerlings grow out stock brood stock and fries Despite the low number of catfish respondents the answers to this question were widely divergent (Table 136) For fingerlings the maximum (in K Cals DE per pound) ranged from 1250 to 1800 and the minimum from 2 to 1500 with a mean maximum of 1525 and a mean minimum of 834 For grow out stock the maximum (in K Cals DE per pound) ranged from only 1500 to 1600 and the minimum from 1 to 1300 with a mean maximum of 1550 and a mean minimum of 750 For catfish brood stock the maximum (in K Cals DE per pound) ranged from 1300 to 1700 and the minimum from 1200 to 1400 with a mean maximum of 1500 and a mean minimum of 1300 For fries the maximum (in K Cals DE per pound) ranged from 1250 to 1800 and the minimum from 900 to 1500 with a mean maximum of 1525 and a mean minimum of 1200 Given the disparity in these responses it seems clear again for catfish feed formulators that there is little common concept of the normal maximum and minimum energy levels for protein feeds
Catfish sample members similarly were asked to indicate the minimum and maximum fat levels they considered critical for protein feeds As with poultry the range of responses was still quite wide but there also appeared to be more uniformity in responses to this question than the one for energy level (Table 137) The maximum fat levels (ether extract as fed basis) indicated by the respondents again ranged from 1 to 15 for most catfish types as was the case for poultry The mean minimum levels of fat for all catfish types ranged from about 3 to 5 The mean maximum ranged from 6 to 10 aCrOSS the different catfish types
Catfish sample members were also asked to indicate the level of gossypol they considered safe for catfish rations The responses again varied widely from a low of 0 ppm up to a high of 300 ppm for some catfish types (Table 138) The two highest mean safe levels of gossypol were 97 ppm for grow out stock and 83 ppm for brood stock For fingerlings and fries the safe maximum mean levels were much lower at 44 ppm and 23 ppm respectively
The questionnaire also asked the sample members to indicate if they use or would use synthetic amino acids where economical The response was that 83 (all but 2) of the catfish respondents indicated that they have or would use synthetic amino acids in this situation (Table 139) This suggests little real aversion on the part of feed formulators to utilize synthetic amino acids in least cost catfish formulations
To obtain some insight on the general perception of catfish formulators regarding CSM the sample members were asked to indicate their opinion of the overall feeding value of a standard 41 protein CSM compared to that of a standard 44 protein soybean meal expressed on a percentage basis They were given a choice of 5 ranges from under 70 of the feeding value of soybean meal to over 100 in 10 increments (see Table 140 for the actual ranges used) All but one of the catfish respondents indicated that CSM has an overall feeding value of under 90 of that of soybean meal Given the five choices offered to respondents the mean feeding value of CSM relative to that of soybean meal was around 80
22
Sources of Information UtiJized on Formulating Catfish Feeds
Only about half of the catfish respondents indicated that they were familiar with research on feeding CSM to grow out stock and only a third were familiar with research on fingerlings (Table 141) Only 2 respondents were familiar with any research on feeding CSM to brood stock and fries To obtain information on formulating feeds for catfish the largest number of respondents indicated that they utilize university research and industry publications of some type (Table 142)
Cottonseed Meal Price and Value
Catfish sample members were also asked two Questions to get some idea concerning their perception of the value of CSM particularly with respect to soybean meal 1) if they would be willing to pay a premium per unit of protein for CSM with more than a standard 41 protein and 2) if gossypol and fiber were sufficiently low on average what percent of the cost of soybean meal would they be willing to pay for CSM
With respect to the first Question 75 of the catfish respondents indicated a willingness to pay a premium for a CSM with more than 41 protein which is consistent with their earlier responses that they would prefer a CSM with a higher crude protein level (Table 143)
In response to the second Question catfish respondents indicated that they would only be willing to pay an average of about 82 of the cost of soybean meal for a CSM with a sufficiently low level of gossypol and fiber (Table 144) The range around that average was more narrow than for poultry from 70 to 100 This is more consistent with the ratio of CSM price to soybean meal price that has existed over the last 7 or 8 years on average
Suggestions for Improving the Usefulness of Cottonseed Meal
Only three catfish respondents offered suggestions for improving the usefulness or value of CSM for catfish rations The three suggestions included I) providing a more consistent product in price and Quality 2) providing a premium Quality toxin-free high protein low-fat product superior to soybean meal and 3) eliminating the CHO fraction (Table 145)
Comparisons Among Animal Species
In order to highlight the salient differences in responses with respect to the various animal species the mean responses to Questions that are common among all surveys regarding CSM use as a feed ingredient were compared and analyzed An analysis of variance (ANOY A) was also done to detect statistically significant differences in the mean responses to each Question by animal specie Comparisons are made among the mean responses to all Questions in the 6 general areas to which all sample members were asked to respond regardless of the animal specie(s) for which they formulate feeds 1) the particular factors affecting their choice of dietary proteins for formulated feeds 2) the extent to which CSM is considered to be an alternative to selected protein feeds 3) the importance of nutritional and non-nutritional factors in their decisions to use CSM rather than alternative dietary proteins in their feed formulations 4) the seasonality of CSM availability 5) the specific reasons for the selection and non-selection of CSM for use in the feeds they formulate and 6) the source of CSM chemical analyses used by the respondents Where appropriate ANOY A results are also indicated
23
Factors Affecting Choice of Dietary Proteins
As discussed earlier all members of the final sample regardless of the animal species for which they formulate feeds were asked to rank the importance of four general factors in their choice of a dietary protein for their feed formulations on a scale of I to 7 (from extremely unimportant to extremely important respectively) 1) quality 2) price 3) availability and 4) consistency Comparing the results across animal types reveals few significant differences in the importance attached to any of the four factors by the responding formulators of the various animal specie feeds (ie comparing results horizontally in Table 146) But as pointed out in an earlier section the mean rankings for quality are all higher than those for the other factors while the mean rankings of price are all lower than those for most other factors across all animal types In other words the respondents consistently ranked quality highest on the scale of importance followed in order by consistency availability and price
Cottonseed Meal As An Alternative Protein Feed
Recall that the sample members were asked to rank various selected protein feeds on a scale of 1 to 7 as inferior or superior to CSM in an overall sense for use in feed formulations A second question required respondents to indicate whether or not they considered CSM to be an alternative to each of the 20 listed protein feeds A comparison of the mean ran kings and ANOV A results across animal types indicates substantial agreement among the respondents regarding the ranking of CSM as an alternative to some animal feeds and substantial disagreement with respect to CSM as an alternative to many others (Table 147) Respondents over all animal types tended to agree that certain feeds and in particular the higher crude-protein-content feeds are clearly superior to CSM including dried skim milk meat and bone meal fish meal blood meal soybean meal dried whole milk and corn gluten feed There was a statistically different deviation in the extent to which respondents for some animal species regarded those meals as superior however For example catfish respondents ranked meat and bone meal fish meal poultry by-products blood meal soybean meal and corn gluten meal higher than did respondents for the ruminant animals The same was roughly the case for poultry Beef and dairy cattle respondents tended to rank all other protein feeds as less superior (ie more inferior) to CSM There was also substantial agreement that CSM was about the same as tankage peanut meal linseed meal and brewers and distillers dried grains but superior to some extent over the other feeds particularly those lower in crude protein including dehydrated alfalfa sunflower meal wheat middlings safflower meal canola meal feather meal and urea Beef and dairy cattle respondents agreed that CSM can be considered an alternative to nearly all the protein feeds except perhaps skim and whole dried milk Poultry and catfish respondents indicated CSM is an alternative to fewer of the other protein feeds
The Importance of Nutritional and Non-Nutritional Factors
Respondents also ranked the importance of specific nutrition-related and non-nutritionshyrelated factors in choosing cottonseed meal as a component of the feeds they formulate on a scale of extremely unimportant to extremely important (a scale of I to 7 respectively) Comparing the mean rankings by the respondents reveals that poultry and catfish feed formulators clearly consider proteinshyrelated factors and gossypol level to be more important than do beef and dairy feed formulators (Table 148) Fiber level is also of more importance to formulators of catfish feed Interestingly the importance of fiber was not ranked significantly higher by poultry feed formulators than by beef and dairy cattle feed formulators At the same time aflatoxin was clearly ranked by all respondents as the most important factor affecting the choice of CSM as a feed ingredient irrespective of the animal specie for which the ration is intended
24
For the non-nutritional factors an analysis of the mean rankings indicates few significant differences in the responses across animal species with respect to each individual factor listed (Table 149) The most notable exception is that poultry respondents ranked palatability significantly less important than did any of the other respondents for the other animal species Finally catfish respondents perceived that service by the CSM industry was more important for them than did the respondents for the other animal species
Seasonality of Cottonseed Meal Availability
The respondents across all animal species indicated that CSM is least available between about May and October likely reflecting the increasing shortages of cottonseed meal supply just prior to the cotton harvest in the fall (Figure 20) At the same time however the beef cattle dairy cattle and poultry respondents all indicated that there is less need for CSM to be available during approximately those same months in order to compete effectively with other protein feeds (Figure 21) This suggest that the seasonality of supply may not represent an important constraint to competitiveness and growth possibilities of CSM as a feed ingredient Interestingly catfish respondents suggested a largely inverse pattern of the times of the year when CSM needs to be available to compete effectively with other protein feeds as a catfish feed ingredient Possible explanations of this phenomenon include I) the protein feed needs of catfish feed formulators peak in the late spring and summer months when supply is less available 2) catfish feed formulators are located such that CSM is not easily obtainable particularly during short supply years or 3) formulators of feed for other animal species have longer experience in using CSM and have adjusted their formulation to the pattern of CSM supply availability In any case it should be remembered that there are relatively few catfish feed formulators in the sample so that their joint responses may not be truly representative of all catfish feed formulators In this case this difference in their responses may mean little
Reasons for the Selection and Non-Selection of Cottonseed Meal
Respondents across animal species were quite consistent in their ranking of the top reasons that CSM is included in feed formulations (Table 150) They overwhelmingly ranked price as the top reason followed generally by availability and protein quality Catfish respondents differed somewhat from that order ranking protein quality second and palatability as third Availability was ranked fourth by catfish respondents The top reason all respondents listed for which CSM is not included in feed formulations was also price (Table lSI) Beef and cattle respondents ranked availability as second but poultry respondents ranked gossypol second while catfish respondents ranked protein quality second A vailability ranked only as the third reason that CSM is not selected by poultry respondents and fourth by catfish respondents Gossypol ranked either third or fourth for all animal species except poultry for which gossypol appears to be a more important reason for not including CSM in poultry feed formulations The question regarding the characteristics of CSM that would have to change in order for it to be selected more frequently as a feed ingredient elicited about the same responses as those for the previous question concerning why CSM is not included in feed formulations (Table 152) The top characteristic that would have to change in the opinion of most respondents is price Catfish respondents however listed price extremely low on their list suggesting that other factors are more of a constraint to CSM use in their opinion They ranked gossypol as the number one characteristic that would have to change Availability appeared to be more of a concern to beef and dairy feed formulators than for poultry and catfish formulators
25
Source of Chemical Analyses for Cottonseed Meal
About the same percentage of respondents across animal species perform analytical tests for aflatoxin crude protein fat fiber and gossypol (Figure 22) The only noticeable differences were for aflatoxin and gossypol for which about half the percentage of dairy and beef respondents compared to catfish respondents reported that they routinely perform tests A higher percentage of poultry respondents also appear to perform tests for aflatoxin and gossypol than is the case for beef or cattle respondents Crude protein is tested for by the highest percentage of respondents for all animal species while gossypol is tested for by the smallest percentage of all respondent groups except catfish CSM suppliers are more likely to provide feed formulators with analytical values for crude protein fat and fiber than for aflatoxin or gossypol (Figure 23) A sizeable percentage of the respondents across all animal types reported that their CSM supplier provides no analytical values whatsoever
Summary ofMajor Findings
Of the reams of information normally provided by a study like this relatively little is usually new or profound And of what can be found that appears important only some is little more than interesting or particularly useful Before turning to a discussion of the implications of the study results the major findings across animal groups are briefly summarized first Sifting through the many tables figures and data sets the main findings of the study appear to be the following
bull Quality is the most important factor affecting the choice of dietary proteins by feed formulators followed by consistency and availability Price is the least important of the four factors in making general decisions regarding dietary proteins for animal diets
bull Once feed formulators have set the general parameters for use of dietary proteins in their formulations however price is the most important factor determining the choice among alternative dietary proteins to satisfy the general parameters for dietary protein use in feed formulations
bull When considering whether or not to use CSM as the dietary protein in feeds the nutritional factors of most concern to formulators of feed for non-ruminant animals (poultry and catfish) appear to be protein-related For formulators of ruminant (beef and dairy cattle) feeds aflatoxin level and rumen degradability are the most important nutritional factors
bull The most important non-nutritional factors affecting feed formulators decisions regarding whether or not to use CSM are I) price 2) availability 3) consistent quality and 4) palatability in that order
bull Non-nutritional factors are more important than nutritional factors in the choice of CSM over alternative feeds to fill the dietary protein requirements of feed formulations In general price and availability were ranked above protein quality and other nutrition-related factors as reasons why CSM is and is not chosen as a feed ingredient over alternatives Price and availability were also cited as the characteristics that most need to change in order for CSM to be selected as a feed ingredient more frequently
bull CSM is generally considered to be inferior to higher protein feedstuffs and superior to lower protein feedstuffs This generalization however does not hold for all feeds and all animal types Formulators of ruminant animal feeds ranked many of the higher protein feeds more on a par with CSM than did formulators of non-ruminant animal feeds
26
bull The seasonality of CSM availability is both a positive and a negative factor affecting the use of CSM rather than alternative protein feeds in animal feed rations That is CSM is obviously more likely to be selected as a feed ingredient during months of greater availability than during the months of lower availability In general however the survey responses indicate that CSM is normally available when feed formulators perceive that it needs to be available One word of caution It may be that a higher percentage of CSM users agreed to participate in this survey than those who are currently not using CSM Those who are current CSM users may well have already adjusted their feed purchasing patterns and operations to reflect the seasonal changes in the availability of CSM Consequently current CSM users may perceive less of an availability problem than those who are not currently using CSM In this case the responses to these questions may not be truly representative of the perception of the availability of CSM by feed formulators in general
bull There is a tremendous disparity in the perception of respondents as to the appropriate levels of several key nutrition-related factors for specific livestock rations including energy levels fat levels gossypol levels and escape values (ruminants only) for cottonseed meal For each animal specie the range of variation in the perceived acceptable levels of each of these factors was extremely wide The obvious conclusion is that feed formulators generally lack adequate and reliable information on many factors which are crucial in efficient feed formulation and which have a significant impact on the choice of CSM as a feed ingredient
PROBLEMS AND OPPORTUNITIES FOR EXPANDING COTTONSEED MEAL USE
CSM is somewhat unique among vegetable protein meals in that it is the product of a byshyproduct The volume of the by-product cottonseed available for crushing and the potential supply of CSM depend more on the dynamics of cotton supply and demand than on forces specific to CSM markets This mean that market signals from feed formulators and livestock feeders regarding desired values and characteristics of protein meals likely have little impact on the potential CSM market supply
Since the mid-1970s the share of the annual production of cottonseed fed directly to ruminant livestock has increased steadily from about 5 in 1974 to nearly 40 in 1990 (Figure 24) The consequence has been a marked decline both in the share of the available supply of cottonseed that is crushed and in the ratio of actual to potential cottonseed meal output An increase in the demand for CSM therefore will either bid up the market price of CSM with no additional volume actually used or increase the cottonseed crush to feed use ratio (or some combination thereof) There will be little or no effect on the total amount of cottonseed available
The intent of efforts to expand the market for any commodity is to effect an increase in sales at a higher price For a commodity with a relatively fixed supply the major result of an expansion in demand is solely an increase in price because supply cannot increase to allow an increase in use For a commodity with an unlimited supply successful market expansion efforts simply increase use to the extent of the promotion with no increase in price For a commodity with a supply somewhere in between those two extremes successful market expansion will increase both the price and quantity used Although the situation for cottonseed meal is closer to the fixed supply end of the spectrum market expansion efforts can increase the use of cottonseed meal through an increase in the crush-toshy
27
feed cottonseed use ratio This ratio will increase as the profitability of crushing vs alternative uses of the seed increase
The results of this survey however indicate both some problems and possible opportunities for expanding cottonseed meal use After briefly summarizing the major obstacles as identified in the study the major opportunities for expanding use of cottonseed meal will be discussed
Problems for Expanding Cottonseed Meal Use
The major problems for expanding CSM use are generally well known and verified by the survey results The major problems that would hinder efforts to expand cottonseed meal use identified in the study included primarily the following
bull Price and availability of CSM are the major factors affecting the selection or non-selection of CSM as an ingredient of feed formulations regardless of animal specie These nonshynutritional factors were judged to be more important than nutritional factors in selecting CSM as a feed ingredient Unfortunately neither the price nor the availability of CSM can be controlled or altered substantially or directly by market expansion efforts Some efforts to improve availability may be possible as discussed in the next section
bull CSM is perceived to be inferior in an overall sense to a number of key protein feeds CSM was judged by the survey respondents to be clearly superior in aggregate to only 5 of 20 potential alternate protein feeds Such an image could work against efforts to expand CSM use
bull Gossypol level is one of the top reasons that CSM is not used more frequently particularly in non-ruminant feed rations The level of gossypol is a unique characteristic of CSM that obviously cannot be changed through market expansion activities
bull Several other specific characteristics of CSM would likely need to change for CSM to be selected more frequently as a feed ingredient including amino acid balance energy level aflatoxin level and protein quality As with gossypol changes in these characteristics are out of the realm of market expansion programs
bull Feed formulators generally lack adequate and reliable information on many factors which are crucial in efficient feed formulation and which likely have a significant impact on the choice of protein feedstuffs The use of CSM in livestock feed rations is likely restricted by the wide disparity in the perception of feed formulators regarding the appropriate levels of several key nutrition-related factors for specific livestock rations including energy levels fat levels gossypol levels and escape values (ruminants only) for cottonseed meal
bull Over 75 of dairy cattle feed formulators and nearly half of beef cattle feed formulators utilize whole fuzzy cottonseed to some extent in some of the feed rations they formulate Relatively few reported using utilizing both CSM and whole cottonseed in the same ration A main attraction of the use of whole fuzzy cottonseed as opposed to cottonseed meal is the fiber content Indeed the use of whole delinted cottonseed in cattle feed rations is much lower
28
Opportunities for Expanding Use of Cottonseed Meal
There are essentially only two basic tools to expand the market for any commodity l market development and 2) enhancing the efficiency of the marketing system Market development involves a wide range of activities including primarily new product development and product differentiation In new product development the effort is to develop new products or characteristics of products that appeal to different segments of consumers An example might be research leading to the elimination of gossypol in cottonseed meal which could further open up the non-ruminant feed industry to cottonseed meal
Product differentiation on the other hand encompasses those activities designed to create a user preference for or loyalty to a commodity Product differentiation occurs in two major forms 1) advertising and 2) variation in design and quality of product The primary purpose of advertising is to create user preference for a commodity and convince users of the superiority of a product over competing products Actual physical differences in the product are not necessary to successfully differentiate it from competing products It is sufficient only that users believe that some superiority exists Advertising often intends to create an image of superior quality because such images are harder to imitate or successfully counter than physically unique features Successful differentiation of a product means that users become less sensitive to price changes more willing to pay a higher price for the same quantity because they prefer the product and are loyal to it in the face of price increases In other words users are willing to pay more for the same amount because advertising if successful creates a preference for the product over competing products
Variations in quality and design are usually used along with advertising to differentiate the product of one seller from that of another Such variations are often necessary to help create the superior images desired andor attract new sets of consumers
Often barriers exist in a marketing system that hinder the efficient functioning of the market and restrict the flow of commodities from sellers to users Enhancing the efficiency of the marketing system through eliminating such barriers can lead to an expansion in the use of a commodity One of the primary requirements of an efficiently functioning market is that sellers and users possess adequate and accurate information regarding the product its characteristics availability sources uses and value among other things Inadequate or inaccurate information regarding a particular product and other market characteristics can divert demand to alternative products with which users may be more familiar regardless of whether or not those products are better in some sense
The concept and importance of enhancing market efficiency in this regard can be illustrated by comparing the flow of information about a product and market conditions with a radio broadcasting system The efficiency of such a system depends on how accurately the microphone and other equipment record sound how accurately and rapidly that sound is transmitted to a radio receiver and how accurately the receiver brings sound to the listener A breakdown anywhere along the line in that system will simply mean that the message of the broadcast does not get from the radio station to the listener Also if the message gets through but static interferes with the transmission the listener might only receive part of the message or a garbled message The listeners impressions and actions consequently might be quite different than if he had received the message intended In quite the same manner the flow of a commodity from producers to users is affected by how rapidly and accurately market information is evaluated and how accurately and rapidly this information is transmitted to and among producers and users Any breakdown or static in the system would result in a smaller and more obstructed flow of the commodity to users than if the market operated more efficiently
29
The survey results suggests possible opportunities for expanding CSM use through market development and enhancing market efficiency Market development opportunities may be limited because of the nature of the CSM supply situation Nevertheless expansion of CSM use is possible through a reduction in direct feeding of cottonseed so that opportunities for expanding use through market expansion efforts should not be discounted Efforts to enhance the adequacy and accuracy of information regarding the use of CSM as a feed ingredient however may well be the most effective means of promoting an expansion of use or enhancement of the value of CSM
Opportunities for Expansion through Market Development
Although many product development opportunities likely exist for CSM the survey basically focused on the image of CSM in the perception of feed formulators If a market development approach to expanding the use of CSM as an ingredient of animal feed formulations has any chance of success the survey results suggest that the following components of such a strategy will be crucial
bull Product quality and consistency and an improved image of availability must be the major targets of promotion efforts The survey responses across all animal types unequivocally indicated that these three factors are the prime considerations in making general decisions regarding dietary proteins for animal rations Price only becomes a factor in specific decisions regarding the particular protein feed to use to fill the dietary protein requirements of feed formulations after these general concerns are addressed Creating an image of quality consistency and availability for CSM is a necessary first step to expanding use and enhancing value
bull CSM use expansion efforts must focus to some extent on reducing the direct feeding of whole cottonseed to beef and dairy cattle Reductions in direct feeding is the only chance for an increase in supply of CSM to fuel expanded use in newer markets such as catfish and poultry feeding Also because beef and dairy cattle are major users of cottonseed meal a decrease in feeding of whole cottonseed in favor of CSM would significantly expand use
bull Separate CSM market promotion messages must be developed to address the very different needs and concerns of ruminant vs non-ruminant feed formulators The survey results clearly indicate that many nutritional and non-nutritional factors are more important for nonshyruminant feed formulators than for ruminant feed formulators and vice versa
bull The nutrition-related content of CSM market promotion messages must emphasize primarily positive aspects of CSM protein quality amino acid balance and amino acid availability as well as an accurate understanding of appropriate gossypol and aflatoxin levels Many of these factors however are more important for non-ruminant rather than ruminant feed formulators which must be accounted for in designing appropriate messages for feed formulators of each animal type
bull The non-nutrition-related content of CSM market promotion messages may well be the most important and must emphasize primarily the positive aspects of price availability consistency of quality and storability The survey results attached a relatively high level of importance also to nutrient guarantees Although not scoring particularly high in the responses services available from the CSM industry may also be a helpful component of CSM use promotion messages
30
Opportunities for Expansion through Market Emciency Enhancement
Even though some gains in CSM use and market value can reasonably be expected through market expansion efforts the cost involved could easily outweigh any benefits in terms of enhanced profits to the CSM industry Perhaps the most cost-effective appropriate and useful means of enhancing the use of CSM would be a strategy aimed at improving the level and accuracy of information available regarding CSM and its use Lack of information or misinformation can easily discourage feed formulators from using CSM in their feed formulations Strategies to enhance the quantity and accuracy of appropriate information can take on many forms from media advertising to market news letters Although it is beyond the scope of this study to develop alternative information strategies the results of this study clearly indicate a number of areas in which enhanced and more accurate information is a critical need These include the following
bull The overall quality of CSM The study suggests that the negative aspects of CSM are well known Less well known are the specific positive aspects of CSM that may give it an edge in some sense over other protein feeds
bull The ideal ratio of the price of CSM to other feeds like soybean meal The study results indicate that feed formulators may not be adequately informed about what the ideal market value of CSM is relative to soybean meal given the differences in feeding value As a consequence CSM may currently be less used in relation to soybean meal than current market price ratios suggest should be the case
bull Protein-related factors for CSM use in non-ruminant feeds These factors are a major concern in the decisions of feed formulators to include or exclude CSM in feed rations
bull The relationship of aflatoxin to CSM and the rumen degradability of CSM particularly for beef and dairy cattle feed formulators These were the nutritional factors of greatest concern to ruminant feed formulators in the decision to include CSM in their feed formulations
bull CSM price availability consistency and palatability These were indicated to be the most important non-nutritional factors affecting feed formulators decisions regarding whether or not to use CSM The study indicates that information on non-nutritional factors may be more important in the decision to use CSM over alternative feeds to fill dietary protein requirements of feed rations than information on nutritional factors
bull The feeding value of CSM relative to alternative protein feeds An accurate and detailed assessment of the extent to which CSM may be superior as an alternative to other standard protein feeds would help position CSM appropriately in the market
bull The appropriate and acceptable levels of several key parameters affecting the use of CSM in animal feed rations including energy levels fat levels gossypol levels and escape values (ruminants only) Feed formulators generally lack adequate and reliable information on these and likely other parameters not included in the study which are crucial in efficient feed formulation and which have a significant impact on the choice of protein feedstuffs Although it appears that nearly all feed formulators routinely perform crude protein analyses few perform analyses for aflatoxin gossypol fat fiber and other parameters Also CSM suppliers are apparently doing an inadequate job currently of providing such information to feed formulators
31
SOME CONCLUDING COMMENTS AND RECOMMENDATIONS
This study assessed the potential problems and opportunities for expanding the use of CSM through an analysis of the perceptions of feed formulators regarding the use of CSM as an animal feed ingredient The perceptions of feed formulators regarding CSM as a protein feed largely define the boundaries within which CSM use will be able to achieve any significant growth in the future Their perceptions right or wrong are the key to understanding not only the problems facing CSM use but also the opportunities
The general conclusion of the study is an obvious one the use of CSM in feed formulations faces some major challenges in the future Chief among these include a perception among feed formulators that price availability quality and other key CSM characteristics are often obstacles precluding increased use of CSM in their feed formulations Perhaps the most important implication of the study is that a serious lack of adequate and accurate information among feed formulators regarding the characteristics parameters value and other aspects of cottonseed meal use in animal feed rations may be seriously restricting the market opportunities for cottonseed meal U nfortunately the development of alternative strategies to expand the use of CSM and enhance the efficient functioning of CSM markets through more accurate and available information on all aspects of CSM use in feed formulations is beyond this study Nevertheless a few recommendations pertinent to the development of such alternative strategies are in order
bull Before adopting any approach to expand the use of CSM it would be useful first to conduct a detailed analysis of the costs and benefits involved Market promotion efforts through advertising can be extremely costly and yield relatively little Research has also shown that there is often a tremendous lag between advertising and promotion expenditures and any associated returns It could take years of investment in such market expansion efforts before an accurate measurement of the actual return on investment could even be attempted
bull Consider developing first a detailed plan for information dissemination to the feed industry regarding all appropriate aspects of CSM use in feed rations as determined in this study An important part of this process would be a comprehensive assessment of the information needs and the information resources readily available The gap discovered in this way between needs and resources will help set the research agenda for the industry to fill the critical existing information gaps
bull Initiate a study of final user attitudes and perceptions of CSM use as a guide to future market expansion efforts This study considered only the perceptions of feed formulators regarding the use of CSM But feed formulators are often not the final users Consulting nutritionists for example often include or exclude certain feeds and feed types from their formulations as requested by feed users At least a few of the respondents to the survey conducted for this study indicated that user preferences are major factors determining whether or not CSM is included in their feed formulations Indeed markets operate as the interaction of supply and demand to determine prices The preferences of final users ultimately will be expressed in the market values of any product in any market unless sufficient obstacles exist to prevent the market from functioning properly Therefore the real decision-makers in the use CSM in the market may well include many more individuals than adequately represented by feed formulators
32
REFERENCES
US Department of Agriculture (USDAa) Feed Situation and Outlook Report Economic Research Service FDS series various issues
US Department of Agriculture (USDA b) Oil Crops Situation and Outlook Yearbook Economic Research Service OCS Series various issues
Figure 1 Quantity of Oilseed Meals Fed to Livestock 194849 - 198590 (Average)
(1000 Tons)
25000 0-1-----------------------shy
20000 I-~
15000
10000
5000
o L 1 J tJ t tmiddotmiddotmiddot 1 oj 1 to bullbull 1 L_ n __LLL I 1 bullbull I V I
1948-49 1950-54 1955-59 1960-64 1965-69 1970-74 1975-79 1980-84 1985-90
(Years)
n iflu Soybean Meal bull Cottonseed Meal Other Oilseed Meals
Source USDA
c
8 c a CD
en ~
--I _ scg ~CD 01)-- en - () mg0 s 0
JCD enOJ CD_CD en 0
sCDCD 0 OJ shyo OJ r Jlt- 0 m CJ) 0 0lt o 0shyCD OJ J
~s ~m cpCJ) r co OJco ~m a
Figure 3 Price Premium (+) or Discount (-) of Cottonseed Meal Relative to Soybean Meal 1956-1990
~~ ~
o I ~ I I
-20 f---
-40
-60
1~1~1~1~1~1~1~1~1~1~1~1~1~1~1~1~1~1~
Cottonseed meal price is adjusted to a soybean meal protein equivalent basis
~I------------------------------------------------------
l l A
I~middotmiddot--- --------
Figure 4 Animal Species for which Respondents Formulate Feeds
DAIRY CATILE
BEEFCATILE
HORSES
SHEEP
BROILERS
LAYERS
OTHER
PETS
TURKEY
SWINE
CATFISH
210
21000
0 5 1000 15 20 25
Figure 5 Respondents Formulating Feeds for the Various Animal Species
0 20 40 60 80
Figure 6 Other Animal Species for Which Respondents Formulate Feeds
DAIRY CATTLE
BEEF CATTLE
HORSES
SHEEP
BROILERS
LAYERS
OTHER
PETS
TURKEY
SWINE
CATFISH
632
Exotics
Trout
Alligators
KOI
Breeding Hens
Wildlife
Rabbits
Avian
Shrimp
Salmon
Ducks
Fish
Gamebirds
Hybrid Bass
379
~--~----~--~----~----~--~----~--~----~--~
0 10 20 30 40 50
Figure 7 Respondent Feed Formulation Activities by State
( of Respondents)
o 00 middot15 16 -30 31 middot45Cgt 46 -60 61 - 75 - 76 -90
Table 8 Respondent Experience as an Animal Nutritionist
( of Respondents) 30 r---shy
25 t-middotmiddotmiddotmiddotmiddotmiddotmiddotmiddotmiddotmiddotmiddotmiddotmiddot-middot ---_ _
20 -_ -nNItshy
15
10
5
0 1-5 6-10 11-15 16-20 21-25 26-30 31-35 36-40 41-45
(Years Of Experience)
-it sa 0 m 8 l 0 CD l g
_ cc c -s CD CObull
-0 -s- 3 Dl ~ IJ CD (fJ
C 0 l C CD l -+
raquo Sl_ lt_ -+_ CD (fJ
Figure 10 Respondent Primary Feed Formulations
by Animal Type 1990 (Percent)
30 I--------------------------------------------------------shy
25 r- middotmiddotmiddotmiddotmiddotmiddot231middotmiddotmiddotmiddot
20
15
10
5
0 Beef Dairy Swine Poultry Horses Pets Aqua- Sheep Exotics
Cattle Cattle culture amp Goats
(Animal Type)
Figure 11 Percent of CSM and S8M Used in Formulations by Feed Manufacturer Respondents 1990
( of Average Feed Ration)
Figure 12 Tons of Feed Formulated by Feed Manufacturer Respondents 1990
65
91
6 9
17
Total Formulations Formulations With CSM
II Less than 200000 Tons
II 200000 - 400000 Tons bullbullbull I bullbullbullbullbullbull ~ 3 ~ 400000 - 600000 Tons
5 rn 600 000 - 800 000 Tonsru 1
[] 800000 - 1000000 Tons9 4
I ~ 1 More Than 1000000 Tons
Formulations With S8M
Figure 13 Percent middotof Beef Cattle Respondents Formulating CSM Feeds for Specific Beef Cattle Types
( of Respondents)
25 ~I------------------------------------------------------~
-Isectig Feedlot-II 223
20
15
10
5
0
bull Other
~ middotmiddotmiddotmiddotmiddotmiddotmiddot middotmiddot _middotmiddotmiddotmiddot-=middotmiddotmiddotccmiddotcmiddotmiddot
Brood Cows Bulls Calves Feeder Heifer Stocker
(Animal Type)
Figure 14 Percent of Dairy Cattle Respondents Formulating CSM Feeds for Specific Dairy Cattle Types
( of Respondents)
120 ----------------------
100 88
80
60
40
20
0 Calves Heifers Lactating Cows Dry Cows
(Animal Type)
Figure 1-5 Percent of Poultry Respondents Formulating CSM Feeds for Specific Poultry Types
( of Respondents)
OO~I--------------------------------------------~-
50 1-laquolaquolt--laquolaquolaquo -lt - lt - lt -lt laquo lt
44
40
30
20
10
0
f-
~laquolaquolaquolaquo
~laquolaquolaquolaquolaquolaquo
Broilers Layers Turkeys Breeding Flocks
(Animal Type)
Figure 16~ Combined Responses Months of the Year When CSM IS NOT Available
( of Respondents) 16 i ---
14 12~8
12
10
87373 7
6
4
2
0 ~~ ~s ~( ~( ~0( ~0(~~~ ~~ ~t ~1 u~ ~g n0~ ad-o N0~ ~a~
~Y ~o Q~lmiddotr
(Month)
Figure 17 Combined Responses Months of the Year When CSM Needs to Be Available
( of Respondents) 12 ---------------------------
10
8
6
4
2
0
goA 9
~ui ~s ~Ot X)Ot ~Ot X)Ot~0SV~0~~erl ~iSclt ~f ~~1 ~v~ ug ~o~ o~o NO~ co~0 0lt609 ~o
(Month)
Figure 18 Beef Cattle Responses Percent of Respondents Formulating Creep Feed for Calves or Supplements for Stockers
733
832
0 20 40 60 80 100 120
( of Respondents)
Figure 19 Beef Cattle Responses Protein-Related Factors Considered When Balancing Rations
Other Protein Factors 110
Rumen
Degradability 686
Crude Protein Level 161
Amino Acid
Values 42
( of Respondents)
Figure 21 Comparison of Responses Months When CSM Needs to Be Available
( of Respondents) 94 ---------------------------shy
92
9
88
86
84
82 8
78
76
74
72
7
68
66
~ euroI - It
64 -t----------------------------------- -----------t
JAN FEB MAR APR MAY JUN JUL AUG SEP OCT NOV DEC
(Month)
bull Beef Cattle -t Dairy Cattle ltgt Poultry Catfish
Figure 20 Comparison of Responses Months When CSM Is Not Available
( of Respondents)
16 t 15
14
13
12
11
10
9
8ltl amp
7
6
5 I JAN
I
FEB I
MAR I
APR I
MAY I
JUN I
JUL I
AUG SEP I
OCT NOV I
DEC
(Month)
bull Beef Cattle -t Dairy Cattle ltgt PouHry b Catfish
Figure 22 Comparison of Responses Analyses Routinely Performed
( of Respondents)
100~-----------------------------------------------
90
80
70
60
50
40
30
20
10
o I ~
AFLATOXIN C PROTEIN FAT FIBER GOSSYPOL OTHER NONE
(Analyses)
bull Beef Cattle Dairy Cattle o Poultry Catfish-t fj
Figure 23 Comparison of Responses Analytical Values Provided by Supplier
( of Respondents)
60shy
50
4)
30
20
10
o amp ~
AFLATOXIN C PROTEIN FAT FIBER GOSSYPOL OTHER NONE
(Analyses)
bull Beef Cattle -t Dairy cattle o Poultry b Catfish
Figure 24 Share of Cottonseed Use Crush vs Feed Use
( of Respondents)
100 I
90
CRUSH 80
70
60
50
40
30
20
FEED USE 10
o 1~ 1~ 1~ 1m 1m 1~ 1~ 1~ 1~ 1~ 1~ 1~ 1~ 1~
(Year)
Source USDAb
Table 1 Percentage of Beef Cattle Feeds Formula ted Table 2 CSM Feeds Formulated for Beef Cattle CSMmiddot Calvesmiddot
middotAverage Response Rate (feedlot=51 other=41) middotResponse Rate = 39
Table 3 CSM Feeds Formulated for Beef Cattle Table 4 CSM Feeds Formulated for Beef Cattle Stockersmiddot
middotResponse Rate = 40
Response Rate =37
Table 5 CSM Feeds Formulated for Beef Cattle Table 6 CSM Feeds Formulated for Beef Cattle
middotResponse Rate =33
middotResponse Rate = 37
Table 8 Percentage of Dairy Cattle Feeds Formulated CSM
Average Response Rate =88
middotResponse Rate = 37
Table 9 CSM Feeds Formulated for Dairy Cattle Table 10 CSM Feeds Formulated for Dairy Cattle
RespooseRate 24
middotResponse Rate = 34
Table 11 CSM Feeds Formulated for Dairy Cattle Table 12 CSM Feeds Formulated for Dairy Cattle
Response Rate = 31 Response Rate = 45
Table 13 Percentage of Poultry Feeds Formulated Using CSMmiddot
bullAverage Response Rate = 79
Table 14 Percentage of Catfish Feeds Formulated Using CSMmiddot
bullAverage Response Rate =67
Table 15 CSM Feeds Formulated for Catfishmiddot )middoti middot fteq~
bullAverage Response Rate = 17
Table 16 Combined Responses Importance of Specific Factors in Choice of Dietary Protein ( of
bullAverage Response Rate =g]
Table 17 Combined Responses Other Important Factors in
bullAverage Response Rate = 22
bullAverage Response Rate =91
-Average Response Rate =90
Table 20 Combined Responses Importance of Non - Nutrition -Related Factors in Choice of CSM over Alternative Protein Feeds ( of
-Average Response Rate = 87
Table 22 Combined Responses Top S Reasons Why CSM IS NOT Selected as a Feed
Table 23 Combined Responses Top 5 Specific Characteristics That Would Have to Change for CSM to be Selected as a Feed
Table 24 Combined Responses Analysis Routinely Performed
Table 25 Combined Responses Analysis Values Provided
CSM
267 067 333 333 1400 S333
467 000 067 067 1400 4867 --shy
467 000 000 067 400 4333 --shy -- shy -- shy
250 000 000 000 1250 4000 -- shy --shy
313R 4733 62 ------ shy~ - shy ~-
4S00 62
bullAverage Response Rate = 100
bullAverage Response Rate = 87
Table 28 Beef Cattle Responses Imponance of Nutrition-Related Factors in Choice of CSM Over Alternative Protein Feeds
Average Response Rate = 91
Table 29 Beef Cattle Responses Other Nutrition - Related
Fact~~~~~~~~~~~~~~~~~~~
Response Rate =7
Table 30 Beef Cattle Responses Imponance of Non - Nutrition - Related Factors in Choice of CSM Over Alternative Protein Feeds
middotAverage Response Rate = 87
middotResponse Rate = 5
bullAverage Response Rate =14
Table 33 Beef Cattle Responses Months of the Year When CSM Needs to Be AvaiJable I ii middot middot1
bullAverage Response Rate =53
10 U
-Moy
JIIJ
All
so
0_ -
to
--I No
Moy
10 -so shy
0_ _ 0-
Table 35 Beef Cattle Responses Top 5 Reasons Why CSM Is Not Selected as a Feed
Average Response Rate =100 Response Rate = 24
Response Rate =28
Average Response Rate = 98
Response Rate = 17
middotResponse Rate =9
Table 43 Beef cattle Responses Type of Creep Feed
middotResponse Rate = 81
middotResponse Rate =26
Table 45 Beef cattle Responses Respondents Formulating Rations With CSM and Whole
middotResponse Rate = 68
Table 47 Beef cattle Responses Percentage of Whole Cottonseed Respondents Mix in Rations Containing Both CSM and Whole Cottonseedmiddot tCmiddotHiitjt~ middotmiddotmiddotmiddot1
middotResponse Rate =25
middotResponse Rate = 30
bull Response Rate = 98
Response Rate =11
Table 51 Beef Cattle Responses Escape Value Respondents Are Using for Rumen Degradabilitymiddot
1~iiii middotb~r~~fgtD zq436imiddotmiddotmiddotmiddotmiddotmiddotmiddot 004bullbullbullbullbullbullbullbullbullbull1----22--+----31-4
I~~I 23 329
middotResponse Rate = 57
Table 53 Beef Cattle Responses Methods or Sources Respondents Used to Calculate CSM
Table 52 Beef Cattle Responses Reliability of Escape Values Used
Table 54 Beef Cattle Responses Interested in Knowing Escape Values for CSM Processed
Valuemiddot
middotResponse Rate =98
)
I Mean ~nse
63 57S19 228381 Q-L_uu ~139 59468 32306 139bullII1 1 061 06
1 1 44 430 614431-------- 57t 001 001 middot-1
==~=-__~~1c9 00 _ 06 _ 001_ 38 133 323 63
Average Response Rate =100
Response Rate = 89
Table 58 Dairy Cattle Responses Importance of Nutrition - Related Factors in Choice ofCSM Over Alternative Protein Feeds (ofbmiddotNmiddotmiddotmiddotmiddotmiddotmiddot
Response Rate =88
Table 59 Dairy Cattle Responses Other Nutrition-Related Factors
Indicated br~~P211dents
Response Rate =10
Table 60 Dairy Cattle Responses Importance of Non- Nutrition - Related Factors in Choice of CSM Over Alternative
Protein Feeds ( ofResPOndents~dd
Response Rate = 88
Response Rate = 3
--
Average Response Rate = 51
Table 62 Dairy Cattle Responses Months in the Year When CSM IS NOT Available
10 u
J -- AIIIi
--~ shy
loOoIMr _ 0-
bullAverage Response Rate =69
--- AIIIi
--~ soM
0
0-_
10
Table 65 Dairy Cattle Responses Top 5 Reasons Why CSM IS NOT Selected as a Peed
Table 66 Dairy Cattle Responses Top 5 Specific Characteristics That Would Have to ro1 ____ for CSM to be Selected as a Feed
Table 67 Dairy Cattle Responses Analyses Routinely Performed fmiddotmiddotmiddotmiddot
Response Rate =96
Response Rate =56
Table 68 Dairy Cattle Responses Other Analyses
Response Rate =25
Table 70 Dairy Cattle Other Analytical Values CSM
Response Rate =4
Average Response Rate =81
Average Response Rate = 15
Table 73 Dairy Cattle Responses Respondents Formulating Feeds With Whole andor Delinted
Cottonseed bull
bullAverage Response Rate =92
middotResponse Rate = 40
Table 74 Dairy Cattle Responses Respondents Formulating Rations with Cottonseed Meal and Whole Cottonseed in the Same Rationmiddot
middotResponse Rate = 97
Table 76 Dairy Cattle Responses Percentage of Whole Cottonseed Respondents Mix in Rations
ltltJIltainin(a0th CSM and WhoeCottonseedmiddot Mean
middotResponse Rate = 42
Table 77 Dairy Cattle Responses Knowledge of Research on Feedine CSM
~~~~
Average Response Rate = 68
Response Rate =7
Average Response Rate =59
Response Rate =25
Average Response Rate =63
Response Rate = 13
middotResponse Rate = 92
Response Rate =82
Table 85 Dairy Cattle Responses Methods or Sources Used to Calculate CSM
Response Rate = 73
Table 86 Dairy Cattle Responses Respondents Interested in Knowing Escape Values for CSM Processed from Different Methodsmiddot fmiddotmiddotmiddotmiddotmiddotmiddot
Response Rate = 92
Response Rate = 34
Table 89 Dairy Cattle Responses Suggestions for CSM
Response Rate =33 Response Rate =22
-----
64 139 24815 00 36 511 5751
5951 131 438 35015 00 15 I-~~~~~
6200 15 423 51151 00 00 ~~~ -~~~ -~~~ ~~~-~~ --~~ ~ ~ ~~-~ ~
292 55125 00 00 125 45800
bullAverage Response Rate =99
Average Response Rate =85
Table 92 Poultry Responses Importance of Nutrition - Related Factors in Choice of CSM Over Alternative Protein Feeds (of
Average Response Rate =85
Table 93 Poultry Responses Other Nutrition-Related Factors Indicated
200
200
Response Rate = 5
Table 94 Poultry Responses Importance of Non - Nutrition - Related Factors in Choice of CSM Over Alternative Protein
Feeds~~~~~~~~~~5=~~~~~T7~~
00 Average Response Rate =83
Response Rate =4
Average Response Rate = 17
Table 97 Poultry Responses Months in the
J
p
April
lao
A
shy-- 0
ft
April
_
Average Response Rate = 43
=1 g L
0
Table 99 Poultry Responses Top 5 Reasons Why CSM IS NOT Selected as a Feed
Table 100 Poultry Responses Top 5 Specific Characteristics That Would Have to Change for
CSM to be Selected as a Feed Inoredient
Table 101 Poultry Responses Analyses Routinely
middotResponse Rate = 93
Table 102 Poultry Responses Other Analyses Routinely
Performed
middotResponse Rate = 27
Table 103 Poultry Responses Analytical Values Provided
middotResponse Rate =73
Table 104 Poultry Responses Knowledge of Problems
bullAverage Response Rate = 62
Average Response Rate = 14
Table 106 Poultry Responses Protein - Related Factors
Average Response Rate = 64
Table 107 Poultry Responses Other Protein - Related
Response Rate =11
Table 108 Poultry Responses Crude Protein Levels
Preferred for CSM
Response Rate = 55
Table 111 Poultry Responses Gossypol Levels Considered
Safe
Table 112 Poultry Responses Would or Do Use Table 113 Poultry Responses Relative Feeding Value of CSM Comoared to 44 SBMmiddot
middotResponse Rate = 96
bull Response Rate = 100
Table 114 Poultry Responses Knowledge of Table 115 Poultry Responses Familiarity with Other Feedino CSMmiddot
middotResponse Rate =7 bull Response Rate = 73
middotResponseRate = 31
bullAverage Response Rate = 58
Table 118 Poultry Responses Willingness to Pay
a Premium Per Unit of Protein for CSM With More
Than 41 Protein
bullResponse Rate =91
Table 119 Poultry Responses Percent of Cost of SBM Respondents Willing to Pay for CSM with
Response Rate =27
Response Rate =64
00 00 87 43 478 304 57 00 00
----shy I--~~
00 ~-~
43 522 348 59 ----shy
62~ 00 00 00 261 ----shy
652 ------shy
00 00 00 00 667 333 63 AverageResponseRate = 99
bullAverage Response Rate = 73
Table 123 Catfish Responses Importance of Nutrition - Related Factors in Choice of CSM Over Alternative Protein Feeds
Average Response Rate =83
Table 124 Catfish Responses Importance of Non- Nutrition - Related Factors in Choice of CSM Over Alternative Protein
Feeds
Average Response Rate = 90
bullAverage Response Rate = 13
Igt 20
s_
Pshy s
--s
H_
_
gt 7 bull bull bull bull bull
1 fsI plusmn -
haMr
N__
shy
bullAverage Response Rate =54
Table 128 Catfish Responses Top 5 Reasons Why CSM IS NOT Selected as a Feed
Table 129 Catfish Responses Top 5 Specific Characteristics That Would Have to Change for CSM to Be Selected as a Feed-_
Table 130 Catfish Responses Analyses Routinely Table 131 Catfish Responses Other Analyses Routinely Performed
middotResponse Rate = 25
middotResponse Rate =92
bullAverage Response Rate = 18
Table 133 Catfish Responses Knowledge of Problems Feedine CSM to CatflSh
Average Response Rate =100
Table 134 Catfish Responses Protein - Related Factors Considered i
Response Rate = 83
Table 135 Catfish Responses Crude Protein Levels Preferred for CSM
Response Rate = 100
Table 139 Catfish Responses Would or Do Use Table 140 Catfish Responses Relative Feeding
Value ofCSM Compared to 44~ Lmiddotmiddotmiddotmiddotmiddotmiddotmiddotmiddotmiddotmiddotmiddotmiddotmiddotmiddotmiddotmiddotmiddotmiddotmiddot _
Response Rate = 100
Response Rate = 100
Table 141 Catfish Responses Knowledge of Research on Table 142 Catfish Responses Sources ofInformation
Average Response Rate = 83
bullAverage Response Rate = 44
Table 143 Catfish Responses Willingness to Pay A Premium Per Unit of Protein for CSM with More Than
middotResponse Rate = 100
Table 144 Catfish Responses Percent of Cost of SBM Respondents Willing to Pay for CSM with Sufficiently Low Goscvnol and Fiber Levelsmiddot
middotResponse Rate = 83
middotResponse Rate = 25
Table 146 Comparison of Mean Responses and Analysis of Variance (ANOVA) Importance of Specific
bull Scale of 1 (extremely unimportant) to 7 (extremely important) for the mean ranking a Mean significantly larger across animal types at the 5 significance level otherwise no difference b Mean significantly lower across animal types at the 5 significance level otherwise no difference
Table 147 Comparison of Mean Responses and Analysis of Variance (ANOVA) Ranking of Other Protein
bull Scale of 1 (CSM inferior to respective feed) to 7 (CSM superior to respective feed) for the mean ranking
a Mean significantly larger across animal types at the 5 significance level otherwise no difference
b Mean significantly lower across animal types at the 5 significance level otherwise no difference
Table 148 Comparison ofMean Responses and Analysis of Variance (ANOVA) Importance of Nutritionshy
Related Factors in Choice ofCSM Over Alternativesmiddot
bull Scale of 1 (extremely unimportant) to 7 (extremely important) for the mean ranking a Mean significantly larger across animal types at the 5 significance level otherwise no difference
b Mean significantly lower across animal types at the 5 significance level otherwise no difference
Table 149 Comparison of Mean Responses and Analysis of Variance (ANOVA) Importance of Nonshy
Nutrition- Related Factors in Choice of CSM Over Alternativesmiddot
bull Scale of 1 (extremely unimportant) to 7 (extremely important) for the mean ranking
a Mean significantly larger across animal types at the 5 significance level otherwise no difference
b Mean significantly lower across animal types at the 5 significance level otherwise no difference
- = Not mentioned or ranked lower than 4th place
Table 151 Comparison of Responses Top Responses Why CSM IS NOT Selected as a Feed
- = Not mentioned or ranked lower than 5th place
Table 152 Comparison of Responses Top Characteristics that Have to Change for CSM to Be
- = Not mentioned or ranked lower than 5th place

8
given by respondents for which CSM is selected as a feed component were price availability and proteinprotein quality in that order
The respondents provided a much longer list of reasons for which CSM is Dot selected than for which CSM is selected as a feed ingredient (Table 22) Interestingly the most frequently listed number one reason (54 of the respondents) why CSM is Dot selected as a feed ingredient was again price Other number one choices included availability (16) gossypol (9) and protein protein quality (3) The reason most often listed second (30 of respondents) was availability followed by pricevalue (20) and gossypol (8) The reason most often listed third was pricevalue again (14 of respondents) and then availability (I 3) and gossypol (I 1) Again based on the total number of times a reason was listed first second or third the top three reasons given by respondents for which CSM is Dot selected as a feed component were price availability and gossypol in that order
The three most commonly listed specific characteristics of CSM that would have to change to be included more frequently in respondents feed formulations also were price availability and gossypol (Table 23) Other less frequently mentioned CSM characteristics that would need to change included amino acid balancelevel energy contentlevel aflatoxin contentlevel proteinprotein quality
In summary price and availability appear to be the two key factors affecting the use of CSM If price is low andor availability is adequate feed formulators are more likely to use CSM in their formulations On the other hand a high price andor poor availability is likely to discourage use of CSM Consequently there is very little loyalty by feed formulators to CSM because they appear to be quick to switch back and forth between CSM and alternative feeds as price changes Feed formulators do not appear to perceive that CSM is a feed ingredient with inherent characteristics for which they are willing to pay a premium if necessary in order to continue using it as an ingredient in the feeds they formulate That is the primary consideration in deciding whether or not to use CSM is its price rather than some nutritional characteristic for example Thus when price rises they perceive little reason to continue using CSM as part of their formulations
The availability of CSM appears also to work both for and against the use of CSM Responses to the specific questions on seasonality seemed to indicate that availability of CSM is not generally a problem during the year But when CSM is not selected as a feed ingredient availability is one of the major reasons During certain times of the year in certain parts of the country availability may be a positive factor motivating the use of CSM
Source of Chemical Analyses for Cottonseed Meal
Nearly 90 of the respondents routinely perform crude protein analyses (Table 24) About two-thirds perform their own fat and fiber analyses as well Surprisingly however less than half the respondents routinely test for aflatoxin even though nearly all respondents indicated aflatoxin to be an important or extremely important factor affecting their choice of CSM as a feed component Only 18 of the respondents routinely test for gossypol Even though nearly all respondents performed their own crude protein analyses CSM suppliers apparently provide analytical values for crude protein to over 40 of respondents (Table 25) CSM suppliers provided fat and fiber analytical values to about a third of the respondents CSM suppliers appear to provide analytical values for gossypol to very few feed formulators
9
Results by Animal Species
The responses in the previous section are indicative of the overall perceptions of feed formulators of the use of CSM as a feed component Those results however may mask some important differences in perceptions among formulators of feeds for the various animal species There are also issues regarding the use of CSM as a feed component that are unique to the various animal species Consequently salient dissimilarities in the responses of formulators of different animal feeds from the combined responses (over all animal types) discussed in the previous section are highlighted in this section Also the results of the questions asked specifically of formulators of feeds for particular animal species are discussed in this section in detail as well
BeeCattle
There are few major differences in the perceptions of beef cattle feed formulator respondents concerning the use of cottonseed meal from those discussed in the previous section for all survey respondents This may reflect the larger number of respondents formulating feed for beef cattle (and for ruminants in general) than for other animal species The salient differences in the 6 general question areas include the following
bull Factors affecting choice 0 dietary proteins The only major difference in the responses to these questions was a somewhat greater concern by responding beef cattle feed formulators for other factors influencing the choice of a dietary protein such as palatability and rumen degradability (Table 26)
bull Cottonseed meal as an alternative protein feed The results for beef cattle are roughly similar to those from the combined responses (Table 27) Major differences include I) a lower percentage of beef cattle survey respondents consider blood meal to be superior to CSM in beef cattle feeds 2) a large majority of respondents feel that CSM is not an alternative to dried skim milk and dried whole milk in beef cattle feeds and 3) an overwhelming majority of respondents consider CSM to be an alternative to the remaining protein feeds for use in beef cattle feeds except perhaps for fish meal and blood meal
bull The importance 0 nutritional and non-nutritionalactors Again the responses are generally the same as for the combined responses The beef cattle survey respondents however tended to rank nutrition-related factors as less important and non-nutrition-related more important than was the case for the combined responses On average beef cattle feed formulators ranked protein quality amino acid balance amino acid availability fat level fiber level and gossypol level as less important factors in the choice of CSM than was the case for the combined responses (Tables 28 and 29) Of the non-nutrition-related factors respondents ranked palatability the need for a local supply equipment requirements convenience and CSM industry service as all slightly more important in the choice of CSM than was the case for the combined responses (Tables 30 and 31)
bull Seasonality 0 cottonseed meal availability The results for the beef cattle respondents are virtually identical to those from the combined responses (Tables 32 and 33)
bull Reasons lor the selection and non-selection 0 cottonseed meal The top three reasons for which CSM is and is not selected as a feed ingredient are exactly the same for the beef cattle responses as for the combined responses (Tables 34 and 35) Also price availability and
10
gossypol level are cited as the three most important factors that would have to change for CSM to be used more frequently as was the case with the combined responses (Table 36)
bull Source 0 chemical analyses lor cottonseed meal No major differences appear in either the analyses routinely performed by the responding beef cattle feed formulators or the analytical values provided to them by CSM suppliers (Tables 37 38 39 and 40)
Beef cattle sample members were also asked several questions specifically regarding the use of CSM in beef cattle feed formulations in 5 general areas I) problems resulting from feeding a ration with CSM to the various beef cattle types 2) details on particular feed formulations for beef cattle 3) sources of information utilized regarding formulating beef cattle feeds 4) protein-related factors considered when balancing rations for beef cattle and 5) an open-ended question soliciting suggestions to improve the usefulness or value of CSM for beef cattle feed formulations
Problems from Feeding CSM Rations to Beef Cattle
Few respondents indicted knowledge of any problems resulting from feeding a ration containing cottonseed meal to either feedlot or other beef cattle (Table 40 The most frequently mentioned problems concerned feedlot bulls and calves The majority of the problems reported involved supplements and starter feeds (Table 42) The main problems reported had to do with gossypol beef cattle performance when fed rations containing CSM and reproduction The low number of respondents indicating problems of any type however suggests that the problems reported were likely isolated cases
Details on Particular Feed Formulations for Beef Cattle
The sample members were also asked to provide information regarding creep feeds for calves and supplements for stockers that they formulate as well as information regarding the use of whole or delinted cottonseed in beef cattle feed rations Nearly 75 of all beef cattle respondents formulate creep feeds for calves and over 80 formulate supplements for stockers (Figure 18) Traditional creep feeds represented two-thirds of the creep feeds formulated (Table 43) Over half the respondents indicated that they formulate traditional creep feeds Fewer respondents formulated high protein creep feeds
Nearly half the beef cattle respondents formulate some feeds using whole fuzzy cottonseed (Table 44) Only a little less than a third formulate any feeds using delinted cottonseed however Also only about a quarter of the respondents formulate any rations that include both CSM and whole cottonseed (Table 45) For those who formulate rations that include both the mix of the two in the rations varies widely Respondents reported that the share of such rations accounted for by CSM ranged from 1 to 100 with a mean of 19 (Table 46) The share of those rations accounted for by whole cottonseed ranged from 0 up to a maximum of 25 with a mean of 102 (Table 47)
Sources of Information Utilized on Formulating Beef Cattle Feeds
The largest number of respondents (110 of 123 respondents) indicated that they utilize university research of some type to obtain information on formulating feeds for beef cattle (Table 48) Only slightly fewer (91 respondents) indicated that industry publications are a source of feed formulation information for beef cattle University extension and government agencies were also listed as important information sources A few respondents listed other sources of information
II
including primarily the results of research performed in their own companies their own personal experience and their own private research (Table 49)
Protein-Related Factors Considered for Balancing Beef Cattle Rations
Nearly 70 of the respondents indicated that rumen degradability is a protein-related factor that they consider when balancing beef cattle rations (Figure 19) Respondents also consider crude protein level (16) and other protein factors (11) Only 4 indicated concern for the amino acid value when balancing beef cattle feed rations The two main other protein-related factors the respondents indicated as having a bearing on balancing beef cattle feed rations were the digestibility of the protein and the protein ingredients (Table 50)
Respondents indicated a wide range of escape values (or by-pass values) that they are using for CSM from less than 20 to over 50 (Table 51) At the same time however they are unsure as to the reliability of the escape values they are using Nearly 70 indicated that the escape values they are using are neither reliable or unreliable or only somewhat reliable (Table 52) The principal single method or source used by respondents for the escape value was the National Research Council (Committee on Animal Nutrition National Academy of Sciences) (Table 53) Universities were the next most frequently mentioned single source of CSM escape values The largest number of respondents (32) simply indicated that several sources were consulted for escape values Finally almost all respondents indicated an interest in obtaining information on escape values for CSM as processed by different methods (Table 54) There appears to be a lack of reliable information on CSM escape values in the perception of beef cattle feed formulators
Suggestions for Improling the Usefulness of Cottonseed Meal
Only 16 of the beef cattle feed formulators that returned surveys provided suggestions that might improve the value or usefulness of CSM in feed rations (Table 55) Some of the more noteworthy suggestions included improving the consistency of cottonseed meal various types of needed research more data on CSM and increased availability of CSM
Dairy Cattle
There are few major differences in the perceptions of dairy cattle feed formulator respondents concerning the use of cottonseed meal from the combined responses over all survey respondents and the beef cattle responses Again this may reflect the larger number of respondents formulating feed for dairy cattle (and for ruminants in general) than for other animal species The salient differences in responses by dairy cattle feed formulators in the 6 general question areas include the following
bull Factors affecting choice of dietary proteins There is virtually no differences in the responses of dairy cattle respondents from the combined responses for any of the listed factors (quality price availability consistency and other) affecting the choice of dietary protein (Table 56) A large majority of dairy cattle feed formulators ranked all factors as either important or extremely important
bull Cottonseed meal as an alternative protein feed The results for dairy cattle are roughly similar to those from the combined responses (Table 57) The two major differences include I) a large majority of respondents feel that CSM is not an alternative to dried skim milk fish
12
meal dried whole milk and blood meal in dairy cattle feeds and 2) an overwhelming majority of respondents consider CSM to be an alternative to nearly all the remaining protein feeds for use in dairy cattle rations
bull The importance of nutritional and non-nutritional factors Again the responses are generally the same As was the case for beef cattle respondents however dairy cattle respondents tended to rank the listed non-nutrition-related factors as relatively more important than the listed nutrition-related factors On average dairy cattle feed formulators ranked amino acid balance fiber level and gossypol level as less important factors in the choice of CSM than was the case for the combined responses (Tables 58 and 59) As in the case of both the combined and beef cattle responses aflatoxin was ranked at a higher level of importance than any other single nutrition-related factor Of the non-nutrition-related factors respondents ranked most factors as all slightly more important in the choice of CSM than was the case for the combined responses (Tables 60 and 61)
bull Seasonality of cottonseed meal allailability The results for the dairy cattle respondents are highly consistent with those for both the combined responses and for the beef cattle responses The months of May through September are the months of least availability of CSM which are also the months indicated when CSM is least needed to be available in the perception of dairy cattle respondents (Tables 62 and 63) Again the suggestion is one of little problem of CSM availability although this is not totally the case as indicated by dairy cattle respondents in later questions
bull Reasons for the selection and non-selection of cottonseed meal While price and availability are also the top two reasons that dairy cattle respondents perceived that CSM is selected as a feed ingredient protein contentquality ranked third on their list followed closely by palatability (Table 64) The top two reasons the CSM is not selected according to the dairy cattle respondents were price and availability as with both the combined responses and the beef cattle responses The third reason given by the dairy cattle respondents however was protein qualitylevel followed in fourth place by gossypol (Table 65) Again price was the key CSM characteristic that dairy cattle respondents indicated that must change in order to be used more frequently in dairy cattle rations (Table 66) Availability and gossypol levels were ranked as the second and third CSM characteristics that must change as was the case for the combined responses
bull Source of chemical analyses for cottonseed meal The results for the chemical analyses performed by dairy cattle respondents are virtually identical to those of both the combined results and those of the beef cattle results The primary analysis routinely performed by the dairy cattle respondents is crude protein (121 of the 143 respondents) followed by fiber (94 respondents) and fat (83 respondents) (Tables 67 and 68) The primary analytical values supplied to the dairy cattle respondents also include crude protein (62 respondents) fiber (50 respondents) and fat (47 respondents) (Tables 69 and 70) It is interesting to note that although aflatoxin was ranked at a higher level of importance than any other nutrition-related factor affecting the choice of CSM as feed component only a third of the dairy cattle respondents routinely perform analyses for aflatoxin and only 11 respondents are provided aflatoxin values by their CSM suppliers The story is about the same for both the combined and the beef cattle responses
Dairy cattle sample members were also asked several questions specifically regarding the use of CSM in dairy cattle feed formulations in 6 general areas I) problems resulting from feeding a
13
ration with CSM to the various dairy cattle types 2) details on dairy cattle feed formulations containing whole cottonseed 3) sources of information utilized on formulating dairy cattle feeds 4) protein-related factors considered when balancing rations for dairy cattle 5) gossypol levels considered to be safe for mature dairy cattle and pre-ruminant calves and 6) an open-ended question soliciting suggestions to improve the usefulness or value of CSM for dairy feed formulations
Problems from Feeding CSM Rations to Dairy Cattle
Again very few respondents indicted knowledge of any problems resulting from feeding a ration containing CSM to dairy cattle (Table 71) Only 24 of the respondents indicated problems with calves and only 18 for lactating cows as the result of feeding rations with CSM Only about 3 of the respondents mentioned problems with either dairy heifers or dry cows The number one problem reported was gossypol toxicity primarily in creep feeds and complete rations (Table 72) Both palatability and poor performance problems for various feed types were also frequently mentioned Again however the low number of respondents indicating problems of any type suggests that the problems reported were likely isolated cases
Details on Dairy Cattle Feed Formulations Containing Whole Cottonseed
Over 75 of dairy cattle respondents formulate feeds using whole fuzzy cottonseed a much higher percentage than was the case for beef cattle Less than half of the dairy cattle respondents however utilize delinted cottonseed in their feeds more in line with the beef cattle results (Table 73) Less than half the respondents formulate rations that include both CSM and whole cottonseed (Table 74) For those who formulate rations that include both the mix of the two in the rations varies widely Respondents reported that the share of such rations accounted for by CSM ranged from 1 to 30 with a mean of 85 (Table 75) The share of those rations accounted for by whole cottonseed ranged from 3 to 100 with a mean of 16 (Table 76) It appears therefore that on average dairy feeds formulated with both CSM and whole cottonseed contain a higher percentage of whole cottonseed than of CSM This is just the opposite of the situation for beef cattle
Sources of Information Utilized on Formulating Dairy Cattle Feeds
Over 80 of the dairy cattle respondents indicated that they were familiar with research on feeding CSM to mature dairy cattle (Table 71) Only half however indicated familiarity with such research for pre-ruminant calves Less than 10 of the respondents listed any other research on feeding CSM to other types of dairy cattle (Table 78) The largest number of respondents (137 of 143 respondents) indicated that they utilize university research to obtain information on formulating feeds for dairy cattle followed by industry publications of some type (121 respondents) and university extension service (83 respondents) (Table 79) Only 36 respondents listed other sources of information including primarily personal experience and research (Table 80)
Protein-Related Factors Considered for Balancing Dairy Cattle Rations
Nearly 100 of the dairy cattle respondents indicated that both crude protein level and rumen degradability are factors they consider when balancing rations for dairy cattle a much higher level than is the case for beef cattle (Table 81) Less than half consider amino acid values (61 of 143 respondents) Only 19 respondents indicated that they consider other factors like protein solubility (Table 82)
Dairy cattle respondents indicated a even wider range of escape values (or by-pass values) that they are using for CSM than did beef cattle respondents from 0 to over 80 (Table 83) The mean escape value calculated from the responses is 40 Dairy cattle respondents indicated slightly more
14
confidence in the escape values they are using than was the case for beef (Table 84) Only 22 respondents however considered those escape values to be reliable or extremely reliable The principal single method or source used by respondents for the escape value they use was again the National Research Council (Committee on Animal Nutrition National Academy of Sciences) (Table 85) Book values was the next most frequently mentioned single source of CSM escape values (23) Finally nearly 100 of the respondents indicated an interest in obtaining information on escape values for CSM as processed by different methods (Table 86) The conclusion from the dairy cattle responses is the same as for beef cattle That is there appears to be a lack of reliable information on CSM escape values in the perception of dairy cattle feed formulators and that they are highly interested in obtaining more information in this regard
Gossypol Level Considered Safe for Mature Dairy Cattle and Pre-Ruminant Calves
Dairy cattle respondents appear to have little idea of what the safe levels are for gossypol in mature dairy cattle and pre-ruminant calf feeds First of all only one-third of those who returned surveys even attempted to provide numbers for safe gossypol levels (Tables 87 and 88) Many respondents simply wrote comments such as dont know or not aware of research on safe gossypol level in the margin of the survey beside the question Second those who attempted to answer the questions provided an amazingly wide range of safe gossypol levels from 0 parts per million (ppm) to 7500 ppm for mature dairy cattle and from 0 ppm to 1000 ppm for pre-ruminant calves The mean safe gossypol levels were 609 ppm for mature dairy cattle and 121 ppm for pre-ruminant calves The responses were spread quite evenly between the extremes around the means It should be noted that the research team checked and rechecked the data set for this question to insure there were no errors in data entry
Suggestions for Improving the Usefulness of Cottonseed Meal
Only about 22 of the dairy cattle feed formulators that returned surveys provided suggestions that might improve the value or usefulness of CSM in dairy cattle feed rations (Table 89) Some of the more frequent suggestions dealt with improving the consistency and availability of CSM Several respondents suggested the need for more information on gossypol a worthy suggestion given the results of the previous question
Poultry
The perceptions of poultry feed formulator respondents concerning the use of cottonseed meal differ importantly in many respects from the combined responses over all survey respondents and from those of beef and dairy cattle Many of the differences are likely the result of the distinct dietary needs of ruminant as opposed to non-ruminant animals The salient differences in responses by poultry feed formulators in the 6 general question areas include the following
bull Factors affecting choice of dietary proteins Surprisingly there was little difference in the responses of those indicating that they formulate feed for poultry than for the combined results (or for beef and dairy cattle) regarding the importance of the listed factors (quality price availability consistency and other) affecting the choice of dietary protein (Table 90) A large majority of poultry feed formulators ranked all factors as either important or extremely important The only exception is that consistency was ranked slightly less important by poultry respondents than by respondents in general
bull Cottonseed meal as an alternative protein feed Poultry respondents ranked more protein feeds as higher on the superior-to-CSM scale than was the case for the combined responses
15
(Table 91) In fact the mean rank of all but three of the protein feeds were all at least somewhat higher than was the case for the combined responses The mean rank of several of the other protein feeds as determined by the poultry respondents was much higher than for the combined responses including fish meal poultry by-product meal and soybean meal Poultry by-product meal changed from an inferior to a superior protein feed compared to CSM The protein feed judged by poultry respondents to be most superior to CSM for poultry rations was soybean meal while urea was ranked as most inferior Poultry respondents also appeared to have stronger opinions about whether or not CSM is an alternative to the other listed protein feeds than was the case for the combined responses They overwhelmingly perceived that CSM is not an alternative to many of the other protein feeds including fish meal dried skim milk dried whole milk poultry by-product meal blood meal tankage and urea A larger percentage of poultry respondents than was the case for dairy and beef cattle perceived however that CSM is a definite alternative to many other protein feeds including safflower meal sunflower meal linseed meal peanut meal canola meal feather meal distillers dried grains brewers dried grains and even soybean meal
bull The importance of nutritional and non-nutritional factors Poultry respondents ranked all but two of the listed nutrition-related factors as more important in the choice of CSM over alternative protein feeds for poultry rations than was the case for the combined responses on average (Le comparing mean responses) (Table 92) The highest percentage of poultry respondents ranked gossypol level (62 of the respondents) amino acid balance (59) aflatoxin (58) protein quality (57) and amino acid availability (57) as extremely important in the choice of CSM over alternative protein feeds Only about 5 of the respondents listed other important nutrition-related factors (Table 93) There are few differences however in the poultry responses as compared to the combined responses regarding the importance of non-nutrition-related factors (Table 94) The major difference is a much lower ranking of the importance of palatability in choosing CSM over alternative protein feeds Also a somewhat higher percentage of poultry respondents ranked price as an extremely important non-nutrition-related factor Few other non-nutrition-related factors were listed by the respondents (Table 95)
bull Seasonality of cottonseed meal availability The results for the poultry respondents regarding the months of the year when CSM is not available are highly consistent with those for the combined responses and those for the beef and dairy cattle responses Poultry respondents indicated that May through September are the months of least availability of CSM (Table 96) But likely because of the shorter production cycle for poultry than for cattle poultry respondents indicated that CSM needs to be available in almost every month (but slightly less so in August and September) for CSM to compete effectively with alternative protein feeds (Table 97) For poultry therefore the indication is that poultry feed formulators may perceive an availability problem which inhibits greater use of CSM in poultry rations to some extent
bull Reasons for the selection and non-selection of cottonseed meal Again price and availability are the number one and number two reasons respectively cited by poultry respondents for which CSM is selected as a feed ingredient (Table 98) Protein quality ranked third on their list followed closely by phosphorous content The top reason that CSM is not selected according to the poultry respondents was pricevalue (Table 99) About tied for second place were gossypol content and availability More respondents ranked availability as the second reason than for gossypol content but more respondents listed gossypol first The amino acid level was listed as a distant fourth reason for which CSM is not selected as a feed ingredient Price is again the key CSM characteristic that poultry respondents indicated must change in
16
order for CSM to be used more frequently in poultry rations (Table 100) Gossypol was clearly considered to be the second most important characteristic that must change Availability was ranked as either first or second by all respondents who listed it as a characteristic that must change
bull Source of chemical analyses for cottonseed meal The results for the chemical analyses performed by poultry respondents are similar to those of both the combined results and those of the beef and dairy cattle results The primary analysis routinely performed by the poultry respondents is crude protein (51 of 55 respondents) followed by fat (40 respondents) fiber (37 respondents) and aflatoxin (31 respondents) (Tables 101 and 102) The primary analytical values supplied to the poultry respondents also included crude protein fiber and fat (Table 103) A third of the poultry respondents indicated that their CSM supplier does not provide them with any analytical values Once again even though aflatoxin was ranked as an extremely important nutrition-related factor in the choice of CSM as a feed component only I respondent obtains an analytical value for aflatoxin from his CSM supplier and only a little over half routinely perform their own aflatoxin analyses
Poultry sample members were asked some specific questions regarding the use of CSM in poultry feed formulations in 5 general areas I) problems resulting from feeding a ration with CSM to the various poultry types 2) specific information on several key nutrition-related factors affecting the use of CSM in poultry rations 3) sources of information utilized on formulating poultry feeds 4) CSM price and value and 5) an open-ended question soliciting suggestions to improve the usefulness or value of CSM for poultry feed formulations
Problems from Feeding CSM Rations to Poultry
The majority of poultry respondents indicated no knowledge of any problems associated with feeding a ration containing CSM to poultry (Table 104) Only 14 of the respondents indicated problems with broilers less than 7 for breeding flocks and about 3 for turkeys Over a third however indicated that they had knowledge of such problems with layers The number one problem reported was yolk molting and discoloration primarily in layer rations (Table 105) A few respondents indicated problems with depressed growth associated with broiler feeds containing CSM
Information on Key Nutrition-Related Factors for Poultry Rations
The survey sample members were asked to respond to a number of specific questions related to nutritional factors that affect the use of CSM in poultry rations including protein energy fat gossypol and synthetic amino acids They were then asked to indicate their perception of the overall feeding value of a standard 41 protein CSM compared to that of a standard 44 protein soybean meal The questions were designed primarily to determine the extent of knowledge among feed formulators concerning these factors as they relate to the use of CSM and the relative feeding value of CSM
Sample members were asked to respond to two questions regarding protein in poultry feed rations They were first asked to indicate the specific protein-related factors that they consider when balancing rations for poultry They were given a list of three factors (crude protein level amino acid content and amino acid availability) They were also allowed to specify any other protein-related factors they consider when balancing poultry rations They were then asked to indicate the crude protein levels they would prefer for cottonseed meal and were given a choice of four levels (3641 (standard) 44 and 48) and allowed to suggest any other preference for crude protein level
17
Almost all poultry respondents indicated that they consider amino acid content and availability when balancing feed rations with fewer responding that they consider the crude protein level (Table 106) Other protein-related factors listed by the respondents included amino acid balance protein digestibility and energy levels (Table 107) With regard to preferred crude protein level for CSM over half of the poultry respondents indicated a preference for 48 crude protein (Table 108) About 27 of the respondents were satisfied with the standard 41 level and 20 indicated a preference for a 44 protein CSM No respondents preferred anything less than the standard 41
With respect to energy levels the sample members were asked to indicate what they considered to be the normal maximum and minimum energy levels for protein feeds for broilers layers turkeys and breeding flock As Table 109 indicates the responses varied widely with little or no indication of a mode (most frequent response) in most cases For broilers the maximum (in K Cals DE per pound) ranged from 0 to 1800 and the minimum from 850 to 1700 with a mean maximum of 1436 and a mean minimum of 1276 For layers the maximum (in K Cals DE per pound) ranged from 1000 to 1800 and the minimum from 800 to 1500 with a mean maximum of 1347 and a mean minimum of 1187 For turkeys the maximum (in K Cals DE per pound) ranged from 1100 to 1725 and the minimum from 850 to 1700 with a mean maximum of 1334 and a mean minimum of 1261 For breeding flocks the maximum (in K Cals DE per pound) ranged from 1000 to 1600 and the minimum from 750 to 1600 with a mean maximum of 1328 and a mean minimum of 1159 Given the disparity in the responses it seems clear that there is little common concept of the normal maximum and minimum energy levels for protein feeds
Sample members similarly were asked to indicate the minimum and maximum fat levels they considered critical for protein feeds Although the range of responses was still quite wide there appeared to be more uniformity in responses to this question than the one for energy (Table 110) The maximum fat levels (ether extract as fed basis) indicated by the respondents ranged from 1 to 15 or 20 for most poultry types The minimums ranged from 0 to 15 The mean minimum levels of fat for all poultry types was about 3 The mean maximum ranged from 6 to 82 depending on the poultry type
Sample members were asked to indicate the level of gossypol they considered safe for poultry rations The responses again varied widely from a low of 0 ppm up to a high of 300 ppm for all poultry types (Table III) The highest mean level of gossypol as calculated from the responses to the question were 104 ppm for broilers and 91 ppm for turkeys For layers and breeding flocks the mean levels were much lower at 57 ppm and 54 ppm respectively
The questionnaire also asked the sample members to indicate if they use or would use synthetic amino acids where economical The response was that nearly 100 of all poultry respondents indicated that they have or would use synthetic amino acids in this situation (Table 112) This suggests little real aversion on the part of feed formulators to utilize synthetic amino acids in least cost poultry formulations
To obtain some insight on the general perception of poultry formulators regarding CSM the sample members were asked to indicate the overall feeding value of a standard 41 protein CSM compared to that of a standard 44 protein soybean meal in their opinion on percentage basis They were given the choice of 5 ranges from under 70 to over 100 in 10 increments (see Table 113 for the actual ranges used) Nearly 80 of the respondents indicated that CSM has an overall feeding value of under 90 of that of soybean meal Given the five choices offered to respondents the mean feeding value was around 80
18
Sources of Information Utilized on Formulating Poultry Feeds
About two-thirds of the poultry respondents indicated that they were familiar with research on feeding CSM to broilers and layers (Table 114) Only half however indicated familiarity with such research for turkeys and only a little over a third for breeding flocks Less than 10 of the respondents listed any other research on feeding CSM to other types of poultry (Table 115) To obtain information on formulating feeds for poultry the largest number of respondents (52 of the 55 respondents) indicated that they utilize university research followed by industry publications of some type (45 respondents) university extension services (26 respondents) and government agencies (20 respondents) (Table 116) Only 17 respondents listed other sources of information including primarily personal experience and research (Table 117)
Cottonseed Meal Price and Value
To get some idea concerning the poultry respondents perceptions of the value of CSM particularly with respect to soybean meal sample members were asked 1) if they would be willing to pay a premium per unit of protein for CSM with more than a standard 41 protein and 2) if gossypol and fiber were sufficiently low on average what percent of the cost of soybean meal they would be willing to pay for CSM
With respect to the first question only about half the respondents indicated a willingness to pay a premium for a CSM with more than 41 protein despite the fact that 75 of them indicated earlier that they would prefer a CSM with a higher crude protein level (Table 118) Thus at least 25 of the respondents prefer a higher protein level CSM but would not be willing to pay a premium to get it
In response to the second question poultry respondents indicated that they would only be willing to pay an average of about 76 of the cost of soybean meal for a CSM with a sufficiently low level of gossypol and fiber (Table 119) The range around that average however was fairly large from 50 to 95 Because CSM has traded at about 91 of the value of soybean meal on the market on a protein equivalent basis and about 85 on an unadjusted basis on average in each year since 1984 either poultry respondents are currently unaware of the historical CSM to soybean meal price relationship or they are indicating that the current CSM market price relative to that of soybean meal is substantially above the levels that most find acceptable
Suggestions for Improving the Usefulness of Cottonseed Meal
Only about 27 of the poultry feed formulators that returned surveys provided suggestions that might improve the value or usefulness of CSM in poultry feed rations (Table 120) Some of the more frequent suggestions included the need for more information on the use of CSM in poultry rations increased availability of CSM and nutrient guarantees
Catfish
The perceptions of catfish feed formulator respondents concerning the use of cottonseed meal correspond closely to those of the poultry respondents likely because of the similar dietary needs of non-ruminant animals The salient differences in responses by catfish feed formulators in the 6 general question areas included on this section of the surveys include the following
bull Factors affecting choice of dietary proteins There were no differences in the responses of those indicating that they formulate feed for catfish than for poultry regarding the importance
19
of the listed factors (quality price availability consistency and other) affecting the choice of dietary protein (Table 121) A large majority of catfish respondents ranked all factors as either important or extremely important as did poultry respondents
bull Cottonseed meal as an alternative protein feed As was the case for poultry catfish respondents ranked more protein feeds as higher on the superior-to-CSM scale than was the case for the combined responses (Table 122) Catfish feeders however ranked meat and bone meal and blood meal as even more superior to CSM than did poultry respondents The protein feeds that catfish respondents ranked as roughly similar to CSM included tankage feather meal peanut meal linseed meal corn gluten meal brewers dried grains distillers dried grains sunflower meal safflower meal and canola meal Catfish respondents also appeared to have nearly as strong views about whether or not CSM is an alternative to the other listed protein feeds as did poultry respondents They perceived that CSM is not an alternative to many of the other protein feeds including blood meal dried whole milk meat and bone meal and dried skim milk Catfish respondents also perceived however that CSM is a definite alternative to many other protein feeds including safflower meal canola meal peanut meal sunflower meal linseed meal distillers dried grains brewers dried grains tankage soybean meal wheat middlings corn gluten meal urea and feather meal
bull The importance of nutritional and non-nutritional factors The responses for catfish with regard to the importance of nutrition-related and non-nutrition-related factors in choosing CSM as a component of catfish feeds were roughly similar to those for poultry (Table 123) The salient differences were that a larger percentage of catfish respondents ranked energy level fat level and fiber level as important or extremely important and a much larger percentage ranked aflatoxin as extremely important One major difference of the catfish responses regarding the importance of non-nutrition-related factors from those of poultry is that palatability is much mOre of a concern to catfish feeders (Table 124) Bin space is less important to catfish respondents and service from the CSM industry is more important to them
bull Seasonality of cottonseed meal availability The results for the catfish respondents regarding the months of the year when CSM is not available were generally consistent with those for poultry except that May and June were perceived as less problematic for obtaining CSM supplies by the catfish respondents (Table 125) Catfish formulators perceive that CSM needs to be more available in April through October than during the rest of the year to be competitive with other protein feeds (Table 126) This suggests the perception on the part of catfish feed formulators of a CSM availability problem during about the first half of any given year
bull Reasons for the selection and non-selection of cottonseed meal Pricevalue is the number one reason cited by catfish respondents for which CSM is selected as a feed ingredient followed by protein quality and palatability (Table 127) The top reason that CSM is not selected according to the catfish respondents is pricevalue followed by quality and gossypol level (Table 128) Gossypol level is the key CSM characteristic that catfish respondents indicated must change in order for CSM to be used more frequently in catfish rations (Table 129) Quality was clearly considered to be the second most important characteristic that must change followed by aflatoxin level This is the only animal species for which price was not the number one characteristic cited that would have to change and was not even listed among the top three responses The implication is that catfish feed formulators may not consider the price of cottonseed meal to be out of line with their needs and thus do not consider price to be a particular problem for the use of CSM in catfish rations A word of caution is in order
20
to avoid taking this conclusion too far because of the relatively few number of catfish feed formulators in the sample
bull Source of chemical analyses for cottonseed meal The results for the chemical analyses performed by poultry respondents are similar to those of poultry as well as those of both the combined results and the beef and dairy cattle results The primary analysis routinely performed by the catfish respondents is crude protein followed by fat fiber aflatoxin and gossypol (Tables 130 and 131) The primary analytical values supplied to the catfish respondents also included crude protein fiber and fat (Table 132) Only 2 of the II catfish respondents indicated that their CSM supplier does not provide them with any analytical values Even though gossypol was ranked as an extremely important nutrition-related factor in the choice of CSM as a feed component and the number one CSM characteristic that needs to change only 5 of the II respondents routinely perform gossypol analyses None of catfish respondents obtain analytical values for aflatoxin from their CSM supplier
As for poultry catfish sample members were asked some specific Questions regarding the use of CSM in catfish feed formulations in 5 general areas 1) problems resulting from feeding a ration with CSM to the various catfish types 2) specific information on several key nutrition-related factors affecting the use of CSM in catfish rations 3) sources of information utilized on formulating catfish feeds 4) CSM price and value and 5) an open-ended Question soliciting suggestions to improve the usefulness or value of CSM for catfish feed formulations
Problems from Feeding CSM Rations to Catfish
Absolutely no catfish respondents indicated any knowledge of any problems associated with feeding a ration containing CSM to catfish (Table 133)
Information on Key Nutrition-Related Factors for Catfish Rations
As for poultry the survey sample members were asked to respond to a number of specific Questions related to nutritional factors that affect the use of CSM in catfish rations including protein energy fat gossypol and synthetic amino acids They were then asked to indicate their perception of the overall feeding value of a standard 41 protein CSM compared to that of a standard 44 protein soybean meal Just as for poultry these Questions were designed primarily to determine the extent of knowledge among catfish feed formulators concerning these factors as they relate to the use of CSM and the relative feeding value of CSM
Sample members were asked to respond to two Questions regarding protein in catfish feed rations They were first asked to indicate the specific protein-related factors that they consider when balancing rations for catfish They were given the same list of three factors (crude protein level amino acid content and amino acid availability) to choose from that the poultry sample members were given Again they were also allowed to specify any other protein-related factors they consider when balancing catfish rations They were then asked to indicate the crude protein levels they would prefer for CSM and were given the same choice of four levels as the poultry sample members (36 41 (standard) 44 and 48) and allowed to suggest any other preference for crude protein level In contrast to poultry the largest percentage of catfish respondents indicated that they consider amino acid availability (10 of the 11 catfish respondents) rather than the content when balancing catfish rations (Table 134) The second largest percentage consider crude protein level (9 respondents) also a different result from poultry
21
With regard to the crude protein level for CSM preferred by catfish respondents about 43 indicated a preference for 48 crude protein (Table 135) About 20 of the respondents were satisfied with the standard 41 level and nearly 30 indicated a preference for a 44 protein CSM No respondents preferred anything less than the standard 41 The mean preferred crude protein level was about 42
With respect to energy levels the catfish sample members were asked to indicate what they considered to be the normal maximum and minimum energy levels for protein feeds for fingerlings grow out stock brood stock and fries Despite the low number of catfish respondents the answers to this question were widely divergent (Table 136) For fingerlings the maximum (in K Cals DE per pound) ranged from 1250 to 1800 and the minimum from 2 to 1500 with a mean maximum of 1525 and a mean minimum of 834 For grow out stock the maximum (in K Cals DE per pound) ranged from only 1500 to 1600 and the minimum from 1 to 1300 with a mean maximum of 1550 and a mean minimum of 750 For catfish brood stock the maximum (in K Cals DE per pound) ranged from 1300 to 1700 and the minimum from 1200 to 1400 with a mean maximum of 1500 and a mean minimum of 1300 For fries the maximum (in K Cals DE per pound) ranged from 1250 to 1800 and the minimum from 900 to 1500 with a mean maximum of 1525 and a mean minimum of 1200 Given the disparity in these responses it seems clear again for catfish feed formulators that there is little common concept of the normal maximum and minimum energy levels for protein feeds
Catfish sample members similarly were asked to indicate the minimum and maximum fat levels they considered critical for protein feeds As with poultry the range of responses was still quite wide but there also appeared to be more uniformity in responses to this question than the one for energy level (Table 137) The maximum fat levels (ether extract as fed basis) indicated by the respondents again ranged from 1 to 15 for most catfish types as was the case for poultry The mean minimum levels of fat for all catfish types ranged from about 3 to 5 The mean maximum ranged from 6 to 10 aCrOSS the different catfish types
Catfish sample members were also asked to indicate the level of gossypol they considered safe for catfish rations The responses again varied widely from a low of 0 ppm up to a high of 300 ppm for some catfish types (Table 138) The two highest mean safe levels of gossypol were 97 ppm for grow out stock and 83 ppm for brood stock For fingerlings and fries the safe maximum mean levels were much lower at 44 ppm and 23 ppm respectively
The questionnaire also asked the sample members to indicate if they use or would use synthetic amino acids where economical The response was that 83 (all but 2) of the catfish respondents indicated that they have or would use synthetic amino acids in this situation (Table 139) This suggests little real aversion on the part of feed formulators to utilize synthetic amino acids in least cost catfish formulations
To obtain some insight on the general perception of catfish formulators regarding CSM the sample members were asked to indicate their opinion of the overall feeding value of a standard 41 protein CSM compared to that of a standard 44 protein soybean meal expressed on a percentage basis They were given a choice of 5 ranges from under 70 of the feeding value of soybean meal to over 100 in 10 increments (see Table 140 for the actual ranges used) All but one of the catfish respondents indicated that CSM has an overall feeding value of under 90 of that of soybean meal Given the five choices offered to respondents the mean feeding value of CSM relative to that of soybean meal was around 80
22
Sources of Information UtiJized on Formulating Catfish Feeds
Only about half of the catfish respondents indicated that they were familiar with research on feeding CSM to grow out stock and only a third were familiar with research on fingerlings (Table 141) Only 2 respondents were familiar with any research on feeding CSM to brood stock and fries To obtain information on formulating feeds for catfish the largest number of respondents indicated that they utilize university research and industry publications of some type (Table 142)
Cottonseed Meal Price and Value
Catfish sample members were also asked two Questions to get some idea concerning their perception of the value of CSM particularly with respect to soybean meal 1) if they would be willing to pay a premium per unit of protein for CSM with more than a standard 41 protein and 2) if gossypol and fiber were sufficiently low on average what percent of the cost of soybean meal would they be willing to pay for CSM
With respect to the first Question 75 of the catfish respondents indicated a willingness to pay a premium for a CSM with more than 41 protein which is consistent with their earlier responses that they would prefer a CSM with a higher crude protein level (Table 143)
In response to the second Question catfish respondents indicated that they would only be willing to pay an average of about 82 of the cost of soybean meal for a CSM with a sufficiently low level of gossypol and fiber (Table 144) The range around that average was more narrow than for poultry from 70 to 100 This is more consistent with the ratio of CSM price to soybean meal price that has existed over the last 7 or 8 years on average
Suggestions for Improving the Usefulness of Cottonseed Meal
Only three catfish respondents offered suggestions for improving the usefulness or value of CSM for catfish rations The three suggestions included I) providing a more consistent product in price and Quality 2) providing a premium Quality toxin-free high protein low-fat product superior to soybean meal and 3) eliminating the CHO fraction (Table 145)
Comparisons Among Animal Species
In order to highlight the salient differences in responses with respect to the various animal species the mean responses to Questions that are common among all surveys regarding CSM use as a feed ingredient were compared and analyzed An analysis of variance (ANOY A) was also done to detect statistically significant differences in the mean responses to each Question by animal specie Comparisons are made among the mean responses to all Questions in the 6 general areas to which all sample members were asked to respond regardless of the animal specie(s) for which they formulate feeds 1) the particular factors affecting their choice of dietary proteins for formulated feeds 2) the extent to which CSM is considered to be an alternative to selected protein feeds 3) the importance of nutritional and non-nutritional factors in their decisions to use CSM rather than alternative dietary proteins in their feed formulations 4) the seasonality of CSM availability 5) the specific reasons for the selection and non-selection of CSM for use in the feeds they formulate and 6) the source of CSM chemical analyses used by the respondents Where appropriate ANOY A results are also indicated
23
Factors Affecting Choice of Dietary Proteins
As discussed earlier all members of the final sample regardless of the animal species for which they formulate feeds were asked to rank the importance of four general factors in their choice of a dietary protein for their feed formulations on a scale of I to 7 (from extremely unimportant to extremely important respectively) 1) quality 2) price 3) availability and 4) consistency Comparing the results across animal types reveals few significant differences in the importance attached to any of the four factors by the responding formulators of the various animal specie feeds (ie comparing results horizontally in Table 146) But as pointed out in an earlier section the mean rankings for quality are all higher than those for the other factors while the mean rankings of price are all lower than those for most other factors across all animal types In other words the respondents consistently ranked quality highest on the scale of importance followed in order by consistency availability and price
Cottonseed Meal As An Alternative Protein Feed
Recall that the sample members were asked to rank various selected protein feeds on a scale of 1 to 7 as inferior or superior to CSM in an overall sense for use in feed formulations A second question required respondents to indicate whether or not they considered CSM to be an alternative to each of the 20 listed protein feeds A comparison of the mean ran kings and ANOV A results across animal types indicates substantial agreement among the respondents regarding the ranking of CSM as an alternative to some animal feeds and substantial disagreement with respect to CSM as an alternative to many others (Table 147) Respondents over all animal types tended to agree that certain feeds and in particular the higher crude-protein-content feeds are clearly superior to CSM including dried skim milk meat and bone meal fish meal blood meal soybean meal dried whole milk and corn gluten feed There was a statistically different deviation in the extent to which respondents for some animal species regarded those meals as superior however For example catfish respondents ranked meat and bone meal fish meal poultry by-products blood meal soybean meal and corn gluten meal higher than did respondents for the ruminant animals The same was roughly the case for poultry Beef and dairy cattle respondents tended to rank all other protein feeds as less superior (ie more inferior) to CSM There was also substantial agreement that CSM was about the same as tankage peanut meal linseed meal and brewers and distillers dried grains but superior to some extent over the other feeds particularly those lower in crude protein including dehydrated alfalfa sunflower meal wheat middlings safflower meal canola meal feather meal and urea Beef and dairy cattle respondents agreed that CSM can be considered an alternative to nearly all the protein feeds except perhaps skim and whole dried milk Poultry and catfish respondents indicated CSM is an alternative to fewer of the other protein feeds
The Importance of Nutritional and Non-Nutritional Factors
Respondents also ranked the importance of specific nutrition-related and non-nutritionshyrelated factors in choosing cottonseed meal as a component of the feeds they formulate on a scale of extremely unimportant to extremely important (a scale of I to 7 respectively) Comparing the mean rankings by the respondents reveals that poultry and catfish feed formulators clearly consider proteinshyrelated factors and gossypol level to be more important than do beef and dairy feed formulators (Table 148) Fiber level is also of more importance to formulators of catfish feed Interestingly the importance of fiber was not ranked significantly higher by poultry feed formulators than by beef and dairy cattle feed formulators At the same time aflatoxin was clearly ranked by all respondents as the most important factor affecting the choice of CSM as a feed ingredient irrespective of the animal specie for which the ration is intended
24
For the non-nutritional factors an analysis of the mean rankings indicates few significant differences in the responses across animal species with respect to each individual factor listed (Table 149) The most notable exception is that poultry respondents ranked palatability significantly less important than did any of the other respondents for the other animal species Finally catfish respondents perceived that service by the CSM industry was more important for them than did the respondents for the other animal species
Seasonality of Cottonseed Meal Availability
The respondents across all animal species indicated that CSM is least available between about May and October likely reflecting the increasing shortages of cottonseed meal supply just prior to the cotton harvest in the fall (Figure 20) At the same time however the beef cattle dairy cattle and poultry respondents all indicated that there is less need for CSM to be available during approximately those same months in order to compete effectively with other protein feeds (Figure 21) This suggest that the seasonality of supply may not represent an important constraint to competitiveness and growth possibilities of CSM as a feed ingredient Interestingly catfish respondents suggested a largely inverse pattern of the times of the year when CSM needs to be available to compete effectively with other protein feeds as a catfish feed ingredient Possible explanations of this phenomenon include I) the protein feed needs of catfish feed formulators peak in the late spring and summer months when supply is less available 2) catfish feed formulators are located such that CSM is not easily obtainable particularly during short supply years or 3) formulators of feed for other animal species have longer experience in using CSM and have adjusted their formulation to the pattern of CSM supply availability In any case it should be remembered that there are relatively few catfish feed formulators in the sample so that their joint responses may not be truly representative of all catfish feed formulators In this case this difference in their responses may mean little
Reasons for the Selection and Non-Selection of Cottonseed Meal
Respondents across animal species were quite consistent in their ranking of the top reasons that CSM is included in feed formulations (Table 150) They overwhelmingly ranked price as the top reason followed generally by availability and protein quality Catfish respondents differed somewhat from that order ranking protein quality second and palatability as third Availability was ranked fourth by catfish respondents The top reason all respondents listed for which CSM is not included in feed formulations was also price (Table lSI) Beef and cattle respondents ranked availability as second but poultry respondents ranked gossypol second while catfish respondents ranked protein quality second A vailability ranked only as the third reason that CSM is not selected by poultry respondents and fourth by catfish respondents Gossypol ranked either third or fourth for all animal species except poultry for which gossypol appears to be a more important reason for not including CSM in poultry feed formulations The question regarding the characteristics of CSM that would have to change in order for it to be selected more frequently as a feed ingredient elicited about the same responses as those for the previous question concerning why CSM is not included in feed formulations (Table 152) The top characteristic that would have to change in the opinion of most respondents is price Catfish respondents however listed price extremely low on their list suggesting that other factors are more of a constraint to CSM use in their opinion They ranked gossypol as the number one characteristic that would have to change Availability appeared to be more of a concern to beef and dairy feed formulators than for poultry and catfish formulators
25
Source of Chemical Analyses for Cottonseed Meal
About the same percentage of respondents across animal species perform analytical tests for aflatoxin crude protein fat fiber and gossypol (Figure 22) The only noticeable differences were for aflatoxin and gossypol for which about half the percentage of dairy and beef respondents compared to catfish respondents reported that they routinely perform tests A higher percentage of poultry respondents also appear to perform tests for aflatoxin and gossypol than is the case for beef or cattle respondents Crude protein is tested for by the highest percentage of respondents for all animal species while gossypol is tested for by the smallest percentage of all respondent groups except catfish CSM suppliers are more likely to provide feed formulators with analytical values for crude protein fat and fiber than for aflatoxin or gossypol (Figure 23) A sizeable percentage of the respondents across all animal types reported that their CSM supplier provides no analytical values whatsoever
Summary ofMajor Findings
Of the reams of information normally provided by a study like this relatively little is usually new or profound And of what can be found that appears important only some is little more than interesting or particularly useful Before turning to a discussion of the implications of the study results the major findings across animal groups are briefly summarized first Sifting through the many tables figures and data sets the main findings of the study appear to be the following
bull Quality is the most important factor affecting the choice of dietary proteins by feed formulators followed by consistency and availability Price is the least important of the four factors in making general decisions regarding dietary proteins for animal diets
bull Once feed formulators have set the general parameters for use of dietary proteins in their formulations however price is the most important factor determining the choice among alternative dietary proteins to satisfy the general parameters for dietary protein use in feed formulations
bull When considering whether or not to use CSM as the dietary protein in feeds the nutritional factors of most concern to formulators of feed for non-ruminant animals (poultry and catfish) appear to be protein-related For formulators of ruminant (beef and dairy cattle) feeds aflatoxin level and rumen degradability are the most important nutritional factors
bull The most important non-nutritional factors affecting feed formulators decisions regarding whether or not to use CSM are I) price 2) availability 3) consistent quality and 4) palatability in that order
bull Non-nutritional factors are more important than nutritional factors in the choice of CSM over alternative feeds to fill the dietary protein requirements of feed formulations In general price and availability were ranked above protein quality and other nutrition-related factors as reasons why CSM is and is not chosen as a feed ingredient over alternatives Price and availability were also cited as the characteristics that most need to change in order for CSM to be selected as a feed ingredient more frequently
bull CSM is generally considered to be inferior to higher protein feedstuffs and superior to lower protein feedstuffs This generalization however does not hold for all feeds and all animal types Formulators of ruminant animal feeds ranked many of the higher protein feeds more on a par with CSM than did formulators of non-ruminant animal feeds
26
bull The seasonality of CSM availability is both a positive and a negative factor affecting the use of CSM rather than alternative protein feeds in animal feed rations That is CSM is obviously more likely to be selected as a feed ingredient during months of greater availability than during the months of lower availability In general however the survey responses indicate that CSM is normally available when feed formulators perceive that it needs to be available One word of caution It may be that a higher percentage of CSM users agreed to participate in this survey than those who are currently not using CSM Those who are current CSM users may well have already adjusted their feed purchasing patterns and operations to reflect the seasonal changes in the availability of CSM Consequently current CSM users may perceive less of an availability problem than those who are not currently using CSM In this case the responses to these questions may not be truly representative of the perception of the availability of CSM by feed formulators in general
bull There is a tremendous disparity in the perception of respondents as to the appropriate levels of several key nutrition-related factors for specific livestock rations including energy levels fat levels gossypol levels and escape values (ruminants only) for cottonseed meal For each animal specie the range of variation in the perceived acceptable levels of each of these factors was extremely wide The obvious conclusion is that feed formulators generally lack adequate and reliable information on many factors which are crucial in efficient feed formulation and which have a significant impact on the choice of CSM as a feed ingredient
PROBLEMS AND OPPORTUNITIES FOR EXPANDING COTTONSEED MEAL USE
CSM is somewhat unique among vegetable protein meals in that it is the product of a byshyproduct The volume of the by-product cottonseed available for crushing and the potential supply of CSM depend more on the dynamics of cotton supply and demand than on forces specific to CSM markets This mean that market signals from feed formulators and livestock feeders regarding desired values and characteristics of protein meals likely have little impact on the potential CSM market supply
Since the mid-1970s the share of the annual production of cottonseed fed directly to ruminant livestock has increased steadily from about 5 in 1974 to nearly 40 in 1990 (Figure 24) The consequence has been a marked decline both in the share of the available supply of cottonseed that is crushed and in the ratio of actual to potential cottonseed meal output An increase in the demand for CSM therefore will either bid up the market price of CSM with no additional volume actually used or increase the cottonseed crush to feed use ratio (or some combination thereof) There will be little or no effect on the total amount of cottonseed available
The intent of efforts to expand the market for any commodity is to effect an increase in sales at a higher price For a commodity with a relatively fixed supply the major result of an expansion in demand is solely an increase in price because supply cannot increase to allow an increase in use For a commodity with an unlimited supply successful market expansion efforts simply increase use to the extent of the promotion with no increase in price For a commodity with a supply somewhere in between those two extremes successful market expansion will increase both the price and quantity used Although the situation for cottonseed meal is closer to the fixed supply end of the spectrum market expansion efforts can increase the use of cottonseed meal through an increase in the crush-toshy
27
feed cottonseed use ratio This ratio will increase as the profitability of crushing vs alternative uses of the seed increase
The results of this survey however indicate both some problems and possible opportunities for expanding cottonseed meal use After briefly summarizing the major obstacles as identified in the study the major opportunities for expanding use of cottonseed meal will be discussed
Problems for Expanding Cottonseed Meal Use
The major problems for expanding CSM use are generally well known and verified by the survey results The major problems that would hinder efforts to expand cottonseed meal use identified in the study included primarily the following
bull Price and availability of CSM are the major factors affecting the selection or non-selection of CSM as an ingredient of feed formulations regardless of animal specie These nonshynutritional factors were judged to be more important than nutritional factors in selecting CSM as a feed ingredient Unfortunately neither the price nor the availability of CSM can be controlled or altered substantially or directly by market expansion efforts Some efforts to improve availability may be possible as discussed in the next section
bull CSM is perceived to be inferior in an overall sense to a number of key protein feeds CSM was judged by the survey respondents to be clearly superior in aggregate to only 5 of 20 potential alternate protein feeds Such an image could work against efforts to expand CSM use
bull Gossypol level is one of the top reasons that CSM is not used more frequently particularly in non-ruminant feed rations The level of gossypol is a unique characteristic of CSM that obviously cannot be changed through market expansion activities
bull Several other specific characteristics of CSM would likely need to change for CSM to be selected more frequently as a feed ingredient including amino acid balance energy level aflatoxin level and protein quality As with gossypol changes in these characteristics are out of the realm of market expansion programs
bull Feed formulators generally lack adequate and reliable information on many factors which are crucial in efficient feed formulation and which likely have a significant impact on the choice of protein feedstuffs The use of CSM in livestock feed rations is likely restricted by the wide disparity in the perception of feed formulators regarding the appropriate levels of several key nutrition-related factors for specific livestock rations including energy levels fat levels gossypol levels and escape values (ruminants only) for cottonseed meal
bull Over 75 of dairy cattle feed formulators and nearly half of beef cattle feed formulators utilize whole fuzzy cottonseed to some extent in some of the feed rations they formulate Relatively few reported using utilizing both CSM and whole cottonseed in the same ration A main attraction of the use of whole fuzzy cottonseed as opposed to cottonseed meal is the fiber content Indeed the use of whole delinted cottonseed in cattle feed rations is much lower
28
Opportunities for Expanding Use of Cottonseed Meal
There are essentially only two basic tools to expand the market for any commodity l market development and 2) enhancing the efficiency of the marketing system Market development involves a wide range of activities including primarily new product development and product differentiation In new product development the effort is to develop new products or characteristics of products that appeal to different segments of consumers An example might be research leading to the elimination of gossypol in cottonseed meal which could further open up the non-ruminant feed industry to cottonseed meal
Product differentiation on the other hand encompasses those activities designed to create a user preference for or loyalty to a commodity Product differentiation occurs in two major forms 1) advertising and 2) variation in design and quality of product The primary purpose of advertising is to create user preference for a commodity and convince users of the superiority of a product over competing products Actual physical differences in the product are not necessary to successfully differentiate it from competing products It is sufficient only that users believe that some superiority exists Advertising often intends to create an image of superior quality because such images are harder to imitate or successfully counter than physically unique features Successful differentiation of a product means that users become less sensitive to price changes more willing to pay a higher price for the same quantity because they prefer the product and are loyal to it in the face of price increases In other words users are willing to pay more for the same amount because advertising if successful creates a preference for the product over competing products
Variations in quality and design are usually used along with advertising to differentiate the product of one seller from that of another Such variations are often necessary to help create the superior images desired andor attract new sets of consumers
Often barriers exist in a marketing system that hinder the efficient functioning of the market and restrict the flow of commodities from sellers to users Enhancing the efficiency of the marketing system through eliminating such barriers can lead to an expansion in the use of a commodity One of the primary requirements of an efficiently functioning market is that sellers and users possess adequate and accurate information regarding the product its characteristics availability sources uses and value among other things Inadequate or inaccurate information regarding a particular product and other market characteristics can divert demand to alternative products with which users may be more familiar regardless of whether or not those products are better in some sense
The concept and importance of enhancing market efficiency in this regard can be illustrated by comparing the flow of information about a product and market conditions with a radio broadcasting system The efficiency of such a system depends on how accurately the microphone and other equipment record sound how accurately and rapidly that sound is transmitted to a radio receiver and how accurately the receiver brings sound to the listener A breakdown anywhere along the line in that system will simply mean that the message of the broadcast does not get from the radio station to the listener Also if the message gets through but static interferes with the transmission the listener might only receive part of the message or a garbled message The listeners impressions and actions consequently might be quite different than if he had received the message intended In quite the same manner the flow of a commodity from producers to users is affected by how rapidly and accurately market information is evaluated and how accurately and rapidly this information is transmitted to and among producers and users Any breakdown or static in the system would result in a smaller and more obstructed flow of the commodity to users than if the market operated more efficiently
29
The survey results suggests possible opportunities for expanding CSM use through market development and enhancing market efficiency Market development opportunities may be limited because of the nature of the CSM supply situation Nevertheless expansion of CSM use is possible through a reduction in direct feeding of cottonseed so that opportunities for expanding use through market expansion efforts should not be discounted Efforts to enhance the adequacy and accuracy of information regarding the use of CSM as a feed ingredient however may well be the most effective means of promoting an expansion of use or enhancement of the value of CSM
Opportunities for Expansion through Market Development
Although many product development opportunities likely exist for CSM the survey basically focused on the image of CSM in the perception of feed formulators If a market development approach to expanding the use of CSM as an ingredient of animal feed formulations has any chance of success the survey results suggest that the following components of such a strategy will be crucial
bull Product quality and consistency and an improved image of availability must be the major targets of promotion efforts The survey responses across all animal types unequivocally indicated that these three factors are the prime considerations in making general decisions regarding dietary proteins for animal rations Price only becomes a factor in specific decisions regarding the particular protein feed to use to fill the dietary protein requirements of feed formulations after these general concerns are addressed Creating an image of quality consistency and availability for CSM is a necessary first step to expanding use and enhancing value
bull CSM use expansion efforts must focus to some extent on reducing the direct feeding of whole cottonseed to beef and dairy cattle Reductions in direct feeding is the only chance for an increase in supply of CSM to fuel expanded use in newer markets such as catfish and poultry feeding Also because beef and dairy cattle are major users of cottonseed meal a decrease in feeding of whole cottonseed in favor of CSM would significantly expand use
bull Separate CSM market promotion messages must be developed to address the very different needs and concerns of ruminant vs non-ruminant feed formulators The survey results clearly indicate that many nutritional and non-nutritional factors are more important for nonshyruminant feed formulators than for ruminant feed formulators and vice versa
bull The nutrition-related content of CSM market promotion messages must emphasize primarily positive aspects of CSM protein quality amino acid balance and amino acid availability as well as an accurate understanding of appropriate gossypol and aflatoxin levels Many of these factors however are more important for non-ruminant rather than ruminant feed formulators which must be accounted for in designing appropriate messages for feed formulators of each animal type
bull The non-nutrition-related content of CSM market promotion messages may well be the most important and must emphasize primarily the positive aspects of price availability consistency of quality and storability The survey results attached a relatively high level of importance also to nutrient guarantees Although not scoring particularly high in the responses services available from the CSM industry may also be a helpful component of CSM use promotion messages
30
Opportunities for Expansion through Market Emciency Enhancement
Even though some gains in CSM use and market value can reasonably be expected through market expansion efforts the cost involved could easily outweigh any benefits in terms of enhanced profits to the CSM industry Perhaps the most cost-effective appropriate and useful means of enhancing the use of CSM would be a strategy aimed at improving the level and accuracy of information available regarding CSM and its use Lack of information or misinformation can easily discourage feed formulators from using CSM in their feed formulations Strategies to enhance the quantity and accuracy of appropriate information can take on many forms from media advertising to market news letters Although it is beyond the scope of this study to develop alternative information strategies the results of this study clearly indicate a number of areas in which enhanced and more accurate information is a critical need These include the following
bull The overall quality of CSM The study suggests that the negative aspects of CSM are well known Less well known are the specific positive aspects of CSM that may give it an edge in some sense over other protein feeds
bull The ideal ratio of the price of CSM to other feeds like soybean meal The study results indicate that feed formulators may not be adequately informed about what the ideal market value of CSM is relative to soybean meal given the differences in feeding value As a consequence CSM may currently be less used in relation to soybean meal than current market price ratios suggest should be the case
bull Protein-related factors for CSM use in non-ruminant feeds These factors are a major concern in the decisions of feed formulators to include or exclude CSM in feed rations
bull The relationship of aflatoxin to CSM and the rumen degradability of CSM particularly for beef and dairy cattle feed formulators These were the nutritional factors of greatest concern to ruminant feed formulators in the decision to include CSM in their feed formulations
bull CSM price availability consistency and palatability These were indicated to be the most important non-nutritional factors affecting feed formulators decisions regarding whether or not to use CSM The study indicates that information on non-nutritional factors may be more important in the decision to use CSM over alternative feeds to fill dietary protein requirements of feed rations than information on nutritional factors
bull The feeding value of CSM relative to alternative protein feeds An accurate and detailed assessment of the extent to which CSM may be superior as an alternative to other standard protein feeds would help position CSM appropriately in the market
bull The appropriate and acceptable levels of several key parameters affecting the use of CSM in animal feed rations including energy levels fat levels gossypol levels and escape values (ruminants only) Feed formulators generally lack adequate and reliable information on these and likely other parameters not included in the study which are crucial in efficient feed formulation and which have a significant impact on the choice of protein feedstuffs Although it appears that nearly all feed formulators routinely perform crude protein analyses few perform analyses for aflatoxin gossypol fat fiber and other parameters Also CSM suppliers are apparently doing an inadequate job currently of providing such information to feed formulators
31
SOME CONCLUDING COMMENTS AND RECOMMENDATIONS
This study assessed the potential problems and opportunities for expanding the use of CSM through an analysis of the perceptions of feed formulators regarding the use of CSM as an animal feed ingredient The perceptions of feed formulators regarding CSM as a protein feed largely define the boundaries within which CSM use will be able to achieve any significant growth in the future Their perceptions right or wrong are the key to understanding not only the problems facing CSM use but also the opportunities
The general conclusion of the study is an obvious one the use of CSM in feed formulations faces some major challenges in the future Chief among these include a perception among feed formulators that price availability quality and other key CSM characteristics are often obstacles precluding increased use of CSM in their feed formulations Perhaps the most important implication of the study is that a serious lack of adequate and accurate information among feed formulators regarding the characteristics parameters value and other aspects of cottonseed meal use in animal feed rations may be seriously restricting the market opportunities for cottonseed meal U nfortunately the development of alternative strategies to expand the use of CSM and enhance the efficient functioning of CSM markets through more accurate and available information on all aspects of CSM use in feed formulations is beyond this study Nevertheless a few recommendations pertinent to the development of such alternative strategies are in order
bull Before adopting any approach to expand the use of CSM it would be useful first to conduct a detailed analysis of the costs and benefits involved Market promotion efforts through advertising can be extremely costly and yield relatively little Research has also shown that there is often a tremendous lag between advertising and promotion expenditures and any associated returns It could take years of investment in such market expansion efforts before an accurate measurement of the actual return on investment could even be attempted
bull Consider developing first a detailed plan for information dissemination to the feed industry regarding all appropriate aspects of CSM use in feed rations as determined in this study An important part of this process would be a comprehensive assessment of the information needs and the information resources readily available The gap discovered in this way between needs and resources will help set the research agenda for the industry to fill the critical existing information gaps
bull Initiate a study of final user attitudes and perceptions of CSM use as a guide to future market expansion efforts This study considered only the perceptions of feed formulators regarding the use of CSM But feed formulators are often not the final users Consulting nutritionists for example often include or exclude certain feeds and feed types from their formulations as requested by feed users At least a few of the respondents to the survey conducted for this study indicated that user preferences are major factors determining whether or not CSM is included in their feed formulations Indeed markets operate as the interaction of supply and demand to determine prices The preferences of final users ultimately will be expressed in the market values of any product in any market unless sufficient obstacles exist to prevent the market from functioning properly Therefore the real decision-makers in the use CSM in the market may well include many more individuals than adequately represented by feed formulators
32
REFERENCES
US Department of Agriculture (USDAa) Feed Situation and Outlook Report Economic Research Service FDS series various issues
US Department of Agriculture (USDA b) Oil Crops Situation and Outlook Yearbook Economic Research Service OCS Series various issues
Figure 1 Quantity of Oilseed Meals Fed to Livestock 194849 - 198590 (Average)
(1000 Tons)
25000 0-1-----------------------shy
20000 I-~
15000
10000
5000
o L 1 J tJ t tmiddotmiddotmiddot 1 oj 1 to bullbull 1 L_ n __LLL I 1 bullbull I V I
1948-49 1950-54 1955-59 1960-64 1965-69 1970-74 1975-79 1980-84 1985-90
(Years)
n iflu Soybean Meal bull Cottonseed Meal Other Oilseed Meals
Source USDA
c
8 c a CD
en ~
--I _ scg ~CD 01)-- en - () mg0 s 0
JCD enOJ CD_CD en 0
sCDCD 0 OJ shyo OJ r Jlt- 0 m CJ) 0 0lt o 0shyCD OJ J
~s ~m cpCJ) r co OJco ~m a
Figure 3 Price Premium (+) or Discount (-) of Cottonseed Meal Relative to Soybean Meal 1956-1990
~~ ~
o I ~ I I
-20 f---
-40
-60
1~1~1~1~1~1~1~1~1~1~1~1~1~1~1~1~1~1~
Cottonseed meal price is adjusted to a soybean meal protein equivalent basis
~I------------------------------------------------------
l l A
I~middotmiddot--- --------
Figure 4 Animal Species for which Respondents Formulate Feeds
DAIRY CATILE
BEEFCATILE
HORSES
SHEEP
BROILERS
LAYERS
OTHER
PETS
TURKEY
SWINE
CATFISH
210
21000
0 5 1000 15 20 25
Figure 5 Respondents Formulating Feeds for the Various Animal Species
0 20 40 60 80
Figure 6 Other Animal Species for Which Respondents Formulate Feeds
DAIRY CATTLE
BEEF CATTLE
HORSES
SHEEP
BROILERS
LAYERS
OTHER
PETS
TURKEY
SWINE
CATFISH
632
Exotics
Trout
Alligators
KOI
Breeding Hens
Wildlife
Rabbits
Avian
Shrimp
Salmon
Ducks
Fish
Gamebirds
Hybrid Bass
379
~--~----~--~----~----~--~----~--~----~--~
0 10 20 30 40 50
Figure 7 Respondent Feed Formulation Activities by State
( of Respondents)
o 00 middot15 16 -30 31 middot45Cgt 46 -60 61 - 75 - 76 -90
Table 8 Respondent Experience as an Animal Nutritionist
( of Respondents) 30 r---shy
25 t-middotmiddotmiddotmiddotmiddotmiddotmiddotmiddotmiddotmiddotmiddotmiddotmiddot-middot ---_ _
20 -_ -nNItshy
15
10
5
0 1-5 6-10 11-15 16-20 21-25 26-30 31-35 36-40 41-45
(Years Of Experience)
-it sa 0 m 8 l 0 CD l g
_ cc c -s CD CObull
-0 -s- 3 Dl ~ IJ CD (fJ
C 0 l C CD l -+
raquo Sl_ lt_ -+_ CD (fJ
Figure 10 Respondent Primary Feed Formulations
by Animal Type 1990 (Percent)
30 I--------------------------------------------------------shy
25 r- middotmiddotmiddotmiddotmiddotmiddot231middotmiddotmiddotmiddot
20
15
10
5
0 Beef Dairy Swine Poultry Horses Pets Aqua- Sheep Exotics
Cattle Cattle culture amp Goats
(Animal Type)
Figure 11 Percent of CSM and S8M Used in Formulations by Feed Manufacturer Respondents 1990
( of Average Feed Ration)
Figure 12 Tons of Feed Formulated by Feed Manufacturer Respondents 1990
65
91
6 9
17
Total Formulations Formulations With CSM
II Less than 200000 Tons
II 200000 - 400000 Tons bullbullbull I bullbullbullbullbullbull ~ 3 ~ 400000 - 600000 Tons
5 rn 600 000 - 800 000 Tonsru 1
[] 800000 - 1000000 Tons9 4
I ~ 1 More Than 1000000 Tons
Formulations With S8M
Figure 13 Percent middotof Beef Cattle Respondents Formulating CSM Feeds for Specific Beef Cattle Types
( of Respondents)
25 ~I------------------------------------------------------~
-Isectig Feedlot-II 223
20
15
10
5
0
bull Other
~ middotmiddotmiddotmiddotmiddotmiddotmiddot middotmiddot _middotmiddotmiddotmiddot-=middotmiddotmiddotccmiddotcmiddotmiddot
Brood Cows Bulls Calves Feeder Heifer Stocker
(Animal Type)
Figure 14 Percent of Dairy Cattle Respondents Formulating CSM Feeds for Specific Dairy Cattle Types
( of Respondents)
120 ----------------------
100 88
80
60
40
20
0 Calves Heifers Lactating Cows Dry Cows
(Animal Type)
Figure 1-5 Percent of Poultry Respondents Formulating CSM Feeds for Specific Poultry Types
( of Respondents)
OO~I--------------------------------------------~-
50 1-laquolaquolt--laquolaquolaquo -lt - lt - lt -lt laquo lt
44
40
30
20
10
0
f-
~laquolaquolaquolaquo
~laquolaquolaquolaquolaquolaquo
Broilers Layers Turkeys Breeding Flocks
(Animal Type)
Figure 16~ Combined Responses Months of the Year When CSM IS NOT Available
( of Respondents) 16 i ---
14 12~8
12
10
87373 7
6
4
2
0 ~~ ~s ~( ~( ~0( ~0(~~~ ~~ ~t ~1 u~ ~g n0~ ad-o N0~ ~a~
~Y ~o Q~lmiddotr
(Month)
Figure 17 Combined Responses Months of the Year When CSM Needs to Be Available
( of Respondents) 12 ---------------------------
10
8
6
4
2
0
goA 9
~ui ~s ~Ot X)Ot ~Ot X)Ot~0SV~0~~erl ~iSclt ~f ~~1 ~v~ ug ~o~ o~o NO~ co~0 0lt609 ~o
(Month)
Figure 18 Beef Cattle Responses Percent of Respondents Formulating Creep Feed for Calves or Supplements for Stockers
733
832
0 20 40 60 80 100 120
( of Respondents)
Figure 19 Beef Cattle Responses Protein-Related Factors Considered When Balancing Rations
Other Protein Factors 110
Rumen
Degradability 686
Crude Protein Level 161
Amino Acid
Values 42
( of Respondents)
Figure 21 Comparison of Responses Months When CSM Needs to Be Available
( of Respondents) 94 ---------------------------shy
92
9
88
86
84
82 8
78
76
74
72
7
68
66
~ euroI - It
64 -t----------------------------------- -----------t
JAN FEB MAR APR MAY JUN JUL AUG SEP OCT NOV DEC
(Month)
bull Beef Cattle -t Dairy Cattle ltgt Poultry Catfish
Figure 20 Comparison of Responses Months When CSM Is Not Available
( of Respondents)
16 t 15
14
13
12
11
10
9
8ltl amp
7
6
5 I JAN
I
FEB I
MAR I
APR I
MAY I
JUN I
JUL I
AUG SEP I
OCT NOV I
DEC
(Month)
bull Beef Cattle -t Dairy Cattle ltgt PouHry b Catfish
Figure 22 Comparison of Responses Analyses Routinely Performed
( of Respondents)
100~-----------------------------------------------
90
80
70
60
50
40
30
20
10
o I ~
AFLATOXIN C PROTEIN FAT FIBER GOSSYPOL OTHER NONE
(Analyses)
bull Beef Cattle Dairy Cattle o Poultry Catfish-t fj
Figure 23 Comparison of Responses Analytical Values Provided by Supplier
( of Respondents)
60shy
50
4)
30
20
10
o amp ~
AFLATOXIN C PROTEIN FAT FIBER GOSSYPOL OTHER NONE
(Analyses)
bull Beef Cattle -t Dairy cattle o Poultry b Catfish
Figure 24 Share of Cottonseed Use Crush vs Feed Use
( of Respondents)
100 I
90
CRUSH 80
70
60
50
40
30
20
FEED USE 10
o 1~ 1~ 1~ 1m 1m 1~ 1~ 1~ 1~ 1~ 1~ 1~ 1~ 1~
(Year)
Source USDAb
Table 1 Percentage of Beef Cattle Feeds Formula ted Table 2 CSM Feeds Formulated for Beef Cattle CSMmiddot Calvesmiddot
middotAverage Response Rate (feedlot=51 other=41) middotResponse Rate = 39
Table 3 CSM Feeds Formulated for Beef Cattle Table 4 CSM Feeds Formulated for Beef Cattle Stockersmiddot
middotResponse Rate = 40
Response Rate =37
Table 5 CSM Feeds Formulated for Beef Cattle Table 6 CSM Feeds Formulated for Beef Cattle
middotResponse Rate =33
middotResponse Rate = 37
Table 8 Percentage of Dairy Cattle Feeds Formulated CSM
Average Response Rate =88
middotResponse Rate = 37
Table 9 CSM Feeds Formulated for Dairy Cattle Table 10 CSM Feeds Formulated for Dairy Cattle
RespooseRate 24
middotResponse Rate = 34
Table 11 CSM Feeds Formulated for Dairy Cattle Table 12 CSM Feeds Formulated for Dairy Cattle
Response Rate = 31 Response Rate = 45
Table 13 Percentage of Poultry Feeds Formulated Using CSMmiddot
bullAverage Response Rate = 79
Table 14 Percentage of Catfish Feeds Formulated Using CSMmiddot
bullAverage Response Rate =67
Table 15 CSM Feeds Formulated for Catfishmiddot )middoti middot fteq~
bullAverage Response Rate = 17
Table 16 Combined Responses Importance of Specific Factors in Choice of Dietary Protein ( of
bullAverage Response Rate =g]
Table 17 Combined Responses Other Important Factors in
bullAverage Response Rate = 22
bullAverage Response Rate =91
-Average Response Rate =90
Table 20 Combined Responses Importance of Non - Nutrition -Related Factors in Choice of CSM over Alternative Protein Feeds ( of
-Average Response Rate = 87
Table 22 Combined Responses Top S Reasons Why CSM IS NOT Selected as a Feed
Table 23 Combined Responses Top 5 Specific Characteristics That Would Have to Change for CSM to be Selected as a Feed
Table 24 Combined Responses Analysis Routinely Performed
Table 25 Combined Responses Analysis Values Provided
CSM
267 067 333 333 1400 S333
467 000 067 067 1400 4867 --shy
467 000 000 067 400 4333 --shy -- shy -- shy
250 000 000 000 1250 4000 -- shy --shy
313R 4733 62 ------ shy~ - shy ~-
4S00 62
bullAverage Response Rate = 100
bullAverage Response Rate = 87
Table 28 Beef Cattle Responses Imponance of Nutrition-Related Factors in Choice of CSM Over Alternative Protein Feeds
Average Response Rate = 91
Table 29 Beef Cattle Responses Other Nutrition - Related
Fact~~~~~~~~~~~~~~~~~~~
Response Rate =7
Table 30 Beef Cattle Responses Imponance of Non - Nutrition - Related Factors in Choice of CSM Over Alternative Protein Feeds
middotAverage Response Rate = 87
middotResponse Rate = 5
bullAverage Response Rate =14
Table 33 Beef Cattle Responses Months of the Year When CSM Needs to Be AvaiJable I ii middot middot1
bullAverage Response Rate =53
10 U
-Moy
JIIJ
All
so
0_ -
to
--I No
Moy
10 -so shy
0_ _ 0-
Table 35 Beef Cattle Responses Top 5 Reasons Why CSM Is Not Selected as a Feed
Average Response Rate =100 Response Rate = 24
Response Rate =28
Average Response Rate = 98
Response Rate = 17
middotResponse Rate =9
Table 43 Beef cattle Responses Type of Creep Feed
middotResponse Rate = 81
middotResponse Rate =26
Table 45 Beef cattle Responses Respondents Formulating Rations With CSM and Whole
middotResponse Rate = 68
Table 47 Beef cattle Responses Percentage of Whole Cottonseed Respondents Mix in Rations Containing Both CSM and Whole Cottonseedmiddot tCmiddotHiitjt~ middotmiddotmiddotmiddot1
middotResponse Rate =25
middotResponse Rate = 30
bull Response Rate = 98
Response Rate =11
Table 51 Beef Cattle Responses Escape Value Respondents Are Using for Rumen Degradabilitymiddot
1~iiii middotb~r~~fgtD zq436imiddotmiddotmiddotmiddotmiddotmiddotmiddot 004bullbullbullbullbullbullbullbullbullbull1----22--+----31-4
I~~I 23 329
middotResponse Rate = 57
Table 53 Beef Cattle Responses Methods or Sources Respondents Used to Calculate CSM
Table 52 Beef Cattle Responses Reliability of Escape Values Used
Table 54 Beef Cattle Responses Interested in Knowing Escape Values for CSM Processed
Valuemiddot
middotResponse Rate =98
)
I Mean ~nse
63 57S19 228381 Q-L_uu ~139 59468 32306 139bullII1 1 061 06
1 1 44 430 614431-------- 57t 001 001 middot-1
==~=-__~~1c9 00 _ 06 _ 001_ 38 133 323 63
Average Response Rate =100
Response Rate = 89
Table 58 Dairy Cattle Responses Importance of Nutrition - Related Factors in Choice ofCSM Over Alternative Protein Feeds (ofbmiddotNmiddotmiddotmiddotmiddotmiddotmiddot
Response Rate =88
Table 59 Dairy Cattle Responses Other Nutrition-Related Factors
Indicated br~~P211dents
Response Rate =10
Table 60 Dairy Cattle Responses Importance of Non- Nutrition - Related Factors in Choice of CSM Over Alternative
Protein Feeds ( ofResPOndents~dd
Response Rate = 88
Response Rate = 3
--
Average Response Rate = 51
Table 62 Dairy Cattle Responses Months in the Year When CSM IS NOT Available
10 u
J -- AIIIi
--~ shy
loOoIMr _ 0-
bullAverage Response Rate =69
--- AIIIi
--~ soM
0
0-_
10
Table 65 Dairy Cattle Responses Top 5 Reasons Why CSM IS NOT Selected as a Peed
Table 66 Dairy Cattle Responses Top 5 Specific Characteristics That Would Have to ro1 ____ for CSM to be Selected as a Feed
Table 67 Dairy Cattle Responses Analyses Routinely Performed fmiddotmiddotmiddotmiddot
Response Rate =96
Response Rate =56
Table 68 Dairy Cattle Responses Other Analyses
Response Rate =25
Table 70 Dairy Cattle Other Analytical Values CSM
Response Rate =4
Average Response Rate =81
Average Response Rate = 15
Table 73 Dairy Cattle Responses Respondents Formulating Feeds With Whole andor Delinted
Cottonseed bull
bullAverage Response Rate =92
middotResponse Rate = 40
Table 74 Dairy Cattle Responses Respondents Formulating Rations with Cottonseed Meal and Whole Cottonseed in the Same Rationmiddot
middotResponse Rate = 97
Table 76 Dairy Cattle Responses Percentage of Whole Cottonseed Respondents Mix in Rations
ltltJIltainin(a0th CSM and WhoeCottonseedmiddot Mean
middotResponse Rate = 42
Table 77 Dairy Cattle Responses Knowledge of Research on Feedine CSM
~~~~
Average Response Rate = 68
Response Rate =7
Average Response Rate =59
Response Rate =25
Average Response Rate =63
Response Rate = 13
middotResponse Rate = 92
Response Rate =82
Table 85 Dairy Cattle Responses Methods or Sources Used to Calculate CSM
Response Rate = 73
Table 86 Dairy Cattle Responses Respondents Interested in Knowing Escape Values for CSM Processed from Different Methodsmiddot fmiddotmiddotmiddotmiddotmiddotmiddot
Response Rate = 92
Response Rate = 34
Table 89 Dairy Cattle Responses Suggestions for CSM
Response Rate =33 Response Rate =22
-----
64 139 24815 00 36 511 5751
5951 131 438 35015 00 15 I-~~~~~
6200 15 423 51151 00 00 ~~~ -~~~ -~~~ ~~~-~~ --~~ ~ ~ ~~-~ ~
292 55125 00 00 125 45800
bullAverage Response Rate =99
Average Response Rate =85
Table 92 Poultry Responses Importance of Nutrition - Related Factors in Choice of CSM Over Alternative Protein Feeds (of
Average Response Rate =85
Table 93 Poultry Responses Other Nutrition-Related Factors Indicated
200
200
Response Rate = 5
Table 94 Poultry Responses Importance of Non - Nutrition - Related Factors in Choice of CSM Over Alternative Protein
Feeds~~~~~~~~~~5=~~~~~T7~~
00 Average Response Rate =83
Response Rate =4
Average Response Rate = 17
Table 97 Poultry Responses Months in the
J
p
April
lao
A
shy-- 0
ft
April
_
Average Response Rate = 43
=1 g L
0
Table 99 Poultry Responses Top 5 Reasons Why CSM IS NOT Selected as a Feed
Table 100 Poultry Responses Top 5 Specific Characteristics That Would Have to Change for
CSM to be Selected as a Feed Inoredient
Table 101 Poultry Responses Analyses Routinely
middotResponse Rate = 93
Table 102 Poultry Responses Other Analyses Routinely
Performed
middotResponse Rate = 27
Table 103 Poultry Responses Analytical Values Provided
middotResponse Rate =73
Table 104 Poultry Responses Knowledge of Problems
bullAverage Response Rate = 62
Average Response Rate = 14
Table 106 Poultry Responses Protein - Related Factors
Average Response Rate = 64
Table 107 Poultry Responses Other Protein - Related
Response Rate =11
Table 108 Poultry Responses Crude Protein Levels
Preferred for CSM
Response Rate = 55
Table 111 Poultry Responses Gossypol Levels Considered
Safe
Table 112 Poultry Responses Would or Do Use Table 113 Poultry Responses Relative Feeding Value of CSM Comoared to 44 SBMmiddot
middotResponse Rate = 96
bull Response Rate = 100
Table 114 Poultry Responses Knowledge of Table 115 Poultry Responses Familiarity with Other Feedino CSMmiddot
middotResponse Rate =7 bull Response Rate = 73
middotResponseRate = 31
bullAverage Response Rate = 58
Table 118 Poultry Responses Willingness to Pay
a Premium Per Unit of Protein for CSM With More
Than 41 Protein
bullResponse Rate =91
Table 119 Poultry Responses Percent of Cost of SBM Respondents Willing to Pay for CSM with
Response Rate =27
Response Rate =64
00 00 87 43 478 304 57 00 00
----shy I--~~
00 ~-~
43 522 348 59 ----shy
62~ 00 00 00 261 ----shy
652 ------shy
00 00 00 00 667 333 63 AverageResponseRate = 99
bullAverage Response Rate = 73
Table 123 Catfish Responses Importance of Nutrition - Related Factors in Choice of CSM Over Alternative Protein Feeds
Average Response Rate =83
Table 124 Catfish Responses Importance of Non- Nutrition - Related Factors in Choice of CSM Over Alternative Protein
Feeds
Average Response Rate = 90
bullAverage Response Rate = 13
Igt 20
s_
Pshy s
--s
H_
_
gt 7 bull bull bull bull bull
1 fsI plusmn -
haMr
N__
shy
bullAverage Response Rate =54
Table 128 Catfish Responses Top 5 Reasons Why CSM IS NOT Selected as a Feed
Table 129 Catfish Responses Top 5 Specific Characteristics That Would Have to Change for CSM to Be Selected as a Feed-_
Table 130 Catfish Responses Analyses Routinely Table 131 Catfish Responses Other Analyses Routinely Performed
middotResponse Rate = 25
middotResponse Rate =92
bullAverage Response Rate = 18
Table 133 Catfish Responses Knowledge of Problems Feedine CSM to CatflSh
Average Response Rate =100
Table 134 Catfish Responses Protein - Related Factors Considered i
Response Rate = 83
Table 135 Catfish Responses Crude Protein Levels Preferred for CSM
Response Rate = 100
Table 139 Catfish Responses Would or Do Use Table 140 Catfish Responses Relative Feeding
Value ofCSM Compared to 44~ Lmiddotmiddotmiddotmiddotmiddotmiddotmiddotmiddotmiddotmiddotmiddotmiddotmiddotmiddotmiddotmiddotmiddotmiddotmiddot _
Response Rate = 100
Response Rate = 100
Table 141 Catfish Responses Knowledge of Research on Table 142 Catfish Responses Sources ofInformation
Average Response Rate = 83
bullAverage Response Rate = 44
Table 143 Catfish Responses Willingness to Pay A Premium Per Unit of Protein for CSM with More Than
middotResponse Rate = 100
Table 144 Catfish Responses Percent of Cost of SBM Respondents Willing to Pay for CSM with Sufficiently Low Goscvnol and Fiber Levelsmiddot
middotResponse Rate = 83
middotResponse Rate = 25
Table 146 Comparison of Mean Responses and Analysis of Variance (ANOVA) Importance of Specific
bull Scale of 1 (extremely unimportant) to 7 (extremely important) for the mean ranking a Mean significantly larger across animal types at the 5 significance level otherwise no difference b Mean significantly lower across animal types at the 5 significance level otherwise no difference
Table 147 Comparison of Mean Responses and Analysis of Variance (ANOVA) Ranking of Other Protein
bull Scale of 1 (CSM inferior to respective feed) to 7 (CSM superior to respective feed) for the mean ranking
a Mean significantly larger across animal types at the 5 significance level otherwise no difference
b Mean significantly lower across animal types at the 5 significance level otherwise no difference
Table 148 Comparison ofMean Responses and Analysis of Variance (ANOVA) Importance of Nutritionshy
Related Factors in Choice ofCSM Over Alternativesmiddot
bull Scale of 1 (extremely unimportant) to 7 (extremely important) for the mean ranking a Mean significantly larger across animal types at the 5 significance level otherwise no difference
b Mean significantly lower across animal types at the 5 significance level otherwise no difference
Table 149 Comparison of Mean Responses and Analysis of Variance (ANOVA) Importance of Nonshy
Nutrition- Related Factors in Choice of CSM Over Alternativesmiddot
bull Scale of 1 (extremely unimportant) to 7 (extremely important) for the mean ranking
a Mean significantly larger across animal types at the 5 significance level otherwise no difference
b Mean significantly lower across animal types at the 5 significance level otherwise no difference
- = Not mentioned or ranked lower than 4th place
Table 151 Comparison of Responses Top Responses Why CSM IS NOT Selected as a Feed
- = Not mentioned or ranked lower than 5th place
Table 152 Comparison of Responses Top Characteristics that Have to Change for CSM to Be
- = Not mentioned or ranked lower than 5th place

9
Results by Animal Species
The responses in the previous section are indicative of the overall perceptions of feed formulators of the use of CSM as a feed component Those results however may mask some important differences in perceptions among formulators of feeds for the various animal species There are also issues regarding the use of CSM as a feed component that are unique to the various animal species Consequently salient dissimilarities in the responses of formulators of different animal feeds from the combined responses (over all animal types) discussed in the previous section are highlighted in this section Also the results of the questions asked specifically of formulators of feeds for particular animal species are discussed in this section in detail as well
BeeCattle
There are few major differences in the perceptions of beef cattle feed formulator respondents concerning the use of cottonseed meal from those discussed in the previous section for all survey respondents This may reflect the larger number of respondents formulating feed for beef cattle (and for ruminants in general) than for other animal species The salient differences in the 6 general question areas include the following
bull Factors affecting choice 0 dietary proteins The only major difference in the responses to these questions was a somewhat greater concern by responding beef cattle feed formulators for other factors influencing the choice of a dietary protein such as palatability and rumen degradability (Table 26)
bull Cottonseed meal as an alternative protein feed The results for beef cattle are roughly similar to those from the combined responses (Table 27) Major differences include I) a lower percentage of beef cattle survey respondents consider blood meal to be superior to CSM in beef cattle feeds 2) a large majority of respondents feel that CSM is not an alternative to dried skim milk and dried whole milk in beef cattle feeds and 3) an overwhelming majority of respondents consider CSM to be an alternative to the remaining protein feeds for use in beef cattle feeds except perhaps for fish meal and blood meal
bull The importance 0 nutritional and non-nutritionalactors Again the responses are generally the same as for the combined responses The beef cattle survey respondents however tended to rank nutrition-related factors as less important and non-nutrition-related more important than was the case for the combined responses On average beef cattle feed formulators ranked protein quality amino acid balance amino acid availability fat level fiber level and gossypol level as less important factors in the choice of CSM than was the case for the combined responses (Tables 28 and 29) Of the non-nutrition-related factors respondents ranked palatability the need for a local supply equipment requirements convenience and CSM industry service as all slightly more important in the choice of CSM than was the case for the combined responses (Tables 30 and 31)
bull Seasonality 0 cottonseed meal availability The results for the beef cattle respondents are virtually identical to those from the combined responses (Tables 32 and 33)
bull Reasons lor the selection and non-selection 0 cottonseed meal The top three reasons for which CSM is and is not selected as a feed ingredient are exactly the same for the beef cattle responses as for the combined responses (Tables 34 and 35) Also price availability and
10
gossypol level are cited as the three most important factors that would have to change for CSM to be used more frequently as was the case with the combined responses (Table 36)
bull Source 0 chemical analyses lor cottonseed meal No major differences appear in either the analyses routinely performed by the responding beef cattle feed formulators or the analytical values provided to them by CSM suppliers (Tables 37 38 39 and 40)
Beef cattle sample members were also asked several questions specifically regarding the use of CSM in beef cattle feed formulations in 5 general areas I) problems resulting from feeding a ration with CSM to the various beef cattle types 2) details on particular feed formulations for beef cattle 3) sources of information utilized regarding formulating beef cattle feeds 4) protein-related factors considered when balancing rations for beef cattle and 5) an open-ended question soliciting suggestions to improve the usefulness or value of CSM for beef cattle feed formulations
Problems from Feeding CSM Rations to Beef Cattle
Few respondents indicted knowledge of any problems resulting from feeding a ration containing cottonseed meal to either feedlot or other beef cattle (Table 40 The most frequently mentioned problems concerned feedlot bulls and calves The majority of the problems reported involved supplements and starter feeds (Table 42) The main problems reported had to do with gossypol beef cattle performance when fed rations containing CSM and reproduction The low number of respondents indicating problems of any type however suggests that the problems reported were likely isolated cases
Details on Particular Feed Formulations for Beef Cattle
The sample members were also asked to provide information regarding creep feeds for calves and supplements for stockers that they formulate as well as information regarding the use of whole or delinted cottonseed in beef cattle feed rations Nearly 75 of all beef cattle respondents formulate creep feeds for calves and over 80 formulate supplements for stockers (Figure 18) Traditional creep feeds represented two-thirds of the creep feeds formulated (Table 43) Over half the respondents indicated that they formulate traditional creep feeds Fewer respondents formulated high protein creep feeds
Nearly half the beef cattle respondents formulate some feeds using whole fuzzy cottonseed (Table 44) Only a little less than a third formulate any feeds using delinted cottonseed however Also only about a quarter of the respondents formulate any rations that include both CSM and whole cottonseed (Table 45) For those who formulate rations that include both the mix of the two in the rations varies widely Respondents reported that the share of such rations accounted for by CSM ranged from 1 to 100 with a mean of 19 (Table 46) The share of those rations accounted for by whole cottonseed ranged from 0 up to a maximum of 25 with a mean of 102 (Table 47)
Sources of Information Utilized on Formulating Beef Cattle Feeds
The largest number of respondents (110 of 123 respondents) indicated that they utilize university research of some type to obtain information on formulating feeds for beef cattle (Table 48) Only slightly fewer (91 respondents) indicated that industry publications are a source of feed formulation information for beef cattle University extension and government agencies were also listed as important information sources A few respondents listed other sources of information
II
including primarily the results of research performed in their own companies their own personal experience and their own private research (Table 49)
Protein-Related Factors Considered for Balancing Beef Cattle Rations
Nearly 70 of the respondents indicated that rumen degradability is a protein-related factor that they consider when balancing beef cattle rations (Figure 19) Respondents also consider crude protein level (16) and other protein factors (11) Only 4 indicated concern for the amino acid value when balancing beef cattle feed rations The two main other protein-related factors the respondents indicated as having a bearing on balancing beef cattle feed rations were the digestibility of the protein and the protein ingredients (Table 50)
Respondents indicated a wide range of escape values (or by-pass values) that they are using for CSM from less than 20 to over 50 (Table 51) At the same time however they are unsure as to the reliability of the escape values they are using Nearly 70 indicated that the escape values they are using are neither reliable or unreliable or only somewhat reliable (Table 52) The principal single method or source used by respondents for the escape value was the National Research Council (Committee on Animal Nutrition National Academy of Sciences) (Table 53) Universities were the next most frequently mentioned single source of CSM escape values The largest number of respondents (32) simply indicated that several sources were consulted for escape values Finally almost all respondents indicated an interest in obtaining information on escape values for CSM as processed by different methods (Table 54) There appears to be a lack of reliable information on CSM escape values in the perception of beef cattle feed formulators
Suggestions for Improling the Usefulness of Cottonseed Meal
Only 16 of the beef cattle feed formulators that returned surveys provided suggestions that might improve the value or usefulness of CSM in feed rations (Table 55) Some of the more noteworthy suggestions included improving the consistency of cottonseed meal various types of needed research more data on CSM and increased availability of CSM
Dairy Cattle
There are few major differences in the perceptions of dairy cattle feed formulator respondents concerning the use of cottonseed meal from the combined responses over all survey respondents and the beef cattle responses Again this may reflect the larger number of respondents formulating feed for dairy cattle (and for ruminants in general) than for other animal species The salient differences in responses by dairy cattle feed formulators in the 6 general question areas include the following
bull Factors affecting choice of dietary proteins There is virtually no differences in the responses of dairy cattle respondents from the combined responses for any of the listed factors (quality price availability consistency and other) affecting the choice of dietary protein (Table 56) A large majority of dairy cattle feed formulators ranked all factors as either important or extremely important
bull Cottonseed meal as an alternative protein feed The results for dairy cattle are roughly similar to those from the combined responses (Table 57) The two major differences include I) a large majority of respondents feel that CSM is not an alternative to dried skim milk fish
12
meal dried whole milk and blood meal in dairy cattle feeds and 2) an overwhelming majority of respondents consider CSM to be an alternative to nearly all the remaining protein feeds for use in dairy cattle rations
bull The importance of nutritional and non-nutritional factors Again the responses are generally the same As was the case for beef cattle respondents however dairy cattle respondents tended to rank the listed non-nutrition-related factors as relatively more important than the listed nutrition-related factors On average dairy cattle feed formulators ranked amino acid balance fiber level and gossypol level as less important factors in the choice of CSM than was the case for the combined responses (Tables 58 and 59) As in the case of both the combined and beef cattle responses aflatoxin was ranked at a higher level of importance than any other single nutrition-related factor Of the non-nutrition-related factors respondents ranked most factors as all slightly more important in the choice of CSM than was the case for the combined responses (Tables 60 and 61)
bull Seasonality of cottonseed meal allailability The results for the dairy cattle respondents are highly consistent with those for both the combined responses and for the beef cattle responses The months of May through September are the months of least availability of CSM which are also the months indicated when CSM is least needed to be available in the perception of dairy cattle respondents (Tables 62 and 63) Again the suggestion is one of little problem of CSM availability although this is not totally the case as indicated by dairy cattle respondents in later questions
bull Reasons for the selection and non-selection of cottonseed meal While price and availability are also the top two reasons that dairy cattle respondents perceived that CSM is selected as a feed ingredient protein contentquality ranked third on their list followed closely by palatability (Table 64) The top two reasons the CSM is not selected according to the dairy cattle respondents were price and availability as with both the combined responses and the beef cattle responses The third reason given by the dairy cattle respondents however was protein qualitylevel followed in fourth place by gossypol (Table 65) Again price was the key CSM characteristic that dairy cattle respondents indicated that must change in order to be used more frequently in dairy cattle rations (Table 66) Availability and gossypol levels were ranked as the second and third CSM characteristics that must change as was the case for the combined responses
bull Source of chemical analyses for cottonseed meal The results for the chemical analyses performed by dairy cattle respondents are virtually identical to those of both the combined results and those of the beef cattle results The primary analysis routinely performed by the dairy cattle respondents is crude protein (121 of the 143 respondents) followed by fiber (94 respondents) and fat (83 respondents) (Tables 67 and 68) The primary analytical values supplied to the dairy cattle respondents also include crude protein (62 respondents) fiber (50 respondents) and fat (47 respondents) (Tables 69 and 70) It is interesting to note that although aflatoxin was ranked at a higher level of importance than any other nutrition-related factor affecting the choice of CSM as feed component only a third of the dairy cattle respondents routinely perform analyses for aflatoxin and only 11 respondents are provided aflatoxin values by their CSM suppliers The story is about the same for both the combined and the beef cattle responses
Dairy cattle sample members were also asked several questions specifically regarding the use of CSM in dairy cattle feed formulations in 6 general areas I) problems resulting from feeding a
13
ration with CSM to the various dairy cattle types 2) details on dairy cattle feed formulations containing whole cottonseed 3) sources of information utilized on formulating dairy cattle feeds 4) protein-related factors considered when balancing rations for dairy cattle 5) gossypol levels considered to be safe for mature dairy cattle and pre-ruminant calves and 6) an open-ended question soliciting suggestions to improve the usefulness or value of CSM for dairy feed formulations
Problems from Feeding CSM Rations to Dairy Cattle
Again very few respondents indicted knowledge of any problems resulting from feeding a ration containing CSM to dairy cattle (Table 71) Only 24 of the respondents indicated problems with calves and only 18 for lactating cows as the result of feeding rations with CSM Only about 3 of the respondents mentioned problems with either dairy heifers or dry cows The number one problem reported was gossypol toxicity primarily in creep feeds and complete rations (Table 72) Both palatability and poor performance problems for various feed types were also frequently mentioned Again however the low number of respondents indicating problems of any type suggests that the problems reported were likely isolated cases
Details on Dairy Cattle Feed Formulations Containing Whole Cottonseed
Over 75 of dairy cattle respondents formulate feeds using whole fuzzy cottonseed a much higher percentage than was the case for beef cattle Less than half of the dairy cattle respondents however utilize delinted cottonseed in their feeds more in line with the beef cattle results (Table 73) Less than half the respondents formulate rations that include both CSM and whole cottonseed (Table 74) For those who formulate rations that include both the mix of the two in the rations varies widely Respondents reported that the share of such rations accounted for by CSM ranged from 1 to 30 with a mean of 85 (Table 75) The share of those rations accounted for by whole cottonseed ranged from 3 to 100 with a mean of 16 (Table 76) It appears therefore that on average dairy feeds formulated with both CSM and whole cottonseed contain a higher percentage of whole cottonseed than of CSM This is just the opposite of the situation for beef cattle
Sources of Information Utilized on Formulating Dairy Cattle Feeds
Over 80 of the dairy cattle respondents indicated that they were familiar with research on feeding CSM to mature dairy cattle (Table 71) Only half however indicated familiarity with such research for pre-ruminant calves Less than 10 of the respondents listed any other research on feeding CSM to other types of dairy cattle (Table 78) The largest number of respondents (137 of 143 respondents) indicated that they utilize university research to obtain information on formulating feeds for dairy cattle followed by industry publications of some type (121 respondents) and university extension service (83 respondents) (Table 79) Only 36 respondents listed other sources of information including primarily personal experience and research (Table 80)
Protein-Related Factors Considered for Balancing Dairy Cattle Rations
Nearly 100 of the dairy cattle respondents indicated that both crude protein level and rumen degradability are factors they consider when balancing rations for dairy cattle a much higher level than is the case for beef cattle (Table 81) Less than half consider amino acid values (61 of 143 respondents) Only 19 respondents indicated that they consider other factors like protein solubility (Table 82)
Dairy cattle respondents indicated a even wider range of escape values (or by-pass values) that they are using for CSM than did beef cattle respondents from 0 to over 80 (Table 83) The mean escape value calculated from the responses is 40 Dairy cattle respondents indicated slightly more
14
confidence in the escape values they are using than was the case for beef (Table 84) Only 22 respondents however considered those escape values to be reliable or extremely reliable The principal single method or source used by respondents for the escape value they use was again the National Research Council (Committee on Animal Nutrition National Academy of Sciences) (Table 85) Book values was the next most frequently mentioned single source of CSM escape values (23) Finally nearly 100 of the respondents indicated an interest in obtaining information on escape values for CSM as processed by different methods (Table 86) The conclusion from the dairy cattle responses is the same as for beef cattle That is there appears to be a lack of reliable information on CSM escape values in the perception of dairy cattle feed formulators and that they are highly interested in obtaining more information in this regard
Gossypol Level Considered Safe for Mature Dairy Cattle and Pre-Ruminant Calves
Dairy cattle respondents appear to have little idea of what the safe levels are for gossypol in mature dairy cattle and pre-ruminant calf feeds First of all only one-third of those who returned surveys even attempted to provide numbers for safe gossypol levels (Tables 87 and 88) Many respondents simply wrote comments such as dont know or not aware of research on safe gossypol level in the margin of the survey beside the question Second those who attempted to answer the questions provided an amazingly wide range of safe gossypol levels from 0 parts per million (ppm) to 7500 ppm for mature dairy cattle and from 0 ppm to 1000 ppm for pre-ruminant calves The mean safe gossypol levels were 609 ppm for mature dairy cattle and 121 ppm for pre-ruminant calves The responses were spread quite evenly between the extremes around the means It should be noted that the research team checked and rechecked the data set for this question to insure there were no errors in data entry
Suggestions for Improving the Usefulness of Cottonseed Meal
Only about 22 of the dairy cattle feed formulators that returned surveys provided suggestions that might improve the value or usefulness of CSM in dairy cattle feed rations (Table 89) Some of the more frequent suggestions dealt with improving the consistency and availability of CSM Several respondents suggested the need for more information on gossypol a worthy suggestion given the results of the previous question
Poultry
The perceptions of poultry feed formulator respondents concerning the use of cottonseed meal differ importantly in many respects from the combined responses over all survey respondents and from those of beef and dairy cattle Many of the differences are likely the result of the distinct dietary needs of ruminant as opposed to non-ruminant animals The salient differences in responses by poultry feed formulators in the 6 general question areas include the following
bull Factors affecting choice of dietary proteins Surprisingly there was little difference in the responses of those indicating that they formulate feed for poultry than for the combined results (or for beef and dairy cattle) regarding the importance of the listed factors (quality price availability consistency and other) affecting the choice of dietary protein (Table 90) A large majority of poultry feed formulators ranked all factors as either important or extremely important The only exception is that consistency was ranked slightly less important by poultry respondents than by respondents in general
bull Cottonseed meal as an alternative protein feed Poultry respondents ranked more protein feeds as higher on the superior-to-CSM scale than was the case for the combined responses
15
(Table 91) In fact the mean rank of all but three of the protein feeds were all at least somewhat higher than was the case for the combined responses The mean rank of several of the other protein feeds as determined by the poultry respondents was much higher than for the combined responses including fish meal poultry by-product meal and soybean meal Poultry by-product meal changed from an inferior to a superior protein feed compared to CSM The protein feed judged by poultry respondents to be most superior to CSM for poultry rations was soybean meal while urea was ranked as most inferior Poultry respondents also appeared to have stronger opinions about whether or not CSM is an alternative to the other listed protein feeds than was the case for the combined responses They overwhelmingly perceived that CSM is not an alternative to many of the other protein feeds including fish meal dried skim milk dried whole milk poultry by-product meal blood meal tankage and urea A larger percentage of poultry respondents than was the case for dairy and beef cattle perceived however that CSM is a definite alternative to many other protein feeds including safflower meal sunflower meal linseed meal peanut meal canola meal feather meal distillers dried grains brewers dried grains and even soybean meal
bull The importance of nutritional and non-nutritional factors Poultry respondents ranked all but two of the listed nutrition-related factors as more important in the choice of CSM over alternative protein feeds for poultry rations than was the case for the combined responses on average (Le comparing mean responses) (Table 92) The highest percentage of poultry respondents ranked gossypol level (62 of the respondents) amino acid balance (59) aflatoxin (58) protein quality (57) and amino acid availability (57) as extremely important in the choice of CSM over alternative protein feeds Only about 5 of the respondents listed other important nutrition-related factors (Table 93) There are few differences however in the poultry responses as compared to the combined responses regarding the importance of non-nutrition-related factors (Table 94) The major difference is a much lower ranking of the importance of palatability in choosing CSM over alternative protein feeds Also a somewhat higher percentage of poultry respondents ranked price as an extremely important non-nutrition-related factor Few other non-nutrition-related factors were listed by the respondents (Table 95)
bull Seasonality of cottonseed meal availability The results for the poultry respondents regarding the months of the year when CSM is not available are highly consistent with those for the combined responses and those for the beef and dairy cattle responses Poultry respondents indicated that May through September are the months of least availability of CSM (Table 96) But likely because of the shorter production cycle for poultry than for cattle poultry respondents indicated that CSM needs to be available in almost every month (but slightly less so in August and September) for CSM to compete effectively with alternative protein feeds (Table 97) For poultry therefore the indication is that poultry feed formulators may perceive an availability problem which inhibits greater use of CSM in poultry rations to some extent
bull Reasons for the selection and non-selection of cottonseed meal Again price and availability are the number one and number two reasons respectively cited by poultry respondents for which CSM is selected as a feed ingredient (Table 98) Protein quality ranked third on their list followed closely by phosphorous content The top reason that CSM is not selected according to the poultry respondents was pricevalue (Table 99) About tied for second place were gossypol content and availability More respondents ranked availability as the second reason than for gossypol content but more respondents listed gossypol first The amino acid level was listed as a distant fourth reason for which CSM is not selected as a feed ingredient Price is again the key CSM characteristic that poultry respondents indicated must change in
16
order for CSM to be used more frequently in poultry rations (Table 100) Gossypol was clearly considered to be the second most important characteristic that must change Availability was ranked as either first or second by all respondents who listed it as a characteristic that must change
bull Source of chemical analyses for cottonseed meal The results for the chemical analyses performed by poultry respondents are similar to those of both the combined results and those of the beef and dairy cattle results The primary analysis routinely performed by the poultry respondents is crude protein (51 of 55 respondents) followed by fat (40 respondents) fiber (37 respondents) and aflatoxin (31 respondents) (Tables 101 and 102) The primary analytical values supplied to the poultry respondents also included crude protein fiber and fat (Table 103) A third of the poultry respondents indicated that their CSM supplier does not provide them with any analytical values Once again even though aflatoxin was ranked as an extremely important nutrition-related factor in the choice of CSM as a feed component only I respondent obtains an analytical value for aflatoxin from his CSM supplier and only a little over half routinely perform their own aflatoxin analyses
Poultry sample members were asked some specific questions regarding the use of CSM in poultry feed formulations in 5 general areas I) problems resulting from feeding a ration with CSM to the various poultry types 2) specific information on several key nutrition-related factors affecting the use of CSM in poultry rations 3) sources of information utilized on formulating poultry feeds 4) CSM price and value and 5) an open-ended question soliciting suggestions to improve the usefulness or value of CSM for poultry feed formulations
Problems from Feeding CSM Rations to Poultry
The majority of poultry respondents indicated no knowledge of any problems associated with feeding a ration containing CSM to poultry (Table 104) Only 14 of the respondents indicated problems with broilers less than 7 for breeding flocks and about 3 for turkeys Over a third however indicated that they had knowledge of such problems with layers The number one problem reported was yolk molting and discoloration primarily in layer rations (Table 105) A few respondents indicated problems with depressed growth associated with broiler feeds containing CSM
Information on Key Nutrition-Related Factors for Poultry Rations
The survey sample members were asked to respond to a number of specific questions related to nutritional factors that affect the use of CSM in poultry rations including protein energy fat gossypol and synthetic amino acids They were then asked to indicate their perception of the overall feeding value of a standard 41 protein CSM compared to that of a standard 44 protein soybean meal The questions were designed primarily to determine the extent of knowledge among feed formulators concerning these factors as they relate to the use of CSM and the relative feeding value of CSM
Sample members were asked to respond to two questions regarding protein in poultry feed rations They were first asked to indicate the specific protein-related factors that they consider when balancing rations for poultry They were given a list of three factors (crude protein level amino acid content and amino acid availability) They were also allowed to specify any other protein-related factors they consider when balancing poultry rations They were then asked to indicate the crude protein levels they would prefer for cottonseed meal and were given a choice of four levels (3641 (standard) 44 and 48) and allowed to suggest any other preference for crude protein level
17
Almost all poultry respondents indicated that they consider amino acid content and availability when balancing feed rations with fewer responding that they consider the crude protein level (Table 106) Other protein-related factors listed by the respondents included amino acid balance protein digestibility and energy levels (Table 107) With regard to preferred crude protein level for CSM over half of the poultry respondents indicated a preference for 48 crude protein (Table 108) About 27 of the respondents were satisfied with the standard 41 level and 20 indicated a preference for a 44 protein CSM No respondents preferred anything less than the standard 41
With respect to energy levels the sample members were asked to indicate what they considered to be the normal maximum and minimum energy levels for protein feeds for broilers layers turkeys and breeding flock As Table 109 indicates the responses varied widely with little or no indication of a mode (most frequent response) in most cases For broilers the maximum (in K Cals DE per pound) ranged from 0 to 1800 and the minimum from 850 to 1700 with a mean maximum of 1436 and a mean minimum of 1276 For layers the maximum (in K Cals DE per pound) ranged from 1000 to 1800 and the minimum from 800 to 1500 with a mean maximum of 1347 and a mean minimum of 1187 For turkeys the maximum (in K Cals DE per pound) ranged from 1100 to 1725 and the minimum from 850 to 1700 with a mean maximum of 1334 and a mean minimum of 1261 For breeding flocks the maximum (in K Cals DE per pound) ranged from 1000 to 1600 and the minimum from 750 to 1600 with a mean maximum of 1328 and a mean minimum of 1159 Given the disparity in the responses it seems clear that there is little common concept of the normal maximum and minimum energy levels for protein feeds
Sample members similarly were asked to indicate the minimum and maximum fat levels they considered critical for protein feeds Although the range of responses was still quite wide there appeared to be more uniformity in responses to this question than the one for energy (Table 110) The maximum fat levels (ether extract as fed basis) indicated by the respondents ranged from 1 to 15 or 20 for most poultry types The minimums ranged from 0 to 15 The mean minimum levels of fat for all poultry types was about 3 The mean maximum ranged from 6 to 82 depending on the poultry type
Sample members were asked to indicate the level of gossypol they considered safe for poultry rations The responses again varied widely from a low of 0 ppm up to a high of 300 ppm for all poultry types (Table III) The highest mean level of gossypol as calculated from the responses to the question were 104 ppm for broilers and 91 ppm for turkeys For layers and breeding flocks the mean levels were much lower at 57 ppm and 54 ppm respectively
The questionnaire also asked the sample members to indicate if they use or would use synthetic amino acids where economical The response was that nearly 100 of all poultry respondents indicated that they have or would use synthetic amino acids in this situation (Table 112) This suggests little real aversion on the part of feed formulators to utilize synthetic amino acids in least cost poultry formulations
To obtain some insight on the general perception of poultry formulators regarding CSM the sample members were asked to indicate the overall feeding value of a standard 41 protein CSM compared to that of a standard 44 protein soybean meal in their opinion on percentage basis They were given the choice of 5 ranges from under 70 to over 100 in 10 increments (see Table 113 for the actual ranges used) Nearly 80 of the respondents indicated that CSM has an overall feeding value of under 90 of that of soybean meal Given the five choices offered to respondents the mean feeding value was around 80
18
Sources of Information Utilized on Formulating Poultry Feeds
About two-thirds of the poultry respondents indicated that they were familiar with research on feeding CSM to broilers and layers (Table 114) Only half however indicated familiarity with such research for turkeys and only a little over a third for breeding flocks Less than 10 of the respondents listed any other research on feeding CSM to other types of poultry (Table 115) To obtain information on formulating feeds for poultry the largest number of respondents (52 of the 55 respondents) indicated that they utilize university research followed by industry publications of some type (45 respondents) university extension services (26 respondents) and government agencies (20 respondents) (Table 116) Only 17 respondents listed other sources of information including primarily personal experience and research (Table 117)
Cottonseed Meal Price and Value
To get some idea concerning the poultry respondents perceptions of the value of CSM particularly with respect to soybean meal sample members were asked 1) if they would be willing to pay a premium per unit of protein for CSM with more than a standard 41 protein and 2) if gossypol and fiber were sufficiently low on average what percent of the cost of soybean meal they would be willing to pay for CSM
With respect to the first question only about half the respondents indicated a willingness to pay a premium for a CSM with more than 41 protein despite the fact that 75 of them indicated earlier that they would prefer a CSM with a higher crude protein level (Table 118) Thus at least 25 of the respondents prefer a higher protein level CSM but would not be willing to pay a premium to get it
In response to the second question poultry respondents indicated that they would only be willing to pay an average of about 76 of the cost of soybean meal for a CSM with a sufficiently low level of gossypol and fiber (Table 119) The range around that average however was fairly large from 50 to 95 Because CSM has traded at about 91 of the value of soybean meal on the market on a protein equivalent basis and about 85 on an unadjusted basis on average in each year since 1984 either poultry respondents are currently unaware of the historical CSM to soybean meal price relationship or they are indicating that the current CSM market price relative to that of soybean meal is substantially above the levels that most find acceptable
Suggestions for Improving the Usefulness of Cottonseed Meal
Only about 27 of the poultry feed formulators that returned surveys provided suggestions that might improve the value or usefulness of CSM in poultry feed rations (Table 120) Some of the more frequent suggestions included the need for more information on the use of CSM in poultry rations increased availability of CSM and nutrient guarantees
Catfish
The perceptions of catfish feed formulator respondents concerning the use of cottonseed meal correspond closely to those of the poultry respondents likely because of the similar dietary needs of non-ruminant animals The salient differences in responses by catfish feed formulators in the 6 general question areas included on this section of the surveys include the following
bull Factors affecting choice of dietary proteins There were no differences in the responses of those indicating that they formulate feed for catfish than for poultry regarding the importance
19
of the listed factors (quality price availability consistency and other) affecting the choice of dietary protein (Table 121) A large majority of catfish respondents ranked all factors as either important or extremely important as did poultry respondents
bull Cottonseed meal as an alternative protein feed As was the case for poultry catfish respondents ranked more protein feeds as higher on the superior-to-CSM scale than was the case for the combined responses (Table 122) Catfish feeders however ranked meat and bone meal and blood meal as even more superior to CSM than did poultry respondents The protein feeds that catfish respondents ranked as roughly similar to CSM included tankage feather meal peanut meal linseed meal corn gluten meal brewers dried grains distillers dried grains sunflower meal safflower meal and canola meal Catfish respondents also appeared to have nearly as strong views about whether or not CSM is an alternative to the other listed protein feeds as did poultry respondents They perceived that CSM is not an alternative to many of the other protein feeds including blood meal dried whole milk meat and bone meal and dried skim milk Catfish respondents also perceived however that CSM is a definite alternative to many other protein feeds including safflower meal canola meal peanut meal sunflower meal linseed meal distillers dried grains brewers dried grains tankage soybean meal wheat middlings corn gluten meal urea and feather meal
bull The importance of nutritional and non-nutritional factors The responses for catfish with regard to the importance of nutrition-related and non-nutrition-related factors in choosing CSM as a component of catfish feeds were roughly similar to those for poultry (Table 123) The salient differences were that a larger percentage of catfish respondents ranked energy level fat level and fiber level as important or extremely important and a much larger percentage ranked aflatoxin as extremely important One major difference of the catfish responses regarding the importance of non-nutrition-related factors from those of poultry is that palatability is much mOre of a concern to catfish feeders (Table 124) Bin space is less important to catfish respondents and service from the CSM industry is more important to them
bull Seasonality of cottonseed meal availability The results for the catfish respondents regarding the months of the year when CSM is not available were generally consistent with those for poultry except that May and June were perceived as less problematic for obtaining CSM supplies by the catfish respondents (Table 125) Catfish formulators perceive that CSM needs to be more available in April through October than during the rest of the year to be competitive with other protein feeds (Table 126) This suggests the perception on the part of catfish feed formulators of a CSM availability problem during about the first half of any given year
bull Reasons for the selection and non-selection of cottonseed meal Pricevalue is the number one reason cited by catfish respondents for which CSM is selected as a feed ingredient followed by protein quality and palatability (Table 127) The top reason that CSM is not selected according to the catfish respondents is pricevalue followed by quality and gossypol level (Table 128) Gossypol level is the key CSM characteristic that catfish respondents indicated must change in order for CSM to be used more frequently in catfish rations (Table 129) Quality was clearly considered to be the second most important characteristic that must change followed by aflatoxin level This is the only animal species for which price was not the number one characteristic cited that would have to change and was not even listed among the top three responses The implication is that catfish feed formulators may not consider the price of cottonseed meal to be out of line with their needs and thus do not consider price to be a particular problem for the use of CSM in catfish rations A word of caution is in order
20
to avoid taking this conclusion too far because of the relatively few number of catfish feed formulators in the sample
bull Source of chemical analyses for cottonseed meal The results for the chemical analyses performed by poultry respondents are similar to those of poultry as well as those of both the combined results and the beef and dairy cattle results The primary analysis routinely performed by the catfish respondents is crude protein followed by fat fiber aflatoxin and gossypol (Tables 130 and 131) The primary analytical values supplied to the catfish respondents also included crude protein fiber and fat (Table 132) Only 2 of the II catfish respondents indicated that their CSM supplier does not provide them with any analytical values Even though gossypol was ranked as an extremely important nutrition-related factor in the choice of CSM as a feed component and the number one CSM characteristic that needs to change only 5 of the II respondents routinely perform gossypol analyses None of catfish respondents obtain analytical values for aflatoxin from their CSM supplier
As for poultry catfish sample members were asked some specific Questions regarding the use of CSM in catfish feed formulations in 5 general areas 1) problems resulting from feeding a ration with CSM to the various catfish types 2) specific information on several key nutrition-related factors affecting the use of CSM in catfish rations 3) sources of information utilized on formulating catfish feeds 4) CSM price and value and 5) an open-ended Question soliciting suggestions to improve the usefulness or value of CSM for catfish feed formulations
Problems from Feeding CSM Rations to Catfish
Absolutely no catfish respondents indicated any knowledge of any problems associated with feeding a ration containing CSM to catfish (Table 133)
Information on Key Nutrition-Related Factors for Catfish Rations
As for poultry the survey sample members were asked to respond to a number of specific Questions related to nutritional factors that affect the use of CSM in catfish rations including protein energy fat gossypol and synthetic amino acids They were then asked to indicate their perception of the overall feeding value of a standard 41 protein CSM compared to that of a standard 44 protein soybean meal Just as for poultry these Questions were designed primarily to determine the extent of knowledge among catfish feed formulators concerning these factors as they relate to the use of CSM and the relative feeding value of CSM
Sample members were asked to respond to two Questions regarding protein in catfish feed rations They were first asked to indicate the specific protein-related factors that they consider when balancing rations for catfish They were given the same list of three factors (crude protein level amino acid content and amino acid availability) to choose from that the poultry sample members were given Again they were also allowed to specify any other protein-related factors they consider when balancing catfish rations They were then asked to indicate the crude protein levels they would prefer for CSM and were given the same choice of four levels as the poultry sample members (36 41 (standard) 44 and 48) and allowed to suggest any other preference for crude protein level In contrast to poultry the largest percentage of catfish respondents indicated that they consider amino acid availability (10 of the 11 catfish respondents) rather than the content when balancing catfish rations (Table 134) The second largest percentage consider crude protein level (9 respondents) also a different result from poultry
21
With regard to the crude protein level for CSM preferred by catfish respondents about 43 indicated a preference for 48 crude protein (Table 135) About 20 of the respondents were satisfied with the standard 41 level and nearly 30 indicated a preference for a 44 protein CSM No respondents preferred anything less than the standard 41 The mean preferred crude protein level was about 42
With respect to energy levels the catfish sample members were asked to indicate what they considered to be the normal maximum and minimum energy levels for protein feeds for fingerlings grow out stock brood stock and fries Despite the low number of catfish respondents the answers to this question were widely divergent (Table 136) For fingerlings the maximum (in K Cals DE per pound) ranged from 1250 to 1800 and the minimum from 2 to 1500 with a mean maximum of 1525 and a mean minimum of 834 For grow out stock the maximum (in K Cals DE per pound) ranged from only 1500 to 1600 and the minimum from 1 to 1300 with a mean maximum of 1550 and a mean minimum of 750 For catfish brood stock the maximum (in K Cals DE per pound) ranged from 1300 to 1700 and the minimum from 1200 to 1400 with a mean maximum of 1500 and a mean minimum of 1300 For fries the maximum (in K Cals DE per pound) ranged from 1250 to 1800 and the minimum from 900 to 1500 with a mean maximum of 1525 and a mean minimum of 1200 Given the disparity in these responses it seems clear again for catfish feed formulators that there is little common concept of the normal maximum and minimum energy levels for protein feeds
Catfish sample members similarly were asked to indicate the minimum and maximum fat levels they considered critical for protein feeds As with poultry the range of responses was still quite wide but there also appeared to be more uniformity in responses to this question than the one for energy level (Table 137) The maximum fat levels (ether extract as fed basis) indicated by the respondents again ranged from 1 to 15 for most catfish types as was the case for poultry The mean minimum levels of fat for all catfish types ranged from about 3 to 5 The mean maximum ranged from 6 to 10 aCrOSS the different catfish types
Catfish sample members were also asked to indicate the level of gossypol they considered safe for catfish rations The responses again varied widely from a low of 0 ppm up to a high of 300 ppm for some catfish types (Table 138) The two highest mean safe levels of gossypol were 97 ppm for grow out stock and 83 ppm for brood stock For fingerlings and fries the safe maximum mean levels were much lower at 44 ppm and 23 ppm respectively
The questionnaire also asked the sample members to indicate if they use or would use synthetic amino acids where economical The response was that 83 (all but 2) of the catfish respondents indicated that they have or would use synthetic amino acids in this situation (Table 139) This suggests little real aversion on the part of feed formulators to utilize synthetic amino acids in least cost catfish formulations
To obtain some insight on the general perception of catfish formulators regarding CSM the sample members were asked to indicate their opinion of the overall feeding value of a standard 41 protein CSM compared to that of a standard 44 protein soybean meal expressed on a percentage basis They were given a choice of 5 ranges from under 70 of the feeding value of soybean meal to over 100 in 10 increments (see Table 140 for the actual ranges used) All but one of the catfish respondents indicated that CSM has an overall feeding value of under 90 of that of soybean meal Given the five choices offered to respondents the mean feeding value of CSM relative to that of soybean meal was around 80
22
Sources of Information UtiJized on Formulating Catfish Feeds
Only about half of the catfish respondents indicated that they were familiar with research on feeding CSM to grow out stock and only a third were familiar with research on fingerlings (Table 141) Only 2 respondents were familiar with any research on feeding CSM to brood stock and fries To obtain information on formulating feeds for catfish the largest number of respondents indicated that they utilize university research and industry publications of some type (Table 142)
Cottonseed Meal Price and Value
Catfish sample members were also asked two Questions to get some idea concerning their perception of the value of CSM particularly with respect to soybean meal 1) if they would be willing to pay a premium per unit of protein for CSM with more than a standard 41 protein and 2) if gossypol and fiber were sufficiently low on average what percent of the cost of soybean meal would they be willing to pay for CSM
With respect to the first Question 75 of the catfish respondents indicated a willingness to pay a premium for a CSM with more than 41 protein which is consistent with their earlier responses that they would prefer a CSM with a higher crude protein level (Table 143)
In response to the second Question catfish respondents indicated that they would only be willing to pay an average of about 82 of the cost of soybean meal for a CSM with a sufficiently low level of gossypol and fiber (Table 144) The range around that average was more narrow than for poultry from 70 to 100 This is more consistent with the ratio of CSM price to soybean meal price that has existed over the last 7 or 8 years on average
Suggestions for Improving the Usefulness of Cottonseed Meal
Only three catfish respondents offered suggestions for improving the usefulness or value of CSM for catfish rations The three suggestions included I) providing a more consistent product in price and Quality 2) providing a premium Quality toxin-free high protein low-fat product superior to soybean meal and 3) eliminating the CHO fraction (Table 145)
Comparisons Among Animal Species
In order to highlight the salient differences in responses with respect to the various animal species the mean responses to Questions that are common among all surveys regarding CSM use as a feed ingredient were compared and analyzed An analysis of variance (ANOY A) was also done to detect statistically significant differences in the mean responses to each Question by animal specie Comparisons are made among the mean responses to all Questions in the 6 general areas to which all sample members were asked to respond regardless of the animal specie(s) for which they formulate feeds 1) the particular factors affecting their choice of dietary proteins for formulated feeds 2) the extent to which CSM is considered to be an alternative to selected protein feeds 3) the importance of nutritional and non-nutritional factors in their decisions to use CSM rather than alternative dietary proteins in their feed formulations 4) the seasonality of CSM availability 5) the specific reasons for the selection and non-selection of CSM for use in the feeds they formulate and 6) the source of CSM chemical analyses used by the respondents Where appropriate ANOY A results are also indicated
23
Factors Affecting Choice of Dietary Proteins
As discussed earlier all members of the final sample regardless of the animal species for which they formulate feeds were asked to rank the importance of four general factors in their choice of a dietary protein for their feed formulations on a scale of I to 7 (from extremely unimportant to extremely important respectively) 1) quality 2) price 3) availability and 4) consistency Comparing the results across animal types reveals few significant differences in the importance attached to any of the four factors by the responding formulators of the various animal specie feeds (ie comparing results horizontally in Table 146) But as pointed out in an earlier section the mean rankings for quality are all higher than those for the other factors while the mean rankings of price are all lower than those for most other factors across all animal types In other words the respondents consistently ranked quality highest on the scale of importance followed in order by consistency availability and price
Cottonseed Meal As An Alternative Protein Feed
Recall that the sample members were asked to rank various selected protein feeds on a scale of 1 to 7 as inferior or superior to CSM in an overall sense for use in feed formulations A second question required respondents to indicate whether or not they considered CSM to be an alternative to each of the 20 listed protein feeds A comparison of the mean ran kings and ANOV A results across animal types indicates substantial agreement among the respondents regarding the ranking of CSM as an alternative to some animal feeds and substantial disagreement with respect to CSM as an alternative to many others (Table 147) Respondents over all animal types tended to agree that certain feeds and in particular the higher crude-protein-content feeds are clearly superior to CSM including dried skim milk meat and bone meal fish meal blood meal soybean meal dried whole milk and corn gluten feed There was a statistically different deviation in the extent to which respondents for some animal species regarded those meals as superior however For example catfish respondents ranked meat and bone meal fish meal poultry by-products blood meal soybean meal and corn gluten meal higher than did respondents for the ruminant animals The same was roughly the case for poultry Beef and dairy cattle respondents tended to rank all other protein feeds as less superior (ie more inferior) to CSM There was also substantial agreement that CSM was about the same as tankage peanut meal linseed meal and brewers and distillers dried grains but superior to some extent over the other feeds particularly those lower in crude protein including dehydrated alfalfa sunflower meal wheat middlings safflower meal canola meal feather meal and urea Beef and dairy cattle respondents agreed that CSM can be considered an alternative to nearly all the protein feeds except perhaps skim and whole dried milk Poultry and catfish respondents indicated CSM is an alternative to fewer of the other protein feeds
The Importance of Nutritional and Non-Nutritional Factors
Respondents also ranked the importance of specific nutrition-related and non-nutritionshyrelated factors in choosing cottonseed meal as a component of the feeds they formulate on a scale of extremely unimportant to extremely important (a scale of I to 7 respectively) Comparing the mean rankings by the respondents reveals that poultry and catfish feed formulators clearly consider proteinshyrelated factors and gossypol level to be more important than do beef and dairy feed formulators (Table 148) Fiber level is also of more importance to formulators of catfish feed Interestingly the importance of fiber was not ranked significantly higher by poultry feed formulators than by beef and dairy cattle feed formulators At the same time aflatoxin was clearly ranked by all respondents as the most important factor affecting the choice of CSM as a feed ingredient irrespective of the animal specie for which the ration is intended
24
For the non-nutritional factors an analysis of the mean rankings indicates few significant differences in the responses across animal species with respect to each individual factor listed (Table 149) The most notable exception is that poultry respondents ranked palatability significantly less important than did any of the other respondents for the other animal species Finally catfish respondents perceived that service by the CSM industry was more important for them than did the respondents for the other animal species
Seasonality of Cottonseed Meal Availability
The respondents across all animal species indicated that CSM is least available between about May and October likely reflecting the increasing shortages of cottonseed meal supply just prior to the cotton harvest in the fall (Figure 20) At the same time however the beef cattle dairy cattle and poultry respondents all indicated that there is less need for CSM to be available during approximately those same months in order to compete effectively with other protein feeds (Figure 21) This suggest that the seasonality of supply may not represent an important constraint to competitiveness and growth possibilities of CSM as a feed ingredient Interestingly catfish respondents suggested a largely inverse pattern of the times of the year when CSM needs to be available to compete effectively with other protein feeds as a catfish feed ingredient Possible explanations of this phenomenon include I) the protein feed needs of catfish feed formulators peak in the late spring and summer months when supply is less available 2) catfish feed formulators are located such that CSM is not easily obtainable particularly during short supply years or 3) formulators of feed for other animal species have longer experience in using CSM and have adjusted their formulation to the pattern of CSM supply availability In any case it should be remembered that there are relatively few catfish feed formulators in the sample so that their joint responses may not be truly representative of all catfish feed formulators In this case this difference in their responses may mean little
Reasons for the Selection and Non-Selection of Cottonseed Meal
Respondents across animal species were quite consistent in their ranking of the top reasons that CSM is included in feed formulations (Table 150) They overwhelmingly ranked price as the top reason followed generally by availability and protein quality Catfish respondents differed somewhat from that order ranking protein quality second and palatability as third Availability was ranked fourth by catfish respondents The top reason all respondents listed for which CSM is not included in feed formulations was also price (Table lSI) Beef and cattle respondents ranked availability as second but poultry respondents ranked gossypol second while catfish respondents ranked protein quality second A vailability ranked only as the third reason that CSM is not selected by poultry respondents and fourth by catfish respondents Gossypol ranked either third or fourth for all animal species except poultry for which gossypol appears to be a more important reason for not including CSM in poultry feed formulations The question regarding the characteristics of CSM that would have to change in order for it to be selected more frequently as a feed ingredient elicited about the same responses as those for the previous question concerning why CSM is not included in feed formulations (Table 152) The top characteristic that would have to change in the opinion of most respondents is price Catfish respondents however listed price extremely low on their list suggesting that other factors are more of a constraint to CSM use in their opinion They ranked gossypol as the number one characteristic that would have to change Availability appeared to be more of a concern to beef and dairy feed formulators than for poultry and catfish formulators
25
Source of Chemical Analyses for Cottonseed Meal
About the same percentage of respondents across animal species perform analytical tests for aflatoxin crude protein fat fiber and gossypol (Figure 22) The only noticeable differences were for aflatoxin and gossypol for which about half the percentage of dairy and beef respondents compared to catfish respondents reported that they routinely perform tests A higher percentage of poultry respondents also appear to perform tests for aflatoxin and gossypol than is the case for beef or cattle respondents Crude protein is tested for by the highest percentage of respondents for all animal species while gossypol is tested for by the smallest percentage of all respondent groups except catfish CSM suppliers are more likely to provide feed formulators with analytical values for crude protein fat and fiber than for aflatoxin or gossypol (Figure 23) A sizeable percentage of the respondents across all animal types reported that their CSM supplier provides no analytical values whatsoever
Summary ofMajor Findings
Of the reams of information normally provided by a study like this relatively little is usually new or profound And of what can be found that appears important only some is little more than interesting or particularly useful Before turning to a discussion of the implications of the study results the major findings across animal groups are briefly summarized first Sifting through the many tables figures and data sets the main findings of the study appear to be the following
bull Quality is the most important factor affecting the choice of dietary proteins by feed formulators followed by consistency and availability Price is the least important of the four factors in making general decisions regarding dietary proteins for animal diets
bull Once feed formulators have set the general parameters for use of dietary proteins in their formulations however price is the most important factor determining the choice among alternative dietary proteins to satisfy the general parameters for dietary protein use in feed formulations
bull When considering whether or not to use CSM as the dietary protein in feeds the nutritional factors of most concern to formulators of feed for non-ruminant animals (poultry and catfish) appear to be protein-related For formulators of ruminant (beef and dairy cattle) feeds aflatoxin level and rumen degradability are the most important nutritional factors
bull The most important non-nutritional factors affecting feed formulators decisions regarding whether or not to use CSM are I) price 2) availability 3) consistent quality and 4) palatability in that order
bull Non-nutritional factors are more important than nutritional factors in the choice of CSM over alternative feeds to fill the dietary protein requirements of feed formulations In general price and availability were ranked above protein quality and other nutrition-related factors as reasons why CSM is and is not chosen as a feed ingredient over alternatives Price and availability were also cited as the characteristics that most need to change in order for CSM to be selected as a feed ingredient more frequently
bull CSM is generally considered to be inferior to higher protein feedstuffs and superior to lower protein feedstuffs This generalization however does not hold for all feeds and all animal types Formulators of ruminant animal feeds ranked many of the higher protein feeds more on a par with CSM than did formulators of non-ruminant animal feeds
26
bull The seasonality of CSM availability is both a positive and a negative factor affecting the use of CSM rather than alternative protein feeds in animal feed rations That is CSM is obviously more likely to be selected as a feed ingredient during months of greater availability than during the months of lower availability In general however the survey responses indicate that CSM is normally available when feed formulators perceive that it needs to be available One word of caution It may be that a higher percentage of CSM users agreed to participate in this survey than those who are currently not using CSM Those who are current CSM users may well have already adjusted their feed purchasing patterns and operations to reflect the seasonal changes in the availability of CSM Consequently current CSM users may perceive less of an availability problem than those who are not currently using CSM In this case the responses to these questions may not be truly representative of the perception of the availability of CSM by feed formulators in general
bull There is a tremendous disparity in the perception of respondents as to the appropriate levels of several key nutrition-related factors for specific livestock rations including energy levels fat levels gossypol levels and escape values (ruminants only) for cottonseed meal For each animal specie the range of variation in the perceived acceptable levels of each of these factors was extremely wide The obvious conclusion is that feed formulators generally lack adequate and reliable information on many factors which are crucial in efficient feed formulation and which have a significant impact on the choice of CSM as a feed ingredient
PROBLEMS AND OPPORTUNITIES FOR EXPANDING COTTONSEED MEAL USE
CSM is somewhat unique among vegetable protein meals in that it is the product of a byshyproduct The volume of the by-product cottonseed available for crushing and the potential supply of CSM depend more on the dynamics of cotton supply and demand than on forces specific to CSM markets This mean that market signals from feed formulators and livestock feeders regarding desired values and characteristics of protein meals likely have little impact on the potential CSM market supply
Since the mid-1970s the share of the annual production of cottonseed fed directly to ruminant livestock has increased steadily from about 5 in 1974 to nearly 40 in 1990 (Figure 24) The consequence has been a marked decline both in the share of the available supply of cottonseed that is crushed and in the ratio of actual to potential cottonseed meal output An increase in the demand for CSM therefore will either bid up the market price of CSM with no additional volume actually used or increase the cottonseed crush to feed use ratio (or some combination thereof) There will be little or no effect on the total amount of cottonseed available
The intent of efforts to expand the market for any commodity is to effect an increase in sales at a higher price For a commodity with a relatively fixed supply the major result of an expansion in demand is solely an increase in price because supply cannot increase to allow an increase in use For a commodity with an unlimited supply successful market expansion efforts simply increase use to the extent of the promotion with no increase in price For a commodity with a supply somewhere in between those two extremes successful market expansion will increase both the price and quantity used Although the situation for cottonseed meal is closer to the fixed supply end of the spectrum market expansion efforts can increase the use of cottonseed meal through an increase in the crush-toshy
27
feed cottonseed use ratio This ratio will increase as the profitability of crushing vs alternative uses of the seed increase
The results of this survey however indicate both some problems and possible opportunities for expanding cottonseed meal use After briefly summarizing the major obstacles as identified in the study the major opportunities for expanding use of cottonseed meal will be discussed
Problems for Expanding Cottonseed Meal Use
The major problems for expanding CSM use are generally well known and verified by the survey results The major problems that would hinder efforts to expand cottonseed meal use identified in the study included primarily the following
bull Price and availability of CSM are the major factors affecting the selection or non-selection of CSM as an ingredient of feed formulations regardless of animal specie These nonshynutritional factors were judged to be more important than nutritional factors in selecting CSM as a feed ingredient Unfortunately neither the price nor the availability of CSM can be controlled or altered substantially or directly by market expansion efforts Some efforts to improve availability may be possible as discussed in the next section
bull CSM is perceived to be inferior in an overall sense to a number of key protein feeds CSM was judged by the survey respondents to be clearly superior in aggregate to only 5 of 20 potential alternate protein feeds Such an image could work against efforts to expand CSM use
bull Gossypol level is one of the top reasons that CSM is not used more frequently particularly in non-ruminant feed rations The level of gossypol is a unique characteristic of CSM that obviously cannot be changed through market expansion activities
bull Several other specific characteristics of CSM would likely need to change for CSM to be selected more frequently as a feed ingredient including amino acid balance energy level aflatoxin level and protein quality As with gossypol changes in these characteristics are out of the realm of market expansion programs
bull Feed formulators generally lack adequate and reliable information on many factors which are crucial in efficient feed formulation and which likely have a significant impact on the choice of protein feedstuffs The use of CSM in livestock feed rations is likely restricted by the wide disparity in the perception of feed formulators regarding the appropriate levels of several key nutrition-related factors for specific livestock rations including energy levels fat levels gossypol levels and escape values (ruminants only) for cottonseed meal
bull Over 75 of dairy cattle feed formulators and nearly half of beef cattle feed formulators utilize whole fuzzy cottonseed to some extent in some of the feed rations they formulate Relatively few reported using utilizing both CSM and whole cottonseed in the same ration A main attraction of the use of whole fuzzy cottonseed as opposed to cottonseed meal is the fiber content Indeed the use of whole delinted cottonseed in cattle feed rations is much lower
28
Opportunities for Expanding Use of Cottonseed Meal
There are essentially only two basic tools to expand the market for any commodity l market development and 2) enhancing the efficiency of the marketing system Market development involves a wide range of activities including primarily new product development and product differentiation In new product development the effort is to develop new products or characteristics of products that appeal to different segments of consumers An example might be research leading to the elimination of gossypol in cottonseed meal which could further open up the non-ruminant feed industry to cottonseed meal
Product differentiation on the other hand encompasses those activities designed to create a user preference for or loyalty to a commodity Product differentiation occurs in two major forms 1) advertising and 2) variation in design and quality of product The primary purpose of advertising is to create user preference for a commodity and convince users of the superiority of a product over competing products Actual physical differences in the product are not necessary to successfully differentiate it from competing products It is sufficient only that users believe that some superiority exists Advertising often intends to create an image of superior quality because such images are harder to imitate or successfully counter than physically unique features Successful differentiation of a product means that users become less sensitive to price changes more willing to pay a higher price for the same quantity because they prefer the product and are loyal to it in the face of price increases In other words users are willing to pay more for the same amount because advertising if successful creates a preference for the product over competing products
Variations in quality and design are usually used along with advertising to differentiate the product of one seller from that of another Such variations are often necessary to help create the superior images desired andor attract new sets of consumers
Often barriers exist in a marketing system that hinder the efficient functioning of the market and restrict the flow of commodities from sellers to users Enhancing the efficiency of the marketing system through eliminating such barriers can lead to an expansion in the use of a commodity One of the primary requirements of an efficiently functioning market is that sellers and users possess adequate and accurate information regarding the product its characteristics availability sources uses and value among other things Inadequate or inaccurate information regarding a particular product and other market characteristics can divert demand to alternative products with which users may be more familiar regardless of whether or not those products are better in some sense
The concept and importance of enhancing market efficiency in this regard can be illustrated by comparing the flow of information about a product and market conditions with a radio broadcasting system The efficiency of such a system depends on how accurately the microphone and other equipment record sound how accurately and rapidly that sound is transmitted to a radio receiver and how accurately the receiver brings sound to the listener A breakdown anywhere along the line in that system will simply mean that the message of the broadcast does not get from the radio station to the listener Also if the message gets through but static interferes with the transmission the listener might only receive part of the message or a garbled message The listeners impressions and actions consequently might be quite different than if he had received the message intended In quite the same manner the flow of a commodity from producers to users is affected by how rapidly and accurately market information is evaluated and how accurately and rapidly this information is transmitted to and among producers and users Any breakdown or static in the system would result in a smaller and more obstructed flow of the commodity to users than if the market operated more efficiently
29
The survey results suggests possible opportunities for expanding CSM use through market development and enhancing market efficiency Market development opportunities may be limited because of the nature of the CSM supply situation Nevertheless expansion of CSM use is possible through a reduction in direct feeding of cottonseed so that opportunities for expanding use through market expansion efforts should not be discounted Efforts to enhance the adequacy and accuracy of information regarding the use of CSM as a feed ingredient however may well be the most effective means of promoting an expansion of use or enhancement of the value of CSM
Opportunities for Expansion through Market Development
Although many product development opportunities likely exist for CSM the survey basically focused on the image of CSM in the perception of feed formulators If a market development approach to expanding the use of CSM as an ingredient of animal feed formulations has any chance of success the survey results suggest that the following components of such a strategy will be crucial
bull Product quality and consistency and an improved image of availability must be the major targets of promotion efforts The survey responses across all animal types unequivocally indicated that these three factors are the prime considerations in making general decisions regarding dietary proteins for animal rations Price only becomes a factor in specific decisions regarding the particular protein feed to use to fill the dietary protein requirements of feed formulations after these general concerns are addressed Creating an image of quality consistency and availability for CSM is a necessary first step to expanding use and enhancing value
bull CSM use expansion efforts must focus to some extent on reducing the direct feeding of whole cottonseed to beef and dairy cattle Reductions in direct feeding is the only chance for an increase in supply of CSM to fuel expanded use in newer markets such as catfish and poultry feeding Also because beef and dairy cattle are major users of cottonseed meal a decrease in feeding of whole cottonseed in favor of CSM would significantly expand use
bull Separate CSM market promotion messages must be developed to address the very different needs and concerns of ruminant vs non-ruminant feed formulators The survey results clearly indicate that many nutritional and non-nutritional factors are more important for nonshyruminant feed formulators than for ruminant feed formulators and vice versa
bull The nutrition-related content of CSM market promotion messages must emphasize primarily positive aspects of CSM protein quality amino acid balance and amino acid availability as well as an accurate understanding of appropriate gossypol and aflatoxin levels Many of these factors however are more important for non-ruminant rather than ruminant feed formulators which must be accounted for in designing appropriate messages for feed formulators of each animal type
bull The non-nutrition-related content of CSM market promotion messages may well be the most important and must emphasize primarily the positive aspects of price availability consistency of quality and storability The survey results attached a relatively high level of importance also to nutrient guarantees Although not scoring particularly high in the responses services available from the CSM industry may also be a helpful component of CSM use promotion messages
30
Opportunities for Expansion through Market Emciency Enhancement
Even though some gains in CSM use and market value can reasonably be expected through market expansion efforts the cost involved could easily outweigh any benefits in terms of enhanced profits to the CSM industry Perhaps the most cost-effective appropriate and useful means of enhancing the use of CSM would be a strategy aimed at improving the level and accuracy of information available regarding CSM and its use Lack of information or misinformation can easily discourage feed formulators from using CSM in their feed formulations Strategies to enhance the quantity and accuracy of appropriate information can take on many forms from media advertising to market news letters Although it is beyond the scope of this study to develop alternative information strategies the results of this study clearly indicate a number of areas in which enhanced and more accurate information is a critical need These include the following
bull The overall quality of CSM The study suggests that the negative aspects of CSM are well known Less well known are the specific positive aspects of CSM that may give it an edge in some sense over other protein feeds
bull The ideal ratio of the price of CSM to other feeds like soybean meal The study results indicate that feed formulators may not be adequately informed about what the ideal market value of CSM is relative to soybean meal given the differences in feeding value As a consequence CSM may currently be less used in relation to soybean meal than current market price ratios suggest should be the case
bull Protein-related factors for CSM use in non-ruminant feeds These factors are a major concern in the decisions of feed formulators to include or exclude CSM in feed rations
bull The relationship of aflatoxin to CSM and the rumen degradability of CSM particularly for beef and dairy cattle feed formulators These were the nutritional factors of greatest concern to ruminant feed formulators in the decision to include CSM in their feed formulations
bull CSM price availability consistency and palatability These were indicated to be the most important non-nutritional factors affecting feed formulators decisions regarding whether or not to use CSM The study indicates that information on non-nutritional factors may be more important in the decision to use CSM over alternative feeds to fill dietary protein requirements of feed rations than information on nutritional factors
bull The feeding value of CSM relative to alternative protein feeds An accurate and detailed assessment of the extent to which CSM may be superior as an alternative to other standard protein feeds would help position CSM appropriately in the market
bull The appropriate and acceptable levels of several key parameters affecting the use of CSM in animal feed rations including energy levels fat levels gossypol levels and escape values (ruminants only) Feed formulators generally lack adequate and reliable information on these and likely other parameters not included in the study which are crucial in efficient feed formulation and which have a significant impact on the choice of protein feedstuffs Although it appears that nearly all feed formulators routinely perform crude protein analyses few perform analyses for aflatoxin gossypol fat fiber and other parameters Also CSM suppliers are apparently doing an inadequate job currently of providing such information to feed formulators
31
SOME CONCLUDING COMMENTS AND RECOMMENDATIONS
This study assessed the potential problems and opportunities for expanding the use of CSM through an analysis of the perceptions of feed formulators regarding the use of CSM as an animal feed ingredient The perceptions of feed formulators regarding CSM as a protein feed largely define the boundaries within which CSM use will be able to achieve any significant growth in the future Their perceptions right or wrong are the key to understanding not only the problems facing CSM use but also the opportunities
The general conclusion of the study is an obvious one the use of CSM in feed formulations faces some major challenges in the future Chief among these include a perception among feed formulators that price availability quality and other key CSM characteristics are often obstacles precluding increased use of CSM in their feed formulations Perhaps the most important implication of the study is that a serious lack of adequate and accurate information among feed formulators regarding the characteristics parameters value and other aspects of cottonseed meal use in animal feed rations may be seriously restricting the market opportunities for cottonseed meal U nfortunately the development of alternative strategies to expand the use of CSM and enhance the efficient functioning of CSM markets through more accurate and available information on all aspects of CSM use in feed formulations is beyond this study Nevertheless a few recommendations pertinent to the development of such alternative strategies are in order
bull Before adopting any approach to expand the use of CSM it would be useful first to conduct a detailed analysis of the costs and benefits involved Market promotion efforts through advertising can be extremely costly and yield relatively little Research has also shown that there is often a tremendous lag between advertising and promotion expenditures and any associated returns It could take years of investment in such market expansion efforts before an accurate measurement of the actual return on investment could even be attempted
bull Consider developing first a detailed plan for information dissemination to the feed industry regarding all appropriate aspects of CSM use in feed rations as determined in this study An important part of this process would be a comprehensive assessment of the information needs and the information resources readily available The gap discovered in this way between needs and resources will help set the research agenda for the industry to fill the critical existing information gaps
bull Initiate a study of final user attitudes and perceptions of CSM use as a guide to future market expansion efforts This study considered only the perceptions of feed formulators regarding the use of CSM But feed formulators are often not the final users Consulting nutritionists for example often include or exclude certain feeds and feed types from their formulations as requested by feed users At least a few of the respondents to the survey conducted for this study indicated that user preferences are major factors determining whether or not CSM is included in their feed formulations Indeed markets operate as the interaction of supply and demand to determine prices The preferences of final users ultimately will be expressed in the market values of any product in any market unless sufficient obstacles exist to prevent the market from functioning properly Therefore the real decision-makers in the use CSM in the market may well include many more individuals than adequately represented by feed formulators
32
REFERENCES
US Department of Agriculture (USDAa) Feed Situation and Outlook Report Economic Research Service FDS series various issues
US Department of Agriculture (USDA b) Oil Crops Situation and Outlook Yearbook Economic Research Service OCS Series various issues
Figure 1 Quantity of Oilseed Meals Fed to Livestock 194849 - 198590 (Average)
(1000 Tons)
25000 0-1-----------------------shy
20000 I-~
15000
10000
5000
o L 1 J tJ t tmiddotmiddotmiddot 1 oj 1 to bullbull 1 L_ n __LLL I 1 bullbull I V I
1948-49 1950-54 1955-59 1960-64 1965-69 1970-74 1975-79 1980-84 1985-90
(Years)
n iflu Soybean Meal bull Cottonseed Meal Other Oilseed Meals
Source USDA
c
8 c a CD
en ~
--I _ scg ~CD 01)-- en - () mg0 s 0
JCD enOJ CD_CD en 0
sCDCD 0 OJ shyo OJ r Jlt- 0 m CJ) 0 0lt o 0shyCD OJ J
~s ~m cpCJ) r co OJco ~m a
Figure 3 Price Premium (+) or Discount (-) of Cottonseed Meal Relative to Soybean Meal 1956-1990
~~ ~
o I ~ I I
-20 f---
-40
-60
1~1~1~1~1~1~1~1~1~1~1~1~1~1~1~1~1~1~
Cottonseed meal price is adjusted to a soybean meal protein equivalent basis
~I------------------------------------------------------
l l A
I~middotmiddot--- --------
Figure 4 Animal Species for which Respondents Formulate Feeds
DAIRY CATILE
BEEFCATILE
HORSES
SHEEP
BROILERS
LAYERS
OTHER
PETS
TURKEY
SWINE
CATFISH
210
21000
0 5 1000 15 20 25
Figure 5 Respondents Formulating Feeds for the Various Animal Species
0 20 40 60 80
Figure 6 Other Animal Species for Which Respondents Formulate Feeds
DAIRY CATTLE
BEEF CATTLE
HORSES
SHEEP
BROILERS
LAYERS
OTHER
PETS
TURKEY
SWINE
CATFISH
632
Exotics
Trout
Alligators
KOI
Breeding Hens
Wildlife
Rabbits
Avian
Shrimp
Salmon
Ducks
Fish
Gamebirds
Hybrid Bass
379
~--~----~--~----~----~--~----~--~----~--~
0 10 20 30 40 50
Figure 7 Respondent Feed Formulation Activities by State
( of Respondents)
o 00 middot15 16 -30 31 middot45Cgt 46 -60 61 - 75 - 76 -90
Table 8 Respondent Experience as an Animal Nutritionist
( of Respondents) 30 r---shy
25 t-middotmiddotmiddotmiddotmiddotmiddotmiddotmiddotmiddotmiddotmiddotmiddotmiddot-middot ---_ _
20 -_ -nNItshy
15
10
5
0 1-5 6-10 11-15 16-20 21-25 26-30 31-35 36-40 41-45
(Years Of Experience)
-it sa 0 m 8 l 0 CD l g
_ cc c -s CD CObull
-0 -s- 3 Dl ~ IJ CD (fJ
C 0 l C CD l -+
raquo Sl_ lt_ -+_ CD (fJ
Figure 10 Respondent Primary Feed Formulations
by Animal Type 1990 (Percent)
30 I--------------------------------------------------------shy
25 r- middotmiddotmiddotmiddotmiddotmiddot231middotmiddotmiddotmiddot
20
15
10
5
0 Beef Dairy Swine Poultry Horses Pets Aqua- Sheep Exotics
Cattle Cattle culture amp Goats
(Animal Type)
Figure 11 Percent of CSM and S8M Used in Formulations by Feed Manufacturer Respondents 1990
( of Average Feed Ration)
Figure 12 Tons of Feed Formulated by Feed Manufacturer Respondents 1990
65
91
6 9
17
Total Formulations Formulations With CSM
II Less than 200000 Tons
II 200000 - 400000 Tons bullbullbull I bullbullbullbullbullbull ~ 3 ~ 400000 - 600000 Tons
5 rn 600 000 - 800 000 Tonsru 1
[] 800000 - 1000000 Tons9 4
I ~ 1 More Than 1000000 Tons
Formulations With S8M
Figure 13 Percent middotof Beef Cattle Respondents Formulating CSM Feeds for Specific Beef Cattle Types
( of Respondents)
25 ~I------------------------------------------------------~
-Isectig Feedlot-II 223
20
15
10
5
0
bull Other
~ middotmiddotmiddotmiddotmiddotmiddotmiddot middotmiddot _middotmiddotmiddotmiddot-=middotmiddotmiddotccmiddotcmiddotmiddot
Brood Cows Bulls Calves Feeder Heifer Stocker
(Animal Type)
Figure 14 Percent of Dairy Cattle Respondents Formulating CSM Feeds for Specific Dairy Cattle Types
( of Respondents)
120 ----------------------
100 88
80
60
40
20
0 Calves Heifers Lactating Cows Dry Cows
(Animal Type)
Figure 1-5 Percent of Poultry Respondents Formulating CSM Feeds for Specific Poultry Types
( of Respondents)
OO~I--------------------------------------------~-
50 1-laquolaquolt--laquolaquolaquo -lt - lt - lt -lt laquo lt
44
40
30
20
10
0
f-
~laquolaquolaquolaquo
~laquolaquolaquolaquolaquolaquo
Broilers Layers Turkeys Breeding Flocks
(Animal Type)
Figure 16~ Combined Responses Months of the Year When CSM IS NOT Available
( of Respondents) 16 i ---
14 12~8
12
10
87373 7
6
4
2
0 ~~ ~s ~( ~( ~0( ~0(~~~ ~~ ~t ~1 u~ ~g n0~ ad-o N0~ ~a~
~Y ~o Q~lmiddotr
(Month)
Figure 17 Combined Responses Months of the Year When CSM Needs to Be Available
( of Respondents) 12 ---------------------------
10
8
6
4
2
0
goA 9
~ui ~s ~Ot X)Ot ~Ot X)Ot~0SV~0~~erl ~iSclt ~f ~~1 ~v~ ug ~o~ o~o NO~ co~0 0lt609 ~o
(Month)
Figure 18 Beef Cattle Responses Percent of Respondents Formulating Creep Feed for Calves or Supplements for Stockers
733
832
0 20 40 60 80 100 120
( of Respondents)
Figure 19 Beef Cattle Responses Protein-Related Factors Considered When Balancing Rations
Other Protein Factors 110
Rumen
Degradability 686
Crude Protein Level 161
Amino Acid
Values 42
( of Respondents)
Figure 21 Comparison of Responses Months When CSM Needs to Be Available
( of Respondents) 94 ---------------------------shy
92
9
88
86
84
82 8
78
76
74
72
7
68
66
~ euroI - It
64 -t----------------------------------- -----------t
JAN FEB MAR APR MAY JUN JUL AUG SEP OCT NOV DEC
(Month)
bull Beef Cattle -t Dairy Cattle ltgt Poultry Catfish
Figure 20 Comparison of Responses Months When CSM Is Not Available
( of Respondents)
16 t 15
14
13
12
11
10
9
8ltl amp
7
6
5 I JAN
I
FEB I
MAR I
APR I
MAY I
JUN I
JUL I
AUG SEP I
OCT NOV I
DEC
(Month)
bull Beef Cattle -t Dairy Cattle ltgt PouHry b Catfish
Figure 22 Comparison of Responses Analyses Routinely Performed
( of Respondents)
100~-----------------------------------------------
90
80
70
60
50
40
30
20
10
o I ~
AFLATOXIN C PROTEIN FAT FIBER GOSSYPOL OTHER NONE
(Analyses)
bull Beef Cattle Dairy Cattle o Poultry Catfish-t fj
Figure 23 Comparison of Responses Analytical Values Provided by Supplier
( of Respondents)
60shy
50
4)
30
20
10
o amp ~
AFLATOXIN C PROTEIN FAT FIBER GOSSYPOL OTHER NONE
(Analyses)
bull Beef Cattle -t Dairy cattle o Poultry b Catfish
Figure 24 Share of Cottonseed Use Crush vs Feed Use
( of Respondents)
100 I
90
CRUSH 80
70
60
50
40
30
20
FEED USE 10
o 1~ 1~ 1~ 1m 1m 1~ 1~ 1~ 1~ 1~ 1~ 1~ 1~ 1~
(Year)
Source USDAb
Table 1 Percentage of Beef Cattle Feeds Formula ted Table 2 CSM Feeds Formulated for Beef Cattle CSMmiddot Calvesmiddot
middotAverage Response Rate (feedlot=51 other=41) middotResponse Rate = 39
Table 3 CSM Feeds Formulated for Beef Cattle Table 4 CSM Feeds Formulated for Beef Cattle Stockersmiddot
middotResponse Rate = 40
Response Rate =37
Table 5 CSM Feeds Formulated for Beef Cattle Table 6 CSM Feeds Formulated for Beef Cattle
middotResponse Rate =33
middotResponse Rate = 37
Table 8 Percentage of Dairy Cattle Feeds Formulated CSM
Average Response Rate =88
middotResponse Rate = 37
Table 9 CSM Feeds Formulated for Dairy Cattle Table 10 CSM Feeds Formulated for Dairy Cattle
RespooseRate 24
middotResponse Rate = 34
Table 11 CSM Feeds Formulated for Dairy Cattle Table 12 CSM Feeds Formulated for Dairy Cattle
Response Rate = 31 Response Rate = 45
Table 13 Percentage of Poultry Feeds Formulated Using CSMmiddot
bullAverage Response Rate = 79
Table 14 Percentage of Catfish Feeds Formulated Using CSMmiddot
bullAverage Response Rate =67
Table 15 CSM Feeds Formulated for Catfishmiddot )middoti middot fteq~
bullAverage Response Rate = 17
Table 16 Combined Responses Importance of Specific Factors in Choice of Dietary Protein ( of
bullAverage Response Rate =g]
Table 17 Combined Responses Other Important Factors in
bullAverage Response Rate = 22
bullAverage Response Rate =91
-Average Response Rate =90
Table 20 Combined Responses Importance of Non - Nutrition -Related Factors in Choice of CSM over Alternative Protein Feeds ( of
-Average Response Rate = 87
Table 22 Combined Responses Top S Reasons Why CSM IS NOT Selected as a Feed
Table 23 Combined Responses Top 5 Specific Characteristics That Would Have to Change for CSM to be Selected as a Feed
Table 24 Combined Responses Analysis Routinely Performed
Table 25 Combined Responses Analysis Values Provided
CSM
267 067 333 333 1400 S333
467 000 067 067 1400 4867 --shy
467 000 000 067 400 4333 --shy -- shy -- shy
250 000 000 000 1250 4000 -- shy --shy
313R 4733 62 ------ shy~ - shy ~-
4S00 62
bullAverage Response Rate = 100
bullAverage Response Rate = 87
Table 28 Beef Cattle Responses Imponance of Nutrition-Related Factors in Choice of CSM Over Alternative Protein Feeds
Average Response Rate = 91
Table 29 Beef Cattle Responses Other Nutrition - Related
Fact~~~~~~~~~~~~~~~~~~~
Response Rate =7
Table 30 Beef Cattle Responses Imponance of Non - Nutrition - Related Factors in Choice of CSM Over Alternative Protein Feeds
middotAverage Response Rate = 87
middotResponse Rate = 5
bullAverage Response Rate =14
Table 33 Beef Cattle Responses Months of the Year When CSM Needs to Be AvaiJable I ii middot middot1
bullAverage Response Rate =53
10 U
-Moy
JIIJ
All
so
0_ -
to
--I No
Moy
10 -so shy
0_ _ 0-
Table 35 Beef Cattle Responses Top 5 Reasons Why CSM Is Not Selected as a Feed
Average Response Rate =100 Response Rate = 24
Response Rate =28
Average Response Rate = 98
Response Rate = 17
middotResponse Rate =9
Table 43 Beef cattle Responses Type of Creep Feed
middotResponse Rate = 81
middotResponse Rate =26
Table 45 Beef cattle Responses Respondents Formulating Rations With CSM and Whole
middotResponse Rate = 68
Table 47 Beef cattle Responses Percentage of Whole Cottonseed Respondents Mix in Rations Containing Both CSM and Whole Cottonseedmiddot tCmiddotHiitjt~ middotmiddotmiddotmiddot1
middotResponse Rate =25
middotResponse Rate = 30
bull Response Rate = 98
Response Rate =11
Table 51 Beef Cattle Responses Escape Value Respondents Are Using for Rumen Degradabilitymiddot
1~iiii middotb~r~~fgtD zq436imiddotmiddotmiddotmiddotmiddotmiddotmiddot 004bullbullbullbullbullbullbullbullbullbull1----22--+----31-4
I~~I 23 329
middotResponse Rate = 57
Table 53 Beef Cattle Responses Methods or Sources Respondents Used to Calculate CSM
Table 52 Beef Cattle Responses Reliability of Escape Values Used
Table 54 Beef Cattle Responses Interested in Knowing Escape Values for CSM Processed
Valuemiddot
middotResponse Rate =98
)
I Mean ~nse
63 57S19 228381 Q-L_uu ~139 59468 32306 139bullII1 1 061 06
1 1 44 430 614431-------- 57t 001 001 middot-1
==~=-__~~1c9 00 _ 06 _ 001_ 38 133 323 63
Average Response Rate =100
Response Rate = 89
Table 58 Dairy Cattle Responses Importance of Nutrition - Related Factors in Choice ofCSM Over Alternative Protein Feeds (ofbmiddotNmiddotmiddotmiddotmiddotmiddotmiddot
Response Rate =88
Table 59 Dairy Cattle Responses Other Nutrition-Related Factors
Indicated br~~P211dents
Response Rate =10
Table 60 Dairy Cattle Responses Importance of Non- Nutrition - Related Factors in Choice of CSM Over Alternative
Protein Feeds ( ofResPOndents~dd
Response Rate = 88
Response Rate = 3
--
Average Response Rate = 51
Table 62 Dairy Cattle Responses Months in the Year When CSM IS NOT Available
10 u
J -- AIIIi
--~ shy
loOoIMr _ 0-
bullAverage Response Rate =69
--- AIIIi
--~ soM
0
0-_
10
Table 65 Dairy Cattle Responses Top 5 Reasons Why CSM IS NOT Selected as a Peed
Table 66 Dairy Cattle Responses Top 5 Specific Characteristics That Would Have to ro1 ____ for CSM to be Selected as a Feed
Table 67 Dairy Cattle Responses Analyses Routinely Performed fmiddotmiddotmiddotmiddot
Response Rate =96
Response Rate =56
Table 68 Dairy Cattle Responses Other Analyses
Response Rate =25
Table 70 Dairy Cattle Other Analytical Values CSM
Response Rate =4
Average Response Rate =81
Average Response Rate = 15
Table 73 Dairy Cattle Responses Respondents Formulating Feeds With Whole andor Delinted
Cottonseed bull
bullAverage Response Rate =92
middotResponse Rate = 40
Table 74 Dairy Cattle Responses Respondents Formulating Rations with Cottonseed Meal and Whole Cottonseed in the Same Rationmiddot
middotResponse Rate = 97
Table 76 Dairy Cattle Responses Percentage of Whole Cottonseed Respondents Mix in Rations
ltltJIltainin(a0th CSM and WhoeCottonseedmiddot Mean
middotResponse Rate = 42
Table 77 Dairy Cattle Responses Knowledge of Research on Feedine CSM
~~~~
Average Response Rate = 68
Response Rate =7
Average Response Rate =59
Response Rate =25
Average Response Rate =63
Response Rate = 13
middotResponse Rate = 92
Response Rate =82
Table 85 Dairy Cattle Responses Methods or Sources Used to Calculate CSM
Response Rate = 73
Table 86 Dairy Cattle Responses Respondents Interested in Knowing Escape Values for CSM Processed from Different Methodsmiddot fmiddotmiddotmiddotmiddotmiddotmiddot
Response Rate = 92
Response Rate = 34
Table 89 Dairy Cattle Responses Suggestions for CSM
Response Rate =33 Response Rate =22
-----
64 139 24815 00 36 511 5751
5951 131 438 35015 00 15 I-~~~~~
6200 15 423 51151 00 00 ~~~ -~~~ -~~~ ~~~-~~ --~~ ~ ~ ~~-~ ~
292 55125 00 00 125 45800
bullAverage Response Rate =99
Average Response Rate =85
Table 92 Poultry Responses Importance of Nutrition - Related Factors in Choice of CSM Over Alternative Protein Feeds (of
Average Response Rate =85
Table 93 Poultry Responses Other Nutrition-Related Factors Indicated
200
200
Response Rate = 5
Table 94 Poultry Responses Importance of Non - Nutrition - Related Factors in Choice of CSM Over Alternative Protein
Feeds~~~~~~~~~~5=~~~~~T7~~
00 Average Response Rate =83
Response Rate =4
Average Response Rate = 17
Table 97 Poultry Responses Months in the
J
p
April
lao
A
shy-- 0
ft
April
_
Average Response Rate = 43
=1 g L
0
Table 99 Poultry Responses Top 5 Reasons Why CSM IS NOT Selected as a Feed
Table 100 Poultry Responses Top 5 Specific Characteristics That Would Have to Change for
CSM to be Selected as a Feed Inoredient
Table 101 Poultry Responses Analyses Routinely
middotResponse Rate = 93
Table 102 Poultry Responses Other Analyses Routinely
Performed
middotResponse Rate = 27
Table 103 Poultry Responses Analytical Values Provided
middotResponse Rate =73
Table 104 Poultry Responses Knowledge of Problems
bullAverage Response Rate = 62
Average Response Rate = 14
Table 106 Poultry Responses Protein - Related Factors
Average Response Rate = 64
Table 107 Poultry Responses Other Protein - Related
Response Rate =11
Table 108 Poultry Responses Crude Protein Levels
Preferred for CSM
Response Rate = 55
Table 111 Poultry Responses Gossypol Levels Considered
Safe
Table 112 Poultry Responses Would or Do Use Table 113 Poultry Responses Relative Feeding Value of CSM Comoared to 44 SBMmiddot
middotResponse Rate = 96
bull Response Rate = 100
Table 114 Poultry Responses Knowledge of Table 115 Poultry Responses Familiarity with Other Feedino CSMmiddot
middotResponse Rate =7 bull Response Rate = 73
middotResponseRate = 31
bullAverage Response Rate = 58
Table 118 Poultry Responses Willingness to Pay
a Premium Per Unit of Protein for CSM With More
Than 41 Protein
bullResponse Rate =91
Table 119 Poultry Responses Percent of Cost of SBM Respondents Willing to Pay for CSM with
Response Rate =27
Response Rate =64
00 00 87 43 478 304 57 00 00
----shy I--~~
00 ~-~
43 522 348 59 ----shy
62~ 00 00 00 261 ----shy
652 ------shy
00 00 00 00 667 333 63 AverageResponseRate = 99
bullAverage Response Rate = 73
Table 123 Catfish Responses Importance of Nutrition - Related Factors in Choice of CSM Over Alternative Protein Feeds
Average Response Rate =83
Table 124 Catfish Responses Importance of Non- Nutrition - Related Factors in Choice of CSM Over Alternative Protein
Feeds
Average Response Rate = 90
bullAverage Response Rate = 13
Igt 20
s_
Pshy s
--s
H_
_
gt 7 bull bull bull bull bull
1 fsI plusmn -
haMr
N__
shy
bullAverage Response Rate =54
Table 128 Catfish Responses Top 5 Reasons Why CSM IS NOT Selected as a Feed
Table 129 Catfish Responses Top 5 Specific Characteristics That Would Have to Change for CSM to Be Selected as a Feed-_
Table 130 Catfish Responses Analyses Routinely Table 131 Catfish Responses Other Analyses Routinely Performed
middotResponse Rate = 25
middotResponse Rate =92
bullAverage Response Rate = 18
Table 133 Catfish Responses Knowledge of Problems Feedine CSM to CatflSh
Average Response Rate =100
Table 134 Catfish Responses Protein - Related Factors Considered i
Response Rate = 83
Table 135 Catfish Responses Crude Protein Levels Preferred for CSM
Response Rate = 100
Table 139 Catfish Responses Would or Do Use Table 140 Catfish Responses Relative Feeding
Value ofCSM Compared to 44~ Lmiddotmiddotmiddotmiddotmiddotmiddotmiddotmiddotmiddotmiddotmiddotmiddotmiddotmiddotmiddotmiddotmiddotmiddotmiddot _
Response Rate = 100
Response Rate = 100
Table 141 Catfish Responses Knowledge of Research on Table 142 Catfish Responses Sources ofInformation
Average Response Rate = 83
bullAverage Response Rate = 44
Table 143 Catfish Responses Willingness to Pay A Premium Per Unit of Protein for CSM with More Than
middotResponse Rate = 100
Table 144 Catfish Responses Percent of Cost of SBM Respondents Willing to Pay for CSM with Sufficiently Low Goscvnol and Fiber Levelsmiddot
middotResponse Rate = 83
middotResponse Rate = 25
Table 146 Comparison of Mean Responses and Analysis of Variance (ANOVA) Importance of Specific
bull Scale of 1 (extremely unimportant) to 7 (extremely important) for the mean ranking a Mean significantly larger across animal types at the 5 significance level otherwise no difference b Mean significantly lower across animal types at the 5 significance level otherwise no difference
Table 147 Comparison of Mean Responses and Analysis of Variance (ANOVA) Ranking of Other Protein
bull Scale of 1 (CSM inferior to respective feed) to 7 (CSM superior to respective feed) for the mean ranking
a Mean significantly larger across animal types at the 5 significance level otherwise no difference
b Mean significantly lower across animal types at the 5 significance level otherwise no difference
Table 148 Comparison ofMean Responses and Analysis of Variance (ANOVA) Importance of Nutritionshy
Related Factors in Choice ofCSM Over Alternativesmiddot
bull Scale of 1 (extremely unimportant) to 7 (extremely important) for the mean ranking a Mean significantly larger across animal types at the 5 significance level otherwise no difference
b Mean significantly lower across animal types at the 5 significance level otherwise no difference
Table 149 Comparison of Mean Responses and Analysis of Variance (ANOVA) Importance of Nonshy
Nutrition- Related Factors in Choice of CSM Over Alternativesmiddot
bull Scale of 1 (extremely unimportant) to 7 (extremely important) for the mean ranking
a Mean significantly larger across animal types at the 5 significance level otherwise no difference
b Mean significantly lower across animal types at the 5 significance level otherwise no difference
- = Not mentioned or ranked lower than 4th place
Table 151 Comparison of Responses Top Responses Why CSM IS NOT Selected as a Feed
- = Not mentioned or ranked lower than 5th place
Table 152 Comparison of Responses Top Characteristics that Have to Change for CSM to Be
- = Not mentioned or ranked lower than 5th place

10
gossypol level are cited as the three most important factors that would have to change for CSM to be used more frequently as was the case with the combined responses (Table 36)
bull Source 0 chemical analyses lor cottonseed meal No major differences appear in either the analyses routinely performed by the responding beef cattle feed formulators or the analytical values provided to them by CSM suppliers (Tables 37 38 39 and 40)
Beef cattle sample members were also asked several questions specifically regarding the use of CSM in beef cattle feed formulations in 5 general areas I) problems resulting from feeding a ration with CSM to the various beef cattle types 2) details on particular feed formulations for beef cattle 3) sources of information utilized regarding formulating beef cattle feeds 4) protein-related factors considered when balancing rations for beef cattle and 5) an open-ended question soliciting suggestions to improve the usefulness or value of CSM for beef cattle feed formulations
Problems from Feeding CSM Rations to Beef Cattle
Few respondents indicted knowledge of any problems resulting from feeding a ration containing cottonseed meal to either feedlot or other beef cattle (Table 40 The most frequently mentioned problems concerned feedlot bulls and calves The majority of the problems reported involved supplements and starter feeds (Table 42) The main problems reported had to do with gossypol beef cattle performance when fed rations containing CSM and reproduction The low number of respondents indicating problems of any type however suggests that the problems reported were likely isolated cases
Details on Particular Feed Formulations for Beef Cattle
The sample members were also asked to provide information regarding creep feeds for calves and supplements for stockers that they formulate as well as information regarding the use of whole or delinted cottonseed in beef cattle feed rations Nearly 75 of all beef cattle respondents formulate creep feeds for calves and over 80 formulate supplements for stockers (Figure 18) Traditional creep feeds represented two-thirds of the creep feeds formulated (Table 43) Over half the respondents indicated that they formulate traditional creep feeds Fewer respondents formulated high protein creep feeds
Nearly half the beef cattle respondents formulate some feeds using whole fuzzy cottonseed (Table 44) Only a little less than a third formulate any feeds using delinted cottonseed however Also only about a quarter of the respondents formulate any rations that include both CSM and whole cottonseed (Table 45) For those who formulate rations that include both the mix of the two in the rations varies widely Respondents reported that the share of such rations accounted for by CSM ranged from 1 to 100 with a mean of 19 (Table 46) The share of those rations accounted for by whole cottonseed ranged from 0 up to a maximum of 25 with a mean of 102 (Table 47)
Sources of Information Utilized on Formulating Beef Cattle Feeds
The largest number of respondents (110 of 123 respondents) indicated that they utilize university research of some type to obtain information on formulating feeds for beef cattle (Table 48) Only slightly fewer (91 respondents) indicated that industry publications are a source of feed formulation information for beef cattle University extension and government agencies were also listed as important information sources A few respondents listed other sources of information
II
including primarily the results of research performed in their own companies their own personal experience and their own private research (Table 49)
Protein-Related Factors Considered for Balancing Beef Cattle Rations
Nearly 70 of the respondents indicated that rumen degradability is a protein-related factor that they consider when balancing beef cattle rations (Figure 19) Respondents also consider crude protein level (16) and other protein factors (11) Only 4 indicated concern for the amino acid value when balancing beef cattle feed rations The two main other protein-related factors the respondents indicated as having a bearing on balancing beef cattle feed rations were the digestibility of the protein and the protein ingredients (Table 50)
Respondents indicated a wide range of escape values (or by-pass values) that they are using for CSM from less than 20 to over 50 (Table 51) At the same time however they are unsure as to the reliability of the escape values they are using Nearly 70 indicated that the escape values they are using are neither reliable or unreliable or only somewhat reliable (Table 52) The principal single method or source used by respondents for the escape value was the National Research Council (Committee on Animal Nutrition National Academy of Sciences) (Table 53) Universities were the next most frequently mentioned single source of CSM escape values The largest number of respondents (32) simply indicated that several sources were consulted for escape values Finally almost all respondents indicated an interest in obtaining information on escape values for CSM as processed by different methods (Table 54) There appears to be a lack of reliable information on CSM escape values in the perception of beef cattle feed formulators
Suggestions for Improling the Usefulness of Cottonseed Meal
Only 16 of the beef cattle feed formulators that returned surveys provided suggestions that might improve the value or usefulness of CSM in feed rations (Table 55) Some of the more noteworthy suggestions included improving the consistency of cottonseed meal various types of needed research more data on CSM and increased availability of CSM
Dairy Cattle
There are few major differences in the perceptions of dairy cattle feed formulator respondents concerning the use of cottonseed meal from the combined responses over all survey respondents and the beef cattle responses Again this may reflect the larger number of respondents formulating feed for dairy cattle (and for ruminants in general) than for other animal species The salient differences in responses by dairy cattle feed formulators in the 6 general question areas include the following
bull Factors affecting choice of dietary proteins There is virtually no differences in the responses of dairy cattle respondents from the combined responses for any of the listed factors (quality price availability consistency and other) affecting the choice of dietary protein (Table 56) A large majority of dairy cattle feed formulators ranked all factors as either important or extremely important
bull Cottonseed meal as an alternative protein feed The results for dairy cattle are roughly similar to those from the combined responses (Table 57) The two major differences include I) a large majority of respondents feel that CSM is not an alternative to dried skim milk fish
12
meal dried whole milk and blood meal in dairy cattle feeds and 2) an overwhelming majority of respondents consider CSM to be an alternative to nearly all the remaining protein feeds for use in dairy cattle rations
bull The importance of nutritional and non-nutritional factors Again the responses are generally the same As was the case for beef cattle respondents however dairy cattle respondents tended to rank the listed non-nutrition-related factors as relatively more important than the listed nutrition-related factors On average dairy cattle feed formulators ranked amino acid balance fiber level and gossypol level as less important factors in the choice of CSM than was the case for the combined responses (Tables 58 and 59) As in the case of both the combined and beef cattle responses aflatoxin was ranked at a higher level of importance than any other single nutrition-related factor Of the non-nutrition-related factors respondents ranked most factors as all slightly more important in the choice of CSM than was the case for the combined responses (Tables 60 and 61)
bull Seasonality of cottonseed meal allailability The results for the dairy cattle respondents are highly consistent with those for both the combined responses and for the beef cattle responses The months of May through September are the months of least availability of CSM which are also the months indicated when CSM is least needed to be available in the perception of dairy cattle respondents (Tables 62 and 63) Again the suggestion is one of little problem of CSM availability although this is not totally the case as indicated by dairy cattle respondents in later questions
bull Reasons for the selection and non-selection of cottonseed meal While price and availability are also the top two reasons that dairy cattle respondents perceived that CSM is selected as a feed ingredient protein contentquality ranked third on their list followed closely by palatability (Table 64) The top two reasons the CSM is not selected according to the dairy cattle respondents were price and availability as with both the combined responses and the beef cattle responses The third reason given by the dairy cattle respondents however was protein qualitylevel followed in fourth place by gossypol (Table 65) Again price was the key CSM characteristic that dairy cattle respondents indicated that must change in order to be used more frequently in dairy cattle rations (Table 66) Availability and gossypol levels were ranked as the second and third CSM characteristics that must change as was the case for the combined responses
bull Source of chemical analyses for cottonseed meal The results for the chemical analyses performed by dairy cattle respondents are virtually identical to those of both the combined results and those of the beef cattle results The primary analysis routinely performed by the dairy cattle respondents is crude protein (121 of the 143 respondents) followed by fiber (94 respondents) and fat (83 respondents) (Tables 67 and 68) The primary analytical values supplied to the dairy cattle respondents also include crude protein (62 respondents) fiber (50 respondents) and fat (47 respondents) (Tables 69 and 70) It is interesting to note that although aflatoxin was ranked at a higher level of importance than any other nutrition-related factor affecting the choice of CSM as feed component only a third of the dairy cattle respondents routinely perform analyses for aflatoxin and only 11 respondents are provided aflatoxin values by their CSM suppliers The story is about the same for both the combined and the beef cattle responses
Dairy cattle sample members were also asked several questions specifically regarding the use of CSM in dairy cattle feed formulations in 6 general areas I) problems resulting from feeding a
13
ration with CSM to the various dairy cattle types 2) details on dairy cattle feed formulations containing whole cottonseed 3) sources of information utilized on formulating dairy cattle feeds 4) protein-related factors considered when balancing rations for dairy cattle 5) gossypol levels considered to be safe for mature dairy cattle and pre-ruminant calves and 6) an open-ended question soliciting suggestions to improve the usefulness or value of CSM for dairy feed formulations
Problems from Feeding CSM Rations to Dairy Cattle
Again very few respondents indicted knowledge of any problems resulting from feeding a ration containing CSM to dairy cattle (Table 71) Only 24 of the respondents indicated problems with calves and only 18 for lactating cows as the result of feeding rations with CSM Only about 3 of the respondents mentioned problems with either dairy heifers or dry cows The number one problem reported was gossypol toxicity primarily in creep feeds and complete rations (Table 72) Both palatability and poor performance problems for various feed types were also frequently mentioned Again however the low number of respondents indicating problems of any type suggests that the problems reported were likely isolated cases
Details on Dairy Cattle Feed Formulations Containing Whole Cottonseed
Over 75 of dairy cattle respondents formulate feeds using whole fuzzy cottonseed a much higher percentage than was the case for beef cattle Less than half of the dairy cattle respondents however utilize delinted cottonseed in their feeds more in line with the beef cattle results (Table 73) Less than half the respondents formulate rations that include both CSM and whole cottonseed (Table 74) For those who formulate rations that include both the mix of the two in the rations varies widely Respondents reported that the share of such rations accounted for by CSM ranged from 1 to 30 with a mean of 85 (Table 75) The share of those rations accounted for by whole cottonseed ranged from 3 to 100 with a mean of 16 (Table 76) It appears therefore that on average dairy feeds formulated with both CSM and whole cottonseed contain a higher percentage of whole cottonseed than of CSM This is just the opposite of the situation for beef cattle
Sources of Information Utilized on Formulating Dairy Cattle Feeds
Over 80 of the dairy cattle respondents indicated that they were familiar with research on feeding CSM to mature dairy cattle (Table 71) Only half however indicated familiarity with such research for pre-ruminant calves Less than 10 of the respondents listed any other research on feeding CSM to other types of dairy cattle (Table 78) The largest number of respondents (137 of 143 respondents) indicated that they utilize university research to obtain information on formulating feeds for dairy cattle followed by industry publications of some type (121 respondents) and university extension service (83 respondents) (Table 79) Only 36 respondents listed other sources of information including primarily personal experience and research (Table 80)
Protein-Related Factors Considered for Balancing Dairy Cattle Rations
Nearly 100 of the dairy cattle respondents indicated that both crude protein level and rumen degradability are factors they consider when balancing rations for dairy cattle a much higher level than is the case for beef cattle (Table 81) Less than half consider amino acid values (61 of 143 respondents) Only 19 respondents indicated that they consider other factors like protein solubility (Table 82)
Dairy cattle respondents indicated a even wider range of escape values (or by-pass values) that they are using for CSM than did beef cattle respondents from 0 to over 80 (Table 83) The mean escape value calculated from the responses is 40 Dairy cattle respondents indicated slightly more
14
confidence in the escape values they are using than was the case for beef (Table 84) Only 22 respondents however considered those escape values to be reliable or extremely reliable The principal single method or source used by respondents for the escape value they use was again the National Research Council (Committee on Animal Nutrition National Academy of Sciences) (Table 85) Book values was the next most frequently mentioned single source of CSM escape values (23) Finally nearly 100 of the respondents indicated an interest in obtaining information on escape values for CSM as processed by different methods (Table 86) The conclusion from the dairy cattle responses is the same as for beef cattle That is there appears to be a lack of reliable information on CSM escape values in the perception of dairy cattle feed formulators and that they are highly interested in obtaining more information in this regard
Gossypol Level Considered Safe for Mature Dairy Cattle and Pre-Ruminant Calves
Dairy cattle respondents appear to have little idea of what the safe levels are for gossypol in mature dairy cattle and pre-ruminant calf feeds First of all only one-third of those who returned surveys even attempted to provide numbers for safe gossypol levels (Tables 87 and 88) Many respondents simply wrote comments such as dont know or not aware of research on safe gossypol level in the margin of the survey beside the question Second those who attempted to answer the questions provided an amazingly wide range of safe gossypol levels from 0 parts per million (ppm) to 7500 ppm for mature dairy cattle and from 0 ppm to 1000 ppm for pre-ruminant calves The mean safe gossypol levels were 609 ppm for mature dairy cattle and 121 ppm for pre-ruminant calves The responses were spread quite evenly between the extremes around the means It should be noted that the research team checked and rechecked the data set for this question to insure there were no errors in data entry
Suggestions for Improving the Usefulness of Cottonseed Meal
Only about 22 of the dairy cattle feed formulators that returned surveys provided suggestions that might improve the value or usefulness of CSM in dairy cattle feed rations (Table 89) Some of the more frequent suggestions dealt with improving the consistency and availability of CSM Several respondents suggested the need for more information on gossypol a worthy suggestion given the results of the previous question
Poultry
The perceptions of poultry feed formulator respondents concerning the use of cottonseed meal differ importantly in many respects from the combined responses over all survey respondents and from those of beef and dairy cattle Many of the differences are likely the result of the distinct dietary needs of ruminant as opposed to non-ruminant animals The salient differences in responses by poultry feed formulators in the 6 general question areas include the following
bull Factors affecting choice of dietary proteins Surprisingly there was little difference in the responses of those indicating that they formulate feed for poultry than for the combined results (or for beef and dairy cattle) regarding the importance of the listed factors (quality price availability consistency and other) affecting the choice of dietary protein (Table 90) A large majority of poultry feed formulators ranked all factors as either important or extremely important The only exception is that consistency was ranked slightly less important by poultry respondents than by respondents in general
bull Cottonseed meal as an alternative protein feed Poultry respondents ranked more protein feeds as higher on the superior-to-CSM scale than was the case for the combined responses
15
(Table 91) In fact the mean rank of all but three of the protein feeds were all at least somewhat higher than was the case for the combined responses The mean rank of several of the other protein feeds as determined by the poultry respondents was much higher than for the combined responses including fish meal poultry by-product meal and soybean meal Poultry by-product meal changed from an inferior to a superior protein feed compared to CSM The protein feed judged by poultry respondents to be most superior to CSM for poultry rations was soybean meal while urea was ranked as most inferior Poultry respondents also appeared to have stronger opinions about whether or not CSM is an alternative to the other listed protein feeds than was the case for the combined responses They overwhelmingly perceived that CSM is not an alternative to many of the other protein feeds including fish meal dried skim milk dried whole milk poultry by-product meal blood meal tankage and urea A larger percentage of poultry respondents than was the case for dairy and beef cattle perceived however that CSM is a definite alternative to many other protein feeds including safflower meal sunflower meal linseed meal peanut meal canola meal feather meal distillers dried grains brewers dried grains and even soybean meal
bull The importance of nutritional and non-nutritional factors Poultry respondents ranked all but two of the listed nutrition-related factors as more important in the choice of CSM over alternative protein feeds for poultry rations than was the case for the combined responses on average (Le comparing mean responses) (Table 92) The highest percentage of poultry respondents ranked gossypol level (62 of the respondents) amino acid balance (59) aflatoxin (58) protein quality (57) and amino acid availability (57) as extremely important in the choice of CSM over alternative protein feeds Only about 5 of the respondents listed other important nutrition-related factors (Table 93) There are few differences however in the poultry responses as compared to the combined responses regarding the importance of non-nutrition-related factors (Table 94) The major difference is a much lower ranking of the importance of palatability in choosing CSM over alternative protein feeds Also a somewhat higher percentage of poultry respondents ranked price as an extremely important non-nutrition-related factor Few other non-nutrition-related factors were listed by the respondents (Table 95)
bull Seasonality of cottonseed meal availability The results for the poultry respondents regarding the months of the year when CSM is not available are highly consistent with those for the combined responses and those for the beef and dairy cattle responses Poultry respondents indicated that May through September are the months of least availability of CSM (Table 96) But likely because of the shorter production cycle for poultry than for cattle poultry respondents indicated that CSM needs to be available in almost every month (but slightly less so in August and September) for CSM to compete effectively with alternative protein feeds (Table 97) For poultry therefore the indication is that poultry feed formulators may perceive an availability problem which inhibits greater use of CSM in poultry rations to some extent
bull Reasons for the selection and non-selection of cottonseed meal Again price and availability are the number one and number two reasons respectively cited by poultry respondents for which CSM is selected as a feed ingredient (Table 98) Protein quality ranked third on their list followed closely by phosphorous content The top reason that CSM is not selected according to the poultry respondents was pricevalue (Table 99) About tied for second place were gossypol content and availability More respondents ranked availability as the second reason than for gossypol content but more respondents listed gossypol first The amino acid level was listed as a distant fourth reason for which CSM is not selected as a feed ingredient Price is again the key CSM characteristic that poultry respondents indicated must change in
16
order for CSM to be used more frequently in poultry rations (Table 100) Gossypol was clearly considered to be the second most important characteristic that must change Availability was ranked as either first or second by all respondents who listed it as a characteristic that must change
bull Source of chemical analyses for cottonseed meal The results for the chemical analyses performed by poultry respondents are similar to those of both the combined results and those of the beef and dairy cattle results The primary analysis routinely performed by the poultry respondents is crude protein (51 of 55 respondents) followed by fat (40 respondents) fiber (37 respondents) and aflatoxin (31 respondents) (Tables 101 and 102) The primary analytical values supplied to the poultry respondents also included crude protein fiber and fat (Table 103) A third of the poultry respondents indicated that their CSM supplier does not provide them with any analytical values Once again even though aflatoxin was ranked as an extremely important nutrition-related factor in the choice of CSM as a feed component only I respondent obtains an analytical value for aflatoxin from his CSM supplier and only a little over half routinely perform their own aflatoxin analyses
Poultry sample members were asked some specific questions regarding the use of CSM in poultry feed formulations in 5 general areas I) problems resulting from feeding a ration with CSM to the various poultry types 2) specific information on several key nutrition-related factors affecting the use of CSM in poultry rations 3) sources of information utilized on formulating poultry feeds 4) CSM price and value and 5) an open-ended question soliciting suggestions to improve the usefulness or value of CSM for poultry feed formulations
Problems from Feeding CSM Rations to Poultry
The majority of poultry respondents indicated no knowledge of any problems associated with feeding a ration containing CSM to poultry (Table 104) Only 14 of the respondents indicated problems with broilers less than 7 for breeding flocks and about 3 for turkeys Over a third however indicated that they had knowledge of such problems with layers The number one problem reported was yolk molting and discoloration primarily in layer rations (Table 105) A few respondents indicated problems with depressed growth associated with broiler feeds containing CSM
Information on Key Nutrition-Related Factors for Poultry Rations
The survey sample members were asked to respond to a number of specific questions related to nutritional factors that affect the use of CSM in poultry rations including protein energy fat gossypol and synthetic amino acids They were then asked to indicate their perception of the overall feeding value of a standard 41 protein CSM compared to that of a standard 44 protein soybean meal The questions were designed primarily to determine the extent of knowledge among feed formulators concerning these factors as they relate to the use of CSM and the relative feeding value of CSM
Sample members were asked to respond to two questions regarding protein in poultry feed rations They were first asked to indicate the specific protein-related factors that they consider when balancing rations for poultry They were given a list of three factors (crude protein level amino acid content and amino acid availability) They were also allowed to specify any other protein-related factors they consider when balancing poultry rations They were then asked to indicate the crude protein levels they would prefer for cottonseed meal and were given a choice of four levels (3641 (standard) 44 and 48) and allowed to suggest any other preference for crude protein level
17
Almost all poultry respondents indicated that they consider amino acid content and availability when balancing feed rations with fewer responding that they consider the crude protein level (Table 106) Other protein-related factors listed by the respondents included amino acid balance protein digestibility and energy levels (Table 107) With regard to preferred crude protein level for CSM over half of the poultry respondents indicated a preference for 48 crude protein (Table 108) About 27 of the respondents were satisfied with the standard 41 level and 20 indicated a preference for a 44 protein CSM No respondents preferred anything less than the standard 41
With respect to energy levels the sample members were asked to indicate what they considered to be the normal maximum and minimum energy levels for protein feeds for broilers layers turkeys and breeding flock As Table 109 indicates the responses varied widely with little or no indication of a mode (most frequent response) in most cases For broilers the maximum (in K Cals DE per pound) ranged from 0 to 1800 and the minimum from 850 to 1700 with a mean maximum of 1436 and a mean minimum of 1276 For layers the maximum (in K Cals DE per pound) ranged from 1000 to 1800 and the minimum from 800 to 1500 with a mean maximum of 1347 and a mean minimum of 1187 For turkeys the maximum (in K Cals DE per pound) ranged from 1100 to 1725 and the minimum from 850 to 1700 with a mean maximum of 1334 and a mean minimum of 1261 For breeding flocks the maximum (in K Cals DE per pound) ranged from 1000 to 1600 and the minimum from 750 to 1600 with a mean maximum of 1328 and a mean minimum of 1159 Given the disparity in the responses it seems clear that there is little common concept of the normal maximum and minimum energy levels for protein feeds
Sample members similarly were asked to indicate the minimum and maximum fat levels they considered critical for protein feeds Although the range of responses was still quite wide there appeared to be more uniformity in responses to this question than the one for energy (Table 110) The maximum fat levels (ether extract as fed basis) indicated by the respondents ranged from 1 to 15 or 20 for most poultry types The minimums ranged from 0 to 15 The mean minimum levels of fat for all poultry types was about 3 The mean maximum ranged from 6 to 82 depending on the poultry type
Sample members were asked to indicate the level of gossypol they considered safe for poultry rations The responses again varied widely from a low of 0 ppm up to a high of 300 ppm for all poultry types (Table III) The highest mean level of gossypol as calculated from the responses to the question were 104 ppm for broilers and 91 ppm for turkeys For layers and breeding flocks the mean levels were much lower at 57 ppm and 54 ppm respectively
The questionnaire also asked the sample members to indicate if they use or would use synthetic amino acids where economical The response was that nearly 100 of all poultry respondents indicated that they have or would use synthetic amino acids in this situation (Table 112) This suggests little real aversion on the part of feed formulators to utilize synthetic amino acids in least cost poultry formulations
To obtain some insight on the general perception of poultry formulators regarding CSM the sample members were asked to indicate the overall feeding value of a standard 41 protein CSM compared to that of a standard 44 protein soybean meal in their opinion on percentage basis They were given the choice of 5 ranges from under 70 to over 100 in 10 increments (see Table 113 for the actual ranges used) Nearly 80 of the respondents indicated that CSM has an overall feeding value of under 90 of that of soybean meal Given the five choices offered to respondents the mean feeding value was around 80
18
Sources of Information Utilized on Formulating Poultry Feeds
About two-thirds of the poultry respondents indicated that they were familiar with research on feeding CSM to broilers and layers (Table 114) Only half however indicated familiarity with such research for turkeys and only a little over a third for breeding flocks Less than 10 of the respondents listed any other research on feeding CSM to other types of poultry (Table 115) To obtain information on formulating feeds for poultry the largest number of respondents (52 of the 55 respondents) indicated that they utilize university research followed by industry publications of some type (45 respondents) university extension services (26 respondents) and government agencies (20 respondents) (Table 116) Only 17 respondents listed other sources of information including primarily personal experience and research (Table 117)
Cottonseed Meal Price and Value
To get some idea concerning the poultry respondents perceptions of the value of CSM particularly with respect to soybean meal sample members were asked 1) if they would be willing to pay a premium per unit of protein for CSM with more than a standard 41 protein and 2) if gossypol and fiber were sufficiently low on average what percent of the cost of soybean meal they would be willing to pay for CSM
With respect to the first question only about half the respondents indicated a willingness to pay a premium for a CSM with more than 41 protein despite the fact that 75 of them indicated earlier that they would prefer a CSM with a higher crude protein level (Table 118) Thus at least 25 of the respondents prefer a higher protein level CSM but would not be willing to pay a premium to get it
In response to the second question poultry respondents indicated that they would only be willing to pay an average of about 76 of the cost of soybean meal for a CSM with a sufficiently low level of gossypol and fiber (Table 119) The range around that average however was fairly large from 50 to 95 Because CSM has traded at about 91 of the value of soybean meal on the market on a protein equivalent basis and about 85 on an unadjusted basis on average in each year since 1984 either poultry respondents are currently unaware of the historical CSM to soybean meal price relationship or they are indicating that the current CSM market price relative to that of soybean meal is substantially above the levels that most find acceptable
Suggestions for Improving the Usefulness of Cottonseed Meal
Only about 27 of the poultry feed formulators that returned surveys provided suggestions that might improve the value or usefulness of CSM in poultry feed rations (Table 120) Some of the more frequent suggestions included the need for more information on the use of CSM in poultry rations increased availability of CSM and nutrient guarantees
Catfish
The perceptions of catfish feed formulator respondents concerning the use of cottonseed meal correspond closely to those of the poultry respondents likely because of the similar dietary needs of non-ruminant animals The salient differences in responses by catfish feed formulators in the 6 general question areas included on this section of the surveys include the following
bull Factors affecting choice of dietary proteins There were no differences in the responses of those indicating that they formulate feed for catfish than for poultry regarding the importance
19
of the listed factors (quality price availability consistency and other) affecting the choice of dietary protein (Table 121) A large majority of catfish respondents ranked all factors as either important or extremely important as did poultry respondents
bull Cottonseed meal as an alternative protein feed As was the case for poultry catfish respondents ranked more protein feeds as higher on the superior-to-CSM scale than was the case for the combined responses (Table 122) Catfish feeders however ranked meat and bone meal and blood meal as even more superior to CSM than did poultry respondents The protein feeds that catfish respondents ranked as roughly similar to CSM included tankage feather meal peanut meal linseed meal corn gluten meal brewers dried grains distillers dried grains sunflower meal safflower meal and canola meal Catfish respondents also appeared to have nearly as strong views about whether or not CSM is an alternative to the other listed protein feeds as did poultry respondents They perceived that CSM is not an alternative to many of the other protein feeds including blood meal dried whole milk meat and bone meal and dried skim milk Catfish respondents also perceived however that CSM is a definite alternative to many other protein feeds including safflower meal canola meal peanut meal sunflower meal linseed meal distillers dried grains brewers dried grains tankage soybean meal wheat middlings corn gluten meal urea and feather meal
bull The importance of nutritional and non-nutritional factors The responses for catfish with regard to the importance of nutrition-related and non-nutrition-related factors in choosing CSM as a component of catfish feeds were roughly similar to those for poultry (Table 123) The salient differences were that a larger percentage of catfish respondents ranked energy level fat level and fiber level as important or extremely important and a much larger percentage ranked aflatoxin as extremely important One major difference of the catfish responses regarding the importance of non-nutrition-related factors from those of poultry is that palatability is much mOre of a concern to catfish feeders (Table 124) Bin space is less important to catfish respondents and service from the CSM industry is more important to them
bull Seasonality of cottonseed meal availability The results for the catfish respondents regarding the months of the year when CSM is not available were generally consistent with those for poultry except that May and June were perceived as less problematic for obtaining CSM supplies by the catfish respondents (Table 125) Catfish formulators perceive that CSM needs to be more available in April through October than during the rest of the year to be competitive with other protein feeds (Table 126) This suggests the perception on the part of catfish feed formulators of a CSM availability problem during about the first half of any given year
bull Reasons for the selection and non-selection of cottonseed meal Pricevalue is the number one reason cited by catfish respondents for which CSM is selected as a feed ingredient followed by protein quality and palatability (Table 127) The top reason that CSM is not selected according to the catfish respondents is pricevalue followed by quality and gossypol level (Table 128) Gossypol level is the key CSM characteristic that catfish respondents indicated must change in order for CSM to be used more frequently in catfish rations (Table 129) Quality was clearly considered to be the second most important characteristic that must change followed by aflatoxin level This is the only animal species for which price was not the number one characteristic cited that would have to change and was not even listed among the top three responses The implication is that catfish feed formulators may not consider the price of cottonseed meal to be out of line with their needs and thus do not consider price to be a particular problem for the use of CSM in catfish rations A word of caution is in order
20
to avoid taking this conclusion too far because of the relatively few number of catfish feed formulators in the sample
bull Source of chemical analyses for cottonseed meal The results for the chemical analyses performed by poultry respondents are similar to those of poultry as well as those of both the combined results and the beef and dairy cattle results The primary analysis routinely performed by the catfish respondents is crude protein followed by fat fiber aflatoxin and gossypol (Tables 130 and 131) The primary analytical values supplied to the catfish respondents also included crude protein fiber and fat (Table 132) Only 2 of the II catfish respondents indicated that their CSM supplier does not provide them with any analytical values Even though gossypol was ranked as an extremely important nutrition-related factor in the choice of CSM as a feed component and the number one CSM characteristic that needs to change only 5 of the II respondents routinely perform gossypol analyses None of catfish respondents obtain analytical values for aflatoxin from their CSM supplier
As for poultry catfish sample members were asked some specific Questions regarding the use of CSM in catfish feed formulations in 5 general areas 1) problems resulting from feeding a ration with CSM to the various catfish types 2) specific information on several key nutrition-related factors affecting the use of CSM in catfish rations 3) sources of information utilized on formulating catfish feeds 4) CSM price and value and 5) an open-ended Question soliciting suggestions to improve the usefulness or value of CSM for catfish feed formulations
Problems from Feeding CSM Rations to Catfish
Absolutely no catfish respondents indicated any knowledge of any problems associated with feeding a ration containing CSM to catfish (Table 133)
Information on Key Nutrition-Related Factors for Catfish Rations
As for poultry the survey sample members were asked to respond to a number of specific Questions related to nutritional factors that affect the use of CSM in catfish rations including protein energy fat gossypol and synthetic amino acids They were then asked to indicate their perception of the overall feeding value of a standard 41 protein CSM compared to that of a standard 44 protein soybean meal Just as for poultry these Questions were designed primarily to determine the extent of knowledge among catfish feed formulators concerning these factors as they relate to the use of CSM and the relative feeding value of CSM
Sample members were asked to respond to two Questions regarding protein in catfish feed rations They were first asked to indicate the specific protein-related factors that they consider when balancing rations for catfish They were given the same list of three factors (crude protein level amino acid content and amino acid availability) to choose from that the poultry sample members were given Again they were also allowed to specify any other protein-related factors they consider when balancing catfish rations They were then asked to indicate the crude protein levels they would prefer for CSM and were given the same choice of four levels as the poultry sample members (36 41 (standard) 44 and 48) and allowed to suggest any other preference for crude protein level In contrast to poultry the largest percentage of catfish respondents indicated that they consider amino acid availability (10 of the 11 catfish respondents) rather than the content when balancing catfish rations (Table 134) The second largest percentage consider crude protein level (9 respondents) also a different result from poultry
21
With regard to the crude protein level for CSM preferred by catfish respondents about 43 indicated a preference for 48 crude protein (Table 135) About 20 of the respondents were satisfied with the standard 41 level and nearly 30 indicated a preference for a 44 protein CSM No respondents preferred anything less than the standard 41 The mean preferred crude protein level was about 42
With respect to energy levels the catfish sample members were asked to indicate what they considered to be the normal maximum and minimum energy levels for protein feeds for fingerlings grow out stock brood stock and fries Despite the low number of catfish respondents the answers to this question were widely divergent (Table 136) For fingerlings the maximum (in K Cals DE per pound) ranged from 1250 to 1800 and the minimum from 2 to 1500 with a mean maximum of 1525 and a mean minimum of 834 For grow out stock the maximum (in K Cals DE per pound) ranged from only 1500 to 1600 and the minimum from 1 to 1300 with a mean maximum of 1550 and a mean minimum of 750 For catfish brood stock the maximum (in K Cals DE per pound) ranged from 1300 to 1700 and the minimum from 1200 to 1400 with a mean maximum of 1500 and a mean minimum of 1300 For fries the maximum (in K Cals DE per pound) ranged from 1250 to 1800 and the minimum from 900 to 1500 with a mean maximum of 1525 and a mean minimum of 1200 Given the disparity in these responses it seems clear again for catfish feed formulators that there is little common concept of the normal maximum and minimum energy levels for protein feeds
Catfish sample members similarly were asked to indicate the minimum and maximum fat levels they considered critical for protein feeds As with poultry the range of responses was still quite wide but there also appeared to be more uniformity in responses to this question than the one for energy level (Table 137) The maximum fat levels (ether extract as fed basis) indicated by the respondents again ranged from 1 to 15 for most catfish types as was the case for poultry The mean minimum levels of fat for all catfish types ranged from about 3 to 5 The mean maximum ranged from 6 to 10 aCrOSS the different catfish types
Catfish sample members were also asked to indicate the level of gossypol they considered safe for catfish rations The responses again varied widely from a low of 0 ppm up to a high of 300 ppm for some catfish types (Table 138) The two highest mean safe levels of gossypol were 97 ppm for grow out stock and 83 ppm for brood stock For fingerlings and fries the safe maximum mean levels were much lower at 44 ppm and 23 ppm respectively
The questionnaire also asked the sample members to indicate if they use or would use synthetic amino acids where economical The response was that 83 (all but 2) of the catfish respondents indicated that they have or would use synthetic amino acids in this situation (Table 139) This suggests little real aversion on the part of feed formulators to utilize synthetic amino acids in least cost catfish formulations
To obtain some insight on the general perception of catfish formulators regarding CSM the sample members were asked to indicate their opinion of the overall feeding value of a standard 41 protein CSM compared to that of a standard 44 protein soybean meal expressed on a percentage basis They were given a choice of 5 ranges from under 70 of the feeding value of soybean meal to over 100 in 10 increments (see Table 140 for the actual ranges used) All but one of the catfish respondents indicated that CSM has an overall feeding value of under 90 of that of soybean meal Given the five choices offered to respondents the mean feeding value of CSM relative to that of soybean meal was around 80
22
Sources of Information UtiJized on Formulating Catfish Feeds
Only about half of the catfish respondents indicated that they were familiar with research on feeding CSM to grow out stock and only a third were familiar with research on fingerlings (Table 141) Only 2 respondents were familiar with any research on feeding CSM to brood stock and fries To obtain information on formulating feeds for catfish the largest number of respondents indicated that they utilize university research and industry publications of some type (Table 142)
Cottonseed Meal Price and Value
Catfish sample members were also asked two Questions to get some idea concerning their perception of the value of CSM particularly with respect to soybean meal 1) if they would be willing to pay a premium per unit of protein for CSM with more than a standard 41 protein and 2) if gossypol and fiber were sufficiently low on average what percent of the cost of soybean meal would they be willing to pay for CSM
With respect to the first Question 75 of the catfish respondents indicated a willingness to pay a premium for a CSM with more than 41 protein which is consistent with their earlier responses that they would prefer a CSM with a higher crude protein level (Table 143)
In response to the second Question catfish respondents indicated that they would only be willing to pay an average of about 82 of the cost of soybean meal for a CSM with a sufficiently low level of gossypol and fiber (Table 144) The range around that average was more narrow than for poultry from 70 to 100 This is more consistent with the ratio of CSM price to soybean meal price that has existed over the last 7 or 8 years on average
Suggestions for Improving the Usefulness of Cottonseed Meal
Only three catfish respondents offered suggestions for improving the usefulness or value of CSM for catfish rations The three suggestions included I) providing a more consistent product in price and Quality 2) providing a premium Quality toxin-free high protein low-fat product superior to soybean meal and 3) eliminating the CHO fraction (Table 145)
Comparisons Among Animal Species
In order to highlight the salient differences in responses with respect to the various animal species the mean responses to Questions that are common among all surveys regarding CSM use as a feed ingredient were compared and analyzed An analysis of variance (ANOY A) was also done to detect statistically significant differences in the mean responses to each Question by animal specie Comparisons are made among the mean responses to all Questions in the 6 general areas to which all sample members were asked to respond regardless of the animal specie(s) for which they formulate feeds 1) the particular factors affecting their choice of dietary proteins for formulated feeds 2) the extent to which CSM is considered to be an alternative to selected protein feeds 3) the importance of nutritional and non-nutritional factors in their decisions to use CSM rather than alternative dietary proteins in their feed formulations 4) the seasonality of CSM availability 5) the specific reasons for the selection and non-selection of CSM for use in the feeds they formulate and 6) the source of CSM chemical analyses used by the respondents Where appropriate ANOY A results are also indicated
23
Factors Affecting Choice of Dietary Proteins
As discussed earlier all members of the final sample regardless of the animal species for which they formulate feeds were asked to rank the importance of four general factors in their choice of a dietary protein for their feed formulations on a scale of I to 7 (from extremely unimportant to extremely important respectively) 1) quality 2) price 3) availability and 4) consistency Comparing the results across animal types reveals few significant differences in the importance attached to any of the four factors by the responding formulators of the various animal specie feeds (ie comparing results horizontally in Table 146) But as pointed out in an earlier section the mean rankings for quality are all higher than those for the other factors while the mean rankings of price are all lower than those for most other factors across all animal types In other words the respondents consistently ranked quality highest on the scale of importance followed in order by consistency availability and price
Cottonseed Meal As An Alternative Protein Feed
Recall that the sample members were asked to rank various selected protein feeds on a scale of 1 to 7 as inferior or superior to CSM in an overall sense for use in feed formulations A second question required respondents to indicate whether or not they considered CSM to be an alternative to each of the 20 listed protein feeds A comparison of the mean ran kings and ANOV A results across animal types indicates substantial agreement among the respondents regarding the ranking of CSM as an alternative to some animal feeds and substantial disagreement with respect to CSM as an alternative to many others (Table 147) Respondents over all animal types tended to agree that certain feeds and in particular the higher crude-protein-content feeds are clearly superior to CSM including dried skim milk meat and bone meal fish meal blood meal soybean meal dried whole milk and corn gluten feed There was a statistically different deviation in the extent to which respondents for some animal species regarded those meals as superior however For example catfish respondents ranked meat and bone meal fish meal poultry by-products blood meal soybean meal and corn gluten meal higher than did respondents for the ruminant animals The same was roughly the case for poultry Beef and dairy cattle respondents tended to rank all other protein feeds as less superior (ie more inferior) to CSM There was also substantial agreement that CSM was about the same as tankage peanut meal linseed meal and brewers and distillers dried grains but superior to some extent over the other feeds particularly those lower in crude protein including dehydrated alfalfa sunflower meal wheat middlings safflower meal canola meal feather meal and urea Beef and dairy cattle respondents agreed that CSM can be considered an alternative to nearly all the protein feeds except perhaps skim and whole dried milk Poultry and catfish respondents indicated CSM is an alternative to fewer of the other protein feeds
The Importance of Nutritional and Non-Nutritional Factors
Respondents also ranked the importance of specific nutrition-related and non-nutritionshyrelated factors in choosing cottonseed meal as a component of the feeds they formulate on a scale of extremely unimportant to extremely important (a scale of I to 7 respectively) Comparing the mean rankings by the respondents reveals that poultry and catfish feed formulators clearly consider proteinshyrelated factors and gossypol level to be more important than do beef and dairy feed formulators (Table 148) Fiber level is also of more importance to formulators of catfish feed Interestingly the importance of fiber was not ranked significantly higher by poultry feed formulators than by beef and dairy cattle feed formulators At the same time aflatoxin was clearly ranked by all respondents as the most important factor affecting the choice of CSM as a feed ingredient irrespective of the animal specie for which the ration is intended
24
For the non-nutritional factors an analysis of the mean rankings indicates few significant differences in the responses across animal species with respect to each individual factor listed (Table 149) The most notable exception is that poultry respondents ranked palatability significantly less important than did any of the other respondents for the other animal species Finally catfish respondents perceived that service by the CSM industry was more important for them than did the respondents for the other animal species
Seasonality of Cottonseed Meal Availability
The respondents across all animal species indicated that CSM is least available between about May and October likely reflecting the increasing shortages of cottonseed meal supply just prior to the cotton harvest in the fall (Figure 20) At the same time however the beef cattle dairy cattle and poultry respondents all indicated that there is less need for CSM to be available during approximately those same months in order to compete effectively with other protein feeds (Figure 21) This suggest that the seasonality of supply may not represent an important constraint to competitiveness and growth possibilities of CSM as a feed ingredient Interestingly catfish respondents suggested a largely inverse pattern of the times of the year when CSM needs to be available to compete effectively with other protein feeds as a catfish feed ingredient Possible explanations of this phenomenon include I) the protein feed needs of catfish feed formulators peak in the late spring and summer months when supply is less available 2) catfish feed formulators are located such that CSM is not easily obtainable particularly during short supply years or 3) formulators of feed for other animal species have longer experience in using CSM and have adjusted their formulation to the pattern of CSM supply availability In any case it should be remembered that there are relatively few catfish feed formulators in the sample so that their joint responses may not be truly representative of all catfish feed formulators In this case this difference in their responses may mean little
Reasons for the Selection and Non-Selection of Cottonseed Meal
Respondents across animal species were quite consistent in their ranking of the top reasons that CSM is included in feed formulations (Table 150) They overwhelmingly ranked price as the top reason followed generally by availability and protein quality Catfish respondents differed somewhat from that order ranking protein quality second and palatability as third Availability was ranked fourth by catfish respondents The top reason all respondents listed for which CSM is not included in feed formulations was also price (Table lSI) Beef and cattle respondents ranked availability as second but poultry respondents ranked gossypol second while catfish respondents ranked protein quality second A vailability ranked only as the third reason that CSM is not selected by poultry respondents and fourth by catfish respondents Gossypol ranked either third or fourth for all animal species except poultry for which gossypol appears to be a more important reason for not including CSM in poultry feed formulations The question regarding the characteristics of CSM that would have to change in order for it to be selected more frequently as a feed ingredient elicited about the same responses as those for the previous question concerning why CSM is not included in feed formulations (Table 152) The top characteristic that would have to change in the opinion of most respondents is price Catfish respondents however listed price extremely low on their list suggesting that other factors are more of a constraint to CSM use in their opinion They ranked gossypol as the number one characteristic that would have to change Availability appeared to be more of a concern to beef and dairy feed formulators than for poultry and catfish formulators
25
Source of Chemical Analyses for Cottonseed Meal
About the same percentage of respondents across animal species perform analytical tests for aflatoxin crude protein fat fiber and gossypol (Figure 22) The only noticeable differences were for aflatoxin and gossypol for which about half the percentage of dairy and beef respondents compared to catfish respondents reported that they routinely perform tests A higher percentage of poultry respondents also appear to perform tests for aflatoxin and gossypol than is the case for beef or cattle respondents Crude protein is tested for by the highest percentage of respondents for all animal species while gossypol is tested for by the smallest percentage of all respondent groups except catfish CSM suppliers are more likely to provide feed formulators with analytical values for crude protein fat and fiber than for aflatoxin or gossypol (Figure 23) A sizeable percentage of the respondents across all animal types reported that their CSM supplier provides no analytical values whatsoever
Summary ofMajor Findings
Of the reams of information normally provided by a study like this relatively little is usually new or profound And of what can be found that appears important only some is little more than interesting or particularly useful Before turning to a discussion of the implications of the study results the major findings across animal groups are briefly summarized first Sifting through the many tables figures and data sets the main findings of the study appear to be the following
bull Quality is the most important factor affecting the choice of dietary proteins by feed formulators followed by consistency and availability Price is the least important of the four factors in making general decisions regarding dietary proteins for animal diets
bull Once feed formulators have set the general parameters for use of dietary proteins in their formulations however price is the most important factor determining the choice among alternative dietary proteins to satisfy the general parameters for dietary protein use in feed formulations
bull When considering whether or not to use CSM as the dietary protein in feeds the nutritional factors of most concern to formulators of feed for non-ruminant animals (poultry and catfish) appear to be protein-related For formulators of ruminant (beef and dairy cattle) feeds aflatoxin level and rumen degradability are the most important nutritional factors
bull The most important non-nutritional factors affecting feed formulators decisions regarding whether or not to use CSM are I) price 2) availability 3) consistent quality and 4) palatability in that order
bull Non-nutritional factors are more important than nutritional factors in the choice of CSM over alternative feeds to fill the dietary protein requirements of feed formulations In general price and availability were ranked above protein quality and other nutrition-related factors as reasons why CSM is and is not chosen as a feed ingredient over alternatives Price and availability were also cited as the characteristics that most need to change in order for CSM to be selected as a feed ingredient more frequently
bull CSM is generally considered to be inferior to higher protein feedstuffs and superior to lower protein feedstuffs This generalization however does not hold for all feeds and all animal types Formulators of ruminant animal feeds ranked many of the higher protein feeds more on a par with CSM than did formulators of non-ruminant animal feeds
26
bull The seasonality of CSM availability is both a positive and a negative factor affecting the use of CSM rather than alternative protein feeds in animal feed rations That is CSM is obviously more likely to be selected as a feed ingredient during months of greater availability than during the months of lower availability In general however the survey responses indicate that CSM is normally available when feed formulators perceive that it needs to be available One word of caution It may be that a higher percentage of CSM users agreed to participate in this survey than those who are currently not using CSM Those who are current CSM users may well have already adjusted their feed purchasing patterns and operations to reflect the seasonal changes in the availability of CSM Consequently current CSM users may perceive less of an availability problem than those who are not currently using CSM In this case the responses to these questions may not be truly representative of the perception of the availability of CSM by feed formulators in general
bull There is a tremendous disparity in the perception of respondents as to the appropriate levels of several key nutrition-related factors for specific livestock rations including energy levels fat levels gossypol levels and escape values (ruminants only) for cottonseed meal For each animal specie the range of variation in the perceived acceptable levels of each of these factors was extremely wide The obvious conclusion is that feed formulators generally lack adequate and reliable information on many factors which are crucial in efficient feed formulation and which have a significant impact on the choice of CSM as a feed ingredient
PROBLEMS AND OPPORTUNITIES FOR EXPANDING COTTONSEED MEAL USE
CSM is somewhat unique among vegetable protein meals in that it is the product of a byshyproduct The volume of the by-product cottonseed available for crushing and the potential supply of CSM depend more on the dynamics of cotton supply and demand than on forces specific to CSM markets This mean that market signals from feed formulators and livestock feeders regarding desired values and characteristics of protein meals likely have little impact on the potential CSM market supply
Since the mid-1970s the share of the annual production of cottonseed fed directly to ruminant livestock has increased steadily from about 5 in 1974 to nearly 40 in 1990 (Figure 24) The consequence has been a marked decline both in the share of the available supply of cottonseed that is crushed and in the ratio of actual to potential cottonseed meal output An increase in the demand for CSM therefore will either bid up the market price of CSM with no additional volume actually used or increase the cottonseed crush to feed use ratio (or some combination thereof) There will be little or no effect on the total amount of cottonseed available
The intent of efforts to expand the market for any commodity is to effect an increase in sales at a higher price For a commodity with a relatively fixed supply the major result of an expansion in demand is solely an increase in price because supply cannot increase to allow an increase in use For a commodity with an unlimited supply successful market expansion efforts simply increase use to the extent of the promotion with no increase in price For a commodity with a supply somewhere in between those two extremes successful market expansion will increase both the price and quantity used Although the situation for cottonseed meal is closer to the fixed supply end of the spectrum market expansion efforts can increase the use of cottonseed meal through an increase in the crush-toshy
27
feed cottonseed use ratio This ratio will increase as the profitability of crushing vs alternative uses of the seed increase
The results of this survey however indicate both some problems and possible opportunities for expanding cottonseed meal use After briefly summarizing the major obstacles as identified in the study the major opportunities for expanding use of cottonseed meal will be discussed
Problems for Expanding Cottonseed Meal Use
The major problems for expanding CSM use are generally well known and verified by the survey results The major problems that would hinder efforts to expand cottonseed meal use identified in the study included primarily the following
bull Price and availability of CSM are the major factors affecting the selection or non-selection of CSM as an ingredient of feed formulations regardless of animal specie These nonshynutritional factors were judged to be more important than nutritional factors in selecting CSM as a feed ingredient Unfortunately neither the price nor the availability of CSM can be controlled or altered substantially or directly by market expansion efforts Some efforts to improve availability may be possible as discussed in the next section
bull CSM is perceived to be inferior in an overall sense to a number of key protein feeds CSM was judged by the survey respondents to be clearly superior in aggregate to only 5 of 20 potential alternate protein feeds Such an image could work against efforts to expand CSM use
bull Gossypol level is one of the top reasons that CSM is not used more frequently particularly in non-ruminant feed rations The level of gossypol is a unique characteristic of CSM that obviously cannot be changed through market expansion activities
bull Several other specific characteristics of CSM would likely need to change for CSM to be selected more frequently as a feed ingredient including amino acid balance energy level aflatoxin level and protein quality As with gossypol changes in these characteristics are out of the realm of market expansion programs
bull Feed formulators generally lack adequate and reliable information on many factors which are crucial in efficient feed formulation and which likely have a significant impact on the choice of protein feedstuffs The use of CSM in livestock feed rations is likely restricted by the wide disparity in the perception of feed formulators regarding the appropriate levels of several key nutrition-related factors for specific livestock rations including energy levels fat levels gossypol levels and escape values (ruminants only) for cottonseed meal
bull Over 75 of dairy cattle feed formulators and nearly half of beef cattle feed formulators utilize whole fuzzy cottonseed to some extent in some of the feed rations they formulate Relatively few reported using utilizing both CSM and whole cottonseed in the same ration A main attraction of the use of whole fuzzy cottonseed as opposed to cottonseed meal is the fiber content Indeed the use of whole delinted cottonseed in cattle feed rations is much lower
28
Opportunities for Expanding Use of Cottonseed Meal
There are essentially only two basic tools to expand the market for any commodity l market development and 2) enhancing the efficiency of the marketing system Market development involves a wide range of activities including primarily new product development and product differentiation In new product development the effort is to develop new products or characteristics of products that appeal to different segments of consumers An example might be research leading to the elimination of gossypol in cottonseed meal which could further open up the non-ruminant feed industry to cottonseed meal
Product differentiation on the other hand encompasses those activities designed to create a user preference for or loyalty to a commodity Product differentiation occurs in two major forms 1) advertising and 2) variation in design and quality of product The primary purpose of advertising is to create user preference for a commodity and convince users of the superiority of a product over competing products Actual physical differences in the product are not necessary to successfully differentiate it from competing products It is sufficient only that users believe that some superiority exists Advertising often intends to create an image of superior quality because such images are harder to imitate or successfully counter than physically unique features Successful differentiation of a product means that users become less sensitive to price changes more willing to pay a higher price for the same quantity because they prefer the product and are loyal to it in the face of price increases In other words users are willing to pay more for the same amount because advertising if successful creates a preference for the product over competing products
Variations in quality and design are usually used along with advertising to differentiate the product of one seller from that of another Such variations are often necessary to help create the superior images desired andor attract new sets of consumers
Often barriers exist in a marketing system that hinder the efficient functioning of the market and restrict the flow of commodities from sellers to users Enhancing the efficiency of the marketing system through eliminating such barriers can lead to an expansion in the use of a commodity One of the primary requirements of an efficiently functioning market is that sellers and users possess adequate and accurate information regarding the product its characteristics availability sources uses and value among other things Inadequate or inaccurate information regarding a particular product and other market characteristics can divert demand to alternative products with which users may be more familiar regardless of whether or not those products are better in some sense
The concept and importance of enhancing market efficiency in this regard can be illustrated by comparing the flow of information about a product and market conditions with a radio broadcasting system The efficiency of such a system depends on how accurately the microphone and other equipment record sound how accurately and rapidly that sound is transmitted to a radio receiver and how accurately the receiver brings sound to the listener A breakdown anywhere along the line in that system will simply mean that the message of the broadcast does not get from the radio station to the listener Also if the message gets through but static interferes with the transmission the listener might only receive part of the message or a garbled message The listeners impressions and actions consequently might be quite different than if he had received the message intended In quite the same manner the flow of a commodity from producers to users is affected by how rapidly and accurately market information is evaluated and how accurately and rapidly this information is transmitted to and among producers and users Any breakdown or static in the system would result in a smaller and more obstructed flow of the commodity to users than if the market operated more efficiently
29
The survey results suggests possible opportunities for expanding CSM use through market development and enhancing market efficiency Market development opportunities may be limited because of the nature of the CSM supply situation Nevertheless expansion of CSM use is possible through a reduction in direct feeding of cottonseed so that opportunities for expanding use through market expansion efforts should not be discounted Efforts to enhance the adequacy and accuracy of information regarding the use of CSM as a feed ingredient however may well be the most effective means of promoting an expansion of use or enhancement of the value of CSM
Opportunities for Expansion through Market Development
Although many product development opportunities likely exist for CSM the survey basically focused on the image of CSM in the perception of feed formulators If a market development approach to expanding the use of CSM as an ingredient of animal feed formulations has any chance of success the survey results suggest that the following components of such a strategy will be crucial
bull Product quality and consistency and an improved image of availability must be the major targets of promotion efforts The survey responses across all animal types unequivocally indicated that these three factors are the prime considerations in making general decisions regarding dietary proteins for animal rations Price only becomes a factor in specific decisions regarding the particular protein feed to use to fill the dietary protein requirements of feed formulations after these general concerns are addressed Creating an image of quality consistency and availability for CSM is a necessary first step to expanding use and enhancing value
bull CSM use expansion efforts must focus to some extent on reducing the direct feeding of whole cottonseed to beef and dairy cattle Reductions in direct feeding is the only chance for an increase in supply of CSM to fuel expanded use in newer markets such as catfish and poultry feeding Also because beef and dairy cattle are major users of cottonseed meal a decrease in feeding of whole cottonseed in favor of CSM would significantly expand use
bull Separate CSM market promotion messages must be developed to address the very different needs and concerns of ruminant vs non-ruminant feed formulators The survey results clearly indicate that many nutritional and non-nutritional factors are more important for nonshyruminant feed formulators than for ruminant feed formulators and vice versa
bull The nutrition-related content of CSM market promotion messages must emphasize primarily positive aspects of CSM protein quality amino acid balance and amino acid availability as well as an accurate understanding of appropriate gossypol and aflatoxin levels Many of these factors however are more important for non-ruminant rather than ruminant feed formulators which must be accounted for in designing appropriate messages for feed formulators of each animal type
bull The non-nutrition-related content of CSM market promotion messages may well be the most important and must emphasize primarily the positive aspects of price availability consistency of quality and storability The survey results attached a relatively high level of importance also to nutrient guarantees Although not scoring particularly high in the responses services available from the CSM industry may also be a helpful component of CSM use promotion messages
30
Opportunities for Expansion through Market Emciency Enhancement
Even though some gains in CSM use and market value can reasonably be expected through market expansion efforts the cost involved could easily outweigh any benefits in terms of enhanced profits to the CSM industry Perhaps the most cost-effective appropriate and useful means of enhancing the use of CSM would be a strategy aimed at improving the level and accuracy of information available regarding CSM and its use Lack of information or misinformation can easily discourage feed formulators from using CSM in their feed formulations Strategies to enhance the quantity and accuracy of appropriate information can take on many forms from media advertising to market news letters Although it is beyond the scope of this study to develop alternative information strategies the results of this study clearly indicate a number of areas in which enhanced and more accurate information is a critical need These include the following
bull The overall quality of CSM The study suggests that the negative aspects of CSM are well known Less well known are the specific positive aspects of CSM that may give it an edge in some sense over other protein feeds
bull The ideal ratio of the price of CSM to other feeds like soybean meal The study results indicate that feed formulators may not be adequately informed about what the ideal market value of CSM is relative to soybean meal given the differences in feeding value As a consequence CSM may currently be less used in relation to soybean meal than current market price ratios suggest should be the case
bull Protein-related factors for CSM use in non-ruminant feeds These factors are a major concern in the decisions of feed formulators to include or exclude CSM in feed rations
bull The relationship of aflatoxin to CSM and the rumen degradability of CSM particularly for beef and dairy cattle feed formulators These were the nutritional factors of greatest concern to ruminant feed formulators in the decision to include CSM in their feed formulations
bull CSM price availability consistency and palatability These were indicated to be the most important non-nutritional factors affecting feed formulators decisions regarding whether or not to use CSM The study indicates that information on non-nutritional factors may be more important in the decision to use CSM over alternative feeds to fill dietary protein requirements of feed rations than information on nutritional factors
bull The feeding value of CSM relative to alternative protein feeds An accurate and detailed assessment of the extent to which CSM may be superior as an alternative to other standard protein feeds would help position CSM appropriately in the market
bull The appropriate and acceptable levels of several key parameters affecting the use of CSM in animal feed rations including energy levels fat levels gossypol levels and escape values (ruminants only) Feed formulators generally lack adequate and reliable information on these and likely other parameters not included in the study which are crucial in efficient feed formulation and which have a significant impact on the choice of protein feedstuffs Although it appears that nearly all feed formulators routinely perform crude protein analyses few perform analyses for aflatoxin gossypol fat fiber and other parameters Also CSM suppliers are apparently doing an inadequate job currently of providing such information to feed formulators
31
SOME CONCLUDING COMMENTS AND RECOMMENDATIONS
This study assessed the potential problems and opportunities for expanding the use of CSM through an analysis of the perceptions of feed formulators regarding the use of CSM as an animal feed ingredient The perceptions of feed formulators regarding CSM as a protein feed largely define the boundaries within which CSM use will be able to achieve any significant growth in the future Their perceptions right or wrong are the key to understanding not only the problems facing CSM use but also the opportunities
The general conclusion of the study is an obvious one the use of CSM in feed formulations faces some major challenges in the future Chief among these include a perception among feed formulators that price availability quality and other key CSM characteristics are often obstacles precluding increased use of CSM in their feed formulations Perhaps the most important implication of the study is that a serious lack of adequate and accurate information among feed formulators regarding the characteristics parameters value and other aspects of cottonseed meal use in animal feed rations may be seriously restricting the market opportunities for cottonseed meal U nfortunately the development of alternative strategies to expand the use of CSM and enhance the efficient functioning of CSM markets through more accurate and available information on all aspects of CSM use in feed formulations is beyond this study Nevertheless a few recommendations pertinent to the development of such alternative strategies are in order
bull Before adopting any approach to expand the use of CSM it would be useful first to conduct a detailed analysis of the costs and benefits involved Market promotion efforts through advertising can be extremely costly and yield relatively little Research has also shown that there is often a tremendous lag between advertising and promotion expenditures and any associated returns It could take years of investment in such market expansion efforts before an accurate measurement of the actual return on investment could even be attempted
bull Consider developing first a detailed plan for information dissemination to the feed industry regarding all appropriate aspects of CSM use in feed rations as determined in this study An important part of this process would be a comprehensive assessment of the information needs and the information resources readily available The gap discovered in this way between needs and resources will help set the research agenda for the industry to fill the critical existing information gaps
bull Initiate a study of final user attitudes and perceptions of CSM use as a guide to future market expansion efforts This study considered only the perceptions of feed formulators regarding the use of CSM But feed formulators are often not the final users Consulting nutritionists for example often include or exclude certain feeds and feed types from their formulations as requested by feed users At least a few of the respondents to the survey conducted for this study indicated that user preferences are major factors determining whether or not CSM is included in their feed formulations Indeed markets operate as the interaction of supply and demand to determine prices The preferences of final users ultimately will be expressed in the market values of any product in any market unless sufficient obstacles exist to prevent the market from functioning properly Therefore the real decision-makers in the use CSM in the market may well include many more individuals than adequately represented by feed formulators
32
REFERENCES
US Department of Agriculture (USDAa) Feed Situation and Outlook Report Economic Research Service FDS series various issues
US Department of Agriculture (USDA b) Oil Crops Situation and Outlook Yearbook Economic Research Service OCS Series various issues
Figure 1 Quantity of Oilseed Meals Fed to Livestock 194849 - 198590 (Average)
(1000 Tons)
25000 0-1-----------------------shy
20000 I-~
15000
10000
5000
o L 1 J tJ t tmiddotmiddotmiddot 1 oj 1 to bullbull 1 L_ n __LLL I 1 bullbull I V I
1948-49 1950-54 1955-59 1960-64 1965-69 1970-74 1975-79 1980-84 1985-90
(Years)
n iflu Soybean Meal bull Cottonseed Meal Other Oilseed Meals
Source USDA
c
8 c a CD
en ~
--I _ scg ~CD 01)-- en - () mg0 s 0
JCD enOJ CD_CD en 0
sCDCD 0 OJ shyo OJ r Jlt- 0 m CJ) 0 0lt o 0shyCD OJ J
~s ~m cpCJ) r co OJco ~m a
Figure 3 Price Premium (+) or Discount (-) of Cottonseed Meal Relative to Soybean Meal 1956-1990
~~ ~
o I ~ I I
-20 f---
-40
-60
1~1~1~1~1~1~1~1~1~1~1~1~1~1~1~1~1~1~
Cottonseed meal price is adjusted to a soybean meal protein equivalent basis
~I------------------------------------------------------
l l A
I~middotmiddot--- --------
Figure 4 Animal Species for which Respondents Formulate Feeds
DAIRY CATILE
BEEFCATILE
HORSES
SHEEP
BROILERS
LAYERS
OTHER
PETS
TURKEY
SWINE
CATFISH
210
21000
0 5 1000 15 20 25
Figure 5 Respondents Formulating Feeds for the Various Animal Species
0 20 40 60 80
Figure 6 Other Animal Species for Which Respondents Formulate Feeds
DAIRY CATTLE
BEEF CATTLE
HORSES
SHEEP
BROILERS
LAYERS
OTHER
PETS
TURKEY
SWINE
CATFISH
632
Exotics
Trout
Alligators
KOI
Breeding Hens
Wildlife
Rabbits
Avian
Shrimp
Salmon
Ducks
Fish
Gamebirds
Hybrid Bass
379
~--~----~--~----~----~--~----~--~----~--~
0 10 20 30 40 50
Figure 7 Respondent Feed Formulation Activities by State
( of Respondents)
o 00 middot15 16 -30 31 middot45Cgt 46 -60 61 - 75 - 76 -90
Table 8 Respondent Experience as an Animal Nutritionist
( of Respondents) 30 r---shy
25 t-middotmiddotmiddotmiddotmiddotmiddotmiddotmiddotmiddotmiddotmiddotmiddotmiddot-middot ---_ _
20 -_ -nNItshy
15
10
5
0 1-5 6-10 11-15 16-20 21-25 26-30 31-35 36-40 41-45
(Years Of Experience)
-it sa 0 m 8 l 0 CD l g
_ cc c -s CD CObull
-0 -s- 3 Dl ~ IJ CD (fJ
C 0 l C CD l -+
raquo Sl_ lt_ -+_ CD (fJ
Figure 10 Respondent Primary Feed Formulations
by Animal Type 1990 (Percent)
30 I--------------------------------------------------------shy
25 r- middotmiddotmiddotmiddotmiddotmiddot231middotmiddotmiddotmiddot
20
15
10
5
0 Beef Dairy Swine Poultry Horses Pets Aqua- Sheep Exotics
Cattle Cattle culture amp Goats
(Animal Type)
Figure 11 Percent of CSM and S8M Used in Formulations by Feed Manufacturer Respondents 1990
( of Average Feed Ration)
Figure 12 Tons of Feed Formulated by Feed Manufacturer Respondents 1990
65
91
6 9
17
Total Formulations Formulations With CSM
II Less than 200000 Tons
II 200000 - 400000 Tons bullbullbull I bullbullbullbullbullbull ~ 3 ~ 400000 - 600000 Tons
5 rn 600 000 - 800 000 Tonsru 1
[] 800000 - 1000000 Tons9 4
I ~ 1 More Than 1000000 Tons
Formulations With S8M
Figure 13 Percent middotof Beef Cattle Respondents Formulating CSM Feeds for Specific Beef Cattle Types
( of Respondents)
25 ~I------------------------------------------------------~
-Isectig Feedlot-II 223
20
15
10
5
0
bull Other
~ middotmiddotmiddotmiddotmiddotmiddotmiddot middotmiddot _middotmiddotmiddotmiddot-=middotmiddotmiddotccmiddotcmiddotmiddot
Brood Cows Bulls Calves Feeder Heifer Stocker
(Animal Type)
Figure 14 Percent of Dairy Cattle Respondents Formulating CSM Feeds for Specific Dairy Cattle Types
( of Respondents)
120 ----------------------
100 88
80
60
40
20
0 Calves Heifers Lactating Cows Dry Cows
(Animal Type)
Figure 1-5 Percent of Poultry Respondents Formulating CSM Feeds for Specific Poultry Types
( of Respondents)
OO~I--------------------------------------------~-
50 1-laquolaquolt--laquolaquolaquo -lt - lt - lt -lt laquo lt
44
40
30
20
10
0
f-
~laquolaquolaquolaquo
~laquolaquolaquolaquolaquolaquo
Broilers Layers Turkeys Breeding Flocks
(Animal Type)
Figure 16~ Combined Responses Months of the Year When CSM IS NOT Available
( of Respondents) 16 i ---
14 12~8
12
10
87373 7
6
4
2
0 ~~ ~s ~( ~( ~0( ~0(~~~ ~~ ~t ~1 u~ ~g n0~ ad-o N0~ ~a~
~Y ~o Q~lmiddotr
(Month)
Figure 17 Combined Responses Months of the Year When CSM Needs to Be Available
( of Respondents) 12 ---------------------------
10
8
6
4
2
0
goA 9
~ui ~s ~Ot X)Ot ~Ot X)Ot~0SV~0~~erl ~iSclt ~f ~~1 ~v~ ug ~o~ o~o NO~ co~0 0lt609 ~o
(Month)
Figure 18 Beef Cattle Responses Percent of Respondents Formulating Creep Feed for Calves or Supplements for Stockers
733
832
0 20 40 60 80 100 120
( of Respondents)
Figure 19 Beef Cattle Responses Protein-Related Factors Considered When Balancing Rations
Other Protein Factors 110
Rumen
Degradability 686
Crude Protein Level 161
Amino Acid
Values 42
( of Respondents)
Figure 21 Comparison of Responses Months When CSM Needs to Be Available
( of Respondents) 94 ---------------------------shy
92
9
88
86
84
82 8
78
76
74
72
7
68
66
~ euroI - It
64 -t----------------------------------- -----------t
JAN FEB MAR APR MAY JUN JUL AUG SEP OCT NOV DEC
(Month)
bull Beef Cattle -t Dairy Cattle ltgt Poultry Catfish
Figure 20 Comparison of Responses Months When CSM Is Not Available
( of Respondents)
16 t 15
14
13
12
11
10
9
8ltl amp
7
6
5 I JAN
I
FEB I
MAR I
APR I
MAY I
JUN I
JUL I
AUG SEP I
OCT NOV I
DEC
(Month)
bull Beef Cattle -t Dairy Cattle ltgt PouHry b Catfish
Figure 22 Comparison of Responses Analyses Routinely Performed
( of Respondents)
100~-----------------------------------------------
90
80
70
60
50
40
30
20
10
o I ~
AFLATOXIN C PROTEIN FAT FIBER GOSSYPOL OTHER NONE
(Analyses)
bull Beef Cattle Dairy Cattle o Poultry Catfish-t fj
Figure 23 Comparison of Responses Analytical Values Provided by Supplier
( of Respondents)
60shy
50
4)
30
20
10
o amp ~
AFLATOXIN C PROTEIN FAT FIBER GOSSYPOL OTHER NONE
(Analyses)
bull Beef Cattle -t Dairy cattle o Poultry b Catfish
Figure 24 Share of Cottonseed Use Crush vs Feed Use
( of Respondents)
100 I
90
CRUSH 80
70
60
50
40
30
20
FEED USE 10
o 1~ 1~ 1~ 1m 1m 1~ 1~ 1~ 1~ 1~ 1~ 1~ 1~ 1~
(Year)
Source USDAb
Table 1 Percentage of Beef Cattle Feeds Formula ted Table 2 CSM Feeds Formulated for Beef Cattle CSMmiddot Calvesmiddot
middotAverage Response Rate (feedlot=51 other=41) middotResponse Rate = 39
Table 3 CSM Feeds Formulated for Beef Cattle Table 4 CSM Feeds Formulated for Beef Cattle Stockersmiddot
middotResponse Rate = 40
Response Rate =37
Table 5 CSM Feeds Formulated for Beef Cattle Table 6 CSM Feeds Formulated for Beef Cattle
middotResponse Rate =33
middotResponse Rate = 37
Table 8 Percentage of Dairy Cattle Feeds Formulated CSM
Average Response Rate =88
middotResponse Rate = 37
Table 9 CSM Feeds Formulated for Dairy Cattle Table 10 CSM Feeds Formulated for Dairy Cattle
RespooseRate 24
middotResponse Rate = 34
Table 11 CSM Feeds Formulated for Dairy Cattle Table 12 CSM Feeds Formulated for Dairy Cattle
Response Rate = 31 Response Rate = 45
Table 13 Percentage of Poultry Feeds Formulated Using CSMmiddot
bullAverage Response Rate = 79
Table 14 Percentage of Catfish Feeds Formulated Using CSMmiddot
bullAverage Response Rate =67
Table 15 CSM Feeds Formulated for Catfishmiddot )middoti middot fteq~
bullAverage Response Rate = 17
Table 16 Combined Responses Importance of Specific Factors in Choice of Dietary Protein ( of
bullAverage Response Rate =g]
Table 17 Combined Responses Other Important Factors in
bullAverage Response Rate = 22
bullAverage Response Rate =91
-Average Response Rate =90
Table 20 Combined Responses Importance of Non - Nutrition -Related Factors in Choice of CSM over Alternative Protein Feeds ( of
-Average Response Rate = 87
Table 22 Combined Responses Top S Reasons Why CSM IS NOT Selected as a Feed
Table 23 Combined Responses Top 5 Specific Characteristics That Would Have to Change for CSM to be Selected as a Feed
Table 24 Combined Responses Analysis Routinely Performed
Table 25 Combined Responses Analysis Values Provided
CSM
267 067 333 333 1400 S333
467 000 067 067 1400 4867 --shy
467 000 000 067 400 4333 --shy -- shy -- shy
250 000 000 000 1250 4000 -- shy --shy
313R 4733 62 ------ shy~ - shy ~-
4S00 62
bullAverage Response Rate = 100
bullAverage Response Rate = 87
Table 28 Beef Cattle Responses Imponance of Nutrition-Related Factors in Choice of CSM Over Alternative Protein Feeds
Average Response Rate = 91
Table 29 Beef Cattle Responses Other Nutrition - Related
Fact~~~~~~~~~~~~~~~~~~~
Response Rate =7
Table 30 Beef Cattle Responses Imponance of Non - Nutrition - Related Factors in Choice of CSM Over Alternative Protein Feeds
middotAverage Response Rate = 87
middotResponse Rate = 5
bullAverage Response Rate =14
Table 33 Beef Cattle Responses Months of the Year When CSM Needs to Be AvaiJable I ii middot middot1
bullAverage Response Rate =53
10 U
-Moy
JIIJ
All
so
0_ -
to
--I No
Moy
10 -so shy
0_ _ 0-
Table 35 Beef Cattle Responses Top 5 Reasons Why CSM Is Not Selected as a Feed
Average Response Rate =100 Response Rate = 24
Response Rate =28
Average Response Rate = 98
Response Rate = 17
middotResponse Rate =9
Table 43 Beef cattle Responses Type of Creep Feed
middotResponse Rate = 81
middotResponse Rate =26
Table 45 Beef cattle Responses Respondents Formulating Rations With CSM and Whole
middotResponse Rate = 68
Table 47 Beef cattle Responses Percentage of Whole Cottonseed Respondents Mix in Rations Containing Both CSM and Whole Cottonseedmiddot tCmiddotHiitjt~ middotmiddotmiddotmiddot1
middotResponse Rate =25
middotResponse Rate = 30
bull Response Rate = 98
Response Rate =11
Table 51 Beef Cattle Responses Escape Value Respondents Are Using for Rumen Degradabilitymiddot
1~iiii middotb~r~~fgtD zq436imiddotmiddotmiddotmiddotmiddotmiddotmiddot 004bullbullbullbullbullbullbullbullbullbull1----22--+----31-4
I~~I 23 329
middotResponse Rate = 57
Table 53 Beef Cattle Responses Methods or Sources Respondents Used to Calculate CSM
Table 52 Beef Cattle Responses Reliability of Escape Values Used
Table 54 Beef Cattle Responses Interested in Knowing Escape Values for CSM Processed
Valuemiddot
middotResponse Rate =98
)
I Mean ~nse
63 57S19 228381 Q-L_uu ~139 59468 32306 139bullII1 1 061 06
1 1 44 430 614431-------- 57t 001 001 middot-1
==~=-__~~1c9 00 _ 06 _ 001_ 38 133 323 63
Average Response Rate =100
Response Rate = 89
Table 58 Dairy Cattle Responses Importance of Nutrition - Related Factors in Choice ofCSM Over Alternative Protein Feeds (ofbmiddotNmiddotmiddotmiddotmiddotmiddotmiddot
Response Rate =88
Table 59 Dairy Cattle Responses Other Nutrition-Related Factors
Indicated br~~P211dents
Response Rate =10
Table 60 Dairy Cattle Responses Importance of Non- Nutrition - Related Factors in Choice of CSM Over Alternative
Protein Feeds ( ofResPOndents~dd
Response Rate = 88
Response Rate = 3
--
Average Response Rate = 51
Table 62 Dairy Cattle Responses Months in the Year When CSM IS NOT Available
10 u
J -- AIIIi
--~ shy
loOoIMr _ 0-
bullAverage Response Rate =69
--- AIIIi
--~ soM
0
0-_
10
Table 65 Dairy Cattle Responses Top 5 Reasons Why CSM IS NOT Selected as a Peed
Table 66 Dairy Cattle Responses Top 5 Specific Characteristics That Would Have to ro1 ____ for CSM to be Selected as a Feed
Table 67 Dairy Cattle Responses Analyses Routinely Performed fmiddotmiddotmiddotmiddot
Response Rate =96
Response Rate =56
Table 68 Dairy Cattle Responses Other Analyses
Response Rate =25
Table 70 Dairy Cattle Other Analytical Values CSM
Response Rate =4
Average Response Rate =81
Average Response Rate = 15
Table 73 Dairy Cattle Responses Respondents Formulating Feeds With Whole andor Delinted
Cottonseed bull
bullAverage Response Rate =92
middotResponse Rate = 40
Table 74 Dairy Cattle Responses Respondents Formulating Rations with Cottonseed Meal and Whole Cottonseed in the Same Rationmiddot
middotResponse Rate = 97
Table 76 Dairy Cattle Responses Percentage of Whole Cottonseed Respondents Mix in Rations
ltltJIltainin(a0th CSM and WhoeCottonseedmiddot Mean
middotResponse Rate = 42
Table 77 Dairy Cattle Responses Knowledge of Research on Feedine CSM
~~~~
Average Response Rate = 68
Response Rate =7
Average Response Rate =59
Response Rate =25
Average Response Rate =63
Response Rate = 13
middotResponse Rate = 92
Response Rate =82
Table 85 Dairy Cattle Responses Methods or Sources Used to Calculate CSM
Response Rate = 73
Table 86 Dairy Cattle Responses Respondents Interested in Knowing Escape Values for CSM Processed from Different Methodsmiddot fmiddotmiddotmiddotmiddotmiddotmiddot
Response Rate = 92
Response Rate = 34
Table 89 Dairy Cattle Responses Suggestions for CSM
Response Rate =33 Response Rate =22
-----
64 139 24815 00 36 511 5751
5951 131 438 35015 00 15 I-~~~~~
6200 15 423 51151 00 00 ~~~ -~~~ -~~~ ~~~-~~ --~~ ~ ~ ~~-~ ~
292 55125 00 00 125 45800
bullAverage Response Rate =99
Average Response Rate =85
Table 92 Poultry Responses Importance of Nutrition - Related Factors in Choice of CSM Over Alternative Protein Feeds (of
Average Response Rate =85
Table 93 Poultry Responses Other Nutrition-Related Factors Indicated
200
200
Response Rate = 5
Table 94 Poultry Responses Importance of Non - Nutrition - Related Factors in Choice of CSM Over Alternative Protein
Feeds~~~~~~~~~~5=~~~~~T7~~
00 Average Response Rate =83
Response Rate =4
Average Response Rate = 17
Table 97 Poultry Responses Months in the
J
p
April
lao
A
shy-- 0
ft
April
_
Average Response Rate = 43
=1 g L
0
Table 99 Poultry Responses Top 5 Reasons Why CSM IS NOT Selected as a Feed
Table 100 Poultry Responses Top 5 Specific Characteristics That Would Have to Change for
CSM to be Selected as a Feed Inoredient
Table 101 Poultry Responses Analyses Routinely
middotResponse Rate = 93
Table 102 Poultry Responses Other Analyses Routinely
Performed
middotResponse Rate = 27
Table 103 Poultry Responses Analytical Values Provided
middotResponse Rate =73
Table 104 Poultry Responses Knowledge of Problems
bullAverage Response Rate = 62
Average Response Rate = 14
Table 106 Poultry Responses Protein - Related Factors
Average Response Rate = 64
Table 107 Poultry Responses Other Protein - Related
Response Rate =11
Table 108 Poultry Responses Crude Protein Levels
Preferred for CSM
Response Rate = 55
Table 111 Poultry Responses Gossypol Levels Considered
Safe
Table 112 Poultry Responses Would or Do Use Table 113 Poultry Responses Relative Feeding Value of CSM Comoared to 44 SBMmiddot
middotResponse Rate = 96
bull Response Rate = 100
Table 114 Poultry Responses Knowledge of Table 115 Poultry Responses Familiarity with Other Feedino CSMmiddot
middotResponse Rate =7 bull Response Rate = 73
middotResponseRate = 31
bullAverage Response Rate = 58
Table 118 Poultry Responses Willingness to Pay
a Premium Per Unit of Protein for CSM With More
Than 41 Protein
bullResponse Rate =91
Table 119 Poultry Responses Percent of Cost of SBM Respondents Willing to Pay for CSM with
Response Rate =27
Response Rate =64
00 00 87 43 478 304 57 00 00
----shy I--~~
00 ~-~
43 522 348 59 ----shy
62~ 00 00 00 261 ----shy
652 ------shy
00 00 00 00 667 333 63 AverageResponseRate = 99
bullAverage Response Rate = 73
Table 123 Catfish Responses Importance of Nutrition - Related Factors in Choice of CSM Over Alternative Protein Feeds
Average Response Rate =83
Table 124 Catfish Responses Importance of Non- Nutrition - Related Factors in Choice of CSM Over Alternative Protein
Feeds
Average Response Rate = 90
bullAverage Response Rate = 13
Igt 20
s_
Pshy s
--s
H_
_
gt 7 bull bull bull bull bull
1 fsI plusmn -
haMr
N__
shy
bullAverage Response Rate =54
Table 128 Catfish Responses Top 5 Reasons Why CSM IS NOT Selected as a Feed
Table 129 Catfish Responses Top 5 Specific Characteristics That Would Have to Change for CSM to Be Selected as a Feed-_
Table 130 Catfish Responses Analyses Routinely Table 131 Catfish Responses Other Analyses Routinely Performed
middotResponse Rate = 25
middotResponse Rate =92
bullAverage Response Rate = 18
Table 133 Catfish Responses Knowledge of Problems Feedine CSM to CatflSh
Average Response Rate =100
Table 134 Catfish Responses Protein - Related Factors Considered i
Response Rate = 83
Table 135 Catfish Responses Crude Protein Levels Preferred for CSM
Response Rate = 100
Table 139 Catfish Responses Would or Do Use Table 140 Catfish Responses Relative Feeding
Value ofCSM Compared to 44~ Lmiddotmiddotmiddotmiddotmiddotmiddotmiddotmiddotmiddotmiddotmiddotmiddotmiddotmiddotmiddotmiddotmiddotmiddotmiddot _
Response Rate = 100
Response Rate = 100
Table 141 Catfish Responses Knowledge of Research on Table 142 Catfish Responses Sources ofInformation
Average Response Rate = 83
bullAverage Response Rate = 44
Table 143 Catfish Responses Willingness to Pay A Premium Per Unit of Protein for CSM with More Than
middotResponse Rate = 100
Table 144 Catfish Responses Percent of Cost of SBM Respondents Willing to Pay for CSM with Sufficiently Low Goscvnol and Fiber Levelsmiddot
middotResponse Rate = 83
middotResponse Rate = 25
Table 146 Comparison of Mean Responses and Analysis of Variance (ANOVA) Importance of Specific
bull Scale of 1 (extremely unimportant) to 7 (extremely important) for the mean ranking a Mean significantly larger across animal types at the 5 significance level otherwise no difference b Mean significantly lower across animal types at the 5 significance level otherwise no difference
Table 147 Comparison of Mean Responses and Analysis of Variance (ANOVA) Ranking of Other Protein
bull Scale of 1 (CSM inferior to respective feed) to 7 (CSM superior to respective feed) for the mean ranking
a Mean significantly larger across animal types at the 5 significance level otherwise no difference
b Mean significantly lower across animal types at the 5 significance level otherwise no difference
Table 148 Comparison ofMean Responses and Analysis of Variance (ANOVA) Importance of Nutritionshy
Related Factors in Choice ofCSM Over Alternativesmiddot
bull Scale of 1 (extremely unimportant) to 7 (extremely important) for the mean ranking a Mean significantly larger across animal types at the 5 significance level otherwise no difference
b Mean significantly lower across animal types at the 5 significance level otherwise no difference
Table 149 Comparison of Mean Responses and Analysis of Variance (ANOVA) Importance of Nonshy
Nutrition- Related Factors in Choice of CSM Over Alternativesmiddot
bull Scale of 1 (extremely unimportant) to 7 (extremely important) for the mean ranking
a Mean significantly larger across animal types at the 5 significance level otherwise no difference
b Mean significantly lower across animal types at the 5 significance level otherwise no difference
- = Not mentioned or ranked lower than 4th place
Table 151 Comparison of Responses Top Responses Why CSM IS NOT Selected as a Feed
- = Not mentioned or ranked lower than 5th place
Table 152 Comparison of Responses Top Characteristics that Have to Change for CSM to Be
- = Not mentioned or ranked lower than 5th place

12
meal dried whole milk and blood meal in dairy cattle feeds and 2) an overwhelming majority of respondents consider CSM to be an alternative to nearly all the remaining protein feeds for use in dairy cattle rations
bull The importance of nutritional and non-nutritional factors Again the responses are generally the same As was the case for beef cattle respondents however dairy cattle respondents tended to rank the listed non-nutrition-related factors as relatively more important than the listed nutrition-related factors On average dairy cattle feed formulators ranked amino acid balance fiber level and gossypol level as less important factors in the choice of CSM than was the case for the combined responses (Tables 58 and 59) As in the case of both the combined and beef cattle responses aflatoxin was ranked at a higher level of importance than any other single nutrition-related factor Of the non-nutrition-related factors respondents ranked most factors as all slightly more important in the choice of CSM than was the case for the combined responses (Tables 60 and 61)
bull Seasonality of cottonseed meal allailability The results for the dairy cattle respondents are highly consistent with those for both the combined responses and for the beef cattle responses The months of May through September are the months of least availability of CSM which are also the months indicated when CSM is least needed to be available in the perception of dairy cattle respondents (Tables 62 and 63) Again the suggestion is one of little problem of CSM availability although this is not totally the case as indicated by dairy cattle respondents in later questions
bull Reasons for the selection and non-selection of cottonseed meal While price and availability are also the top two reasons that dairy cattle respondents perceived that CSM is selected as a feed ingredient protein contentquality ranked third on their list followed closely by palatability (Table 64) The top two reasons the CSM is not selected according to the dairy cattle respondents were price and availability as with both the combined responses and the beef cattle responses The third reason given by the dairy cattle respondents however was protein qualitylevel followed in fourth place by gossypol (Table 65) Again price was the key CSM characteristic that dairy cattle respondents indicated that must change in order to be used more frequently in dairy cattle rations (Table 66) Availability and gossypol levels were ranked as the second and third CSM characteristics that must change as was the case for the combined responses
bull Source of chemical analyses for cottonseed meal The results for the chemical analyses performed by dairy cattle respondents are virtually identical to those of both the combined results and those of the beef cattle results The primary analysis routinely performed by the dairy cattle respondents is crude protein (121 of the 143 respondents) followed by fiber (94 respondents) and fat (83 respondents) (Tables 67 and 68) The primary analytical values supplied to the dairy cattle respondents also include crude protein (62 respondents) fiber (50 respondents) and fat (47 respondents) (Tables 69 and 70) It is interesting to note that although aflatoxin was ranked at a higher level of importance than any other nutrition-related factor affecting the choice of CSM as feed component only a third of the dairy cattle respondents routinely perform analyses for aflatoxin and only 11 respondents are provided aflatoxin values by their CSM suppliers The story is about the same for both the combined and the beef cattle responses
Dairy cattle sample members were also asked several questions specifically regarding the use of CSM in dairy cattle feed formulations in 6 general areas I) problems resulting from feeding a
13
ration with CSM to the various dairy cattle types 2) details on dairy cattle feed formulations containing whole cottonseed 3) sources of information utilized on formulating dairy cattle feeds 4) protein-related factors considered when balancing rations for dairy cattle 5) gossypol levels considered to be safe for mature dairy cattle and pre-ruminant calves and 6) an open-ended question soliciting suggestions to improve the usefulness or value of CSM for dairy feed formulations
Problems from Feeding CSM Rations to Dairy Cattle
Again very few respondents indicted knowledge of any problems resulting from feeding a ration containing CSM to dairy cattle (Table 71) Only 24 of the respondents indicated problems with calves and only 18 for lactating cows as the result of feeding rations with CSM Only about 3 of the respondents mentioned problems with either dairy heifers or dry cows The number one problem reported was gossypol toxicity primarily in creep feeds and complete rations (Table 72) Both palatability and poor performance problems for various feed types were also frequently mentioned Again however the low number of respondents indicating problems of any type suggests that the problems reported were likely isolated cases
Details on Dairy Cattle Feed Formulations Containing Whole Cottonseed
Over 75 of dairy cattle respondents formulate feeds using whole fuzzy cottonseed a much higher percentage than was the case for beef cattle Less than half of the dairy cattle respondents however utilize delinted cottonseed in their feeds more in line with the beef cattle results (Table 73) Less than half the respondents formulate rations that include both CSM and whole cottonseed (Table 74) For those who formulate rations that include both the mix of the two in the rations varies widely Respondents reported that the share of such rations accounted for by CSM ranged from 1 to 30 with a mean of 85 (Table 75) The share of those rations accounted for by whole cottonseed ranged from 3 to 100 with a mean of 16 (Table 76) It appears therefore that on average dairy feeds formulated with both CSM and whole cottonseed contain a higher percentage of whole cottonseed than of CSM This is just the opposite of the situation for beef cattle
Sources of Information Utilized on Formulating Dairy Cattle Feeds
Over 80 of the dairy cattle respondents indicated that they were familiar with research on feeding CSM to mature dairy cattle (Table 71) Only half however indicated familiarity with such research for pre-ruminant calves Less than 10 of the respondents listed any other research on feeding CSM to other types of dairy cattle (Table 78) The largest number of respondents (137 of 143 respondents) indicated that they utilize university research to obtain information on formulating feeds for dairy cattle followed by industry publications of some type (121 respondents) and university extension service (83 respondents) (Table 79) Only 36 respondents listed other sources of information including primarily personal experience and research (Table 80)
Protein-Related Factors Considered for Balancing Dairy Cattle Rations
Nearly 100 of the dairy cattle respondents indicated that both crude protein level and rumen degradability are factors they consider when balancing rations for dairy cattle a much higher level than is the case for beef cattle (Table 81) Less than half consider amino acid values (61 of 143 respondents) Only 19 respondents indicated that they consider other factors like protein solubility (Table 82)
Dairy cattle respondents indicated a even wider range of escape values (or by-pass values) that they are using for CSM than did beef cattle respondents from 0 to over 80 (Table 83) The mean escape value calculated from the responses is 40 Dairy cattle respondents indicated slightly more
14
confidence in the escape values they are using than was the case for beef (Table 84) Only 22 respondents however considered those escape values to be reliable or extremely reliable The principal single method or source used by respondents for the escape value they use was again the National Research Council (Committee on Animal Nutrition National Academy of Sciences) (Table 85) Book values was the next most frequently mentioned single source of CSM escape values (23) Finally nearly 100 of the respondents indicated an interest in obtaining information on escape values for CSM as processed by different methods (Table 86) The conclusion from the dairy cattle responses is the same as for beef cattle That is there appears to be a lack of reliable information on CSM escape values in the perception of dairy cattle feed formulators and that they are highly interested in obtaining more information in this regard
Gossypol Level Considered Safe for Mature Dairy Cattle and Pre-Ruminant Calves
Dairy cattle respondents appear to have little idea of what the safe levels are for gossypol in mature dairy cattle and pre-ruminant calf feeds First of all only one-third of those who returned surveys even attempted to provide numbers for safe gossypol levels (Tables 87 and 88) Many respondents simply wrote comments such as dont know or not aware of research on safe gossypol level in the margin of the survey beside the question Second those who attempted to answer the questions provided an amazingly wide range of safe gossypol levels from 0 parts per million (ppm) to 7500 ppm for mature dairy cattle and from 0 ppm to 1000 ppm for pre-ruminant calves The mean safe gossypol levels were 609 ppm for mature dairy cattle and 121 ppm for pre-ruminant calves The responses were spread quite evenly between the extremes around the means It should be noted that the research team checked and rechecked the data set for this question to insure there were no errors in data entry
Suggestions for Improving the Usefulness of Cottonseed Meal
Only about 22 of the dairy cattle feed formulators that returned surveys provided suggestions that might improve the value or usefulness of CSM in dairy cattle feed rations (Table 89) Some of the more frequent suggestions dealt with improving the consistency and availability of CSM Several respondents suggested the need for more information on gossypol a worthy suggestion given the results of the previous question
Poultry
The perceptions of poultry feed formulator respondents concerning the use of cottonseed meal differ importantly in many respects from the combined responses over all survey respondents and from those of beef and dairy cattle Many of the differences are likely the result of the distinct dietary needs of ruminant as opposed to non-ruminant animals The salient differences in responses by poultry feed formulators in the 6 general question areas include the following
bull Factors affecting choice of dietary proteins Surprisingly there was little difference in the responses of those indicating that they formulate feed for poultry than for the combined results (or for beef and dairy cattle) regarding the importance of the listed factors (quality price availability consistency and other) affecting the choice of dietary protein (Table 90) A large majority of poultry feed formulators ranked all factors as either important or extremely important The only exception is that consistency was ranked slightly less important by poultry respondents than by respondents in general
bull Cottonseed meal as an alternative protein feed Poultry respondents ranked more protein feeds as higher on the superior-to-CSM scale than was the case for the combined responses
15
(Table 91) In fact the mean rank of all but three of the protein feeds were all at least somewhat higher than was the case for the combined responses The mean rank of several of the other protein feeds as determined by the poultry respondents was much higher than for the combined responses including fish meal poultry by-product meal and soybean meal Poultry by-product meal changed from an inferior to a superior protein feed compared to CSM The protein feed judged by poultry respondents to be most superior to CSM for poultry rations was soybean meal while urea was ranked as most inferior Poultry respondents also appeared to have stronger opinions about whether or not CSM is an alternative to the other listed protein feeds than was the case for the combined responses They overwhelmingly perceived that CSM is not an alternative to many of the other protein feeds including fish meal dried skim milk dried whole milk poultry by-product meal blood meal tankage and urea A larger percentage of poultry respondents than was the case for dairy and beef cattle perceived however that CSM is a definite alternative to many other protein feeds including safflower meal sunflower meal linseed meal peanut meal canola meal feather meal distillers dried grains brewers dried grains and even soybean meal
bull The importance of nutritional and non-nutritional factors Poultry respondents ranked all but two of the listed nutrition-related factors as more important in the choice of CSM over alternative protein feeds for poultry rations than was the case for the combined responses on average (Le comparing mean responses) (Table 92) The highest percentage of poultry respondents ranked gossypol level (62 of the respondents) amino acid balance (59) aflatoxin (58) protein quality (57) and amino acid availability (57) as extremely important in the choice of CSM over alternative protein feeds Only about 5 of the respondents listed other important nutrition-related factors (Table 93) There are few differences however in the poultry responses as compared to the combined responses regarding the importance of non-nutrition-related factors (Table 94) The major difference is a much lower ranking of the importance of palatability in choosing CSM over alternative protein feeds Also a somewhat higher percentage of poultry respondents ranked price as an extremely important non-nutrition-related factor Few other non-nutrition-related factors were listed by the respondents (Table 95)
bull Seasonality of cottonseed meal availability The results for the poultry respondents regarding the months of the year when CSM is not available are highly consistent with those for the combined responses and those for the beef and dairy cattle responses Poultry respondents indicated that May through September are the months of least availability of CSM (Table 96) But likely because of the shorter production cycle for poultry than for cattle poultry respondents indicated that CSM needs to be available in almost every month (but slightly less so in August and September) for CSM to compete effectively with alternative protein feeds (Table 97) For poultry therefore the indication is that poultry feed formulators may perceive an availability problem which inhibits greater use of CSM in poultry rations to some extent
bull Reasons for the selection and non-selection of cottonseed meal Again price and availability are the number one and number two reasons respectively cited by poultry respondents for which CSM is selected as a feed ingredient (Table 98) Protein quality ranked third on their list followed closely by phosphorous content The top reason that CSM is not selected according to the poultry respondents was pricevalue (Table 99) About tied for second place were gossypol content and availability More respondents ranked availability as the second reason than for gossypol content but more respondents listed gossypol first The amino acid level was listed as a distant fourth reason for which CSM is not selected as a feed ingredient Price is again the key CSM characteristic that poultry respondents indicated must change in
16
order for CSM to be used more frequently in poultry rations (Table 100) Gossypol was clearly considered to be the second most important characteristic that must change Availability was ranked as either first or second by all respondents who listed it as a characteristic that must change
bull Source of chemical analyses for cottonseed meal The results for the chemical analyses performed by poultry respondents are similar to those of both the combined results and those of the beef and dairy cattle results The primary analysis routinely performed by the poultry respondents is crude protein (51 of 55 respondents) followed by fat (40 respondents) fiber (37 respondents) and aflatoxin (31 respondents) (Tables 101 and 102) The primary analytical values supplied to the poultry respondents also included crude protein fiber and fat (Table 103) A third of the poultry respondents indicated that their CSM supplier does not provide them with any analytical values Once again even though aflatoxin was ranked as an extremely important nutrition-related factor in the choice of CSM as a feed component only I respondent obtains an analytical value for aflatoxin from his CSM supplier and only a little over half routinely perform their own aflatoxin analyses
Poultry sample members were asked some specific questions regarding the use of CSM in poultry feed formulations in 5 general areas I) problems resulting from feeding a ration with CSM to the various poultry types 2) specific information on several key nutrition-related factors affecting the use of CSM in poultry rations 3) sources of information utilized on formulating poultry feeds 4) CSM price and value and 5) an open-ended question soliciting suggestions to improve the usefulness or value of CSM for poultry feed formulations
Problems from Feeding CSM Rations to Poultry
The majority of poultry respondents indicated no knowledge of any problems associated with feeding a ration containing CSM to poultry (Table 104) Only 14 of the respondents indicated problems with broilers less than 7 for breeding flocks and about 3 for turkeys Over a third however indicated that they had knowledge of such problems with layers The number one problem reported was yolk molting and discoloration primarily in layer rations (Table 105) A few respondents indicated problems with depressed growth associated with broiler feeds containing CSM
Information on Key Nutrition-Related Factors for Poultry Rations
The survey sample members were asked to respond to a number of specific questions related to nutritional factors that affect the use of CSM in poultry rations including protein energy fat gossypol and synthetic amino acids They were then asked to indicate their perception of the overall feeding value of a standard 41 protein CSM compared to that of a standard 44 protein soybean meal The questions were designed primarily to determine the extent of knowledge among feed formulators concerning these factors as they relate to the use of CSM and the relative feeding value of CSM
Sample members were asked to respond to two questions regarding protein in poultry feed rations They were first asked to indicate the specific protein-related factors that they consider when balancing rations for poultry They were given a list of three factors (crude protein level amino acid content and amino acid availability) They were also allowed to specify any other protein-related factors they consider when balancing poultry rations They were then asked to indicate the crude protein levels they would prefer for cottonseed meal and were given a choice of four levels (3641 (standard) 44 and 48) and allowed to suggest any other preference for crude protein level
17
Almost all poultry respondents indicated that they consider amino acid content and availability when balancing feed rations with fewer responding that they consider the crude protein level (Table 106) Other protein-related factors listed by the respondents included amino acid balance protein digestibility and energy levels (Table 107) With regard to preferred crude protein level for CSM over half of the poultry respondents indicated a preference for 48 crude protein (Table 108) About 27 of the respondents were satisfied with the standard 41 level and 20 indicated a preference for a 44 protein CSM No respondents preferred anything less than the standard 41
With respect to energy levels the sample members were asked to indicate what they considered to be the normal maximum and minimum energy levels for protein feeds for broilers layers turkeys and breeding flock As Table 109 indicates the responses varied widely with little or no indication of a mode (most frequent response) in most cases For broilers the maximum (in K Cals DE per pound) ranged from 0 to 1800 and the minimum from 850 to 1700 with a mean maximum of 1436 and a mean minimum of 1276 For layers the maximum (in K Cals DE per pound) ranged from 1000 to 1800 and the minimum from 800 to 1500 with a mean maximum of 1347 and a mean minimum of 1187 For turkeys the maximum (in K Cals DE per pound) ranged from 1100 to 1725 and the minimum from 850 to 1700 with a mean maximum of 1334 and a mean minimum of 1261 For breeding flocks the maximum (in K Cals DE per pound) ranged from 1000 to 1600 and the minimum from 750 to 1600 with a mean maximum of 1328 and a mean minimum of 1159 Given the disparity in the responses it seems clear that there is little common concept of the normal maximum and minimum energy levels for protein feeds
Sample members similarly were asked to indicate the minimum and maximum fat levels they considered critical for protein feeds Although the range of responses was still quite wide there appeared to be more uniformity in responses to this question than the one for energy (Table 110) The maximum fat levels (ether extract as fed basis) indicated by the respondents ranged from 1 to 15 or 20 for most poultry types The minimums ranged from 0 to 15 The mean minimum levels of fat for all poultry types was about 3 The mean maximum ranged from 6 to 82 depending on the poultry type
Sample members were asked to indicate the level of gossypol they considered safe for poultry rations The responses again varied widely from a low of 0 ppm up to a high of 300 ppm for all poultry types (Table III) The highest mean level of gossypol as calculated from the responses to the question were 104 ppm for broilers and 91 ppm for turkeys For layers and breeding flocks the mean levels were much lower at 57 ppm and 54 ppm respectively
The questionnaire also asked the sample members to indicate if they use or would use synthetic amino acids where economical The response was that nearly 100 of all poultry respondents indicated that they have or would use synthetic amino acids in this situation (Table 112) This suggests little real aversion on the part of feed formulators to utilize synthetic amino acids in least cost poultry formulations
To obtain some insight on the general perception of poultry formulators regarding CSM the sample members were asked to indicate the overall feeding value of a standard 41 protein CSM compared to that of a standard 44 protein soybean meal in their opinion on percentage basis They were given the choice of 5 ranges from under 70 to over 100 in 10 increments (see Table 113 for the actual ranges used) Nearly 80 of the respondents indicated that CSM has an overall feeding value of under 90 of that of soybean meal Given the five choices offered to respondents the mean feeding value was around 80
18
Sources of Information Utilized on Formulating Poultry Feeds
About two-thirds of the poultry respondents indicated that they were familiar with research on feeding CSM to broilers and layers (Table 114) Only half however indicated familiarity with such research for turkeys and only a little over a third for breeding flocks Less than 10 of the respondents listed any other research on feeding CSM to other types of poultry (Table 115) To obtain information on formulating feeds for poultry the largest number of respondents (52 of the 55 respondents) indicated that they utilize university research followed by industry publications of some type (45 respondents) university extension services (26 respondents) and government agencies (20 respondents) (Table 116) Only 17 respondents listed other sources of information including primarily personal experience and research (Table 117)
Cottonseed Meal Price and Value
To get some idea concerning the poultry respondents perceptions of the value of CSM particularly with respect to soybean meal sample members were asked 1) if they would be willing to pay a premium per unit of protein for CSM with more than a standard 41 protein and 2) if gossypol and fiber were sufficiently low on average what percent of the cost of soybean meal they would be willing to pay for CSM
With respect to the first question only about half the respondents indicated a willingness to pay a premium for a CSM with more than 41 protein despite the fact that 75 of them indicated earlier that they would prefer a CSM with a higher crude protein level (Table 118) Thus at least 25 of the respondents prefer a higher protein level CSM but would not be willing to pay a premium to get it
In response to the second question poultry respondents indicated that they would only be willing to pay an average of about 76 of the cost of soybean meal for a CSM with a sufficiently low level of gossypol and fiber (Table 119) The range around that average however was fairly large from 50 to 95 Because CSM has traded at about 91 of the value of soybean meal on the market on a protein equivalent basis and about 85 on an unadjusted basis on average in each year since 1984 either poultry respondents are currently unaware of the historical CSM to soybean meal price relationship or they are indicating that the current CSM market price relative to that of soybean meal is substantially above the levels that most find acceptable
Suggestions for Improving the Usefulness of Cottonseed Meal
Only about 27 of the poultry feed formulators that returned surveys provided suggestions that might improve the value or usefulness of CSM in poultry feed rations (Table 120) Some of the more frequent suggestions included the need for more information on the use of CSM in poultry rations increased availability of CSM and nutrient guarantees
Catfish
The perceptions of catfish feed formulator respondents concerning the use of cottonseed meal correspond closely to those of the poultry respondents likely because of the similar dietary needs of non-ruminant animals The salient differences in responses by catfish feed formulators in the 6 general question areas included on this section of the surveys include the following
bull Factors affecting choice of dietary proteins There were no differences in the responses of those indicating that they formulate feed for catfish than for poultry regarding the importance
19
of the listed factors (quality price availability consistency and other) affecting the choice of dietary protein (Table 121) A large majority of catfish respondents ranked all factors as either important or extremely important as did poultry respondents
bull Cottonseed meal as an alternative protein feed As was the case for poultry catfish respondents ranked more protein feeds as higher on the superior-to-CSM scale than was the case for the combined responses (Table 122) Catfish feeders however ranked meat and bone meal and blood meal as even more superior to CSM than did poultry respondents The protein feeds that catfish respondents ranked as roughly similar to CSM included tankage feather meal peanut meal linseed meal corn gluten meal brewers dried grains distillers dried grains sunflower meal safflower meal and canola meal Catfish respondents also appeared to have nearly as strong views about whether or not CSM is an alternative to the other listed protein feeds as did poultry respondents They perceived that CSM is not an alternative to many of the other protein feeds including blood meal dried whole milk meat and bone meal and dried skim milk Catfish respondents also perceived however that CSM is a definite alternative to many other protein feeds including safflower meal canola meal peanut meal sunflower meal linseed meal distillers dried grains brewers dried grains tankage soybean meal wheat middlings corn gluten meal urea and feather meal
bull The importance of nutritional and non-nutritional factors The responses for catfish with regard to the importance of nutrition-related and non-nutrition-related factors in choosing CSM as a component of catfish feeds were roughly similar to those for poultry (Table 123) The salient differences were that a larger percentage of catfish respondents ranked energy level fat level and fiber level as important or extremely important and a much larger percentage ranked aflatoxin as extremely important One major difference of the catfish responses regarding the importance of non-nutrition-related factors from those of poultry is that palatability is much mOre of a concern to catfish feeders (Table 124) Bin space is less important to catfish respondents and service from the CSM industry is more important to them
bull Seasonality of cottonseed meal availability The results for the catfish respondents regarding the months of the year when CSM is not available were generally consistent with those for poultry except that May and June were perceived as less problematic for obtaining CSM supplies by the catfish respondents (Table 125) Catfish formulators perceive that CSM needs to be more available in April through October than during the rest of the year to be competitive with other protein feeds (Table 126) This suggests the perception on the part of catfish feed formulators of a CSM availability problem during about the first half of any given year
bull Reasons for the selection and non-selection of cottonseed meal Pricevalue is the number one reason cited by catfish respondents for which CSM is selected as a feed ingredient followed by protein quality and palatability (Table 127) The top reason that CSM is not selected according to the catfish respondents is pricevalue followed by quality and gossypol level (Table 128) Gossypol level is the key CSM characteristic that catfish respondents indicated must change in order for CSM to be used more frequently in catfish rations (Table 129) Quality was clearly considered to be the second most important characteristic that must change followed by aflatoxin level This is the only animal species for which price was not the number one characteristic cited that would have to change and was not even listed among the top three responses The implication is that catfish feed formulators may not consider the price of cottonseed meal to be out of line with their needs and thus do not consider price to be a particular problem for the use of CSM in catfish rations A word of caution is in order
20
to avoid taking this conclusion too far because of the relatively few number of catfish feed formulators in the sample
bull Source of chemical analyses for cottonseed meal The results for the chemical analyses performed by poultry respondents are similar to those of poultry as well as those of both the combined results and the beef and dairy cattle results The primary analysis routinely performed by the catfish respondents is crude protein followed by fat fiber aflatoxin and gossypol (Tables 130 and 131) The primary analytical values supplied to the catfish respondents also included crude protein fiber and fat (Table 132) Only 2 of the II catfish respondents indicated that their CSM supplier does not provide them with any analytical values Even though gossypol was ranked as an extremely important nutrition-related factor in the choice of CSM as a feed component and the number one CSM characteristic that needs to change only 5 of the II respondents routinely perform gossypol analyses None of catfish respondents obtain analytical values for aflatoxin from their CSM supplier
As for poultry catfish sample members were asked some specific Questions regarding the use of CSM in catfish feed formulations in 5 general areas 1) problems resulting from feeding a ration with CSM to the various catfish types 2) specific information on several key nutrition-related factors affecting the use of CSM in catfish rations 3) sources of information utilized on formulating catfish feeds 4) CSM price and value and 5) an open-ended Question soliciting suggestions to improve the usefulness or value of CSM for catfish feed formulations
Problems from Feeding CSM Rations to Catfish
Absolutely no catfish respondents indicated any knowledge of any problems associated with feeding a ration containing CSM to catfish (Table 133)
Information on Key Nutrition-Related Factors for Catfish Rations
As for poultry the survey sample members were asked to respond to a number of specific Questions related to nutritional factors that affect the use of CSM in catfish rations including protein energy fat gossypol and synthetic amino acids They were then asked to indicate their perception of the overall feeding value of a standard 41 protein CSM compared to that of a standard 44 protein soybean meal Just as for poultry these Questions were designed primarily to determine the extent of knowledge among catfish feed formulators concerning these factors as they relate to the use of CSM and the relative feeding value of CSM
Sample members were asked to respond to two Questions regarding protein in catfish feed rations They were first asked to indicate the specific protein-related factors that they consider when balancing rations for catfish They were given the same list of three factors (crude protein level amino acid content and amino acid availability) to choose from that the poultry sample members were given Again they were also allowed to specify any other protein-related factors they consider when balancing catfish rations They were then asked to indicate the crude protein levels they would prefer for CSM and were given the same choice of four levels as the poultry sample members (36 41 (standard) 44 and 48) and allowed to suggest any other preference for crude protein level In contrast to poultry the largest percentage of catfish respondents indicated that they consider amino acid availability (10 of the 11 catfish respondents) rather than the content when balancing catfish rations (Table 134) The second largest percentage consider crude protein level (9 respondents) also a different result from poultry
21
With regard to the crude protein level for CSM preferred by catfish respondents about 43 indicated a preference for 48 crude protein (Table 135) About 20 of the respondents were satisfied with the standard 41 level and nearly 30 indicated a preference for a 44 protein CSM No respondents preferred anything less than the standard 41 The mean preferred crude protein level was about 42
With respect to energy levels the catfish sample members were asked to indicate what they considered to be the normal maximum and minimum energy levels for protein feeds for fingerlings grow out stock brood stock and fries Despite the low number of catfish respondents the answers to this question were widely divergent (Table 136) For fingerlings the maximum (in K Cals DE per pound) ranged from 1250 to 1800 and the minimum from 2 to 1500 with a mean maximum of 1525 and a mean minimum of 834 For grow out stock the maximum (in K Cals DE per pound) ranged from only 1500 to 1600 and the minimum from 1 to 1300 with a mean maximum of 1550 and a mean minimum of 750 For catfish brood stock the maximum (in K Cals DE per pound) ranged from 1300 to 1700 and the minimum from 1200 to 1400 with a mean maximum of 1500 and a mean minimum of 1300 For fries the maximum (in K Cals DE per pound) ranged from 1250 to 1800 and the minimum from 900 to 1500 with a mean maximum of 1525 and a mean minimum of 1200 Given the disparity in these responses it seems clear again for catfish feed formulators that there is little common concept of the normal maximum and minimum energy levels for protein feeds
Catfish sample members similarly were asked to indicate the minimum and maximum fat levels they considered critical for protein feeds As with poultry the range of responses was still quite wide but there also appeared to be more uniformity in responses to this question than the one for energy level (Table 137) The maximum fat levels (ether extract as fed basis) indicated by the respondents again ranged from 1 to 15 for most catfish types as was the case for poultry The mean minimum levels of fat for all catfish types ranged from about 3 to 5 The mean maximum ranged from 6 to 10 aCrOSS the different catfish types
Catfish sample members were also asked to indicate the level of gossypol they considered safe for catfish rations The responses again varied widely from a low of 0 ppm up to a high of 300 ppm for some catfish types (Table 138) The two highest mean safe levels of gossypol were 97 ppm for grow out stock and 83 ppm for brood stock For fingerlings and fries the safe maximum mean levels were much lower at 44 ppm and 23 ppm respectively
The questionnaire also asked the sample members to indicate if they use or would use synthetic amino acids where economical The response was that 83 (all but 2) of the catfish respondents indicated that they have or would use synthetic amino acids in this situation (Table 139) This suggests little real aversion on the part of feed formulators to utilize synthetic amino acids in least cost catfish formulations
To obtain some insight on the general perception of catfish formulators regarding CSM the sample members were asked to indicate their opinion of the overall feeding value of a standard 41 protein CSM compared to that of a standard 44 protein soybean meal expressed on a percentage basis They were given a choice of 5 ranges from under 70 of the feeding value of soybean meal to over 100 in 10 increments (see Table 140 for the actual ranges used) All but one of the catfish respondents indicated that CSM has an overall feeding value of under 90 of that of soybean meal Given the five choices offered to respondents the mean feeding value of CSM relative to that of soybean meal was around 80
22
Sources of Information UtiJized on Formulating Catfish Feeds
Only about half of the catfish respondents indicated that they were familiar with research on feeding CSM to grow out stock and only a third were familiar with research on fingerlings (Table 141) Only 2 respondents were familiar with any research on feeding CSM to brood stock and fries To obtain information on formulating feeds for catfish the largest number of respondents indicated that they utilize university research and industry publications of some type (Table 142)
Cottonseed Meal Price and Value
Catfish sample members were also asked two Questions to get some idea concerning their perception of the value of CSM particularly with respect to soybean meal 1) if they would be willing to pay a premium per unit of protein for CSM with more than a standard 41 protein and 2) if gossypol and fiber were sufficiently low on average what percent of the cost of soybean meal would they be willing to pay for CSM
With respect to the first Question 75 of the catfish respondents indicated a willingness to pay a premium for a CSM with more than 41 protein which is consistent with their earlier responses that they would prefer a CSM with a higher crude protein level (Table 143)
In response to the second Question catfish respondents indicated that they would only be willing to pay an average of about 82 of the cost of soybean meal for a CSM with a sufficiently low level of gossypol and fiber (Table 144) The range around that average was more narrow than for poultry from 70 to 100 This is more consistent with the ratio of CSM price to soybean meal price that has existed over the last 7 or 8 years on average
Suggestions for Improving the Usefulness of Cottonseed Meal
Only three catfish respondents offered suggestions for improving the usefulness or value of CSM for catfish rations The three suggestions included I) providing a more consistent product in price and Quality 2) providing a premium Quality toxin-free high protein low-fat product superior to soybean meal and 3) eliminating the CHO fraction (Table 145)
Comparisons Among Animal Species
In order to highlight the salient differences in responses with respect to the various animal species the mean responses to Questions that are common among all surveys regarding CSM use as a feed ingredient were compared and analyzed An analysis of variance (ANOY A) was also done to detect statistically significant differences in the mean responses to each Question by animal specie Comparisons are made among the mean responses to all Questions in the 6 general areas to which all sample members were asked to respond regardless of the animal specie(s) for which they formulate feeds 1) the particular factors affecting their choice of dietary proteins for formulated feeds 2) the extent to which CSM is considered to be an alternative to selected protein feeds 3) the importance of nutritional and non-nutritional factors in their decisions to use CSM rather than alternative dietary proteins in their feed formulations 4) the seasonality of CSM availability 5) the specific reasons for the selection and non-selection of CSM for use in the feeds they formulate and 6) the source of CSM chemical analyses used by the respondents Where appropriate ANOY A results are also indicated
23
Factors Affecting Choice of Dietary Proteins
As discussed earlier all members of the final sample regardless of the animal species for which they formulate feeds were asked to rank the importance of four general factors in their choice of a dietary protein for their feed formulations on a scale of I to 7 (from extremely unimportant to extremely important respectively) 1) quality 2) price 3) availability and 4) consistency Comparing the results across animal types reveals few significant differences in the importance attached to any of the four factors by the responding formulators of the various animal specie feeds (ie comparing results horizontally in Table 146) But as pointed out in an earlier section the mean rankings for quality are all higher than those for the other factors while the mean rankings of price are all lower than those for most other factors across all animal types In other words the respondents consistently ranked quality highest on the scale of importance followed in order by consistency availability and price
Cottonseed Meal As An Alternative Protein Feed
Recall that the sample members were asked to rank various selected protein feeds on a scale of 1 to 7 as inferior or superior to CSM in an overall sense for use in feed formulations A second question required respondents to indicate whether or not they considered CSM to be an alternative to each of the 20 listed protein feeds A comparison of the mean ran kings and ANOV A results across animal types indicates substantial agreement among the respondents regarding the ranking of CSM as an alternative to some animal feeds and substantial disagreement with respect to CSM as an alternative to many others (Table 147) Respondents over all animal types tended to agree that certain feeds and in particular the higher crude-protein-content feeds are clearly superior to CSM including dried skim milk meat and bone meal fish meal blood meal soybean meal dried whole milk and corn gluten feed There was a statistically different deviation in the extent to which respondents for some animal species regarded those meals as superior however For example catfish respondents ranked meat and bone meal fish meal poultry by-products blood meal soybean meal and corn gluten meal higher than did respondents for the ruminant animals The same was roughly the case for poultry Beef and dairy cattle respondents tended to rank all other protein feeds as less superior (ie more inferior) to CSM There was also substantial agreement that CSM was about the same as tankage peanut meal linseed meal and brewers and distillers dried grains but superior to some extent over the other feeds particularly those lower in crude protein including dehydrated alfalfa sunflower meal wheat middlings safflower meal canola meal feather meal and urea Beef and dairy cattle respondents agreed that CSM can be considered an alternative to nearly all the protein feeds except perhaps skim and whole dried milk Poultry and catfish respondents indicated CSM is an alternative to fewer of the other protein feeds
The Importance of Nutritional and Non-Nutritional Factors
Respondents also ranked the importance of specific nutrition-related and non-nutritionshyrelated factors in choosing cottonseed meal as a component of the feeds they formulate on a scale of extremely unimportant to extremely important (a scale of I to 7 respectively) Comparing the mean rankings by the respondents reveals that poultry and catfish feed formulators clearly consider proteinshyrelated factors and gossypol level to be more important than do beef and dairy feed formulators (Table 148) Fiber level is also of more importance to formulators of catfish feed Interestingly the importance of fiber was not ranked significantly higher by poultry feed formulators than by beef and dairy cattle feed formulators At the same time aflatoxin was clearly ranked by all respondents as the most important factor affecting the choice of CSM as a feed ingredient irrespective of the animal specie for which the ration is intended
24
For the non-nutritional factors an analysis of the mean rankings indicates few significant differences in the responses across animal species with respect to each individual factor listed (Table 149) The most notable exception is that poultry respondents ranked palatability significantly less important than did any of the other respondents for the other animal species Finally catfish respondents perceived that service by the CSM industry was more important for them than did the respondents for the other animal species
Seasonality of Cottonseed Meal Availability
The respondents across all animal species indicated that CSM is least available between about May and October likely reflecting the increasing shortages of cottonseed meal supply just prior to the cotton harvest in the fall (Figure 20) At the same time however the beef cattle dairy cattle and poultry respondents all indicated that there is less need for CSM to be available during approximately those same months in order to compete effectively with other protein feeds (Figure 21) This suggest that the seasonality of supply may not represent an important constraint to competitiveness and growth possibilities of CSM as a feed ingredient Interestingly catfish respondents suggested a largely inverse pattern of the times of the year when CSM needs to be available to compete effectively with other protein feeds as a catfish feed ingredient Possible explanations of this phenomenon include I) the protein feed needs of catfish feed formulators peak in the late spring and summer months when supply is less available 2) catfish feed formulators are located such that CSM is not easily obtainable particularly during short supply years or 3) formulators of feed for other animal species have longer experience in using CSM and have adjusted their formulation to the pattern of CSM supply availability In any case it should be remembered that there are relatively few catfish feed formulators in the sample so that their joint responses may not be truly representative of all catfish feed formulators In this case this difference in their responses may mean little
Reasons for the Selection and Non-Selection of Cottonseed Meal
Respondents across animal species were quite consistent in their ranking of the top reasons that CSM is included in feed formulations (Table 150) They overwhelmingly ranked price as the top reason followed generally by availability and protein quality Catfish respondents differed somewhat from that order ranking protein quality second and palatability as third Availability was ranked fourth by catfish respondents The top reason all respondents listed for which CSM is not included in feed formulations was also price (Table lSI) Beef and cattle respondents ranked availability as second but poultry respondents ranked gossypol second while catfish respondents ranked protein quality second A vailability ranked only as the third reason that CSM is not selected by poultry respondents and fourth by catfish respondents Gossypol ranked either third or fourth for all animal species except poultry for which gossypol appears to be a more important reason for not including CSM in poultry feed formulations The question regarding the characteristics of CSM that would have to change in order for it to be selected more frequently as a feed ingredient elicited about the same responses as those for the previous question concerning why CSM is not included in feed formulations (Table 152) The top characteristic that would have to change in the opinion of most respondents is price Catfish respondents however listed price extremely low on their list suggesting that other factors are more of a constraint to CSM use in their opinion They ranked gossypol as the number one characteristic that would have to change Availability appeared to be more of a concern to beef and dairy feed formulators than for poultry and catfish formulators
25
Source of Chemical Analyses for Cottonseed Meal
About the same percentage of respondents across animal species perform analytical tests for aflatoxin crude protein fat fiber and gossypol (Figure 22) The only noticeable differences were for aflatoxin and gossypol for which about half the percentage of dairy and beef respondents compared to catfish respondents reported that they routinely perform tests A higher percentage of poultry respondents also appear to perform tests for aflatoxin and gossypol than is the case for beef or cattle respondents Crude protein is tested for by the highest percentage of respondents for all animal species while gossypol is tested for by the smallest percentage of all respondent groups except catfish CSM suppliers are more likely to provide feed formulators with analytical values for crude protein fat and fiber than for aflatoxin or gossypol (Figure 23) A sizeable percentage of the respondents across all animal types reported that their CSM supplier provides no analytical values whatsoever
Summary ofMajor Findings
Of the reams of information normally provided by a study like this relatively little is usually new or profound And of what can be found that appears important only some is little more than interesting or particularly useful Before turning to a discussion of the implications of the study results the major findings across animal groups are briefly summarized first Sifting through the many tables figures and data sets the main findings of the study appear to be the following
bull Quality is the most important factor affecting the choice of dietary proteins by feed formulators followed by consistency and availability Price is the least important of the four factors in making general decisions regarding dietary proteins for animal diets
bull Once feed formulators have set the general parameters for use of dietary proteins in their formulations however price is the most important factor determining the choice among alternative dietary proteins to satisfy the general parameters for dietary protein use in feed formulations
bull When considering whether or not to use CSM as the dietary protein in feeds the nutritional factors of most concern to formulators of feed for non-ruminant animals (poultry and catfish) appear to be protein-related For formulators of ruminant (beef and dairy cattle) feeds aflatoxin level and rumen degradability are the most important nutritional factors
bull The most important non-nutritional factors affecting feed formulators decisions regarding whether or not to use CSM are I) price 2) availability 3) consistent quality and 4) palatability in that order
bull Non-nutritional factors are more important than nutritional factors in the choice of CSM over alternative feeds to fill the dietary protein requirements of feed formulations In general price and availability were ranked above protein quality and other nutrition-related factors as reasons why CSM is and is not chosen as a feed ingredient over alternatives Price and availability were also cited as the characteristics that most need to change in order for CSM to be selected as a feed ingredient more frequently
bull CSM is generally considered to be inferior to higher protein feedstuffs and superior to lower protein feedstuffs This generalization however does not hold for all feeds and all animal types Formulators of ruminant animal feeds ranked many of the higher protein feeds more on a par with CSM than did formulators of non-ruminant animal feeds
26
bull The seasonality of CSM availability is both a positive and a negative factor affecting the use of CSM rather than alternative protein feeds in animal feed rations That is CSM is obviously more likely to be selected as a feed ingredient during months of greater availability than during the months of lower availability In general however the survey responses indicate that CSM is normally available when feed formulators perceive that it needs to be available One word of caution It may be that a higher percentage of CSM users agreed to participate in this survey than those who are currently not using CSM Those who are current CSM users may well have already adjusted their feed purchasing patterns and operations to reflect the seasonal changes in the availability of CSM Consequently current CSM users may perceive less of an availability problem than those who are not currently using CSM In this case the responses to these questions may not be truly representative of the perception of the availability of CSM by feed formulators in general
bull There is a tremendous disparity in the perception of respondents as to the appropriate levels of several key nutrition-related factors for specific livestock rations including energy levels fat levels gossypol levels and escape values (ruminants only) for cottonseed meal For each animal specie the range of variation in the perceived acceptable levels of each of these factors was extremely wide The obvious conclusion is that feed formulators generally lack adequate and reliable information on many factors which are crucial in efficient feed formulation and which have a significant impact on the choice of CSM as a feed ingredient
PROBLEMS AND OPPORTUNITIES FOR EXPANDING COTTONSEED MEAL USE
CSM is somewhat unique among vegetable protein meals in that it is the product of a byshyproduct The volume of the by-product cottonseed available for crushing and the potential supply of CSM depend more on the dynamics of cotton supply and demand than on forces specific to CSM markets This mean that market signals from feed formulators and livestock feeders regarding desired values and characteristics of protein meals likely have little impact on the potential CSM market supply
Since the mid-1970s the share of the annual production of cottonseed fed directly to ruminant livestock has increased steadily from about 5 in 1974 to nearly 40 in 1990 (Figure 24) The consequence has been a marked decline both in the share of the available supply of cottonseed that is crushed and in the ratio of actual to potential cottonseed meal output An increase in the demand for CSM therefore will either bid up the market price of CSM with no additional volume actually used or increase the cottonseed crush to feed use ratio (or some combination thereof) There will be little or no effect on the total amount of cottonseed available
The intent of efforts to expand the market for any commodity is to effect an increase in sales at a higher price For a commodity with a relatively fixed supply the major result of an expansion in demand is solely an increase in price because supply cannot increase to allow an increase in use For a commodity with an unlimited supply successful market expansion efforts simply increase use to the extent of the promotion with no increase in price For a commodity with a supply somewhere in between those two extremes successful market expansion will increase both the price and quantity used Although the situation for cottonseed meal is closer to the fixed supply end of the spectrum market expansion efforts can increase the use of cottonseed meal through an increase in the crush-toshy
27
feed cottonseed use ratio This ratio will increase as the profitability of crushing vs alternative uses of the seed increase
The results of this survey however indicate both some problems and possible opportunities for expanding cottonseed meal use After briefly summarizing the major obstacles as identified in the study the major opportunities for expanding use of cottonseed meal will be discussed
Problems for Expanding Cottonseed Meal Use
The major problems for expanding CSM use are generally well known and verified by the survey results The major problems that would hinder efforts to expand cottonseed meal use identified in the study included primarily the following
bull Price and availability of CSM are the major factors affecting the selection or non-selection of CSM as an ingredient of feed formulations regardless of animal specie These nonshynutritional factors were judged to be more important than nutritional factors in selecting CSM as a feed ingredient Unfortunately neither the price nor the availability of CSM can be controlled or altered substantially or directly by market expansion efforts Some efforts to improve availability may be possible as discussed in the next section
bull CSM is perceived to be inferior in an overall sense to a number of key protein feeds CSM was judged by the survey respondents to be clearly superior in aggregate to only 5 of 20 potential alternate protein feeds Such an image could work against efforts to expand CSM use
bull Gossypol level is one of the top reasons that CSM is not used more frequently particularly in non-ruminant feed rations The level of gossypol is a unique characteristic of CSM that obviously cannot be changed through market expansion activities
bull Several other specific characteristics of CSM would likely need to change for CSM to be selected more frequently as a feed ingredient including amino acid balance energy level aflatoxin level and protein quality As with gossypol changes in these characteristics are out of the realm of market expansion programs
bull Feed formulators generally lack adequate and reliable information on many factors which are crucial in efficient feed formulation and which likely have a significant impact on the choice of protein feedstuffs The use of CSM in livestock feed rations is likely restricted by the wide disparity in the perception of feed formulators regarding the appropriate levels of several key nutrition-related factors for specific livestock rations including energy levels fat levels gossypol levels and escape values (ruminants only) for cottonseed meal
bull Over 75 of dairy cattle feed formulators and nearly half of beef cattle feed formulators utilize whole fuzzy cottonseed to some extent in some of the feed rations they formulate Relatively few reported using utilizing both CSM and whole cottonseed in the same ration A main attraction of the use of whole fuzzy cottonseed as opposed to cottonseed meal is the fiber content Indeed the use of whole delinted cottonseed in cattle feed rations is much lower
28
Opportunities for Expanding Use of Cottonseed Meal
There are essentially only two basic tools to expand the market for any commodity l market development and 2) enhancing the efficiency of the marketing system Market development involves a wide range of activities including primarily new product development and product differentiation In new product development the effort is to develop new products or characteristics of products that appeal to different segments of consumers An example might be research leading to the elimination of gossypol in cottonseed meal which could further open up the non-ruminant feed industry to cottonseed meal
Product differentiation on the other hand encompasses those activities designed to create a user preference for or loyalty to a commodity Product differentiation occurs in two major forms 1) advertising and 2) variation in design and quality of product The primary purpose of advertising is to create user preference for a commodity and convince users of the superiority of a product over competing products Actual physical differences in the product are not necessary to successfully differentiate it from competing products It is sufficient only that users believe that some superiority exists Advertising often intends to create an image of superior quality because such images are harder to imitate or successfully counter than physically unique features Successful differentiation of a product means that users become less sensitive to price changes more willing to pay a higher price for the same quantity because they prefer the product and are loyal to it in the face of price increases In other words users are willing to pay more for the same amount because advertising if successful creates a preference for the product over competing products
Variations in quality and design are usually used along with advertising to differentiate the product of one seller from that of another Such variations are often necessary to help create the superior images desired andor attract new sets of consumers
Often barriers exist in a marketing system that hinder the efficient functioning of the market and restrict the flow of commodities from sellers to users Enhancing the efficiency of the marketing system through eliminating such barriers can lead to an expansion in the use of a commodity One of the primary requirements of an efficiently functioning market is that sellers and users possess adequate and accurate information regarding the product its characteristics availability sources uses and value among other things Inadequate or inaccurate information regarding a particular product and other market characteristics can divert demand to alternative products with which users may be more familiar regardless of whether or not those products are better in some sense
The concept and importance of enhancing market efficiency in this regard can be illustrated by comparing the flow of information about a product and market conditions with a radio broadcasting system The efficiency of such a system depends on how accurately the microphone and other equipment record sound how accurately and rapidly that sound is transmitted to a radio receiver and how accurately the receiver brings sound to the listener A breakdown anywhere along the line in that system will simply mean that the message of the broadcast does not get from the radio station to the listener Also if the message gets through but static interferes with the transmission the listener might only receive part of the message or a garbled message The listeners impressions and actions consequently might be quite different than if he had received the message intended In quite the same manner the flow of a commodity from producers to users is affected by how rapidly and accurately market information is evaluated and how accurately and rapidly this information is transmitted to and among producers and users Any breakdown or static in the system would result in a smaller and more obstructed flow of the commodity to users than if the market operated more efficiently
29
The survey results suggests possible opportunities for expanding CSM use through market development and enhancing market efficiency Market development opportunities may be limited because of the nature of the CSM supply situation Nevertheless expansion of CSM use is possible through a reduction in direct feeding of cottonseed so that opportunities for expanding use through market expansion efforts should not be discounted Efforts to enhance the adequacy and accuracy of information regarding the use of CSM as a feed ingredient however may well be the most effective means of promoting an expansion of use or enhancement of the value of CSM
Opportunities for Expansion through Market Development
Although many product development opportunities likely exist for CSM the survey basically focused on the image of CSM in the perception of feed formulators If a market development approach to expanding the use of CSM as an ingredient of animal feed formulations has any chance of success the survey results suggest that the following components of such a strategy will be crucial
bull Product quality and consistency and an improved image of availability must be the major targets of promotion efforts The survey responses across all animal types unequivocally indicated that these three factors are the prime considerations in making general decisions regarding dietary proteins for animal rations Price only becomes a factor in specific decisions regarding the particular protein feed to use to fill the dietary protein requirements of feed formulations after these general concerns are addressed Creating an image of quality consistency and availability for CSM is a necessary first step to expanding use and enhancing value
bull CSM use expansion efforts must focus to some extent on reducing the direct feeding of whole cottonseed to beef and dairy cattle Reductions in direct feeding is the only chance for an increase in supply of CSM to fuel expanded use in newer markets such as catfish and poultry feeding Also because beef and dairy cattle are major users of cottonseed meal a decrease in feeding of whole cottonseed in favor of CSM would significantly expand use
bull Separate CSM market promotion messages must be developed to address the very different needs and concerns of ruminant vs non-ruminant feed formulators The survey results clearly indicate that many nutritional and non-nutritional factors are more important for nonshyruminant feed formulators than for ruminant feed formulators and vice versa
bull The nutrition-related content of CSM market promotion messages must emphasize primarily positive aspects of CSM protein quality amino acid balance and amino acid availability as well as an accurate understanding of appropriate gossypol and aflatoxin levels Many of these factors however are more important for non-ruminant rather than ruminant feed formulators which must be accounted for in designing appropriate messages for feed formulators of each animal type
bull The non-nutrition-related content of CSM market promotion messages may well be the most important and must emphasize primarily the positive aspects of price availability consistency of quality and storability The survey results attached a relatively high level of importance also to nutrient guarantees Although not scoring particularly high in the responses services available from the CSM industry may also be a helpful component of CSM use promotion messages
30
Opportunities for Expansion through Market Emciency Enhancement
Even though some gains in CSM use and market value can reasonably be expected through market expansion efforts the cost involved could easily outweigh any benefits in terms of enhanced profits to the CSM industry Perhaps the most cost-effective appropriate and useful means of enhancing the use of CSM would be a strategy aimed at improving the level and accuracy of information available regarding CSM and its use Lack of information or misinformation can easily discourage feed formulators from using CSM in their feed formulations Strategies to enhance the quantity and accuracy of appropriate information can take on many forms from media advertising to market news letters Although it is beyond the scope of this study to develop alternative information strategies the results of this study clearly indicate a number of areas in which enhanced and more accurate information is a critical need These include the following
bull The overall quality of CSM The study suggests that the negative aspects of CSM are well known Less well known are the specific positive aspects of CSM that may give it an edge in some sense over other protein feeds
bull The ideal ratio of the price of CSM to other feeds like soybean meal The study results indicate that feed formulators may not be adequately informed about what the ideal market value of CSM is relative to soybean meal given the differences in feeding value As a consequence CSM may currently be less used in relation to soybean meal than current market price ratios suggest should be the case
bull Protein-related factors for CSM use in non-ruminant feeds These factors are a major concern in the decisions of feed formulators to include or exclude CSM in feed rations
bull The relationship of aflatoxin to CSM and the rumen degradability of CSM particularly for beef and dairy cattle feed formulators These were the nutritional factors of greatest concern to ruminant feed formulators in the decision to include CSM in their feed formulations
bull CSM price availability consistency and palatability These were indicated to be the most important non-nutritional factors affecting feed formulators decisions regarding whether or not to use CSM The study indicates that information on non-nutritional factors may be more important in the decision to use CSM over alternative feeds to fill dietary protein requirements of feed rations than information on nutritional factors
bull The feeding value of CSM relative to alternative protein feeds An accurate and detailed assessment of the extent to which CSM may be superior as an alternative to other standard protein feeds would help position CSM appropriately in the market
bull The appropriate and acceptable levels of several key parameters affecting the use of CSM in animal feed rations including energy levels fat levels gossypol levels and escape values (ruminants only) Feed formulators generally lack adequate and reliable information on these and likely other parameters not included in the study which are crucial in efficient feed formulation and which have a significant impact on the choice of protein feedstuffs Although it appears that nearly all feed formulators routinely perform crude protein analyses few perform analyses for aflatoxin gossypol fat fiber and other parameters Also CSM suppliers are apparently doing an inadequate job currently of providing such information to feed formulators
31
SOME CONCLUDING COMMENTS AND RECOMMENDATIONS
This study assessed the potential problems and opportunities for expanding the use of CSM through an analysis of the perceptions of feed formulators regarding the use of CSM as an animal feed ingredient The perceptions of feed formulators regarding CSM as a protein feed largely define the boundaries within which CSM use will be able to achieve any significant growth in the future Their perceptions right or wrong are the key to understanding not only the problems facing CSM use but also the opportunities
The general conclusion of the study is an obvious one the use of CSM in feed formulations faces some major challenges in the future Chief among these include a perception among feed formulators that price availability quality and other key CSM characteristics are often obstacles precluding increased use of CSM in their feed formulations Perhaps the most important implication of the study is that a serious lack of adequate and accurate information among feed formulators regarding the characteristics parameters value and other aspects of cottonseed meal use in animal feed rations may be seriously restricting the market opportunities for cottonseed meal U nfortunately the development of alternative strategies to expand the use of CSM and enhance the efficient functioning of CSM markets through more accurate and available information on all aspects of CSM use in feed formulations is beyond this study Nevertheless a few recommendations pertinent to the development of such alternative strategies are in order
bull Before adopting any approach to expand the use of CSM it would be useful first to conduct a detailed analysis of the costs and benefits involved Market promotion efforts through advertising can be extremely costly and yield relatively little Research has also shown that there is often a tremendous lag between advertising and promotion expenditures and any associated returns It could take years of investment in such market expansion efforts before an accurate measurement of the actual return on investment could even be attempted
bull Consider developing first a detailed plan for information dissemination to the feed industry regarding all appropriate aspects of CSM use in feed rations as determined in this study An important part of this process would be a comprehensive assessment of the information needs and the information resources readily available The gap discovered in this way between needs and resources will help set the research agenda for the industry to fill the critical existing information gaps
bull Initiate a study of final user attitudes and perceptions of CSM use as a guide to future market expansion efforts This study considered only the perceptions of feed formulators regarding the use of CSM But feed formulators are often not the final users Consulting nutritionists for example often include or exclude certain feeds and feed types from their formulations as requested by feed users At least a few of the respondents to the survey conducted for this study indicated that user preferences are major factors determining whether or not CSM is included in their feed formulations Indeed markets operate as the interaction of supply and demand to determine prices The preferences of final users ultimately will be expressed in the market values of any product in any market unless sufficient obstacles exist to prevent the market from functioning properly Therefore the real decision-makers in the use CSM in the market may well include many more individuals than adequately represented by feed formulators
32
REFERENCES
US Department of Agriculture (USDAa) Feed Situation and Outlook Report Economic Research Service FDS series various issues
US Department of Agriculture (USDA b) Oil Crops Situation and Outlook Yearbook Economic Research Service OCS Series various issues
Figure 1 Quantity of Oilseed Meals Fed to Livestock 194849 - 198590 (Average)
(1000 Tons)
25000 0-1-----------------------shy
20000 I-~
15000
10000
5000
o L 1 J tJ t tmiddotmiddotmiddot 1 oj 1 to bullbull 1 L_ n __LLL I 1 bullbull I V I
1948-49 1950-54 1955-59 1960-64 1965-69 1970-74 1975-79 1980-84 1985-90
(Years)
n iflu Soybean Meal bull Cottonseed Meal Other Oilseed Meals
Source USDA
c
8 c a CD
en ~
--I _ scg ~CD 01)-- en - () mg0 s 0
JCD enOJ CD_CD en 0
sCDCD 0 OJ shyo OJ r Jlt- 0 m CJ) 0 0lt o 0shyCD OJ J
~s ~m cpCJ) r co OJco ~m a
Figure 3 Price Premium (+) or Discount (-) of Cottonseed Meal Relative to Soybean Meal 1956-1990
~~ ~
o I ~ I I
-20 f---
-40
-60
1~1~1~1~1~1~1~1~1~1~1~1~1~1~1~1~1~1~
Cottonseed meal price is adjusted to a soybean meal protein equivalent basis
~I------------------------------------------------------
l l A
I~middotmiddot--- --------
Figure 4 Animal Species for which Respondents Formulate Feeds
DAIRY CATILE
BEEFCATILE
HORSES
SHEEP
BROILERS
LAYERS
OTHER
PETS
TURKEY
SWINE
CATFISH
210
21000
0 5 1000 15 20 25
Figure 5 Respondents Formulating Feeds for the Various Animal Species
0 20 40 60 80
Figure 6 Other Animal Species for Which Respondents Formulate Feeds
DAIRY CATTLE
BEEF CATTLE
HORSES
SHEEP
BROILERS
LAYERS
OTHER
PETS
TURKEY
SWINE
CATFISH
632
Exotics
Trout
Alligators
KOI
Breeding Hens
Wildlife
Rabbits
Avian
Shrimp
Salmon
Ducks
Fish
Gamebirds
Hybrid Bass
379
~--~----~--~----~----~--~----~--~----~--~
0 10 20 30 40 50
Figure 7 Respondent Feed Formulation Activities by State
( of Respondents)
o 00 middot15 16 -30 31 middot45Cgt 46 -60 61 - 75 - 76 -90
Table 8 Respondent Experience as an Animal Nutritionist
( of Respondents) 30 r---shy
25 t-middotmiddotmiddotmiddotmiddotmiddotmiddotmiddotmiddotmiddotmiddotmiddotmiddot-middot ---_ _
20 -_ -nNItshy
15
10
5
0 1-5 6-10 11-15 16-20 21-25 26-30 31-35 36-40 41-45
(Years Of Experience)
-it sa 0 m 8 l 0 CD l g
_ cc c -s CD CObull
-0 -s- 3 Dl ~ IJ CD (fJ
C 0 l C CD l -+
raquo Sl_ lt_ -+_ CD (fJ
Figure 10 Respondent Primary Feed Formulations
by Animal Type 1990 (Percent)
30 I--------------------------------------------------------shy
25 r- middotmiddotmiddotmiddotmiddotmiddot231middotmiddotmiddotmiddot
20
15
10
5
0 Beef Dairy Swine Poultry Horses Pets Aqua- Sheep Exotics
Cattle Cattle culture amp Goats
(Animal Type)
Figure 11 Percent of CSM and S8M Used in Formulations by Feed Manufacturer Respondents 1990
( of Average Feed Ration)
Figure 12 Tons of Feed Formulated by Feed Manufacturer Respondents 1990
65
91
6 9
17
Total Formulations Formulations With CSM
II Less than 200000 Tons
II 200000 - 400000 Tons bullbullbull I bullbullbullbullbullbull ~ 3 ~ 400000 - 600000 Tons
5 rn 600 000 - 800 000 Tonsru 1
[] 800000 - 1000000 Tons9 4
I ~ 1 More Than 1000000 Tons
Formulations With S8M
Figure 13 Percent middotof Beef Cattle Respondents Formulating CSM Feeds for Specific Beef Cattle Types
( of Respondents)
25 ~I------------------------------------------------------~
-Isectig Feedlot-II 223
20
15
10
5
0
bull Other
~ middotmiddotmiddotmiddotmiddotmiddotmiddot middotmiddot _middotmiddotmiddotmiddot-=middotmiddotmiddotccmiddotcmiddotmiddot
Brood Cows Bulls Calves Feeder Heifer Stocker
(Animal Type)
Figure 14 Percent of Dairy Cattle Respondents Formulating CSM Feeds for Specific Dairy Cattle Types
( of Respondents)
120 ----------------------
100 88
80
60
40
20
0 Calves Heifers Lactating Cows Dry Cows
(Animal Type)
Figure 1-5 Percent of Poultry Respondents Formulating CSM Feeds for Specific Poultry Types
( of Respondents)
OO~I--------------------------------------------~-
50 1-laquolaquolt--laquolaquolaquo -lt - lt - lt -lt laquo lt
44
40
30
20
10
0
f-
~laquolaquolaquolaquo
~laquolaquolaquolaquolaquolaquo
Broilers Layers Turkeys Breeding Flocks
(Animal Type)
Figure 16~ Combined Responses Months of the Year When CSM IS NOT Available
( of Respondents) 16 i ---
14 12~8
12
10
87373 7
6
4
2
0 ~~ ~s ~( ~( ~0( ~0(~~~ ~~ ~t ~1 u~ ~g n0~ ad-o N0~ ~a~
~Y ~o Q~lmiddotr
(Month)
Figure 17 Combined Responses Months of the Year When CSM Needs to Be Available
( of Respondents) 12 ---------------------------
10
8
6
4
2
0
goA 9
~ui ~s ~Ot X)Ot ~Ot X)Ot~0SV~0~~erl ~iSclt ~f ~~1 ~v~ ug ~o~ o~o NO~ co~0 0lt609 ~o
(Month)
Figure 18 Beef Cattle Responses Percent of Respondents Formulating Creep Feed for Calves or Supplements for Stockers
733
832
0 20 40 60 80 100 120
( of Respondents)
Figure 19 Beef Cattle Responses Protein-Related Factors Considered When Balancing Rations
Other Protein Factors 110
Rumen
Degradability 686
Crude Protein Level 161
Amino Acid
Values 42
( of Respondents)
Figure 21 Comparison of Responses Months When CSM Needs to Be Available
( of Respondents) 94 ---------------------------shy
92
9
88
86
84
82 8
78
76
74
72
7
68
66
~ euroI - It
64 -t----------------------------------- -----------t
JAN FEB MAR APR MAY JUN JUL AUG SEP OCT NOV DEC
(Month)
bull Beef Cattle -t Dairy Cattle ltgt Poultry Catfish
Figure 20 Comparison of Responses Months When CSM Is Not Available
( of Respondents)
16 t 15
14
13
12
11
10
9
8ltl amp
7
6
5 I JAN
I
FEB I
MAR I
APR I
MAY I
JUN I
JUL I
AUG SEP I
OCT NOV I
DEC
(Month)
bull Beef Cattle -t Dairy Cattle ltgt PouHry b Catfish
Figure 22 Comparison of Responses Analyses Routinely Performed
( of Respondents)
100~-----------------------------------------------
90
80
70
60
50
40
30
20
10
o I ~
AFLATOXIN C PROTEIN FAT FIBER GOSSYPOL OTHER NONE
(Analyses)
bull Beef Cattle Dairy Cattle o Poultry Catfish-t fj
Figure 23 Comparison of Responses Analytical Values Provided by Supplier
( of Respondents)
60shy
50
4)
30
20
10
o amp ~
AFLATOXIN C PROTEIN FAT FIBER GOSSYPOL OTHER NONE
(Analyses)
bull Beef Cattle -t Dairy cattle o Poultry b Catfish
Figure 24 Share of Cottonseed Use Crush vs Feed Use
( of Respondents)
100 I
90
CRUSH 80
70
60
50
40
30
20
FEED USE 10
o 1~ 1~ 1~ 1m 1m 1~ 1~ 1~ 1~ 1~ 1~ 1~ 1~ 1~
(Year)
Source USDAb
Table 1 Percentage of Beef Cattle Feeds Formula ted Table 2 CSM Feeds Formulated for Beef Cattle CSMmiddot Calvesmiddot
middotAverage Response Rate (feedlot=51 other=41) middotResponse Rate = 39
Table 3 CSM Feeds Formulated for Beef Cattle Table 4 CSM Feeds Formulated for Beef Cattle Stockersmiddot
middotResponse Rate = 40
Response Rate =37
Table 5 CSM Feeds Formulated for Beef Cattle Table 6 CSM Feeds Formulated for Beef Cattle
middotResponse Rate =33
middotResponse Rate = 37
Table 8 Percentage of Dairy Cattle Feeds Formulated CSM
Average Response Rate =88
middotResponse Rate = 37
Table 9 CSM Feeds Formulated for Dairy Cattle Table 10 CSM Feeds Formulated for Dairy Cattle
RespooseRate 24
middotResponse Rate = 34
Table 11 CSM Feeds Formulated for Dairy Cattle Table 12 CSM Feeds Formulated for Dairy Cattle
Response Rate = 31 Response Rate = 45
Table 13 Percentage of Poultry Feeds Formulated Using CSMmiddot
bullAverage Response Rate = 79
Table 14 Percentage of Catfish Feeds Formulated Using CSMmiddot
bullAverage Response Rate =67
Table 15 CSM Feeds Formulated for Catfishmiddot )middoti middot fteq~
bullAverage Response Rate = 17
Table 16 Combined Responses Importance of Specific Factors in Choice of Dietary Protein ( of
bullAverage Response Rate =g]
Table 17 Combined Responses Other Important Factors in
bullAverage Response Rate = 22
bullAverage Response Rate =91
-Average Response Rate =90
Table 20 Combined Responses Importance of Non - Nutrition -Related Factors in Choice of CSM over Alternative Protein Feeds ( of
-Average Response Rate = 87
Table 22 Combined Responses Top S Reasons Why CSM IS NOT Selected as a Feed
Table 23 Combined Responses Top 5 Specific Characteristics That Would Have to Change for CSM to be Selected as a Feed
Table 24 Combined Responses Analysis Routinely Performed
Table 25 Combined Responses Analysis Values Provided
CSM
267 067 333 333 1400 S333
467 000 067 067 1400 4867 --shy
467 000 000 067 400 4333 --shy -- shy -- shy
250 000 000 000 1250 4000 -- shy --shy
313R 4733 62 ------ shy~ - shy ~-
4S00 62
bullAverage Response Rate = 100
bullAverage Response Rate = 87
Table 28 Beef Cattle Responses Imponance of Nutrition-Related Factors in Choice of CSM Over Alternative Protein Feeds
Average Response Rate = 91
Table 29 Beef Cattle Responses Other Nutrition - Related
Fact~~~~~~~~~~~~~~~~~~~
Response Rate =7
Table 30 Beef Cattle Responses Imponance of Non - Nutrition - Related Factors in Choice of CSM Over Alternative Protein Feeds
middotAverage Response Rate = 87
middotResponse Rate = 5
bullAverage Response Rate =14
Table 33 Beef Cattle Responses Months of the Year When CSM Needs to Be AvaiJable I ii middot middot1
bullAverage Response Rate =53
10 U
-Moy
JIIJ
All
so
0_ -
to
--I No
Moy
10 -so shy
0_ _ 0-
Table 35 Beef Cattle Responses Top 5 Reasons Why CSM Is Not Selected as a Feed
Average Response Rate =100 Response Rate = 24
Response Rate =28
Average Response Rate = 98
Response Rate = 17
middotResponse Rate =9
Table 43 Beef cattle Responses Type of Creep Feed
middotResponse Rate = 81
middotResponse Rate =26
Table 45 Beef cattle Responses Respondents Formulating Rations With CSM and Whole
middotResponse Rate = 68
Table 47 Beef cattle Responses Percentage of Whole Cottonseed Respondents Mix in Rations Containing Both CSM and Whole Cottonseedmiddot tCmiddotHiitjt~ middotmiddotmiddotmiddot1
middotResponse Rate =25
middotResponse Rate = 30
bull Response Rate = 98
Response Rate =11
Table 51 Beef Cattle Responses Escape Value Respondents Are Using for Rumen Degradabilitymiddot
1~iiii middotb~r~~fgtD zq436imiddotmiddotmiddotmiddotmiddotmiddotmiddot 004bullbullbullbullbullbullbullbullbullbull1----22--+----31-4
I~~I 23 329
middotResponse Rate = 57
Table 53 Beef Cattle Responses Methods or Sources Respondents Used to Calculate CSM
Table 52 Beef Cattle Responses Reliability of Escape Values Used
Table 54 Beef Cattle Responses Interested in Knowing Escape Values for CSM Processed
Valuemiddot
middotResponse Rate =98
)
I Mean ~nse
63 57S19 228381 Q-L_uu ~139 59468 32306 139bullII1 1 061 06
1 1 44 430 614431-------- 57t 001 001 middot-1
==~=-__~~1c9 00 _ 06 _ 001_ 38 133 323 63
Average Response Rate =100
Response Rate = 89
Table 58 Dairy Cattle Responses Importance of Nutrition - Related Factors in Choice ofCSM Over Alternative Protein Feeds (ofbmiddotNmiddotmiddotmiddotmiddotmiddotmiddot
Response Rate =88
Table 59 Dairy Cattle Responses Other Nutrition-Related Factors
Indicated br~~P211dents
Response Rate =10
Table 60 Dairy Cattle Responses Importance of Non- Nutrition - Related Factors in Choice of CSM Over Alternative
Protein Feeds ( ofResPOndents~dd
Response Rate = 88
Response Rate = 3
--
Average Response Rate = 51
Table 62 Dairy Cattle Responses Months in the Year When CSM IS NOT Available
10 u
J -- AIIIi
--~ shy
loOoIMr _ 0-
bullAverage Response Rate =69
--- AIIIi
--~ soM
0
0-_
10
Table 65 Dairy Cattle Responses Top 5 Reasons Why CSM IS NOT Selected as a Peed
Table 66 Dairy Cattle Responses Top 5 Specific Characteristics That Would Have to ro1 ____ for CSM to be Selected as a Feed
Table 67 Dairy Cattle Responses Analyses Routinely Performed fmiddotmiddotmiddotmiddot
Response Rate =96
Response Rate =56
Table 68 Dairy Cattle Responses Other Analyses
Response Rate =25
Table 70 Dairy Cattle Other Analytical Values CSM
Response Rate =4
Average Response Rate =81
Average Response Rate = 15
Table 73 Dairy Cattle Responses Respondents Formulating Feeds With Whole andor Delinted
Cottonseed bull
bullAverage Response Rate =92
middotResponse Rate = 40
Table 74 Dairy Cattle Responses Respondents Formulating Rations with Cottonseed Meal and Whole Cottonseed in the Same Rationmiddot
middotResponse Rate = 97
Table 76 Dairy Cattle Responses Percentage of Whole Cottonseed Respondents Mix in Rations
ltltJIltainin(a0th CSM and WhoeCottonseedmiddot Mean
middotResponse Rate = 42
Table 77 Dairy Cattle Responses Knowledge of Research on Feedine CSM
~~~~
Average Response Rate = 68
Response Rate =7
Average Response Rate =59
Response Rate =25
Average Response Rate =63
Response Rate = 13
middotResponse Rate = 92
Response Rate =82
Table 85 Dairy Cattle Responses Methods or Sources Used to Calculate CSM
Response Rate = 73
Table 86 Dairy Cattle Responses Respondents Interested in Knowing Escape Values for CSM Processed from Different Methodsmiddot fmiddotmiddotmiddotmiddotmiddotmiddot
Response Rate = 92
Response Rate = 34
Table 89 Dairy Cattle Responses Suggestions for CSM
Response Rate =33 Response Rate =22
-----
64 139 24815 00 36 511 5751
5951 131 438 35015 00 15 I-~~~~~
6200 15 423 51151 00 00 ~~~ -~~~ -~~~ ~~~-~~ --~~ ~ ~ ~~-~ ~
292 55125 00 00 125 45800
bullAverage Response Rate =99
Average Response Rate =85
Table 92 Poultry Responses Importance of Nutrition - Related Factors in Choice of CSM Over Alternative Protein Feeds (of
Average Response Rate =85
Table 93 Poultry Responses Other Nutrition-Related Factors Indicated
200
200
Response Rate = 5
Table 94 Poultry Responses Importance of Non - Nutrition - Related Factors in Choice of CSM Over Alternative Protein
Feeds~~~~~~~~~~5=~~~~~T7~~
00 Average Response Rate =83
Response Rate =4
Average Response Rate = 17
Table 97 Poultry Responses Months in the
J
p
April
lao
A
shy-- 0
ft
April
_
Average Response Rate = 43
=1 g L
0
Table 99 Poultry Responses Top 5 Reasons Why CSM IS NOT Selected as a Feed
Table 100 Poultry Responses Top 5 Specific Characteristics That Would Have to Change for
CSM to be Selected as a Feed Inoredient
Table 101 Poultry Responses Analyses Routinely
middotResponse Rate = 93
Table 102 Poultry Responses Other Analyses Routinely
Performed
middotResponse Rate = 27
Table 103 Poultry Responses Analytical Values Provided
middotResponse Rate =73
Table 104 Poultry Responses Knowledge of Problems
bullAverage Response Rate = 62
Average Response Rate = 14
Table 106 Poultry Responses Protein - Related Factors
Average Response Rate = 64
Table 107 Poultry Responses Other Protein - Related
Response Rate =11
Table 108 Poultry Responses Crude Protein Levels
Preferred for CSM
Response Rate = 55
Table 111 Poultry Responses Gossypol Levels Considered
Safe
Table 112 Poultry Responses Would or Do Use Table 113 Poultry Responses Relative Feeding Value of CSM Comoared to 44 SBMmiddot
middotResponse Rate = 96
bull Response Rate = 100
Table 114 Poultry Responses Knowledge of Table 115 Poultry Responses Familiarity with Other Feedino CSMmiddot
middotResponse Rate =7 bull Response Rate = 73
middotResponseRate = 31
bullAverage Response Rate = 58
Table 118 Poultry Responses Willingness to Pay
a Premium Per Unit of Protein for CSM With More
Than 41 Protein
bullResponse Rate =91
Table 119 Poultry Responses Percent of Cost of SBM Respondents Willing to Pay for CSM with
Response Rate =27
Response Rate =64
00 00 87 43 478 304 57 00 00
----shy I--~~
00 ~-~
43 522 348 59 ----shy
62~ 00 00 00 261 ----shy
652 ------shy
00 00 00 00 667 333 63 AverageResponseRate = 99
bullAverage Response Rate = 73
Table 123 Catfish Responses Importance of Nutrition - Related Factors in Choice of CSM Over Alternative Protein Feeds
Average Response Rate =83
Table 124 Catfish Responses Importance of Non- Nutrition - Related Factors in Choice of CSM Over Alternative Protein
Feeds
Average Response Rate = 90
bullAverage Response Rate = 13
Igt 20
s_
Pshy s
--s
H_
_
gt 7 bull bull bull bull bull
1 fsI plusmn -
haMr
N__
shy
bullAverage Response Rate =54
Table 128 Catfish Responses Top 5 Reasons Why CSM IS NOT Selected as a Feed
Table 129 Catfish Responses Top 5 Specific Characteristics That Would Have to Change for CSM to Be Selected as a Feed-_
Table 130 Catfish Responses Analyses Routinely Table 131 Catfish Responses Other Analyses Routinely Performed
middotResponse Rate = 25
middotResponse Rate =92
bullAverage Response Rate = 18
Table 133 Catfish Responses Knowledge of Problems Feedine CSM to CatflSh
Average Response Rate =100
Table 134 Catfish Responses Protein - Related Factors Considered i
Response Rate = 83
Table 135 Catfish Responses Crude Protein Levels Preferred for CSM
Response Rate = 100
Table 139 Catfish Responses Would or Do Use Table 140 Catfish Responses Relative Feeding
Value ofCSM Compared to 44~ Lmiddotmiddotmiddotmiddotmiddotmiddotmiddotmiddotmiddotmiddotmiddotmiddotmiddotmiddotmiddotmiddotmiddotmiddotmiddot _
Response Rate = 100
Response Rate = 100
Table 141 Catfish Responses Knowledge of Research on Table 142 Catfish Responses Sources ofInformation
Average Response Rate = 83
bullAverage Response Rate = 44
Table 143 Catfish Responses Willingness to Pay A Premium Per Unit of Protein for CSM with More Than
middotResponse Rate = 100
Table 144 Catfish Responses Percent of Cost of SBM Respondents Willing to Pay for CSM with Sufficiently Low Goscvnol and Fiber Levelsmiddot
middotResponse Rate = 83
middotResponse Rate = 25
Table 146 Comparison of Mean Responses and Analysis of Variance (ANOVA) Importance of Specific
bull Scale of 1 (extremely unimportant) to 7 (extremely important) for the mean ranking a Mean significantly larger across animal types at the 5 significance level otherwise no difference b Mean significantly lower across animal types at the 5 significance level otherwise no difference
Table 147 Comparison of Mean Responses and Analysis of Variance (ANOVA) Ranking of Other Protein
bull Scale of 1 (CSM inferior to respective feed) to 7 (CSM superior to respective feed) for the mean ranking
a Mean significantly larger across animal types at the 5 significance level otherwise no difference
b Mean significantly lower across animal types at the 5 significance level otherwise no difference
Table 148 Comparison ofMean Responses and Analysis of Variance (ANOVA) Importance of Nutritionshy
Related Factors in Choice ofCSM Over Alternativesmiddot
bull Scale of 1 (extremely unimportant) to 7 (extremely important) for the mean ranking a Mean significantly larger across animal types at the 5 significance level otherwise no difference
b Mean significantly lower across animal types at the 5 significance level otherwise no difference
Table 149 Comparison of Mean Responses and Analysis of Variance (ANOVA) Importance of Nonshy
Nutrition- Related Factors in Choice of CSM Over Alternativesmiddot
bull Scale of 1 (extremely unimportant) to 7 (extremely important) for the mean ranking
a Mean significantly larger across animal types at the 5 significance level otherwise no difference
b Mean significantly lower across animal types at the 5 significance level otherwise no difference
- = Not mentioned or ranked lower than 4th place
Table 151 Comparison of Responses Top Responses Why CSM IS NOT Selected as a Feed
- = Not mentioned or ranked lower than 5th place
Table 152 Comparison of Responses Top Characteristics that Have to Change for CSM to Be
- = Not mentioned or ranked lower than 5th place

13
ration with CSM to the various dairy cattle types 2) details on dairy cattle feed formulations containing whole cottonseed 3) sources of information utilized on formulating dairy cattle feeds 4) protein-related factors considered when balancing rations for dairy cattle 5) gossypol levels considered to be safe for mature dairy cattle and pre-ruminant calves and 6) an open-ended question soliciting suggestions to improve the usefulness or value of CSM for dairy feed formulations
Problems from Feeding CSM Rations to Dairy Cattle
Again very few respondents indicted knowledge of any problems resulting from feeding a ration containing CSM to dairy cattle (Table 71) Only 24 of the respondents indicated problems with calves and only 18 for lactating cows as the result of feeding rations with CSM Only about 3 of the respondents mentioned problems with either dairy heifers or dry cows The number one problem reported was gossypol toxicity primarily in creep feeds and complete rations (Table 72) Both palatability and poor performance problems for various feed types were also frequently mentioned Again however the low number of respondents indicating problems of any type suggests that the problems reported were likely isolated cases
Details on Dairy Cattle Feed Formulations Containing Whole Cottonseed
Over 75 of dairy cattle respondents formulate feeds using whole fuzzy cottonseed a much higher percentage than was the case for beef cattle Less than half of the dairy cattle respondents however utilize delinted cottonseed in their feeds more in line with the beef cattle results (Table 73) Less than half the respondents formulate rations that include both CSM and whole cottonseed (Table 74) For those who formulate rations that include both the mix of the two in the rations varies widely Respondents reported that the share of such rations accounted for by CSM ranged from 1 to 30 with a mean of 85 (Table 75) The share of those rations accounted for by whole cottonseed ranged from 3 to 100 with a mean of 16 (Table 76) It appears therefore that on average dairy feeds formulated with both CSM and whole cottonseed contain a higher percentage of whole cottonseed than of CSM This is just the opposite of the situation for beef cattle
Sources of Information Utilized on Formulating Dairy Cattle Feeds
Over 80 of the dairy cattle respondents indicated that they were familiar with research on feeding CSM to mature dairy cattle (Table 71) Only half however indicated familiarity with such research for pre-ruminant calves Less than 10 of the respondents listed any other research on feeding CSM to other types of dairy cattle (Table 78) The largest number of respondents (137 of 143 respondents) indicated that they utilize university research to obtain information on formulating feeds for dairy cattle followed by industry publications of some type (121 respondents) and university extension service (83 respondents) (Table 79) Only 36 respondents listed other sources of information including primarily personal experience and research (Table 80)
Protein-Related Factors Considered for Balancing Dairy Cattle Rations
Nearly 100 of the dairy cattle respondents indicated that both crude protein level and rumen degradability are factors they consider when balancing rations for dairy cattle a much higher level than is the case for beef cattle (Table 81) Less than half consider amino acid values (61 of 143 respondents) Only 19 respondents indicated that they consider other factors like protein solubility (Table 82)
Dairy cattle respondents indicated a even wider range of escape values (or by-pass values) that they are using for CSM than did beef cattle respondents from 0 to over 80 (Table 83) The mean escape value calculated from the responses is 40 Dairy cattle respondents indicated slightly more
14
confidence in the escape values they are using than was the case for beef (Table 84) Only 22 respondents however considered those escape values to be reliable or extremely reliable The principal single method or source used by respondents for the escape value they use was again the National Research Council (Committee on Animal Nutrition National Academy of Sciences) (Table 85) Book values was the next most frequently mentioned single source of CSM escape values (23) Finally nearly 100 of the respondents indicated an interest in obtaining information on escape values for CSM as processed by different methods (Table 86) The conclusion from the dairy cattle responses is the same as for beef cattle That is there appears to be a lack of reliable information on CSM escape values in the perception of dairy cattle feed formulators and that they are highly interested in obtaining more information in this regard
Gossypol Level Considered Safe for Mature Dairy Cattle and Pre-Ruminant Calves
Dairy cattle respondents appear to have little idea of what the safe levels are for gossypol in mature dairy cattle and pre-ruminant calf feeds First of all only one-third of those who returned surveys even attempted to provide numbers for safe gossypol levels (Tables 87 and 88) Many respondents simply wrote comments such as dont know or not aware of research on safe gossypol level in the margin of the survey beside the question Second those who attempted to answer the questions provided an amazingly wide range of safe gossypol levels from 0 parts per million (ppm) to 7500 ppm for mature dairy cattle and from 0 ppm to 1000 ppm for pre-ruminant calves The mean safe gossypol levels were 609 ppm for mature dairy cattle and 121 ppm for pre-ruminant calves The responses were spread quite evenly between the extremes around the means It should be noted that the research team checked and rechecked the data set for this question to insure there were no errors in data entry
Suggestions for Improving the Usefulness of Cottonseed Meal
Only about 22 of the dairy cattle feed formulators that returned surveys provided suggestions that might improve the value or usefulness of CSM in dairy cattle feed rations (Table 89) Some of the more frequent suggestions dealt with improving the consistency and availability of CSM Several respondents suggested the need for more information on gossypol a worthy suggestion given the results of the previous question
Poultry
The perceptions of poultry feed formulator respondents concerning the use of cottonseed meal differ importantly in many respects from the combined responses over all survey respondents and from those of beef and dairy cattle Many of the differences are likely the result of the distinct dietary needs of ruminant as opposed to non-ruminant animals The salient differences in responses by poultry feed formulators in the 6 general question areas include the following
bull Factors affecting choice of dietary proteins Surprisingly there was little difference in the responses of those indicating that they formulate feed for poultry than for the combined results (or for beef and dairy cattle) regarding the importance of the listed factors (quality price availability consistency and other) affecting the choice of dietary protein (Table 90) A large majority of poultry feed formulators ranked all factors as either important or extremely important The only exception is that consistency was ranked slightly less important by poultry respondents than by respondents in general
bull Cottonseed meal as an alternative protein feed Poultry respondents ranked more protein feeds as higher on the superior-to-CSM scale than was the case for the combined responses
15
(Table 91) In fact the mean rank of all but three of the protein feeds were all at least somewhat higher than was the case for the combined responses The mean rank of several of the other protein feeds as determined by the poultry respondents was much higher than for the combined responses including fish meal poultry by-product meal and soybean meal Poultry by-product meal changed from an inferior to a superior protein feed compared to CSM The protein feed judged by poultry respondents to be most superior to CSM for poultry rations was soybean meal while urea was ranked as most inferior Poultry respondents also appeared to have stronger opinions about whether or not CSM is an alternative to the other listed protein feeds than was the case for the combined responses They overwhelmingly perceived that CSM is not an alternative to many of the other protein feeds including fish meal dried skim milk dried whole milk poultry by-product meal blood meal tankage and urea A larger percentage of poultry respondents than was the case for dairy and beef cattle perceived however that CSM is a definite alternative to many other protein feeds including safflower meal sunflower meal linseed meal peanut meal canola meal feather meal distillers dried grains brewers dried grains and even soybean meal
bull The importance of nutritional and non-nutritional factors Poultry respondents ranked all but two of the listed nutrition-related factors as more important in the choice of CSM over alternative protein feeds for poultry rations than was the case for the combined responses on average (Le comparing mean responses) (Table 92) The highest percentage of poultry respondents ranked gossypol level (62 of the respondents) amino acid balance (59) aflatoxin (58) protein quality (57) and amino acid availability (57) as extremely important in the choice of CSM over alternative protein feeds Only about 5 of the respondents listed other important nutrition-related factors (Table 93) There are few differences however in the poultry responses as compared to the combined responses regarding the importance of non-nutrition-related factors (Table 94) The major difference is a much lower ranking of the importance of palatability in choosing CSM over alternative protein feeds Also a somewhat higher percentage of poultry respondents ranked price as an extremely important non-nutrition-related factor Few other non-nutrition-related factors were listed by the respondents (Table 95)
bull Seasonality of cottonseed meal availability The results for the poultry respondents regarding the months of the year when CSM is not available are highly consistent with those for the combined responses and those for the beef and dairy cattle responses Poultry respondents indicated that May through September are the months of least availability of CSM (Table 96) But likely because of the shorter production cycle for poultry than for cattle poultry respondents indicated that CSM needs to be available in almost every month (but slightly less so in August and September) for CSM to compete effectively with alternative protein feeds (Table 97) For poultry therefore the indication is that poultry feed formulators may perceive an availability problem which inhibits greater use of CSM in poultry rations to some extent
bull Reasons for the selection and non-selection of cottonseed meal Again price and availability are the number one and number two reasons respectively cited by poultry respondents for which CSM is selected as a feed ingredient (Table 98) Protein quality ranked third on their list followed closely by phosphorous content The top reason that CSM is not selected according to the poultry respondents was pricevalue (Table 99) About tied for second place were gossypol content and availability More respondents ranked availability as the second reason than for gossypol content but more respondents listed gossypol first The amino acid level was listed as a distant fourth reason for which CSM is not selected as a feed ingredient Price is again the key CSM characteristic that poultry respondents indicated must change in
16
order for CSM to be used more frequently in poultry rations (Table 100) Gossypol was clearly considered to be the second most important characteristic that must change Availability was ranked as either first or second by all respondents who listed it as a characteristic that must change
bull Source of chemical analyses for cottonseed meal The results for the chemical analyses performed by poultry respondents are similar to those of both the combined results and those of the beef and dairy cattle results The primary analysis routinely performed by the poultry respondents is crude protein (51 of 55 respondents) followed by fat (40 respondents) fiber (37 respondents) and aflatoxin (31 respondents) (Tables 101 and 102) The primary analytical values supplied to the poultry respondents also included crude protein fiber and fat (Table 103) A third of the poultry respondents indicated that their CSM supplier does not provide them with any analytical values Once again even though aflatoxin was ranked as an extremely important nutrition-related factor in the choice of CSM as a feed component only I respondent obtains an analytical value for aflatoxin from his CSM supplier and only a little over half routinely perform their own aflatoxin analyses
Poultry sample members were asked some specific questions regarding the use of CSM in poultry feed formulations in 5 general areas I) problems resulting from feeding a ration with CSM to the various poultry types 2) specific information on several key nutrition-related factors affecting the use of CSM in poultry rations 3) sources of information utilized on formulating poultry feeds 4) CSM price and value and 5) an open-ended question soliciting suggestions to improve the usefulness or value of CSM for poultry feed formulations
Problems from Feeding CSM Rations to Poultry
The majority of poultry respondents indicated no knowledge of any problems associated with feeding a ration containing CSM to poultry (Table 104) Only 14 of the respondents indicated problems with broilers less than 7 for breeding flocks and about 3 for turkeys Over a third however indicated that they had knowledge of such problems with layers The number one problem reported was yolk molting and discoloration primarily in layer rations (Table 105) A few respondents indicated problems with depressed growth associated with broiler feeds containing CSM
Information on Key Nutrition-Related Factors for Poultry Rations
The survey sample members were asked to respond to a number of specific questions related to nutritional factors that affect the use of CSM in poultry rations including protein energy fat gossypol and synthetic amino acids They were then asked to indicate their perception of the overall feeding value of a standard 41 protein CSM compared to that of a standard 44 protein soybean meal The questions were designed primarily to determine the extent of knowledge among feed formulators concerning these factors as they relate to the use of CSM and the relative feeding value of CSM
Sample members were asked to respond to two questions regarding protein in poultry feed rations They were first asked to indicate the specific protein-related factors that they consider when balancing rations for poultry They were given a list of three factors (crude protein level amino acid content and amino acid availability) They were also allowed to specify any other protein-related factors they consider when balancing poultry rations They were then asked to indicate the crude protein levels they would prefer for cottonseed meal and were given a choice of four levels (3641 (standard) 44 and 48) and allowed to suggest any other preference for crude protein level
17
Almost all poultry respondents indicated that they consider amino acid content and availability when balancing feed rations with fewer responding that they consider the crude protein level (Table 106) Other protein-related factors listed by the respondents included amino acid balance protein digestibility and energy levels (Table 107) With regard to preferred crude protein level for CSM over half of the poultry respondents indicated a preference for 48 crude protein (Table 108) About 27 of the respondents were satisfied with the standard 41 level and 20 indicated a preference for a 44 protein CSM No respondents preferred anything less than the standard 41
With respect to energy levels the sample members were asked to indicate what they considered to be the normal maximum and minimum energy levels for protein feeds for broilers layers turkeys and breeding flock As Table 109 indicates the responses varied widely with little or no indication of a mode (most frequent response) in most cases For broilers the maximum (in K Cals DE per pound) ranged from 0 to 1800 and the minimum from 850 to 1700 with a mean maximum of 1436 and a mean minimum of 1276 For layers the maximum (in K Cals DE per pound) ranged from 1000 to 1800 and the minimum from 800 to 1500 with a mean maximum of 1347 and a mean minimum of 1187 For turkeys the maximum (in K Cals DE per pound) ranged from 1100 to 1725 and the minimum from 850 to 1700 with a mean maximum of 1334 and a mean minimum of 1261 For breeding flocks the maximum (in K Cals DE per pound) ranged from 1000 to 1600 and the minimum from 750 to 1600 with a mean maximum of 1328 and a mean minimum of 1159 Given the disparity in the responses it seems clear that there is little common concept of the normal maximum and minimum energy levels for protein feeds
Sample members similarly were asked to indicate the minimum and maximum fat levels they considered critical for protein feeds Although the range of responses was still quite wide there appeared to be more uniformity in responses to this question than the one for energy (Table 110) The maximum fat levels (ether extract as fed basis) indicated by the respondents ranged from 1 to 15 or 20 for most poultry types The minimums ranged from 0 to 15 The mean minimum levels of fat for all poultry types was about 3 The mean maximum ranged from 6 to 82 depending on the poultry type
Sample members were asked to indicate the level of gossypol they considered safe for poultry rations The responses again varied widely from a low of 0 ppm up to a high of 300 ppm for all poultry types (Table III) The highest mean level of gossypol as calculated from the responses to the question were 104 ppm for broilers and 91 ppm for turkeys For layers and breeding flocks the mean levels were much lower at 57 ppm and 54 ppm respectively
The questionnaire also asked the sample members to indicate if they use or would use synthetic amino acids where economical The response was that nearly 100 of all poultry respondents indicated that they have or would use synthetic amino acids in this situation (Table 112) This suggests little real aversion on the part of feed formulators to utilize synthetic amino acids in least cost poultry formulations
To obtain some insight on the general perception of poultry formulators regarding CSM the sample members were asked to indicate the overall feeding value of a standard 41 protein CSM compared to that of a standard 44 protein soybean meal in their opinion on percentage basis They were given the choice of 5 ranges from under 70 to over 100 in 10 increments (see Table 113 for the actual ranges used) Nearly 80 of the respondents indicated that CSM has an overall feeding value of under 90 of that of soybean meal Given the five choices offered to respondents the mean feeding value was around 80
18
Sources of Information Utilized on Formulating Poultry Feeds
About two-thirds of the poultry respondents indicated that they were familiar with research on feeding CSM to broilers and layers (Table 114) Only half however indicated familiarity with such research for turkeys and only a little over a third for breeding flocks Less than 10 of the respondents listed any other research on feeding CSM to other types of poultry (Table 115) To obtain information on formulating feeds for poultry the largest number of respondents (52 of the 55 respondents) indicated that they utilize university research followed by industry publications of some type (45 respondents) university extension services (26 respondents) and government agencies (20 respondents) (Table 116) Only 17 respondents listed other sources of information including primarily personal experience and research (Table 117)
Cottonseed Meal Price and Value
To get some idea concerning the poultry respondents perceptions of the value of CSM particularly with respect to soybean meal sample members were asked 1) if they would be willing to pay a premium per unit of protein for CSM with more than a standard 41 protein and 2) if gossypol and fiber were sufficiently low on average what percent of the cost of soybean meal they would be willing to pay for CSM
With respect to the first question only about half the respondents indicated a willingness to pay a premium for a CSM with more than 41 protein despite the fact that 75 of them indicated earlier that they would prefer a CSM with a higher crude protein level (Table 118) Thus at least 25 of the respondents prefer a higher protein level CSM but would not be willing to pay a premium to get it
In response to the second question poultry respondents indicated that they would only be willing to pay an average of about 76 of the cost of soybean meal for a CSM with a sufficiently low level of gossypol and fiber (Table 119) The range around that average however was fairly large from 50 to 95 Because CSM has traded at about 91 of the value of soybean meal on the market on a protein equivalent basis and about 85 on an unadjusted basis on average in each year since 1984 either poultry respondents are currently unaware of the historical CSM to soybean meal price relationship or they are indicating that the current CSM market price relative to that of soybean meal is substantially above the levels that most find acceptable
Suggestions for Improving the Usefulness of Cottonseed Meal
Only about 27 of the poultry feed formulators that returned surveys provided suggestions that might improve the value or usefulness of CSM in poultry feed rations (Table 120) Some of the more frequent suggestions included the need for more information on the use of CSM in poultry rations increased availability of CSM and nutrient guarantees
Catfish
The perceptions of catfish feed formulator respondents concerning the use of cottonseed meal correspond closely to those of the poultry respondents likely because of the similar dietary needs of non-ruminant animals The salient differences in responses by catfish feed formulators in the 6 general question areas included on this section of the surveys include the following
bull Factors affecting choice of dietary proteins There were no differences in the responses of those indicating that they formulate feed for catfish than for poultry regarding the importance
19
of the listed factors (quality price availability consistency and other) affecting the choice of dietary protein (Table 121) A large majority of catfish respondents ranked all factors as either important or extremely important as did poultry respondents
bull Cottonseed meal as an alternative protein feed As was the case for poultry catfish respondents ranked more protein feeds as higher on the superior-to-CSM scale than was the case for the combined responses (Table 122) Catfish feeders however ranked meat and bone meal and blood meal as even more superior to CSM than did poultry respondents The protein feeds that catfish respondents ranked as roughly similar to CSM included tankage feather meal peanut meal linseed meal corn gluten meal brewers dried grains distillers dried grains sunflower meal safflower meal and canola meal Catfish respondents also appeared to have nearly as strong views about whether or not CSM is an alternative to the other listed protein feeds as did poultry respondents They perceived that CSM is not an alternative to many of the other protein feeds including blood meal dried whole milk meat and bone meal and dried skim milk Catfish respondents also perceived however that CSM is a definite alternative to many other protein feeds including safflower meal canola meal peanut meal sunflower meal linseed meal distillers dried grains brewers dried grains tankage soybean meal wheat middlings corn gluten meal urea and feather meal
bull The importance of nutritional and non-nutritional factors The responses for catfish with regard to the importance of nutrition-related and non-nutrition-related factors in choosing CSM as a component of catfish feeds were roughly similar to those for poultry (Table 123) The salient differences were that a larger percentage of catfish respondents ranked energy level fat level and fiber level as important or extremely important and a much larger percentage ranked aflatoxin as extremely important One major difference of the catfish responses regarding the importance of non-nutrition-related factors from those of poultry is that palatability is much mOre of a concern to catfish feeders (Table 124) Bin space is less important to catfish respondents and service from the CSM industry is more important to them
bull Seasonality of cottonseed meal availability The results for the catfish respondents regarding the months of the year when CSM is not available were generally consistent with those for poultry except that May and June were perceived as less problematic for obtaining CSM supplies by the catfish respondents (Table 125) Catfish formulators perceive that CSM needs to be more available in April through October than during the rest of the year to be competitive with other protein feeds (Table 126) This suggests the perception on the part of catfish feed formulators of a CSM availability problem during about the first half of any given year
bull Reasons for the selection and non-selection of cottonseed meal Pricevalue is the number one reason cited by catfish respondents for which CSM is selected as a feed ingredient followed by protein quality and palatability (Table 127) The top reason that CSM is not selected according to the catfish respondents is pricevalue followed by quality and gossypol level (Table 128) Gossypol level is the key CSM characteristic that catfish respondents indicated must change in order for CSM to be used more frequently in catfish rations (Table 129) Quality was clearly considered to be the second most important characteristic that must change followed by aflatoxin level This is the only animal species for which price was not the number one characteristic cited that would have to change and was not even listed among the top three responses The implication is that catfish feed formulators may not consider the price of cottonseed meal to be out of line with their needs and thus do not consider price to be a particular problem for the use of CSM in catfish rations A word of caution is in order
20
to avoid taking this conclusion too far because of the relatively few number of catfish feed formulators in the sample
bull Source of chemical analyses for cottonseed meal The results for the chemical analyses performed by poultry respondents are similar to those of poultry as well as those of both the combined results and the beef and dairy cattle results The primary analysis routinely performed by the catfish respondents is crude protein followed by fat fiber aflatoxin and gossypol (Tables 130 and 131) The primary analytical values supplied to the catfish respondents also included crude protein fiber and fat (Table 132) Only 2 of the II catfish respondents indicated that their CSM supplier does not provide them with any analytical values Even though gossypol was ranked as an extremely important nutrition-related factor in the choice of CSM as a feed component and the number one CSM characteristic that needs to change only 5 of the II respondents routinely perform gossypol analyses None of catfish respondents obtain analytical values for aflatoxin from their CSM supplier
As for poultry catfish sample members were asked some specific Questions regarding the use of CSM in catfish feed formulations in 5 general areas 1) problems resulting from feeding a ration with CSM to the various catfish types 2) specific information on several key nutrition-related factors affecting the use of CSM in catfish rations 3) sources of information utilized on formulating catfish feeds 4) CSM price and value and 5) an open-ended Question soliciting suggestions to improve the usefulness or value of CSM for catfish feed formulations
Problems from Feeding CSM Rations to Catfish
Absolutely no catfish respondents indicated any knowledge of any problems associated with feeding a ration containing CSM to catfish (Table 133)
Information on Key Nutrition-Related Factors for Catfish Rations
As for poultry the survey sample members were asked to respond to a number of specific Questions related to nutritional factors that affect the use of CSM in catfish rations including protein energy fat gossypol and synthetic amino acids They were then asked to indicate their perception of the overall feeding value of a standard 41 protein CSM compared to that of a standard 44 protein soybean meal Just as for poultry these Questions were designed primarily to determine the extent of knowledge among catfish feed formulators concerning these factors as they relate to the use of CSM and the relative feeding value of CSM
Sample members were asked to respond to two Questions regarding protein in catfish feed rations They were first asked to indicate the specific protein-related factors that they consider when balancing rations for catfish They were given the same list of three factors (crude protein level amino acid content and amino acid availability) to choose from that the poultry sample members were given Again they were also allowed to specify any other protein-related factors they consider when balancing catfish rations They were then asked to indicate the crude protein levels they would prefer for CSM and were given the same choice of four levels as the poultry sample members (36 41 (standard) 44 and 48) and allowed to suggest any other preference for crude protein level In contrast to poultry the largest percentage of catfish respondents indicated that they consider amino acid availability (10 of the 11 catfish respondents) rather than the content when balancing catfish rations (Table 134) The second largest percentage consider crude protein level (9 respondents) also a different result from poultry
21
With regard to the crude protein level for CSM preferred by catfish respondents about 43 indicated a preference for 48 crude protein (Table 135) About 20 of the respondents were satisfied with the standard 41 level and nearly 30 indicated a preference for a 44 protein CSM No respondents preferred anything less than the standard 41 The mean preferred crude protein level was about 42
With respect to energy levels the catfish sample members were asked to indicate what they considered to be the normal maximum and minimum energy levels for protein feeds for fingerlings grow out stock brood stock and fries Despite the low number of catfish respondents the answers to this question were widely divergent (Table 136) For fingerlings the maximum (in K Cals DE per pound) ranged from 1250 to 1800 and the minimum from 2 to 1500 with a mean maximum of 1525 and a mean minimum of 834 For grow out stock the maximum (in K Cals DE per pound) ranged from only 1500 to 1600 and the minimum from 1 to 1300 with a mean maximum of 1550 and a mean minimum of 750 For catfish brood stock the maximum (in K Cals DE per pound) ranged from 1300 to 1700 and the minimum from 1200 to 1400 with a mean maximum of 1500 and a mean minimum of 1300 For fries the maximum (in K Cals DE per pound) ranged from 1250 to 1800 and the minimum from 900 to 1500 with a mean maximum of 1525 and a mean minimum of 1200 Given the disparity in these responses it seems clear again for catfish feed formulators that there is little common concept of the normal maximum and minimum energy levels for protein feeds
Catfish sample members similarly were asked to indicate the minimum and maximum fat levels they considered critical for protein feeds As with poultry the range of responses was still quite wide but there also appeared to be more uniformity in responses to this question than the one for energy level (Table 137) The maximum fat levels (ether extract as fed basis) indicated by the respondents again ranged from 1 to 15 for most catfish types as was the case for poultry The mean minimum levels of fat for all catfish types ranged from about 3 to 5 The mean maximum ranged from 6 to 10 aCrOSS the different catfish types
Catfish sample members were also asked to indicate the level of gossypol they considered safe for catfish rations The responses again varied widely from a low of 0 ppm up to a high of 300 ppm for some catfish types (Table 138) The two highest mean safe levels of gossypol were 97 ppm for grow out stock and 83 ppm for brood stock For fingerlings and fries the safe maximum mean levels were much lower at 44 ppm and 23 ppm respectively
The questionnaire also asked the sample members to indicate if they use or would use synthetic amino acids where economical The response was that 83 (all but 2) of the catfish respondents indicated that they have or would use synthetic amino acids in this situation (Table 139) This suggests little real aversion on the part of feed formulators to utilize synthetic amino acids in least cost catfish formulations
To obtain some insight on the general perception of catfish formulators regarding CSM the sample members were asked to indicate their opinion of the overall feeding value of a standard 41 protein CSM compared to that of a standard 44 protein soybean meal expressed on a percentage basis They were given a choice of 5 ranges from under 70 of the feeding value of soybean meal to over 100 in 10 increments (see Table 140 for the actual ranges used) All but one of the catfish respondents indicated that CSM has an overall feeding value of under 90 of that of soybean meal Given the five choices offered to respondents the mean feeding value of CSM relative to that of soybean meal was around 80
22
Sources of Information UtiJized on Formulating Catfish Feeds
Only about half of the catfish respondents indicated that they were familiar with research on feeding CSM to grow out stock and only a third were familiar with research on fingerlings (Table 141) Only 2 respondents were familiar with any research on feeding CSM to brood stock and fries To obtain information on formulating feeds for catfish the largest number of respondents indicated that they utilize university research and industry publications of some type (Table 142)
Cottonseed Meal Price and Value
Catfish sample members were also asked two Questions to get some idea concerning their perception of the value of CSM particularly with respect to soybean meal 1) if they would be willing to pay a premium per unit of protein for CSM with more than a standard 41 protein and 2) if gossypol and fiber were sufficiently low on average what percent of the cost of soybean meal would they be willing to pay for CSM
With respect to the first Question 75 of the catfish respondents indicated a willingness to pay a premium for a CSM with more than 41 protein which is consistent with their earlier responses that they would prefer a CSM with a higher crude protein level (Table 143)
In response to the second Question catfish respondents indicated that they would only be willing to pay an average of about 82 of the cost of soybean meal for a CSM with a sufficiently low level of gossypol and fiber (Table 144) The range around that average was more narrow than for poultry from 70 to 100 This is more consistent with the ratio of CSM price to soybean meal price that has existed over the last 7 or 8 years on average
Suggestions for Improving the Usefulness of Cottonseed Meal
Only three catfish respondents offered suggestions for improving the usefulness or value of CSM for catfish rations The three suggestions included I) providing a more consistent product in price and Quality 2) providing a premium Quality toxin-free high protein low-fat product superior to soybean meal and 3) eliminating the CHO fraction (Table 145)
Comparisons Among Animal Species
In order to highlight the salient differences in responses with respect to the various animal species the mean responses to Questions that are common among all surveys regarding CSM use as a feed ingredient were compared and analyzed An analysis of variance (ANOY A) was also done to detect statistically significant differences in the mean responses to each Question by animal specie Comparisons are made among the mean responses to all Questions in the 6 general areas to which all sample members were asked to respond regardless of the animal specie(s) for which they formulate feeds 1) the particular factors affecting their choice of dietary proteins for formulated feeds 2) the extent to which CSM is considered to be an alternative to selected protein feeds 3) the importance of nutritional and non-nutritional factors in their decisions to use CSM rather than alternative dietary proteins in their feed formulations 4) the seasonality of CSM availability 5) the specific reasons for the selection and non-selection of CSM for use in the feeds they formulate and 6) the source of CSM chemical analyses used by the respondents Where appropriate ANOY A results are also indicated
23
Factors Affecting Choice of Dietary Proteins
As discussed earlier all members of the final sample regardless of the animal species for which they formulate feeds were asked to rank the importance of four general factors in their choice of a dietary protein for their feed formulations on a scale of I to 7 (from extremely unimportant to extremely important respectively) 1) quality 2) price 3) availability and 4) consistency Comparing the results across animal types reveals few significant differences in the importance attached to any of the four factors by the responding formulators of the various animal specie feeds (ie comparing results horizontally in Table 146) But as pointed out in an earlier section the mean rankings for quality are all higher than those for the other factors while the mean rankings of price are all lower than those for most other factors across all animal types In other words the respondents consistently ranked quality highest on the scale of importance followed in order by consistency availability and price
Cottonseed Meal As An Alternative Protein Feed
Recall that the sample members were asked to rank various selected protein feeds on a scale of 1 to 7 as inferior or superior to CSM in an overall sense for use in feed formulations A second question required respondents to indicate whether or not they considered CSM to be an alternative to each of the 20 listed protein feeds A comparison of the mean ran kings and ANOV A results across animal types indicates substantial agreement among the respondents regarding the ranking of CSM as an alternative to some animal feeds and substantial disagreement with respect to CSM as an alternative to many others (Table 147) Respondents over all animal types tended to agree that certain feeds and in particular the higher crude-protein-content feeds are clearly superior to CSM including dried skim milk meat and bone meal fish meal blood meal soybean meal dried whole milk and corn gluten feed There was a statistically different deviation in the extent to which respondents for some animal species regarded those meals as superior however For example catfish respondents ranked meat and bone meal fish meal poultry by-products blood meal soybean meal and corn gluten meal higher than did respondents for the ruminant animals The same was roughly the case for poultry Beef and dairy cattle respondents tended to rank all other protein feeds as less superior (ie more inferior) to CSM There was also substantial agreement that CSM was about the same as tankage peanut meal linseed meal and brewers and distillers dried grains but superior to some extent over the other feeds particularly those lower in crude protein including dehydrated alfalfa sunflower meal wheat middlings safflower meal canola meal feather meal and urea Beef and dairy cattle respondents agreed that CSM can be considered an alternative to nearly all the protein feeds except perhaps skim and whole dried milk Poultry and catfish respondents indicated CSM is an alternative to fewer of the other protein feeds
The Importance of Nutritional and Non-Nutritional Factors
Respondents also ranked the importance of specific nutrition-related and non-nutritionshyrelated factors in choosing cottonseed meal as a component of the feeds they formulate on a scale of extremely unimportant to extremely important (a scale of I to 7 respectively) Comparing the mean rankings by the respondents reveals that poultry and catfish feed formulators clearly consider proteinshyrelated factors and gossypol level to be more important than do beef and dairy feed formulators (Table 148) Fiber level is also of more importance to formulators of catfish feed Interestingly the importance of fiber was not ranked significantly higher by poultry feed formulators than by beef and dairy cattle feed formulators At the same time aflatoxin was clearly ranked by all respondents as the most important factor affecting the choice of CSM as a feed ingredient irrespective of the animal specie for which the ration is intended
24
For the non-nutritional factors an analysis of the mean rankings indicates few significant differences in the responses across animal species with respect to each individual factor listed (Table 149) The most notable exception is that poultry respondents ranked palatability significantly less important than did any of the other respondents for the other animal species Finally catfish respondents perceived that service by the CSM industry was more important for them than did the respondents for the other animal species
Seasonality of Cottonseed Meal Availability
The respondents across all animal species indicated that CSM is least available between about May and October likely reflecting the increasing shortages of cottonseed meal supply just prior to the cotton harvest in the fall (Figure 20) At the same time however the beef cattle dairy cattle and poultry respondents all indicated that there is less need for CSM to be available during approximately those same months in order to compete effectively with other protein feeds (Figure 21) This suggest that the seasonality of supply may not represent an important constraint to competitiveness and growth possibilities of CSM as a feed ingredient Interestingly catfish respondents suggested a largely inverse pattern of the times of the year when CSM needs to be available to compete effectively with other protein feeds as a catfish feed ingredient Possible explanations of this phenomenon include I) the protein feed needs of catfish feed formulators peak in the late spring and summer months when supply is less available 2) catfish feed formulators are located such that CSM is not easily obtainable particularly during short supply years or 3) formulators of feed for other animal species have longer experience in using CSM and have adjusted their formulation to the pattern of CSM supply availability In any case it should be remembered that there are relatively few catfish feed formulators in the sample so that their joint responses may not be truly representative of all catfish feed formulators In this case this difference in their responses may mean little
Reasons for the Selection and Non-Selection of Cottonseed Meal
Respondents across animal species were quite consistent in their ranking of the top reasons that CSM is included in feed formulations (Table 150) They overwhelmingly ranked price as the top reason followed generally by availability and protein quality Catfish respondents differed somewhat from that order ranking protein quality second and palatability as third Availability was ranked fourth by catfish respondents The top reason all respondents listed for which CSM is not included in feed formulations was also price (Table lSI) Beef and cattle respondents ranked availability as second but poultry respondents ranked gossypol second while catfish respondents ranked protein quality second A vailability ranked only as the third reason that CSM is not selected by poultry respondents and fourth by catfish respondents Gossypol ranked either third or fourth for all animal species except poultry for which gossypol appears to be a more important reason for not including CSM in poultry feed formulations The question regarding the characteristics of CSM that would have to change in order for it to be selected more frequently as a feed ingredient elicited about the same responses as those for the previous question concerning why CSM is not included in feed formulations (Table 152) The top characteristic that would have to change in the opinion of most respondents is price Catfish respondents however listed price extremely low on their list suggesting that other factors are more of a constraint to CSM use in their opinion They ranked gossypol as the number one characteristic that would have to change Availability appeared to be more of a concern to beef and dairy feed formulators than for poultry and catfish formulators
25
Source of Chemical Analyses for Cottonseed Meal
About the same percentage of respondents across animal species perform analytical tests for aflatoxin crude protein fat fiber and gossypol (Figure 22) The only noticeable differences were for aflatoxin and gossypol for which about half the percentage of dairy and beef respondents compared to catfish respondents reported that they routinely perform tests A higher percentage of poultry respondents also appear to perform tests for aflatoxin and gossypol than is the case for beef or cattle respondents Crude protein is tested for by the highest percentage of respondents for all animal species while gossypol is tested for by the smallest percentage of all respondent groups except catfish CSM suppliers are more likely to provide feed formulators with analytical values for crude protein fat and fiber than for aflatoxin or gossypol (Figure 23) A sizeable percentage of the respondents across all animal types reported that their CSM supplier provides no analytical values whatsoever
Summary ofMajor Findings
Of the reams of information normally provided by a study like this relatively little is usually new or profound And of what can be found that appears important only some is little more than interesting or particularly useful Before turning to a discussion of the implications of the study results the major findings across animal groups are briefly summarized first Sifting through the many tables figures and data sets the main findings of the study appear to be the following
bull Quality is the most important factor affecting the choice of dietary proteins by feed formulators followed by consistency and availability Price is the least important of the four factors in making general decisions regarding dietary proteins for animal diets
bull Once feed formulators have set the general parameters for use of dietary proteins in their formulations however price is the most important factor determining the choice among alternative dietary proteins to satisfy the general parameters for dietary protein use in feed formulations
bull When considering whether or not to use CSM as the dietary protein in feeds the nutritional factors of most concern to formulators of feed for non-ruminant animals (poultry and catfish) appear to be protein-related For formulators of ruminant (beef and dairy cattle) feeds aflatoxin level and rumen degradability are the most important nutritional factors
bull The most important non-nutritional factors affecting feed formulators decisions regarding whether or not to use CSM are I) price 2) availability 3) consistent quality and 4) palatability in that order
bull Non-nutritional factors are more important than nutritional factors in the choice of CSM over alternative feeds to fill the dietary protein requirements of feed formulations In general price and availability were ranked above protein quality and other nutrition-related factors as reasons why CSM is and is not chosen as a feed ingredient over alternatives Price and availability were also cited as the characteristics that most need to change in order for CSM to be selected as a feed ingredient more frequently
bull CSM is generally considered to be inferior to higher protein feedstuffs and superior to lower protein feedstuffs This generalization however does not hold for all feeds and all animal types Formulators of ruminant animal feeds ranked many of the higher protein feeds more on a par with CSM than did formulators of non-ruminant animal feeds
26
bull The seasonality of CSM availability is both a positive and a negative factor affecting the use of CSM rather than alternative protein feeds in animal feed rations That is CSM is obviously more likely to be selected as a feed ingredient during months of greater availability than during the months of lower availability In general however the survey responses indicate that CSM is normally available when feed formulators perceive that it needs to be available One word of caution It may be that a higher percentage of CSM users agreed to participate in this survey than those who are currently not using CSM Those who are current CSM users may well have already adjusted their feed purchasing patterns and operations to reflect the seasonal changes in the availability of CSM Consequently current CSM users may perceive less of an availability problem than those who are not currently using CSM In this case the responses to these questions may not be truly representative of the perception of the availability of CSM by feed formulators in general
bull There is a tremendous disparity in the perception of respondents as to the appropriate levels of several key nutrition-related factors for specific livestock rations including energy levels fat levels gossypol levels and escape values (ruminants only) for cottonseed meal For each animal specie the range of variation in the perceived acceptable levels of each of these factors was extremely wide The obvious conclusion is that feed formulators generally lack adequate and reliable information on many factors which are crucial in efficient feed formulation and which have a significant impact on the choice of CSM as a feed ingredient
PROBLEMS AND OPPORTUNITIES FOR EXPANDING COTTONSEED MEAL USE
CSM is somewhat unique among vegetable protein meals in that it is the product of a byshyproduct The volume of the by-product cottonseed available for crushing and the potential supply of CSM depend more on the dynamics of cotton supply and demand than on forces specific to CSM markets This mean that market signals from feed formulators and livestock feeders regarding desired values and characteristics of protein meals likely have little impact on the potential CSM market supply
Since the mid-1970s the share of the annual production of cottonseed fed directly to ruminant livestock has increased steadily from about 5 in 1974 to nearly 40 in 1990 (Figure 24) The consequence has been a marked decline both in the share of the available supply of cottonseed that is crushed and in the ratio of actual to potential cottonseed meal output An increase in the demand for CSM therefore will either bid up the market price of CSM with no additional volume actually used or increase the cottonseed crush to feed use ratio (or some combination thereof) There will be little or no effect on the total amount of cottonseed available
The intent of efforts to expand the market for any commodity is to effect an increase in sales at a higher price For a commodity with a relatively fixed supply the major result of an expansion in demand is solely an increase in price because supply cannot increase to allow an increase in use For a commodity with an unlimited supply successful market expansion efforts simply increase use to the extent of the promotion with no increase in price For a commodity with a supply somewhere in between those two extremes successful market expansion will increase both the price and quantity used Although the situation for cottonseed meal is closer to the fixed supply end of the spectrum market expansion efforts can increase the use of cottonseed meal through an increase in the crush-toshy
27
feed cottonseed use ratio This ratio will increase as the profitability of crushing vs alternative uses of the seed increase
The results of this survey however indicate both some problems and possible opportunities for expanding cottonseed meal use After briefly summarizing the major obstacles as identified in the study the major opportunities for expanding use of cottonseed meal will be discussed
Problems for Expanding Cottonseed Meal Use
The major problems for expanding CSM use are generally well known and verified by the survey results The major problems that would hinder efforts to expand cottonseed meal use identified in the study included primarily the following
bull Price and availability of CSM are the major factors affecting the selection or non-selection of CSM as an ingredient of feed formulations regardless of animal specie These nonshynutritional factors were judged to be more important than nutritional factors in selecting CSM as a feed ingredient Unfortunately neither the price nor the availability of CSM can be controlled or altered substantially or directly by market expansion efforts Some efforts to improve availability may be possible as discussed in the next section
bull CSM is perceived to be inferior in an overall sense to a number of key protein feeds CSM was judged by the survey respondents to be clearly superior in aggregate to only 5 of 20 potential alternate protein feeds Such an image could work against efforts to expand CSM use
bull Gossypol level is one of the top reasons that CSM is not used more frequently particularly in non-ruminant feed rations The level of gossypol is a unique characteristic of CSM that obviously cannot be changed through market expansion activities
bull Several other specific characteristics of CSM would likely need to change for CSM to be selected more frequently as a feed ingredient including amino acid balance energy level aflatoxin level and protein quality As with gossypol changes in these characteristics are out of the realm of market expansion programs
bull Feed formulators generally lack adequate and reliable information on many factors which are crucial in efficient feed formulation and which likely have a significant impact on the choice of protein feedstuffs The use of CSM in livestock feed rations is likely restricted by the wide disparity in the perception of feed formulators regarding the appropriate levels of several key nutrition-related factors for specific livestock rations including energy levels fat levels gossypol levels and escape values (ruminants only) for cottonseed meal
bull Over 75 of dairy cattle feed formulators and nearly half of beef cattle feed formulators utilize whole fuzzy cottonseed to some extent in some of the feed rations they formulate Relatively few reported using utilizing both CSM and whole cottonseed in the same ration A main attraction of the use of whole fuzzy cottonseed as opposed to cottonseed meal is the fiber content Indeed the use of whole delinted cottonseed in cattle feed rations is much lower
28
Opportunities for Expanding Use of Cottonseed Meal
There are essentially only two basic tools to expand the market for any commodity l market development and 2) enhancing the efficiency of the marketing system Market development involves a wide range of activities including primarily new product development and product differentiation In new product development the effort is to develop new products or characteristics of products that appeal to different segments of consumers An example might be research leading to the elimination of gossypol in cottonseed meal which could further open up the non-ruminant feed industry to cottonseed meal
Product differentiation on the other hand encompasses those activities designed to create a user preference for or loyalty to a commodity Product differentiation occurs in two major forms 1) advertising and 2) variation in design and quality of product The primary purpose of advertising is to create user preference for a commodity and convince users of the superiority of a product over competing products Actual physical differences in the product are not necessary to successfully differentiate it from competing products It is sufficient only that users believe that some superiority exists Advertising often intends to create an image of superior quality because such images are harder to imitate or successfully counter than physically unique features Successful differentiation of a product means that users become less sensitive to price changes more willing to pay a higher price for the same quantity because they prefer the product and are loyal to it in the face of price increases In other words users are willing to pay more for the same amount because advertising if successful creates a preference for the product over competing products
Variations in quality and design are usually used along with advertising to differentiate the product of one seller from that of another Such variations are often necessary to help create the superior images desired andor attract new sets of consumers
Often barriers exist in a marketing system that hinder the efficient functioning of the market and restrict the flow of commodities from sellers to users Enhancing the efficiency of the marketing system through eliminating such barriers can lead to an expansion in the use of a commodity One of the primary requirements of an efficiently functioning market is that sellers and users possess adequate and accurate information regarding the product its characteristics availability sources uses and value among other things Inadequate or inaccurate information regarding a particular product and other market characteristics can divert demand to alternative products with which users may be more familiar regardless of whether or not those products are better in some sense
The concept and importance of enhancing market efficiency in this regard can be illustrated by comparing the flow of information about a product and market conditions with a radio broadcasting system The efficiency of such a system depends on how accurately the microphone and other equipment record sound how accurately and rapidly that sound is transmitted to a radio receiver and how accurately the receiver brings sound to the listener A breakdown anywhere along the line in that system will simply mean that the message of the broadcast does not get from the radio station to the listener Also if the message gets through but static interferes with the transmission the listener might only receive part of the message or a garbled message The listeners impressions and actions consequently might be quite different than if he had received the message intended In quite the same manner the flow of a commodity from producers to users is affected by how rapidly and accurately market information is evaluated and how accurately and rapidly this information is transmitted to and among producers and users Any breakdown or static in the system would result in a smaller and more obstructed flow of the commodity to users than if the market operated more efficiently
29
The survey results suggests possible opportunities for expanding CSM use through market development and enhancing market efficiency Market development opportunities may be limited because of the nature of the CSM supply situation Nevertheless expansion of CSM use is possible through a reduction in direct feeding of cottonseed so that opportunities for expanding use through market expansion efforts should not be discounted Efforts to enhance the adequacy and accuracy of information regarding the use of CSM as a feed ingredient however may well be the most effective means of promoting an expansion of use or enhancement of the value of CSM
Opportunities for Expansion through Market Development
Although many product development opportunities likely exist for CSM the survey basically focused on the image of CSM in the perception of feed formulators If a market development approach to expanding the use of CSM as an ingredient of animal feed formulations has any chance of success the survey results suggest that the following components of such a strategy will be crucial
bull Product quality and consistency and an improved image of availability must be the major targets of promotion efforts The survey responses across all animal types unequivocally indicated that these three factors are the prime considerations in making general decisions regarding dietary proteins for animal rations Price only becomes a factor in specific decisions regarding the particular protein feed to use to fill the dietary protein requirements of feed formulations after these general concerns are addressed Creating an image of quality consistency and availability for CSM is a necessary first step to expanding use and enhancing value
bull CSM use expansion efforts must focus to some extent on reducing the direct feeding of whole cottonseed to beef and dairy cattle Reductions in direct feeding is the only chance for an increase in supply of CSM to fuel expanded use in newer markets such as catfish and poultry feeding Also because beef and dairy cattle are major users of cottonseed meal a decrease in feeding of whole cottonseed in favor of CSM would significantly expand use
bull Separate CSM market promotion messages must be developed to address the very different needs and concerns of ruminant vs non-ruminant feed formulators The survey results clearly indicate that many nutritional and non-nutritional factors are more important for nonshyruminant feed formulators than for ruminant feed formulators and vice versa
bull The nutrition-related content of CSM market promotion messages must emphasize primarily positive aspects of CSM protein quality amino acid balance and amino acid availability as well as an accurate understanding of appropriate gossypol and aflatoxin levels Many of these factors however are more important for non-ruminant rather than ruminant feed formulators which must be accounted for in designing appropriate messages for feed formulators of each animal type
bull The non-nutrition-related content of CSM market promotion messages may well be the most important and must emphasize primarily the positive aspects of price availability consistency of quality and storability The survey results attached a relatively high level of importance also to nutrient guarantees Although not scoring particularly high in the responses services available from the CSM industry may also be a helpful component of CSM use promotion messages
30
Opportunities for Expansion through Market Emciency Enhancement
Even though some gains in CSM use and market value can reasonably be expected through market expansion efforts the cost involved could easily outweigh any benefits in terms of enhanced profits to the CSM industry Perhaps the most cost-effective appropriate and useful means of enhancing the use of CSM would be a strategy aimed at improving the level and accuracy of information available regarding CSM and its use Lack of information or misinformation can easily discourage feed formulators from using CSM in their feed formulations Strategies to enhance the quantity and accuracy of appropriate information can take on many forms from media advertising to market news letters Although it is beyond the scope of this study to develop alternative information strategies the results of this study clearly indicate a number of areas in which enhanced and more accurate information is a critical need These include the following
bull The overall quality of CSM The study suggests that the negative aspects of CSM are well known Less well known are the specific positive aspects of CSM that may give it an edge in some sense over other protein feeds
bull The ideal ratio of the price of CSM to other feeds like soybean meal The study results indicate that feed formulators may not be adequately informed about what the ideal market value of CSM is relative to soybean meal given the differences in feeding value As a consequence CSM may currently be less used in relation to soybean meal than current market price ratios suggest should be the case
bull Protein-related factors for CSM use in non-ruminant feeds These factors are a major concern in the decisions of feed formulators to include or exclude CSM in feed rations
bull The relationship of aflatoxin to CSM and the rumen degradability of CSM particularly for beef and dairy cattle feed formulators These were the nutritional factors of greatest concern to ruminant feed formulators in the decision to include CSM in their feed formulations
bull CSM price availability consistency and palatability These were indicated to be the most important non-nutritional factors affecting feed formulators decisions regarding whether or not to use CSM The study indicates that information on non-nutritional factors may be more important in the decision to use CSM over alternative feeds to fill dietary protein requirements of feed rations than information on nutritional factors
bull The feeding value of CSM relative to alternative protein feeds An accurate and detailed assessment of the extent to which CSM may be superior as an alternative to other standard protein feeds would help position CSM appropriately in the market
bull The appropriate and acceptable levels of several key parameters affecting the use of CSM in animal feed rations including energy levels fat levels gossypol levels and escape values (ruminants only) Feed formulators generally lack adequate and reliable information on these and likely other parameters not included in the study which are crucial in efficient feed formulation and which have a significant impact on the choice of protein feedstuffs Although it appears that nearly all feed formulators routinely perform crude protein analyses few perform analyses for aflatoxin gossypol fat fiber and other parameters Also CSM suppliers are apparently doing an inadequate job currently of providing such information to feed formulators
31
SOME CONCLUDING COMMENTS AND RECOMMENDATIONS
This study assessed the potential problems and opportunities for expanding the use of CSM through an analysis of the perceptions of feed formulators regarding the use of CSM as an animal feed ingredient The perceptions of feed formulators regarding CSM as a protein feed largely define the boundaries within which CSM use will be able to achieve any significant growth in the future Their perceptions right or wrong are the key to understanding not only the problems facing CSM use but also the opportunities
The general conclusion of the study is an obvious one the use of CSM in feed formulations faces some major challenges in the future Chief among these include a perception among feed formulators that price availability quality and other key CSM characteristics are often obstacles precluding increased use of CSM in their feed formulations Perhaps the most important implication of the study is that a serious lack of adequate and accurate information among feed formulators regarding the characteristics parameters value and other aspects of cottonseed meal use in animal feed rations may be seriously restricting the market opportunities for cottonseed meal U nfortunately the development of alternative strategies to expand the use of CSM and enhance the efficient functioning of CSM markets through more accurate and available information on all aspects of CSM use in feed formulations is beyond this study Nevertheless a few recommendations pertinent to the development of such alternative strategies are in order
bull Before adopting any approach to expand the use of CSM it would be useful first to conduct a detailed analysis of the costs and benefits involved Market promotion efforts through advertising can be extremely costly and yield relatively little Research has also shown that there is often a tremendous lag between advertising and promotion expenditures and any associated returns It could take years of investment in such market expansion efforts before an accurate measurement of the actual return on investment could even be attempted
bull Consider developing first a detailed plan for information dissemination to the feed industry regarding all appropriate aspects of CSM use in feed rations as determined in this study An important part of this process would be a comprehensive assessment of the information needs and the information resources readily available The gap discovered in this way between needs and resources will help set the research agenda for the industry to fill the critical existing information gaps
bull Initiate a study of final user attitudes and perceptions of CSM use as a guide to future market expansion efforts This study considered only the perceptions of feed formulators regarding the use of CSM But feed formulators are often not the final users Consulting nutritionists for example often include or exclude certain feeds and feed types from their formulations as requested by feed users At least a few of the respondents to the survey conducted for this study indicated that user preferences are major factors determining whether or not CSM is included in their feed formulations Indeed markets operate as the interaction of supply and demand to determine prices The preferences of final users ultimately will be expressed in the market values of any product in any market unless sufficient obstacles exist to prevent the market from functioning properly Therefore the real decision-makers in the use CSM in the market may well include many more individuals than adequately represented by feed formulators
32
REFERENCES
US Department of Agriculture (USDAa) Feed Situation and Outlook Report Economic Research Service FDS series various issues
US Department of Agriculture (USDA b) Oil Crops Situation and Outlook Yearbook Economic Research Service OCS Series various issues
Figure 1 Quantity of Oilseed Meals Fed to Livestock 194849 - 198590 (Average)
(1000 Tons)
25000 0-1-----------------------shy
20000 I-~
15000
10000
5000
o L 1 J tJ t tmiddotmiddotmiddot 1 oj 1 to bullbull 1 L_ n __LLL I 1 bullbull I V I
1948-49 1950-54 1955-59 1960-64 1965-69 1970-74 1975-79 1980-84 1985-90
(Years)
n iflu Soybean Meal bull Cottonseed Meal Other Oilseed Meals
Source USDA
c
8 c a CD
en ~
--I _ scg ~CD 01)-- en - () mg0 s 0
JCD enOJ CD_CD en 0
sCDCD 0 OJ shyo OJ r Jlt- 0 m CJ) 0 0lt o 0shyCD OJ J
~s ~m cpCJ) r co OJco ~m a
Figure 3 Price Premium (+) or Discount (-) of Cottonseed Meal Relative to Soybean Meal 1956-1990
~~ ~
o I ~ I I
-20 f---
-40
-60
1~1~1~1~1~1~1~1~1~1~1~1~1~1~1~1~1~1~
Cottonseed meal price is adjusted to a soybean meal protein equivalent basis
~I------------------------------------------------------
l l A
I~middotmiddot--- --------
Figure 4 Animal Species for which Respondents Formulate Feeds
DAIRY CATILE
BEEFCATILE
HORSES
SHEEP
BROILERS
LAYERS
OTHER
PETS
TURKEY
SWINE
CATFISH
210
21000
0 5 1000 15 20 25
Figure 5 Respondents Formulating Feeds for the Various Animal Species
0 20 40 60 80
Figure 6 Other Animal Species for Which Respondents Formulate Feeds
DAIRY CATTLE
BEEF CATTLE
HORSES
SHEEP
BROILERS
LAYERS
OTHER
PETS
TURKEY
SWINE
CATFISH
632
Exotics
Trout
Alligators
KOI
Breeding Hens
Wildlife
Rabbits
Avian
Shrimp
Salmon
Ducks
Fish
Gamebirds
Hybrid Bass
379
~--~----~--~----~----~--~----~--~----~--~
0 10 20 30 40 50
Figure 7 Respondent Feed Formulation Activities by State
( of Respondents)
o 00 middot15 16 -30 31 middot45Cgt 46 -60 61 - 75 - 76 -90
Table 8 Respondent Experience as an Animal Nutritionist
( of Respondents) 30 r---shy
25 t-middotmiddotmiddotmiddotmiddotmiddotmiddotmiddotmiddotmiddotmiddotmiddotmiddot-middot ---_ _
20 -_ -nNItshy
15
10
5
0 1-5 6-10 11-15 16-20 21-25 26-30 31-35 36-40 41-45
(Years Of Experience)
-it sa 0 m 8 l 0 CD l g
_ cc c -s CD CObull
-0 -s- 3 Dl ~ IJ CD (fJ
C 0 l C CD l -+
raquo Sl_ lt_ -+_ CD (fJ
Figure 10 Respondent Primary Feed Formulations
by Animal Type 1990 (Percent)
30 I--------------------------------------------------------shy
25 r- middotmiddotmiddotmiddotmiddotmiddot231middotmiddotmiddotmiddot
20
15
10
5
0 Beef Dairy Swine Poultry Horses Pets Aqua- Sheep Exotics
Cattle Cattle culture amp Goats
(Animal Type)
Figure 11 Percent of CSM and S8M Used in Formulations by Feed Manufacturer Respondents 1990
( of Average Feed Ration)
Figure 12 Tons of Feed Formulated by Feed Manufacturer Respondents 1990
65
91
6 9
17
Total Formulations Formulations With CSM
II Less than 200000 Tons
II 200000 - 400000 Tons bullbullbull I bullbullbullbullbullbull ~ 3 ~ 400000 - 600000 Tons
5 rn 600 000 - 800 000 Tonsru 1
[] 800000 - 1000000 Tons9 4
I ~ 1 More Than 1000000 Tons
Formulations With S8M
Figure 13 Percent middotof Beef Cattle Respondents Formulating CSM Feeds for Specific Beef Cattle Types
( of Respondents)
25 ~I------------------------------------------------------~
-Isectig Feedlot-II 223
20
15
10
5
0
bull Other
~ middotmiddotmiddotmiddotmiddotmiddotmiddot middotmiddot _middotmiddotmiddotmiddot-=middotmiddotmiddotccmiddotcmiddotmiddot
Brood Cows Bulls Calves Feeder Heifer Stocker
(Animal Type)
Figure 14 Percent of Dairy Cattle Respondents Formulating CSM Feeds for Specific Dairy Cattle Types
( of Respondents)
120 ----------------------
100 88
80
60
40
20
0 Calves Heifers Lactating Cows Dry Cows
(Animal Type)
Figure 1-5 Percent of Poultry Respondents Formulating CSM Feeds for Specific Poultry Types
( of Respondents)
OO~I--------------------------------------------~-
50 1-laquolaquolt--laquolaquolaquo -lt - lt - lt -lt laquo lt
44
40
30
20
10
0
f-
~laquolaquolaquolaquo
~laquolaquolaquolaquolaquolaquo
Broilers Layers Turkeys Breeding Flocks
(Animal Type)
Figure 16~ Combined Responses Months of the Year When CSM IS NOT Available
( of Respondents) 16 i ---
14 12~8
12
10
87373 7
6
4
2
0 ~~ ~s ~( ~( ~0( ~0(~~~ ~~ ~t ~1 u~ ~g n0~ ad-o N0~ ~a~
~Y ~o Q~lmiddotr
(Month)
Figure 17 Combined Responses Months of the Year When CSM Needs to Be Available
( of Respondents) 12 ---------------------------
10
8
6
4
2
0
goA 9
~ui ~s ~Ot X)Ot ~Ot X)Ot~0SV~0~~erl ~iSclt ~f ~~1 ~v~ ug ~o~ o~o NO~ co~0 0lt609 ~o
(Month)
Figure 18 Beef Cattle Responses Percent of Respondents Formulating Creep Feed for Calves or Supplements for Stockers
733
832
0 20 40 60 80 100 120
( of Respondents)
Figure 19 Beef Cattle Responses Protein-Related Factors Considered When Balancing Rations
Other Protein Factors 110
Rumen
Degradability 686
Crude Protein Level 161
Amino Acid
Values 42
( of Respondents)
Figure 21 Comparison of Responses Months When CSM Needs to Be Available
( of Respondents) 94 ---------------------------shy
92
9
88
86
84
82 8
78
76
74
72
7
68
66
~ euroI - It
64 -t----------------------------------- -----------t
JAN FEB MAR APR MAY JUN JUL AUG SEP OCT NOV DEC
(Month)
bull Beef Cattle -t Dairy Cattle ltgt Poultry Catfish
Figure 20 Comparison of Responses Months When CSM Is Not Available
( of Respondents)
16 t 15
14
13
12
11
10
9
8ltl amp
7
6
5 I JAN
I
FEB I
MAR I
APR I
MAY I
JUN I
JUL I
AUG SEP I
OCT NOV I
DEC
(Month)
bull Beef Cattle -t Dairy Cattle ltgt PouHry b Catfish
Figure 22 Comparison of Responses Analyses Routinely Performed
( of Respondents)
100~-----------------------------------------------
90
80
70
60
50
40
30
20
10
o I ~
AFLATOXIN C PROTEIN FAT FIBER GOSSYPOL OTHER NONE
(Analyses)
bull Beef Cattle Dairy Cattle o Poultry Catfish-t fj
Figure 23 Comparison of Responses Analytical Values Provided by Supplier
( of Respondents)
60shy
50
4)
30
20
10
o amp ~
AFLATOXIN C PROTEIN FAT FIBER GOSSYPOL OTHER NONE
(Analyses)
bull Beef Cattle -t Dairy cattle o Poultry b Catfish
Figure 24 Share of Cottonseed Use Crush vs Feed Use
( of Respondents)
100 I
90
CRUSH 80
70
60
50
40
30
20
FEED USE 10
o 1~ 1~ 1~ 1m 1m 1~ 1~ 1~ 1~ 1~ 1~ 1~ 1~ 1~
(Year)
Source USDAb
Table 1 Percentage of Beef Cattle Feeds Formula ted Table 2 CSM Feeds Formulated for Beef Cattle CSMmiddot Calvesmiddot
middotAverage Response Rate (feedlot=51 other=41) middotResponse Rate = 39
Table 3 CSM Feeds Formulated for Beef Cattle Table 4 CSM Feeds Formulated for Beef Cattle Stockersmiddot
middotResponse Rate = 40
Response Rate =37
Table 5 CSM Feeds Formulated for Beef Cattle Table 6 CSM Feeds Formulated for Beef Cattle
middotResponse Rate =33
middotResponse Rate = 37
Table 8 Percentage of Dairy Cattle Feeds Formulated CSM
Average Response Rate =88
middotResponse Rate = 37
Table 9 CSM Feeds Formulated for Dairy Cattle Table 10 CSM Feeds Formulated for Dairy Cattle
RespooseRate 24
middotResponse Rate = 34
Table 11 CSM Feeds Formulated for Dairy Cattle Table 12 CSM Feeds Formulated for Dairy Cattle
Response Rate = 31 Response Rate = 45
Table 13 Percentage of Poultry Feeds Formulated Using CSMmiddot
bullAverage Response Rate = 79
Table 14 Percentage of Catfish Feeds Formulated Using CSMmiddot
bullAverage Response Rate =67
Table 15 CSM Feeds Formulated for Catfishmiddot )middoti middot fteq~
bullAverage Response Rate = 17
Table 16 Combined Responses Importance of Specific Factors in Choice of Dietary Protein ( of
bullAverage Response Rate =g]
Table 17 Combined Responses Other Important Factors in
bullAverage Response Rate = 22
bullAverage Response Rate =91
-Average Response Rate =90
Table 20 Combined Responses Importance of Non - Nutrition -Related Factors in Choice of CSM over Alternative Protein Feeds ( of
-Average Response Rate = 87
Table 22 Combined Responses Top S Reasons Why CSM IS NOT Selected as a Feed
Table 23 Combined Responses Top 5 Specific Characteristics That Would Have to Change for CSM to be Selected as a Feed
Table 24 Combined Responses Analysis Routinely Performed
Table 25 Combined Responses Analysis Values Provided
CSM
267 067 333 333 1400 S333
467 000 067 067 1400 4867 --shy
467 000 000 067 400 4333 --shy -- shy -- shy
250 000 000 000 1250 4000 -- shy --shy
313R 4733 62 ------ shy~ - shy ~-
4S00 62
bullAverage Response Rate = 100
bullAverage Response Rate = 87
Table 28 Beef Cattle Responses Imponance of Nutrition-Related Factors in Choice of CSM Over Alternative Protein Feeds
Average Response Rate = 91
Table 29 Beef Cattle Responses Other Nutrition - Related
Fact~~~~~~~~~~~~~~~~~~~
Response Rate =7
Table 30 Beef Cattle Responses Imponance of Non - Nutrition - Related Factors in Choice of CSM Over Alternative Protein Feeds
middotAverage Response Rate = 87
middotResponse Rate = 5
bullAverage Response Rate =14
Table 33 Beef Cattle Responses Months of the Year When CSM Needs to Be AvaiJable I ii middot middot1
bullAverage Response Rate =53
10 U
-Moy
JIIJ
All
so
0_ -
to
--I No
Moy
10 -so shy
0_ _ 0-
Table 35 Beef Cattle Responses Top 5 Reasons Why CSM Is Not Selected as a Feed
Average Response Rate =100 Response Rate = 24
Response Rate =28
Average Response Rate = 98
Response Rate = 17
middotResponse Rate =9
Table 43 Beef cattle Responses Type of Creep Feed
middotResponse Rate = 81
middotResponse Rate =26
Table 45 Beef cattle Responses Respondents Formulating Rations With CSM and Whole
middotResponse Rate = 68
Table 47 Beef cattle Responses Percentage of Whole Cottonseed Respondents Mix in Rations Containing Both CSM and Whole Cottonseedmiddot tCmiddotHiitjt~ middotmiddotmiddotmiddot1
middotResponse Rate =25
middotResponse Rate = 30
bull Response Rate = 98
Response Rate =11
Table 51 Beef Cattle Responses Escape Value Respondents Are Using for Rumen Degradabilitymiddot
1~iiii middotb~r~~fgtD zq436imiddotmiddotmiddotmiddotmiddotmiddotmiddot 004bullbullbullbullbullbullbullbullbullbull1----22--+----31-4
I~~I 23 329
middotResponse Rate = 57
Table 53 Beef Cattle Responses Methods or Sources Respondents Used to Calculate CSM
Table 52 Beef Cattle Responses Reliability of Escape Values Used
Table 54 Beef Cattle Responses Interested in Knowing Escape Values for CSM Processed
Valuemiddot
middotResponse Rate =98
)
I Mean ~nse
63 57S19 228381 Q-L_uu ~139 59468 32306 139bullII1 1 061 06
1 1 44 430 614431-------- 57t 001 001 middot-1
==~=-__~~1c9 00 _ 06 _ 001_ 38 133 323 63
Average Response Rate =100
Response Rate = 89
Table 58 Dairy Cattle Responses Importance of Nutrition - Related Factors in Choice ofCSM Over Alternative Protein Feeds (ofbmiddotNmiddotmiddotmiddotmiddotmiddotmiddot
Response Rate =88
Table 59 Dairy Cattle Responses Other Nutrition-Related Factors
Indicated br~~P211dents
Response Rate =10
Table 60 Dairy Cattle Responses Importance of Non- Nutrition - Related Factors in Choice of CSM Over Alternative
Protein Feeds ( ofResPOndents~dd
Response Rate = 88
Response Rate = 3
--
Average Response Rate = 51
Table 62 Dairy Cattle Responses Months in the Year When CSM IS NOT Available
10 u
J -- AIIIi
--~ shy
loOoIMr _ 0-
bullAverage Response Rate =69
--- AIIIi
--~ soM
0
0-_
10
Table 65 Dairy Cattle Responses Top 5 Reasons Why CSM IS NOT Selected as a Peed
Table 66 Dairy Cattle Responses Top 5 Specific Characteristics That Would Have to ro1 ____ for CSM to be Selected as a Feed
Table 67 Dairy Cattle Responses Analyses Routinely Performed fmiddotmiddotmiddotmiddot
Response Rate =96
Response Rate =56
Table 68 Dairy Cattle Responses Other Analyses
Response Rate =25
Table 70 Dairy Cattle Other Analytical Values CSM
Response Rate =4
Average Response Rate =81
Average Response Rate = 15
Table 73 Dairy Cattle Responses Respondents Formulating Feeds With Whole andor Delinted
Cottonseed bull
bullAverage Response Rate =92
middotResponse Rate = 40
Table 74 Dairy Cattle Responses Respondents Formulating Rations with Cottonseed Meal and Whole Cottonseed in the Same Rationmiddot
middotResponse Rate = 97
Table 76 Dairy Cattle Responses Percentage of Whole Cottonseed Respondents Mix in Rations
ltltJIltainin(a0th CSM and WhoeCottonseedmiddot Mean
middotResponse Rate = 42
Table 77 Dairy Cattle Responses Knowledge of Research on Feedine CSM
~~~~
Average Response Rate = 68
Response Rate =7
Average Response Rate =59
Response Rate =25
Average Response Rate =63
Response Rate = 13
middotResponse Rate = 92
Response Rate =82
Table 85 Dairy Cattle Responses Methods or Sources Used to Calculate CSM
Response Rate = 73
Table 86 Dairy Cattle Responses Respondents Interested in Knowing Escape Values for CSM Processed from Different Methodsmiddot fmiddotmiddotmiddotmiddotmiddotmiddot
Response Rate = 92
Response Rate = 34
Table 89 Dairy Cattle Responses Suggestions for CSM
Response Rate =33 Response Rate =22
-----
64 139 24815 00 36 511 5751
5951 131 438 35015 00 15 I-~~~~~
6200 15 423 51151 00 00 ~~~ -~~~ -~~~ ~~~-~~ --~~ ~ ~ ~~-~ ~
292 55125 00 00 125 45800
bullAverage Response Rate =99
Average Response Rate =85
Table 92 Poultry Responses Importance of Nutrition - Related Factors in Choice of CSM Over Alternative Protein Feeds (of
Average Response Rate =85
Table 93 Poultry Responses Other Nutrition-Related Factors Indicated
200
200
Response Rate = 5
Table 94 Poultry Responses Importance of Non - Nutrition - Related Factors in Choice of CSM Over Alternative Protein
Feeds~~~~~~~~~~5=~~~~~T7~~
00 Average Response Rate =83
Response Rate =4
Average Response Rate = 17
Table 97 Poultry Responses Months in the
J
p
April
lao
A
shy-- 0
ft
April
_
Average Response Rate = 43
=1 g L
0
Table 99 Poultry Responses Top 5 Reasons Why CSM IS NOT Selected as a Feed
Table 100 Poultry Responses Top 5 Specific Characteristics That Would Have to Change for
CSM to be Selected as a Feed Inoredient
Table 101 Poultry Responses Analyses Routinely
middotResponse Rate = 93
Table 102 Poultry Responses Other Analyses Routinely
Performed
middotResponse Rate = 27
Table 103 Poultry Responses Analytical Values Provided
middotResponse Rate =73
Table 104 Poultry Responses Knowledge of Problems
bullAverage Response Rate = 62
Average Response Rate = 14
Table 106 Poultry Responses Protein - Related Factors
Average Response Rate = 64
Table 107 Poultry Responses Other Protein - Related
Response Rate =11
Table 108 Poultry Responses Crude Protein Levels
Preferred for CSM
Response Rate = 55
Table 111 Poultry Responses Gossypol Levels Considered
Safe
Table 112 Poultry Responses Would or Do Use Table 113 Poultry Responses Relative Feeding Value of CSM Comoared to 44 SBMmiddot
middotResponse Rate = 96
bull Response Rate = 100
Table 114 Poultry Responses Knowledge of Table 115 Poultry Responses Familiarity with Other Feedino CSMmiddot
middotResponse Rate =7 bull Response Rate = 73
middotResponseRate = 31
bullAverage Response Rate = 58
Table 118 Poultry Responses Willingness to Pay
a Premium Per Unit of Protein for CSM With More
Than 41 Protein
bullResponse Rate =91
Table 119 Poultry Responses Percent of Cost of SBM Respondents Willing to Pay for CSM with
Response Rate =27
Response Rate =64
00 00 87 43 478 304 57 00 00
----shy I--~~
00 ~-~
43 522 348 59 ----shy
62~ 00 00 00 261 ----shy
652 ------shy
00 00 00 00 667 333 63 AverageResponseRate = 99
bullAverage Response Rate = 73
Table 123 Catfish Responses Importance of Nutrition - Related Factors in Choice of CSM Over Alternative Protein Feeds
Average Response Rate =83
Table 124 Catfish Responses Importance of Non- Nutrition - Related Factors in Choice of CSM Over Alternative Protein
Feeds
Average Response Rate = 90
bullAverage Response Rate = 13
Igt 20
s_
Pshy s
--s
H_
_
gt 7 bull bull bull bull bull
1 fsI plusmn -
haMr
N__
shy
bullAverage Response Rate =54
Table 128 Catfish Responses Top 5 Reasons Why CSM IS NOT Selected as a Feed
Table 129 Catfish Responses Top 5 Specific Characteristics That Would Have to Change for CSM to Be Selected as a Feed-_
Table 130 Catfish Responses Analyses Routinely Table 131 Catfish Responses Other Analyses Routinely Performed
middotResponse Rate = 25
middotResponse Rate =92
bullAverage Response Rate = 18
Table 133 Catfish Responses Knowledge of Problems Feedine CSM to CatflSh
Average Response Rate =100
Table 134 Catfish Responses Protein - Related Factors Considered i
Response Rate = 83
Table 135 Catfish Responses Crude Protein Levels Preferred for CSM
Response Rate = 100
Table 139 Catfish Responses Would or Do Use Table 140 Catfish Responses Relative Feeding
Value ofCSM Compared to 44~ Lmiddotmiddotmiddotmiddotmiddotmiddotmiddotmiddotmiddotmiddotmiddotmiddotmiddotmiddotmiddotmiddotmiddotmiddotmiddot _
Response Rate = 100
Response Rate = 100
Table 141 Catfish Responses Knowledge of Research on Table 142 Catfish Responses Sources ofInformation
Average Response Rate = 83
bullAverage Response Rate = 44
Table 143 Catfish Responses Willingness to Pay A Premium Per Unit of Protein for CSM with More Than
middotResponse Rate = 100
Table 144 Catfish Responses Percent of Cost of SBM Respondents Willing to Pay for CSM with Sufficiently Low Goscvnol and Fiber Levelsmiddot
middotResponse Rate = 83
middotResponse Rate = 25
Table 146 Comparison of Mean Responses and Analysis of Variance (ANOVA) Importance of Specific
bull Scale of 1 (extremely unimportant) to 7 (extremely important) for the mean ranking a Mean significantly larger across animal types at the 5 significance level otherwise no difference b Mean significantly lower across animal types at the 5 significance level otherwise no difference
Table 147 Comparison of Mean Responses and Analysis of Variance (ANOVA) Ranking of Other Protein
bull Scale of 1 (CSM inferior to respective feed) to 7 (CSM superior to respective feed) for the mean ranking
a Mean significantly larger across animal types at the 5 significance level otherwise no difference
b Mean significantly lower across animal types at the 5 significance level otherwise no difference
Table 148 Comparison ofMean Responses and Analysis of Variance (ANOVA) Importance of Nutritionshy
Related Factors in Choice ofCSM Over Alternativesmiddot
bull Scale of 1 (extremely unimportant) to 7 (extremely important) for the mean ranking a Mean significantly larger across animal types at the 5 significance level otherwise no difference
b Mean significantly lower across animal types at the 5 significance level otherwise no difference
Table 149 Comparison of Mean Responses and Analysis of Variance (ANOVA) Importance of Nonshy
Nutrition- Related Factors in Choice of CSM Over Alternativesmiddot
bull Scale of 1 (extremely unimportant) to 7 (extremely important) for the mean ranking
a Mean significantly larger across animal types at the 5 significance level otherwise no difference
b Mean significantly lower across animal types at the 5 significance level otherwise no difference
- = Not mentioned or ranked lower than 4th place
Table 151 Comparison of Responses Top Responses Why CSM IS NOT Selected as a Feed
- = Not mentioned or ranked lower than 5th place
Table 152 Comparison of Responses Top Characteristics that Have to Change for CSM to Be
- = Not mentioned or ranked lower than 5th place

14
confidence in the escape values they are using than was the case for beef (Table 84) Only 22 respondents however considered those escape values to be reliable or extremely reliable The principal single method or source used by respondents for the escape value they use was again the National Research Council (Committee on Animal Nutrition National Academy of Sciences) (Table 85) Book values was the next most frequently mentioned single source of CSM escape values (23) Finally nearly 100 of the respondents indicated an interest in obtaining information on escape values for CSM as processed by different methods (Table 86) The conclusion from the dairy cattle responses is the same as for beef cattle That is there appears to be a lack of reliable information on CSM escape values in the perception of dairy cattle feed formulators and that they are highly interested in obtaining more information in this regard
Gossypol Level Considered Safe for Mature Dairy Cattle and Pre-Ruminant Calves
Dairy cattle respondents appear to have little idea of what the safe levels are for gossypol in mature dairy cattle and pre-ruminant calf feeds First of all only one-third of those who returned surveys even attempted to provide numbers for safe gossypol levels (Tables 87 and 88) Many respondents simply wrote comments such as dont know or not aware of research on safe gossypol level in the margin of the survey beside the question Second those who attempted to answer the questions provided an amazingly wide range of safe gossypol levels from 0 parts per million (ppm) to 7500 ppm for mature dairy cattle and from 0 ppm to 1000 ppm for pre-ruminant calves The mean safe gossypol levels were 609 ppm for mature dairy cattle and 121 ppm for pre-ruminant calves The responses were spread quite evenly between the extremes around the means It should be noted that the research team checked and rechecked the data set for this question to insure there were no errors in data entry
Suggestions for Improving the Usefulness of Cottonseed Meal
Only about 22 of the dairy cattle feed formulators that returned surveys provided suggestions that might improve the value or usefulness of CSM in dairy cattle feed rations (Table 89) Some of the more frequent suggestions dealt with improving the consistency and availability of CSM Several respondents suggested the need for more information on gossypol a worthy suggestion given the results of the previous question
Poultry
The perceptions of poultry feed formulator respondents concerning the use of cottonseed meal differ importantly in many respects from the combined responses over all survey respondents and from those of beef and dairy cattle Many of the differences are likely the result of the distinct dietary needs of ruminant as opposed to non-ruminant animals The salient differences in responses by poultry feed formulators in the 6 general question areas include the following
bull Factors affecting choice of dietary proteins Surprisingly there was little difference in the responses of those indicating that they formulate feed for poultry than for the combined results (or for beef and dairy cattle) regarding the importance of the listed factors (quality price availability consistency and other) affecting the choice of dietary protein (Table 90) A large majority of poultry feed formulators ranked all factors as either important or extremely important The only exception is that consistency was ranked slightly less important by poultry respondents than by respondents in general
bull Cottonseed meal as an alternative protein feed Poultry respondents ranked more protein feeds as higher on the superior-to-CSM scale than was the case for the combined responses
15
(Table 91) In fact the mean rank of all but three of the protein feeds were all at least somewhat higher than was the case for the combined responses The mean rank of several of the other protein feeds as determined by the poultry respondents was much higher than for the combined responses including fish meal poultry by-product meal and soybean meal Poultry by-product meal changed from an inferior to a superior protein feed compared to CSM The protein feed judged by poultry respondents to be most superior to CSM for poultry rations was soybean meal while urea was ranked as most inferior Poultry respondents also appeared to have stronger opinions about whether or not CSM is an alternative to the other listed protein feeds than was the case for the combined responses They overwhelmingly perceived that CSM is not an alternative to many of the other protein feeds including fish meal dried skim milk dried whole milk poultry by-product meal blood meal tankage and urea A larger percentage of poultry respondents than was the case for dairy and beef cattle perceived however that CSM is a definite alternative to many other protein feeds including safflower meal sunflower meal linseed meal peanut meal canola meal feather meal distillers dried grains brewers dried grains and even soybean meal
bull The importance of nutritional and non-nutritional factors Poultry respondents ranked all but two of the listed nutrition-related factors as more important in the choice of CSM over alternative protein feeds for poultry rations than was the case for the combined responses on average (Le comparing mean responses) (Table 92) The highest percentage of poultry respondents ranked gossypol level (62 of the respondents) amino acid balance (59) aflatoxin (58) protein quality (57) and amino acid availability (57) as extremely important in the choice of CSM over alternative protein feeds Only about 5 of the respondents listed other important nutrition-related factors (Table 93) There are few differences however in the poultry responses as compared to the combined responses regarding the importance of non-nutrition-related factors (Table 94) The major difference is a much lower ranking of the importance of palatability in choosing CSM over alternative protein feeds Also a somewhat higher percentage of poultry respondents ranked price as an extremely important non-nutrition-related factor Few other non-nutrition-related factors were listed by the respondents (Table 95)
bull Seasonality of cottonseed meal availability The results for the poultry respondents regarding the months of the year when CSM is not available are highly consistent with those for the combined responses and those for the beef and dairy cattle responses Poultry respondents indicated that May through September are the months of least availability of CSM (Table 96) But likely because of the shorter production cycle for poultry than for cattle poultry respondents indicated that CSM needs to be available in almost every month (but slightly less so in August and September) for CSM to compete effectively with alternative protein feeds (Table 97) For poultry therefore the indication is that poultry feed formulators may perceive an availability problem which inhibits greater use of CSM in poultry rations to some extent
bull Reasons for the selection and non-selection of cottonseed meal Again price and availability are the number one and number two reasons respectively cited by poultry respondents for which CSM is selected as a feed ingredient (Table 98) Protein quality ranked third on their list followed closely by phosphorous content The top reason that CSM is not selected according to the poultry respondents was pricevalue (Table 99) About tied for second place were gossypol content and availability More respondents ranked availability as the second reason than for gossypol content but more respondents listed gossypol first The amino acid level was listed as a distant fourth reason for which CSM is not selected as a feed ingredient Price is again the key CSM characteristic that poultry respondents indicated must change in
16
order for CSM to be used more frequently in poultry rations (Table 100) Gossypol was clearly considered to be the second most important characteristic that must change Availability was ranked as either first or second by all respondents who listed it as a characteristic that must change
bull Source of chemical analyses for cottonseed meal The results for the chemical analyses performed by poultry respondents are similar to those of both the combined results and those of the beef and dairy cattle results The primary analysis routinely performed by the poultry respondents is crude protein (51 of 55 respondents) followed by fat (40 respondents) fiber (37 respondents) and aflatoxin (31 respondents) (Tables 101 and 102) The primary analytical values supplied to the poultry respondents also included crude protein fiber and fat (Table 103) A third of the poultry respondents indicated that their CSM supplier does not provide them with any analytical values Once again even though aflatoxin was ranked as an extremely important nutrition-related factor in the choice of CSM as a feed component only I respondent obtains an analytical value for aflatoxin from his CSM supplier and only a little over half routinely perform their own aflatoxin analyses
Poultry sample members were asked some specific questions regarding the use of CSM in poultry feed formulations in 5 general areas I) problems resulting from feeding a ration with CSM to the various poultry types 2) specific information on several key nutrition-related factors affecting the use of CSM in poultry rations 3) sources of information utilized on formulating poultry feeds 4) CSM price and value and 5) an open-ended question soliciting suggestions to improve the usefulness or value of CSM for poultry feed formulations
Problems from Feeding CSM Rations to Poultry
The majority of poultry respondents indicated no knowledge of any problems associated with feeding a ration containing CSM to poultry (Table 104) Only 14 of the respondents indicated problems with broilers less than 7 for breeding flocks and about 3 for turkeys Over a third however indicated that they had knowledge of such problems with layers The number one problem reported was yolk molting and discoloration primarily in layer rations (Table 105) A few respondents indicated problems with depressed growth associated with broiler feeds containing CSM
Information on Key Nutrition-Related Factors for Poultry Rations
The survey sample members were asked to respond to a number of specific questions related to nutritional factors that affect the use of CSM in poultry rations including protein energy fat gossypol and synthetic amino acids They were then asked to indicate their perception of the overall feeding value of a standard 41 protein CSM compared to that of a standard 44 protein soybean meal The questions were designed primarily to determine the extent of knowledge among feed formulators concerning these factors as they relate to the use of CSM and the relative feeding value of CSM
Sample members were asked to respond to two questions regarding protein in poultry feed rations They were first asked to indicate the specific protein-related factors that they consider when balancing rations for poultry They were given a list of three factors (crude protein level amino acid content and amino acid availability) They were also allowed to specify any other protein-related factors they consider when balancing poultry rations They were then asked to indicate the crude protein levels they would prefer for cottonseed meal and were given a choice of four levels (3641 (standard) 44 and 48) and allowed to suggest any other preference for crude protein level
17
Almost all poultry respondents indicated that they consider amino acid content and availability when balancing feed rations with fewer responding that they consider the crude protein level (Table 106) Other protein-related factors listed by the respondents included amino acid balance protein digestibility and energy levels (Table 107) With regard to preferred crude protein level for CSM over half of the poultry respondents indicated a preference for 48 crude protein (Table 108) About 27 of the respondents were satisfied with the standard 41 level and 20 indicated a preference for a 44 protein CSM No respondents preferred anything less than the standard 41
With respect to energy levels the sample members were asked to indicate what they considered to be the normal maximum and minimum energy levels for protein feeds for broilers layers turkeys and breeding flock As Table 109 indicates the responses varied widely with little or no indication of a mode (most frequent response) in most cases For broilers the maximum (in K Cals DE per pound) ranged from 0 to 1800 and the minimum from 850 to 1700 with a mean maximum of 1436 and a mean minimum of 1276 For layers the maximum (in K Cals DE per pound) ranged from 1000 to 1800 and the minimum from 800 to 1500 with a mean maximum of 1347 and a mean minimum of 1187 For turkeys the maximum (in K Cals DE per pound) ranged from 1100 to 1725 and the minimum from 850 to 1700 with a mean maximum of 1334 and a mean minimum of 1261 For breeding flocks the maximum (in K Cals DE per pound) ranged from 1000 to 1600 and the minimum from 750 to 1600 with a mean maximum of 1328 and a mean minimum of 1159 Given the disparity in the responses it seems clear that there is little common concept of the normal maximum and minimum energy levels for protein feeds
Sample members similarly were asked to indicate the minimum and maximum fat levels they considered critical for protein feeds Although the range of responses was still quite wide there appeared to be more uniformity in responses to this question than the one for energy (Table 110) The maximum fat levels (ether extract as fed basis) indicated by the respondents ranged from 1 to 15 or 20 for most poultry types The minimums ranged from 0 to 15 The mean minimum levels of fat for all poultry types was about 3 The mean maximum ranged from 6 to 82 depending on the poultry type
Sample members were asked to indicate the level of gossypol they considered safe for poultry rations The responses again varied widely from a low of 0 ppm up to a high of 300 ppm for all poultry types (Table III) The highest mean level of gossypol as calculated from the responses to the question were 104 ppm for broilers and 91 ppm for turkeys For layers and breeding flocks the mean levels were much lower at 57 ppm and 54 ppm respectively
The questionnaire also asked the sample members to indicate if they use or would use synthetic amino acids where economical The response was that nearly 100 of all poultry respondents indicated that they have or would use synthetic amino acids in this situation (Table 112) This suggests little real aversion on the part of feed formulators to utilize synthetic amino acids in least cost poultry formulations
To obtain some insight on the general perception of poultry formulators regarding CSM the sample members were asked to indicate the overall feeding value of a standard 41 protein CSM compared to that of a standard 44 protein soybean meal in their opinion on percentage basis They were given the choice of 5 ranges from under 70 to over 100 in 10 increments (see Table 113 for the actual ranges used) Nearly 80 of the respondents indicated that CSM has an overall feeding value of under 90 of that of soybean meal Given the five choices offered to respondents the mean feeding value was around 80
18
Sources of Information Utilized on Formulating Poultry Feeds
About two-thirds of the poultry respondents indicated that they were familiar with research on feeding CSM to broilers and layers (Table 114) Only half however indicated familiarity with such research for turkeys and only a little over a third for breeding flocks Less than 10 of the respondents listed any other research on feeding CSM to other types of poultry (Table 115) To obtain information on formulating feeds for poultry the largest number of respondents (52 of the 55 respondents) indicated that they utilize university research followed by industry publications of some type (45 respondents) university extension services (26 respondents) and government agencies (20 respondents) (Table 116) Only 17 respondents listed other sources of information including primarily personal experience and research (Table 117)
Cottonseed Meal Price and Value
To get some idea concerning the poultry respondents perceptions of the value of CSM particularly with respect to soybean meal sample members were asked 1) if they would be willing to pay a premium per unit of protein for CSM with more than a standard 41 protein and 2) if gossypol and fiber were sufficiently low on average what percent of the cost of soybean meal they would be willing to pay for CSM
With respect to the first question only about half the respondents indicated a willingness to pay a premium for a CSM with more than 41 protein despite the fact that 75 of them indicated earlier that they would prefer a CSM with a higher crude protein level (Table 118) Thus at least 25 of the respondents prefer a higher protein level CSM but would not be willing to pay a premium to get it
In response to the second question poultry respondents indicated that they would only be willing to pay an average of about 76 of the cost of soybean meal for a CSM with a sufficiently low level of gossypol and fiber (Table 119) The range around that average however was fairly large from 50 to 95 Because CSM has traded at about 91 of the value of soybean meal on the market on a protein equivalent basis and about 85 on an unadjusted basis on average in each year since 1984 either poultry respondents are currently unaware of the historical CSM to soybean meal price relationship or they are indicating that the current CSM market price relative to that of soybean meal is substantially above the levels that most find acceptable
Suggestions for Improving the Usefulness of Cottonseed Meal
Only about 27 of the poultry feed formulators that returned surveys provided suggestions that might improve the value or usefulness of CSM in poultry feed rations (Table 120) Some of the more frequent suggestions included the need for more information on the use of CSM in poultry rations increased availability of CSM and nutrient guarantees
Catfish
The perceptions of catfish feed formulator respondents concerning the use of cottonseed meal correspond closely to those of the poultry respondents likely because of the similar dietary needs of non-ruminant animals The salient differences in responses by catfish feed formulators in the 6 general question areas included on this section of the surveys include the following
bull Factors affecting choice of dietary proteins There were no differences in the responses of those indicating that they formulate feed for catfish than for poultry regarding the importance
19
of the listed factors (quality price availability consistency and other) affecting the choice of dietary protein (Table 121) A large majority of catfish respondents ranked all factors as either important or extremely important as did poultry respondents
bull Cottonseed meal as an alternative protein feed As was the case for poultry catfish respondents ranked more protein feeds as higher on the superior-to-CSM scale than was the case for the combined responses (Table 122) Catfish feeders however ranked meat and bone meal and blood meal as even more superior to CSM than did poultry respondents The protein feeds that catfish respondents ranked as roughly similar to CSM included tankage feather meal peanut meal linseed meal corn gluten meal brewers dried grains distillers dried grains sunflower meal safflower meal and canola meal Catfish respondents also appeared to have nearly as strong views about whether or not CSM is an alternative to the other listed protein feeds as did poultry respondents They perceived that CSM is not an alternative to many of the other protein feeds including blood meal dried whole milk meat and bone meal and dried skim milk Catfish respondents also perceived however that CSM is a definite alternative to many other protein feeds including safflower meal canola meal peanut meal sunflower meal linseed meal distillers dried grains brewers dried grains tankage soybean meal wheat middlings corn gluten meal urea and feather meal
bull The importance of nutritional and non-nutritional factors The responses for catfish with regard to the importance of nutrition-related and non-nutrition-related factors in choosing CSM as a component of catfish feeds were roughly similar to those for poultry (Table 123) The salient differences were that a larger percentage of catfish respondents ranked energy level fat level and fiber level as important or extremely important and a much larger percentage ranked aflatoxin as extremely important One major difference of the catfish responses regarding the importance of non-nutrition-related factors from those of poultry is that palatability is much mOre of a concern to catfish feeders (Table 124) Bin space is less important to catfish respondents and service from the CSM industry is more important to them
bull Seasonality of cottonseed meal availability The results for the catfish respondents regarding the months of the year when CSM is not available were generally consistent with those for poultry except that May and June were perceived as less problematic for obtaining CSM supplies by the catfish respondents (Table 125) Catfish formulators perceive that CSM needs to be more available in April through October than during the rest of the year to be competitive with other protein feeds (Table 126) This suggests the perception on the part of catfish feed formulators of a CSM availability problem during about the first half of any given year
bull Reasons for the selection and non-selection of cottonseed meal Pricevalue is the number one reason cited by catfish respondents for which CSM is selected as a feed ingredient followed by protein quality and palatability (Table 127) The top reason that CSM is not selected according to the catfish respondents is pricevalue followed by quality and gossypol level (Table 128) Gossypol level is the key CSM characteristic that catfish respondents indicated must change in order for CSM to be used more frequently in catfish rations (Table 129) Quality was clearly considered to be the second most important characteristic that must change followed by aflatoxin level This is the only animal species for which price was not the number one characteristic cited that would have to change and was not even listed among the top three responses The implication is that catfish feed formulators may not consider the price of cottonseed meal to be out of line with their needs and thus do not consider price to be a particular problem for the use of CSM in catfish rations A word of caution is in order
20
to avoid taking this conclusion too far because of the relatively few number of catfish feed formulators in the sample
bull Source of chemical analyses for cottonseed meal The results for the chemical analyses performed by poultry respondents are similar to those of poultry as well as those of both the combined results and the beef and dairy cattle results The primary analysis routinely performed by the catfish respondents is crude protein followed by fat fiber aflatoxin and gossypol (Tables 130 and 131) The primary analytical values supplied to the catfish respondents also included crude protein fiber and fat (Table 132) Only 2 of the II catfish respondents indicated that their CSM supplier does not provide them with any analytical values Even though gossypol was ranked as an extremely important nutrition-related factor in the choice of CSM as a feed component and the number one CSM characteristic that needs to change only 5 of the II respondents routinely perform gossypol analyses None of catfish respondents obtain analytical values for aflatoxin from their CSM supplier
As for poultry catfish sample members were asked some specific Questions regarding the use of CSM in catfish feed formulations in 5 general areas 1) problems resulting from feeding a ration with CSM to the various catfish types 2) specific information on several key nutrition-related factors affecting the use of CSM in catfish rations 3) sources of information utilized on formulating catfish feeds 4) CSM price and value and 5) an open-ended Question soliciting suggestions to improve the usefulness or value of CSM for catfish feed formulations
Problems from Feeding CSM Rations to Catfish
Absolutely no catfish respondents indicated any knowledge of any problems associated with feeding a ration containing CSM to catfish (Table 133)
Information on Key Nutrition-Related Factors for Catfish Rations
As for poultry the survey sample members were asked to respond to a number of specific Questions related to nutritional factors that affect the use of CSM in catfish rations including protein energy fat gossypol and synthetic amino acids They were then asked to indicate their perception of the overall feeding value of a standard 41 protein CSM compared to that of a standard 44 protein soybean meal Just as for poultry these Questions were designed primarily to determine the extent of knowledge among catfish feed formulators concerning these factors as they relate to the use of CSM and the relative feeding value of CSM
Sample members were asked to respond to two Questions regarding protein in catfish feed rations They were first asked to indicate the specific protein-related factors that they consider when balancing rations for catfish They were given the same list of three factors (crude protein level amino acid content and amino acid availability) to choose from that the poultry sample members were given Again they were also allowed to specify any other protein-related factors they consider when balancing catfish rations They were then asked to indicate the crude protein levels they would prefer for CSM and were given the same choice of four levels as the poultry sample members (36 41 (standard) 44 and 48) and allowed to suggest any other preference for crude protein level In contrast to poultry the largest percentage of catfish respondents indicated that they consider amino acid availability (10 of the 11 catfish respondents) rather than the content when balancing catfish rations (Table 134) The second largest percentage consider crude protein level (9 respondents) also a different result from poultry
21
With regard to the crude protein level for CSM preferred by catfish respondents about 43 indicated a preference for 48 crude protein (Table 135) About 20 of the respondents were satisfied with the standard 41 level and nearly 30 indicated a preference for a 44 protein CSM No respondents preferred anything less than the standard 41 The mean preferred crude protein level was about 42
With respect to energy levels the catfish sample members were asked to indicate what they considered to be the normal maximum and minimum energy levels for protein feeds for fingerlings grow out stock brood stock and fries Despite the low number of catfish respondents the answers to this question were widely divergent (Table 136) For fingerlings the maximum (in K Cals DE per pound) ranged from 1250 to 1800 and the minimum from 2 to 1500 with a mean maximum of 1525 and a mean minimum of 834 For grow out stock the maximum (in K Cals DE per pound) ranged from only 1500 to 1600 and the minimum from 1 to 1300 with a mean maximum of 1550 and a mean minimum of 750 For catfish brood stock the maximum (in K Cals DE per pound) ranged from 1300 to 1700 and the minimum from 1200 to 1400 with a mean maximum of 1500 and a mean minimum of 1300 For fries the maximum (in K Cals DE per pound) ranged from 1250 to 1800 and the minimum from 900 to 1500 with a mean maximum of 1525 and a mean minimum of 1200 Given the disparity in these responses it seems clear again for catfish feed formulators that there is little common concept of the normal maximum and minimum energy levels for protein feeds
Catfish sample members similarly were asked to indicate the minimum and maximum fat levels they considered critical for protein feeds As with poultry the range of responses was still quite wide but there also appeared to be more uniformity in responses to this question than the one for energy level (Table 137) The maximum fat levels (ether extract as fed basis) indicated by the respondents again ranged from 1 to 15 for most catfish types as was the case for poultry The mean minimum levels of fat for all catfish types ranged from about 3 to 5 The mean maximum ranged from 6 to 10 aCrOSS the different catfish types
Catfish sample members were also asked to indicate the level of gossypol they considered safe for catfish rations The responses again varied widely from a low of 0 ppm up to a high of 300 ppm for some catfish types (Table 138) The two highest mean safe levels of gossypol were 97 ppm for grow out stock and 83 ppm for brood stock For fingerlings and fries the safe maximum mean levels were much lower at 44 ppm and 23 ppm respectively
The questionnaire also asked the sample members to indicate if they use or would use synthetic amino acids where economical The response was that 83 (all but 2) of the catfish respondents indicated that they have or would use synthetic amino acids in this situation (Table 139) This suggests little real aversion on the part of feed formulators to utilize synthetic amino acids in least cost catfish formulations
To obtain some insight on the general perception of catfish formulators regarding CSM the sample members were asked to indicate their opinion of the overall feeding value of a standard 41 protein CSM compared to that of a standard 44 protein soybean meal expressed on a percentage basis They were given a choice of 5 ranges from under 70 of the feeding value of soybean meal to over 100 in 10 increments (see Table 140 for the actual ranges used) All but one of the catfish respondents indicated that CSM has an overall feeding value of under 90 of that of soybean meal Given the five choices offered to respondents the mean feeding value of CSM relative to that of soybean meal was around 80
22
Sources of Information UtiJized on Formulating Catfish Feeds
Only about half of the catfish respondents indicated that they were familiar with research on feeding CSM to grow out stock and only a third were familiar with research on fingerlings (Table 141) Only 2 respondents were familiar with any research on feeding CSM to brood stock and fries To obtain information on formulating feeds for catfish the largest number of respondents indicated that they utilize university research and industry publications of some type (Table 142)
Cottonseed Meal Price and Value
Catfish sample members were also asked two Questions to get some idea concerning their perception of the value of CSM particularly with respect to soybean meal 1) if they would be willing to pay a premium per unit of protein for CSM with more than a standard 41 protein and 2) if gossypol and fiber were sufficiently low on average what percent of the cost of soybean meal would they be willing to pay for CSM
With respect to the first Question 75 of the catfish respondents indicated a willingness to pay a premium for a CSM with more than 41 protein which is consistent with their earlier responses that they would prefer a CSM with a higher crude protein level (Table 143)
In response to the second Question catfish respondents indicated that they would only be willing to pay an average of about 82 of the cost of soybean meal for a CSM with a sufficiently low level of gossypol and fiber (Table 144) The range around that average was more narrow than for poultry from 70 to 100 This is more consistent with the ratio of CSM price to soybean meal price that has existed over the last 7 or 8 years on average
Suggestions for Improving the Usefulness of Cottonseed Meal
Only three catfish respondents offered suggestions for improving the usefulness or value of CSM for catfish rations The three suggestions included I) providing a more consistent product in price and Quality 2) providing a premium Quality toxin-free high protein low-fat product superior to soybean meal and 3) eliminating the CHO fraction (Table 145)
Comparisons Among Animal Species
In order to highlight the salient differences in responses with respect to the various animal species the mean responses to Questions that are common among all surveys regarding CSM use as a feed ingredient were compared and analyzed An analysis of variance (ANOY A) was also done to detect statistically significant differences in the mean responses to each Question by animal specie Comparisons are made among the mean responses to all Questions in the 6 general areas to which all sample members were asked to respond regardless of the animal specie(s) for which they formulate feeds 1) the particular factors affecting their choice of dietary proteins for formulated feeds 2) the extent to which CSM is considered to be an alternative to selected protein feeds 3) the importance of nutritional and non-nutritional factors in their decisions to use CSM rather than alternative dietary proteins in their feed formulations 4) the seasonality of CSM availability 5) the specific reasons for the selection and non-selection of CSM for use in the feeds they formulate and 6) the source of CSM chemical analyses used by the respondents Where appropriate ANOY A results are also indicated
23
Factors Affecting Choice of Dietary Proteins
As discussed earlier all members of the final sample regardless of the animal species for which they formulate feeds were asked to rank the importance of four general factors in their choice of a dietary protein for their feed formulations on a scale of I to 7 (from extremely unimportant to extremely important respectively) 1) quality 2) price 3) availability and 4) consistency Comparing the results across animal types reveals few significant differences in the importance attached to any of the four factors by the responding formulators of the various animal specie feeds (ie comparing results horizontally in Table 146) But as pointed out in an earlier section the mean rankings for quality are all higher than those for the other factors while the mean rankings of price are all lower than those for most other factors across all animal types In other words the respondents consistently ranked quality highest on the scale of importance followed in order by consistency availability and price
Cottonseed Meal As An Alternative Protein Feed
Recall that the sample members were asked to rank various selected protein feeds on a scale of 1 to 7 as inferior or superior to CSM in an overall sense for use in feed formulations A second question required respondents to indicate whether or not they considered CSM to be an alternative to each of the 20 listed protein feeds A comparison of the mean ran kings and ANOV A results across animal types indicates substantial agreement among the respondents regarding the ranking of CSM as an alternative to some animal feeds and substantial disagreement with respect to CSM as an alternative to many others (Table 147) Respondents over all animal types tended to agree that certain feeds and in particular the higher crude-protein-content feeds are clearly superior to CSM including dried skim milk meat and bone meal fish meal blood meal soybean meal dried whole milk and corn gluten feed There was a statistically different deviation in the extent to which respondents for some animal species regarded those meals as superior however For example catfish respondents ranked meat and bone meal fish meal poultry by-products blood meal soybean meal and corn gluten meal higher than did respondents for the ruminant animals The same was roughly the case for poultry Beef and dairy cattle respondents tended to rank all other protein feeds as less superior (ie more inferior) to CSM There was also substantial agreement that CSM was about the same as tankage peanut meal linseed meal and brewers and distillers dried grains but superior to some extent over the other feeds particularly those lower in crude protein including dehydrated alfalfa sunflower meal wheat middlings safflower meal canola meal feather meal and urea Beef and dairy cattle respondents agreed that CSM can be considered an alternative to nearly all the protein feeds except perhaps skim and whole dried milk Poultry and catfish respondents indicated CSM is an alternative to fewer of the other protein feeds
The Importance of Nutritional and Non-Nutritional Factors
Respondents also ranked the importance of specific nutrition-related and non-nutritionshyrelated factors in choosing cottonseed meal as a component of the feeds they formulate on a scale of extremely unimportant to extremely important (a scale of I to 7 respectively) Comparing the mean rankings by the respondents reveals that poultry and catfish feed formulators clearly consider proteinshyrelated factors and gossypol level to be more important than do beef and dairy feed formulators (Table 148) Fiber level is also of more importance to formulators of catfish feed Interestingly the importance of fiber was not ranked significantly higher by poultry feed formulators than by beef and dairy cattle feed formulators At the same time aflatoxin was clearly ranked by all respondents as the most important factor affecting the choice of CSM as a feed ingredient irrespective of the animal specie for which the ration is intended
24
For the non-nutritional factors an analysis of the mean rankings indicates few significant differences in the responses across animal species with respect to each individual factor listed (Table 149) The most notable exception is that poultry respondents ranked palatability significantly less important than did any of the other respondents for the other animal species Finally catfish respondents perceived that service by the CSM industry was more important for them than did the respondents for the other animal species
Seasonality of Cottonseed Meal Availability
The respondents across all animal species indicated that CSM is least available between about May and October likely reflecting the increasing shortages of cottonseed meal supply just prior to the cotton harvest in the fall (Figure 20) At the same time however the beef cattle dairy cattle and poultry respondents all indicated that there is less need for CSM to be available during approximately those same months in order to compete effectively with other protein feeds (Figure 21) This suggest that the seasonality of supply may not represent an important constraint to competitiveness and growth possibilities of CSM as a feed ingredient Interestingly catfish respondents suggested a largely inverse pattern of the times of the year when CSM needs to be available to compete effectively with other protein feeds as a catfish feed ingredient Possible explanations of this phenomenon include I) the protein feed needs of catfish feed formulators peak in the late spring and summer months when supply is less available 2) catfish feed formulators are located such that CSM is not easily obtainable particularly during short supply years or 3) formulators of feed for other animal species have longer experience in using CSM and have adjusted their formulation to the pattern of CSM supply availability In any case it should be remembered that there are relatively few catfish feed formulators in the sample so that their joint responses may not be truly representative of all catfish feed formulators In this case this difference in their responses may mean little
Reasons for the Selection and Non-Selection of Cottonseed Meal
Respondents across animal species were quite consistent in their ranking of the top reasons that CSM is included in feed formulations (Table 150) They overwhelmingly ranked price as the top reason followed generally by availability and protein quality Catfish respondents differed somewhat from that order ranking protein quality second and palatability as third Availability was ranked fourth by catfish respondents The top reason all respondents listed for which CSM is not included in feed formulations was also price (Table lSI) Beef and cattle respondents ranked availability as second but poultry respondents ranked gossypol second while catfish respondents ranked protein quality second A vailability ranked only as the third reason that CSM is not selected by poultry respondents and fourth by catfish respondents Gossypol ranked either third or fourth for all animal species except poultry for which gossypol appears to be a more important reason for not including CSM in poultry feed formulations The question regarding the characteristics of CSM that would have to change in order for it to be selected more frequently as a feed ingredient elicited about the same responses as those for the previous question concerning why CSM is not included in feed formulations (Table 152) The top characteristic that would have to change in the opinion of most respondents is price Catfish respondents however listed price extremely low on their list suggesting that other factors are more of a constraint to CSM use in their opinion They ranked gossypol as the number one characteristic that would have to change Availability appeared to be more of a concern to beef and dairy feed formulators than for poultry and catfish formulators
25
Source of Chemical Analyses for Cottonseed Meal
About the same percentage of respondents across animal species perform analytical tests for aflatoxin crude protein fat fiber and gossypol (Figure 22) The only noticeable differences were for aflatoxin and gossypol for which about half the percentage of dairy and beef respondents compared to catfish respondents reported that they routinely perform tests A higher percentage of poultry respondents also appear to perform tests for aflatoxin and gossypol than is the case for beef or cattle respondents Crude protein is tested for by the highest percentage of respondents for all animal species while gossypol is tested for by the smallest percentage of all respondent groups except catfish CSM suppliers are more likely to provide feed formulators with analytical values for crude protein fat and fiber than for aflatoxin or gossypol (Figure 23) A sizeable percentage of the respondents across all animal types reported that their CSM supplier provides no analytical values whatsoever
Summary ofMajor Findings
Of the reams of information normally provided by a study like this relatively little is usually new or profound And of what can be found that appears important only some is little more than interesting or particularly useful Before turning to a discussion of the implications of the study results the major findings across animal groups are briefly summarized first Sifting through the many tables figures and data sets the main findings of the study appear to be the following
bull Quality is the most important factor affecting the choice of dietary proteins by feed formulators followed by consistency and availability Price is the least important of the four factors in making general decisions regarding dietary proteins for animal diets
bull Once feed formulators have set the general parameters for use of dietary proteins in their formulations however price is the most important factor determining the choice among alternative dietary proteins to satisfy the general parameters for dietary protein use in feed formulations
bull When considering whether or not to use CSM as the dietary protein in feeds the nutritional factors of most concern to formulators of feed for non-ruminant animals (poultry and catfish) appear to be protein-related For formulators of ruminant (beef and dairy cattle) feeds aflatoxin level and rumen degradability are the most important nutritional factors
bull The most important non-nutritional factors affecting feed formulators decisions regarding whether or not to use CSM are I) price 2) availability 3) consistent quality and 4) palatability in that order
bull Non-nutritional factors are more important than nutritional factors in the choice of CSM over alternative feeds to fill the dietary protein requirements of feed formulations In general price and availability were ranked above protein quality and other nutrition-related factors as reasons why CSM is and is not chosen as a feed ingredient over alternatives Price and availability were also cited as the characteristics that most need to change in order for CSM to be selected as a feed ingredient more frequently
bull CSM is generally considered to be inferior to higher protein feedstuffs and superior to lower protein feedstuffs This generalization however does not hold for all feeds and all animal types Formulators of ruminant animal feeds ranked many of the higher protein feeds more on a par with CSM than did formulators of non-ruminant animal feeds
26
bull The seasonality of CSM availability is both a positive and a negative factor affecting the use of CSM rather than alternative protein feeds in animal feed rations That is CSM is obviously more likely to be selected as a feed ingredient during months of greater availability than during the months of lower availability In general however the survey responses indicate that CSM is normally available when feed formulators perceive that it needs to be available One word of caution It may be that a higher percentage of CSM users agreed to participate in this survey than those who are currently not using CSM Those who are current CSM users may well have already adjusted their feed purchasing patterns and operations to reflect the seasonal changes in the availability of CSM Consequently current CSM users may perceive less of an availability problem than those who are not currently using CSM In this case the responses to these questions may not be truly representative of the perception of the availability of CSM by feed formulators in general
bull There is a tremendous disparity in the perception of respondents as to the appropriate levels of several key nutrition-related factors for specific livestock rations including energy levels fat levels gossypol levels and escape values (ruminants only) for cottonseed meal For each animal specie the range of variation in the perceived acceptable levels of each of these factors was extremely wide The obvious conclusion is that feed formulators generally lack adequate and reliable information on many factors which are crucial in efficient feed formulation and which have a significant impact on the choice of CSM as a feed ingredient
PROBLEMS AND OPPORTUNITIES FOR EXPANDING COTTONSEED MEAL USE
CSM is somewhat unique among vegetable protein meals in that it is the product of a byshyproduct The volume of the by-product cottonseed available for crushing and the potential supply of CSM depend more on the dynamics of cotton supply and demand than on forces specific to CSM markets This mean that market signals from feed formulators and livestock feeders regarding desired values and characteristics of protein meals likely have little impact on the potential CSM market supply
Since the mid-1970s the share of the annual production of cottonseed fed directly to ruminant livestock has increased steadily from about 5 in 1974 to nearly 40 in 1990 (Figure 24) The consequence has been a marked decline both in the share of the available supply of cottonseed that is crushed and in the ratio of actual to potential cottonseed meal output An increase in the demand for CSM therefore will either bid up the market price of CSM with no additional volume actually used or increase the cottonseed crush to feed use ratio (or some combination thereof) There will be little or no effect on the total amount of cottonseed available
The intent of efforts to expand the market for any commodity is to effect an increase in sales at a higher price For a commodity with a relatively fixed supply the major result of an expansion in demand is solely an increase in price because supply cannot increase to allow an increase in use For a commodity with an unlimited supply successful market expansion efforts simply increase use to the extent of the promotion with no increase in price For a commodity with a supply somewhere in between those two extremes successful market expansion will increase both the price and quantity used Although the situation for cottonseed meal is closer to the fixed supply end of the spectrum market expansion efforts can increase the use of cottonseed meal through an increase in the crush-toshy
27
feed cottonseed use ratio This ratio will increase as the profitability of crushing vs alternative uses of the seed increase
The results of this survey however indicate both some problems and possible opportunities for expanding cottonseed meal use After briefly summarizing the major obstacles as identified in the study the major opportunities for expanding use of cottonseed meal will be discussed
Problems for Expanding Cottonseed Meal Use
The major problems for expanding CSM use are generally well known and verified by the survey results The major problems that would hinder efforts to expand cottonseed meal use identified in the study included primarily the following
bull Price and availability of CSM are the major factors affecting the selection or non-selection of CSM as an ingredient of feed formulations regardless of animal specie These nonshynutritional factors were judged to be more important than nutritional factors in selecting CSM as a feed ingredient Unfortunately neither the price nor the availability of CSM can be controlled or altered substantially or directly by market expansion efforts Some efforts to improve availability may be possible as discussed in the next section
bull CSM is perceived to be inferior in an overall sense to a number of key protein feeds CSM was judged by the survey respondents to be clearly superior in aggregate to only 5 of 20 potential alternate protein feeds Such an image could work against efforts to expand CSM use
bull Gossypol level is one of the top reasons that CSM is not used more frequently particularly in non-ruminant feed rations The level of gossypol is a unique characteristic of CSM that obviously cannot be changed through market expansion activities
bull Several other specific characteristics of CSM would likely need to change for CSM to be selected more frequently as a feed ingredient including amino acid balance energy level aflatoxin level and protein quality As with gossypol changes in these characteristics are out of the realm of market expansion programs
bull Feed formulators generally lack adequate and reliable information on many factors which are crucial in efficient feed formulation and which likely have a significant impact on the choice of protein feedstuffs The use of CSM in livestock feed rations is likely restricted by the wide disparity in the perception of feed formulators regarding the appropriate levels of several key nutrition-related factors for specific livestock rations including energy levels fat levels gossypol levels and escape values (ruminants only) for cottonseed meal
bull Over 75 of dairy cattle feed formulators and nearly half of beef cattle feed formulators utilize whole fuzzy cottonseed to some extent in some of the feed rations they formulate Relatively few reported using utilizing both CSM and whole cottonseed in the same ration A main attraction of the use of whole fuzzy cottonseed as opposed to cottonseed meal is the fiber content Indeed the use of whole delinted cottonseed in cattle feed rations is much lower
28
Opportunities for Expanding Use of Cottonseed Meal
There are essentially only two basic tools to expand the market for any commodity l market development and 2) enhancing the efficiency of the marketing system Market development involves a wide range of activities including primarily new product development and product differentiation In new product development the effort is to develop new products or characteristics of products that appeal to different segments of consumers An example might be research leading to the elimination of gossypol in cottonseed meal which could further open up the non-ruminant feed industry to cottonseed meal
Product differentiation on the other hand encompasses those activities designed to create a user preference for or loyalty to a commodity Product differentiation occurs in two major forms 1) advertising and 2) variation in design and quality of product The primary purpose of advertising is to create user preference for a commodity and convince users of the superiority of a product over competing products Actual physical differences in the product are not necessary to successfully differentiate it from competing products It is sufficient only that users believe that some superiority exists Advertising often intends to create an image of superior quality because such images are harder to imitate or successfully counter than physically unique features Successful differentiation of a product means that users become less sensitive to price changes more willing to pay a higher price for the same quantity because they prefer the product and are loyal to it in the face of price increases In other words users are willing to pay more for the same amount because advertising if successful creates a preference for the product over competing products
Variations in quality and design are usually used along with advertising to differentiate the product of one seller from that of another Such variations are often necessary to help create the superior images desired andor attract new sets of consumers
Often barriers exist in a marketing system that hinder the efficient functioning of the market and restrict the flow of commodities from sellers to users Enhancing the efficiency of the marketing system through eliminating such barriers can lead to an expansion in the use of a commodity One of the primary requirements of an efficiently functioning market is that sellers and users possess adequate and accurate information regarding the product its characteristics availability sources uses and value among other things Inadequate or inaccurate information regarding a particular product and other market characteristics can divert demand to alternative products with which users may be more familiar regardless of whether or not those products are better in some sense
The concept and importance of enhancing market efficiency in this regard can be illustrated by comparing the flow of information about a product and market conditions with a radio broadcasting system The efficiency of such a system depends on how accurately the microphone and other equipment record sound how accurately and rapidly that sound is transmitted to a radio receiver and how accurately the receiver brings sound to the listener A breakdown anywhere along the line in that system will simply mean that the message of the broadcast does not get from the radio station to the listener Also if the message gets through but static interferes with the transmission the listener might only receive part of the message or a garbled message The listeners impressions and actions consequently might be quite different than if he had received the message intended In quite the same manner the flow of a commodity from producers to users is affected by how rapidly and accurately market information is evaluated and how accurately and rapidly this information is transmitted to and among producers and users Any breakdown or static in the system would result in a smaller and more obstructed flow of the commodity to users than if the market operated more efficiently
29
The survey results suggests possible opportunities for expanding CSM use through market development and enhancing market efficiency Market development opportunities may be limited because of the nature of the CSM supply situation Nevertheless expansion of CSM use is possible through a reduction in direct feeding of cottonseed so that opportunities for expanding use through market expansion efforts should not be discounted Efforts to enhance the adequacy and accuracy of information regarding the use of CSM as a feed ingredient however may well be the most effective means of promoting an expansion of use or enhancement of the value of CSM
Opportunities for Expansion through Market Development
Although many product development opportunities likely exist for CSM the survey basically focused on the image of CSM in the perception of feed formulators If a market development approach to expanding the use of CSM as an ingredient of animal feed formulations has any chance of success the survey results suggest that the following components of such a strategy will be crucial
bull Product quality and consistency and an improved image of availability must be the major targets of promotion efforts The survey responses across all animal types unequivocally indicated that these three factors are the prime considerations in making general decisions regarding dietary proteins for animal rations Price only becomes a factor in specific decisions regarding the particular protein feed to use to fill the dietary protein requirements of feed formulations after these general concerns are addressed Creating an image of quality consistency and availability for CSM is a necessary first step to expanding use and enhancing value
bull CSM use expansion efforts must focus to some extent on reducing the direct feeding of whole cottonseed to beef and dairy cattle Reductions in direct feeding is the only chance for an increase in supply of CSM to fuel expanded use in newer markets such as catfish and poultry feeding Also because beef and dairy cattle are major users of cottonseed meal a decrease in feeding of whole cottonseed in favor of CSM would significantly expand use
bull Separate CSM market promotion messages must be developed to address the very different needs and concerns of ruminant vs non-ruminant feed formulators The survey results clearly indicate that many nutritional and non-nutritional factors are more important for nonshyruminant feed formulators than for ruminant feed formulators and vice versa
bull The nutrition-related content of CSM market promotion messages must emphasize primarily positive aspects of CSM protein quality amino acid balance and amino acid availability as well as an accurate understanding of appropriate gossypol and aflatoxin levels Many of these factors however are more important for non-ruminant rather than ruminant feed formulators which must be accounted for in designing appropriate messages for feed formulators of each animal type
bull The non-nutrition-related content of CSM market promotion messages may well be the most important and must emphasize primarily the positive aspects of price availability consistency of quality and storability The survey results attached a relatively high level of importance also to nutrient guarantees Although not scoring particularly high in the responses services available from the CSM industry may also be a helpful component of CSM use promotion messages
30
Opportunities for Expansion through Market Emciency Enhancement
Even though some gains in CSM use and market value can reasonably be expected through market expansion efforts the cost involved could easily outweigh any benefits in terms of enhanced profits to the CSM industry Perhaps the most cost-effective appropriate and useful means of enhancing the use of CSM would be a strategy aimed at improving the level and accuracy of information available regarding CSM and its use Lack of information or misinformation can easily discourage feed formulators from using CSM in their feed formulations Strategies to enhance the quantity and accuracy of appropriate information can take on many forms from media advertising to market news letters Although it is beyond the scope of this study to develop alternative information strategies the results of this study clearly indicate a number of areas in which enhanced and more accurate information is a critical need These include the following
bull The overall quality of CSM The study suggests that the negative aspects of CSM are well known Less well known are the specific positive aspects of CSM that may give it an edge in some sense over other protein feeds
bull The ideal ratio of the price of CSM to other feeds like soybean meal The study results indicate that feed formulators may not be adequately informed about what the ideal market value of CSM is relative to soybean meal given the differences in feeding value As a consequence CSM may currently be less used in relation to soybean meal than current market price ratios suggest should be the case
bull Protein-related factors for CSM use in non-ruminant feeds These factors are a major concern in the decisions of feed formulators to include or exclude CSM in feed rations
bull The relationship of aflatoxin to CSM and the rumen degradability of CSM particularly for beef and dairy cattle feed formulators These were the nutritional factors of greatest concern to ruminant feed formulators in the decision to include CSM in their feed formulations
bull CSM price availability consistency and palatability These were indicated to be the most important non-nutritional factors affecting feed formulators decisions regarding whether or not to use CSM The study indicates that information on non-nutritional factors may be more important in the decision to use CSM over alternative feeds to fill dietary protein requirements of feed rations than information on nutritional factors
bull The feeding value of CSM relative to alternative protein feeds An accurate and detailed assessment of the extent to which CSM may be superior as an alternative to other standard protein feeds would help position CSM appropriately in the market
bull The appropriate and acceptable levels of several key parameters affecting the use of CSM in animal feed rations including energy levels fat levels gossypol levels and escape values (ruminants only) Feed formulators generally lack adequate and reliable information on these and likely other parameters not included in the study which are crucial in efficient feed formulation and which have a significant impact on the choice of protein feedstuffs Although it appears that nearly all feed formulators routinely perform crude protein analyses few perform analyses for aflatoxin gossypol fat fiber and other parameters Also CSM suppliers are apparently doing an inadequate job currently of providing such information to feed formulators
31
SOME CONCLUDING COMMENTS AND RECOMMENDATIONS
This study assessed the potential problems and opportunities for expanding the use of CSM through an analysis of the perceptions of feed formulators regarding the use of CSM as an animal feed ingredient The perceptions of feed formulators regarding CSM as a protein feed largely define the boundaries within which CSM use will be able to achieve any significant growth in the future Their perceptions right or wrong are the key to understanding not only the problems facing CSM use but also the opportunities
The general conclusion of the study is an obvious one the use of CSM in feed formulations faces some major challenges in the future Chief among these include a perception among feed formulators that price availability quality and other key CSM characteristics are often obstacles precluding increased use of CSM in their feed formulations Perhaps the most important implication of the study is that a serious lack of adequate and accurate information among feed formulators regarding the characteristics parameters value and other aspects of cottonseed meal use in animal feed rations may be seriously restricting the market opportunities for cottonseed meal U nfortunately the development of alternative strategies to expand the use of CSM and enhance the efficient functioning of CSM markets through more accurate and available information on all aspects of CSM use in feed formulations is beyond this study Nevertheless a few recommendations pertinent to the development of such alternative strategies are in order
bull Before adopting any approach to expand the use of CSM it would be useful first to conduct a detailed analysis of the costs and benefits involved Market promotion efforts through advertising can be extremely costly and yield relatively little Research has also shown that there is often a tremendous lag between advertising and promotion expenditures and any associated returns It could take years of investment in such market expansion efforts before an accurate measurement of the actual return on investment could even be attempted
bull Consider developing first a detailed plan for information dissemination to the feed industry regarding all appropriate aspects of CSM use in feed rations as determined in this study An important part of this process would be a comprehensive assessment of the information needs and the information resources readily available The gap discovered in this way between needs and resources will help set the research agenda for the industry to fill the critical existing information gaps
bull Initiate a study of final user attitudes and perceptions of CSM use as a guide to future market expansion efforts This study considered only the perceptions of feed formulators regarding the use of CSM But feed formulators are often not the final users Consulting nutritionists for example often include or exclude certain feeds and feed types from their formulations as requested by feed users At least a few of the respondents to the survey conducted for this study indicated that user preferences are major factors determining whether or not CSM is included in their feed formulations Indeed markets operate as the interaction of supply and demand to determine prices The preferences of final users ultimately will be expressed in the market values of any product in any market unless sufficient obstacles exist to prevent the market from functioning properly Therefore the real decision-makers in the use CSM in the market may well include many more individuals than adequately represented by feed formulators
32
REFERENCES
US Department of Agriculture (USDAa) Feed Situation and Outlook Report Economic Research Service FDS series various issues
US Department of Agriculture (USDA b) Oil Crops Situation and Outlook Yearbook Economic Research Service OCS Series various issues
Figure 1 Quantity of Oilseed Meals Fed to Livestock 194849 - 198590 (Average)
(1000 Tons)
25000 0-1-----------------------shy
20000 I-~
15000
10000
5000
o L 1 J tJ t tmiddotmiddotmiddot 1 oj 1 to bullbull 1 L_ n __LLL I 1 bullbull I V I
1948-49 1950-54 1955-59 1960-64 1965-69 1970-74 1975-79 1980-84 1985-90
(Years)
n iflu Soybean Meal bull Cottonseed Meal Other Oilseed Meals
Source USDA
c
8 c a CD
en ~
--I _ scg ~CD 01)-- en - () mg0 s 0
JCD enOJ CD_CD en 0
sCDCD 0 OJ shyo OJ r Jlt- 0 m CJ) 0 0lt o 0shyCD OJ J
~s ~m cpCJ) r co OJco ~m a
Figure 3 Price Premium (+) or Discount (-) of Cottonseed Meal Relative to Soybean Meal 1956-1990
~~ ~
o I ~ I I
-20 f---
-40
-60
1~1~1~1~1~1~1~1~1~1~1~1~1~1~1~1~1~1~
Cottonseed meal price is adjusted to a soybean meal protein equivalent basis
~I------------------------------------------------------
l l A
I~middotmiddot--- --------
Figure 4 Animal Species for which Respondents Formulate Feeds
DAIRY CATILE
BEEFCATILE
HORSES
SHEEP
BROILERS
LAYERS
OTHER
PETS
TURKEY
SWINE
CATFISH
210
21000
0 5 1000 15 20 25
Figure 5 Respondents Formulating Feeds for the Various Animal Species
0 20 40 60 80
Figure 6 Other Animal Species for Which Respondents Formulate Feeds
DAIRY CATTLE
BEEF CATTLE
HORSES
SHEEP
BROILERS
LAYERS
OTHER
PETS
TURKEY
SWINE
CATFISH
632
Exotics
Trout
Alligators
KOI
Breeding Hens
Wildlife
Rabbits
Avian
Shrimp
Salmon
Ducks
Fish
Gamebirds
Hybrid Bass
379
~--~----~--~----~----~--~----~--~----~--~
0 10 20 30 40 50
Figure 7 Respondent Feed Formulation Activities by State
( of Respondents)
o 00 middot15 16 -30 31 middot45Cgt 46 -60 61 - 75 - 76 -90
Table 8 Respondent Experience as an Animal Nutritionist
( of Respondents) 30 r---shy
25 t-middotmiddotmiddotmiddotmiddotmiddotmiddotmiddotmiddotmiddotmiddotmiddotmiddot-middot ---_ _
20 -_ -nNItshy
15
10
5
0 1-5 6-10 11-15 16-20 21-25 26-30 31-35 36-40 41-45
(Years Of Experience)
-it sa 0 m 8 l 0 CD l g
_ cc c -s CD CObull
-0 -s- 3 Dl ~ IJ CD (fJ
C 0 l C CD l -+
raquo Sl_ lt_ -+_ CD (fJ
Figure 10 Respondent Primary Feed Formulations
by Animal Type 1990 (Percent)
30 I--------------------------------------------------------shy
25 r- middotmiddotmiddotmiddotmiddotmiddot231middotmiddotmiddotmiddot
20
15
10
5
0 Beef Dairy Swine Poultry Horses Pets Aqua- Sheep Exotics
Cattle Cattle culture amp Goats
(Animal Type)
Figure 11 Percent of CSM and S8M Used in Formulations by Feed Manufacturer Respondents 1990
( of Average Feed Ration)
Figure 12 Tons of Feed Formulated by Feed Manufacturer Respondents 1990
65
91
6 9
17
Total Formulations Formulations With CSM
II Less than 200000 Tons
II 200000 - 400000 Tons bullbullbull I bullbullbullbullbullbull ~ 3 ~ 400000 - 600000 Tons
5 rn 600 000 - 800 000 Tonsru 1
[] 800000 - 1000000 Tons9 4
I ~ 1 More Than 1000000 Tons
Formulations With S8M
Figure 13 Percent middotof Beef Cattle Respondents Formulating CSM Feeds for Specific Beef Cattle Types
( of Respondents)
25 ~I------------------------------------------------------~
-Isectig Feedlot-II 223
20
15
10
5
0
bull Other
~ middotmiddotmiddotmiddotmiddotmiddotmiddot middotmiddot _middotmiddotmiddotmiddot-=middotmiddotmiddotccmiddotcmiddotmiddot
Brood Cows Bulls Calves Feeder Heifer Stocker
(Animal Type)
Figure 14 Percent of Dairy Cattle Respondents Formulating CSM Feeds for Specific Dairy Cattle Types
( of Respondents)
120 ----------------------
100 88
80
60
40
20
0 Calves Heifers Lactating Cows Dry Cows
(Animal Type)
Figure 1-5 Percent of Poultry Respondents Formulating CSM Feeds for Specific Poultry Types
( of Respondents)
OO~I--------------------------------------------~-
50 1-laquolaquolt--laquolaquolaquo -lt - lt - lt -lt laquo lt
44
40
30
20
10
0
f-
~laquolaquolaquolaquo
~laquolaquolaquolaquolaquolaquo
Broilers Layers Turkeys Breeding Flocks
(Animal Type)
Figure 16~ Combined Responses Months of the Year When CSM IS NOT Available
( of Respondents) 16 i ---
14 12~8
12
10
87373 7
6
4
2
0 ~~ ~s ~( ~( ~0( ~0(~~~ ~~ ~t ~1 u~ ~g n0~ ad-o N0~ ~a~
~Y ~o Q~lmiddotr
(Month)
Figure 17 Combined Responses Months of the Year When CSM Needs to Be Available
( of Respondents) 12 ---------------------------
10
8
6
4
2
0
goA 9
~ui ~s ~Ot X)Ot ~Ot X)Ot~0SV~0~~erl ~iSclt ~f ~~1 ~v~ ug ~o~ o~o NO~ co~0 0lt609 ~o
(Month)
Figure 18 Beef Cattle Responses Percent of Respondents Formulating Creep Feed for Calves or Supplements for Stockers
733
832
0 20 40 60 80 100 120
( of Respondents)
Figure 19 Beef Cattle Responses Protein-Related Factors Considered When Balancing Rations
Other Protein Factors 110
Rumen
Degradability 686
Crude Protein Level 161
Amino Acid
Values 42
( of Respondents)
Figure 21 Comparison of Responses Months When CSM Needs to Be Available
( of Respondents) 94 ---------------------------shy
92
9
88
86
84
82 8
78
76
74
72
7
68
66
~ euroI - It
64 -t----------------------------------- -----------t
JAN FEB MAR APR MAY JUN JUL AUG SEP OCT NOV DEC
(Month)
bull Beef Cattle -t Dairy Cattle ltgt Poultry Catfish
Figure 20 Comparison of Responses Months When CSM Is Not Available
( of Respondents)
16 t 15
14
13
12
11
10
9
8ltl amp
7
6
5 I JAN
I
FEB I
MAR I
APR I
MAY I
JUN I
JUL I
AUG SEP I
OCT NOV I
DEC
(Month)
bull Beef Cattle -t Dairy Cattle ltgt PouHry b Catfish
Figure 22 Comparison of Responses Analyses Routinely Performed
( of Respondents)
100~-----------------------------------------------
90
80
70
60
50
40
30
20
10
o I ~
AFLATOXIN C PROTEIN FAT FIBER GOSSYPOL OTHER NONE
(Analyses)
bull Beef Cattle Dairy Cattle o Poultry Catfish-t fj
Figure 23 Comparison of Responses Analytical Values Provided by Supplier
( of Respondents)
60shy
50
4)
30
20
10
o amp ~
AFLATOXIN C PROTEIN FAT FIBER GOSSYPOL OTHER NONE
(Analyses)
bull Beef Cattle -t Dairy cattle o Poultry b Catfish
Figure 24 Share of Cottonseed Use Crush vs Feed Use
( of Respondents)
100 I
90
CRUSH 80
70
60
50
40
30
20
FEED USE 10
o 1~ 1~ 1~ 1m 1m 1~ 1~ 1~ 1~ 1~ 1~ 1~ 1~ 1~
(Year)
Source USDAb
Table 1 Percentage of Beef Cattle Feeds Formula ted Table 2 CSM Feeds Formulated for Beef Cattle CSMmiddot Calvesmiddot
middotAverage Response Rate (feedlot=51 other=41) middotResponse Rate = 39
Table 3 CSM Feeds Formulated for Beef Cattle Table 4 CSM Feeds Formulated for Beef Cattle Stockersmiddot
middotResponse Rate = 40
Response Rate =37
Table 5 CSM Feeds Formulated for Beef Cattle Table 6 CSM Feeds Formulated for Beef Cattle
middotResponse Rate =33
middotResponse Rate = 37
Table 8 Percentage of Dairy Cattle Feeds Formulated CSM
Average Response Rate =88
middotResponse Rate = 37
Table 9 CSM Feeds Formulated for Dairy Cattle Table 10 CSM Feeds Formulated for Dairy Cattle
RespooseRate 24
middotResponse Rate = 34
Table 11 CSM Feeds Formulated for Dairy Cattle Table 12 CSM Feeds Formulated for Dairy Cattle
Response Rate = 31 Response Rate = 45
Table 13 Percentage of Poultry Feeds Formulated Using CSMmiddot
bullAverage Response Rate = 79
Table 14 Percentage of Catfish Feeds Formulated Using CSMmiddot
bullAverage Response Rate =67
Table 15 CSM Feeds Formulated for Catfishmiddot )middoti middot fteq~
bullAverage Response Rate = 17
Table 16 Combined Responses Importance of Specific Factors in Choice of Dietary Protein ( of
bullAverage Response Rate =g]
Table 17 Combined Responses Other Important Factors in
bullAverage Response Rate = 22
bullAverage Response Rate =91
-Average Response Rate =90
Table 20 Combined Responses Importance of Non - Nutrition -Related Factors in Choice of CSM over Alternative Protein Feeds ( of
-Average Response Rate = 87
Table 22 Combined Responses Top S Reasons Why CSM IS NOT Selected as a Feed
Table 23 Combined Responses Top 5 Specific Characteristics That Would Have to Change for CSM to be Selected as a Feed
Table 24 Combined Responses Analysis Routinely Performed
Table 25 Combined Responses Analysis Values Provided
CSM
267 067 333 333 1400 S333
467 000 067 067 1400 4867 --shy
467 000 000 067 400 4333 --shy -- shy -- shy
250 000 000 000 1250 4000 -- shy --shy
313R 4733 62 ------ shy~ - shy ~-
4S00 62
bullAverage Response Rate = 100
bullAverage Response Rate = 87
Table 28 Beef Cattle Responses Imponance of Nutrition-Related Factors in Choice of CSM Over Alternative Protein Feeds
Average Response Rate = 91
Table 29 Beef Cattle Responses Other Nutrition - Related
Fact~~~~~~~~~~~~~~~~~~~
Response Rate =7
Table 30 Beef Cattle Responses Imponance of Non - Nutrition - Related Factors in Choice of CSM Over Alternative Protein Feeds
middotAverage Response Rate = 87
middotResponse Rate = 5
bullAverage Response Rate =14
Table 33 Beef Cattle Responses Months of the Year When CSM Needs to Be AvaiJable I ii middot middot1
bullAverage Response Rate =53
10 U
-Moy
JIIJ
All
so
0_ -
to
--I No
Moy
10 -so shy
0_ _ 0-
Table 35 Beef Cattle Responses Top 5 Reasons Why CSM Is Not Selected as a Feed
Average Response Rate =100 Response Rate = 24
Response Rate =28
Average Response Rate = 98
Response Rate = 17
middotResponse Rate =9
Table 43 Beef cattle Responses Type of Creep Feed
middotResponse Rate = 81
middotResponse Rate =26
Table 45 Beef cattle Responses Respondents Formulating Rations With CSM and Whole
middotResponse Rate = 68
Table 47 Beef cattle Responses Percentage of Whole Cottonseed Respondents Mix in Rations Containing Both CSM and Whole Cottonseedmiddot tCmiddotHiitjt~ middotmiddotmiddotmiddot1
middotResponse Rate =25
middotResponse Rate = 30
bull Response Rate = 98
Response Rate =11
Table 51 Beef Cattle Responses Escape Value Respondents Are Using for Rumen Degradabilitymiddot
1~iiii middotb~r~~fgtD zq436imiddotmiddotmiddotmiddotmiddotmiddotmiddot 004bullbullbullbullbullbullbullbullbullbull1----22--+----31-4
I~~I 23 329
middotResponse Rate = 57
Table 53 Beef Cattle Responses Methods or Sources Respondents Used to Calculate CSM
Table 52 Beef Cattle Responses Reliability of Escape Values Used
Table 54 Beef Cattle Responses Interested in Knowing Escape Values for CSM Processed
Valuemiddot
middotResponse Rate =98
)
I Mean ~nse
63 57S19 228381 Q-L_uu ~139 59468 32306 139bullII1 1 061 06
1 1 44 430 614431-------- 57t 001 001 middot-1
==~=-__~~1c9 00 _ 06 _ 001_ 38 133 323 63
Average Response Rate =100
Response Rate = 89
Table 58 Dairy Cattle Responses Importance of Nutrition - Related Factors in Choice ofCSM Over Alternative Protein Feeds (ofbmiddotNmiddotmiddotmiddotmiddotmiddotmiddot
Response Rate =88
Table 59 Dairy Cattle Responses Other Nutrition-Related Factors
Indicated br~~P211dents
Response Rate =10
Table 60 Dairy Cattle Responses Importance of Non- Nutrition - Related Factors in Choice of CSM Over Alternative
Protein Feeds ( ofResPOndents~dd
Response Rate = 88
Response Rate = 3
--
Average Response Rate = 51
Table 62 Dairy Cattle Responses Months in the Year When CSM IS NOT Available
10 u
J -- AIIIi
--~ shy
loOoIMr _ 0-
bullAverage Response Rate =69
--- AIIIi
--~ soM
0
0-_
10
Table 65 Dairy Cattle Responses Top 5 Reasons Why CSM IS NOT Selected as a Peed
Table 66 Dairy Cattle Responses Top 5 Specific Characteristics That Would Have to ro1 ____ for CSM to be Selected as a Feed
Table 67 Dairy Cattle Responses Analyses Routinely Performed fmiddotmiddotmiddotmiddot
Response Rate =96
Response Rate =56
Table 68 Dairy Cattle Responses Other Analyses
Response Rate =25
Table 70 Dairy Cattle Other Analytical Values CSM
Response Rate =4
Average Response Rate =81
Average Response Rate = 15
Table 73 Dairy Cattle Responses Respondents Formulating Feeds With Whole andor Delinted
Cottonseed bull
bullAverage Response Rate =92
middotResponse Rate = 40
Table 74 Dairy Cattle Responses Respondents Formulating Rations with Cottonseed Meal and Whole Cottonseed in the Same Rationmiddot
middotResponse Rate = 97
Table 76 Dairy Cattle Responses Percentage of Whole Cottonseed Respondents Mix in Rations
ltltJIltainin(a0th CSM and WhoeCottonseedmiddot Mean
middotResponse Rate = 42
Table 77 Dairy Cattle Responses Knowledge of Research on Feedine CSM
~~~~
Average Response Rate = 68
Response Rate =7
Average Response Rate =59
Response Rate =25
Average Response Rate =63
Response Rate = 13
middotResponse Rate = 92
Response Rate =82
Table 85 Dairy Cattle Responses Methods or Sources Used to Calculate CSM
Response Rate = 73
Table 86 Dairy Cattle Responses Respondents Interested in Knowing Escape Values for CSM Processed from Different Methodsmiddot fmiddotmiddotmiddotmiddotmiddotmiddot
Response Rate = 92
Response Rate = 34
Table 89 Dairy Cattle Responses Suggestions for CSM
Response Rate =33 Response Rate =22
-----
64 139 24815 00 36 511 5751
5951 131 438 35015 00 15 I-~~~~~
6200 15 423 51151 00 00 ~~~ -~~~ -~~~ ~~~-~~ --~~ ~ ~ ~~-~ ~
292 55125 00 00 125 45800
bullAverage Response Rate =99
Average Response Rate =85
Table 92 Poultry Responses Importance of Nutrition - Related Factors in Choice of CSM Over Alternative Protein Feeds (of
Average Response Rate =85
Table 93 Poultry Responses Other Nutrition-Related Factors Indicated
200
200
Response Rate = 5
Table 94 Poultry Responses Importance of Non - Nutrition - Related Factors in Choice of CSM Over Alternative Protein
Feeds~~~~~~~~~~5=~~~~~T7~~
00 Average Response Rate =83
Response Rate =4
Average Response Rate = 17
Table 97 Poultry Responses Months in the
J
p
April
lao
A
shy-- 0
ft
April
_
Average Response Rate = 43
=1 g L
0
Table 99 Poultry Responses Top 5 Reasons Why CSM IS NOT Selected as a Feed
Table 100 Poultry Responses Top 5 Specific Characteristics That Would Have to Change for
CSM to be Selected as a Feed Inoredient
Table 101 Poultry Responses Analyses Routinely
middotResponse Rate = 93
Table 102 Poultry Responses Other Analyses Routinely
Performed
middotResponse Rate = 27
Table 103 Poultry Responses Analytical Values Provided
middotResponse Rate =73
Table 104 Poultry Responses Knowledge of Problems
bullAverage Response Rate = 62
Average Response Rate = 14
Table 106 Poultry Responses Protein - Related Factors
Average Response Rate = 64
Table 107 Poultry Responses Other Protein - Related
Response Rate =11
Table 108 Poultry Responses Crude Protein Levels
Preferred for CSM
Response Rate = 55
Table 111 Poultry Responses Gossypol Levels Considered
Safe
Table 112 Poultry Responses Would or Do Use Table 113 Poultry Responses Relative Feeding Value of CSM Comoared to 44 SBMmiddot
middotResponse Rate = 96
bull Response Rate = 100
Table 114 Poultry Responses Knowledge of Table 115 Poultry Responses Familiarity with Other Feedino CSMmiddot
middotResponse Rate =7 bull Response Rate = 73
middotResponseRate = 31
bullAverage Response Rate = 58
Table 118 Poultry Responses Willingness to Pay
a Premium Per Unit of Protein for CSM With More
Than 41 Protein
bullResponse Rate =91
Table 119 Poultry Responses Percent of Cost of SBM Respondents Willing to Pay for CSM with
Response Rate =27
Response Rate =64
00 00 87 43 478 304 57 00 00
----shy I--~~
00 ~-~
43 522 348 59 ----shy
62~ 00 00 00 261 ----shy
652 ------shy
00 00 00 00 667 333 63 AverageResponseRate = 99
bullAverage Response Rate = 73
Table 123 Catfish Responses Importance of Nutrition - Related Factors in Choice of CSM Over Alternative Protein Feeds
Average Response Rate =83
Table 124 Catfish Responses Importance of Non- Nutrition - Related Factors in Choice of CSM Over Alternative Protein
Feeds
Average Response Rate = 90
bullAverage Response Rate = 13
Igt 20
s_
Pshy s
--s
H_
_
gt 7 bull bull bull bull bull
1 fsI plusmn -
haMr
N__
shy
bullAverage Response Rate =54
Table 128 Catfish Responses Top 5 Reasons Why CSM IS NOT Selected as a Feed
Table 129 Catfish Responses Top 5 Specific Characteristics That Would Have to Change for CSM to Be Selected as a Feed-_
Table 130 Catfish Responses Analyses Routinely Table 131 Catfish Responses Other Analyses Routinely Performed
middotResponse Rate = 25
middotResponse Rate =92
bullAverage Response Rate = 18
Table 133 Catfish Responses Knowledge of Problems Feedine CSM to CatflSh
Average Response Rate =100
Table 134 Catfish Responses Protein - Related Factors Considered i
Response Rate = 83
Table 135 Catfish Responses Crude Protein Levels Preferred for CSM
Response Rate = 100
Table 139 Catfish Responses Would or Do Use Table 140 Catfish Responses Relative Feeding
Value ofCSM Compared to 44~ Lmiddotmiddotmiddotmiddotmiddotmiddotmiddotmiddotmiddotmiddotmiddotmiddotmiddotmiddotmiddotmiddotmiddotmiddotmiddot _
Response Rate = 100
Response Rate = 100
Table 141 Catfish Responses Knowledge of Research on Table 142 Catfish Responses Sources ofInformation
Average Response Rate = 83
bullAverage Response Rate = 44
Table 143 Catfish Responses Willingness to Pay A Premium Per Unit of Protein for CSM with More Than
middotResponse Rate = 100
Table 144 Catfish Responses Percent of Cost of SBM Respondents Willing to Pay for CSM with Sufficiently Low Goscvnol and Fiber Levelsmiddot
middotResponse Rate = 83
middotResponse Rate = 25
Table 146 Comparison of Mean Responses and Analysis of Variance (ANOVA) Importance of Specific
bull Scale of 1 (extremely unimportant) to 7 (extremely important) for the mean ranking a Mean significantly larger across animal types at the 5 significance level otherwise no difference b Mean significantly lower across animal types at the 5 significance level otherwise no difference
Table 147 Comparison of Mean Responses and Analysis of Variance (ANOVA) Ranking of Other Protein
bull Scale of 1 (CSM inferior to respective feed) to 7 (CSM superior to respective feed) for the mean ranking
a Mean significantly larger across animal types at the 5 significance level otherwise no difference
b Mean significantly lower across animal types at the 5 significance level otherwise no difference
Table 148 Comparison ofMean Responses and Analysis of Variance (ANOVA) Importance of Nutritionshy
Related Factors in Choice ofCSM Over Alternativesmiddot
bull Scale of 1 (extremely unimportant) to 7 (extremely important) for the mean ranking a Mean significantly larger across animal types at the 5 significance level otherwise no difference
b Mean significantly lower across animal types at the 5 significance level otherwise no difference
Table 149 Comparison of Mean Responses and Analysis of Variance (ANOVA) Importance of Nonshy
Nutrition- Related Factors in Choice of CSM Over Alternativesmiddot
bull Scale of 1 (extremely unimportant) to 7 (extremely important) for the mean ranking
a Mean significantly larger across animal types at the 5 significance level otherwise no difference
b Mean significantly lower across animal types at the 5 significance level otherwise no difference
- = Not mentioned or ranked lower than 4th place
Table 151 Comparison of Responses Top Responses Why CSM IS NOT Selected as a Feed
- = Not mentioned or ranked lower than 5th place
Table 152 Comparison of Responses Top Characteristics that Have to Change for CSM to Be
- = Not mentioned or ranked lower than 5th place

15
(Table 91) In fact the mean rank of all but three of the protein feeds were all at least somewhat higher than was the case for the combined responses The mean rank of several of the other protein feeds as determined by the poultry respondents was much higher than for the combined responses including fish meal poultry by-product meal and soybean meal Poultry by-product meal changed from an inferior to a superior protein feed compared to CSM The protein feed judged by poultry respondents to be most superior to CSM for poultry rations was soybean meal while urea was ranked as most inferior Poultry respondents also appeared to have stronger opinions about whether or not CSM is an alternative to the other listed protein feeds than was the case for the combined responses They overwhelmingly perceived that CSM is not an alternative to many of the other protein feeds including fish meal dried skim milk dried whole milk poultry by-product meal blood meal tankage and urea A larger percentage of poultry respondents than was the case for dairy and beef cattle perceived however that CSM is a definite alternative to many other protein feeds including safflower meal sunflower meal linseed meal peanut meal canola meal feather meal distillers dried grains brewers dried grains and even soybean meal
bull The importance of nutritional and non-nutritional factors Poultry respondents ranked all but two of the listed nutrition-related factors as more important in the choice of CSM over alternative protein feeds for poultry rations than was the case for the combined responses on average (Le comparing mean responses) (Table 92) The highest percentage of poultry respondents ranked gossypol level (62 of the respondents) amino acid balance (59) aflatoxin (58) protein quality (57) and amino acid availability (57) as extremely important in the choice of CSM over alternative protein feeds Only about 5 of the respondents listed other important nutrition-related factors (Table 93) There are few differences however in the poultry responses as compared to the combined responses regarding the importance of non-nutrition-related factors (Table 94) The major difference is a much lower ranking of the importance of palatability in choosing CSM over alternative protein feeds Also a somewhat higher percentage of poultry respondents ranked price as an extremely important non-nutrition-related factor Few other non-nutrition-related factors were listed by the respondents (Table 95)
bull Seasonality of cottonseed meal availability The results for the poultry respondents regarding the months of the year when CSM is not available are highly consistent with those for the combined responses and those for the beef and dairy cattle responses Poultry respondents indicated that May through September are the months of least availability of CSM (Table 96) But likely because of the shorter production cycle for poultry than for cattle poultry respondents indicated that CSM needs to be available in almost every month (but slightly less so in August and September) for CSM to compete effectively with alternative protein feeds (Table 97) For poultry therefore the indication is that poultry feed formulators may perceive an availability problem which inhibits greater use of CSM in poultry rations to some extent
bull Reasons for the selection and non-selection of cottonseed meal Again price and availability are the number one and number two reasons respectively cited by poultry respondents for which CSM is selected as a feed ingredient (Table 98) Protein quality ranked third on their list followed closely by phosphorous content The top reason that CSM is not selected according to the poultry respondents was pricevalue (Table 99) About tied for second place were gossypol content and availability More respondents ranked availability as the second reason than for gossypol content but more respondents listed gossypol first The amino acid level was listed as a distant fourth reason for which CSM is not selected as a feed ingredient Price is again the key CSM characteristic that poultry respondents indicated must change in
16
order for CSM to be used more frequently in poultry rations (Table 100) Gossypol was clearly considered to be the second most important characteristic that must change Availability was ranked as either first or second by all respondents who listed it as a characteristic that must change
bull Source of chemical analyses for cottonseed meal The results for the chemical analyses performed by poultry respondents are similar to those of both the combined results and those of the beef and dairy cattle results The primary analysis routinely performed by the poultry respondents is crude protein (51 of 55 respondents) followed by fat (40 respondents) fiber (37 respondents) and aflatoxin (31 respondents) (Tables 101 and 102) The primary analytical values supplied to the poultry respondents also included crude protein fiber and fat (Table 103) A third of the poultry respondents indicated that their CSM supplier does not provide them with any analytical values Once again even though aflatoxin was ranked as an extremely important nutrition-related factor in the choice of CSM as a feed component only I respondent obtains an analytical value for aflatoxin from his CSM supplier and only a little over half routinely perform their own aflatoxin analyses
Poultry sample members were asked some specific questions regarding the use of CSM in poultry feed formulations in 5 general areas I) problems resulting from feeding a ration with CSM to the various poultry types 2) specific information on several key nutrition-related factors affecting the use of CSM in poultry rations 3) sources of information utilized on formulating poultry feeds 4) CSM price and value and 5) an open-ended question soliciting suggestions to improve the usefulness or value of CSM for poultry feed formulations
Problems from Feeding CSM Rations to Poultry
The majority of poultry respondents indicated no knowledge of any problems associated with feeding a ration containing CSM to poultry (Table 104) Only 14 of the respondents indicated problems with broilers less than 7 for breeding flocks and about 3 for turkeys Over a third however indicated that they had knowledge of such problems with layers The number one problem reported was yolk molting and discoloration primarily in layer rations (Table 105) A few respondents indicated problems with depressed growth associated with broiler feeds containing CSM
Information on Key Nutrition-Related Factors for Poultry Rations
The survey sample members were asked to respond to a number of specific questions related to nutritional factors that affect the use of CSM in poultry rations including protein energy fat gossypol and synthetic amino acids They were then asked to indicate their perception of the overall feeding value of a standard 41 protein CSM compared to that of a standard 44 protein soybean meal The questions were designed primarily to determine the extent of knowledge among feed formulators concerning these factors as they relate to the use of CSM and the relative feeding value of CSM
Sample members were asked to respond to two questions regarding protein in poultry feed rations They were first asked to indicate the specific protein-related factors that they consider when balancing rations for poultry They were given a list of three factors (crude protein level amino acid content and amino acid availability) They were also allowed to specify any other protein-related factors they consider when balancing poultry rations They were then asked to indicate the crude protein levels they would prefer for cottonseed meal and were given a choice of four levels (3641 (standard) 44 and 48) and allowed to suggest any other preference for crude protein level
17
Almost all poultry respondents indicated that they consider amino acid content and availability when balancing feed rations with fewer responding that they consider the crude protein level (Table 106) Other protein-related factors listed by the respondents included amino acid balance protein digestibility and energy levels (Table 107) With regard to preferred crude protein level for CSM over half of the poultry respondents indicated a preference for 48 crude protein (Table 108) About 27 of the respondents were satisfied with the standard 41 level and 20 indicated a preference for a 44 protein CSM No respondents preferred anything less than the standard 41
With respect to energy levels the sample members were asked to indicate what they considered to be the normal maximum and minimum energy levels for protein feeds for broilers layers turkeys and breeding flock As Table 109 indicates the responses varied widely with little or no indication of a mode (most frequent response) in most cases For broilers the maximum (in K Cals DE per pound) ranged from 0 to 1800 and the minimum from 850 to 1700 with a mean maximum of 1436 and a mean minimum of 1276 For layers the maximum (in K Cals DE per pound) ranged from 1000 to 1800 and the minimum from 800 to 1500 with a mean maximum of 1347 and a mean minimum of 1187 For turkeys the maximum (in K Cals DE per pound) ranged from 1100 to 1725 and the minimum from 850 to 1700 with a mean maximum of 1334 and a mean minimum of 1261 For breeding flocks the maximum (in K Cals DE per pound) ranged from 1000 to 1600 and the minimum from 750 to 1600 with a mean maximum of 1328 and a mean minimum of 1159 Given the disparity in the responses it seems clear that there is little common concept of the normal maximum and minimum energy levels for protein feeds
Sample members similarly were asked to indicate the minimum and maximum fat levels they considered critical for protein feeds Although the range of responses was still quite wide there appeared to be more uniformity in responses to this question than the one for energy (Table 110) The maximum fat levels (ether extract as fed basis) indicated by the respondents ranged from 1 to 15 or 20 for most poultry types The minimums ranged from 0 to 15 The mean minimum levels of fat for all poultry types was about 3 The mean maximum ranged from 6 to 82 depending on the poultry type
Sample members were asked to indicate the level of gossypol they considered safe for poultry rations The responses again varied widely from a low of 0 ppm up to a high of 300 ppm for all poultry types (Table III) The highest mean level of gossypol as calculated from the responses to the question were 104 ppm for broilers and 91 ppm for turkeys For layers and breeding flocks the mean levels were much lower at 57 ppm and 54 ppm respectively
The questionnaire also asked the sample members to indicate if they use or would use synthetic amino acids where economical The response was that nearly 100 of all poultry respondents indicated that they have or would use synthetic amino acids in this situation (Table 112) This suggests little real aversion on the part of feed formulators to utilize synthetic amino acids in least cost poultry formulations
To obtain some insight on the general perception of poultry formulators regarding CSM the sample members were asked to indicate the overall feeding value of a standard 41 protein CSM compared to that of a standard 44 protein soybean meal in their opinion on percentage basis They were given the choice of 5 ranges from under 70 to over 100 in 10 increments (see Table 113 for the actual ranges used) Nearly 80 of the respondents indicated that CSM has an overall feeding value of under 90 of that of soybean meal Given the five choices offered to respondents the mean feeding value was around 80
18
Sources of Information Utilized on Formulating Poultry Feeds
About two-thirds of the poultry respondents indicated that they were familiar with research on feeding CSM to broilers and layers (Table 114) Only half however indicated familiarity with such research for turkeys and only a little over a third for breeding flocks Less than 10 of the respondents listed any other research on feeding CSM to other types of poultry (Table 115) To obtain information on formulating feeds for poultry the largest number of respondents (52 of the 55 respondents) indicated that they utilize university research followed by industry publications of some type (45 respondents) university extension services (26 respondents) and government agencies (20 respondents) (Table 116) Only 17 respondents listed other sources of information including primarily personal experience and research (Table 117)
Cottonseed Meal Price and Value
To get some idea concerning the poultry respondents perceptions of the value of CSM particularly with respect to soybean meal sample members were asked 1) if they would be willing to pay a premium per unit of protein for CSM with more than a standard 41 protein and 2) if gossypol and fiber were sufficiently low on average what percent of the cost of soybean meal they would be willing to pay for CSM
With respect to the first question only about half the respondents indicated a willingness to pay a premium for a CSM with more than 41 protein despite the fact that 75 of them indicated earlier that they would prefer a CSM with a higher crude protein level (Table 118) Thus at least 25 of the respondents prefer a higher protein level CSM but would not be willing to pay a premium to get it
In response to the second question poultry respondents indicated that they would only be willing to pay an average of about 76 of the cost of soybean meal for a CSM with a sufficiently low level of gossypol and fiber (Table 119) The range around that average however was fairly large from 50 to 95 Because CSM has traded at about 91 of the value of soybean meal on the market on a protein equivalent basis and about 85 on an unadjusted basis on average in each year since 1984 either poultry respondents are currently unaware of the historical CSM to soybean meal price relationship or they are indicating that the current CSM market price relative to that of soybean meal is substantially above the levels that most find acceptable
Suggestions for Improving the Usefulness of Cottonseed Meal
Only about 27 of the poultry feed formulators that returned surveys provided suggestions that might improve the value or usefulness of CSM in poultry feed rations (Table 120) Some of the more frequent suggestions included the need for more information on the use of CSM in poultry rations increased availability of CSM and nutrient guarantees
Catfish
The perceptions of catfish feed formulator respondents concerning the use of cottonseed meal correspond closely to those of the poultry respondents likely because of the similar dietary needs of non-ruminant animals The salient differences in responses by catfish feed formulators in the 6 general question areas included on this section of the surveys include the following
bull Factors affecting choice of dietary proteins There were no differences in the responses of those indicating that they formulate feed for catfish than for poultry regarding the importance
19
of the listed factors (quality price availability consistency and other) affecting the choice of dietary protein (Table 121) A large majority of catfish respondents ranked all factors as either important or extremely important as did poultry respondents
bull Cottonseed meal as an alternative protein feed As was the case for poultry catfish respondents ranked more protein feeds as higher on the superior-to-CSM scale than was the case for the combined responses (Table 122) Catfish feeders however ranked meat and bone meal and blood meal as even more superior to CSM than did poultry respondents The protein feeds that catfish respondents ranked as roughly similar to CSM included tankage feather meal peanut meal linseed meal corn gluten meal brewers dried grains distillers dried grains sunflower meal safflower meal and canola meal Catfish respondents also appeared to have nearly as strong views about whether or not CSM is an alternative to the other listed protein feeds as did poultry respondents They perceived that CSM is not an alternative to many of the other protein feeds including blood meal dried whole milk meat and bone meal and dried skim milk Catfish respondents also perceived however that CSM is a definite alternative to many other protein feeds including safflower meal canola meal peanut meal sunflower meal linseed meal distillers dried grains brewers dried grains tankage soybean meal wheat middlings corn gluten meal urea and feather meal
bull The importance of nutritional and non-nutritional factors The responses for catfish with regard to the importance of nutrition-related and non-nutrition-related factors in choosing CSM as a component of catfish feeds were roughly similar to those for poultry (Table 123) The salient differences were that a larger percentage of catfish respondents ranked energy level fat level and fiber level as important or extremely important and a much larger percentage ranked aflatoxin as extremely important One major difference of the catfish responses regarding the importance of non-nutrition-related factors from those of poultry is that palatability is much mOre of a concern to catfish feeders (Table 124) Bin space is less important to catfish respondents and service from the CSM industry is more important to them
bull Seasonality of cottonseed meal availability The results for the catfish respondents regarding the months of the year when CSM is not available were generally consistent with those for poultry except that May and June were perceived as less problematic for obtaining CSM supplies by the catfish respondents (Table 125) Catfish formulators perceive that CSM needs to be more available in April through October than during the rest of the year to be competitive with other protein feeds (Table 126) This suggests the perception on the part of catfish feed formulators of a CSM availability problem during about the first half of any given year
bull Reasons for the selection and non-selection of cottonseed meal Pricevalue is the number one reason cited by catfish respondents for which CSM is selected as a feed ingredient followed by protein quality and palatability (Table 127) The top reason that CSM is not selected according to the catfish respondents is pricevalue followed by quality and gossypol level (Table 128) Gossypol level is the key CSM characteristic that catfish respondents indicated must change in order for CSM to be used more frequently in catfish rations (Table 129) Quality was clearly considered to be the second most important characteristic that must change followed by aflatoxin level This is the only animal species for which price was not the number one characteristic cited that would have to change and was not even listed among the top three responses The implication is that catfish feed formulators may not consider the price of cottonseed meal to be out of line with their needs and thus do not consider price to be a particular problem for the use of CSM in catfish rations A word of caution is in order
20
to avoid taking this conclusion too far because of the relatively few number of catfish feed formulators in the sample
bull Source of chemical analyses for cottonseed meal The results for the chemical analyses performed by poultry respondents are similar to those of poultry as well as those of both the combined results and the beef and dairy cattle results The primary analysis routinely performed by the catfish respondents is crude protein followed by fat fiber aflatoxin and gossypol (Tables 130 and 131) The primary analytical values supplied to the catfish respondents also included crude protein fiber and fat (Table 132) Only 2 of the II catfish respondents indicated that their CSM supplier does not provide them with any analytical values Even though gossypol was ranked as an extremely important nutrition-related factor in the choice of CSM as a feed component and the number one CSM characteristic that needs to change only 5 of the II respondents routinely perform gossypol analyses None of catfish respondents obtain analytical values for aflatoxin from their CSM supplier
As for poultry catfish sample members were asked some specific Questions regarding the use of CSM in catfish feed formulations in 5 general areas 1) problems resulting from feeding a ration with CSM to the various catfish types 2) specific information on several key nutrition-related factors affecting the use of CSM in catfish rations 3) sources of information utilized on formulating catfish feeds 4) CSM price and value and 5) an open-ended Question soliciting suggestions to improve the usefulness or value of CSM for catfish feed formulations
Problems from Feeding CSM Rations to Catfish
Absolutely no catfish respondents indicated any knowledge of any problems associated with feeding a ration containing CSM to catfish (Table 133)
Information on Key Nutrition-Related Factors for Catfish Rations
As for poultry the survey sample members were asked to respond to a number of specific Questions related to nutritional factors that affect the use of CSM in catfish rations including protein energy fat gossypol and synthetic amino acids They were then asked to indicate their perception of the overall feeding value of a standard 41 protein CSM compared to that of a standard 44 protein soybean meal Just as for poultry these Questions were designed primarily to determine the extent of knowledge among catfish feed formulators concerning these factors as they relate to the use of CSM and the relative feeding value of CSM
Sample members were asked to respond to two Questions regarding protein in catfish feed rations They were first asked to indicate the specific protein-related factors that they consider when balancing rations for catfish They were given the same list of three factors (crude protein level amino acid content and amino acid availability) to choose from that the poultry sample members were given Again they were also allowed to specify any other protein-related factors they consider when balancing catfish rations They were then asked to indicate the crude protein levels they would prefer for CSM and were given the same choice of four levels as the poultry sample members (36 41 (standard) 44 and 48) and allowed to suggest any other preference for crude protein level In contrast to poultry the largest percentage of catfish respondents indicated that they consider amino acid availability (10 of the 11 catfish respondents) rather than the content when balancing catfish rations (Table 134) The second largest percentage consider crude protein level (9 respondents) also a different result from poultry
21
With regard to the crude protein level for CSM preferred by catfish respondents about 43 indicated a preference for 48 crude protein (Table 135) About 20 of the respondents were satisfied with the standard 41 level and nearly 30 indicated a preference for a 44 protein CSM No respondents preferred anything less than the standard 41 The mean preferred crude protein level was about 42
With respect to energy levels the catfish sample members were asked to indicate what they considered to be the normal maximum and minimum energy levels for protein feeds for fingerlings grow out stock brood stock and fries Despite the low number of catfish respondents the answers to this question were widely divergent (Table 136) For fingerlings the maximum (in K Cals DE per pound) ranged from 1250 to 1800 and the minimum from 2 to 1500 with a mean maximum of 1525 and a mean minimum of 834 For grow out stock the maximum (in K Cals DE per pound) ranged from only 1500 to 1600 and the minimum from 1 to 1300 with a mean maximum of 1550 and a mean minimum of 750 For catfish brood stock the maximum (in K Cals DE per pound) ranged from 1300 to 1700 and the minimum from 1200 to 1400 with a mean maximum of 1500 and a mean minimum of 1300 For fries the maximum (in K Cals DE per pound) ranged from 1250 to 1800 and the minimum from 900 to 1500 with a mean maximum of 1525 and a mean minimum of 1200 Given the disparity in these responses it seems clear again for catfish feed formulators that there is little common concept of the normal maximum and minimum energy levels for protein feeds
Catfish sample members similarly were asked to indicate the minimum and maximum fat levels they considered critical for protein feeds As with poultry the range of responses was still quite wide but there also appeared to be more uniformity in responses to this question than the one for energy level (Table 137) The maximum fat levels (ether extract as fed basis) indicated by the respondents again ranged from 1 to 15 for most catfish types as was the case for poultry The mean minimum levels of fat for all catfish types ranged from about 3 to 5 The mean maximum ranged from 6 to 10 aCrOSS the different catfish types
Catfish sample members were also asked to indicate the level of gossypol they considered safe for catfish rations The responses again varied widely from a low of 0 ppm up to a high of 300 ppm for some catfish types (Table 138) The two highest mean safe levels of gossypol were 97 ppm for grow out stock and 83 ppm for brood stock For fingerlings and fries the safe maximum mean levels were much lower at 44 ppm and 23 ppm respectively
The questionnaire also asked the sample members to indicate if they use or would use synthetic amino acids where economical The response was that 83 (all but 2) of the catfish respondents indicated that they have or would use synthetic amino acids in this situation (Table 139) This suggests little real aversion on the part of feed formulators to utilize synthetic amino acids in least cost catfish formulations
To obtain some insight on the general perception of catfish formulators regarding CSM the sample members were asked to indicate their opinion of the overall feeding value of a standard 41 protein CSM compared to that of a standard 44 protein soybean meal expressed on a percentage basis They were given a choice of 5 ranges from under 70 of the feeding value of soybean meal to over 100 in 10 increments (see Table 140 for the actual ranges used) All but one of the catfish respondents indicated that CSM has an overall feeding value of under 90 of that of soybean meal Given the five choices offered to respondents the mean feeding value of CSM relative to that of soybean meal was around 80
22
Sources of Information UtiJized on Formulating Catfish Feeds
Only about half of the catfish respondents indicated that they were familiar with research on feeding CSM to grow out stock and only a third were familiar with research on fingerlings (Table 141) Only 2 respondents were familiar with any research on feeding CSM to brood stock and fries To obtain information on formulating feeds for catfish the largest number of respondents indicated that they utilize university research and industry publications of some type (Table 142)
Cottonseed Meal Price and Value
Catfish sample members were also asked two Questions to get some idea concerning their perception of the value of CSM particularly with respect to soybean meal 1) if they would be willing to pay a premium per unit of protein for CSM with more than a standard 41 protein and 2) if gossypol and fiber were sufficiently low on average what percent of the cost of soybean meal would they be willing to pay for CSM
With respect to the first Question 75 of the catfish respondents indicated a willingness to pay a premium for a CSM with more than 41 protein which is consistent with their earlier responses that they would prefer a CSM with a higher crude protein level (Table 143)
In response to the second Question catfish respondents indicated that they would only be willing to pay an average of about 82 of the cost of soybean meal for a CSM with a sufficiently low level of gossypol and fiber (Table 144) The range around that average was more narrow than for poultry from 70 to 100 This is more consistent with the ratio of CSM price to soybean meal price that has existed over the last 7 or 8 years on average
Suggestions for Improving the Usefulness of Cottonseed Meal
Only three catfish respondents offered suggestions for improving the usefulness or value of CSM for catfish rations The three suggestions included I) providing a more consistent product in price and Quality 2) providing a premium Quality toxin-free high protein low-fat product superior to soybean meal and 3) eliminating the CHO fraction (Table 145)
Comparisons Among Animal Species
In order to highlight the salient differences in responses with respect to the various animal species the mean responses to Questions that are common among all surveys regarding CSM use as a feed ingredient were compared and analyzed An analysis of variance (ANOY A) was also done to detect statistically significant differences in the mean responses to each Question by animal specie Comparisons are made among the mean responses to all Questions in the 6 general areas to which all sample members were asked to respond regardless of the animal specie(s) for which they formulate feeds 1) the particular factors affecting their choice of dietary proteins for formulated feeds 2) the extent to which CSM is considered to be an alternative to selected protein feeds 3) the importance of nutritional and non-nutritional factors in their decisions to use CSM rather than alternative dietary proteins in their feed formulations 4) the seasonality of CSM availability 5) the specific reasons for the selection and non-selection of CSM for use in the feeds they formulate and 6) the source of CSM chemical analyses used by the respondents Where appropriate ANOY A results are also indicated
23
Factors Affecting Choice of Dietary Proteins
As discussed earlier all members of the final sample regardless of the animal species for which they formulate feeds were asked to rank the importance of four general factors in their choice of a dietary protein for their feed formulations on a scale of I to 7 (from extremely unimportant to extremely important respectively) 1) quality 2) price 3) availability and 4) consistency Comparing the results across animal types reveals few significant differences in the importance attached to any of the four factors by the responding formulators of the various animal specie feeds (ie comparing results horizontally in Table 146) But as pointed out in an earlier section the mean rankings for quality are all higher than those for the other factors while the mean rankings of price are all lower than those for most other factors across all animal types In other words the respondents consistently ranked quality highest on the scale of importance followed in order by consistency availability and price
Cottonseed Meal As An Alternative Protein Feed
Recall that the sample members were asked to rank various selected protein feeds on a scale of 1 to 7 as inferior or superior to CSM in an overall sense for use in feed formulations A second question required respondents to indicate whether or not they considered CSM to be an alternative to each of the 20 listed protein feeds A comparison of the mean ran kings and ANOV A results across animal types indicates substantial agreement among the respondents regarding the ranking of CSM as an alternative to some animal feeds and substantial disagreement with respect to CSM as an alternative to many others (Table 147) Respondents over all animal types tended to agree that certain feeds and in particular the higher crude-protein-content feeds are clearly superior to CSM including dried skim milk meat and bone meal fish meal blood meal soybean meal dried whole milk and corn gluten feed There was a statistically different deviation in the extent to which respondents for some animal species regarded those meals as superior however For example catfish respondents ranked meat and bone meal fish meal poultry by-products blood meal soybean meal and corn gluten meal higher than did respondents for the ruminant animals The same was roughly the case for poultry Beef and dairy cattle respondents tended to rank all other protein feeds as less superior (ie more inferior) to CSM There was also substantial agreement that CSM was about the same as tankage peanut meal linseed meal and brewers and distillers dried grains but superior to some extent over the other feeds particularly those lower in crude protein including dehydrated alfalfa sunflower meal wheat middlings safflower meal canola meal feather meal and urea Beef and dairy cattle respondents agreed that CSM can be considered an alternative to nearly all the protein feeds except perhaps skim and whole dried milk Poultry and catfish respondents indicated CSM is an alternative to fewer of the other protein feeds
The Importance of Nutritional and Non-Nutritional Factors
Respondents also ranked the importance of specific nutrition-related and non-nutritionshyrelated factors in choosing cottonseed meal as a component of the feeds they formulate on a scale of extremely unimportant to extremely important (a scale of I to 7 respectively) Comparing the mean rankings by the respondents reveals that poultry and catfish feed formulators clearly consider proteinshyrelated factors and gossypol level to be more important than do beef and dairy feed formulators (Table 148) Fiber level is also of more importance to formulators of catfish feed Interestingly the importance of fiber was not ranked significantly higher by poultry feed formulators than by beef and dairy cattle feed formulators At the same time aflatoxin was clearly ranked by all respondents as the most important factor affecting the choice of CSM as a feed ingredient irrespective of the animal specie for which the ration is intended
24
For the non-nutritional factors an analysis of the mean rankings indicates few significant differences in the responses across animal species with respect to each individual factor listed (Table 149) The most notable exception is that poultry respondents ranked palatability significantly less important than did any of the other respondents for the other animal species Finally catfish respondents perceived that service by the CSM industry was more important for them than did the respondents for the other animal species
Seasonality of Cottonseed Meal Availability
The respondents across all animal species indicated that CSM is least available between about May and October likely reflecting the increasing shortages of cottonseed meal supply just prior to the cotton harvest in the fall (Figure 20) At the same time however the beef cattle dairy cattle and poultry respondents all indicated that there is less need for CSM to be available during approximately those same months in order to compete effectively with other protein feeds (Figure 21) This suggest that the seasonality of supply may not represent an important constraint to competitiveness and growth possibilities of CSM as a feed ingredient Interestingly catfish respondents suggested a largely inverse pattern of the times of the year when CSM needs to be available to compete effectively with other protein feeds as a catfish feed ingredient Possible explanations of this phenomenon include I) the protein feed needs of catfish feed formulators peak in the late spring and summer months when supply is less available 2) catfish feed formulators are located such that CSM is not easily obtainable particularly during short supply years or 3) formulators of feed for other animal species have longer experience in using CSM and have adjusted their formulation to the pattern of CSM supply availability In any case it should be remembered that there are relatively few catfish feed formulators in the sample so that their joint responses may not be truly representative of all catfish feed formulators In this case this difference in their responses may mean little
Reasons for the Selection and Non-Selection of Cottonseed Meal
Respondents across animal species were quite consistent in their ranking of the top reasons that CSM is included in feed formulations (Table 150) They overwhelmingly ranked price as the top reason followed generally by availability and protein quality Catfish respondents differed somewhat from that order ranking protein quality second and palatability as third Availability was ranked fourth by catfish respondents The top reason all respondents listed for which CSM is not included in feed formulations was also price (Table lSI) Beef and cattle respondents ranked availability as second but poultry respondents ranked gossypol second while catfish respondents ranked protein quality second A vailability ranked only as the third reason that CSM is not selected by poultry respondents and fourth by catfish respondents Gossypol ranked either third or fourth for all animal species except poultry for which gossypol appears to be a more important reason for not including CSM in poultry feed formulations The question regarding the characteristics of CSM that would have to change in order for it to be selected more frequently as a feed ingredient elicited about the same responses as those for the previous question concerning why CSM is not included in feed formulations (Table 152) The top characteristic that would have to change in the opinion of most respondents is price Catfish respondents however listed price extremely low on their list suggesting that other factors are more of a constraint to CSM use in their opinion They ranked gossypol as the number one characteristic that would have to change Availability appeared to be more of a concern to beef and dairy feed formulators than for poultry and catfish formulators
25
Source of Chemical Analyses for Cottonseed Meal
About the same percentage of respondents across animal species perform analytical tests for aflatoxin crude protein fat fiber and gossypol (Figure 22) The only noticeable differences were for aflatoxin and gossypol for which about half the percentage of dairy and beef respondents compared to catfish respondents reported that they routinely perform tests A higher percentage of poultry respondents also appear to perform tests for aflatoxin and gossypol than is the case for beef or cattle respondents Crude protein is tested for by the highest percentage of respondents for all animal species while gossypol is tested for by the smallest percentage of all respondent groups except catfish CSM suppliers are more likely to provide feed formulators with analytical values for crude protein fat and fiber than for aflatoxin or gossypol (Figure 23) A sizeable percentage of the respondents across all animal types reported that their CSM supplier provides no analytical values whatsoever
Summary ofMajor Findings
Of the reams of information normally provided by a study like this relatively little is usually new or profound And of what can be found that appears important only some is little more than interesting or particularly useful Before turning to a discussion of the implications of the study results the major findings across animal groups are briefly summarized first Sifting through the many tables figures and data sets the main findings of the study appear to be the following
bull Quality is the most important factor affecting the choice of dietary proteins by feed formulators followed by consistency and availability Price is the least important of the four factors in making general decisions regarding dietary proteins for animal diets
bull Once feed formulators have set the general parameters for use of dietary proteins in their formulations however price is the most important factor determining the choice among alternative dietary proteins to satisfy the general parameters for dietary protein use in feed formulations
bull When considering whether or not to use CSM as the dietary protein in feeds the nutritional factors of most concern to formulators of feed for non-ruminant animals (poultry and catfish) appear to be protein-related For formulators of ruminant (beef and dairy cattle) feeds aflatoxin level and rumen degradability are the most important nutritional factors
bull The most important non-nutritional factors affecting feed formulators decisions regarding whether or not to use CSM are I) price 2) availability 3) consistent quality and 4) palatability in that order
bull Non-nutritional factors are more important than nutritional factors in the choice of CSM over alternative feeds to fill the dietary protein requirements of feed formulations In general price and availability were ranked above protein quality and other nutrition-related factors as reasons why CSM is and is not chosen as a feed ingredient over alternatives Price and availability were also cited as the characteristics that most need to change in order for CSM to be selected as a feed ingredient more frequently
bull CSM is generally considered to be inferior to higher protein feedstuffs and superior to lower protein feedstuffs This generalization however does not hold for all feeds and all animal types Formulators of ruminant animal feeds ranked many of the higher protein feeds more on a par with CSM than did formulators of non-ruminant animal feeds
26
bull The seasonality of CSM availability is both a positive and a negative factor affecting the use of CSM rather than alternative protein feeds in animal feed rations That is CSM is obviously more likely to be selected as a feed ingredient during months of greater availability than during the months of lower availability In general however the survey responses indicate that CSM is normally available when feed formulators perceive that it needs to be available One word of caution It may be that a higher percentage of CSM users agreed to participate in this survey than those who are currently not using CSM Those who are current CSM users may well have already adjusted their feed purchasing patterns and operations to reflect the seasonal changes in the availability of CSM Consequently current CSM users may perceive less of an availability problem than those who are not currently using CSM In this case the responses to these questions may not be truly representative of the perception of the availability of CSM by feed formulators in general
bull There is a tremendous disparity in the perception of respondents as to the appropriate levels of several key nutrition-related factors for specific livestock rations including energy levels fat levels gossypol levels and escape values (ruminants only) for cottonseed meal For each animal specie the range of variation in the perceived acceptable levels of each of these factors was extremely wide The obvious conclusion is that feed formulators generally lack adequate and reliable information on many factors which are crucial in efficient feed formulation and which have a significant impact on the choice of CSM as a feed ingredient
PROBLEMS AND OPPORTUNITIES FOR EXPANDING COTTONSEED MEAL USE
CSM is somewhat unique among vegetable protein meals in that it is the product of a byshyproduct The volume of the by-product cottonseed available for crushing and the potential supply of CSM depend more on the dynamics of cotton supply and demand than on forces specific to CSM markets This mean that market signals from feed formulators and livestock feeders regarding desired values and characteristics of protein meals likely have little impact on the potential CSM market supply
Since the mid-1970s the share of the annual production of cottonseed fed directly to ruminant livestock has increased steadily from about 5 in 1974 to nearly 40 in 1990 (Figure 24) The consequence has been a marked decline both in the share of the available supply of cottonseed that is crushed and in the ratio of actual to potential cottonseed meal output An increase in the demand for CSM therefore will either bid up the market price of CSM with no additional volume actually used or increase the cottonseed crush to feed use ratio (or some combination thereof) There will be little or no effect on the total amount of cottonseed available
The intent of efforts to expand the market for any commodity is to effect an increase in sales at a higher price For a commodity with a relatively fixed supply the major result of an expansion in demand is solely an increase in price because supply cannot increase to allow an increase in use For a commodity with an unlimited supply successful market expansion efforts simply increase use to the extent of the promotion with no increase in price For a commodity with a supply somewhere in between those two extremes successful market expansion will increase both the price and quantity used Although the situation for cottonseed meal is closer to the fixed supply end of the spectrum market expansion efforts can increase the use of cottonseed meal through an increase in the crush-toshy
27
feed cottonseed use ratio This ratio will increase as the profitability of crushing vs alternative uses of the seed increase
The results of this survey however indicate both some problems and possible opportunities for expanding cottonseed meal use After briefly summarizing the major obstacles as identified in the study the major opportunities for expanding use of cottonseed meal will be discussed
Problems for Expanding Cottonseed Meal Use
The major problems for expanding CSM use are generally well known and verified by the survey results The major problems that would hinder efforts to expand cottonseed meal use identified in the study included primarily the following
bull Price and availability of CSM are the major factors affecting the selection or non-selection of CSM as an ingredient of feed formulations regardless of animal specie These nonshynutritional factors were judged to be more important than nutritional factors in selecting CSM as a feed ingredient Unfortunately neither the price nor the availability of CSM can be controlled or altered substantially or directly by market expansion efforts Some efforts to improve availability may be possible as discussed in the next section
bull CSM is perceived to be inferior in an overall sense to a number of key protein feeds CSM was judged by the survey respondents to be clearly superior in aggregate to only 5 of 20 potential alternate protein feeds Such an image could work against efforts to expand CSM use
bull Gossypol level is one of the top reasons that CSM is not used more frequently particularly in non-ruminant feed rations The level of gossypol is a unique characteristic of CSM that obviously cannot be changed through market expansion activities
bull Several other specific characteristics of CSM would likely need to change for CSM to be selected more frequently as a feed ingredient including amino acid balance energy level aflatoxin level and protein quality As with gossypol changes in these characteristics are out of the realm of market expansion programs
bull Feed formulators generally lack adequate and reliable information on many factors which are crucial in efficient feed formulation and which likely have a significant impact on the choice of protein feedstuffs The use of CSM in livestock feed rations is likely restricted by the wide disparity in the perception of feed formulators regarding the appropriate levels of several key nutrition-related factors for specific livestock rations including energy levels fat levels gossypol levels and escape values (ruminants only) for cottonseed meal
bull Over 75 of dairy cattle feed formulators and nearly half of beef cattle feed formulators utilize whole fuzzy cottonseed to some extent in some of the feed rations they formulate Relatively few reported using utilizing both CSM and whole cottonseed in the same ration A main attraction of the use of whole fuzzy cottonseed as opposed to cottonseed meal is the fiber content Indeed the use of whole delinted cottonseed in cattle feed rations is much lower
28
Opportunities for Expanding Use of Cottonseed Meal
There are essentially only two basic tools to expand the market for any commodity l market development and 2) enhancing the efficiency of the marketing system Market development involves a wide range of activities including primarily new product development and product differentiation In new product development the effort is to develop new products or characteristics of products that appeal to different segments of consumers An example might be research leading to the elimination of gossypol in cottonseed meal which could further open up the non-ruminant feed industry to cottonseed meal
Product differentiation on the other hand encompasses those activities designed to create a user preference for or loyalty to a commodity Product differentiation occurs in two major forms 1) advertising and 2) variation in design and quality of product The primary purpose of advertising is to create user preference for a commodity and convince users of the superiority of a product over competing products Actual physical differences in the product are not necessary to successfully differentiate it from competing products It is sufficient only that users believe that some superiority exists Advertising often intends to create an image of superior quality because such images are harder to imitate or successfully counter than physically unique features Successful differentiation of a product means that users become less sensitive to price changes more willing to pay a higher price for the same quantity because they prefer the product and are loyal to it in the face of price increases In other words users are willing to pay more for the same amount because advertising if successful creates a preference for the product over competing products
Variations in quality and design are usually used along with advertising to differentiate the product of one seller from that of another Such variations are often necessary to help create the superior images desired andor attract new sets of consumers
Often barriers exist in a marketing system that hinder the efficient functioning of the market and restrict the flow of commodities from sellers to users Enhancing the efficiency of the marketing system through eliminating such barriers can lead to an expansion in the use of a commodity One of the primary requirements of an efficiently functioning market is that sellers and users possess adequate and accurate information regarding the product its characteristics availability sources uses and value among other things Inadequate or inaccurate information regarding a particular product and other market characteristics can divert demand to alternative products with which users may be more familiar regardless of whether or not those products are better in some sense
The concept and importance of enhancing market efficiency in this regard can be illustrated by comparing the flow of information about a product and market conditions with a radio broadcasting system The efficiency of such a system depends on how accurately the microphone and other equipment record sound how accurately and rapidly that sound is transmitted to a radio receiver and how accurately the receiver brings sound to the listener A breakdown anywhere along the line in that system will simply mean that the message of the broadcast does not get from the radio station to the listener Also if the message gets through but static interferes with the transmission the listener might only receive part of the message or a garbled message The listeners impressions and actions consequently might be quite different than if he had received the message intended In quite the same manner the flow of a commodity from producers to users is affected by how rapidly and accurately market information is evaluated and how accurately and rapidly this information is transmitted to and among producers and users Any breakdown or static in the system would result in a smaller and more obstructed flow of the commodity to users than if the market operated more efficiently
29
The survey results suggests possible opportunities for expanding CSM use through market development and enhancing market efficiency Market development opportunities may be limited because of the nature of the CSM supply situation Nevertheless expansion of CSM use is possible through a reduction in direct feeding of cottonseed so that opportunities for expanding use through market expansion efforts should not be discounted Efforts to enhance the adequacy and accuracy of information regarding the use of CSM as a feed ingredient however may well be the most effective means of promoting an expansion of use or enhancement of the value of CSM
Opportunities for Expansion through Market Development
Although many product development opportunities likely exist for CSM the survey basically focused on the image of CSM in the perception of feed formulators If a market development approach to expanding the use of CSM as an ingredient of animal feed formulations has any chance of success the survey results suggest that the following components of such a strategy will be crucial
bull Product quality and consistency and an improved image of availability must be the major targets of promotion efforts The survey responses across all animal types unequivocally indicated that these three factors are the prime considerations in making general decisions regarding dietary proteins for animal rations Price only becomes a factor in specific decisions regarding the particular protein feed to use to fill the dietary protein requirements of feed formulations after these general concerns are addressed Creating an image of quality consistency and availability for CSM is a necessary first step to expanding use and enhancing value
bull CSM use expansion efforts must focus to some extent on reducing the direct feeding of whole cottonseed to beef and dairy cattle Reductions in direct feeding is the only chance for an increase in supply of CSM to fuel expanded use in newer markets such as catfish and poultry feeding Also because beef and dairy cattle are major users of cottonseed meal a decrease in feeding of whole cottonseed in favor of CSM would significantly expand use
bull Separate CSM market promotion messages must be developed to address the very different needs and concerns of ruminant vs non-ruminant feed formulators The survey results clearly indicate that many nutritional and non-nutritional factors are more important for nonshyruminant feed formulators than for ruminant feed formulators and vice versa
bull The nutrition-related content of CSM market promotion messages must emphasize primarily positive aspects of CSM protein quality amino acid balance and amino acid availability as well as an accurate understanding of appropriate gossypol and aflatoxin levels Many of these factors however are more important for non-ruminant rather than ruminant feed formulators which must be accounted for in designing appropriate messages for feed formulators of each animal type
bull The non-nutrition-related content of CSM market promotion messages may well be the most important and must emphasize primarily the positive aspects of price availability consistency of quality and storability The survey results attached a relatively high level of importance also to nutrient guarantees Although not scoring particularly high in the responses services available from the CSM industry may also be a helpful component of CSM use promotion messages
30
Opportunities for Expansion through Market Emciency Enhancement
Even though some gains in CSM use and market value can reasonably be expected through market expansion efforts the cost involved could easily outweigh any benefits in terms of enhanced profits to the CSM industry Perhaps the most cost-effective appropriate and useful means of enhancing the use of CSM would be a strategy aimed at improving the level and accuracy of information available regarding CSM and its use Lack of information or misinformation can easily discourage feed formulators from using CSM in their feed formulations Strategies to enhance the quantity and accuracy of appropriate information can take on many forms from media advertising to market news letters Although it is beyond the scope of this study to develop alternative information strategies the results of this study clearly indicate a number of areas in which enhanced and more accurate information is a critical need These include the following
bull The overall quality of CSM The study suggests that the negative aspects of CSM are well known Less well known are the specific positive aspects of CSM that may give it an edge in some sense over other protein feeds
bull The ideal ratio of the price of CSM to other feeds like soybean meal The study results indicate that feed formulators may not be adequately informed about what the ideal market value of CSM is relative to soybean meal given the differences in feeding value As a consequence CSM may currently be less used in relation to soybean meal than current market price ratios suggest should be the case
bull Protein-related factors for CSM use in non-ruminant feeds These factors are a major concern in the decisions of feed formulators to include or exclude CSM in feed rations
bull The relationship of aflatoxin to CSM and the rumen degradability of CSM particularly for beef and dairy cattle feed formulators These were the nutritional factors of greatest concern to ruminant feed formulators in the decision to include CSM in their feed formulations
bull CSM price availability consistency and palatability These were indicated to be the most important non-nutritional factors affecting feed formulators decisions regarding whether or not to use CSM The study indicates that information on non-nutritional factors may be more important in the decision to use CSM over alternative feeds to fill dietary protein requirements of feed rations than information on nutritional factors
bull The feeding value of CSM relative to alternative protein feeds An accurate and detailed assessment of the extent to which CSM may be superior as an alternative to other standard protein feeds would help position CSM appropriately in the market
bull The appropriate and acceptable levels of several key parameters affecting the use of CSM in animal feed rations including energy levels fat levels gossypol levels and escape values (ruminants only) Feed formulators generally lack adequate and reliable information on these and likely other parameters not included in the study which are crucial in efficient feed formulation and which have a significant impact on the choice of protein feedstuffs Although it appears that nearly all feed formulators routinely perform crude protein analyses few perform analyses for aflatoxin gossypol fat fiber and other parameters Also CSM suppliers are apparently doing an inadequate job currently of providing such information to feed formulators
31
SOME CONCLUDING COMMENTS AND RECOMMENDATIONS
This study assessed the potential problems and opportunities for expanding the use of CSM through an analysis of the perceptions of feed formulators regarding the use of CSM as an animal feed ingredient The perceptions of feed formulators regarding CSM as a protein feed largely define the boundaries within which CSM use will be able to achieve any significant growth in the future Their perceptions right or wrong are the key to understanding not only the problems facing CSM use but also the opportunities
The general conclusion of the study is an obvious one the use of CSM in feed formulations faces some major challenges in the future Chief among these include a perception among feed formulators that price availability quality and other key CSM characteristics are often obstacles precluding increased use of CSM in their feed formulations Perhaps the most important implication of the study is that a serious lack of adequate and accurate information among feed formulators regarding the characteristics parameters value and other aspects of cottonseed meal use in animal feed rations may be seriously restricting the market opportunities for cottonseed meal U nfortunately the development of alternative strategies to expand the use of CSM and enhance the efficient functioning of CSM markets through more accurate and available information on all aspects of CSM use in feed formulations is beyond this study Nevertheless a few recommendations pertinent to the development of such alternative strategies are in order
bull Before adopting any approach to expand the use of CSM it would be useful first to conduct a detailed analysis of the costs and benefits involved Market promotion efforts through advertising can be extremely costly and yield relatively little Research has also shown that there is often a tremendous lag between advertising and promotion expenditures and any associated returns It could take years of investment in such market expansion efforts before an accurate measurement of the actual return on investment could even be attempted
bull Consider developing first a detailed plan for information dissemination to the feed industry regarding all appropriate aspects of CSM use in feed rations as determined in this study An important part of this process would be a comprehensive assessment of the information needs and the information resources readily available The gap discovered in this way between needs and resources will help set the research agenda for the industry to fill the critical existing information gaps
bull Initiate a study of final user attitudes and perceptions of CSM use as a guide to future market expansion efforts This study considered only the perceptions of feed formulators regarding the use of CSM But feed formulators are often not the final users Consulting nutritionists for example often include or exclude certain feeds and feed types from their formulations as requested by feed users At least a few of the respondents to the survey conducted for this study indicated that user preferences are major factors determining whether or not CSM is included in their feed formulations Indeed markets operate as the interaction of supply and demand to determine prices The preferences of final users ultimately will be expressed in the market values of any product in any market unless sufficient obstacles exist to prevent the market from functioning properly Therefore the real decision-makers in the use CSM in the market may well include many more individuals than adequately represented by feed formulators
32
REFERENCES
US Department of Agriculture (USDAa) Feed Situation and Outlook Report Economic Research Service FDS series various issues
US Department of Agriculture (USDA b) Oil Crops Situation and Outlook Yearbook Economic Research Service OCS Series various issues
Figure 1 Quantity of Oilseed Meals Fed to Livestock 194849 - 198590 (Average)
(1000 Tons)
25000 0-1-----------------------shy
20000 I-~
15000
10000
5000
o L 1 J tJ t tmiddotmiddotmiddot 1 oj 1 to bullbull 1 L_ n __LLL I 1 bullbull I V I
1948-49 1950-54 1955-59 1960-64 1965-69 1970-74 1975-79 1980-84 1985-90
(Years)
n iflu Soybean Meal bull Cottonseed Meal Other Oilseed Meals
Source USDA
c
8 c a CD
en ~
--I _ scg ~CD 01)-- en - () mg0 s 0
JCD enOJ CD_CD en 0
sCDCD 0 OJ shyo OJ r Jlt- 0 m CJ) 0 0lt o 0shyCD OJ J
~s ~m cpCJ) r co OJco ~m a
Figure 3 Price Premium (+) or Discount (-) of Cottonseed Meal Relative to Soybean Meal 1956-1990
~~ ~
o I ~ I I
-20 f---
-40
-60
1~1~1~1~1~1~1~1~1~1~1~1~1~1~1~1~1~1~
Cottonseed meal price is adjusted to a soybean meal protein equivalent basis
~I------------------------------------------------------
l l A
I~middotmiddot--- --------
Figure 4 Animal Species for which Respondents Formulate Feeds
DAIRY CATILE
BEEFCATILE
HORSES
SHEEP
BROILERS
LAYERS
OTHER
PETS
TURKEY
SWINE
CATFISH
210
21000
0 5 1000 15 20 25
Figure 5 Respondents Formulating Feeds for the Various Animal Species
0 20 40 60 80
Figure 6 Other Animal Species for Which Respondents Formulate Feeds
DAIRY CATTLE
BEEF CATTLE
HORSES
SHEEP
BROILERS
LAYERS
OTHER
PETS
TURKEY
SWINE
CATFISH
632
Exotics
Trout
Alligators
KOI
Breeding Hens
Wildlife
Rabbits
Avian
Shrimp
Salmon
Ducks
Fish
Gamebirds
Hybrid Bass
379
~--~----~--~----~----~--~----~--~----~--~
0 10 20 30 40 50
Figure 7 Respondent Feed Formulation Activities by State
( of Respondents)
o 00 middot15 16 -30 31 middot45Cgt 46 -60 61 - 75 - 76 -90
Table 8 Respondent Experience as an Animal Nutritionist
( of Respondents) 30 r---shy
25 t-middotmiddotmiddotmiddotmiddotmiddotmiddotmiddotmiddotmiddotmiddotmiddotmiddot-middot ---_ _
20 -_ -nNItshy
15
10
5
0 1-5 6-10 11-15 16-20 21-25 26-30 31-35 36-40 41-45
(Years Of Experience)
-it sa 0 m 8 l 0 CD l g
_ cc c -s CD CObull
-0 -s- 3 Dl ~ IJ CD (fJ
C 0 l C CD l -+
raquo Sl_ lt_ -+_ CD (fJ
Figure 10 Respondent Primary Feed Formulations
by Animal Type 1990 (Percent)
30 I--------------------------------------------------------shy
25 r- middotmiddotmiddotmiddotmiddotmiddot231middotmiddotmiddotmiddot
20
15
10
5
0 Beef Dairy Swine Poultry Horses Pets Aqua- Sheep Exotics
Cattle Cattle culture amp Goats
(Animal Type)
Figure 11 Percent of CSM and S8M Used in Formulations by Feed Manufacturer Respondents 1990
( of Average Feed Ration)
Figure 12 Tons of Feed Formulated by Feed Manufacturer Respondents 1990
65
91
6 9
17
Total Formulations Formulations With CSM
II Less than 200000 Tons
II 200000 - 400000 Tons bullbullbull I bullbullbullbullbullbull ~ 3 ~ 400000 - 600000 Tons
5 rn 600 000 - 800 000 Tonsru 1
[] 800000 - 1000000 Tons9 4
I ~ 1 More Than 1000000 Tons
Formulations With S8M
Figure 13 Percent middotof Beef Cattle Respondents Formulating CSM Feeds for Specific Beef Cattle Types
( of Respondents)
25 ~I------------------------------------------------------~
-Isectig Feedlot-II 223
20
15
10
5
0
bull Other
~ middotmiddotmiddotmiddotmiddotmiddotmiddot middotmiddot _middotmiddotmiddotmiddot-=middotmiddotmiddotccmiddotcmiddotmiddot
Brood Cows Bulls Calves Feeder Heifer Stocker
(Animal Type)
Figure 14 Percent of Dairy Cattle Respondents Formulating CSM Feeds for Specific Dairy Cattle Types
( of Respondents)
120 ----------------------
100 88
80
60
40
20
0 Calves Heifers Lactating Cows Dry Cows
(Animal Type)
Figure 1-5 Percent of Poultry Respondents Formulating CSM Feeds for Specific Poultry Types
( of Respondents)
OO~I--------------------------------------------~-
50 1-laquolaquolt--laquolaquolaquo -lt - lt - lt -lt laquo lt
44
40
30
20
10
0
f-
~laquolaquolaquolaquo
~laquolaquolaquolaquolaquolaquo
Broilers Layers Turkeys Breeding Flocks
(Animal Type)
Figure 16~ Combined Responses Months of the Year When CSM IS NOT Available
( of Respondents) 16 i ---
14 12~8
12
10
87373 7
6
4
2
0 ~~ ~s ~( ~( ~0( ~0(~~~ ~~ ~t ~1 u~ ~g n0~ ad-o N0~ ~a~
~Y ~o Q~lmiddotr
(Month)
Figure 17 Combined Responses Months of the Year When CSM Needs to Be Available
( of Respondents) 12 ---------------------------
10
8
6
4
2
0
goA 9
~ui ~s ~Ot X)Ot ~Ot X)Ot~0SV~0~~erl ~iSclt ~f ~~1 ~v~ ug ~o~ o~o NO~ co~0 0lt609 ~o
(Month)
Figure 18 Beef Cattle Responses Percent of Respondents Formulating Creep Feed for Calves or Supplements for Stockers
733
832
0 20 40 60 80 100 120
( of Respondents)
Figure 19 Beef Cattle Responses Protein-Related Factors Considered When Balancing Rations
Other Protein Factors 110
Rumen
Degradability 686
Crude Protein Level 161
Amino Acid
Values 42
( of Respondents)
Figure 21 Comparison of Responses Months When CSM Needs to Be Available
( of Respondents) 94 ---------------------------shy
92
9
88
86
84
82 8
78
76
74
72
7
68
66
~ euroI - It
64 -t----------------------------------- -----------t
JAN FEB MAR APR MAY JUN JUL AUG SEP OCT NOV DEC
(Month)
bull Beef Cattle -t Dairy Cattle ltgt Poultry Catfish
Figure 20 Comparison of Responses Months When CSM Is Not Available
( of Respondents)
16 t 15
14
13
12
11
10
9
8ltl amp
7
6
5 I JAN
I
FEB I
MAR I
APR I
MAY I
JUN I
JUL I
AUG SEP I
OCT NOV I
DEC
(Month)
bull Beef Cattle -t Dairy Cattle ltgt PouHry b Catfish
Figure 22 Comparison of Responses Analyses Routinely Performed
( of Respondents)
100~-----------------------------------------------
90
80
70
60
50
40
30
20
10
o I ~
AFLATOXIN C PROTEIN FAT FIBER GOSSYPOL OTHER NONE
(Analyses)
bull Beef Cattle Dairy Cattle o Poultry Catfish-t fj
Figure 23 Comparison of Responses Analytical Values Provided by Supplier
( of Respondents)
60shy
50
4)
30
20
10
o amp ~
AFLATOXIN C PROTEIN FAT FIBER GOSSYPOL OTHER NONE
(Analyses)
bull Beef Cattle -t Dairy cattle o Poultry b Catfish
Figure 24 Share of Cottonseed Use Crush vs Feed Use
( of Respondents)
100 I
90
CRUSH 80
70
60
50
40
30
20
FEED USE 10
o 1~ 1~ 1~ 1m 1m 1~ 1~ 1~ 1~ 1~ 1~ 1~ 1~ 1~
(Year)
Source USDAb
Table 1 Percentage of Beef Cattle Feeds Formula ted Table 2 CSM Feeds Formulated for Beef Cattle CSMmiddot Calvesmiddot
middotAverage Response Rate (feedlot=51 other=41) middotResponse Rate = 39
Table 3 CSM Feeds Formulated for Beef Cattle Table 4 CSM Feeds Formulated for Beef Cattle Stockersmiddot
middotResponse Rate = 40
Response Rate =37
Table 5 CSM Feeds Formulated for Beef Cattle Table 6 CSM Feeds Formulated for Beef Cattle
middotResponse Rate =33
middotResponse Rate = 37
Table 8 Percentage of Dairy Cattle Feeds Formulated CSM
Average Response Rate =88
middotResponse Rate = 37
Table 9 CSM Feeds Formulated for Dairy Cattle Table 10 CSM Feeds Formulated for Dairy Cattle
RespooseRate 24
middotResponse Rate = 34
Table 11 CSM Feeds Formulated for Dairy Cattle Table 12 CSM Feeds Formulated for Dairy Cattle
Response Rate = 31 Response Rate = 45
Table 13 Percentage of Poultry Feeds Formulated Using CSMmiddot
bullAverage Response Rate = 79
Table 14 Percentage of Catfish Feeds Formulated Using CSMmiddot
bullAverage Response Rate =67
Table 15 CSM Feeds Formulated for Catfishmiddot )middoti middot fteq~
bullAverage Response Rate = 17
Table 16 Combined Responses Importance of Specific Factors in Choice of Dietary Protein ( of
bullAverage Response Rate =g]
Table 17 Combined Responses Other Important Factors in
bullAverage Response Rate = 22
bullAverage Response Rate =91
-Average Response Rate =90
Table 20 Combined Responses Importance of Non - Nutrition -Related Factors in Choice of CSM over Alternative Protein Feeds ( of
-Average Response Rate = 87
Table 22 Combined Responses Top S Reasons Why CSM IS NOT Selected as a Feed
Table 23 Combined Responses Top 5 Specific Characteristics That Would Have to Change for CSM to be Selected as a Feed
Table 24 Combined Responses Analysis Routinely Performed
Table 25 Combined Responses Analysis Values Provided
CSM
267 067 333 333 1400 S333
467 000 067 067 1400 4867 --shy
467 000 000 067 400 4333 --shy -- shy -- shy
250 000 000 000 1250 4000 -- shy --shy
313R 4733 62 ------ shy~ - shy ~-
4S00 62
bullAverage Response Rate = 100
bullAverage Response Rate = 87
Table 28 Beef Cattle Responses Imponance of Nutrition-Related Factors in Choice of CSM Over Alternative Protein Feeds
Average Response Rate = 91
Table 29 Beef Cattle Responses Other Nutrition - Related
Fact~~~~~~~~~~~~~~~~~~~
Response Rate =7
Table 30 Beef Cattle Responses Imponance of Non - Nutrition - Related Factors in Choice of CSM Over Alternative Protein Feeds
middotAverage Response Rate = 87
middotResponse Rate = 5
bullAverage Response Rate =14
Table 33 Beef Cattle Responses Months of the Year When CSM Needs to Be AvaiJable I ii middot middot1
bullAverage Response Rate =53
10 U
-Moy
JIIJ
All
so
0_ -
to
--I No
Moy
10 -so shy
0_ _ 0-
Table 35 Beef Cattle Responses Top 5 Reasons Why CSM Is Not Selected as a Feed
Average Response Rate =100 Response Rate = 24
Response Rate =28
Average Response Rate = 98
Response Rate = 17
middotResponse Rate =9
Table 43 Beef cattle Responses Type of Creep Feed
middotResponse Rate = 81
middotResponse Rate =26
Table 45 Beef cattle Responses Respondents Formulating Rations With CSM and Whole
middotResponse Rate = 68
Table 47 Beef cattle Responses Percentage of Whole Cottonseed Respondents Mix in Rations Containing Both CSM and Whole Cottonseedmiddot tCmiddotHiitjt~ middotmiddotmiddotmiddot1
middotResponse Rate =25
middotResponse Rate = 30
bull Response Rate = 98
Response Rate =11
Table 51 Beef Cattle Responses Escape Value Respondents Are Using for Rumen Degradabilitymiddot
1~iiii middotb~r~~fgtD zq436imiddotmiddotmiddotmiddotmiddotmiddotmiddot 004bullbullbullbullbullbullbullbullbullbull1----22--+----31-4
I~~I 23 329
middotResponse Rate = 57
Table 53 Beef Cattle Responses Methods or Sources Respondents Used to Calculate CSM
Table 52 Beef Cattle Responses Reliability of Escape Values Used
Table 54 Beef Cattle Responses Interested in Knowing Escape Values for CSM Processed
Valuemiddot
middotResponse Rate =98
)
I Mean ~nse
63 57S19 228381 Q-L_uu ~139 59468 32306 139bullII1 1 061 06
1 1 44 430 614431-------- 57t 001 001 middot-1
==~=-__~~1c9 00 _ 06 _ 001_ 38 133 323 63
Average Response Rate =100
Response Rate = 89
Table 58 Dairy Cattle Responses Importance of Nutrition - Related Factors in Choice ofCSM Over Alternative Protein Feeds (ofbmiddotNmiddotmiddotmiddotmiddotmiddotmiddot
Response Rate =88
Table 59 Dairy Cattle Responses Other Nutrition-Related Factors
Indicated br~~P211dents
Response Rate =10
Table 60 Dairy Cattle Responses Importance of Non- Nutrition - Related Factors in Choice of CSM Over Alternative
Protein Feeds ( ofResPOndents~dd
Response Rate = 88
Response Rate = 3
--
Average Response Rate = 51
Table 62 Dairy Cattle Responses Months in the Year When CSM IS NOT Available
10 u
J -- AIIIi
--~ shy
loOoIMr _ 0-
bullAverage Response Rate =69
--- AIIIi
--~ soM
0
0-_
10
Table 65 Dairy Cattle Responses Top 5 Reasons Why CSM IS NOT Selected as a Peed
Table 66 Dairy Cattle Responses Top 5 Specific Characteristics That Would Have to ro1 ____ for CSM to be Selected as a Feed
Table 67 Dairy Cattle Responses Analyses Routinely Performed fmiddotmiddotmiddotmiddot
Response Rate =96
Response Rate =56
Table 68 Dairy Cattle Responses Other Analyses
Response Rate =25
Table 70 Dairy Cattle Other Analytical Values CSM
Response Rate =4
Average Response Rate =81
Average Response Rate = 15
Table 73 Dairy Cattle Responses Respondents Formulating Feeds With Whole andor Delinted
Cottonseed bull
bullAverage Response Rate =92
middotResponse Rate = 40
Table 74 Dairy Cattle Responses Respondents Formulating Rations with Cottonseed Meal and Whole Cottonseed in the Same Rationmiddot
middotResponse Rate = 97
Table 76 Dairy Cattle Responses Percentage of Whole Cottonseed Respondents Mix in Rations
ltltJIltainin(a0th CSM and WhoeCottonseedmiddot Mean
middotResponse Rate = 42
Table 77 Dairy Cattle Responses Knowledge of Research on Feedine CSM
~~~~
Average Response Rate = 68
Response Rate =7
Average Response Rate =59
Response Rate =25
Average Response Rate =63
Response Rate = 13
middotResponse Rate = 92
Response Rate =82
Table 85 Dairy Cattle Responses Methods or Sources Used to Calculate CSM
Response Rate = 73
Table 86 Dairy Cattle Responses Respondents Interested in Knowing Escape Values for CSM Processed from Different Methodsmiddot fmiddotmiddotmiddotmiddotmiddotmiddot
Response Rate = 92
Response Rate = 34
Table 89 Dairy Cattle Responses Suggestions for CSM
Response Rate =33 Response Rate =22
-----
64 139 24815 00 36 511 5751
5951 131 438 35015 00 15 I-~~~~~
6200 15 423 51151 00 00 ~~~ -~~~ -~~~ ~~~-~~ --~~ ~ ~ ~~-~ ~
292 55125 00 00 125 45800
bullAverage Response Rate =99
Average Response Rate =85
Table 92 Poultry Responses Importance of Nutrition - Related Factors in Choice of CSM Over Alternative Protein Feeds (of
Average Response Rate =85
Table 93 Poultry Responses Other Nutrition-Related Factors Indicated
200
200
Response Rate = 5
Table 94 Poultry Responses Importance of Non - Nutrition - Related Factors in Choice of CSM Over Alternative Protein
Feeds~~~~~~~~~~5=~~~~~T7~~
00 Average Response Rate =83
Response Rate =4
Average Response Rate = 17
Table 97 Poultry Responses Months in the
J
p
April
lao
A
shy-- 0
ft
April
_
Average Response Rate = 43
=1 g L
0
Table 99 Poultry Responses Top 5 Reasons Why CSM IS NOT Selected as a Feed
Table 100 Poultry Responses Top 5 Specific Characteristics That Would Have to Change for
CSM to be Selected as a Feed Inoredient
Table 101 Poultry Responses Analyses Routinely
middotResponse Rate = 93
Table 102 Poultry Responses Other Analyses Routinely
Performed
middotResponse Rate = 27
Table 103 Poultry Responses Analytical Values Provided
middotResponse Rate =73
Table 104 Poultry Responses Knowledge of Problems
bullAverage Response Rate = 62
Average Response Rate = 14
Table 106 Poultry Responses Protein - Related Factors
Average Response Rate = 64
Table 107 Poultry Responses Other Protein - Related
Response Rate =11
Table 108 Poultry Responses Crude Protein Levels
Preferred for CSM
Response Rate = 55
Table 111 Poultry Responses Gossypol Levels Considered
Safe
Table 112 Poultry Responses Would or Do Use Table 113 Poultry Responses Relative Feeding Value of CSM Comoared to 44 SBMmiddot
middotResponse Rate = 96
bull Response Rate = 100
Table 114 Poultry Responses Knowledge of Table 115 Poultry Responses Familiarity with Other Feedino CSMmiddot
middotResponse Rate =7 bull Response Rate = 73
middotResponseRate = 31
bullAverage Response Rate = 58
Table 118 Poultry Responses Willingness to Pay
a Premium Per Unit of Protein for CSM With More
Than 41 Protein
bullResponse Rate =91
Table 119 Poultry Responses Percent of Cost of SBM Respondents Willing to Pay for CSM with
Response Rate =27
Response Rate =64
00 00 87 43 478 304 57 00 00
----shy I--~~
00 ~-~
43 522 348 59 ----shy
62~ 00 00 00 261 ----shy
652 ------shy
00 00 00 00 667 333 63 AverageResponseRate = 99
bullAverage Response Rate = 73
Table 123 Catfish Responses Importance of Nutrition - Related Factors in Choice of CSM Over Alternative Protein Feeds
Average Response Rate =83
Table 124 Catfish Responses Importance of Non- Nutrition - Related Factors in Choice of CSM Over Alternative Protein
Feeds
Average Response Rate = 90
bullAverage Response Rate = 13
Igt 20
s_
Pshy s
--s
H_
_
gt 7 bull bull bull bull bull
1 fsI plusmn -
haMr
N__
shy
bullAverage Response Rate =54
Table 128 Catfish Responses Top 5 Reasons Why CSM IS NOT Selected as a Feed
Table 129 Catfish Responses Top 5 Specific Characteristics That Would Have to Change for CSM to Be Selected as a Feed-_
Table 130 Catfish Responses Analyses Routinely Table 131 Catfish Responses Other Analyses Routinely Performed
middotResponse Rate = 25
middotResponse Rate =92
bullAverage Response Rate = 18
Table 133 Catfish Responses Knowledge of Problems Feedine CSM to CatflSh
Average Response Rate =100
Table 134 Catfish Responses Protein - Related Factors Considered i
Response Rate = 83
Table 135 Catfish Responses Crude Protein Levels Preferred for CSM
Response Rate = 100
Table 139 Catfish Responses Would or Do Use Table 140 Catfish Responses Relative Feeding
Value ofCSM Compared to 44~ Lmiddotmiddotmiddotmiddotmiddotmiddotmiddotmiddotmiddotmiddotmiddotmiddotmiddotmiddotmiddotmiddotmiddotmiddotmiddot _
Response Rate = 100
Response Rate = 100
Table 141 Catfish Responses Knowledge of Research on Table 142 Catfish Responses Sources ofInformation
Average Response Rate = 83
bullAverage Response Rate = 44
Table 143 Catfish Responses Willingness to Pay A Premium Per Unit of Protein for CSM with More Than
middotResponse Rate = 100
Table 144 Catfish Responses Percent of Cost of SBM Respondents Willing to Pay for CSM with Sufficiently Low Goscvnol and Fiber Levelsmiddot
middotResponse Rate = 83
middotResponse Rate = 25
Table 146 Comparison of Mean Responses and Analysis of Variance (ANOVA) Importance of Specific
bull Scale of 1 (extremely unimportant) to 7 (extremely important) for the mean ranking a Mean significantly larger across animal types at the 5 significance level otherwise no difference b Mean significantly lower across animal types at the 5 significance level otherwise no difference
Table 147 Comparison of Mean Responses and Analysis of Variance (ANOVA) Ranking of Other Protein
bull Scale of 1 (CSM inferior to respective feed) to 7 (CSM superior to respective feed) for the mean ranking
a Mean significantly larger across animal types at the 5 significance level otherwise no difference
b Mean significantly lower across animal types at the 5 significance level otherwise no difference
Table 148 Comparison ofMean Responses and Analysis of Variance (ANOVA) Importance of Nutritionshy
Related Factors in Choice ofCSM Over Alternativesmiddot
bull Scale of 1 (extremely unimportant) to 7 (extremely important) for the mean ranking a Mean significantly larger across animal types at the 5 significance level otherwise no difference
b Mean significantly lower across animal types at the 5 significance level otherwise no difference
Table 149 Comparison of Mean Responses and Analysis of Variance (ANOVA) Importance of Nonshy
Nutrition- Related Factors in Choice of CSM Over Alternativesmiddot
bull Scale of 1 (extremely unimportant) to 7 (extremely important) for the mean ranking
a Mean significantly larger across animal types at the 5 significance level otherwise no difference
b Mean significantly lower across animal types at the 5 significance level otherwise no difference
- = Not mentioned or ranked lower than 4th place
Table 151 Comparison of Responses Top Responses Why CSM IS NOT Selected as a Feed
- = Not mentioned or ranked lower than 5th place
Table 152 Comparison of Responses Top Characteristics that Have to Change for CSM to Be
- = Not mentioned or ranked lower than 5th place

17
Almost all poultry respondents indicated that they consider amino acid content and availability when balancing feed rations with fewer responding that they consider the crude protein level (Table 106) Other protein-related factors listed by the respondents included amino acid balance protein digestibility and energy levels (Table 107) With regard to preferred crude protein level for CSM over half of the poultry respondents indicated a preference for 48 crude protein (Table 108) About 27 of the respondents were satisfied with the standard 41 level and 20 indicated a preference for a 44 protein CSM No respondents preferred anything less than the standard 41
With respect to energy levels the sample members were asked to indicate what they considered to be the normal maximum and minimum energy levels for protein feeds for broilers layers turkeys and breeding flock As Table 109 indicates the responses varied widely with little or no indication of a mode (most frequent response) in most cases For broilers the maximum (in K Cals DE per pound) ranged from 0 to 1800 and the minimum from 850 to 1700 with a mean maximum of 1436 and a mean minimum of 1276 For layers the maximum (in K Cals DE per pound) ranged from 1000 to 1800 and the minimum from 800 to 1500 with a mean maximum of 1347 and a mean minimum of 1187 For turkeys the maximum (in K Cals DE per pound) ranged from 1100 to 1725 and the minimum from 850 to 1700 with a mean maximum of 1334 and a mean minimum of 1261 For breeding flocks the maximum (in K Cals DE per pound) ranged from 1000 to 1600 and the minimum from 750 to 1600 with a mean maximum of 1328 and a mean minimum of 1159 Given the disparity in the responses it seems clear that there is little common concept of the normal maximum and minimum energy levels for protein feeds
Sample members similarly were asked to indicate the minimum and maximum fat levels they considered critical for protein feeds Although the range of responses was still quite wide there appeared to be more uniformity in responses to this question than the one for energy (Table 110) The maximum fat levels (ether extract as fed basis) indicated by the respondents ranged from 1 to 15 or 20 for most poultry types The minimums ranged from 0 to 15 The mean minimum levels of fat for all poultry types was about 3 The mean maximum ranged from 6 to 82 depending on the poultry type
Sample members were asked to indicate the level of gossypol they considered safe for poultry rations The responses again varied widely from a low of 0 ppm up to a high of 300 ppm for all poultry types (Table III) The highest mean level of gossypol as calculated from the responses to the question were 104 ppm for broilers and 91 ppm for turkeys For layers and breeding flocks the mean levels were much lower at 57 ppm and 54 ppm respectively
The questionnaire also asked the sample members to indicate if they use or would use synthetic amino acids where economical The response was that nearly 100 of all poultry respondents indicated that they have or would use synthetic amino acids in this situation (Table 112) This suggests little real aversion on the part of feed formulators to utilize synthetic amino acids in least cost poultry formulations
To obtain some insight on the general perception of poultry formulators regarding CSM the sample members were asked to indicate the overall feeding value of a standard 41 protein CSM compared to that of a standard 44 protein soybean meal in their opinion on percentage basis They were given the choice of 5 ranges from under 70 to over 100 in 10 increments (see Table 113 for the actual ranges used) Nearly 80 of the respondents indicated that CSM has an overall feeding value of under 90 of that of soybean meal Given the five choices offered to respondents the mean feeding value was around 80
18
Sources of Information Utilized on Formulating Poultry Feeds
About two-thirds of the poultry respondents indicated that they were familiar with research on feeding CSM to broilers and layers (Table 114) Only half however indicated familiarity with such research for turkeys and only a little over a third for breeding flocks Less than 10 of the respondents listed any other research on feeding CSM to other types of poultry (Table 115) To obtain information on formulating feeds for poultry the largest number of respondents (52 of the 55 respondents) indicated that they utilize university research followed by industry publications of some type (45 respondents) university extension services (26 respondents) and government agencies (20 respondents) (Table 116) Only 17 respondents listed other sources of information including primarily personal experience and research (Table 117)
Cottonseed Meal Price and Value
To get some idea concerning the poultry respondents perceptions of the value of CSM particularly with respect to soybean meal sample members were asked 1) if they would be willing to pay a premium per unit of protein for CSM with more than a standard 41 protein and 2) if gossypol and fiber were sufficiently low on average what percent of the cost of soybean meal they would be willing to pay for CSM
With respect to the first question only about half the respondents indicated a willingness to pay a premium for a CSM with more than 41 protein despite the fact that 75 of them indicated earlier that they would prefer a CSM with a higher crude protein level (Table 118) Thus at least 25 of the respondents prefer a higher protein level CSM but would not be willing to pay a premium to get it
In response to the second question poultry respondents indicated that they would only be willing to pay an average of about 76 of the cost of soybean meal for a CSM with a sufficiently low level of gossypol and fiber (Table 119) The range around that average however was fairly large from 50 to 95 Because CSM has traded at about 91 of the value of soybean meal on the market on a protein equivalent basis and about 85 on an unadjusted basis on average in each year since 1984 either poultry respondents are currently unaware of the historical CSM to soybean meal price relationship or they are indicating that the current CSM market price relative to that of soybean meal is substantially above the levels that most find acceptable
Suggestions for Improving the Usefulness of Cottonseed Meal
Only about 27 of the poultry feed formulators that returned surveys provided suggestions that might improve the value or usefulness of CSM in poultry feed rations (Table 120) Some of the more frequent suggestions included the need for more information on the use of CSM in poultry rations increased availability of CSM and nutrient guarantees
Catfish
The perceptions of catfish feed formulator respondents concerning the use of cottonseed meal correspond closely to those of the poultry respondents likely because of the similar dietary needs of non-ruminant animals The salient differences in responses by catfish feed formulators in the 6 general question areas included on this section of the surveys include the following
bull Factors affecting choice of dietary proteins There were no differences in the responses of those indicating that they formulate feed for catfish than for poultry regarding the importance
19
of the listed factors (quality price availability consistency and other) affecting the choice of dietary protein (Table 121) A large majority of catfish respondents ranked all factors as either important or extremely important as did poultry respondents
bull Cottonseed meal as an alternative protein feed As was the case for poultry catfish respondents ranked more protein feeds as higher on the superior-to-CSM scale than was the case for the combined responses (Table 122) Catfish feeders however ranked meat and bone meal and blood meal as even more superior to CSM than did poultry respondents The protein feeds that catfish respondents ranked as roughly similar to CSM included tankage feather meal peanut meal linseed meal corn gluten meal brewers dried grains distillers dried grains sunflower meal safflower meal and canola meal Catfish respondents also appeared to have nearly as strong views about whether or not CSM is an alternative to the other listed protein feeds as did poultry respondents They perceived that CSM is not an alternative to many of the other protein feeds including blood meal dried whole milk meat and bone meal and dried skim milk Catfish respondents also perceived however that CSM is a definite alternative to many other protein feeds including safflower meal canola meal peanut meal sunflower meal linseed meal distillers dried grains brewers dried grains tankage soybean meal wheat middlings corn gluten meal urea and feather meal
bull The importance of nutritional and non-nutritional factors The responses for catfish with regard to the importance of nutrition-related and non-nutrition-related factors in choosing CSM as a component of catfish feeds were roughly similar to those for poultry (Table 123) The salient differences were that a larger percentage of catfish respondents ranked energy level fat level and fiber level as important or extremely important and a much larger percentage ranked aflatoxin as extremely important One major difference of the catfish responses regarding the importance of non-nutrition-related factors from those of poultry is that palatability is much mOre of a concern to catfish feeders (Table 124) Bin space is less important to catfish respondents and service from the CSM industry is more important to them
bull Seasonality of cottonseed meal availability The results for the catfish respondents regarding the months of the year when CSM is not available were generally consistent with those for poultry except that May and June were perceived as less problematic for obtaining CSM supplies by the catfish respondents (Table 125) Catfish formulators perceive that CSM needs to be more available in April through October than during the rest of the year to be competitive with other protein feeds (Table 126) This suggests the perception on the part of catfish feed formulators of a CSM availability problem during about the first half of any given year
bull Reasons for the selection and non-selection of cottonseed meal Pricevalue is the number one reason cited by catfish respondents for which CSM is selected as a feed ingredient followed by protein quality and palatability (Table 127) The top reason that CSM is not selected according to the catfish respondents is pricevalue followed by quality and gossypol level (Table 128) Gossypol level is the key CSM characteristic that catfish respondents indicated must change in order for CSM to be used more frequently in catfish rations (Table 129) Quality was clearly considered to be the second most important characteristic that must change followed by aflatoxin level This is the only animal species for which price was not the number one characteristic cited that would have to change and was not even listed among the top three responses The implication is that catfish feed formulators may not consider the price of cottonseed meal to be out of line with their needs and thus do not consider price to be a particular problem for the use of CSM in catfish rations A word of caution is in order
20
to avoid taking this conclusion too far because of the relatively few number of catfish feed formulators in the sample
bull Source of chemical analyses for cottonseed meal The results for the chemical analyses performed by poultry respondents are similar to those of poultry as well as those of both the combined results and the beef and dairy cattle results The primary analysis routinely performed by the catfish respondents is crude protein followed by fat fiber aflatoxin and gossypol (Tables 130 and 131) The primary analytical values supplied to the catfish respondents also included crude protein fiber and fat (Table 132) Only 2 of the II catfish respondents indicated that their CSM supplier does not provide them with any analytical values Even though gossypol was ranked as an extremely important nutrition-related factor in the choice of CSM as a feed component and the number one CSM characteristic that needs to change only 5 of the II respondents routinely perform gossypol analyses None of catfish respondents obtain analytical values for aflatoxin from their CSM supplier
As for poultry catfish sample members were asked some specific Questions regarding the use of CSM in catfish feed formulations in 5 general areas 1) problems resulting from feeding a ration with CSM to the various catfish types 2) specific information on several key nutrition-related factors affecting the use of CSM in catfish rations 3) sources of information utilized on formulating catfish feeds 4) CSM price and value and 5) an open-ended Question soliciting suggestions to improve the usefulness or value of CSM for catfish feed formulations
Problems from Feeding CSM Rations to Catfish
Absolutely no catfish respondents indicated any knowledge of any problems associated with feeding a ration containing CSM to catfish (Table 133)
Information on Key Nutrition-Related Factors for Catfish Rations
As for poultry the survey sample members were asked to respond to a number of specific Questions related to nutritional factors that affect the use of CSM in catfish rations including protein energy fat gossypol and synthetic amino acids They were then asked to indicate their perception of the overall feeding value of a standard 41 protein CSM compared to that of a standard 44 protein soybean meal Just as for poultry these Questions were designed primarily to determine the extent of knowledge among catfish feed formulators concerning these factors as they relate to the use of CSM and the relative feeding value of CSM
Sample members were asked to respond to two Questions regarding protein in catfish feed rations They were first asked to indicate the specific protein-related factors that they consider when balancing rations for catfish They were given the same list of three factors (crude protein level amino acid content and amino acid availability) to choose from that the poultry sample members were given Again they were also allowed to specify any other protein-related factors they consider when balancing catfish rations They were then asked to indicate the crude protein levels they would prefer for CSM and were given the same choice of four levels as the poultry sample members (36 41 (standard) 44 and 48) and allowed to suggest any other preference for crude protein level In contrast to poultry the largest percentage of catfish respondents indicated that they consider amino acid availability (10 of the 11 catfish respondents) rather than the content when balancing catfish rations (Table 134) The second largest percentage consider crude protein level (9 respondents) also a different result from poultry
21
With regard to the crude protein level for CSM preferred by catfish respondents about 43 indicated a preference for 48 crude protein (Table 135) About 20 of the respondents were satisfied with the standard 41 level and nearly 30 indicated a preference for a 44 protein CSM No respondents preferred anything less than the standard 41 The mean preferred crude protein level was about 42
With respect to energy levels the catfish sample members were asked to indicate what they considered to be the normal maximum and minimum energy levels for protein feeds for fingerlings grow out stock brood stock and fries Despite the low number of catfish respondents the answers to this question were widely divergent (Table 136) For fingerlings the maximum (in K Cals DE per pound) ranged from 1250 to 1800 and the minimum from 2 to 1500 with a mean maximum of 1525 and a mean minimum of 834 For grow out stock the maximum (in K Cals DE per pound) ranged from only 1500 to 1600 and the minimum from 1 to 1300 with a mean maximum of 1550 and a mean minimum of 750 For catfish brood stock the maximum (in K Cals DE per pound) ranged from 1300 to 1700 and the minimum from 1200 to 1400 with a mean maximum of 1500 and a mean minimum of 1300 For fries the maximum (in K Cals DE per pound) ranged from 1250 to 1800 and the minimum from 900 to 1500 with a mean maximum of 1525 and a mean minimum of 1200 Given the disparity in these responses it seems clear again for catfish feed formulators that there is little common concept of the normal maximum and minimum energy levels for protein feeds
Catfish sample members similarly were asked to indicate the minimum and maximum fat levels they considered critical for protein feeds As with poultry the range of responses was still quite wide but there also appeared to be more uniformity in responses to this question than the one for energy level (Table 137) The maximum fat levels (ether extract as fed basis) indicated by the respondents again ranged from 1 to 15 for most catfish types as was the case for poultry The mean minimum levels of fat for all catfish types ranged from about 3 to 5 The mean maximum ranged from 6 to 10 aCrOSS the different catfish types
Catfish sample members were also asked to indicate the level of gossypol they considered safe for catfish rations The responses again varied widely from a low of 0 ppm up to a high of 300 ppm for some catfish types (Table 138) The two highest mean safe levels of gossypol were 97 ppm for grow out stock and 83 ppm for brood stock For fingerlings and fries the safe maximum mean levels were much lower at 44 ppm and 23 ppm respectively
The questionnaire also asked the sample members to indicate if they use or would use synthetic amino acids where economical The response was that 83 (all but 2) of the catfish respondents indicated that they have or would use synthetic amino acids in this situation (Table 139) This suggests little real aversion on the part of feed formulators to utilize synthetic amino acids in least cost catfish formulations
To obtain some insight on the general perception of catfish formulators regarding CSM the sample members were asked to indicate their opinion of the overall feeding value of a standard 41 protein CSM compared to that of a standard 44 protein soybean meal expressed on a percentage basis They were given a choice of 5 ranges from under 70 of the feeding value of soybean meal to over 100 in 10 increments (see Table 140 for the actual ranges used) All but one of the catfish respondents indicated that CSM has an overall feeding value of under 90 of that of soybean meal Given the five choices offered to respondents the mean feeding value of CSM relative to that of soybean meal was around 80
22
Sources of Information UtiJized on Formulating Catfish Feeds
Only about half of the catfish respondents indicated that they were familiar with research on feeding CSM to grow out stock and only a third were familiar with research on fingerlings (Table 141) Only 2 respondents were familiar with any research on feeding CSM to brood stock and fries To obtain information on formulating feeds for catfish the largest number of respondents indicated that they utilize university research and industry publications of some type (Table 142)
Cottonseed Meal Price and Value
Catfish sample members were also asked two Questions to get some idea concerning their perception of the value of CSM particularly with respect to soybean meal 1) if they would be willing to pay a premium per unit of protein for CSM with more than a standard 41 protein and 2) if gossypol and fiber were sufficiently low on average what percent of the cost of soybean meal would they be willing to pay for CSM
With respect to the first Question 75 of the catfish respondents indicated a willingness to pay a premium for a CSM with more than 41 protein which is consistent with their earlier responses that they would prefer a CSM with a higher crude protein level (Table 143)
In response to the second Question catfish respondents indicated that they would only be willing to pay an average of about 82 of the cost of soybean meal for a CSM with a sufficiently low level of gossypol and fiber (Table 144) The range around that average was more narrow than for poultry from 70 to 100 This is more consistent with the ratio of CSM price to soybean meal price that has existed over the last 7 or 8 years on average
Suggestions for Improving the Usefulness of Cottonseed Meal
Only three catfish respondents offered suggestions for improving the usefulness or value of CSM for catfish rations The three suggestions included I) providing a more consistent product in price and Quality 2) providing a premium Quality toxin-free high protein low-fat product superior to soybean meal and 3) eliminating the CHO fraction (Table 145)
Comparisons Among Animal Species
In order to highlight the salient differences in responses with respect to the various animal species the mean responses to Questions that are common among all surveys regarding CSM use as a feed ingredient were compared and analyzed An analysis of variance (ANOY A) was also done to detect statistically significant differences in the mean responses to each Question by animal specie Comparisons are made among the mean responses to all Questions in the 6 general areas to which all sample members were asked to respond regardless of the animal specie(s) for which they formulate feeds 1) the particular factors affecting their choice of dietary proteins for formulated feeds 2) the extent to which CSM is considered to be an alternative to selected protein feeds 3) the importance of nutritional and non-nutritional factors in their decisions to use CSM rather than alternative dietary proteins in their feed formulations 4) the seasonality of CSM availability 5) the specific reasons for the selection and non-selection of CSM for use in the feeds they formulate and 6) the source of CSM chemical analyses used by the respondents Where appropriate ANOY A results are also indicated
23
Factors Affecting Choice of Dietary Proteins
As discussed earlier all members of the final sample regardless of the animal species for which they formulate feeds were asked to rank the importance of four general factors in their choice of a dietary protein for their feed formulations on a scale of I to 7 (from extremely unimportant to extremely important respectively) 1) quality 2) price 3) availability and 4) consistency Comparing the results across animal types reveals few significant differences in the importance attached to any of the four factors by the responding formulators of the various animal specie feeds (ie comparing results horizontally in Table 146) But as pointed out in an earlier section the mean rankings for quality are all higher than those for the other factors while the mean rankings of price are all lower than those for most other factors across all animal types In other words the respondents consistently ranked quality highest on the scale of importance followed in order by consistency availability and price
Cottonseed Meal As An Alternative Protein Feed
Recall that the sample members were asked to rank various selected protein feeds on a scale of 1 to 7 as inferior or superior to CSM in an overall sense for use in feed formulations A second question required respondents to indicate whether or not they considered CSM to be an alternative to each of the 20 listed protein feeds A comparison of the mean ran kings and ANOV A results across animal types indicates substantial agreement among the respondents regarding the ranking of CSM as an alternative to some animal feeds and substantial disagreement with respect to CSM as an alternative to many others (Table 147) Respondents over all animal types tended to agree that certain feeds and in particular the higher crude-protein-content feeds are clearly superior to CSM including dried skim milk meat and bone meal fish meal blood meal soybean meal dried whole milk and corn gluten feed There was a statistically different deviation in the extent to which respondents for some animal species regarded those meals as superior however For example catfish respondents ranked meat and bone meal fish meal poultry by-products blood meal soybean meal and corn gluten meal higher than did respondents for the ruminant animals The same was roughly the case for poultry Beef and dairy cattle respondents tended to rank all other protein feeds as less superior (ie more inferior) to CSM There was also substantial agreement that CSM was about the same as tankage peanut meal linseed meal and brewers and distillers dried grains but superior to some extent over the other feeds particularly those lower in crude protein including dehydrated alfalfa sunflower meal wheat middlings safflower meal canola meal feather meal and urea Beef and dairy cattle respondents agreed that CSM can be considered an alternative to nearly all the protein feeds except perhaps skim and whole dried milk Poultry and catfish respondents indicated CSM is an alternative to fewer of the other protein feeds
The Importance of Nutritional and Non-Nutritional Factors
Respondents also ranked the importance of specific nutrition-related and non-nutritionshyrelated factors in choosing cottonseed meal as a component of the feeds they formulate on a scale of extremely unimportant to extremely important (a scale of I to 7 respectively) Comparing the mean rankings by the respondents reveals that poultry and catfish feed formulators clearly consider proteinshyrelated factors and gossypol level to be more important than do beef and dairy feed formulators (Table 148) Fiber level is also of more importance to formulators of catfish feed Interestingly the importance of fiber was not ranked significantly higher by poultry feed formulators than by beef and dairy cattle feed formulators At the same time aflatoxin was clearly ranked by all respondents as the most important factor affecting the choice of CSM as a feed ingredient irrespective of the animal specie for which the ration is intended
24
For the non-nutritional factors an analysis of the mean rankings indicates few significant differences in the responses across animal species with respect to each individual factor listed (Table 149) The most notable exception is that poultry respondents ranked palatability significantly less important than did any of the other respondents for the other animal species Finally catfish respondents perceived that service by the CSM industry was more important for them than did the respondents for the other animal species
Seasonality of Cottonseed Meal Availability
The respondents across all animal species indicated that CSM is least available between about May and October likely reflecting the increasing shortages of cottonseed meal supply just prior to the cotton harvest in the fall (Figure 20) At the same time however the beef cattle dairy cattle and poultry respondents all indicated that there is less need for CSM to be available during approximately those same months in order to compete effectively with other protein feeds (Figure 21) This suggest that the seasonality of supply may not represent an important constraint to competitiveness and growth possibilities of CSM as a feed ingredient Interestingly catfish respondents suggested a largely inverse pattern of the times of the year when CSM needs to be available to compete effectively with other protein feeds as a catfish feed ingredient Possible explanations of this phenomenon include I) the protein feed needs of catfish feed formulators peak in the late spring and summer months when supply is less available 2) catfish feed formulators are located such that CSM is not easily obtainable particularly during short supply years or 3) formulators of feed for other animal species have longer experience in using CSM and have adjusted their formulation to the pattern of CSM supply availability In any case it should be remembered that there are relatively few catfish feed formulators in the sample so that their joint responses may not be truly representative of all catfish feed formulators In this case this difference in their responses may mean little
Reasons for the Selection and Non-Selection of Cottonseed Meal
Respondents across animal species were quite consistent in their ranking of the top reasons that CSM is included in feed formulations (Table 150) They overwhelmingly ranked price as the top reason followed generally by availability and protein quality Catfish respondents differed somewhat from that order ranking protein quality second and palatability as third Availability was ranked fourth by catfish respondents The top reason all respondents listed for which CSM is not included in feed formulations was also price (Table lSI) Beef and cattle respondents ranked availability as second but poultry respondents ranked gossypol second while catfish respondents ranked protein quality second A vailability ranked only as the third reason that CSM is not selected by poultry respondents and fourth by catfish respondents Gossypol ranked either third or fourth for all animal species except poultry for which gossypol appears to be a more important reason for not including CSM in poultry feed formulations The question regarding the characteristics of CSM that would have to change in order for it to be selected more frequently as a feed ingredient elicited about the same responses as those for the previous question concerning why CSM is not included in feed formulations (Table 152) The top characteristic that would have to change in the opinion of most respondents is price Catfish respondents however listed price extremely low on their list suggesting that other factors are more of a constraint to CSM use in their opinion They ranked gossypol as the number one characteristic that would have to change Availability appeared to be more of a concern to beef and dairy feed formulators than for poultry and catfish formulators
25
Source of Chemical Analyses for Cottonseed Meal
About the same percentage of respondents across animal species perform analytical tests for aflatoxin crude protein fat fiber and gossypol (Figure 22) The only noticeable differences were for aflatoxin and gossypol for which about half the percentage of dairy and beef respondents compared to catfish respondents reported that they routinely perform tests A higher percentage of poultry respondents also appear to perform tests for aflatoxin and gossypol than is the case for beef or cattle respondents Crude protein is tested for by the highest percentage of respondents for all animal species while gossypol is tested for by the smallest percentage of all respondent groups except catfish CSM suppliers are more likely to provide feed formulators with analytical values for crude protein fat and fiber than for aflatoxin or gossypol (Figure 23) A sizeable percentage of the respondents across all animal types reported that their CSM supplier provides no analytical values whatsoever
Summary ofMajor Findings
Of the reams of information normally provided by a study like this relatively little is usually new or profound And of what can be found that appears important only some is little more than interesting or particularly useful Before turning to a discussion of the implications of the study results the major findings across animal groups are briefly summarized first Sifting through the many tables figures and data sets the main findings of the study appear to be the following
bull Quality is the most important factor affecting the choice of dietary proteins by feed formulators followed by consistency and availability Price is the least important of the four factors in making general decisions regarding dietary proteins for animal diets
bull Once feed formulators have set the general parameters for use of dietary proteins in their formulations however price is the most important factor determining the choice among alternative dietary proteins to satisfy the general parameters for dietary protein use in feed formulations
bull When considering whether or not to use CSM as the dietary protein in feeds the nutritional factors of most concern to formulators of feed for non-ruminant animals (poultry and catfish) appear to be protein-related For formulators of ruminant (beef and dairy cattle) feeds aflatoxin level and rumen degradability are the most important nutritional factors
bull The most important non-nutritional factors affecting feed formulators decisions regarding whether or not to use CSM are I) price 2) availability 3) consistent quality and 4) palatability in that order
bull Non-nutritional factors are more important than nutritional factors in the choice of CSM over alternative feeds to fill the dietary protein requirements of feed formulations In general price and availability were ranked above protein quality and other nutrition-related factors as reasons why CSM is and is not chosen as a feed ingredient over alternatives Price and availability were also cited as the characteristics that most need to change in order for CSM to be selected as a feed ingredient more frequently
bull CSM is generally considered to be inferior to higher protein feedstuffs and superior to lower protein feedstuffs This generalization however does not hold for all feeds and all animal types Formulators of ruminant animal feeds ranked many of the higher protein feeds more on a par with CSM than did formulators of non-ruminant animal feeds
26
bull The seasonality of CSM availability is both a positive and a negative factor affecting the use of CSM rather than alternative protein feeds in animal feed rations That is CSM is obviously more likely to be selected as a feed ingredient during months of greater availability than during the months of lower availability In general however the survey responses indicate that CSM is normally available when feed formulators perceive that it needs to be available One word of caution It may be that a higher percentage of CSM users agreed to participate in this survey than those who are currently not using CSM Those who are current CSM users may well have already adjusted their feed purchasing patterns and operations to reflect the seasonal changes in the availability of CSM Consequently current CSM users may perceive less of an availability problem than those who are not currently using CSM In this case the responses to these questions may not be truly representative of the perception of the availability of CSM by feed formulators in general
bull There is a tremendous disparity in the perception of respondents as to the appropriate levels of several key nutrition-related factors for specific livestock rations including energy levels fat levels gossypol levels and escape values (ruminants only) for cottonseed meal For each animal specie the range of variation in the perceived acceptable levels of each of these factors was extremely wide The obvious conclusion is that feed formulators generally lack adequate and reliable information on many factors which are crucial in efficient feed formulation and which have a significant impact on the choice of CSM as a feed ingredient
PROBLEMS AND OPPORTUNITIES FOR EXPANDING COTTONSEED MEAL USE
CSM is somewhat unique among vegetable protein meals in that it is the product of a byshyproduct The volume of the by-product cottonseed available for crushing and the potential supply of CSM depend more on the dynamics of cotton supply and demand than on forces specific to CSM markets This mean that market signals from feed formulators and livestock feeders regarding desired values and characteristics of protein meals likely have little impact on the potential CSM market supply
Since the mid-1970s the share of the annual production of cottonseed fed directly to ruminant livestock has increased steadily from about 5 in 1974 to nearly 40 in 1990 (Figure 24) The consequence has been a marked decline both in the share of the available supply of cottonseed that is crushed and in the ratio of actual to potential cottonseed meal output An increase in the demand for CSM therefore will either bid up the market price of CSM with no additional volume actually used or increase the cottonseed crush to feed use ratio (or some combination thereof) There will be little or no effect on the total amount of cottonseed available
The intent of efforts to expand the market for any commodity is to effect an increase in sales at a higher price For a commodity with a relatively fixed supply the major result of an expansion in demand is solely an increase in price because supply cannot increase to allow an increase in use For a commodity with an unlimited supply successful market expansion efforts simply increase use to the extent of the promotion with no increase in price For a commodity with a supply somewhere in between those two extremes successful market expansion will increase both the price and quantity used Although the situation for cottonseed meal is closer to the fixed supply end of the spectrum market expansion efforts can increase the use of cottonseed meal through an increase in the crush-toshy
27
feed cottonseed use ratio This ratio will increase as the profitability of crushing vs alternative uses of the seed increase
The results of this survey however indicate both some problems and possible opportunities for expanding cottonseed meal use After briefly summarizing the major obstacles as identified in the study the major opportunities for expanding use of cottonseed meal will be discussed
Problems for Expanding Cottonseed Meal Use
The major problems for expanding CSM use are generally well known and verified by the survey results The major problems that would hinder efforts to expand cottonseed meal use identified in the study included primarily the following
bull Price and availability of CSM are the major factors affecting the selection or non-selection of CSM as an ingredient of feed formulations regardless of animal specie These nonshynutritional factors were judged to be more important than nutritional factors in selecting CSM as a feed ingredient Unfortunately neither the price nor the availability of CSM can be controlled or altered substantially or directly by market expansion efforts Some efforts to improve availability may be possible as discussed in the next section
bull CSM is perceived to be inferior in an overall sense to a number of key protein feeds CSM was judged by the survey respondents to be clearly superior in aggregate to only 5 of 20 potential alternate protein feeds Such an image could work against efforts to expand CSM use
bull Gossypol level is one of the top reasons that CSM is not used more frequently particularly in non-ruminant feed rations The level of gossypol is a unique characteristic of CSM that obviously cannot be changed through market expansion activities
bull Several other specific characteristics of CSM would likely need to change for CSM to be selected more frequently as a feed ingredient including amino acid balance energy level aflatoxin level and protein quality As with gossypol changes in these characteristics are out of the realm of market expansion programs
bull Feed formulators generally lack adequate and reliable information on many factors which are crucial in efficient feed formulation and which likely have a significant impact on the choice of protein feedstuffs The use of CSM in livestock feed rations is likely restricted by the wide disparity in the perception of feed formulators regarding the appropriate levels of several key nutrition-related factors for specific livestock rations including energy levels fat levels gossypol levels and escape values (ruminants only) for cottonseed meal
bull Over 75 of dairy cattle feed formulators and nearly half of beef cattle feed formulators utilize whole fuzzy cottonseed to some extent in some of the feed rations they formulate Relatively few reported using utilizing both CSM and whole cottonseed in the same ration A main attraction of the use of whole fuzzy cottonseed as opposed to cottonseed meal is the fiber content Indeed the use of whole delinted cottonseed in cattle feed rations is much lower
28
Opportunities for Expanding Use of Cottonseed Meal
There are essentially only two basic tools to expand the market for any commodity l market development and 2) enhancing the efficiency of the marketing system Market development involves a wide range of activities including primarily new product development and product differentiation In new product development the effort is to develop new products or characteristics of products that appeal to different segments of consumers An example might be research leading to the elimination of gossypol in cottonseed meal which could further open up the non-ruminant feed industry to cottonseed meal
Product differentiation on the other hand encompasses those activities designed to create a user preference for or loyalty to a commodity Product differentiation occurs in two major forms 1) advertising and 2) variation in design and quality of product The primary purpose of advertising is to create user preference for a commodity and convince users of the superiority of a product over competing products Actual physical differences in the product are not necessary to successfully differentiate it from competing products It is sufficient only that users believe that some superiority exists Advertising often intends to create an image of superior quality because such images are harder to imitate or successfully counter than physically unique features Successful differentiation of a product means that users become less sensitive to price changes more willing to pay a higher price for the same quantity because they prefer the product and are loyal to it in the face of price increases In other words users are willing to pay more for the same amount because advertising if successful creates a preference for the product over competing products
Variations in quality and design are usually used along with advertising to differentiate the product of one seller from that of another Such variations are often necessary to help create the superior images desired andor attract new sets of consumers
Often barriers exist in a marketing system that hinder the efficient functioning of the market and restrict the flow of commodities from sellers to users Enhancing the efficiency of the marketing system through eliminating such barriers can lead to an expansion in the use of a commodity One of the primary requirements of an efficiently functioning market is that sellers and users possess adequate and accurate information regarding the product its characteristics availability sources uses and value among other things Inadequate or inaccurate information regarding a particular product and other market characteristics can divert demand to alternative products with which users may be more familiar regardless of whether or not those products are better in some sense
The concept and importance of enhancing market efficiency in this regard can be illustrated by comparing the flow of information about a product and market conditions with a radio broadcasting system The efficiency of such a system depends on how accurately the microphone and other equipment record sound how accurately and rapidly that sound is transmitted to a radio receiver and how accurately the receiver brings sound to the listener A breakdown anywhere along the line in that system will simply mean that the message of the broadcast does not get from the radio station to the listener Also if the message gets through but static interferes with the transmission the listener might only receive part of the message or a garbled message The listeners impressions and actions consequently might be quite different than if he had received the message intended In quite the same manner the flow of a commodity from producers to users is affected by how rapidly and accurately market information is evaluated and how accurately and rapidly this information is transmitted to and among producers and users Any breakdown or static in the system would result in a smaller and more obstructed flow of the commodity to users than if the market operated more efficiently
29
The survey results suggests possible opportunities for expanding CSM use through market development and enhancing market efficiency Market development opportunities may be limited because of the nature of the CSM supply situation Nevertheless expansion of CSM use is possible through a reduction in direct feeding of cottonseed so that opportunities for expanding use through market expansion efforts should not be discounted Efforts to enhance the adequacy and accuracy of information regarding the use of CSM as a feed ingredient however may well be the most effective means of promoting an expansion of use or enhancement of the value of CSM
Opportunities for Expansion through Market Development
Although many product development opportunities likely exist for CSM the survey basically focused on the image of CSM in the perception of feed formulators If a market development approach to expanding the use of CSM as an ingredient of animal feed formulations has any chance of success the survey results suggest that the following components of such a strategy will be crucial
bull Product quality and consistency and an improved image of availability must be the major targets of promotion efforts The survey responses across all animal types unequivocally indicated that these three factors are the prime considerations in making general decisions regarding dietary proteins for animal rations Price only becomes a factor in specific decisions regarding the particular protein feed to use to fill the dietary protein requirements of feed formulations after these general concerns are addressed Creating an image of quality consistency and availability for CSM is a necessary first step to expanding use and enhancing value
bull CSM use expansion efforts must focus to some extent on reducing the direct feeding of whole cottonseed to beef and dairy cattle Reductions in direct feeding is the only chance for an increase in supply of CSM to fuel expanded use in newer markets such as catfish and poultry feeding Also because beef and dairy cattle are major users of cottonseed meal a decrease in feeding of whole cottonseed in favor of CSM would significantly expand use
bull Separate CSM market promotion messages must be developed to address the very different needs and concerns of ruminant vs non-ruminant feed formulators The survey results clearly indicate that many nutritional and non-nutritional factors are more important for nonshyruminant feed formulators than for ruminant feed formulators and vice versa
bull The nutrition-related content of CSM market promotion messages must emphasize primarily positive aspects of CSM protein quality amino acid balance and amino acid availability as well as an accurate understanding of appropriate gossypol and aflatoxin levels Many of these factors however are more important for non-ruminant rather than ruminant feed formulators which must be accounted for in designing appropriate messages for feed formulators of each animal type
bull The non-nutrition-related content of CSM market promotion messages may well be the most important and must emphasize primarily the positive aspects of price availability consistency of quality and storability The survey results attached a relatively high level of importance also to nutrient guarantees Although not scoring particularly high in the responses services available from the CSM industry may also be a helpful component of CSM use promotion messages
30
Opportunities for Expansion through Market Emciency Enhancement
Even though some gains in CSM use and market value can reasonably be expected through market expansion efforts the cost involved could easily outweigh any benefits in terms of enhanced profits to the CSM industry Perhaps the most cost-effective appropriate and useful means of enhancing the use of CSM would be a strategy aimed at improving the level and accuracy of information available regarding CSM and its use Lack of information or misinformation can easily discourage feed formulators from using CSM in their feed formulations Strategies to enhance the quantity and accuracy of appropriate information can take on many forms from media advertising to market news letters Although it is beyond the scope of this study to develop alternative information strategies the results of this study clearly indicate a number of areas in which enhanced and more accurate information is a critical need These include the following
bull The overall quality of CSM The study suggests that the negative aspects of CSM are well known Less well known are the specific positive aspects of CSM that may give it an edge in some sense over other protein feeds
bull The ideal ratio of the price of CSM to other feeds like soybean meal The study results indicate that feed formulators may not be adequately informed about what the ideal market value of CSM is relative to soybean meal given the differences in feeding value As a consequence CSM may currently be less used in relation to soybean meal than current market price ratios suggest should be the case
bull Protein-related factors for CSM use in non-ruminant feeds These factors are a major concern in the decisions of feed formulators to include or exclude CSM in feed rations
bull The relationship of aflatoxin to CSM and the rumen degradability of CSM particularly for beef and dairy cattle feed formulators These were the nutritional factors of greatest concern to ruminant feed formulators in the decision to include CSM in their feed formulations
bull CSM price availability consistency and palatability These were indicated to be the most important non-nutritional factors affecting feed formulators decisions regarding whether or not to use CSM The study indicates that information on non-nutritional factors may be more important in the decision to use CSM over alternative feeds to fill dietary protein requirements of feed rations than information on nutritional factors
bull The feeding value of CSM relative to alternative protein feeds An accurate and detailed assessment of the extent to which CSM may be superior as an alternative to other standard protein feeds would help position CSM appropriately in the market
bull The appropriate and acceptable levels of several key parameters affecting the use of CSM in animal feed rations including energy levels fat levels gossypol levels and escape values (ruminants only) Feed formulators generally lack adequate and reliable information on these and likely other parameters not included in the study which are crucial in efficient feed formulation and which have a significant impact on the choice of protein feedstuffs Although it appears that nearly all feed formulators routinely perform crude protein analyses few perform analyses for aflatoxin gossypol fat fiber and other parameters Also CSM suppliers are apparently doing an inadequate job currently of providing such information to feed formulators
31
SOME CONCLUDING COMMENTS AND RECOMMENDATIONS
This study assessed the potential problems and opportunities for expanding the use of CSM through an analysis of the perceptions of feed formulators regarding the use of CSM as an animal feed ingredient The perceptions of feed formulators regarding CSM as a protein feed largely define the boundaries within which CSM use will be able to achieve any significant growth in the future Their perceptions right or wrong are the key to understanding not only the problems facing CSM use but also the opportunities
The general conclusion of the study is an obvious one the use of CSM in feed formulations faces some major challenges in the future Chief among these include a perception among feed formulators that price availability quality and other key CSM characteristics are often obstacles precluding increased use of CSM in their feed formulations Perhaps the most important implication of the study is that a serious lack of adequate and accurate information among feed formulators regarding the characteristics parameters value and other aspects of cottonseed meal use in animal feed rations may be seriously restricting the market opportunities for cottonseed meal U nfortunately the development of alternative strategies to expand the use of CSM and enhance the efficient functioning of CSM markets through more accurate and available information on all aspects of CSM use in feed formulations is beyond this study Nevertheless a few recommendations pertinent to the development of such alternative strategies are in order
bull Before adopting any approach to expand the use of CSM it would be useful first to conduct a detailed analysis of the costs and benefits involved Market promotion efforts through advertising can be extremely costly and yield relatively little Research has also shown that there is often a tremendous lag between advertising and promotion expenditures and any associated returns It could take years of investment in such market expansion efforts before an accurate measurement of the actual return on investment could even be attempted
bull Consider developing first a detailed plan for information dissemination to the feed industry regarding all appropriate aspects of CSM use in feed rations as determined in this study An important part of this process would be a comprehensive assessment of the information needs and the information resources readily available The gap discovered in this way between needs and resources will help set the research agenda for the industry to fill the critical existing information gaps
bull Initiate a study of final user attitudes and perceptions of CSM use as a guide to future market expansion efforts This study considered only the perceptions of feed formulators regarding the use of CSM But feed formulators are often not the final users Consulting nutritionists for example often include or exclude certain feeds and feed types from their formulations as requested by feed users At least a few of the respondents to the survey conducted for this study indicated that user preferences are major factors determining whether or not CSM is included in their feed formulations Indeed markets operate as the interaction of supply and demand to determine prices The preferences of final users ultimately will be expressed in the market values of any product in any market unless sufficient obstacles exist to prevent the market from functioning properly Therefore the real decision-makers in the use CSM in the market may well include many more individuals than adequately represented by feed formulators
32
REFERENCES
US Department of Agriculture (USDAa) Feed Situation and Outlook Report Economic Research Service FDS series various issues
US Department of Agriculture (USDA b) Oil Crops Situation and Outlook Yearbook Economic Research Service OCS Series various issues
Figure 1 Quantity of Oilseed Meals Fed to Livestock 194849 - 198590 (Average)
(1000 Tons)
25000 0-1-----------------------shy
20000 I-~
15000
10000
5000
o L 1 J tJ t tmiddotmiddotmiddot 1 oj 1 to bullbull 1 L_ n __LLL I 1 bullbull I V I
1948-49 1950-54 1955-59 1960-64 1965-69 1970-74 1975-79 1980-84 1985-90
(Years)
n iflu Soybean Meal bull Cottonseed Meal Other Oilseed Meals
Source USDA
c
8 c a CD
en ~
--I _ scg ~CD 01)-- en - () mg0 s 0
JCD enOJ CD_CD en 0
sCDCD 0 OJ shyo OJ r Jlt- 0 m CJ) 0 0lt o 0shyCD OJ J
~s ~m cpCJ) r co OJco ~m a
Figure 3 Price Premium (+) or Discount (-) of Cottonseed Meal Relative to Soybean Meal 1956-1990
~~ ~
o I ~ I I
-20 f---
-40
-60
1~1~1~1~1~1~1~1~1~1~1~1~1~1~1~1~1~1~
Cottonseed meal price is adjusted to a soybean meal protein equivalent basis
~I------------------------------------------------------
l l A
I~middotmiddot--- --------
Figure 4 Animal Species for which Respondents Formulate Feeds
DAIRY CATILE
BEEFCATILE
HORSES
SHEEP
BROILERS
LAYERS
OTHER
PETS
TURKEY
SWINE
CATFISH
210
21000
0 5 1000 15 20 25
Figure 5 Respondents Formulating Feeds for the Various Animal Species
0 20 40 60 80
Figure 6 Other Animal Species for Which Respondents Formulate Feeds
DAIRY CATTLE
BEEF CATTLE
HORSES
SHEEP
BROILERS
LAYERS
OTHER
PETS
TURKEY
SWINE
CATFISH
632
Exotics
Trout
Alligators
KOI
Breeding Hens
Wildlife
Rabbits
Avian
Shrimp
Salmon
Ducks
Fish
Gamebirds
Hybrid Bass
379
~--~----~--~----~----~--~----~--~----~--~
0 10 20 30 40 50
Figure 7 Respondent Feed Formulation Activities by State
( of Respondents)
o 00 middot15 16 -30 31 middot45Cgt 46 -60 61 - 75 - 76 -90
Table 8 Respondent Experience as an Animal Nutritionist
( of Respondents) 30 r---shy
25 t-middotmiddotmiddotmiddotmiddotmiddotmiddotmiddotmiddotmiddotmiddotmiddotmiddot-middot ---_ _
20 -_ -nNItshy
15
10
5
0 1-5 6-10 11-15 16-20 21-25 26-30 31-35 36-40 41-45
(Years Of Experience)
-it sa 0 m 8 l 0 CD l g
_ cc c -s CD CObull
-0 -s- 3 Dl ~ IJ CD (fJ
C 0 l C CD l -+
raquo Sl_ lt_ -+_ CD (fJ
Figure 10 Respondent Primary Feed Formulations
by Animal Type 1990 (Percent)
30 I--------------------------------------------------------shy
25 r- middotmiddotmiddotmiddotmiddotmiddot231middotmiddotmiddotmiddot
20
15
10
5
0 Beef Dairy Swine Poultry Horses Pets Aqua- Sheep Exotics
Cattle Cattle culture amp Goats
(Animal Type)
Figure 11 Percent of CSM and S8M Used in Formulations by Feed Manufacturer Respondents 1990
( of Average Feed Ration)
Figure 12 Tons of Feed Formulated by Feed Manufacturer Respondents 1990
65
91
6 9
17
Total Formulations Formulations With CSM
II Less than 200000 Tons
II 200000 - 400000 Tons bullbullbull I bullbullbullbullbullbull ~ 3 ~ 400000 - 600000 Tons
5 rn 600 000 - 800 000 Tonsru 1
[] 800000 - 1000000 Tons9 4
I ~ 1 More Than 1000000 Tons
Formulations With S8M
Figure 13 Percent middotof Beef Cattle Respondents Formulating CSM Feeds for Specific Beef Cattle Types
( of Respondents)
25 ~I------------------------------------------------------~
-Isectig Feedlot-II 223
20
15
10
5
0
bull Other
~ middotmiddotmiddotmiddotmiddotmiddotmiddot middotmiddot _middotmiddotmiddotmiddot-=middotmiddotmiddotccmiddotcmiddotmiddot
Brood Cows Bulls Calves Feeder Heifer Stocker
(Animal Type)
Figure 14 Percent of Dairy Cattle Respondents Formulating CSM Feeds for Specific Dairy Cattle Types
( of Respondents)
120 ----------------------
100 88
80
60
40
20
0 Calves Heifers Lactating Cows Dry Cows
(Animal Type)
Figure 1-5 Percent of Poultry Respondents Formulating CSM Feeds for Specific Poultry Types
( of Respondents)
OO~I--------------------------------------------~-
50 1-laquolaquolt--laquolaquolaquo -lt - lt - lt -lt laquo lt
44
40
30
20
10
0
f-
~laquolaquolaquolaquo
~laquolaquolaquolaquolaquolaquo
Broilers Layers Turkeys Breeding Flocks
(Animal Type)
Figure 16~ Combined Responses Months of the Year When CSM IS NOT Available
( of Respondents) 16 i ---
14 12~8
12
10
87373 7
6
4
2
0 ~~ ~s ~( ~( ~0( ~0(~~~ ~~ ~t ~1 u~ ~g n0~ ad-o N0~ ~a~
~Y ~o Q~lmiddotr
(Month)
Figure 17 Combined Responses Months of the Year When CSM Needs to Be Available
( of Respondents) 12 ---------------------------
10
8
6
4
2
0
goA 9
~ui ~s ~Ot X)Ot ~Ot X)Ot~0SV~0~~erl ~iSclt ~f ~~1 ~v~ ug ~o~ o~o NO~ co~0 0lt609 ~o
(Month)
Figure 18 Beef Cattle Responses Percent of Respondents Formulating Creep Feed for Calves or Supplements for Stockers
733
832
0 20 40 60 80 100 120
( of Respondents)
Figure 19 Beef Cattle Responses Protein-Related Factors Considered When Balancing Rations
Other Protein Factors 110
Rumen
Degradability 686
Crude Protein Level 161
Amino Acid
Values 42
( of Respondents)
Figure 21 Comparison of Responses Months When CSM Needs to Be Available
( of Respondents) 94 ---------------------------shy
92
9
88
86
84
82 8
78
76
74
72
7
68
66
~ euroI - It
64 -t----------------------------------- -----------t
JAN FEB MAR APR MAY JUN JUL AUG SEP OCT NOV DEC
(Month)
bull Beef Cattle -t Dairy Cattle ltgt Poultry Catfish
Figure 20 Comparison of Responses Months When CSM Is Not Available
( of Respondents)
16 t 15
14
13
12
11
10
9
8ltl amp
7
6
5 I JAN
I
FEB I
MAR I
APR I
MAY I
JUN I
JUL I
AUG SEP I
OCT NOV I
DEC
(Month)
bull Beef Cattle -t Dairy Cattle ltgt PouHry b Catfish
Figure 22 Comparison of Responses Analyses Routinely Performed
( of Respondents)
100~-----------------------------------------------
90
80
70
60
50
40
30
20
10
o I ~
AFLATOXIN C PROTEIN FAT FIBER GOSSYPOL OTHER NONE
(Analyses)
bull Beef Cattle Dairy Cattle o Poultry Catfish-t fj
Figure 23 Comparison of Responses Analytical Values Provided by Supplier
( of Respondents)
60shy
50
4)
30
20
10
o amp ~
AFLATOXIN C PROTEIN FAT FIBER GOSSYPOL OTHER NONE
(Analyses)
bull Beef Cattle -t Dairy cattle o Poultry b Catfish
Figure 24 Share of Cottonseed Use Crush vs Feed Use
( of Respondents)
100 I
90
CRUSH 80
70
60
50
40
30
20
FEED USE 10
o 1~ 1~ 1~ 1m 1m 1~ 1~ 1~ 1~ 1~ 1~ 1~ 1~ 1~
(Year)
Source USDAb
Table 1 Percentage of Beef Cattle Feeds Formula ted Table 2 CSM Feeds Formulated for Beef Cattle CSMmiddot Calvesmiddot
middotAverage Response Rate (feedlot=51 other=41) middotResponse Rate = 39
Table 3 CSM Feeds Formulated for Beef Cattle Table 4 CSM Feeds Formulated for Beef Cattle Stockersmiddot
middotResponse Rate = 40
Response Rate =37
Table 5 CSM Feeds Formulated for Beef Cattle Table 6 CSM Feeds Formulated for Beef Cattle
middotResponse Rate =33
middotResponse Rate = 37
Table 8 Percentage of Dairy Cattle Feeds Formulated CSM
Average Response Rate =88
middotResponse Rate = 37
Table 9 CSM Feeds Formulated for Dairy Cattle Table 10 CSM Feeds Formulated for Dairy Cattle
RespooseRate 24
middotResponse Rate = 34
Table 11 CSM Feeds Formulated for Dairy Cattle Table 12 CSM Feeds Formulated for Dairy Cattle
Response Rate = 31 Response Rate = 45
Table 13 Percentage of Poultry Feeds Formulated Using CSMmiddot
bullAverage Response Rate = 79
Table 14 Percentage of Catfish Feeds Formulated Using CSMmiddot
bullAverage Response Rate =67
Table 15 CSM Feeds Formulated for Catfishmiddot )middoti middot fteq~
bullAverage Response Rate = 17
Table 16 Combined Responses Importance of Specific Factors in Choice of Dietary Protein ( of
bullAverage Response Rate =g]
Table 17 Combined Responses Other Important Factors in
bullAverage Response Rate = 22
bullAverage Response Rate =91
-Average Response Rate =90
Table 20 Combined Responses Importance of Non - Nutrition -Related Factors in Choice of CSM over Alternative Protein Feeds ( of
-Average Response Rate = 87
Table 22 Combined Responses Top S Reasons Why CSM IS NOT Selected as a Feed
Table 23 Combined Responses Top 5 Specific Characteristics That Would Have to Change for CSM to be Selected as a Feed
Table 24 Combined Responses Analysis Routinely Performed
Table 25 Combined Responses Analysis Values Provided
CSM
267 067 333 333 1400 S333
467 000 067 067 1400 4867 --shy
467 000 000 067 400 4333 --shy -- shy -- shy
250 000 000 000 1250 4000 -- shy --shy
313R 4733 62 ------ shy~ - shy ~-
4S00 62
bullAverage Response Rate = 100
bullAverage Response Rate = 87
Table 28 Beef Cattle Responses Imponance of Nutrition-Related Factors in Choice of CSM Over Alternative Protein Feeds
Average Response Rate = 91
Table 29 Beef Cattle Responses Other Nutrition - Related
Fact~~~~~~~~~~~~~~~~~~~
Response Rate =7
Table 30 Beef Cattle Responses Imponance of Non - Nutrition - Related Factors in Choice of CSM Over Alternative Protein Feeds
middotAverage Response Rate = 87
middotResponse Rate = 5
bullAverage Response Rate =14
Table 33 Beef Cattle Responses Months of the Year When CSM Needs to Be AvaiJable I ii middot middot1
bullAverage Response Rate =53
10 U
-Moy
JIIJ
All
so
0_ -
to
--I No
Moy
10 -so shy
0_ _ 0-
Table 35 Beef Cattle Responses Top 5 Reasons Why CSM Is Not Selected as a Feed
Average Response Rate =100 Response Rate = 24
Response Rate =28
Average Response Rate = 98
Response Rate = 17
middotResponse Rate =9
Table 43 Beef cattle Responses Type of Creep Feed
middotResponse Rate = 81
middotResponse Rate =26
Table 45 Beef cattle Responses Respondents Formulating Rations With CSM and Whole
middotResponse Rate = 68
Table 47 Beef cattle Responses Percentage of Whole Cottonseed Respondents Mix in Rations Containing Both CSM and Whole Cottonseedmiddot tCmiddotHiitjt~ middotmiddotmiddotmiddot1
middotResponse Rate =25
middotResponse Rate = 30
bull Response Rate = 98
Response Rate =11
Table 51 Beef Cattle Responses Escape Value Respondents Are Using for Rumen Degradabilitymiddot
1~iiii middotb~r~~fgtD zq436imiddotmiddotmiddotmiddotmiddotmiddotmiddot 004bullbullbullbullbullbullbullbullbullbull1----22--+----31-4
I~~I 23 329
middotResponse Rate = 57
Table 53 Beef Cattle Responses Methods or Sources Respondents Used to Calculate CSM
Table 52 Beef Cattle Responses Reliability of Escape Values Used
Table 54 Beef Cattle Responses Interested in Knowing Escape Values for CSM Processed
Valuemiddot
middotResponse Rate =98
)
I Mean ~nse
63 57S19 228381 Q-L_uu ~139 59468 32306 139bullII1 1 061 06
1 1 44 430 614431-------- 57t 001 001 middot-1
==~=-__~~1c9 00 _ 06 _ 001_ 38 133 323 63
Average Response Rate =100
Response Rate = 89
Table 58 Dairy Cattle Responses Importance of Nutrition - Related Factors in Choice ofCSM Over Alternative Protein Feeds (ofbmiddotNmiddotmiddotmiddotmiddotmiddotmiddot
Response Rate =88
Table 59 Dairy Cattle Responses Other Nutrition-Related Factors
Indicated br~~P211dents
Response Rate =10
Table 60 Dairy Cattle Responses Importance of Non- Nutrition - Related Factors in Choice of CSM Over Alternative
Protein Feeds ( ofResPOndents~dd
Response Rate = 88
Response Rate = 3
--
Average Response Rate = 51
Table 62 Dairy Cattle Responses Months in the Year When CSM IS NOT Available
10 u
J -- AIIIi
--~ shy
loOoIMr _ 0-
bullAverage Response Rate =69
--- AIIIi
--~ soM
0
0-_
10
Table 65 Dairy Cattle Responses Top 5 Reasons Why CSM IS NOT Selected as a Peed
Table 66 Dairy Cattle Responses Top 5 Specific Characteristics That Would Have to ro1 ____ for CSM to be Selected as a Feed
Table 67 Dairy Cattle Responses Analyses Routinely Performed fmiddotmiddotmiddotmiddot
Response Rate =96
Response Rate =56
Table 68 Dairy Cattle Responses Other Analyses
Response Rate =25
Table 70 Dairy Cattle Other Analytical Values CSM
Response Rate =4
Average Response Rate =81
Average Response Rate = 15
Table 73 Dairy Cattle Responses Respondents Formulating Feeds With Whole andor Delinted
Cottonseed bull
bullAverage Response Rate =92
middotResponse Rate = 40
Table 74 Dairy Cattle Responses Respondents Formulating Rations with Cottonseed Meal and Whole Cottonseed in the Same Rationmiddot
middotResponse Rate = 97
Table 76 Dairy Cattle Responses Percentage of Whole Cottonseed Respondents Mix in Rations
ltltJIltainin(a0th CSM and WhoeCottonseedmiddot Mean
middotResponse Rate = 42
Table 77 Dairy Cattle Responses Knowledge of Research on Feedine CSM
~~~~
Average Response Rate = 68
Response Rate =7
Average Response Rate =59
Response Rate =25
Average Response Rate =63
Response Rate = 13
middotResponse Rate = 92
Response Rate =82
Table 85 Dairy Cattle Responses Methods or Sources Used to Calculate CSM
Response Rate = 73
Table 86 Dairy Cattle Responses Respondents Interested in Knowing Escape Values for CSM Processed from Different Methodsmiddot fmiddotmiddotmiddotmiddotmiddotmiddot
Response Rate = 92
Response Rate = 34
Table 89 Dairy Cattle Responses Suggestions for CSM
Response Rate =33 Response Rate =22
-----
64 139 24815 00 36 511 5751
5951 131 438 35015 00 15 I-~~~~~
6200 15 423 51151 00 00 ~~~ -~~~ -~~~ ~~~-~~ --~~ ~ ~ ~~-~ ~
292 55125 00 00 125 45800
bullAverage Response Rate =99
Average Response Rate =85
Table 92 Poultry Responses Importance of Nutrition - Related Factors in Choice of CSM Over Alternative Protein Feeds (of
Average Response Rate =85
Table 93 Poultry Responses Other Nutrition-Related Factors Indicated
200
200
Response Rate = 5
Table 94 Poultry Responses Importance of Non - Nutrition - Related Factors in Choice of CSM Over Alternative Protein
Feeds~~~~~~~~~~5=~~~~~T7~~
00 Average Response Rate =83
Response Rate =4
Average Response Rate = 17
Table 97 Poultry Responses Months in the
J
p
April
lao
A
shy-- 0
ft
April
_
Average Response Rate = 43
=1 g L
0
Table 99 Poultry Responses Top 5 Reasons Why CSM IS NOT Selected as a Feed
Table 100 Poultry Responses Top 5 Specific Characteristics That Would Have to Change for
CSM to be Selected as a Feed Inoredient
Table 101 Poultry Responses Analyses Routinely
middotResponse Rate = 93
Table 102 Poultry Responses Other Analyses Routinely
Performed
middotResponse Rate = 27
Table 103 Poultry Responses Analytical Values Provided
middotResponse Rate =73
Table 104 Poultry Responses Knowledge of Problems
bullAverage Response Rate = 62
Average Response Rate = 14
Table 106 Poultry Responses Protein - Related Factors
Average Response Rate = 64
Table 107 Poultry Responses Other Protein - Related
Response Rate =11
Table 108 Poultry Responses Crude Protein Levels
Preferred for CSM
Response Rate = 55
Table 111 Poultry Responses Gossypol Levels Considered
Safe
Table 112 Poultry Responses Would or Do Use Table 113 Poultry Responses Relative Feeding Value of CSM Comoared to 44 SBMmiddot
middotResponse Rate = 96
bull Response Rate = 100
Table 114 Poultry Responses Knowledge of Table 115 Poultry Responses Familiarity with Other Feedino CSMmiddot
middotResponse Rate =7 bull Response Rate = 73
middotResponseRate = 31
bullAverage Response Rate = 58
Table 118 Poultry Responses Willingness to Pay
a Premium Per Unit of Protein for CSM With More
Than 41 Protein
bullResponse Rate =91
Table 119 Poultry Responses Percent of Cost of SBM Respondents Willing to Pay for CSM with
Response Rate =27
Response Rate =64
00 00 87 43 478 304 57 00 00
----shy I--~~
00 ~-~
43 522 348 59 ----shy
62~ 00 00 00 261 ----shy
652 ------shy
00 00 00 00 667 333 63 AverageResponseRate = 99
bullAverage Response Rate = 73
Table 123 Catfish Responses Importance of Nutrition - Related Factors in Choice of CSM Over Alternative Protein Feeds
Average Response Rate =83
Table 124 Catfish Responses Importance of Non- Nutrition - Related Factors in Choice of CSM Over Alternative Protein
Feeds
Average Response Rate = 90
bullAverage Response Rate = 13
Igt 20
s_
Pshy s
--s
H_
_
gt 7 bull bull bull bull bull
1 fsI plusmn -
haMr
N__
shy
bullAverage Response Rate =54
Table 128 Catfish Responses Top 5 Reasons Why CSM IS NOT Selected as a Feed
Table 129 Catfish Responses Top 5 Specific Characteristics That Would Have to Change for CSM to Be Selected as a Feed-_
Table 130 Catfish Responses Analyses Routinely Table 131 Catfish Responses Other Analyses Routinely Performed
middotResponse Rate = 25
middotResponse Rate =92
bullAverage Response Rate = 18
Table 133 Catfish Responses Knowledge of Problems Feedine CSM to CatflSh
Average Response Rate =100
Table 134 Catfish Responses Protein - Related Factors Considered i
Response Rate = 83
Table 135 Catfish Responses Crude Protein Levels Preferred for CSM
Response Rate = 100
Table 139 Catfish Responses Would or Do Use Table 140 Catfish Responses Relative Feeding
Value ofCSM Compared to 44~ Lmiddotmiddotmiddotmiddotmiddotmiddotmiddotmiddotmiddotmiddotmiddotmiddotmiddotmiddotmiddotmiddotmiddotmiddotmiddot _
Response Rate = 100
Response Rate = 100
Table 141 Catfish Responses Knowledge of Research on Table 142 Catfish Responses Sources ofInformation
Average Response Rate = 83
bullAverage Response Rate = 44
Table 143 Catfish Responses Willingness to Pay A Premium Per Unit of Protein for CSM with More Than
middotResponse Rate = 100
Table 144 Catfish Responses Percent of Cost of SBM Respondents Willing to Pay for CSM with Sufficiently Low Goscvnol and Fiber Levelsmiddot
middotResponse Rate = 83
middotResponse Rate = 25
Table 146 Comparison of Mean Responses and Analysis of Variance (ANOVA) Importance of Specific
bull Scale of 1 (extremely unimportant) to 7 (extremely important) for the mean ranking a Mean significantly larger across animal types at the 5 significance level otherwise no difference b Mean significantly lower across animal types at the 5 significance level otherwise no difference
Table 147 Comparison of Mean Responses and Analysis of Variance (ANOVA) Ranking of Other Protein
bull Scale of 1 (CSM inferior to respective feed) to 7 (CSM superior to respective feed) for the mean ranking
a Mean significantly larger across animal types at the 5 significance level otherwise no difference
b Mean significantly lower across animal types at the 5 significance level otherwise no difference
Table 148 Comparison ofMean Responses and Analysis of Variance (ANOVA) Importance of Nutritionshy
Related Factors in Choice ofCSM Over Alternativesmiddot
bull Scale of 1 (extremely unimportant) to 7 (extremely important) for the mean ranking a Mean significantly larger across animal types at the 5 significance level otherwise no difference
b Mean significantly lower across animal types at the 5 significance level otherwise no difference
Table 149 Comparison of Mean Responses and Analysis of Variance (ANOVA) Importance of Nonshy
Nutrition- Related Factors in Choice of CSM Over Alternativesmiddot
bull Scale of 1 (extremely unimportant) to 7 (extremely important) for the mean ranking
a Mean significantly larger across animal types at the 5 significance level otherwise no difference
b Mean significantly lower across animal types at the 5 significance level otherwise no difference
- = Not mentioned or ranked lower than 4th place
Table 151 Comparison of Responses Top Responses Why CSM IS NOT Selected as a Feed
- = Not mentioned or ranked lower than 5th place
Table 152 Comparison of Responses Top Characteristics that Have to Change for CSM to Be
- = Not mentioned or ranked lower than 5th place

20
to avoid taking this conclusion too far because of the relatively few number of catfish feed formulators in the sample
bull Source of chemical analyses for cottonseed meal The results for the chemical analyses performed by poultry respondents are similar to those of poultry as well as those of both the combined results and the beef and dairy cattle results The primary analysis routinely performed by the catfish respondents is crude protein followed by fat fiber aflatoxin and gossypol (Tables 130 and 131) The primary analytical values supplied to the catfish respondents also included crude protein fiber and fat (Table 132) Only 2 of the II catfish respondents indicated that their CSM supplier does not provide them with any analytical values Even though gossypol was ranked as an extremely important nutrition-related factor in the choice of CSM as a feed component and the number one CSM characteristic that needs to change only 5 of the II respondents routinely perform gossypol analyses None of catfish respondents obtain analytical values for aflatoxin from their CSM supplier
As for poultry catfish sample members were asked some specific Questions regarding the use of CSM in catfish feed formulations in 5 general areas 1) problems resulting from feeding a ration with CSM to the various catfish types 2) specific information on several key nutrition-related factors affecting the use of CSM in catfish rations 3) sources of information utilized on formulating catfish feeds 4) CSM price and value and 5) an open-ended Question soliciting suggestions to improve the usefulness or value of CSM for catfish feed formulations
Problems from Feeding CSM Rations to Catfish
Absolutely no catfish respondents indicated any knowledge of any problems associated with feeding a ration containing CSM to catfish (Table 133)
Information on Key Nutrition-Related Factors for Catfish Rations
As for poultry the survey sample members were asked to respond to a number of specific Questions related to nutritional factors that affect the use of CSM in catfish rations including protein energy fat gossypol and synthetic amino acids They were then asked to indicate their perception of the overall feeding value of a standard 41 protein CSM compared to that of a standard 44 protein soybean meal Just as for poultry these Questions were designed primarily to determine the extent of knowledge among catfish feed formulators concerning these factors as they relate to the use of CSM and the relative feeding value of CSM
Sample members were asked to respond to two Questions regarding protein in catfish feed rations They were first asked to indicate the specific protein-related factors that they consider when balancing rations for catfish They were given the same list of three factors (crude protein level amino acid content and amino acid availability) to choose from that the poultry sample members were given Again they were also allowed to specify any other protein-related factors they consider when balancing catfish rations They were then asked to indicate the crude protein levels they would prefer for CSM and were given the same choice of four levels as the poultry sample members (36 41 (standard) 44 and 48) and allowed to suggest any other preference for crude protein level In contrast to poultry the largest percentage of catfish respondents indicated that they consider amino acid availability (10 of the 11 catfish respondents) rather than the content when balancing catfish rations (Table 134) The second largest percentage consider crude protein level (9 respondents) also a different result from poultry
21
With regard to the crude protein level for CSM preferred by catfish respondents about 43 indicated a preference for 48 crude protein (Table 135) About 20 of the respondents were satisfied with the standard 41 level and nearly 30 indicated a preference for a 44 protein CSM No respondents preferred anything less than the standard 41 The mean preferred crude protein level was about 42
With respect to energy levels the catfish sample members were asked to indicate what they considered to be the normal maximum and minimum energy levels for protein feeds for fingerlings grow out stock brood stock and fries Despite the low number of catfish respondents the answers to this question were widely divergent (Table 136) For fingerlings the maximum (in K Cals DE per pound) ranged from 1250 to 1800 and the minimum from 2 to 1500 with a mean maximum of 1525 and a mean minimum of 834 For grow out stock the maximum (in K Cals DE per pound) ranged from only 1500 to 1600 and the minimum from 1 to 1300 with a mean maximum of 1550 and a mean minimum of 750 For catfish brood stock the maximum (in K Cals DE per pound) ranged from 1300 to 1700 and the minimum from 1200 to 1400 with a mean maximum of 1500 and a mean minimum of 1300 For fries the maximum (in K Cals DE per pound) ranged from 1250 to 1800 and the minimum from 900 to 1500 with a mean maximum of 1525 and a mean minimum of 1200 Given the disparity in these responses it seems clear again for catfish feed formulators that there is little common concept of the normal maximum and minimum energy levels for protein feeds
Catfish sample members similarly were asked to indicate the minimum and maximum fat levels they considered critical for protein feeds As with poultry the range of responses was still quite wide but there also appeared to be more uniformity in responses to this question than the one for energy level (Table 137) The maximum fat levels (ether extract as fed basis) indicated by the respondents again ranged from 1 to 15 for most catfish types as was the case for poultry The mean minimum levels of fat for all catfish types ranged from about 3 to 5 The mean maximum ranged from 6 to 10 aCrOSS the different catfish types
Catfish sample members were also asked to indicate the level of gossypol they considered safe for catfish rations The responses again varied widely from a low of 0 ppm up to a high of 300 ppm for some catfish types (Table 138) The two highest mean safe levels of gossypol were 97 ppm for grow out stock and 83 ppm for brood stock For fingerlings and fries the safe maximum mean levels were much lower at 44 ppm and 23 ppm respectively
The questionnaire also asked the sample members to indicate if they use or would use synthetic amino acids where economical The response was that 83 (all but 2) of the catfish respondents indicated that they have or would use synthetic amino acids in this situation (Table 139) This suggests little real aversion on the part of feed formulators to utilize synthetic amino acids in least cost catfish formulations
To obtain some insight on the general perception of catfish formulators regarding CSM the sample members were asked to indicate their opinion of the overall feeding value of a standard 41 protein CSM compared to that of a standard 44 protein soybean meal expressed on a percentage basis They were given a choice of 5 ranges from under 70 of the feeding value of soybean meal to over 100 in 10 increments (see Table 140 for the actual ranges used) All but one of the catfish respondents indicated that CSM has an overall feeding value of under 90 of that of soybean meal Given the five choices offered to respondents the mean feeding value of CSM relative to that of soybean meal was around 80
22
Sources of Information UtiJized on Formulating Catfish Feeds
Only about half of the catfish respondents indicated that they were familiar with research on feeding CSM to grow out stock and only a third were familiar with research on fingerlings (Table 141) Only 2 respondents were familiar with any research on feeding CSM to brood stock and fries To obtain information on formulating feeds for catfish the largest number of respondents indicated that they utilize university research and industry publications of some type (Table 142)
Cottonseed Meal Price and Value
Catfish sample members were also asked two Questions to get some idea concerning their perception of the value of CSM particularly with respect to soybean meal 1) if they would be willing to pay a premium per unit of protein for CSM with more than a standard 41 protein and 2) if gossypol and fiber were sufficiently low on average what percent of the cost of soybean meal would they be willing to pay for CSM
With respect to the first Question 75 of the catfish respondents indicated a willingness to pay a premium for a CSM with more than 41 protein which is consistent with their earlier responses that they would prefer a CSM with a higher crude protein level (Table 143)
In response to the second Question catfish respondents indicated that they would only be willing to pay an average of about 82 of the cost of soybean meal for a CSM with a sufficiently low level of gossypol and fiber (Table 144) The range around that average was more narrow than for poultry from 70 to 100 This is more consistent with the ratio of CSM price to soybean meal price that has existed over the last 7 or 8 years on average
Suggestions for Improving the Usefulness of Cottonseed Meal
Only three catfish respondents offered suggestions for improving the usefulness or value of CSM for catfish rations The three suggestions included I) providing a more consistent product in price and Quality 2) providing a premium Quality toxin-free high protein low-fat product superior to soybean meal and 3) eliminating the CHO fraction (Table 145)
Comparisons Among Animal Species
In order to highlight the salient differences in responses with respect to the various animal species the mean responses to Questions that are common among all surveys regarding CSM use as a feed ingredient were compared and analyzed An analysis of variance (ANOY A) was also done to detect statistically significant differences in the mean responses to each Question by animal specie Comparisons are made among the mean responses to all Questions in the 6 general areas to which all sample members were asked to respond regardless of the animal specie(s) for which they formulate feeds 1) the particular factors affecting their choice of dietary proteins for formulated feeds 2) the extent to which CSM is considered to be an alternative to selected protein feeds 3) the importance of nutritional and non-nutritional factors in their decisions to use CSM rather than alternative dietary proteins in their feed formulations 4) the seasonality of CSM availability 5) the specific reasons for the selection and non-selection of CSM for use in the feeds they formulate and 6) the source of CSM chemical analyses used by the respondents Where appropriate ANOY A results are also indicated
23
Factors Affecting Choice of Dietary Proteins
As discussed earlier all members of the final sample regardless of the animal species for which they formulate feeds were asked to rank the importance of four general factors in their choice of a dietary protein for their feed formulations on a scale of I to 7 (from extremely unimportant to extremely important respectively) 1) quality 2) price 3) availability and 4) consistency Comparing the results across animal types reveals few significant differences in the importance attached to any of the four factors by the responding formulators of the various animal specie feeds (ie comparing results horizontally in Table 146) But as pointed out in an earlier section the mean rankings for quality are all higher than those for the other factors while the mean rankings of price are all lower than those for most other factors across all animal types In other words the respondents consistently ranked quality highest on the scale of importance followed in order by consistency availability and price
Cottonseed Meal As An Alternative Protein Feed
Recall that the sample members were asked to rank various selected protein feeds on a scale of 1 to 7 as inferior or superior to CSM in an overall sense for use in feed formulations A second question required respondents to indicate whether or not they considered CSM to be an alternative to each of the 20 listed protein feeds A comparison of the mean ran kings and ANOV A results across animal types indicates substantial agreement among the respondents regarding the ranking of CSM as an alternative to some animal feeds and substantial disagreement with respect to CSM as an alternative to many others (Table 147) Respondents over all animal types tended to agree that certain feeds and in particular the higher crude-protein-content feeds are clearly superior to CSM including dried skim milk meat and bone meal fish meal blood meal soybean meal dried whole milk and corn gluten feed There was a statistically different deviation in the extent to which respondents for some animal species regarded those meals as superior however For example catfish respondents ranked meat and bone meal fish meal poultry by-products blood meal soybean meal and corn gluten meal higher than did respondents for the ruminant animals The same was roughly the case for poultry Beef and dairy cattle respondents tended to rank all other protein feeds as less superior (ie more inferior) to CSM There was also substantial agreement that CSM was about the same as tankage peanut meal linseed meal and brewers and distillers dried grains but superior to some extent over the other feeds particularly those lower in crude protein including dehydrated alfalfa sunflower meal wheat middlings safflower meal canola meal feather meal and urea Beef and dairy cattle respondents agreed that CSM can be considered an alternative to nearly all the protein feeds except perhaps skim and whole dried milk Poultry and catfish respondents indicated CSM is an alternative to fewer of the other protein feeds
The Importance of Nutritional and Non-Nutritional Factors
Respondents also ranked the importance of specific nutrition-related and non-nutritionshyrelated factors in choosing cottonseed meal as a component of the feeds they formulate on a scale of extremely unimportant to extremely important (a scale of I to 7 respectively) Comparing the mean rankings by the respondents reveals that poultry and catfish feed formulators clearly consider proteinshyrelated factors and gossypol level to be more important than do beef and dairy feed formulators (Table 148) Fiber level is also of more importance to formulators of catfish feed Interestingly the importance of fiber was not ranked significantly higher by poultry feed formulators than by beef and dairy cattle feed formulators At the same time aflatoxin was clearly ranked by all respondents as the most important factor affecting the choice of CSM as a feed ingredient irrespective of the animal specie for which the ration is intended
24
For the non-nutritional factors an analysis of the mean rankings indicates few significant differences in the responses across animal species with respect to each individual factor listed (Table 149) The most notable exception is that poultry respondents ranked palatability significantly less important than did any of the other respondents for the other animal species Finally catfish respondents perceived that service by the CSM industry was more important for them than did the respondents for the other animal species
Seasonality of Cottonseed Meal Availability
The respondents across all animal species indicated that CSM is least available between about May and October likely reflecting the increasing shortages of cottonseed meal supply just prior to the cotton harvest in the fall (Figure 20) At the same time however the beef cattle dairy cattle and poultry respondents all indicated that there is less need for CSM to be available during approximately those same months in order to compete effectively with other protein feeds (Figure 21) This suggest that the seasonality of supply may not represent an important constraint to competitiveness and growth possibilities of CSM as a feed ingredient Interestingly catfish respondents suggested a largely inverse pattern of the times of the year when CSM needs to be available to compete effectively with other protein feeds as a catfish feed ingredient Possible explanations of this phenomenon include I) the protein feed needs of catfish feed formulators peak in the late spring and summer months when supply is less available 2) catfish feed formulators are located such that CSM is not easily obtainable particularly during short supply years or 3) formulators of feed for other animal species have longer experience in using CSM and have adjusted their formulation to the pattern of CSM supply availability In any case it should be remembered that there are relatively few catfish feed formulators in the sample so that their joint responses may not be truly representative of all catfish feed formulators In this case this difference in their responses may mean little
Reasons for the Selection and Non-Selection of Cottonseed Meal
Respondents across animal species were quite consistent in their ranking of the top reasons that CSM is included in feed formulations (Table 150) They overwhelmingly ranked price as the top reason followed generally by availability and protein quality Catfish respondents differed somewhat from that order ranking protein quality second and palatability as third Availability was ranked fourth by catfish respondents The top reason all respondents listed for which CSM is not included in feed formulations was also price (Table lSI) Beef and cattle respondents ranked availability as second but poultry respondents ranked gossypol second while catfish respondents ranked protein quality second A vailability ranked only as the third reason that CSM is not selected by poultry respondents and fourth by catfish respondents Gossypol ranked either third or fourth for all animal species except poultry for which gossypol appears to be a more important reason for not including CSM in poultry feed formulations The question regarding the characteristics of CSM that would have to change in order for it to be selected more frequently as a feed ingredient elicited about the same responses as those for the previous question concerning why CSM is not included in feed formulations (Table 152) The top characteristic that would have to change in the opinion of most respondents is price Catfish respondents however listed price extremely low on their list suggesting that other factors are more of a constraint to CSM use in their opinion They ranked gossypol as the number one characteristic that would have to change Availability appeared to be more of a concern to beef and dairy feed formulators than for poultry and catfish formulators
25
Source of Chemical Analyses for Cottonseed Meal
About the same percentage of respondents across animal species perform analytical tests for aflatoxin crude protein fat fiber and gossypol (Figure 22) The only noticeable differences were for aflatoxin and gossypol for which about half the percentage of dairy and beef respondents compared to catfish respondents reported that they routinely perform tests A higher percentage of poultry respondents also appear to perform tests for aflatoxin and gossypol than is the case for beef or cattle respondents Crude protein is tested for by the highest percentage of respondents for all animal species while gossypol is tested for by the smallest percentage of all respondent groups except catfish CSM suppliers are more likely to provide feed formulators with analytical values for crude protein fat and fiber than for aflatoxin or gossypol (Figure 23) A sizeable percentage of the respondents across all animal types reported that their CSM supplier provides no analytical values whatsoever
Summary ofMajor Findings
Of the reams of information normally provided by a study like this relatively little is usually new or profound And of what can be found that appears important only some is little more than interesting or particularly useful Before turning to a discussion of the implications of the study results the major findings across animal groups are briefly summarized first Sifting through the many tables figures and data sets the main findings of the study appear to be the following
bull Quality is the most important factor affecting the choice of dietary proteins by feed formulators followed by consistency and availability Price is the least important of the four factors in making general decisions regarding dietary proteins for animal diets
bull Once feed formulators have set the general parameters for use of dietary proteins in their formulations however price is the most important factor determining the choice among alternative dietary proteins to satisfy the general parameters for dietary protein use in feed formulations
bull When considering whether or not to use CSM as the dietary protein in feeds the nutritional factors of most concern to formulators of feed for non-ruminant animals (poultry and catfish) appear to be protein-related For formulators of ruminant (beef and dairy cattle) feeds aflatoxin level and rumen degradability are the most important nutritional factors
bull The most important non-nutritional factors affecting feed formulators decisions regarding whether or not to use CSM are I) price 2) availability 3) consistent quality and 4) palatability in that order
bull Non-nutritional factors are more important than nutritional factors in the choice of CSM over alternative feeds to fill the dietary protein requirements of feed formulations In general price and availability were ranked above protein quality and other nutrition-related factors as reasons why CSM is and is not chosen as a feed ingredient over alternatives Price and availability were also cited as the characteristics that most need to change in order for CSM to be selected as a feed ingredient more frequently
bull CSM is generally considered to be inferior to higher protein feedstuffs and superior to lower protein feedstuffs This generalization however does not hold for all feeds and all animal types Formulators of ruminant animal feeds ranked many of the higher protein feeds more on a par with CSM than did formulators of non-ruminant animal feeds
26
bull The seasonality of CSM availability is both a positive and a negative factor affecting the use of CSM rather than alternative protein feeds in animal feed rations That is CSM is obviously more likely to be selected as a feed ingredient during months of greater availability than during the months of lower availability In general however the survey responses indicate that CSM is normally available when feed formulators perceive that it needs to be available One word of caution It may be that a higher percentage of CSM users agreed to participate in this survey than those who are currently not using CSM Those who are current CSM users may well have already adjusted their feed purchasing patterns and operations to reflect the seasonal changes in the availability of CSM Consequently current CSM users may perceive less of an availability problem than those who are not currently using CSM In this case the responses to these questions may not be truly representative of the perception of the availability of CSM by feed formulators in general
bull There is a tremendous disparity in the perception of respondents as to the appropriate levels of several key nutrition-related factors for specific livestock rations including energy levels fat levels gossypol levels and escape values (ruminants only) for cottonseed meal For each animal specie the range of variation in the perceived acceptable levels of each of these factors was extremely wide The obvious conclusion is that feed formulators generally lack adequate and reliable information on many factors which are crucial in efficient feed formulation and which have a significant impact on the choice of CSM as a feed ingredient
PROBLEMS AND OPPORTUNITIES FOR EXPANDING COTTONSEED MEAL USE
CSM is somewhat unique among vegetable protein meals in that it is the product of a byshyproduct The volume of the by-product cottonseed available for crushing and the potential supply of CSM depend more on the dynamics of cotton supply and demand than on forces specific to CSM markets This mean that market signals from feed formulators and livestock feeders regarding desired values and characteristics of protein meals likely have little impact on the potential CSM market supply
Since the mid-1970s the share of the annual production of cottonseed fed directly to ruminant livestock has increased steadily from about 5 in 1974 to nearly 40 in 1990 (Figure 24) The consequence has been a marked decline both in the share of the available supply of cottonseed that is crushed and in the ratio of actual to potential cottonseed meal output An increase in the demand for CSM therefore will either bid up the market price of CSM with no additional volume actually used or increase the cottonseed crush to feed use ratio (or some combination thereof) There will be little or no effect on the total amount of cottonseed available
The intent of efforts to expand the market for any commodity is to effect an increase in sales at a higher price For a commodity with a relatively fixed supply the major result of an expansion in demand is solely an increase in price because supply cannot increase to allow an increase in use For a commodity with an unlimited supply successful market expansion efforts simply increase use to the extent of the promotion with no increase in price For a commodity with a supply somewhere in between those two extremes successful market expansion will increase both the price and quantity used Although the situation for cottonseed meal is closer to the fixed supply end of the spectrum market expansion efforts can increase the use of cottonseed meal through an increase in the crush-toshy
27
feed cottonseed use ratio This ratio will increase as the profitability of crushing vs alternative uses of the seed increase
The results of this survey however indicate both some problems and possible opportunities for expanding cottonseed meal use After briefly summarizing the major obstacles as identified in the study the major opportunities for expanding use of cottonseed meal will be discussed
Problems for Expanding Cottonseed Meal Use
The major problems for expanding CSM use are generally well known and verified by the survey results The major problems that would hinder efforts to expand cottonseed meal use identified in the study included primarily the following
bull Price and availability of CSM are the major factors affecting the selection or non-selection of CSM as an ingredient of feed formulations regardless of animal specie These nonshynutritional factors were judged to be more important than nutritional factors in selecting CSM as a feed ingredient Unfortunately neither the price nor the availability of CSM can be controlled or altered substantially or directly by market expansion efforts Some efforts to improve availability may be possible as discussed in the next section
bull CSM is perceived to be inferior in an overall sense to a number of key protein feeds CSM was judged by the survey respondents to be clearly superior in aggregate to only 5 of 20 potential alternate protein feeds Such an image could work against efforts to expand CSM use
bull Gossypol level is one of the top reasons that CSM is not used more frequently particularly in non-ruminant feed rations The level of gossypol is a unique characteristic of CSM that obviously cannot be changed through market expansion activities
bull Several other specific characteristics of CSM would likely need to change for CSM to be selected more frequently as a feed ingredient including amino acid balance energy level aflatoxin level and protein quality As with gossypol changes in these characteristics are out of the realm of market expansion programs
bull Feed formulators generally lack adequate and reliable information on many factors which are crucial in efficient feed formulation and which likely have a significant impact on the choice of protein feedstuffs The use of CSM in livestock feed rations is likely restricted by the wide disparity in the perception of feed formulators regarding the appropriate levels of several key nutrition-related factors for specific livestock rations including energy levels fat levels gossypol levels and escape values (ruminants only) for cottonseed meal
bull Over 75 of dairy cattle feed formulators and nearly half of beef cattle feed formulators utilize whole fuzzy cottonseed to some extent in some of the feed rations they formulate Relatively few reported using utilizing both CSM and whole cottonseed in the same ration A main attraction of the use of whole fuzzy cottonseed as opposed to cottonseed meal is the fiber content Indeed the use of whole delinted cottonseed in cattle feed rations is much lower
28
Opportunities for Expanding Use of Cottonseed Meal
There are essentially only two basic tools to expand the market for any commodity l market development and 2) enhancing the efficiency of the marketing system Market development involves a wide range of activities including primarily new product development and product differentiation In new product development the effort is to develop new products or characteristics of products that appeal to different segments of consumers An example might be research leading to the elimination of gossypol in cottonseed meal which could further open up the non-ruminant feed industry to cottonseed meal
Product differentiation on the other hand encompasses those activities designed to create a user preference for or loyalty to a commodity Product differentiation occurs in two major forms 1) advertising and 2) variation in design and quality of product The primary purpose of advertising is to create user preference for a commodity and convince users of the superiority of a product over competing products Actual physical differences in the product are not necessary to successfully differentiate it from competing products It is sufficient only that users believe that some superiority exists Advertising often intends to create an image of superior quality because such images are harder to imitate or successfully counter than physically unique features Successful differentiation of a product means that users become less sensitive to price changes more willing to pay a higher price for the same quantity because they prefer the product and are loyal to it in the face of price increases In other words users are willing to pay more for the same amount because advertising if successful creates a preference for the product over competing products
Variations in quality and design are usually used along with advertising to differentiate the product of one seller from that of another Such variations are often necessary to help create the superior images desired andor attract new sets of consumers
Often barriers exist in a marketing system that hinder the efficient functioning of the market and restrict the flow of commodities from sellers to users Enhancing the efficiency of the marketing system through eliminating such barriers can lead to an expansion in the use of a commodity One of the primary requirements of an efficiently functioning market is that sellers and users possess adequate and accurate information regarding the product its characteristics availability sources uses and value among other things Inadequate or inaccurate information regarding a particular product and other market characteristics can divert demand to alternative products with which users may be more familiar regardless of whether or not those products are better in some sense
The concept and importance of enhancing market efficiency in this regard can be illustrated by comparing the flow of information about a product and market conditions with a radio broadcasting system The efficiency of such a system depends on how accurately the microphone and other equipment record sound how accurately and rapidly that sound is transmitted to a radio receiver and how accurately the receiver brings sound to the listener A breakdown anywhere along the line in that system will simply mean that the message of the broadcast does not get from the radio station to the listener Also if the message gets through but static interferes with the transmission the listener might only receive part of the message or a garbled message The listeners impressions and actions consequently might be quite different than if he had received the message intended In quite the same manner the flow of a commodity from producers to users is affected by how rapidly and accurately market information is evaluated and how accurately and rapidly this information is transmitted to and among producers and users Any breakdown or static in the system would result in a smaller and more obstructed flow of the commodity to users than if the market operated more efficiently
29
The survey results suggests possible opportunities for expanding CSM use through market development and enhancing market efficiency Market development opportunities may be limited because of the nature of the CSM supply situation Nevertheless expansion of CSM use is possible through a reduction in direct feeding of cottonseed so that opportunities for expanding use through market expansion efforts should not be discounted Efforts to enhance the adequacy and accuracy of information regarding the use of CSM as a feed ingredient however may well be the most effective means of promoting an expansion of use or enhancement of the value of CSM
Opportunities for Expansion through Market Development
Although many product development opportunities likely exist for CSM the survey basically focused on the image of CSM in the perception of feed formulators If a market development approach to expanding the use of CSM as an ingredient of animal feed formulations has any chance of success the survey results suggest that the following components of such a strategy will be crucial
bull Product quality and consistency and an improved image of availability must be the major targets of promotion efforts The survey responses across all animal types unequivocally indicated that these three factors are the prime considerations in making general decisions regarding dietary proteins for animal rations Price only becomes a factor in specific decisions regarding the particular protein feed to use to fill the dietary protein requirements of feed formulations after these general concerns are addressed Creating an image of quality consistency and availability for CSM is a necessary first step to expanding use and enhancing value
bull CSM use expansion efforts must focus to some extent on reducing the direct feeding of whole cottonseed to beef and dairy cattle Reductions in direct feeding is the only chance for an increase in supply of CSM to fuel expanded use in newer markets such as catfish and poultry feeding Also because beef and dairy cattle are major users of cottonseed meal a decrease in feeding of whole cottonseed in favor of CSM would significantly expand use
bull Separate CSM market promotion messages must be developed to address the very different needs and concerns of ruminant vs non-ruminant feed formulators The survey results clearly indicate that many nutritional and non-nutritional factors are more important for nonshyruminant feed formulators than for ruminant feed formulators and vice versa
bull The nutrition-related content of CSM market promotion messages must emphasize primarily positive aspects of CSM protein quality amino acid balance and amino acid availability as well as an accurate understanding of appropriate gossypol and aflatoxin levels Many of these factors however are more important for non-ruminant rather than ruminant feed formulators which must be accounted for in designing appropriate messages for feed formulators of each animal type
bull The non-nutrition-related content of CSM market promotion messages may well be the most important and must emphasize primarily the positive aspects of price availability consistency of quality and storability The survey results attached a relatively high level of importance also to nutrient guarantees Although not scoring particularly high in the responses services available from the CSM industry may also be a helpful component of CSM use promotion messages
30
Opportunities for Expansion through Market Emciency Enhancement
Even though some gains in CSM use and market value can reasonably be expected through market expansion efforts the cost involved could easily outweigh any benefits in terms of enhanced profits to the CSM industry Perhaps the most cost-effective appropriate and useful means of enhancing the use of CSM would be a strategy aimed at improving the level and accuracy of information available regarding CSM and its use Lack of information or misinformation can easily discourage feed formulators from using CSM in their feed formulations Strategies to enhance the quantity and accuracy of appropriate information can take on many forms from media advertising to market news letters Although it is beyond the scope of this study to develop alternative information strategies the results of this study clearly indicate a number of areas in which enhanced and more accurate information is a critical need These include the following
bull The overall quality of CSM The study suggests that the negative aspects of CSM are well known Less well known are the specific positive aspects of CSM that may give it an edge in some sense over other protein feeds
bull The ideal ratio of the price of CSM to other feeds like soybean meal The study results indicate that feed formulators may not be adequately informed about what the ideal market value of CSM is relative to soybean meal given the differences in feeding value As a consequence CSM may currently be less used in relation to soybean meal than current market price ratios suggest should be the case
bull Protein-related factors for CSM use in non-ruminant feeds These factors are a major concern in the decisions of feed formulators to include or exclude CSM in feed rations
bull The relationship of aflatoxin to CSM and the rumen degradability of CSM particularly for beef and dairy cattle feed formulators These were the nutritional factors of greatest concern to ruminant feed formulators in the decision to include CSM in their feed formulations
bull CSM price availability consistency and palatability These were indicated to be the most important non-nutritional factors affecting feed formulators decisions regarding whether or not to use CSM The study indicates that information on non-nutritional factors may be more important in the decision to use CSM over alternative feeds to fill dietary protein requirements of feed rations than information on nutritional factors
bull The feeding value of CSM relative to alternative protein feeds An accurate and detailed assessment of the extent to which CSM may be superior as an alternative to other standard protein feeds would help position CSM appropriately in the market
bull The appropriate and acceptable levels of several key parameters affecting the use of CSM in animal feed rations including energy levels fat levels gossypol levels and escape values (ruminants only) Feed formulators generally lack adequate and reliable information on these and likely other parameters not included in the study which are crucial in efficient feed formulation and which have a significant impact on the choice of protein feedstuffs Although it appears that nearly all feed formulators routinely perform crude protein analyses few perform analyses for aflatoxin gossypol fat fiber and other parameters Also CSM suppliers are apparently doing an inadequate job currently of providing such information to feed formulators
31
SOME CONCLUDING COMMENTS AND RECOMMENDATIONS
This study assessed the potential problems and opportunities for expanding the use of CSM through an analysis of the perceptions of feed formulators regarding the use of CSM as an animal feed ingredient The perceptions of feed formulators regarding CSM as a protein feed largely define the boundaries within which CSM use will be able to achieve any significant growth in the future Their perceptions right or wrong are the key to understanding not only the problems facing CSM use but also the opportunities
The general conclusion of the study is an obvious one the use of CSM in feed formulations faces some major challenges in the future Chief among these include a perception among feed formulators that price availability quality and other key CSM characteristics are often obstacles precluding increased use of CSM in their feed formulations Perhaps the most important implication of the study is that a serious lack of adequate and accurate information among feed formulators regarding the characteristics parameters value and other aspects of cottonseed meal use in animal feed rations may be seriously restricting the market opportunities for cottonseed meal U nfortunately the development of alternative strategies to expand the use of CSM and enhance the efficient functioning of CSM markets through more accurate and available information on all aspects of CSM use in feed formulations is beyond this study Nevertheless a few recommendations pertinent to the development of such alternative strategies are in order
bull Before adopting any approach to expand the use of CSM it would be useful first to conduct a detailed analysis of the costs and benefits involved Market promotion efforts through advertising can be extremely costly and yield relatively little Research has also shown that there is often a tremendous lag between advertising and promotion expenditures and any associated returns It could take years of investment in such market expansion efforts before an accurate measurement of the actual return on investment could even be attempted
bull Consider developing first a detailed plan for information dissemination to the feed industry regarding all appropriate aspects of CSM use in feed rations as determined in this study An important part of this process would be a comprehensive assessment of the information needs and the information resources readily available The gap discovered in this way between needs and resources will help set the research agenda for the industry to fill the critical existing information gaps
bull Initiate a study of final user attitudes and perceptions of CSM use as a guide to future market expansion efforts This study considered only the perceptions of feed formulators regarding the use of CSM But feed formulators are often not the final users Consulting nutritionists for example often include or exclude certain feeds and feed types from their formulations as requested by feed users At least a few of the respondents to the survey conducted for this study indicated that user preferences are major factors determining whether or not CSM is included in their feed formulations Indeed markets operate as the interaction of supply and demand to determine prices The preferences of final users ultimately will be expressed in the market values of any product in any market unless sufficient obstacles exist to prevent the market from functioning properly Therefore the real decision-makers in the use CSM in the market may well include many more individuals than adequately represented by feed formulators
32
REFERENCES
US Department of Agriculture (USDAa) Feed Situation and Outlook Report Economic Research Service FDS series various issues
US Department of Agriculture (USDA b) Oil Crops Situation and Outlook Yearbook Economic Research Service OCS Series various issues
Figure 1 Quantity of Oilseed Meals Fed to Livestock 194849 - 198590 (Average)
(1000 Tons)
25000 0-1-----------------------shy
20000 I-~
15000
10000
5000
o L 1 J tJ t tmiddotmiddotmiddot 1 oj 1 to bullbull 1 L_ n __LLL I 1 bullbull I V I
1948-49 1950-54 1955-59 1960-64 1965-69 1970-74 1975-79 1980-84 1985-90
(Years)
n iflu Soybean Meal bull Cottonseed Meal Other Oilseed Meals
Source USDA
c
8 c a CD
en ~
--I _ scg ~CD 01)-- en - () mg0 s 0
JCD enOJ CD_CD en 0
sCDCD 0 OJ shyo OJ r Jlt- 0 m CJ) 0 0lt o 0shyCD OJ J
~s ~m cpCJ) r co OJco ~m a
Figure 3 Price Premium (+) or Discount (-) of Cottonseed Meal Relative to Soybean Meal 1956-1990
~~ ~
o I ~ I I
-20 f---
-40
-60
1~1~1~1~1~1~1~1~1~1~1~1~1~1~1~1~1~1~
Cottonseed meal price is adjusted to a soybean meal protein equivalent basis
~I------------------------------------------------------
l l A
I~middotmiddot--- --------
Figure 4 Animal Species for which Respondents Formulate Feeds
DAIRY CATILE
BEEFCATILE
HORSES
SHEEP
BROILERS
LAYERS
OTHER
PETS
TURKEY
SWINE
CATFISH
210
21000
0 5 1000 15 20 25
Figure 5 Respondents Formulating Feeds for the Various Animal Species
0 20 40 60 80
Figure 6 Other Animal Species for Which Respondents Formulate Feeds
DAIRY CATTLE
BEEF CATTLE
HORSES
SHEEP
BROILERS
LAYERS
OTHER
PETS
TURKEY
SWINE
CATFISH
632
Exotics
Trout
Alligators
KOI
Breeding Hens
Wildlife
Rabbits
Avian
Shrimp
Salmon
Ducks
Fish
Gamebirds
Hybrid Bass
379
~--~----~--~----~----~--~----~--~----~--~
0 10 20 30 40 50
Figure 7 Respondent Feed Formulation Activities by State
( of Respondents)
o 00 middot15 16 -30 31 middot45Cgt 46 -60 61 - 75 - 76 -90
Table 8 Respondent Experience as an Animal Nutritionist
( of Respondents) 30 r---shy
25 t-middotmiddotmiddotmiddotmiddotmiddotmiddotmiddotmiddotmiddotmiddotmiddotmiddot-middot ---_ _
20 -_ -nNItshy
15
10
5
0 1-5 6-10 11-15 16-20 21-25 26-30 31-35 36-40 41-45
(Years Of Experience)
-it sa 0 m 8 l 0 CD l g
_ cc c -s CD CObull
-0 -s- 3 Dl ~ IJ CD (fJ
C 0 l C CD l -+
raquo Sl_ lt_ -+_ CD (fJ
Figure 10 Respondent Primary Feed Formulations
by Animal Type 1990 (Percent)
30 I--------------------------------------------------------shy
25 r- middotmiddotmiddotmiddotmiddotmiddot231middotmiddotmiddotmiddot
20
15
10
5
0 Beef Dairy Swine Poultry Horses Pets Aqua- Sheep Exotics
Cattle Cattle culture amp Goats
(Animal Type)
Figure 11 Percent of CSM and S8M Used in Formulations by Feed Manufacturer Respondents 1990
( of Average Feed Ration)
Figure 12 Tons of Feed Formulated by Feed Manufacturer Respondents 1990
65
91
6 9
17
Total Formulations Formulations With CSM
II Less than 200000 Tons
II 200000 - 400000 Tons bullbullbull I bullbullbullbullbullbull ~ 3 ~ 400000 - 600000 Tons
5 rn 600 000 - 800 000 Tonsru 1
[] 800000 - 1000000 Tons9 4
I ~ 1 More Than 1000000 Tons
Formulations With S8M
Figure 13 Percent middotof Beef Cattle Respondents Formulating CSM Feeds for Specific Beef Cattle Types
( of Respondents)
25 ~I------------------------------------------------------~
-Isectig Feedlot-II 223
20
15
10
5
0
bull Other
~ middotmiddotmiddotmiddotmiddotmiddotmiddot middotmiddot _middotmiddotmiddotmiddot-=middotmiddotmiddotccmiddotcmiddotmiddot
Brood Cows Bulls Calves Feeder Heifer Stocker
(Animal Type)
Figure 14 Percent of Dairy Cattle Respondents Formulating CSM Feeds for Specific Dairy Cattle Types
( of Respondents)
120 ----------------------
100 88
80
60
40
20
0 Calves Heifers Lactating Cows Dry Cows
(Animal Type)
Figure 1-5 Percent of Poultry Respondents Formulating CSM Feeds for Specific Poultry Types
( of Respondents)
OO~I--------------------------------------------~-
50 1-laquolaquolt--laquolaquolaquo -lt - lt - lt -lt laquo lt
44
40
30
20
10
0
f-
~laquolaquolaquolaquo
~laquolaquolaquolaquolaquolaquo
Broilers Layers Turkeys Breeding Flocks
(Animal Type)
Figure 16~ Combined Responses Months of the Year When CSM IS NOT Available
( of Respondents) 16 i ---
14 12~8
12
10
87373 7
6
4
2
0 ~~ ~s ~( ~( ~0( ~0(~~~ ~~ ~t ~1 u~ ~g n0~ ad-o N0~ ~a~
~Y ~o Q~lmiddotr
(Month)
Figure 17 Combined Responses Months of the Year When CSM Needs to Be Available
( of Respondents) 12 ---------------------------
10
8
6
4
2
0
goA 9
~ui ~s ~Ot X)Ot ~Ot X)Ot~0SV~0~~erl ~iSclt ~f ~~1 ~v~ ug ~o~ o~o NO~ co~0 0lt609 ~o
(Month)
Figure 18 Beef Cattle Responses Percent of Respondents Formulating Creep Feed for Calves or Supplements for Stockers
733
832
0 20 40 60 80 100 120
( of Respondents)
Figure 19 Beef Cattle Responses Protein-Related Factors Considered When Balancing Rations
Other Protein Factors 110
Rumen
Degradability 686
Crude Protein Level 161
Amino Acid
Values 42
( of Respondents)
Figure 21 Comparison of Responses Months When CSM Needs to Be Available
( of Respondents) 94 ---------------------------shy
92
9
88
86
84
82 8
78
76
74
72
7
68
66
~ euroI - It
64 -t----------------------------------- -----------t
JAN FEB MAR APR MAY JUN JUL AUG SEP OCT NOV DEC
(Month)
bull Beef Cattle -t Dairy Cattle ltgt Poultry Catfish
Figure 20 Comparison of Responses Months When CSM Is Not Available
( of Respondents)
16 t 15
14
13
12
11
10
9
8ltl amp
7
6
5 I JAN
I
FEB I
MAR I
APR I
MAY I
JUN I
JUL I
AUG SEP I
OCT NOV I
DEC
(Month)
bull Beef Cattle -t Dairy Cattle ltgt PouHry b Catfish
Figure 22 Comparison of Responses Analyses Routinely Performed
( of Respondents)
100~-----------------------------------------------
90
80
70
60
50
40
30
20
10
o I ~
AFLATOXIN C PROTEIN FAT FIBER GOSSYPOL OTHER NONE
(Analyses)
bull Beef Cattle Dairy Cattle o Poultry Catfish-t fj
Figure 23 Comparison of Responses Analytical Values Provided by Supplier
( of Respondents)
60shy
50
4)
30
20
10
o amp ~
AFLATOXIN C PROTEIN FAT FIBER GOSSYPOL OTHER NONE
(Analyses)
bull Beef Cattle -t Dairy cattle o Poultry b Catfish
Figure 24 Share of Cottonseed Use Crush vs Feed Use
( of Respondents)
100 I
90
CRUSH 80
70
60
50
40
30
20
FEED USE 10
o 1~ 1~ 1~ 1m 1m 1~ 1~ 1~ 1~ 1~ 1~ 1~ 1~ 1~
(Year)
Source USDAb
Table 1 Percentage of Beef Cattle Feeds Formula ted Table 2 CSM Feeds Formulated for Beef Cattle CSMmiddot Calvesmiddot
middotAverage Response Rate (feedlot=51 other=41) middotResponse Rate = 39
Table 3 CSM Feeds Formulated for Beef Cattle Table 4 CSM Feeds Formulated for Beef Cattle Stockersmiddot
middotResponse Rate = 40
Response Rate =37
Table 5 CSM Feeds Formulated for Beef Cattle Table 6 CSM Feeds Formulated for Beef Cattle
middotResponse Rate =33
middotResponse Rate = 37
Table 8 Percentage of Dairy Cattle Feeds Formulated CSM
Average Response Rate =88
middotResponse Rate = 37
Table 9 CSM Feeds Formulated for Dairy Cattle Table 10 CSM Feeds Formulated for Dairy Cattle
RespooseRate 24
middotResponse Rate = 34
Table 11 CSM Feeds Formulated for Dairy Cattle Table 12 CSM Feeds Formulated for Dairy Cattle
Response Rate = 31 Response Rate = 45
Table 13 Percentage of Poultry Feeds Formulated Using CSMmiddot
bullAverage Response Rate = 79
Table 14 Percentage of Catfish Feeds Formulated Using CSMmiddot
bullAverage Response Rate =67
Table 15 CSM Feeds Formulated for Catfishmiddot )middoti middot fteq~
bullAverage Response Rate = 17
Table 16 Combined Responses Importance of Specific Factors in Choice of Dietary Protein ( of
bullAverage Response Rate =g]
Table 17 Combined Responses Other Important Factors in
bullAverage Response Rate = 22
bullAverage Response Rate =91
-Average Response Rate =90
Table 20 Combined Responses Importance of Non - Nutrition -Related Factors in Choice of CSM over Alternative Protein Feeds ( of
-Average Response Rate = 87
Table 22 Combined Responses Top S Reasons Why CSM IS NOT Selected as a Feed
Table 23 Combined Responses Top 5 Specific Characteristics That Would Have to Change for CSM to be Selected as a Feed
Table 24 Combined Responses Analysis Routinely Performed
Table 25 Combined Responses Analysis Values Provided
CSM
267 067 333 333 1400 S333
467 000 067 067 1400 4867 --shy
467 000 000 067 400 4333 --shy -- shy -- shy
250 000 000 000 1250 4000 -- shy --shy
313R 4733 62 ------ shy~ - shy ~-
4S00 62
bullAverage Response Rate = 100
bullAverage Response Rate = 87
Table 28 Beef Cattle Responses Imponance of Nutrition-Related Factors in Choice of CSM Over Alternative Protein Feeds
Average Response Rate = 91
Table 29 Beef Cattle Responses Other Nutrition - Related
Fact~~~~~~~~~~~~~~~~~~~
Response Rate =7
Table 30 Beef Cattle Responses Imponance of Non - Nutrition - Related Factors in Choice of CSM Over Alternative Protein Feeds
middotAverage Response Rate = 87
middotResponse Rate = 5
bullAverage Response Rate =14
Table 33 Beef Cattle Responses Months of the Year When CSM Needs to Be AvaiJable I ii middot middot1
bullAverage Response Rate =53
10 U
-Moy
JIIJ
All
so
0_ -
to
--I No
Moy
10 -so shy
0_ _ 0-
Table 35 Beef Cattle Responses Top 5 Reasons Why CSM Is Not Selected as a Feed
Average Response Rate =100 Response Rate = 24
Response Rate =28
Average Response Rate = 98
Response Rate = 17
middotResponse Rate =9
Table 43 Beef cattle Responses Type of Creep Feed
middotResponse Rate = 81
middotResponse Rate =26
Table 45 Beef cattle Responses Respondents Formulating Rations With CSM and Whole
middotResponse Rate = 68
Table 47 Beef cattle Responses Percentage of Whole Cottonseed Respondents Mix in Rations Containing Both CSM and Whole Cottonseedmiddot tCmiddotHiitjt~ middotmiddotmiddotmiddot1
middotResponse Rate =25
middotResponse Rate = 30
bull Response Rate = 98
Response Rate =11
Table 51 Beef Cattle Responses Escape Value Respondents Are Using for Rumen Degradabilitymiddot
1~iiii middotb~r~~fgtD zq436imiddotmiddotmiddotmiddotmiddotmiddotmiddot 004bullbullbullbullbullbullbullbullbullbull1----22--+----31-4
I~~I 23 329
middotResponse Rate = 57
Table 53 Beef Cattle Responses Methods or Sources Respondents Used to Calculate CSM
Table 52 Beef Cattle Responses Reliability of Escape Values Used
Table 54 Beef Cattle Responses Interested in Knowing Escape Values for CSM Processed
Valuemiddot
middotResponse Rate =98
)
I Mean ~nse
63 57S19 228381 Q-L_uu ~139 59468 32306 139bullII1 1 061 06
1 1 44 430 614431-------- 57t 001 001 middot-1
==~=-__~~1c9 00 _ 06 _ 001_ 38 133 323 63
Average Response Rate =100
Response Rate = 89
Table 58 Dairy Cattle Responses Importance of Nutrition - Related Factors in Choice ofCSM Over Alternative Protein Feeds (ofbmiddotNmiddotmiddotmiddotmiddotmiddotmiddot
Response Rate =88
Table 59 Dairy Cattle Responses Other Nutrition-Related Factors
Indicated br~~P211dents
Response Rate =10
Table 60 Dairy Cattle Responses Importance of Non- Nutrition - Related Factors in Choice of CSM Over Alternative
Protein Feeds ( ofResPOndents~dd
Response Rate = 88
Response Rate = 3
--
Average Response Rate = 51
Table 62 Dairy Cattle Responses Months in the Year When CSM IS NOT Available
10 u
J -- AIIIi
--~ shy
loOoIMr _ 0-
bullAverage Response Rate =69
--- AIIIi
--~ soM
0
0-_
10
Table 65 Dairy Cattle Responses Top 5 Reasons Why CSM IS NOT Selected as a Peed
Table 66 Dairy Cattle Responses Top 5 Specific Characteristics That Would Have to ro1 ____ for CSM to be Selected as a Feed
Table 67 Dairy Cattle Responses Analyses Routinely Performed fmiddotmiddotmiddotmiddot
Response Rate =96
Response Rate =56
Table 68 Dairy Cattle Responses Other Analyses
Response Rate =25
Table 70 Dairy Cattle Other Analytical Values CSM
Response Rate =4
Average Response Rate =81
Average Response Rate = 15
Table 73 Dairy Cattle Responses Respondents Formulating Feeds With Whole andor Delinted
Cottonseed bull
bullAverage Response Rate =92
middotResponse Rate = 40
Table 74 Dairy Cattle Responses Respondents Formulating Rations with Cottonseed Meal and Whole Cottonseed in the Same Rationmiddot
middotResponse Rate = 97
Table 76 Dairy Cattle Responses Percentage of Whole Cottonseed Respondents Mix in Rations
ltltJIltainin(a0th CSM and WhoeCottonseedmiddot Mean
middotResponse Rate = 42
Table 77 Dairy Cattle Responses Knowledge of Research on Feedine CSM
~~~~
Average Response Rate = 68
Response Rate =7
Average Response Rate =59
Response Rate =25
Average Response Rate =63
Response Rate = 13
middotResponse Rate = 92
Response Rate =82
Table 85 Dairy Cattle Responses Methods or Sources Used to Calculate CSM
Response Rate = 73
Table 86 Dairy Cattle Responses Respondents Interested in Knowing Escape Values for CSM Processed from Different Methodsmiddot fmiddotmiddotmiddotmiddotmiddotmiddot
Response Rate = 92
Response Rate = 34
Table 89 Dairy Cattle Responses Suggestions for CSM
Response Rate =33 Response Rate =22
-----
64 139 24815 00 36 511 5751
5951 131 438 35015 00 15 I-~~~~~
6200 15 423 51151 00 00 ~~~ -~~~ -~~~ ~~~-~~ --~~ ~ ~ ~~-~ ~
292 55125 00 00 125 45800
bullAverage Response Rate =99
Average Response Rate =85
Table 92 Poultry Responses Importance of Nutrition - Related Factors in Choice of CSM Over Alternative Protein Feeds (of
Average Response Rate =85
Table 93 Poultry Responses Other Nutrition-Related Factors Indicated
200
200
Response Rate = 5
Table 94 Poultry Responses Importance of Non - Nutrition - Related Factors in Choice of CSM Over Alternative Protein
Feeds~~~~~~~~~~5=~~~~~T7~~
00 Average Response Rate =83
Response Rate =4
Average Response Rate = 17
Table 97 Poultry Responses Months in the
J
p
April
lao
A
shy-- 0
ft
April
_
Average Response Rate = 43
=1 g L
0
Table 99 Poultry Responses Top 5 Reasons Why CSM IS NOT Selected as a Feed
Table 100 Poultry Responses Top 5 Specific Characteristics That Would Have to Change for
CSM to be Selected as a Feed Inoredient
Table 101 Poultry Responses Analyses Routinely
middotResponse Rate = 93
Table 102 Poultry Responses Other Analyses Routinely
Performed
middotResponse Rate = 27
Table 103 Poultry Responses Analytical Values Provided
middotResponse Rate =73
Table 104 Poultry Responses Knowledge of Problems
bullAverage Response Rate = 62
Average Response Rate = 14
Table 106 Poultry Responses Protein - Related Factors
Average Response Rate = 64
Table 107 Poultry Responses Other Protein - Related
Response Rate =11
Table 108 Poultry Responses Crude Protein Levels
Preferred for CSM
Response Rate = 55
Table 111 Poultry Responses Gossypol Levels Considered
Safe
Table 112 Poultry Responses Would or Do Use Table 113 Poultry Responses Relative Feeding Value of CSM Comoared to 44 SBMmiddot
middotResponse Rate = 96
bull Response Rate = 100
Table 114 Poultry Responses Knowledge of Table 115 Poultry Responses Familiarity with Other Feedino CSMmiddot
middotResponse Rate =7 bull Response Rate = 73
middotResponseRate = 31
bullAverage Response Rate = 58
Table 118 Poultry Responses Willingness to Pay
a Premium Per Unit of Protein for CSM With More
Than 41 Protein
bullResponse Rate =91
Table 119 Poultry Responses Percent of Cost of SBM Respondents Willing to Pay for CSM with
Response Rate =27
Response Rate =64
00 00 87 43 478 304 57 00 00
----shy I--~~
00 ~-~
43 522 348 59 ----shy
62~ 00 00 00 261 ----shy
652 ------shy
00 00 00 00 667 333 63 AverageResponseRate = 99
bullAverage Response Rate = 73
Table 123 Catfish Responses Importance of Nutrition - Related Factors in Choice of CSM Over Alternative Protein Feeds
Average Response Rate =83
Table 124 Catfish Responses Importance of Non- Nutrition - Related Factors in Choice of CSM Over Alternative Protein
Feeds
Average Response Rate = 90
bullAverage Response Rate = 13
Igt 20
s_
Pshy s
--s
H_
_
gt 7 bull bull bull bull bull
1 fsI plusmn -
haMr
N__
shy
bullAverage Response Rate =54
Table 128 Catfish Responses Top 5 Reasons Why CSM IS NOT Selected as a Feed
Table 129 Catfish Responses Top 5 Specific Characteristics That Would Have to Change for CSM to Be Selected as a Feed-_
Table 130 Catfish Responses Analyses Routinely Table 131 Catfish Responses Other Analyses Routinely Performed
middotResponse Rate = 25
middotResponse Rate =92
bullAverage Response Rate = 18
Table 133 Catfish Responses Knowledge of Problems Feedine CSM to CatflSh
Average Response Rate =100
Table 134 Catfish Responses Protein - Related Factors Considered i
Response Rate = 83
Table 135 Catfish Responses Crude Protein Levels Preferred for CSM
Response Rate = 100
Table 139 Catfish Responses Would or Do Use Table 140 Catfish Responses Relative Feeding
Value ofCSM Compared to 44~ Lmiddotmiddotmiddotmiddotmiddotmiddotmiddotmiddotmiddotmiddotmiddotmiddotmiddotmiddotmiddotmiddotmiddotmiddotmiddot _
Response Rate = 100
Response Rate = 100
Table 141 Catfish Responses Knowledge of Research on Table 142 Catfish Responses Sources ofInformation
Average Response Rate = 83
bullAverage Response Rate = 44
Table 143 Catfish Responses Willingness to Pay A Premium Per Unit of Protein for CSM with More Than
middotResponse Rate = 100
Table 144 Catfish Responses Percent of Cost of SBM Respondents Willing to Pay for CSM with Sufficiently Low Goscvnol and Fiber Levelsmiddot
middotResponse Rate = 83
middotResponse Rate = 25
Table 146 Comparison of Mean Responses and Analysis of Variance (ANOVA) Importance of Specific
bull Scale of 1 (extremely unimportant) to 7 (extremely important) for the mean ranking a Mean significantly larger across animal types at the 5 significance level otherwise no difference b Mean significantly lower across animal types at the 5 significance level otherwise no difference
Table 147 Comparison of Mean Responses and Analysis of Variance (ANOVA) Ranking of Other Protein
bull Scale of 1 (CSM inferior to respective feed) to 7 (CSM superior to respective feed) for the mean ranking
a Mean significantly larger across animal types at the 5 significance level otherwise no difference
b Mean significantly lower across animal types at the 5 significance level otherwise no difference
Table 148 Comparison ofMean Responses and Analysis of Variance (ANOVA) Importance of Nutritionshy
Related Factors in Choice ofCSM Over Alternativesmiddot
bull Scale of 1 (extremely unimportant) to 7 (extremely important) for the mean ranking a Mean significantly larger across animal types at the 5 significance level otherwise no difference
b Mean significantly lower across animal types at the 5 significance level otherwise no difference
Table 149 Comparison of Mean Responses and Analysis of Variance (ANOVA) Importance of Nonshy
Nutrition- Related Factors in Choice of CSM Over Alternativesmiddot
bull Scale of 1 (extremely unimportant) to 7 (extremely important) for the mean ranking
a Mean significantly larger across animal types at the 5 significance level otherwise no difference
b Mean significantly lower across animal types at the 5 significance level otherwise no difference
- = Not mentioned or ranked lower than 4th place
Table 151 Comparison of Responses Top Responses Why CSM IS NOT Selected as a Feed
- = Not mentioned or ranked lower than 5th place
Table 152 Comparison of Responses Top Characteristics that Have to Change for CSM to Be
- = Not mentioned or ranked lower than 5th place

30
Opportunities for Expansion through Market Emciency Enhancement
Even though some gains in CSM use and market value can reasonably be expected through market expansion efforts the cost involved could easily outweigh any benefits in terms of enhanced profits to the CSM industry Perhaps the most cost-effective appropriate and useful means of enhancing the use of CSM would be a strategy aimed at improving the level and accuracy of information available regarding CSM and its use Lack of information or misinformation can easily discourage feed formulators from using CSM in their feed formulations Strategies to enhance the quantity and accuracy of appropriate information can take on many forms from media advertising to market news letters Although it is beyond the scope of this study to develop alternative information strategies the results of this study clearly indicate a number of areas in which enhanced and more accurate information is a critical need These include the following
bull The overall quality of CSM The study suggests that the negative aspects of CSM are well known Less well known are the specific positive aspects of CSM that may give it an edge in some sense over other protein feeds
bull The ideal ratio of the price of CSM to other feeds like soybean meal The study results indicate that feed formulators may not be adequately informed about what the ideal market value of CSM is relative to soybean meal given the differences in feeding value As a consequence CSM may currently be less used in relation to soybean meal than current market price ratios suggest should be the case
bull Protein-related factors for CSM use in non-ruminant feeds These factors are a major concern in the decisions of feed formulators to include or exclude CSM in feed rations
bull The relationship of aflatoxin to CSM and the rumen degradability of CSM particularly for beef and dairy cattle feed formulators These were the nutritional factors of greatest concern to ruminant feed formulators in the decision to include CSM in their feed formulations
bull CSM price availability consistency and palatability These were indicated to be the most important non-nutritional factors affecting feed formulators decisions regarding whether or not to use CSM The study indicates that information on non-nutritional factors may be more important in the decision to use CSM over alternative feeds to fill dietary protein requirements of feed rations than information on nutritional factors
bull The feeding value of CSM relative to alternative protein feeds An accurate and detailed assessment of the extent to which CSM may be superior as an alternative to other standard protein feeds would help position CSM appropriately in the market
bull The appropriate and acceptable levels of several key parameters affecting the use of CSM in animal feed rations including energy levels fat levels gossypol levels and escape values (ruminants only) Feed formulators generally lack adequate and reliable information on these and likely other parameters not included in the study which are crucial in efficient feed formulation and which have a significant impact on the choice of protein feedstuffs Although it appears that nearly all feed formulators routinely perform crude protein analyses few perform analyses for aflatoxin gossypol fat fiber and other parameters Also CSM suppliers are apparently doing an inadequate job currently of providing such information to feed formulators
31
SOME CONCLUDING COMMENTS AND RECOMMENDATIONS
This study assessed the potential problems and opportunities for expanding the use of CSM through an analysis of the perceptions of feed formulators regarding the use of CSM as an animal feed ingredient The perceptions of feed formulators regarding CSM as a protein feed largely define the boundaries within which CSM use will be able to achieve any significant growth in the future Their perceptions right or wrong are the key to understanding not only the problems facing CSM use but also the opportunities
The general conclusion of the study is an obvious one the use of CSM in feed formulations faces some major challenges in the future Chief among these include a perception among feed formulators that price availability quality and other key CSM characteristics are often obstacles precluding increased use of CSM in their feed formulations Perhaps the most important implication of the study is that a serious lack of adequate and accurate information among feed formulators regarding the characteristics parameters value and other aspects of cottonseed meal use in animal feed rations may be seriously restricting the market opportunities for cottonseed meal U nfortunately the development of alternative strategies to expand the use of CSM and enhance the efficient functioning of CSM markets through more accurate and available information on all aspects of CSM use in feed formulations is beyond this study Nevertheless a few recommendations pertinent to the development of such alternative strategies are in order
bull Before adopting any approach to expand the use of CSM it would be useful first to conduct a detailed analysis of the costs and benefits involved Market promotion efforts through advertising can be extremely costly and yield relatively little Research has also shown that there is often a tremendous lag between advertising and promotion expenditures and any associated returns It could take years of investment in such market expansion efforts before an accurate measurement of the actual return on investment could even be attempted
bull Consider developing first a detailed plan for information dissemination to the feed industry regarding all appropriate aspects of CSM use in feed rations as determined in this study An important part of this process would be a comprehensive assessment of the information needs and the information resources readily available The gap discovered in this way between needs and resources will help set the research agenda for the industry to fill the critical existing information gaps
bull Initiate a study of final user attitudes and perceptions of CSM use as a guide to future market expansion efforts This study considered only the perceptions of feed formulators regarding the use of CSM But feed formulators are often not the final users Consulting nutritionists for example often include or exclude certain feeds and feed types from their formulations as requested by feed users At least a few of the respondents to the survey conducted for this study indicated that user preferences are major factors determining whether or not CSM is included in their feed formulations Indeed markets operate as the interaction of supply and demand to determine prices The preferences of final users ultimately will be expressed in the market values of any product in any market unless sufficient obstacles exist to prevent the market from functioning properly Therefore the real decision-makers in the use CSM in the market may well include many more individuals than adequately represented by feed formulators
32
REFERENCES
US Department of Agriculture (USDAa) Feed Situation and Outlook Report Economic Research Service FDS series various issues
US Department of Agriculture (USDA b) Oil Crops Situation and Outlook Yearbook Economic Research Service OCS Series various issues
Figure 1 Quantity of Oilseed Meals Fed to Livestock 194849 - 198590 (Average)
(1000 Tons)
25000 0-1-----------------------shy
20000 I-~
15000
10000
5000
o L 1 J tJ t tmiddotmiddotmiddot 1 oj 1 to bullbull 1 L_ n __LLL I 1 bullbull I V I
1948-49 1950-54 1955-59 1960-64 1965-69 1970-74 1975-79 1980-84 1985-90
(Years)
n iflu Soybean Meal bull Cottonseed Meal Other Oilseed Meals
Source USDA
c
8 c a CD
en ~
--I _ scg ~CD 01)-- en - () mg0 s 0
JCD enOJ CD_CD en 0
sCDCD 0 OJ shyo OJ r Jlt- 0 m CJ) 0 0lt o 0shyCD OJ J
~s ~m cpCJ) r co OJco ~m a
Figure 3 Price Premium (+) or Discount (-) of Cottonseed Meal Relative to Soybean Meal 1956-1990
~~ ~
o I ~ I I
-20 f---
-40
-60
1~1~1~1~1~1~1~1~1~1~1~1~1~1~1~1~1~1~
Cottonseed meal price is adjusted to a soybean meal protein equivalent basis
~I------------------------------------------------------
l l A
I~middotmiddot--- --------
Figure 4 Animal Species for which Respondents Formulate Feeds
DAIRY CATILE
BEEFCATILE
HORSES
SHEEP
BROILERS
LAYERS
OTHER
PETS
TURKEY
SWINE
CATFISH
210
21000
0 5 1000 15 20 25
Figure 5 Respondents Formulating Feeds for the Various Animal Species
0 20 40 60 80
Figure 6 Other Animal Species for Which Respondents Formulate Feeds
DAIRY CATTLE
BEEF CATTLE
HORSES
SHEEP
BROILERS
LAYERS
OTHER
PETS
TURKEY
SWINE
CATFISH
632
Exotics
Trout
Alligators
KOI
Breeding Hens
Wildlife
Rabbits
Avian
Shrimp
Salmon
Ducks
Fish
Gamebirds
Hybrid Bass
379
~--~----~--~----~----~--~----~--~----~--~
0 10 20 30 40 50
Figure 7 Respondent Feed Formulation Activities by State
( of Respondents)
o 00 middot15 16 -30 31 middot45Cgt 46 -60 61 - 75 - 76 -90
Table 8 Respondent Experience as an Animal Nutritionist
( of Respondents) 30 r---shy
25 t-middotmiddotmiddotmiddotmiddotmiddotmiddotmiddotmiddotmiddotmiddotmiddotmiddot-middot ---_ _
20 -_ -nNItshy
15
10
5
0 1-5 6-10 11-15 16-20 21-25 26-30 31-35 36-40 41-45
(Years Of Experience)
-it sa 0 m 8 l 0 CD l g
_ cc c -s CD CObull
-0 -s- 3 Dl ~ IJ CD (fJ
C 0 l C CD l -+
raquo Sl_ lt_ -+_ CD (fJ
Figure 10 Respondent Primary Feed Formulations
by Animal Type 1990 (Percent)
30 I--------------------------------------------------------shy
25 r- middotmiddotmiddotmiddotmiddotmiddot231middotmiddotmiddotmiddot
20
15
10
5
0 Beef Dairy Swine Poultry Horses Pets Aqua- Sheep Exotics
Cattle Cattle culture amp Goats
(Animal Type)
Figure 11 Percent of CSM and S8M Used in Formulations by Feed Manufacturer Respondents 1990
( of Average Feed Ration)
Figure 12 Tons of Feed Formulated by Feed Manufacturer Respondents 1990
65
91
6 9
17
Total Formulations Formulations With CSM
II Less than 200000 Tons
II 200000 - 400000 Tons bullbullbull I bullbullbullbullbullbull ~ 3 ~ 400000 - 600000 Tons
5 rn 600 000 - 800 000 Tonsru 1
[] 800000 - 1000000 Tons9 4
I ~ 1 More Than 1000000 Tons
Formulations With S8M
Figure 13 Percent middotof Beef Cattle Respondents Formulating CSM Feeds for Specific Beef Cattle Types
( of Respondents)
25 ~I------------------------------------------------------~
-Isectig Feedlot-II 223
20
15
10
5
0
bull Other
~ middotmiddotmiddotmiddotmiddotmiddotmiddot middotmiddot _middotmiddotmiddotmiddot-=middotmiddotmiddotccmiddotcmiddotmiddot
Brood Cows Bulls Calves Feeder Heifer Stocker
(Animal Type)
Figure 14 Percent of Dairy Cattle Respondents Formulating CSM Feeds for Specific Dairy Cattle Types
( of Respondents)
120 ----------------------
100 88
80
60
40
20
0 Calves Heifers Lactating Cows Dry Cows
(Animal Type)
Figure 1-5 Percent of Poultry Respondents Formulating CSM Feeds for Specific Poultry Types
( of Respondents)
OO~I--------------------------------------------~-
50 1-laquolaquolt--laquolaquolaquo -lt - lt - lt -lt laquo lt
44
40
30
20
10
0
f-
~laquolaquolaquolaquo
~laquolaquolaquolaquolaquolaquo
Broilers Layers Turkeys Breeding Flocks
(Animal Type)
Figure 16~ Combined Responses Months of the Year When CSM IS NOT Available
( of Respondents) 16 i ---
14 12~8
12
10
87373 7
6
4
2
0 ~~ ~s ~( ~( ~0( ~0(~~~ ~~ ~t ~1 u~ ~g n0~ ad-o N0~ ~a~
~Y ~o Q~lmiddotr
(Month)
Figure 17 Combined Responses Months of the Year When CSM Needs to Be Available
( of Respondents) 12 ---------------------------
10
8
6
4
2
0
goA 9
~ui ~s ~Ot X)Ot ~Ot X)Ot~0SV~0~~erl ~iSclt ~f ~~1 ~v~ ug ~o~ o~o NO~ co~0 0lt609 ~o
(Month)
Figure 18 Beef Cattle Responses Percent of Respondents Formulating Creep Feed for Calves or Supplements for Stockers
733
832
0 20 40 60 80 100 120
( of Respondents)
Figure 19 Beef Cattle Responses Protein-Related Factors Considered When Balancing Rations
Other Protein Factors 110
Rumen
Degradability 686
Crude Protein Level 161
Amino Acid
Values 42
( of Respondents)
Figure 21 Comparison of Responses Months When CSM Needs to Be Available
( of Respondents) 94 ---------------------------shy
92
9
88
86
84
82 8
78
76
74
72
7
68
66
~ euroI - It
64 -t----------------------------------- -----------t
JAN FEB MAR APR MAY JUN JUL AUG SEP OCT NOV DEC
(Month)
bull Beef Cattle -t Dairy Cattle ltgt Poultry Catfish
Figure 20 Comparison of Responses Months When CSM Is Not Available
( of Respondents)
16 t 15
14
13
12
11
10
9
8ltl amp
7
6
5 I JAN
I
FEB I
MAR I
APR I
MAY I
JUN I
JUL I
AUG SEP I
OCT NOV I
DEC
(Month)
bull Beef Cattle -t Dairy Cattle ltgt PouHry b Catfish
Figure 22 Comparison of Responses Analyses Routinely Performed
( of Respondents)
100~-----------------------------------------------
90
80
70
60
50
40
30
20
10
o I ~
AFLATOXIN C PROTEIN FAT FIBER GOSSYPOL OTHER NONE
(Analyses)
bull Beef Cattle Dairy Cattle o Poultry Catfish-t fj
Figure 23 Comparison of Responses Analytical Values Provided by Supplier
( of Respondents)
60shy
50
4)
30
20
10
o amp ~
AFLATOXIN C PROTEIN FAT FIBER GOSSYPOL OTHER NONE
(Analyses)
bull Beef Cattle -t Dairy cattle o Poultry b Catfish
Figure 24 Share of Cottonseed Use Crush vs Feed Use
( of Respondents)
100 I
90
CRUSH 80
70
60
50
40
30
20
FEED USE 10
o 1~ 1~ 1~ 1m 1m 1~ 1~ 1~ 1~ 1~ 1~ 1~ 1~ 1~
(Year)
Source USDAb
Table 1 Percentage of Beef Cattle Feeds Formula ted Table 2 CSM Feeds Formulated for Beef Cattle CSMmiddot Calvesmiddot
middotAverage Response Rate (feedlot=51 other=41) middotResponse Rate = 39
Table 3 CSM Feeds Formulated for Beef Cattle Table 4 CSM Feeds Formulated for Beef Cattle Stockersmiddot
middotResponse Rate = 40
Response Rate =37
Table 5 CSM Feeds Formulated for Beef Cattle Table 6 CSM Feeds Formulated for Beef Cattle
middotResponse Rate =33
middotResponse Rate = 37
Table 8 Percentage of Dairy Cattle Feeds Formulated CSM
Average Response Rate =88
middotResponse Rate = 37
Table 9 CSM Feeds Formulated for Dairy Cattle Table 10 CSM Feeds Formulated for Dairy Cattle
RespooseRate 24
middotResponse Rate = 34
Table 11 CSM Feeds Formulated for Dairy Cattle Table 12 CSM Feeds Formulated for Dairy Cattle
Response Rate = 31 Response Rate = 45
Table 13 Percentage of Poultry Feeds Formulated Using CSMmiddot
bullAverage Response Rate = 79
Table 14 Percentage of Catfish Feeds Formulated Using CSMmiddot
bullAverage Response Rate =67
Table 15 CSM Feeds Formulated for Catfishmiddot )middoti middot fteq~
bullAverage Response Rate = 17
Table 16 Combined Responses Importance of Specific Factors in Choice of Dietary Protein ( of
bullAverage Response Rate =g]
Table 17 Combined Responses Other Important Factors in
bullAverage Response Rate = 22
bullAverage Response Rate =91
-Average Response Rate =90
Table 20 Combined Responses Importance of Non - Nutrition -Related Factors in Choice of CSM over Alternative Protein Feeds ( of
-Average Response Rate = 87
Table 22 Combined Responses Top S Reasons Why CSM IS NOT Selected as a Feed
Table 23 Combined Responses Top 5 Specific Characteristics That Would Have to Change for CSM to be Selected as a Feed
Table 24 Combined Responses Analysis Routinely Performed
Table 25 Combined Responses Analysis Values Provided
CSM
267 067 333 333 1400 S333
467 000 067 067 1400 4867 --shy
467 000 000 067 400 4333 --shy -- shy -- shy
250 000 000 000 1250 4000 -- shy --shy
313R 4733 62 ------ shy~ - shy ~-
4S00 62
bullAverage Response Rate = 100
bullAverage Response Rate = 87
Table 28 Beef Cattle Responses Imponance of Nutrition-Related Factors in Choice of CSM Over Alternative Protein Feeds
Average Response Rate = 91
Table 29 Beef Cattle Responses Other Nutrition - Related
Fact~~~~~~~~~~~~~~~~~~~
Response Rate =7
Table 30 Beef Cattle Responses Imponance of Non - Nutrition - Related Factors in Choice of CSM Over Alternative Protein Feeds
middotAverage Response Rate = 87
middotResponse Rate = 5
bullAverage Response Rate =14
Table 33 Beef Cattle Responses Months of the Year When CSM Needs to Be AvaiJable I ii middot middot1
bullAverage Response Rate =53
10 U
-Moy
JIIJ
All
so
0_ -
to
--I No
Moy
10 -so shy
0_ _ 0-
Table 35 Beef Cattle Responses Top 5 Reasons Why CSM Is Not Selected as a Feed
Average Response Rate =100 Response Rate = 24
Response Rate =28
Average Response Rate = 98
Response Rate = 17
middotResponse Rate =9
Table 43 Beef cattle Responses Type of Creep Feed
middotResponse Rate = 81
middotResponse Rate =26
Table 45 Beef cattle Responses Respondents Formulating Rations With CSM and Whole
middotResponse Rate = 68
Table 47 Beef cattle Responses Percentage of Whole Cottonseed Respondents Mix in Rations Containing Both CSM and Whole Cottonseedmiddot tCmiddotHiitjt~ middotmiddotmiddotmiddot1
middotResponse Rate =25
middotResponse Rate = 30
bull Response Rate = 98
Response Rate =11
Table 51 Beef Cattle Responses Escape Value Respondents Are Using for Rumen Degradabilitymiddot
1~iiii middotb~r~~fgtD zq436imiddotmiddotmiddotmiddotmiddotmiddotmiddot 004bullbullbullbullbullbullbullbullbullbull1----22--+----31-4
I~~I 23 329
middotResponse Rate = 57
Table 53 Beef Cattle Responses Methods or Sources Respondents Used to Calculate CSM
Table 52 Beef Cattle Responses Reliability of Escape Values Used
Table 54 Beef Cattle Responses Interested in Knowing Escape Values for CSM Processed
Valuemiddot
middotResponse Rate =98
)
I Mean ~nse
63 57S19 228381 Q-L_uu ~139 59468 32306 139bullII1 1 061 06
1 1 44 430 614431-------- 57t 001 001 middot-1
==~=-__~~1c9 00 _ 06 _ 001_ 38 133 323 63
Average Response Rate =100
Response Rate = 89
Table 58 Dairy Cattle Responses Importance of Nutrition - Related Factors in Choice ofCSM Over Alternative Protein Feeds (ofbmiddotNmiddotmiddotmiddotmiddotmiddotmiddot
Response Rate =88
Table 59 Dairy Cattle Responses Other Nutrition-Related Factors
Indicated br~~P211dents
Response Rate =10
Table 60 Dairy Cattle Responses Importance of Non- Nutrition - Related Factors in Choice of CSM Over Alternative
Protein Feeds ( ofResPOndents~dd
Response Rate = 88
Response Rate = 3
--
Average Response Rate = 51
Table 62 Dairy Cattle Responses Months in the Year When CSM IS NOT Available
10 u
J -- AIIIi
--~ shy
loOoIMr _ 0-
bullAverage Response Rate =69
--- AIIIi
--~ soM
0
0-_
10
Table 65 Dairy Cattle Responses Top 5 Reasons Why CSM IS NOT Selected as a Peed
Table 66 Dairy Cattle Responses Top 5 Specific Characteristics That Would Have to ro1 ____ for CSM to be Selected as a Feed
Table 67 Dairy Cattle Responses Analyses Routinely Performed fmiddotmiddotmiddotmiddot
Response Rate =96
Response Rate =56
Table 68 Dairy Cattle Responses Other Analyses
Response Rate =25
Table 70 Dairy Cattle Other Analytical Values CSM
Response Rate =4
Average Response Rate =81
Average Response Rate = 15
Table 73 Dairy Cattle Responses Respondents Formulating Feeds With Whole andor Delinted
Cottonseed bull
bullAverage Response Rate =92
middotResponse Rate = 40
Table 74 Dairy Cattle Responses Respondents Formulating Rations with Cottonseed Meal and Whole Cottonseed in the Same Rationmiddot
middotResponse Rate = 97
Table 76 Dairy Cattle Responses Percentage of Whole Cottonseed Respondents Mix in Rations
ltltJIltainin(a0th CSM and WhoeCottonseedmiddot Mean
middotResponse Rate = 42
Table 77 Dairy Cattle Responses Knowledge of Research on Feedine CSM
~~~~
Average Response Rate = 68
Response Rate =7
Average Response Rate =59
Response Rate =25
Average Response Rate =63
Response Rate = 13
middotResponse Rate = 92
Response Rate =82
Table 85 Dairy Cattle Responses Methods or Sources Used to Calculate CSM
Response Rate = 73
Table 86 Dairy Cattle Responses Respondents Interested in Knowing Escape Values for CSM Processed from Different Methodsmiddot fmiddotmiddotmiddotmiddotmiddotmiddot
Response Rate = 92
Response Rate = 34
Table 89 Dairy Cattle Responses Suggestions for CSM
Response Rate =33 Response Rate =22
-----
64 139 24815 00 36 511 5751
5951 131 438 35015 00 15 I-~~~~~
6200 15 423 51151 00 00 ~~~ -~~~ -~~~ ~~~-~~ --~~ ~ ~ ~~-~ ~
292 55125 00 00 125 45800
bullAverage Response Rate =99
Average Response Rate =85
Table 92 Poultry Responses Importance of Nutrition - Related Factors in Choice of CSM Over Alternative Protein Feeds (of
Average Response Rate =85
Table 93 Poultry Responses Other Nutrition-Related Factors Indicated
200
200
Response Rate = 5
Table 94 Poultry Responses Importance of Non - Nutrition - Related Factors in Choice of CSM Over Alternative Protein
Feeds~~~~~~~~~~5=~~~~~T7~~
00 Average Response Rate =83
Response Rate =4
Average Response Rate = 17
Table 97 Poultry Responses Months in the
J
p
April
lao
A
shy-- 0
ft
April
_
Average Response Rate = 43
=1 g L
0
Table 99 Poultry Responses Top 5 Reasons Why CSM IS NOT Selected as a Feed
Table 100 Poultry Responses Top 5 Specific Characteristics That Would Have to Change for
CSM to be Selected as a Feed Inoredient
Table 101 Poultry Responses Analyses Routinely
middotResponse Rate = 93
Table 102 Poultry Responses Other Analyses Routinely
Performed
middotResponse Rate = 27
Table 103 Poultry Responses Analytical Values Provided
middotResponse Rate =73
Table 104 Poultry Responses Knowledge of Problems
bullAverage Response Rate = 62
Average Response Rate = 14
Table 106 Poultry Responses Protein - Related Factors
Average Response Rate = 64
Table 107 Poultry Responses Other Protein - Related
Response Rate =11
Table 108 Poultry Responses Crude Protein Levels
Preferred for CSM
Response Rate = 55
Table 111 Poultry Responses Gossypol Levels Considered
Safe
Table 112 Poultry Responses Would or Do Use Table 113 Poultry Responses Relative Feeding Value of CSM Comoared to 44 SBMmiddot
middotResponse Rate = 96
bull Response Rate = 100
Table 114 Poultry Responses Knowledge of Table 115 Poultry Responses Familiarity with Other Feedino CSMmiddot
middotResponse Rate =7 bull Response Rate = 73
middotResponseRate = 31
bullAverage Response Rate = 58
Table 118 Poultry Responses Willingness to Pay
a Premium Per Unit of Protein for CSM With More
Than 41 Protein
bullResponse Rate =91
Table 119 Poultry Responses Percent of Cost of SBM Respondents Willing to Pay for CSM with
Response Rate =27
Response Rate =64
00 00 87 43 478 304 57 00 00
----shy I--~~
00 ~-~
43 522 348 59 ----shy
62~ 00 00 00 261 ----shy
652 ------shy
00 00 00 00 667 333 63 AverageResponseRate = 99
bullAverage Response Rate = 73
Table 123 Catfish Responses Importance of Nutrition - Related Factors in Choice of CSM Over Alternative Protein Feeds
Average Response Rate =83
Table 124 Catfish Responses Importance of Non- Nutrition - Related Factors in Choice of CSM Over Alternative Protein
Feeds
Average Response Rate = 90
bullAverage Response Rate = 13
Igt 20
s_
Pshy s
--s
H_
_
gt 7 bull bull bull bull bull
1 fsI plusmn -
haMr
N__
shy
bullAverage Response Rate =54
Table 128 Catfish Responses Top 5 Reasons Why CSM IS NOT Selected as a Feed
Table 129 Catfish Responses Top 5 Specific Characteristics That Would Have to Change for CSM to Be Selected as a Feed-_
Table 130 Catfish Responses Analyses Routinely Table 131 Catfish Responses Other Analyses Routinely Performed
middotResponse Rate = 25
middotResponse Rate =92
bullAverage Response Rate = 18
Table 133 Catfish Responses Knowledge of Problems Feedine CSM to CatflSh
Average Response Rate =100
Table 134 Catfish Responses Protein - Related Factors Considered i
Response Rate = 83
Table 135 Catfish Responses Crude Protein Levels Preferred for CSM
Response Rate = 100
Table 139 Catfish Responses Would or Do Use Table 140 Catfish Responses Relative Feeding
Value ofCSM Compared to 44~ Lmiddotmiddotmiddotmiddotmiddotmiddotmiddotmiddotmiddotmiddotmiddotmiddotmiddotmiddotmiddotmiddotmiddotmiddotmiddot _
Response Rate = 100
Response Rate = 100
Table 141 Catfish Responses Knowledge of Research on Table 142 Catfish Responses Sources ofInformation
Average Response Rate = 83
bullAverage Response Rate = 44
Table 143 Catfish Responses Willingness to Pay A Premium Per Unit of Protein for CSM with More Than
middotResponse Rate = 100
Table 144 Catfish Responses Percent of Cost of SBM Respondents Willing to Pay for CSM with Sufficiently Low Goscvnol and Fiber Levelsmiddot
middotResponse Rate = 83
middotResponse Rate = 25
Table 146 Comparison of Mean Responses and Analysis of Variance (ANOVA) Importance of Specific
bull Scale of 1 (extremely unimportant) to 7 (extremely important) for the mean ranking a Mean significantly larger across animal types at the 5 significance level otherwise no difference b Mean significantly lower across animal types at the 5 significance level otherwise no difference
Table 147 Comparison of Mean Responses and Analysis of Variance (ANOVA) Ranking of Other Protein
bull Scale of 1 (CSM inferior to respective feed) to 7 (CSM superior to respective feed) for the mean ranking
a Mean significantly larger across animal types at the 5 significance level otherwise no difference
b Mean significantly lower across animal types at the 5 significance level otherwise no difference
Table 148 Comparison ofMean Responses and Analysis of Variance (ANOVA) Importance of Nutritionshy
Related Factors in Choice ofCSM Over Alternativesmiddot
bull Scale of 1 (extremely unimportant) to 7 (extremely important) for the mean ranking a Mean significantly larger across animal types at the 5 significance level otherwise no difference
b Mean significantly lower across animal types at the 5 significance level otherwise no difference
Table 149 Comparison of Mean Responses and Analysis of Variance (ANOVA) Importance of Nonshy
Nutrition- Related Factors in Choice of CSM Over Alternativesmiddot
bull Scale of 1 (extremely unimportant) to 7 (extremely important) for the mean ranking
a Mean significantly larger across animal types at the 5 significance level otherwise no difference
b Mean significantly lower across animal types at the 5 significance level otherwise no difference
- = Not mentioned or ranked lower than 4th place
Table 151 Comparison of Responses Top Responses Why CSM IS NOT Selected as a Feed
- = Not mentioned or ranked lower than 5th place
Table 152 Comparison of Responses Top Characteristics that Have to Change for CSM to Be
- = Not mentioned or ranked lower than 5th place
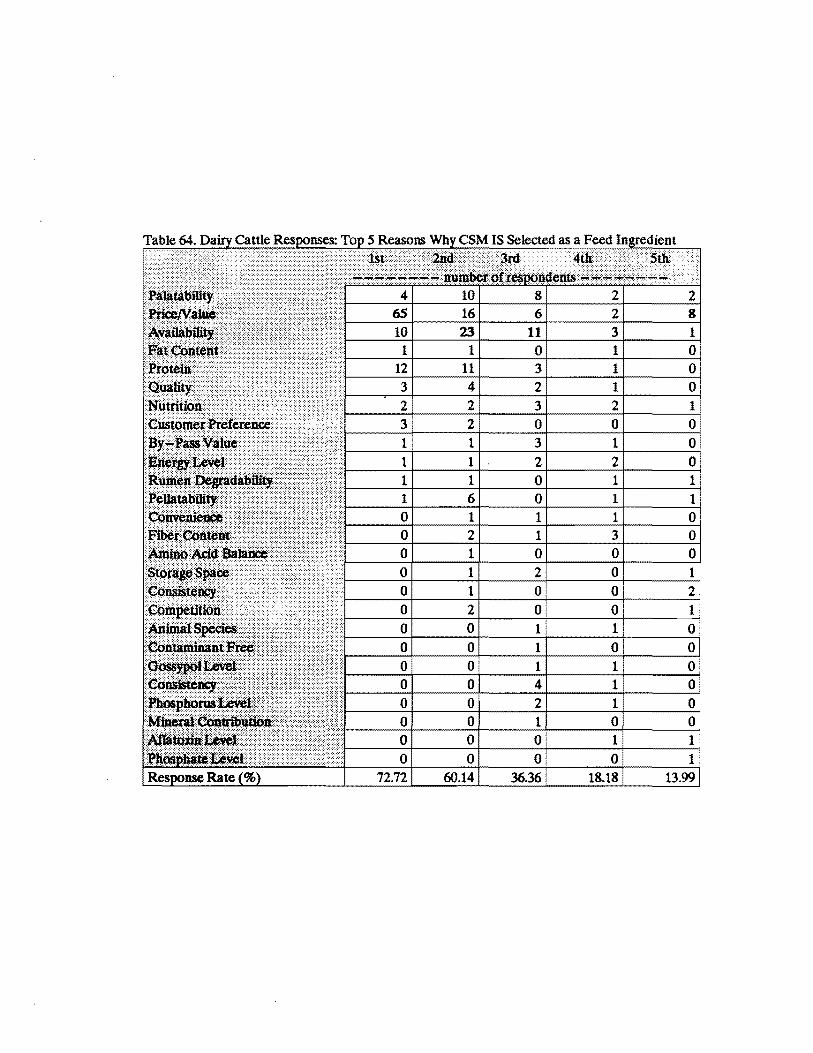

Average Response Rate =85
Table 92 Poultry Responses Importance of Nutrition - Related Factors in Choice of CSM Over Alternative Protein Feeds (of
Average Response Rate =85
Table 93 Poultry Responses Other Nutrition-Related Factors Indicated
200
200
Response Rate = 5
Table 94 Poultry Responses Importance of Non - Nutrition - Related Factors in Choice of CSM Over Alternative Protein
Feeds~~~~~~~~~~5=~~~~~T7~~
00 Average Response Rate =83
Response Rate =4
Average Response Rate = 17
Table 97 Poultry Responses Months in the
J
p
April
lao
A
shy-- 0
ft
April
_
Average Response Rate = 43
=1 g L
0
Table 99 Poultry Responses Top 5 Reasons Why CSM IS NOT Selected as a Feed
Table 100 Poultry Responses Top 5 Specific Characteristics That Would Have to Change for
CSM to be Selected as a Feed Inoredient
Table 101 Poultry Responses Analyses Routinely
middotResponse Rate = 93
Table 102 Poultry Responses Other Analyses Routinely
Performed
middotResponse Rate = 27
Table 103 Poultry Responses Analytical Values Provided
middotResponse Rate =73
Table 104 Poultry Responses Knowledge of Problems
bullAverage Response Rate = 62
Average Response Rate = 14
Table 106 Poultry Responses Protein - Related Factors
Average Response Rate = 64
Table 107 Poultry Responses Other Protein - Related
Response Rate =11
Table 108 Poultry Responses Crude Protein Levels
Preferred for CSM
Response Rate = 55
Table 111 Poultry Responses Gossypol Levels Considered
Safe
Table 112 Poultry Responses Would or Do Use Table 113 Poultry Responses Relative Feeding Value of CSM Comoared to 44 SBMmiddot
middotResponse Rate = 96
bull Response Rate = 100
Table 114 Poultry Responses Knowledge of Table 115 Poultry Responses Familiarity with Other Feedino CSMmiddot
middotResponse Rate =7 bull Response Rate = 73
middotResponseRate = 31
bullAverage Response Rate = 58
Table 118 Poultry Responses Willingness to Pay
a Premium Per Unit of Protein for CSM With More
Than 41 Protein
bullResponse Rate =91
Table 119 Poultry Responses Percent of Cost of SBM Respondents Willing to Pay for CSM with
Response Rate =27
Response Rate =64
00 00 87 43 478 304 57 00 00
----shy I--~~
00 ~-~
43 522 348 59 ----shy
62~ 00 00 00 261 ----shy
652 ------shy
00 00 00 00 667 333 63 AverageResponseRate = 99
bullAverage Response Rate = 73
Table 123 Catfish Responses Importance of Nutrition - Related Factors in Choice of CSM Over Alternative Protein Feeds
Average Response Rate =83
Table 124 Catfish Responses Importance of Non- Nutrition - Related Factors in Choice of CSM Over Alternative Protein
Feeds
Average Response Rate = 90
bullAverage Response Rate = 13
Igt 20
s_
Pshy s
--s
H_
_
gt 7 bull bull bull bull bull
1 fsI plusmn -
haMr
N__
shy
bullAverage Response Rate =54
Table 128 Catfish Responses Top 5 Reasons Why CSM IS NOT Selected as a Feed
Table 129 Catfish Responses Top 5 Specific Characteristics That Would Have to Change for CSM to Be Selected as a Feed-_
Table 130 Catfish Responses Analyses Routinely Table 131 Catfish Responses Other Analyses Routinely Performed
middotResponse Rate = 25
middotResponse Rate =92
bullAverage Response Rate = 18
Table 133 Catfish Responses Knowledge of Problems Feedine CSM to CatflSh
Average Response Rate =100
Table 134 Catfish Responses Protein - Related Factors Considered i
Response Rate = 83
Table 135 Catfish Responses Crude Protein Levels Preferred for CSM
Response Rate = 100
Table 139 Catfish Responses Would or Do Use Table 140 Catfish Responses Relative Feeding
Value ofCSM Compared to 44~ Lmiddotmiddotmiddotmiddotmiddotmiddotmiddotmiddotmiddotmiddotmiddotmiddotmiddotmiddotmiddotmiddotmiddotmiddotmiddot _
Response Rate = 100
Response Rate = 100
Table 141 Catfish Responses Knowledge of Research on Table 142 Catfish Responses Sources ofInformation
Average Response Rate = 83
bullAverage Response Rate = 44
Table 143 Catfish Responses Willingness to Pay A Premium Per Unit of Protein for CSM with More Than
middotResponse Rate = 100
Table 144 Catfish Responses Percent of Cost of SBM Respondents Willing to Pay for CSM with Sufficiently Low Goscvnol and Fiber Levelsmiddot
middotResponse Rate = 83
middotResponse Rate = 25
Table 146 Comparison of Mean Responses and Analysis of Variance (ANOVA) Importance of Specific
bull Scale of 1 (extremely unimportant) to 7 (extremely important) for the mean ranking a Mean significantly larger across animal types at the 5 significance level otherwise no difference b Mean significantly lower across animal types at the 5 significance level otherwise no difference
Table 147 Comparison of Mean Responses and Analysis of Variance (ANOVA) Ranking of Other Protein
bull Scale of 1 (CSM inferior to respective feed) to 7 (CSM superior to respective feed) for the mean ranking
a Mean significantly larger across animal types at the 5 significance level otherwise no difference
b Mean significantly lower across animal types at the 5 significance level otherwise no difference
Table 148 Comparison ofMean Responses and Analysis of Variance (ANOVA) Importance of Nutritionshy
Related Factors in Choice ofCSM Over Alternativesmiddot
bull Scale of 1 (extremely unimportant) to 7 (extremely important) for the mean ranking a Mean significantly larger across animal types at the 5 significance level otherwise no difference
b Mean significantly lower across animal types at the 5 significance level otherwise no difference
Table 149 Comparison of Mean Responses and Analysis of Variance (ANOVA) Importance of Nonshy
Nutrition- Related Factors in Choice of CSM Over Alternativesmiddot
bull Scale of 1 (extremely unimportant) to 7 (extremely important) for the mean ranking
a Mean significantly larger across animal types at the 5 significance level otherwise no difference
b Mean significantly lower across animal types at the 5 significance level otherwise no difference
- = Not mentioned or ranked lower than 4th place
Table 151 Comparison of Responses Top Responses Why CSM IS NOT Selected as a Feed
- = Not mentioned or ranked lower than 5th place
Table 152 Comparison of Responses Top Characteristics that Have to Change for CSM to Be
- = Not mentioned or ranked lower than 5th place