the use of data collection ... - ball state...
TRANSCRIPT

THE USE OF DATA COLLECTION ACTIVITIES IN THE SECONDARY
MATHEMATICS CLASSROOM
A CREATIVE PROJECT
SUBMITTED TO THE GRADUATE SCHOOL
IN PARTIAL FULFILLMENT OF THE REQUIREMENTS
FOR THE DEGREE
MASTER OF ARTS IN PHYSICS EDUCATION
BY
LISA A. ENNEKING
DR. JOEL BRYAN, ADVISOR
BALL STATE UNIVERSITY
MUNCIE, INDIANA
JULY 2008

Abstract
Many high school students find mathematics to be difficult and irrelevant to their lives.
The focus of this project was to survey high school math teachers to find out how often
they use scientific data collection activities in their classroom in order to make real world
connections. The survey also explored teacher attitudes about the use of data collection
and teachers’ reasons for not incorporating more data collection activities into their
curriculum. The analysis of the survey data showed that a little more than half of the
teachers who completed the survey have used data collection and that the greatest factor
limiting the use of data collection activities was time. This project provides some
recommendations for math teachers and includes some examples of data collection
activities that are appropriate for use in secondary mathematics classrooms.

2THE USE OF DATA COLLECTION ACTIVITIES IN THE SECONDARY
MATHEMATICS CLASSROOM
Incorporating scientific data collection activities into math curriculum is a
teaching approach that should be considered by mathematics educators. Likewise, science
educators should also look for ways to highlight mathematical models during the analysis
of scientific data. Making changes in the way we teach our subjects and organize our
curriculum is always a challenge. However, there are benefits for students and teachers to
finding the areas where connections can be made between math and science curricula,
and these benefits make the challenges that must be worked through worthwhile.
Why collect data in math classes? Making connections is one of the five process
standards recommended by the National Council of Teachers of Mathematics (NCTM).
NCTM encourages teachers to apply math in contextual situations so that it will be more
likely students will not forget the math skills they have learned in class. NCTM
expectations for math programs at the high school level include designing studies,
collecting and organizing data, developing models for the data, and making inferences
using the models (NCTM, 2000). The NCTM Principles and Standards for School
Mathematics (2000) states:
The kinds of experiences teachers provide clearly play a major role in determining
the extent and quality of students’ learning. Students’ understanding of
mathematical ideas can be built throughout their school years if they actively
engage in tasks and experiences designed to deepen and connect their knowledge.
(p. 21)

3The National Research Council (NRC) also states that science educators should be
connecting science to other school subjects like mathematics (NRC, 1996). The book
How People Learn (2000) which was co-written by a committee from the NRC, states:
Students develop flexible understanding of when, where, why, and how to use
their knowledge to solve new problems if they learn how to extract underlying
themes and principles from their learning exercises. Understanding how and when
to put knowledge to use –known as conditions of applicability-is an important
characteristic of expertise. Learning in multiple contexts most likely affects this
aspect of transfer. (p. 236)
Using scientific data collection activities in math classes is a simple way to connect
separate courses that high school students attend in their daily school routine.
Students do not easily make the connections between their individual courses on
their own, and a traditional high school does not offer integrated curriculum. Beane says
“students as though piecing together a jigsaw puzzle, must rely on their own intuition to
piece together fragmentary pieces of knowledge obtained separately from different
subjects” (as cited in Jang, 2006, p. 615). Jeff Marshall and Bob Horton, educators
involved in math and science education at the college level, feel that students want
learning to be meaningful and relevant, and math and physical science courses are most
often taught as separate subjects, limiting the cohesiveness of the learning (Marshall,
Horton, & Austin-Wade, 2007). Students need to see math and science as relevant parts
of their world. Math should not be taught just for the sake of learning math but to make
sense out of the world (Davison, Miller, & Metheny, 1995). Berlin and White said “There

4are times when the concepts of science and the concepts of mathematics have enough in
common for it to be more meaningful to the student and more efficient to connect the
learning of these concepts” (as cited in Roebuck & Warden, 1998, p. 329).
We can make our subjects more interesting for our students and hook them on
math and science by tweaking our teaching methods to promote connections between the
two subjects. In a paper presented at a conference for Integrated Science and
Mathematics Teaching and Learning, Lynn A. Steen (1994) recommended that math and
science teachers learn from each other by incorporating some of the ways each other
teaches in their own classroom. For instance, math teachers should include more
observation and data collection of real world situations which would lead to long-term
retention of information by students. Science teachers should include more activities to
promote inference and deduction skills instead of just dictating to students what science
says is going to happen in certain situations. Steen wrote, “Active, exploratory learning
works as well in mathematics as it does in science” (p. 12).
Teachers would also benefit from integrating math and science curricula through
data collection activities in their classrooms. Because of the design of school schedules,
teachers spend most of the school day in their own classrooms focused on their own
students and individual subjects. There is very little opportunity during the school day to
communicate with other teachers other than through short e-mail messages. By
incorporating integrated data collection activities in the curriculum, teachers would need
to have conversations with teachers in other subject areas to ask them for clarification on
points related to their subjects. The other teachers in our buildings are our best resources
5for help and talking with them will give us insight into what our students are learning in
their other classes. Lisa Schmidt and Sam Horton, high school teachers who have taught
interdisciplinary math and science courses, report that courses that require you to work
with members of other departments lead to “a high level of collegiality that is both
exciting and rewarding” (2003, p. 51).
Some documentation on educators making connections between math and science
has been reported and the feedback is positive. Mike Smith, a Physics teacher who began
integrating algebra concepts and technology into his curriculum, has found that he has
changed the way he assesses his students and his students reap the benefits. He now
appreciates the importance of algebra to science (Nicol, 1997). Robert Horton, an
assistant professor of mathematics education, and William Leonard, a professor of
education and biology, have worked on projects with their students to gather data and
develop mathematical models to fit their data. They say that:
In our experience, students not only enjoyed what they were doing but also
surprised us with how quickly they mastered the techniques, which allowed us to
focus on the connections between the mathematical models and scientific ideas
they were investigating. The process goals in math and science standards have
much in common. Teachers must take advantage of this and the power of modern
technology to make learning as rich as possible. (Horton & Leonard, 2005, p. 45)
Why then are not all math teachers taking advantage of the opportunity to bring
real world scientific data collection activities into their classroom? The national standards
say to do it. The students would enjoy the hands-on activities, be more likely to retain
6information, and develop higher-order thinking skills like application and inquiry.
Teachers would get the opportunity to work with colleagues and unite to achieve the
common goal of making learning meaningful.
In order to discover more about the use of data collection in math classes, a
survey was administered. The survey included questions to learn about the following: the
frequency in which secondary mathematics teachers have their students take experimental
data, the teacher perceptions of the value of data collection and analysis, and the
limitations that keep mathematics teachers from doing more experiments in their classes.
Survey
The survey consisted primarily of multiple choice questions and statements with a
Likert rating scale. Several free response questions allowed teachers to post their own
comments. The survey was sent to an Indiana math teacher listserv database and also to
individual high school math departments in Indiana. It was also sent to a small number of
math contacts in Texas. The survey was administered through Ball State University’s
inQsit system and was open for responses for a period of approximately seven weeks.
Teacher background information requested included the number of years of math
teaching experience, number of years of science teaching experience, highest education
level, and math courses taught. Background information was looked at for correlation to
use of data collection.
One survey question directly asked if math teachers had ever used data collection
in their classes. The response to this question then routed the respondents to answer a set
of specific questions. If the respondents answered “no,” then the respondents answered
7questions about reasons for not using data collection and opinions of the use of data
collection. If the respondents answered “yes,” then the respondents answered questions
about the types of equipment used in their activities, the frequency of use of activities,
reasons for not using more data collection activities, and their opinions of the use of data
collection. The survey questions can be found in Appendix A.
Survey results
One hundred and twenty-three math teachers responded to the voluntary
electronic survey. Of those, 16 respondents’ answers were deleted because they answered
questions in both sections of the survey for teachers who said they did use data collection
and for teachers who said they did not use data collection. One hundred and seven
teachers’ responses were then analyzed. The majority of the teachers who responded
were from schools across Indiana with more than 1200 students. The number of male and
female respondents was almost even. Thirteen of the respondents had some experience as
science instructors. Almost half of the respondents had more than 12 years of teaching
experience. There were an undetermined number of teachers who responded from Texas.
Complete results of the survey can be found in Appendix B.
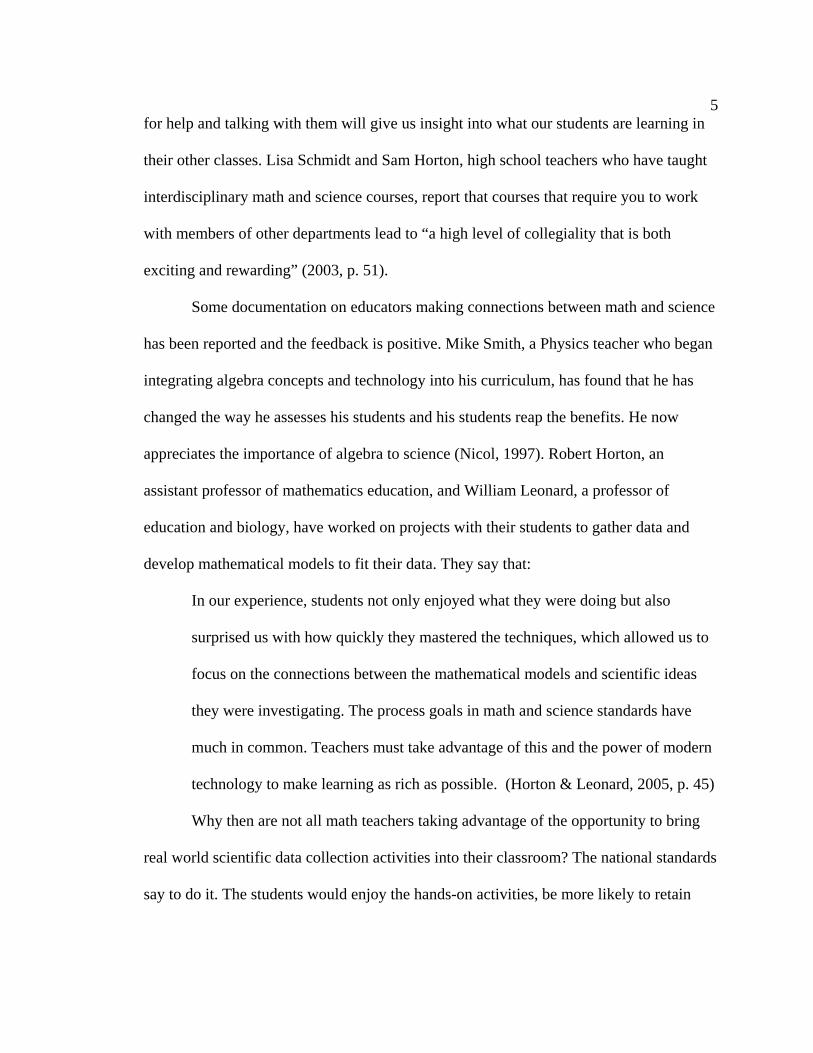
Sixty-one math teachers (57%) responded that they have had students use data
collection in their classes and 46 math teachers (43%) responded that they have not had
students use data collection. Time perceptions seemed to be the greatest concern for those
who did not implement data collection activities. Of the 46 teachers who have never had
students perform data collection activities, 38 teachers either agreed or strongly agreed
that they did not have time to implement this instructional practice because there were too
8many standards to cover, and 31 either agreed or strongly agreed that they did not have
time to gather materials (Figure 1).
0%
20%
40%
60%
80%
100%
Need to CoverRequiredStandards
Need Ideas onHow to use
Data Collection
Do not HaveTime to Gather
Materials
Math Bookdoes not
Include Ideas
No MoneyBudgeted for
Materials
agree unsure disagree
Figure 1. Top five reasons teachers do not use data collection
Thirty-six teachers would like more ideas on how to incorporate data collection
activities into their lessons. Twenty-seven teachers do not have math textbooks that
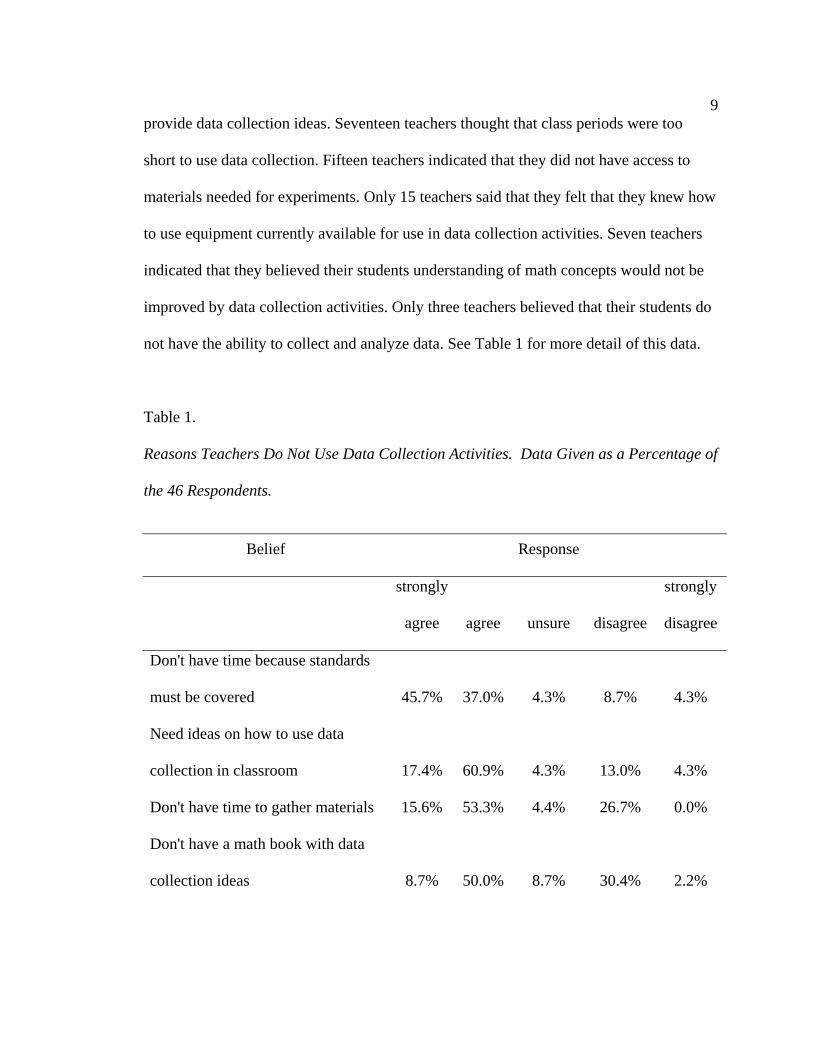
9provide data collection ideas. Seventeen teachers thought that class periods were too
short to use data collection. Fifteen teachers indicated that they did not have access to
materials needed for experiments. Only 15 teachers said that they felt that they knew how
to use equipment currently available for use in data collection activities. Seven teachers
indicated that they believed their students understanding of math concepts would not be
improved by data collection activities. Only three teachers believed that their students do
not have the ability to collect and analyze data. See Table 1 for more detail of this data.
Table 1.
Reasons Teachers Do Not Use Data Collection Activities. Data Given as a Percentage of
the 46 Respondents.
Belief
Response
strongly
agree agree unsure disagree
strongly
disagree
Don't have time because standards
must be covered 45.7% 37.0% 4.3% 8.7% 4.3%
Need ideas on how to use data
collection in classroom 17.4% 60.9% 4.3% 13.0% 4.3%
Don't have time to gather materials 15.6% 53.3% 4.4% 26.7% 0.0%
Don't have a math book with data
collection ideas 8.7% 50.0% 8.7% 30.4% 2.2%
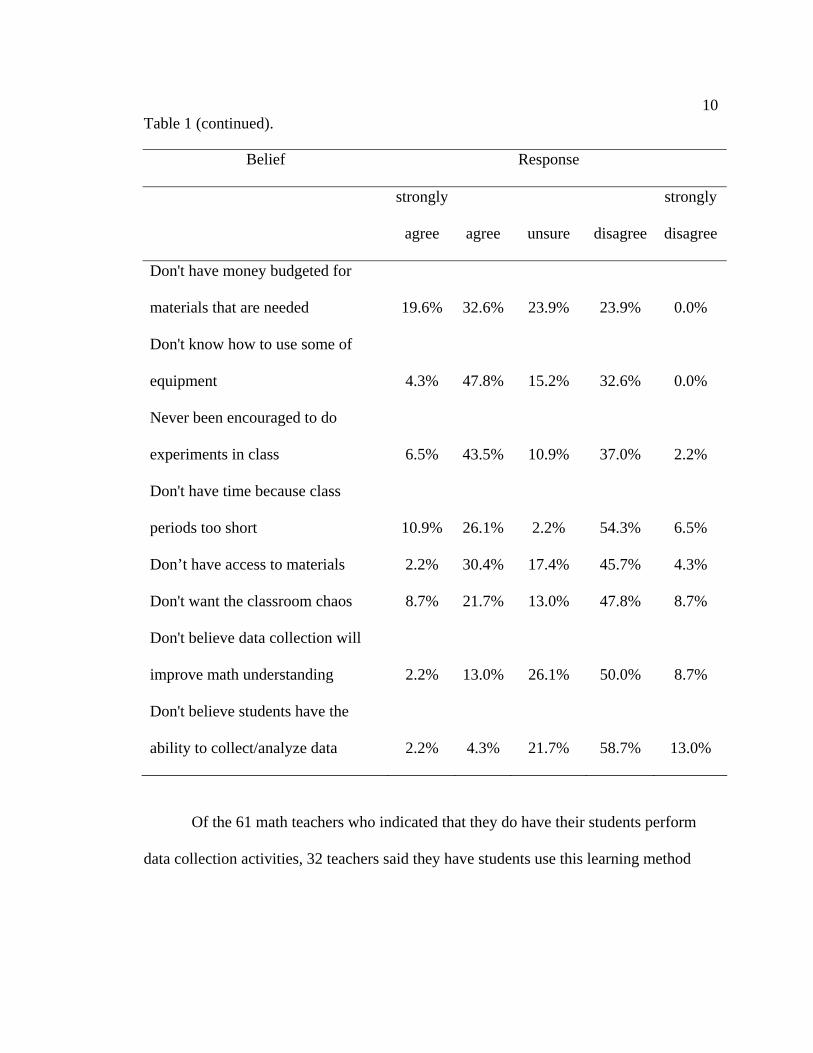
10Table 1 (continued).
Belief
Response
strongly
agree agree unsure disagree
strongly
disagree
Don't have money budgeted for
materials that are needed 19.6% 32.6% 23.9% 23.9% 0.0%
Don't know how to use some of
equipment 4.3% 47.8% 15.2% 32.6% 0.0%
Never been encouraged to do
experiments in class 6.5% 43.5% 10.9% 37.0% 2.2%
Don't have time because class
periods too short 10.9% 26.1% 2.2% 54.3% 6.5%
Don’t have access to materials 2.2% 30.4% 17.4% 45.7% 4.3%
Don't want the classroom chaos 8.7% 21.7% 13.0% 47.8% 8.7%
Don't believe data collection will
improve math understanding 2.2% 13.0% 26.1% 50.0% 8.7%
Don't believe students have the
ability to collect/analyze data 2.2% 4.3% 21.7% 58.7% 13.0%
Of the 61 math teachers who indicated that they do have their students perform
data collection activities, 32 teachers said they have students use this learning method

11once or twice per semester (Figure2). Only 15 teachers indicated that they have their
students perform a data collection activity once every two to three weeks.
32
14
8
34
0
10
20
30
40
50
60
70
Total
Number of
Teachers
Using Data
Collection
Nine or more times
Seven to eight times
Five to six times
Three to four times
One to two times
Figure 2. How many times per semester teachers use data collection
Not only did the majority of these 61 respondents feel very comfortable using the
equipment, they indicated that their students enjoyed the activities, and believed that their
students understood the math concepts better because of the data collection activities.
Fifty-one teachers would like to use data collection more in their lessons. Forty-three
teachers indicated they do not have more time to do so because they have too many

12standards to cover. Fifty-one teachers would like additional ideas on how to
incorporate more activities into their lessons. Twenty-eight teachers do not have math
textbooks that provide data collection ideas. Twenty-four teachers felt that the length of
their class periods prohibits the inclusion of more activities. Twenty-five teachers do not
have the time to collect the needed materials for the activities. See Table 2 for more detail
of this data.
Table 2
Reasons Teachers Do Not Use More Data Collection Activities. Data is Given as a
Percentage of the 61 Respondents.
Belief
Response
strongly
agree agree unsure disagree
strongly
disagree
Students enjoy taking data 31.1% 55.7% 11.5% 1.6% 0.0%
Data collection in math will
improve math understanding 37.7% 45.9% 13.1% 3.3% 0.0%
Would like to use more data
collection in class 34.4% 49.2% 9.8% 6.6% 0.0%
Need ideas on how to use data
collection in classroom 16.4% 67.2% 3.3% 13.1% 0.0%

13Table 2 (continued).
Belief
Response
strongly
agree agree unsure disagree
strongly
disagree
Don't have time because standards
must be covered 37.7% 32.8% 9.8% 14.8% 4.9%
Don't have money budgeted for
materials that are needed 19.0% 32.8% 15.5% 27.6% 5.2%
Don't have a math textbook with
data collection ideas 11.5% 34.4% 9.8% 39.3% 4.9%
Don't have time to gather materials 1.7% 40.0% 6.7% 46.7% 5.0%
Don't have time because class
periods too short 13.6% 27.1% 10.2% 40.7% 8.5%
Don't want the classroom chaos 6.6% 21.3% 8.2% 39.3% 24.6%
Don't know how to use some of
equipment 3.4% 25.9% 24.1% 39.7% 6.9%
Don’t have access to materials 0.0% 28.8% 8.5% 54.2% 8.5%
The findings from this survey demonstrate that math teachers believe that data
collection activities do help students with their understanding of math concepts. Time is
the factor that limits the use of this teaching method. Teachers feel the pressure to cover a
greater number of standards than can be taught in the length of their courses. One teacher

14commented, “The main reason that I do not incorporate data collection activities is that
I feel like I am always pressed for time because of class length and state standards that
need to be covered.” Data collection takes time to complete and if technology is
involved, extra time will be needed to become proficient with the equipment. Also,
teachers do not always have the time to gather the materials and do activity set-up,
evidenced by one teacher who commented that “I don’t have time to search out activities
and plan out the activity.”
Math teachers would like more ideas and examples of data collection activities
they can use. One respondent noted, “If I had an experiment that was already set up for
me, I would at least try it to see how it worked, even if it put me behind a couple of
days.” Fifty-one percent of all the teachers surveyed indicated that their textbooks do not
include examples of data collection activities. Appendix C includes comments from
teachers who do not use data collection activities in their lessons. Appendix D includes
comments from teachers who do use data collection activities in their lessons.
The survey provides evidence that math teachers with more years of teaching
experience may be more likely to include data collection in their classes, although a more
scientific polling method would be necessary to substantiate this claim. Sixty-four
percent of teachers with 12 or more years of teaching experience stated that they do use
data collection compared to 47% of teachers with one to three years of teaching
experience who said that they included data collection in their teaching methods. Those
with a bachelor’s degree who responded to this survey were more likely to include data
collection in their classes when compared to those who responded with a master’s degree.

15Although 61% of teachers with a bachelor’s degree use data collection compared to
55% of teachers with a master’s degree, these numbers likely indicate that there is no
statistical difference, but again, a more scientific survey would be needed. Also, the
survey showed that 47% of the female teachers used data collection compared to 66% of
the male teachers surveyed.
Recommendations
One recommendation for math teachers would be to begin by including one data
collection activity every nine weeks or two per semester for each math class. Work
together with other math teachers to develop activities and organize the materials. At the
beginning, choose activities that use simple, low-cost materials that your department can
keep boxed up in a labeled container. The most common equipment used by the math
teachers who already use data collection were rulers, timers, mass scales, and motion
sensors. Enlist the help of a science teacher to learn how to use science equipment and to
find science concepts that use specific mathematical functions. Start by asking questions
such as “Do you ever take data in your science class that result in linear graphs or
relationships among the variables?” There are math textbooks companies that include
experiments in their texts. Look through the books left behind from your last textbook
adoption. I found many algebra based activities in Discovering Advanced Algebra: An
Investigative Approach published by Key Curriculum Press. There are activity
workbooks for purchase that use simple equipment, such as Algebra Experiments 1:
Exploring Linear Functions published by Addison-Wesley. Articles in the Mathematics
Teacher also frequently include data collection activities.
16As far as the issue of using classroom time to collect data, consider carefully
whether it is more important to cover as many topics as possible with minimal real world
application, or to cover fewer topics in more depth and emphasize process skills like
collecting data and making deductions? A recommendation for national and state
standard boards would be to indicate in the standards a “core” group of standards that
must be covered and lighten the pressure on teachers so they can pick and choose from
the other standards to cover in a course. Then teachers would have the flexibility to teach
process skills along with concept standards.
Data collection activities
There are three algebra based activities included in the appendices that serve as
models of the types of activities that students could and should perform in their
mathematics classes. These activities were chosen because they used the equipment that
was indicated in the survey as the most often used by teachers already using data
collection in their classrooms. The Free Fall lab is appropriate for a second year algebra
course (Appendix E). This lab requires motion sensors (which are commonly used in
physical science classes) and graphing calculators. This lab will require about 20 minutes
of class time to take the data and five minutes to gather the equipment. Teachers who
have never used motion sensors before would want to practice with the equipment before
doing the Free Fall activity. This activity reinforces the concepts of quadratic equations
and system of equations. Science connections made are free-fall and gravitational
acceleration. This activity meets the needs of teachers who do not have a lot class time to
17spend taking data and for teachers who have used motion sensors before, the
preparation time will be minimal.
The Skittlelium Decay lab is also appropriate for a second year algebra course
(Appendix F). This lab requires inexpensive Skittles® candies and graphing calculators.
The activity will require about 10 minutes of class time to collect the data and
approximately 10 minutes per class to sort the candies into piles of 50 for each lab group.
Student helpers could be utilized ahead of time to perform the sorting. This activity
reinforces the concept of exponential decay. Science connections made are radioactivity
and half-life. This activity meets the needs of teachers who do not have a lot of class time
to spend taking data. There is no equipment required to gather or understand how to use.
The Comparing Pennies lab (Appendix G) is appropriate for a first year algebra
course, but could easily be modified for a second year course. This activity requires
electronic balances, graduated cylinders, water, old and new pennies, and graph paper.
The activity will require about 20 minutes of class time to take the data and 20 minutes to
collect the materials. This activity reinforces the concepts of graphing skills, y-intercept
form of equations, and best line of fit. The science connection made is density. This
activity meets the needs of teachers who do not have a lot of class time to spend taking
data. The equipment is simple to use. A science teacher can demonstrate how to use the
electronic balances in one minute.
Conclusion
While it is encouraging to find that many mathematics teachers are currently
integrating data collection activities into their instructional practices, more teachers need

18to incorporate this approach so students can develop a deeper understanding of
mathematical concepts. Using data collection in class does not have to be costly or take
much class time. It will require teacher preparation time to either find or write activities
and a willingness to try something new. We need to challenge ourselves as teachers in
order to improve the curriculum for students so that their learning is as meaningful as
possible.
19References
Bransford, J., Brown, A., & Cocking, R. (Eds.). (2000). How people learn: Brain, mind,
experience, and school Washington, D.C.: National Academy Press.
Davison, D., Miller, K., & Metheny, D. (1995). What does integration of science and
mathematics really mean? School Science and Mathematics, May, 95 (5), 226-
230.
Horton, R.M, & Leonard, W.H. (2005). Mathematical modeling in science. The Science
Teacher, July/August, 40-45.
Jang,S.-J. (2006). The effects of incorporating web-assisted learning with team teaching
in seventh-grade science classes. International Journal of Science Education,
May, 28 (6), 615-632.
Marshall, J., Horton, B., & Austin-Wade, J. (2007). Giving meaning to numbers. The
Science Teacher, February, 36-41.
Murdock, J., Kamischke, E.,& Kamischke, E. (2004). Discovering advanced algebra: An
investigative approach Emeryville, CA.: Key Curriculum Press.
National Council of Teachers of Mathematics (NCTM). 2000. Principles and standards
for school mathematics. Reston, VA: NCTM.
National Research Council. (1996). National science education standards. Washington,
DC: National Academy Press.
Nicol, M. (1997). How one physics teacher changed his algebraic thinking. The
Mathematics Teacher, 90 (2), 86-89.
Roebuck, K.I., & Warden, M.A. (1998). Searching for the center on the mathematics-

20 science continuum. School Science and Mathematics, 98 (6), 328-333).
Schmitt, L., & Horton, S. (2203). Smath. The Science Teacher, December, 46-51.
Steen, L. (1991, April). Integrating school science and mathematics: Fad or folly.
Paper presented at the NSF/SSMA Wingspread Conference, Racine, WI.
Winter, M.J. & Carlson, R.J. (1993). Algebra experiments I: Exploring linear functions
United States: Addison-Wesley Publishing Company.

21Appendix A
Teacher Survey 1. How many years of mathematics teaching experience, including the current year, do you have? a. 1-3 b. 4-6 c. 7-9 d. 10-12 e. more than 12 Pick one 2. How many years of science teaching experience, including the current year, do you have? a. 0 b. 1-3 c. 4-6 d. 7-9 e. 10-12 f. more than 12 Pick one 3a. In what fields are you currently certified to teach? Check all that apply. a. elementary mathematics b. middle level mathematics c. secondary mathematics d. secondary life science e. secondary physical science 3b. other 4a. What course(s) do you currently teach? Check all that apply. a. algebra 1 b. algebra 2 c. geometry d. trigonometry/precalculus e. calculus f. probability and statistics 4b. other
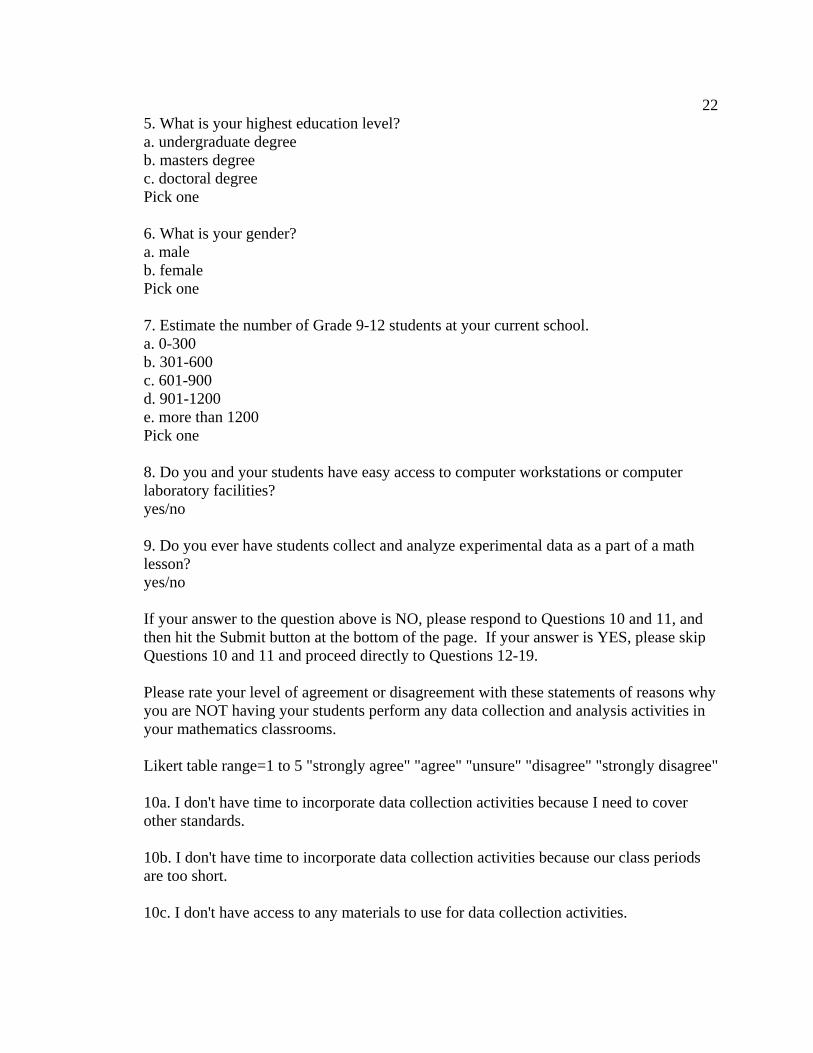
225. What is your highest education level? a. undergraduate degree b. masters degree c. doctoral degree Pick one 6. What is your gender? a. male b. female Pick one 7. Estimate the number of Grade 9-12 students at your current school. a. 0-300 b. 301-600 c. 601-900 d. 901-1200 e. more than 1200 Pick one 8. Do you and your students have easy access to computer workstations or computer laboratory facilities? yes/no 9. Do you ever have students collect and analyze experimental data as a part of a math lesson? yes/no If your answer to the question above is NO, please respond to Questions 10 and 11, and then hit the Submit button at the bottom of the page. If your answer is YES, please skip Questions 10 and 11 and proceed directly to Questions 12-19. Please rate your level of agreement or disagreement with these statements of reasons why you are NOT having your students perform any data collection and analysis activities in your mathematics classrooms. Likert table range=1 to 5 "strongly agree" "agree" "unsure" "disagree" "strongly disagree" 10a. I don't have time to incorporate data collection activities because I need to cover other standards. 10b. I don't have time to incorporate data collection activities because our class periods are too short. 10c. I don't have access to any materials to use for data collection activities.

23 10d. I don't have money budgeted to purchase materials to use in data collection activities. 10e. I don't know how to use some of the equipment that is currently available for us to use in data collection activities. 10f. I don't have time to gather the materials to use in data collection activities. 10g. I don't want the chaos that might occur during data collection activities. 10h. I need ideas on how data collection activities could be used in my lessons. 10i. I don't believe that using data from an experiment will improve my students' understanding of math concepts. 10j. I don't believe my students have the ability to collect and analyze real laboratory data. 10k. I don't believe my students have the discipline to collect and analyze real laboratory data. 10l. I've never been encouraged to do experiments in my class. 10m. I don't have a math textbook that provides examples of data collection experiments that I can use with my lessons. 11. Please list any other reasons why you do not incorporate data collection activities into your mathematics lessons. Then hit Submit at the bottom of the page. Only answer the remaining questions if you answered YES to question 9. 12a. What types of equipment have you had students use in data collection. Check all that apply. a. rulers b. timers c. thermometers d. chemicals e. mass/weight scales f. masses/weights g. motion sensors h. light sensors i. pH sensors j. sound meters k. other sensors
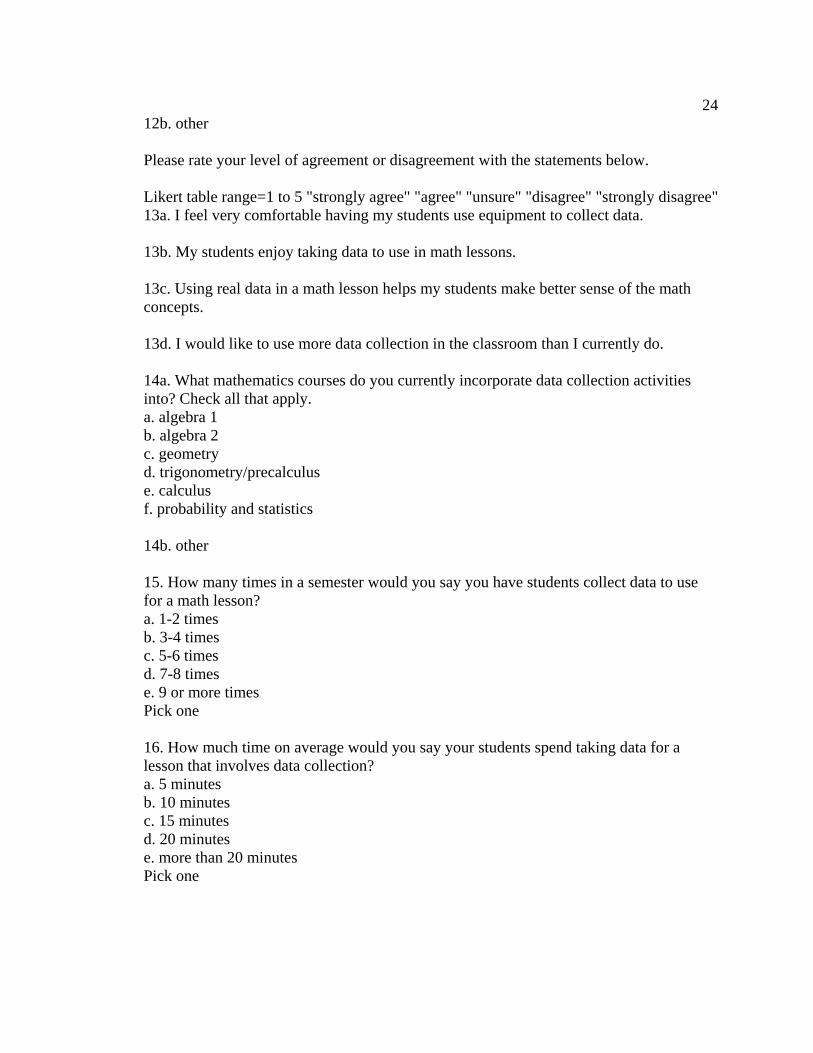
2412b. other Please rate your level of agreement or disagreement with the statements below. Likert table range=1 to 5 "strongly agree" "agree" "unsure" "disagree" "strongly disagree" 13a. I feel very comfortable having my students use equipment to collect data. 13b. My students enjoy taking data to use in math lessons. 13c. Using real data in a math lesson helps my students make better sense of the math concepts. 13d. I would like to use more data collection in the classroom than I currently do. 14a. What mathematics courses do you currently incorporate data collection activities into? Check all that apply. a. algebra 1 b. algebra 2 c. geometry d. trigonometry/precalculus e. calculus f. probability and statistics 14b. other 15. How many times in a semester would you say you have students collect data to use for a math lesson? a. 1-2 times b. 3-4 times c. 5-6 times d. 7-8 times e. 9 or more times Pick one 16. How much time on average would you say your students spend taking data for a lesson that involves data collection? a. 5 minutes b. 10 minutes c. 15 minutes d. 20 minutes e. more than 20 minutes Pick one
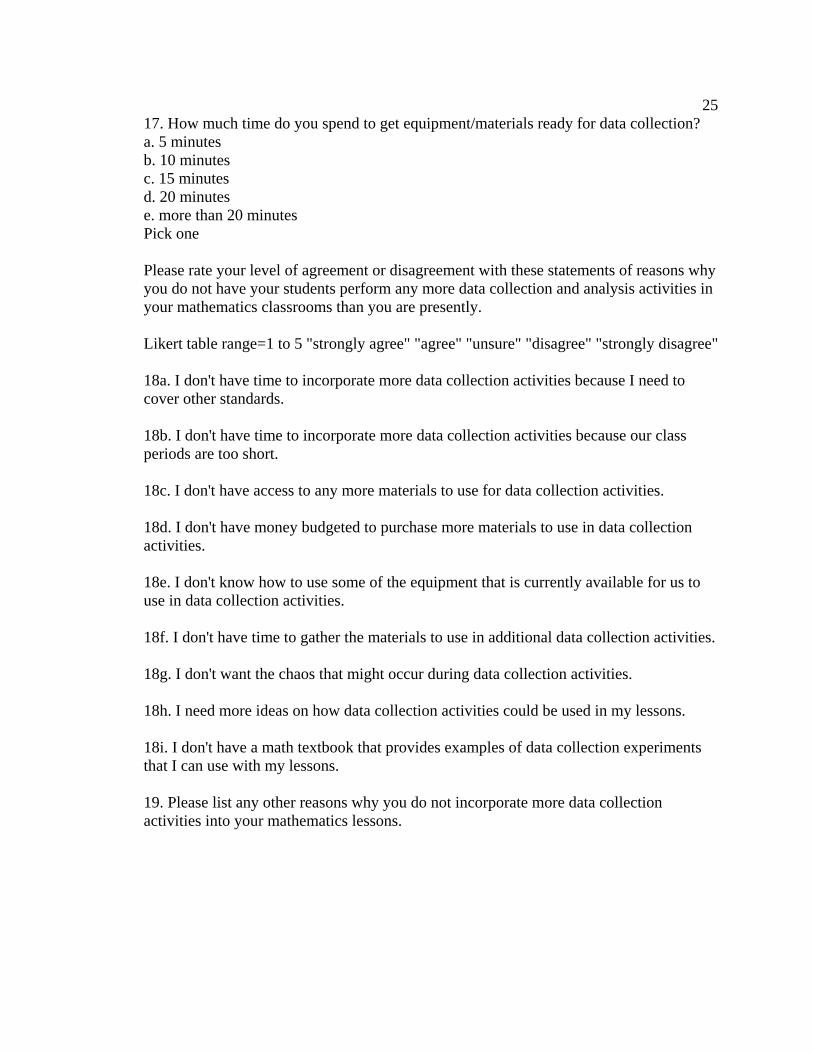
2517. How much time do you spend to get equipment/materials ready for data collection? a. 5 minutes b. 10 minutes c. 15 minutes d. 20 minutes e. more than 20 minutes Pick one Please rate your level of agreement or disagreement with these statements of reasons why you do not have your students perform any more data collection and analysis activities in your mathematics classrooms than you are presently. Likert table range=1 to 5 "strongly agree" "agree" "unsure" "disagree" "strongly disagree" 18a. I don't have time to incorporate more data collection activities because I need to cover other standards. 18b. I don't have time to incorporate more data collection activities because our class periods are too short. 18c. I don't have access to any more materials to use for data collection activities. 18d. I don't have money budgeted to purchase more materials to use in data collection activities. 18e. I don't know how to use some of the equipment that is currently available for us to use in data collection activities. 18f. I don't have time to gather the materials to use in additional data collection activities. 18g. I don't want the chaos that might occur during data collection activities. 18h. I need more ideas on how data collection activities could be used in my lessons. 18i. I don't have a math textbook that provides examples of data collection experiments that I can use with my lessons. 19. Please list any other reasons why you do not incorporate more data collection activities into your mathematics lessons.

26Appendix B
Teacher survey results
Number Type Total Right Difficulty Descrimination Mean St.Dev1 MC 107 107 100.00% -2 2 MC 107 107 100.00% -2 3a MR 107 107 100.00% -2 3b Essay 107 0 04a MR 107 107 100.00% -2 4b Essay 107 0 05 MC 107 107 100.00% -2 6 MC 107 107 100.00% -2 7 MC 107 107 100.00% -2 8 Y/N 107 0 0.00% 0 9 Y/N 107 0 0.00% 0
10a Likert 107 1.89 1.1110b Likert 107 3.2 1.2110c Likert 107 3.2 0.9910d Likert 107 2.52 1.0610e Likert 107 2.76 0.9610f Likert 107 2.42 1.0410g Likert 107 3.26 1.1510h Likert 107 2.26 1.0310i Likert 107 3.5 0.910j Likert 107 3.76 0.8110k Likert 107 3.2 1.1210l Likert 107 2.85 1.06
10m Likert 107 2.67 1.0611 Essay 107 0 012a MR 107 107 100.00% -2 12b Essay 107 0 013a Likert 107 1.88 0.813b Likert 107 1.87 0.713c Likert 107 1.84 0.7913d Likert 107 1.9 0.8414a MR 107 107 100.00% -2 14b Essay 107 0 015 MC 107 107 100.00% -2 16 MC 107 107 100.00% -2 17 MC 107 107 100.00% -2 18a Likert 107 2.16 1.2218b Likert 107 3.03 1.2518c Likert 107 3.42 0.9918d Likert 107 2.67 1.2118e Likert 107 3.21 1.0118f Likert 107 3.13 1.0618g Likert 107 3.54 1.2518h Likert 107 2.13 0.8418i Likert 107 2.92 1.1819 Essay 107 0 0

27Number YES NO A B C D E
1 15 11 13 13 552 94 7 3 1 13a 5 61 103 2 63b 4a 54 39 48 31 124b 5 46 60 0 6 56 51 7 7 7 8 7 788 93 13 9 61 46
10a 21 17 2 4 210b 5 12 1 25 310c 1 14 8 21 210d 9 15 11 11 10e 2 22 7 15 10f 7 24 2 12 10g 4 10 6 22 410h 8 28 2 6 210i 1 6 12 23 410j 1 2 10 27 610k 3 12 8 19 410l 3 20 5 17 1
10m 4 23 4 14 111 12a 53 39 7 0 2112b 13a 23 28 8 2 13b 19 34 7 1 13c 23 28 8 2 13d 21 30 6 4 14a 23 13 18 15 614b 15 32 14 8 3 416 0 15 16 9 2117 9 12 11 10 1818a 23 20 6 9 318b 8 16 6 24 518c 17 5 32 518d 11 19 9 16 318e 2 15 14 23 418f 1 24 4 28 318g 4 13 5 24 1518h 10 41 2 8 18i 7 21 6 24 319
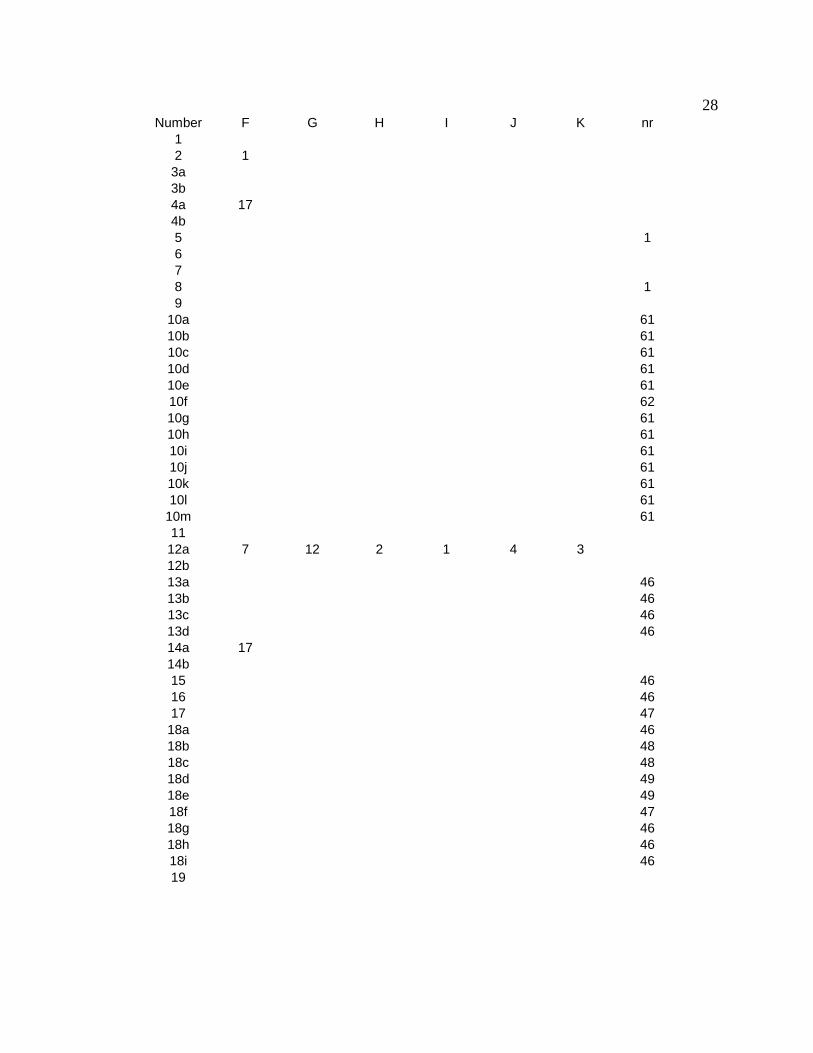
28Number F G H I J K nr
1 2 1
3a 3b 4a 17 4b 5 16 7 8 19
10a 6110b 6110c 6110d 6110e 6110f 6210g 6110h 6110i 6110j 6110k 6110l 61
10m 6111 12a 7 12 2 1 4 3 12b 13a 4613b 4613c 4613d 4614a 17 14b 15 4616 4617 4718a 4618b 4818c 4818d 4918e 4918f 4718g 4618h 4618i 4619
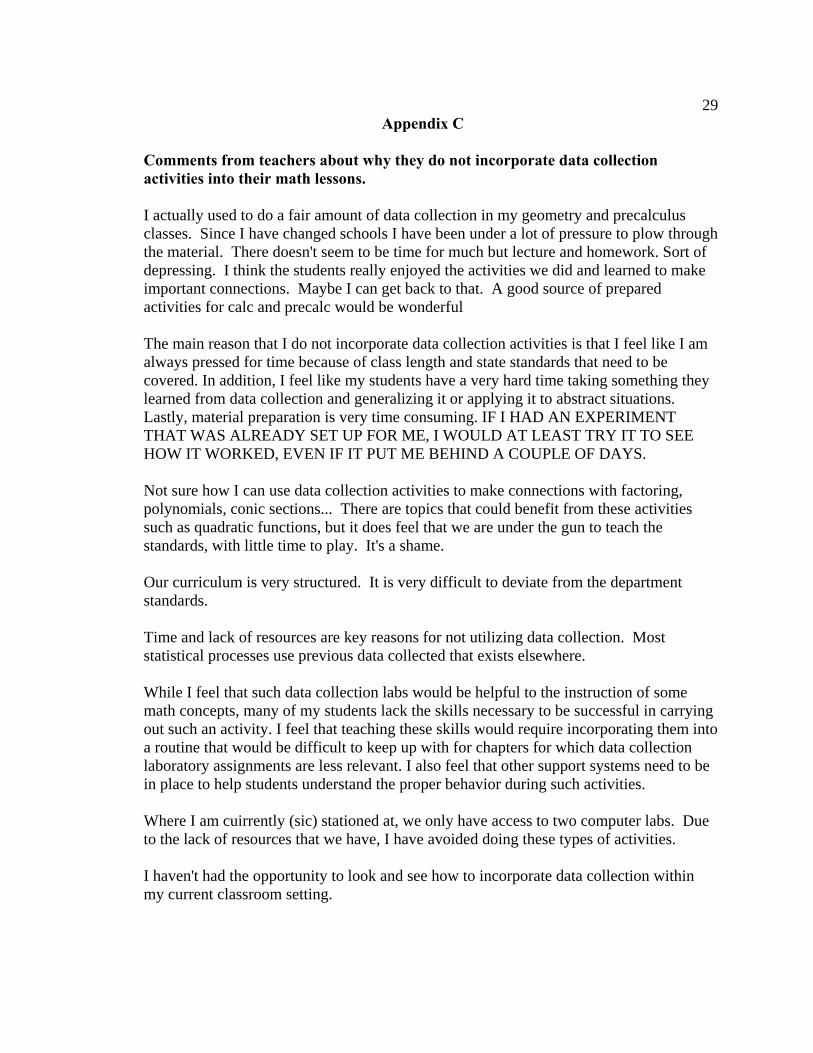
29Appendix C
Comments from teachers about why they do not incorporate data collection activities into their math lessons. I actually used to do a fair amount of data collection in my geometry and precalculus classes. Since I have changed schools I have been under a lot of pressure to plow through the material. There doesn't seem to be time for much but lecture and homework. Sort of depressing. I think the students really enjoyed the activities we did and learned to make important connections. Maybe I can get back to that. A good source of prepared activities for calc and precalc would be wonderful The main reason that I do not incorporate data collection activities is that I feel like I am always pressed for time because of class length and state standards that need to be covered. In addition, I feel like my students have a very hard time taking something they learned from data collection and generalizing it or applying it to abstract situations. Lastly, material preparation is very time consuming. IF I HAD AN EXPERIMENT THAT WAS ALREADY SET UP FOR ME, I WOULD AT LEAST TRY IT TO SEE HOW IT WORKED, EVEN IF IT PUT ME BEHIND A COUPLE OF DAYS. Not sure how I can use data collection activities to make connections with factoring, polynomials, conic sections... There are topics that could benefit from these activities such as quadratic functions, but it does feel that we are under the gun to teach the standards, with little time to play. It's a shame. Our curriculum is very structured. It is very difficult to deviate from the department standards. Time and lack of resources are key reasons for not utilizing data collection. Most statistical processes use previous data collected that exists elsewhere. While I feel that such data collection labs would be helpful to the instruction of some math concepts, many of my students lack the skills necessary to be successful in carrying out such an activity. I feel that teaching these skills would require incorporating them into a routine that would be difficult to keep up with for chapters for which data collection laboratory assignments are less relevant. I also feel that other support systems need to be in place to help students understand the proper behavior during such activities. Where I am cuirrently (sic) stationed at, we only have access to two computer labs. Due to the lack of resources that we have, I have avoided doing these types of activities. I haven't had the opportunity to look and see how to incorporate data collection within my current classroom setting.
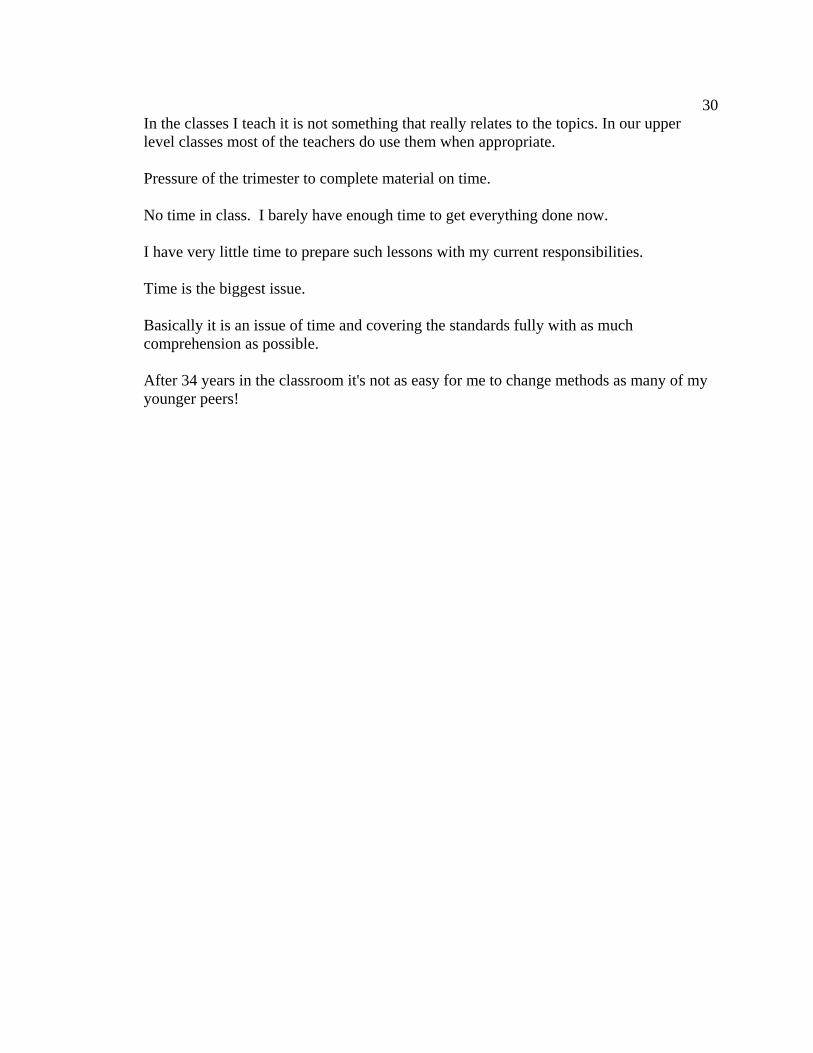
30In the classes I teach it is not something that really relates to the topics. In our upper level classes most of the teachers do use them when appropriate. Pressure of the trimester to complete material on time. No time in class. I barely have enough time to get everything done now. I have very little time to prepare such lessons with my current responsibilities. Time is the biggest issue. Basically it is an issue of time and covering the standards fully with as much comprehension as possible. After 34 years in the classroom it's not as easy for me to change methods as many of my younger peers!

31Appendix D
Comments from teachers about why they do not incorporate more data collection activities into their math lessons than they currently do. I don't have time to search out activities and PLAN out the activity. Students understand the concepts of the graphs, mean, median, mode, etc without having to take the time to get the data. I find other units need the extra time rather than the data chapter. We are on a trimester schedule and are required to cover a specific amount of lessons in the 12-week period. It is a real challenge to get through the chapters and therefore the first things that is cut from my lessons are anything ivolving (sic) math manipulatives and data collection. Doesn't always fit lessons. I would like more lessons available so that I don't have to make up so many from scratch. I believe the primary reason teachers don't incorporate data collection in a math class is amount of material that must be covered. It is also important to have data collection mean something mathematically. Often the time spent collecting actual data can be bypassed if you want to simply analyze data in a mathematical manner. The scientific methods of collecting meaningful data put emphasis on science and technology as opposed to mathematical analysis. If the two subjects (math and science) were to be taught simultaneously one could justify taking the time to collect data in a meaningful way before analyzing it. There is a difference in my schedule between MATH and STATISTICS courses. In my stats courses, I use data collection activities frequently. In Pre-calculus, I collect data only 1-2 times per year since the emphasis of the course is not on data and statistics, but more on functions and trigonometry. Our statistics text has plenty of real data sets for use in various problems. Students collect data for the (sic) own end-of-course research project. Otherwise, data collection is not really relevant to geometry. Working on using Science class data at this time :) You have to really keep the students on task when they are doing this kinds of activities and a lot of times one or two students end up doing all the work:)

32Appendix E
Free Fall
Purpose: In this lab you will collect free fall data using a motion detector and your calculator. You will then look at the data to see what kind of mathematical function the data will model and write an equation. Materials: motion sensor, graphing calculator, pillow
Pre-lab: 1. In Physics we use the equation d = ½ gt2 to find the distances(d) that a free-falling object will drop in relation to the amount of time (t) that the object is in free-fall. Use g = 10m/s2 for acceleration due to gravity and neglect air resistance. Time interval (sec) Distance fallen (m) D1 D2
0 0 ---------------- ---------------- 1 ---------------- 2 3 4 5 6 7 8 9 10
2. In the D1 column, find the common differences for the distance fallen. In the D2 column, find the differences between the D1 column. The D2 column should be constant values if you’ve done your work correctly. Constant D2 values indicate that the data represents a quadratic function like y = ax2 + bx + c.
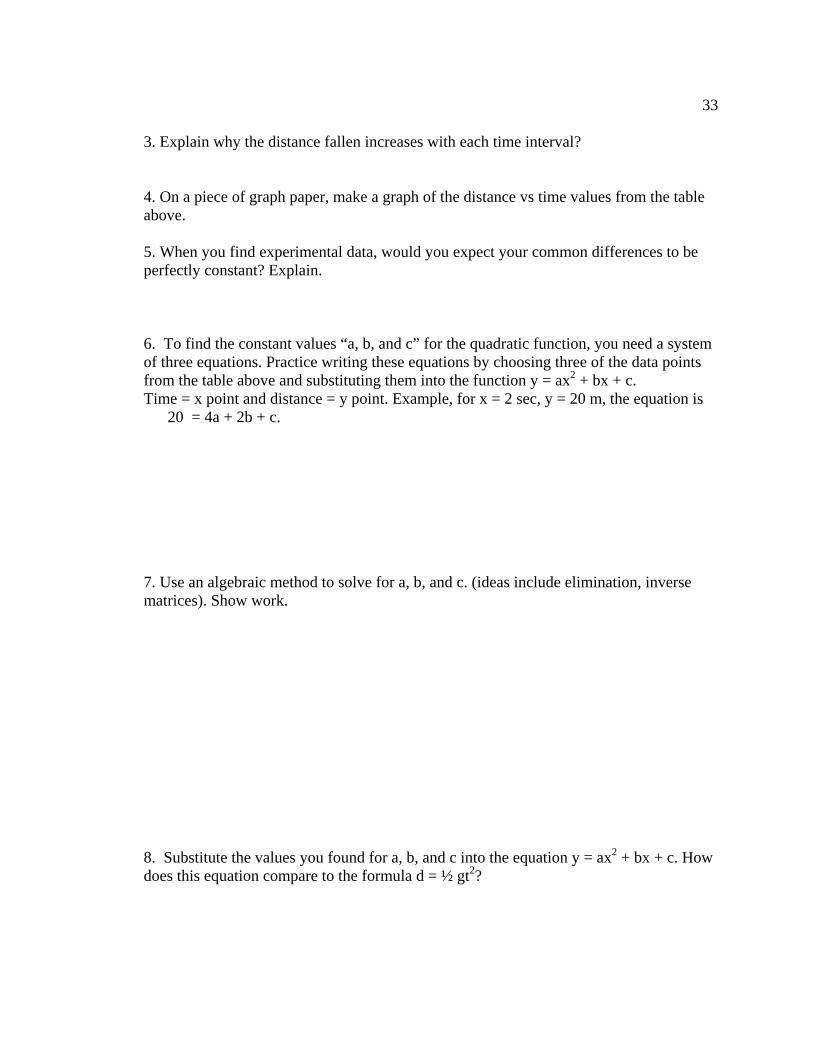
33 3. Explain why the distance fallen increases with each time interval? 4. On a piece of graph paper, make a graph of the distance vs time values from the table above. 5. When you find experimental data, would you expect your common differences to be perfectly constant? Explain. 6. To find the constant values “a, b, and c” for the quadratic function, you need a system of three equations. Practice writing these equations by choosing three of the data points from the table above and substituting them into the function y = ax2 + bx + c. Time = x point and distance = y point. Example, for x = 2 sec, y = 20 m, the equation is
20 = 4a + 2b + c. 7. Use an algebraic method to solve for a, b, and c. (ideas include elimination, inverse matrices). Show work. 8. Substitute the values you found for a, b, and c into the equation y = ax2 + bx + c. How does this equation compare to the formula d = ½ gt2?

34 Procedure: 1. Using the ranger program, at the main menu go to set up and enter the following: real time: no time: 5 display: dist begin on: (trigger) smoothing: light units: meter The sensor will collect distance data every .053 seconds for 5 seconds. 2. Arrow up to start now. Place the sensor and calculator on the floor. Hold a soft object about 2 meters directly above the sensor. Press the trigger button, then release the object so it falls straight. Check your graph to make sure the sensor recorded your falling object correctly and the graph looks appropriate. What should the graph look like? Perform again if necessary. 3. Clean up materials. Data: 1.Trace the points on the drop part of your graph and copy 10 sets of x and y data points onto your data table so that x is an arithmetric sequence. 2. Enter your time values(x) into L1 on your calculator. Enter your distance values(y) into L2. 3. Find the differences in your distances, D1, and enter into L4 on your calculator. Use your calculator to perform common differences for a list. With your lists displayed on the screen, arrow the curser so L4 is highlighted. Then enter 2nd (List) OPS 7 ΔList L2 . Copy these values onto your data table. 4. Enter your time values into L3. Do not enter the first value so that you have the same number of entries as in L4. 5. Stop if D1 values are nearly constant. Continue if not. 6. Enter your time values into L5. Do not enter the first two values. Use your calculator to find the second differences in your distances, D2, and enter into L6.
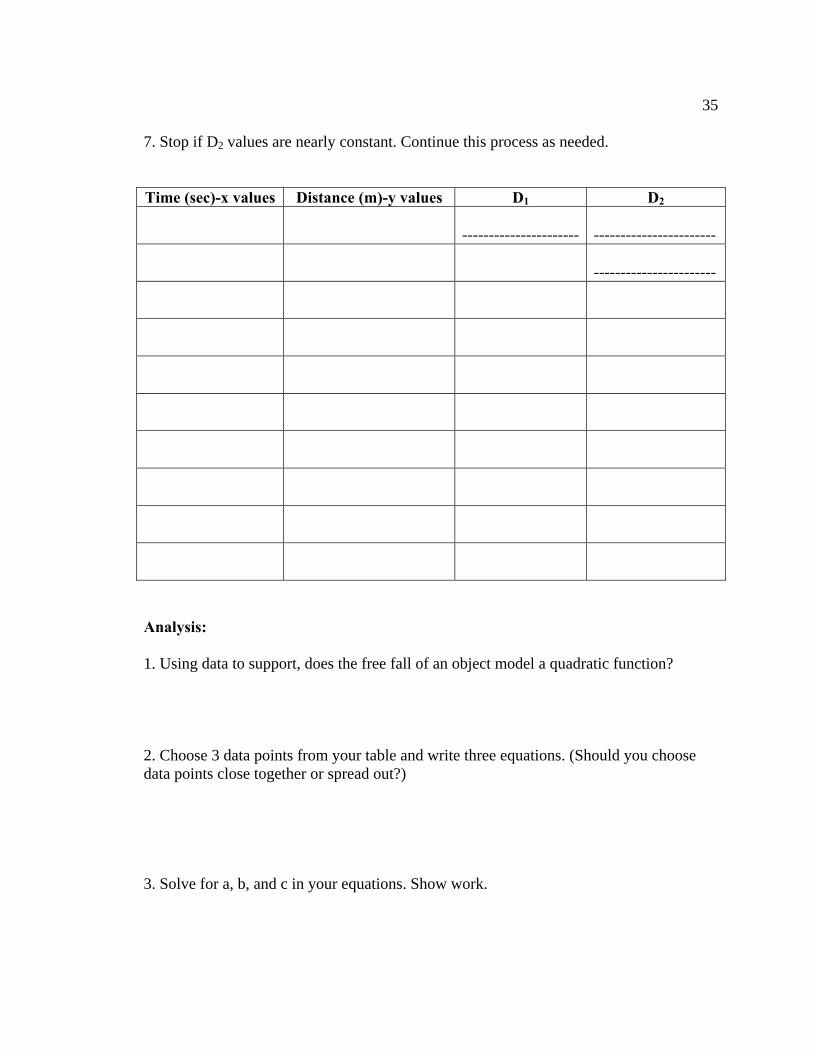
35 7. Stop if D2 values are nearly constant. Continue this process as needed. Time (sec)-x values Distance (m)-y values D1 D2
----------------------
-----------------------
-----------------------
Analysis: 1. Using data to support, does the free fall of an object model a quadratic function? 2. Choose 3 data points from your table and write three equations. (Should you choose data points close together or spread out?) 3. Solve for a, b, and c in your equations. Show work.

364. Substitute the values you found for a, b ,and c into the equation y= ax2 + bx + c. How does this equation compare to the formula d = ½ gt2 ? Account for the differences in the equation created by having the object fall toward the motion sensor instead of away. 5. What should the graph of D1 values compared to time values look like? Using StatPlot, view the graph of L3 and L4 to see the graph. Show the shape of the graph . 6. What should the graph of D2 values compared to time values look like? Using StatPlot, view the graph of L5 and L6 to see the graph. Show the shape of the graph.

37Teacher notes:
• Course level- This activity would be most appropriate for students in Algebra 2.
• Concepts covered- quadratic equations, system of equations, free-fall, gravitational acceleration
• This lab was based on an activity found in Discovering Advanced Algebra, 2004
published by Key Curriculum Press
• Set-up- I tried collecting data by having the object fall away from the sensor which was clamped to a ring stand resting on a lab table. The data was never as smooth as when the object fell toward the sensor.
Data: Original graph of distance vs. time Sample data
L1 time L2 distance L3 time L4 D1 L5 time L6 D2 0.2688 2.22783 0.32256 -0.02723 0.37632 -0.02517 0.32256 2.2006 0.37632 -0.0524 0.43008 -0.0259 0.37632 2.1482 0.43008 -0.0783 0.48384 -0.0235 0.43008 2.0699 0.48384 -0.1018 0.5376 -0.0234 0.48384 1.9681 0.5376 -0.1252 0.59136 -0.0214 0.5376 1.8429 0.59136 -0.1466 0.64512 -0.0216 0.59136 1.6963 0.64512 -0.1672 0.69888 -0.0197 0.64512 1.5291 0.69888 -0.1869 0.69888 1.3422
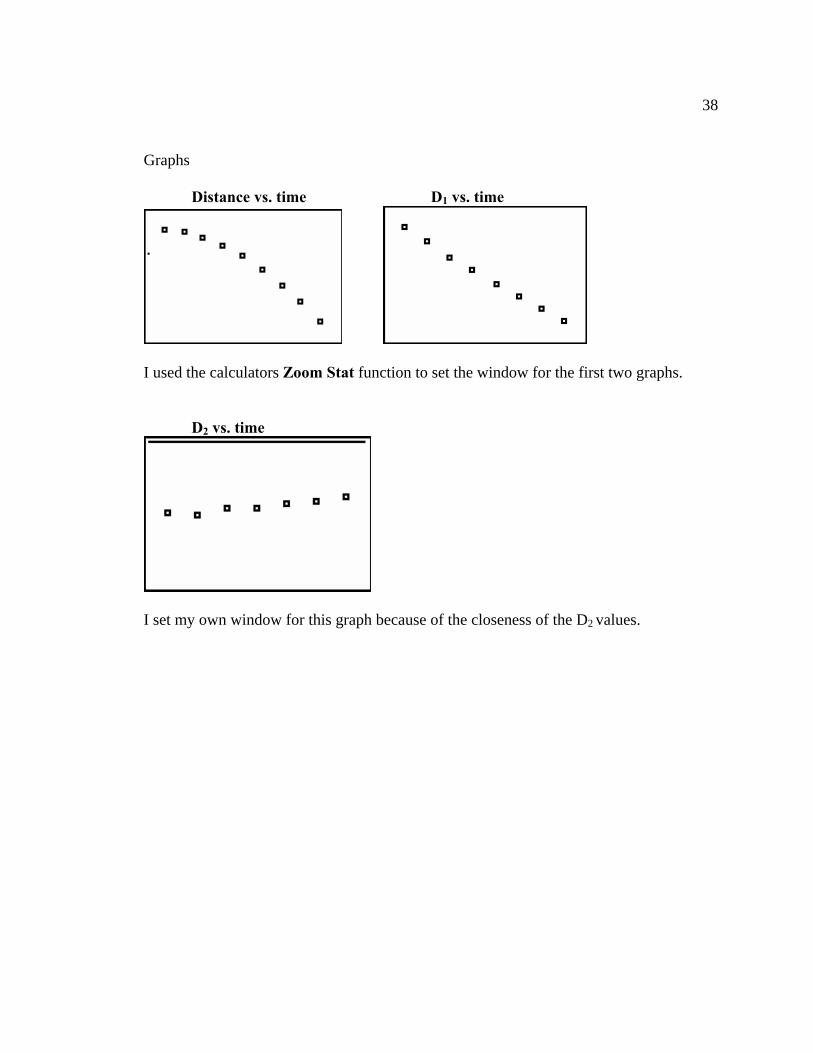
38 Graphs Distance vs. time D1 vs. time
I used the calculators Zoom Stat function to set the window for the first two graphs. D2 vs. time
I set my own window for this graph because of the closeness of the D2 values.
39Appendix F
Skittlelium Decay Purpose: In this lab you will simulate radioactive decay using Skittles®
candies to represent radioactive nuclei. You will graph class data and find an equation to model the data. Materials: cup with 50 Skittles® candies Pre-lab: 1. What is radioactive decay? 2. What is half-life? Procedure:
1. Shake the 50 Skittles® in your cup and gently pour them on a paper towel. The Skittles® are the nuclei of a radioactive element called Skittlelium. Sort your Skittles® into 2 piles. One pile should have the “S” facing down and the other pile should have the “S” facing up. Those candies with the “S” facing down have just decayed and should be removed (and eaten immediately). Count those that remain and record your data for throw #1 on the data table.
2. Continue this process until all of the radioactive Skittlelium are gone.
3. Combine the class data for each trial on your data table.
Data:
Throw # Number of radioactive nuclei
Class total of radioactive nuclei
0 50 1 2 3 4 5 6 7 8 9 10

40Analysis:
1. Look at the column for class data. What is happening to the number of radioactive Skittlelium remaining each consecutive toss?
2. What type of function models this kind of data? 3. Write the general equation for this mathematical expression.
4. Make a graph of the class data on your calculator. Make the independent variable
the # of tosses and the dependent variable the # of radioactive Skittlelium remaining.
Draw what your graph looks like. Label the axis.
5. For each trial(throw), write an equation and solve for the rate. Show work.
average rate = Write an equation using your average rate value.
6. Explain what the value of your rate means or indicates.
7. Use the calculator to fit your data to an exponential regression equation. Write the equation.
8. Copy this equation in your y= window and graph this equation with your
experimental graph. Comparing the graphs, how does this graph fit your data?
41Science connection:
The rate that you measured in this experiment is the half-life of your Skittlelium element. A better label for your x-axis on your graph would be “number of half-lives” instead of “toss #”. Throughout radioactive decay the half-life or rate of decay for an element is constant. It is not affected by environmental conditions such as temperature and pressure.
Questions: 1. A radioactive nuclei has a half life of 4 days. If you start with a 500 gram sample,
how much of the sample will you have in the following amount of time?
4 days _____________ 8 days ______________ 10 days _____________ Write an equation for this data. Check your answers using the equation.
2. Thorium-234 has a half-life of 24.1 days. If you start with a 100 gram sample and
you have 12.5 grams remaining, how many half-lives have passes? Write an equation to solve for # of half-lives.

42Teacher Notes
• Course level- This activity would be appropriate for students in Algebra 2.
• Concepts covered-exponential decay, radioactivity and half-life
• Materials- 2 bags of Skittles® per class were enough if students work in pairs and are given 50 Skittles . I give my students a few extra credit points for bringing in candy for labs.
Answers to pre-lab questions
1. Radioactive decay is when the nuclei of unstable atoms break down into other particles in order to gain stability. Eventually, stable non-radioactive atoms are formed. The process is accompanied by the emission of energy.
2. Half-life is the amount of time it takes for half of the mass of a sample to decay.
This time can be a fraction of a second or billions of years depending on the types of radioactive material.
Sample data
throw # class total of radioactive nuclei 0 450 1 223 2 111 3 56 4 24 5 12 6 7 7 5 8 3
Window Graph

43Graphing instructions
• To enter data into lists, press STAT, EDIT. In List 1, input # of tosses and in List 2, input # of radioactive Skittlelium remaining.
• Set window. • To turn on the graph, press STAT PLOT and turn on plot 1. For X List: L1
and for YList: L2. • To fit an equation, press STAT, CALC. Arrow down to 0: ExpRegression.
After you see ExpReg on the screen enter L1,L2 and enter. You will be given the values for the equation.
• To graph this equation with your experimental equation, after L2 , enter , VARS , Y-VARS, 1: Function, Y1 then enter. Both graphs will be displayed together.
Answers to questions
1. 4 days- 250 grams, 8 days-125 grams, 10 days-88 grams y = 500 (.5)x
2. 12.5 = 100(.5)x x = 3 half-lives

44Appendix G
Comparing Pennies Purpose: In this lab you will measure the density of pre-1983 pennies and post-1983 pennies. You will graph your results and find an equation to fit the data. Introduction: The U.S. government changed the composition of the penny throughout 1983 due to rising copper prices. Before 1983, the penny was made of copper. Following the change, the penny has been made with a zinc center and a copper coating. Materials: 100 ml graduated cylinder, older and newer pennies, electronic balance Pre-lab:
1. What is density?
2. What is the formula for calculating density of an object?
3. What kinds of objects have density? Procedure:
1. Sort a handful of pennies into a pre-1983 pile and a post-1983 pile. You need 25 for each pile. Do not use 1983 pennies.
2. Mass 5 pre-1983 pennies with an electronic balance. Record. 3. Fill your 100 ml graduated cylinder with precisely 40.0 ml of water.
Remember to read from the bottom of the meniscus and read to the correct precision which would be one tenth of a milliliter. Record this as the initial volume for each set of data. Carefully drop in the 5 pennies and read the new volume. Record. Subtract to find the volume of the 5 pennies.
4. Mass 5 more pennies. Record and then total the mass of the 10 pennies. 5. Add these 5 pennies to the graduated cylinder. Record the final volume of the
10 pennies. 6. Continue adding 5 pennies at a time until you reach 25 pennies. 7. Drain the water and pour your pennies on a paper towel. 8. Calculate the density of the pennies for each set of data using the formula
from your pre-lab.
9. Repeat with post-1983 pennies .

45Data: pre-1983 penny
# of pennies
Mass of 5 additional pennies (g)
Total mass of pennies
(g)
Initial volumeof H2O
(ml)
Final volume of H2O (ml)
Volume of pennies
(ml)
Calculated density (g/ml)
5
10
15
20
25
post-1983 penny
# of pennies
Mass of 5 additional pennies (g)
Total mass of pennies
(g)
Initial volume of H2O
(ml)
Final volume of H2O (ml)
Volume of pennies
(ml)
Calculated density (g/ml)
5
10
15
20
25
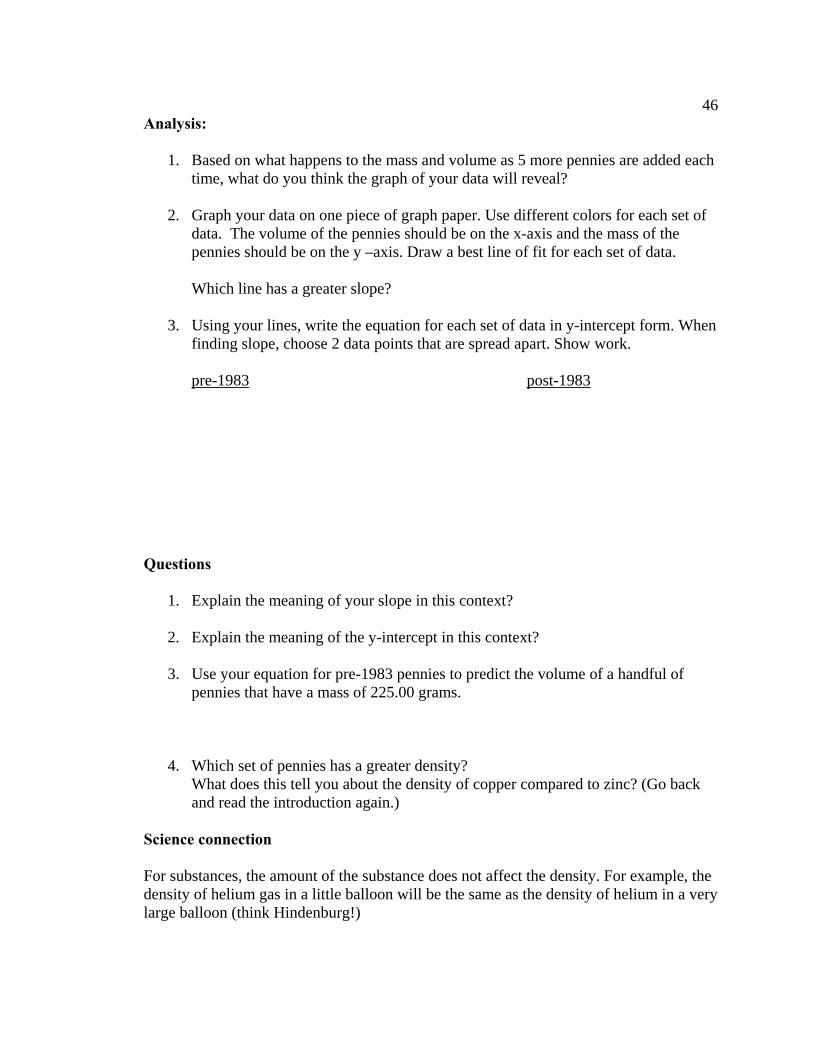
46Analysis:
1. Based on what happens to the mass and volume as 5 more pennies are added each time, what do you think the graph of your data will reveal?
2. Graph your data on one piece of graph paper. Use different colors for each set of
data. The volume of the pennies should be on the x-axis and the mass of the pennies should be on the y –axis. Draw a best line of fit for each set of data.
Which line has a greater slope?
3. Using your lines, write the equation for each set of data in y-intercept form. When
finding slope, choose 2 data points that are spread apart. Show work.
pre-1983 post-1983
Questions
1. Explain the meaning of your slope in this context?
2. Explain the meaning of the y-intercept in this context?
3. Use your equation for pre-1983 pennies to predict the volume of a handful of pennies that have a mass of 225.00 grams.
4. Which set of pennies has a greater density? What does this tell you about the density of copper compared to zinc? (Go back and read the introduction again.)
Science connection For substances, the amount of the substance does not affect the density. For example, the density of helium gas in a little balloon will be the same as the density of helium in a very large balloon (think Hindenburg!)

475. Use your data to explain why the density of the pennies remains constant as
you add more and more pennies.
6. Which will have a greater density? a small ice cube (1” x 1” x 1”) or a large ice
cube ( 1’ x 1’ x 1’)
7. What can be done to an object that will change its density?
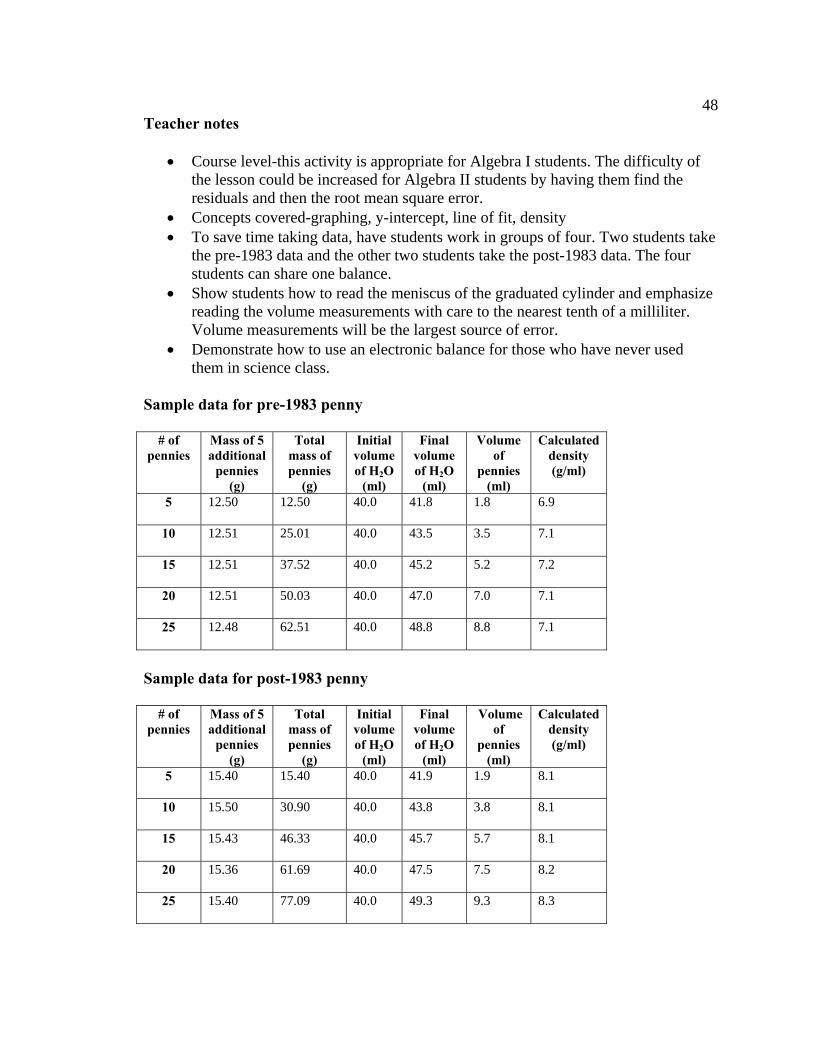
48Teacher notes
• Course level-this activity is appropriate for Algebra I students. The difficulty of the lesson could be increased for Algebra II students by having them find the residuals and then the root mean square error.
• Concepts covered-graphing, y-intercept, line of fit, density • To save time taking data, have students work in groups of four. Two students take
the pre-1983 data and the other two students take the post-1983 data. The four students can share one balance.
• Show students how to read the meniscus of the graduated cylinder and emphasize reading the volume measurements with care to the nearest tenth of a milliliter. Volume measurements will be the largest source of error.
• Demonstrate how to use an electronic balance for those who have never used them in science class.
Sample data for pre-1983 penny
# of pennies
Mass of 5 additional
pennies (g)
Total mass of pennies
(g)
Initial volume of H2O
(ml)
Final volume of H2O
(ml)
Volume of
pennies (ml)
Calculated density (g/ml)
5
12.50 12.50 40.0 41.8 1.8 6.9
10
12.51 25.01 40.0 43.5 3.5 7.1
15
12.51 37.52 40.0 45.2 5.2 7.2
20
12.51 50.03 40.0 47.0 7.0 7.1
25
12.48 62.51 40.0 48.8 8.8 7.1
Sample data for post-1983 penny
# of pennies
Mass of 5 additional
pennies (g)
Total mass of pennies
(g)
Initial volume of H2O
(ml)
Final volume of H2O
(ml)
Volume of
pennies (ml)
Calculated density (g/ml)
5
15.40 15.40 40.0 41.9 1.9 8.1
10
15.50 30.90 40.0 43.8 3.8 8.1
15
15.43 46.33 40.0 45.7 5.7 8.1
20
15.36 61.69 40.0 47.5 7.5 8.2
25
15.40 77.09 40.0 49.3 9.3 8.3
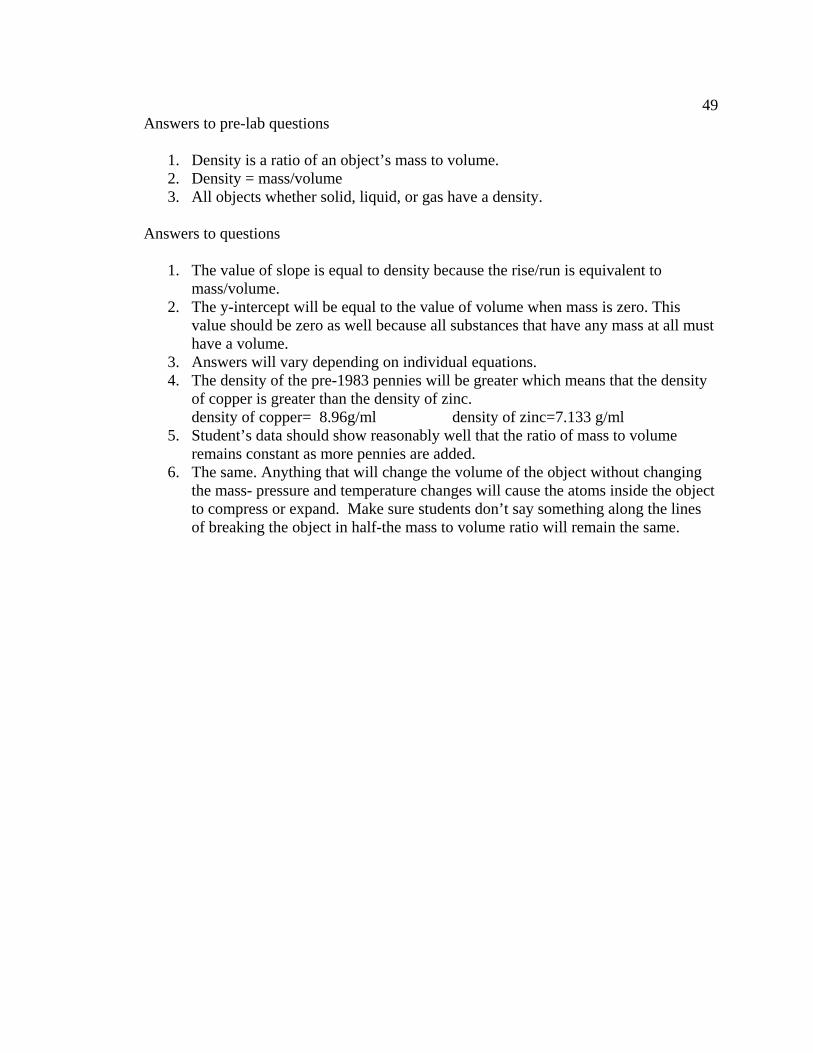
49Answers to pre-lab questions
1. Density is a ratio of an object’s mass to volume. 2. Density = mass/volume 3. All objects whether solid, liquid, or gas have a density.
Answers to questions
1. The value of slope is equal to density because the rise/run is equivalent to mass/volume.
2. The y-intercept will be equal to the value of volume when mass is zero. This value should be zero as well because all substances that have any mass at all must have a volume.
3. Answers will vary depending on individual equations. 4. The density of the pre-1983 pennies will be greater which means that the density
of copper is greater than the density of zinc. density of copper= 8.96g/ml density of zinc=7.133 g/ml
5. Student’s data should show reasonably well that the ratio of mass to volume remains constant as more pennies are added.
6. The same. Anything that will change the volume of the object without changing the mass- pressure and temperature changes will cause the atoms inside the object to compress or expand. Make sure students don’t say something along the lines of breaking the object in half-the mass to volume ratio will remain the same.