the use of environmental functions to evaluate management ...pubs.iied.org/pdfs/8134iied.pdf · the...
TRANSCRIPT

The Use Of EnvironmentalFunctions To EvaluateManagement Strategies ForThe Pagbilao MangroveForest
A.J. Gilbert and R. Janssen
CREED Working Paper No 15
August 1997

Alison Gilbert is a Senior Environmental Scientist and Ron Janssen is a Senior Economist. They becontacted at the Institute for Environmental Studies (IVM):
Institute for Environmental StudiesVrije Universiteitde Boelelaan 11151081 HV AmsterdamTHE NETHERLANDS
Tel: +31 20 444 9555Fax: +31 20 444 9553Email: [email protected]
The programme of Collaborative Research in the Economics of Environment and Development(CREED) was established in 1993 as a joint initiative of the International Institute for Environmentand Development (IIED), London, and the Institute for Environmental Studies (IVM), Amsterdam.The Secretariat for CREED is based at IIED in London. A Steering Committee is responsible foroverall management and coordination of the CREED Programme.
Environmental Economics Programme, IIED
IIED is an independent, non-profit organisation which seeks to promote sustainable patterns ofworld development through research, training, policy studies, consensus building and publicinformation. The Environmental Economics Programme is one of seven major programmes of IIED;it conducts economic research and policy analysis for improved management of natural resourcesand sustainable economic growth in the developing world.
Environmental Economics ProgrammeIIED, 3 Endsleigh StreetLondon WC1H 0DD, UKTel (44 171) 388 2117; Fax (44 171) 388 2826e-mail: [email protected]
Institute for Environmental Studies, (IVM)
IVM is a non-profit research institute, based at Vrije Universiteit, Amsterdam. The Institute's primaryobjective is to carry out multi- and interdisciplinary research on environmental issues, based oncross-fertilisation of monodisciplinary sciences. Environment and the Third World is one of eightmajor IVM research programmes.
IVM, Vrije UniversiteitDe Boelelaan 11151081 HV AmsterdamThe NetherlandsTel: +31 20 444 9555; Fax: +31 20 444 9553e-mail:[email protected]
CREED Steering Committee members include:
Prof Johannes Opschoor, Institute for Social Studies, The Netherlands (Chair)Prof Gopal Kadekodi, Institute of Economic Growth, IndiaDr Ronaldo Seroa da Motta, IPEA, BrazilDr Mohamud Jama, Institute for Development Studies, KenyaDr Anantha Duraiappah, IVM, The NetherlandsProf Harmen Verbruggen, IVM, The NetherlandsJoshua Bishop, IIED, UKMaryanne Grieg-Gran, IIED, UK

Abstract
Mangroves are part of rich ecosystems providing a variety of environmental goods and services.Underestimation of their value and of the impacts of human activities is a major factor contributingto the widespread loss and degradation of ecosystems. Economists frequently receive the blame forsuch environmental ills, but it may also be argued that ecologists inadequately communicate theirknowledge to decision makers and therefore have limited influence. This article links informationsupplied by ecologists to the information required for effective and efficient mangrovemanagement. A key problem which ecologists face is the high degree of interconnectedness withinand between ecosystems. This makes it difficult to predict what is going to happen let aloneunderstand what is going on. The concept of ‘environmental function’ is used in combination withsystems diagrams to address this problem. System diagrams are used to identify and assess goods andservices produced by the system under different management regimes. These goods and services arethen valued to enable assessment of the economic efficiency of the management regimes.
Abrégé
Les mangroves font partie de riches écosystèmes fournissant toute une variété de biens et servicesenvironnementaux. La sous-estimation de leur valeur et de l’impact des activités humaines à leurégard est un facteur essentiel de la perte et de la dégradation universelle des écosystèmes. C’est auxéconomistes qu’on fait souvent porter le blâme pour ces difficultés écologiques, mais on peut aussiestimer que les écologistes communiquent bien mal leurs connaissances aux décideurs et n’exercentdonc qu’une influence limitée. Ce texte établit un lien entre les informations fournies par lesécologistes et celles requises pour une gestion efficace des mangroves. Un des prolèmes-clésrecontrés par les écologistes tient au degré élevé d’interconnexion existant au sein des écosystèmeset entre eux, ce qui rend difficile toute prévision de ce qui va se passer, voire même lacompréhension des phénomènes en cours. Le concept de ‘fonction environnementale’ estemployé de concert avec des graphiques systémiques afin de traiter ce problème. Les graphiquessystémiques servent à identifier et à évaluer les biens et services produits par un écosystème selondifférents régimes de gestion. Ces biens et services sont ensuite évalués de manière à faciliterl’estimation de l’efficacité économique de chaque régime de gestion.
Resumen
Los manglares hacen parte de ricos ecosistemas que ofrecen una gran variedad de bienes y serviciosambientales. El subestimar su valor y los impactos de las actividades humanas es un factorimportante que contribuye a la degradación de los ecosistemas. Ocurre con frecuencia que a loseconomistas se les culpa por estos problemas ambientales y sin embargo es posible que el hecho deque la influencia de los ecologistas sea limitada se deba a la falta de comunicación entre éstos yquienes toman las decisiones. Este artículo busca establecer vínculos entre la informaciónsuministrada por ecologistas y la requerida para una efectiva y eficiente gestión de los manglares.Un problema central que deben enfrentar los ecologistas es el del alto grado de interconexión queexiste tanto en el interior de los ecosistemas como entre ellos. Esto no sólo dificulta la predicciónde lo que pueda ocurrir sino también la comprensión de lo que está sucediendo. Con relación a esteproblema en esta monografía se ha usado el concepto de “función ambiental” en combinación condiagramas de sistemas. Estos se usan para identificar y evaluar los bienes y servicios producidos porecosistemas bajo diversos esquemas de gestión. Para facilitar una evaluación de la eficienciaeconómica de los esquemas de gestión a estos bienes y servicios se les asigna un valor económico.
Acknowledgements
This article presents results from the project “Economic valuation of mangrove-fish pondinteractions”. This project is part of the program for “Collaborative Research in the Economicsof Environment and Development (CREED)” which is funded by the Directorate ofInternational Co-operation of the Dutch Ministry of Foreign Affairs. The authors would like tothank Dr Jose E. Padilla, Dr M.S. delos Angeles, Dr A. Carandang, Dr P. Ong and M. Tanaelfrom Resources, Environment and Economics Centre for studies Inc., Pasig City, Philippines fortheir contributions to the project, and the three anonymous referees for their thorough review ofthe manuscript and their suggestions for improvement.
Contents
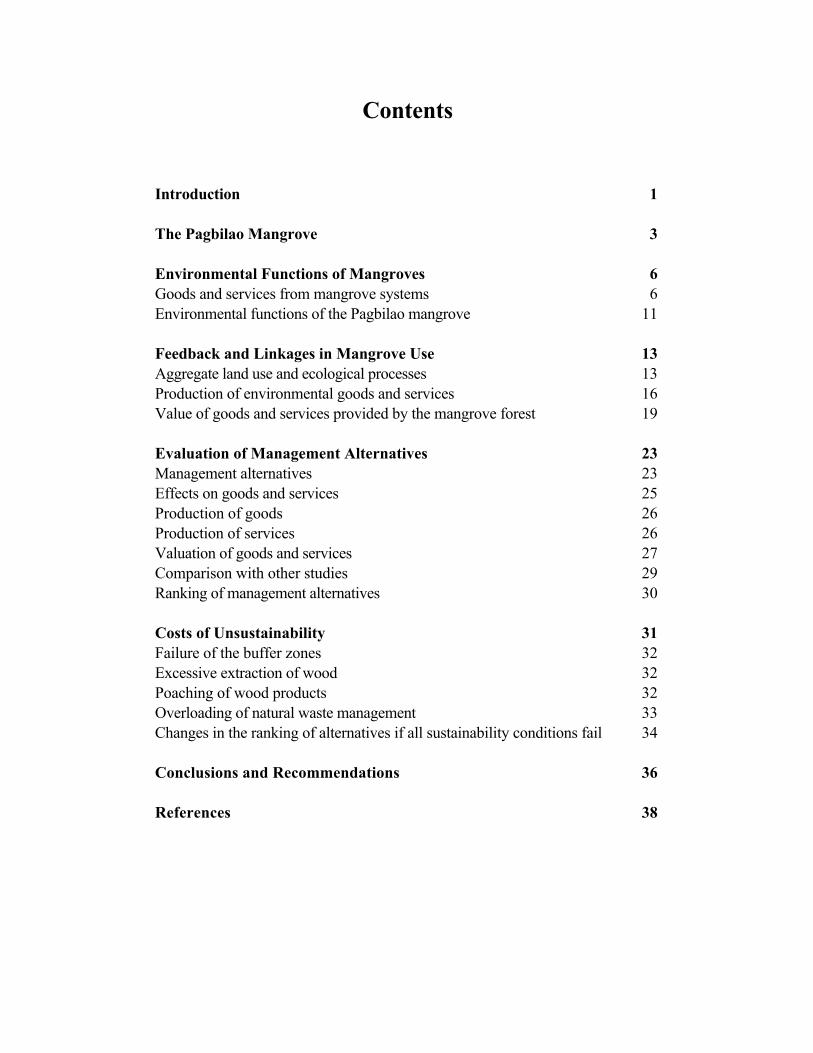
Introduction 1
The Pagbilao Mangrove 3
Environmental Functions of Mangroves 6Goods and services from mangrove systems 6Environmental functions of the Pagbilao mangrove 11
Feedback and Linkages in Mangrove Use 13Aggregate land use and ecological processes 13Production of environmental goods and services 16Value of goods and services provided by the mangrove forest 19
Evaluation of Management Alternatives 23Management alternatives 23Effects on goods and services 25Production of goods 26Production of services 26Valuation of goods and services 27Comparison with other studies 29Ranking of management alternatives 30
Costs of Unsustainability 31Failure of the buffer zones 32Excessive extraction of wood 32Poaching of wood products 32Overloading of natural waste management 33Changes in the ranking of alternatives if all sustainability conditions fail 34
Conclusions and Recommendations 36
References 38

List of tables
Table 1. Environmental functions of the Pagbilao mangrovesTable 2. Goods and services under different management alternativesTable 3. Annual contribution to total value of the management alternativesTable 4. A comparison of net annual benefits of mangrove products and functionsTable 5. Problem variables triggered by failure of management conditionsTable 6. Change in annual contribution to total value of the management alternatives in
case of unsustainability
List of figures
Figure 1 The Pagbilao regionFigure 2 Fishponds near the Pagbilao mangrove forestFigure 3 Functions of the natural environment (adapted from de Groot 1992)Figure 4 Mangroves on the coastal edge of the Pagbilao mangrove forestFigure 5 Rhizophora and Avicennia mangalsFigure 6 Explanation of symbols usedFigure 7 Structure of the systems diagramsFigure 8 Aggregate dynamics and ecological processesFigure 9 Production of environmental goods by the Pagbilao mangrovesFigure 10 Provision of environmental services by the Pagbilao mangrovesFigure 11 Values of environmental goods provided by the Pagbilao mangrovesFigure 12 Values of environmental services provided by the Pagbilao mangroves

Introduction
Mangroves are salt-tolerant trees or shrubs found along low-energy, tidal shorelines betweenlatitudes in tropical and subtropical areas (approximately between 30oN and 30oS). Theycolonise newly formed tidal flats in the wind and wave shadows of promontories and islands,and behind wave-absorbing sand bars and seagrass beds (Carter, 1988). As much as 75 percentof low-lying tropical coastlines with freshwater drainage support mangrove ecosystems (WRIand IUCN, 1986). Mangroves provide the basis for complex and extensive ecosystems at theinterface of terrestrial, freshwater and marine ecosystems (eg, Mann, 1982; Carter, 1988;Robertson and Alongi, 1992).
Mangroves are part of rich ecosystems providing a variety of environmental goods and services.In traditional economies the exploitation of mangrove resources is usually not intensive andsettlement is quite sparse. In South East Asia this has been attributed to the scarcity offreshwater for domestic use and the unsuitability of mangrove soils for long-term agriculturaluse. Recently exploitation of mangrove forests has intensified as traditional economies becomeincreasingly market-integrated and modernised. The building of roads, provision of amenities inthese areas, and improvements in technology have provided the impetus. As a result of thistransition in use of mangrove forests, mangrove cover in the Philippines has reduced from itoriginal 288,035 ha. in 1970 to 123,400 ha. by 1993.
The widespread loss and degradation of mangroves, as well as other ecosystems, may be largelyattributed to an underestimation of their value together with the impact of human activities.Economists frequently receive the blame for such environmental ills. However, it may also beargued that ecologists inadequately communicate their knowledge to decision makers andtherefore have limited influence. This paper links information supplied by ecologists to theinformation required for effective and efficient mangrove management.
Ecologists face two difficulties. The first is that an anthropocentric viewpoint is often seen asincompatible with the study of ecology. Consideration of human activities tends to be ‘added-on’, much as the environment is ‘added-on’ to economics. The second is the high degree ofinterconnectedness within and between ecosystems. This makes it difficult to predict what isgoing to happen let alone understand what is going on. These two aspects are addressed in thispaper through the concept of ‘environmental function’ used in combination with systemsdiagrams. The result is qualitative information on the direction and desirability of ecosystemchanges under alternative management regimes.
This paper aims to demonstrate the use of environmental functions to evaluate managementstrategies for the Pagbilao mangrove forest. It presents results from the project “Economicvaluation of mangrove-fish pond interactions”.

The structure of this paper is as follows.
• Description of the study site• Specification of the environmental functions• Description of feedbacks and linkages using systems diagrams to identify and value goods
and services produced by the mangrove forest• Specification and valuation of management alternatives assuming sustainability• Assessment of the changes in these values should sustainability conditions fail• Conclusions and recommendations
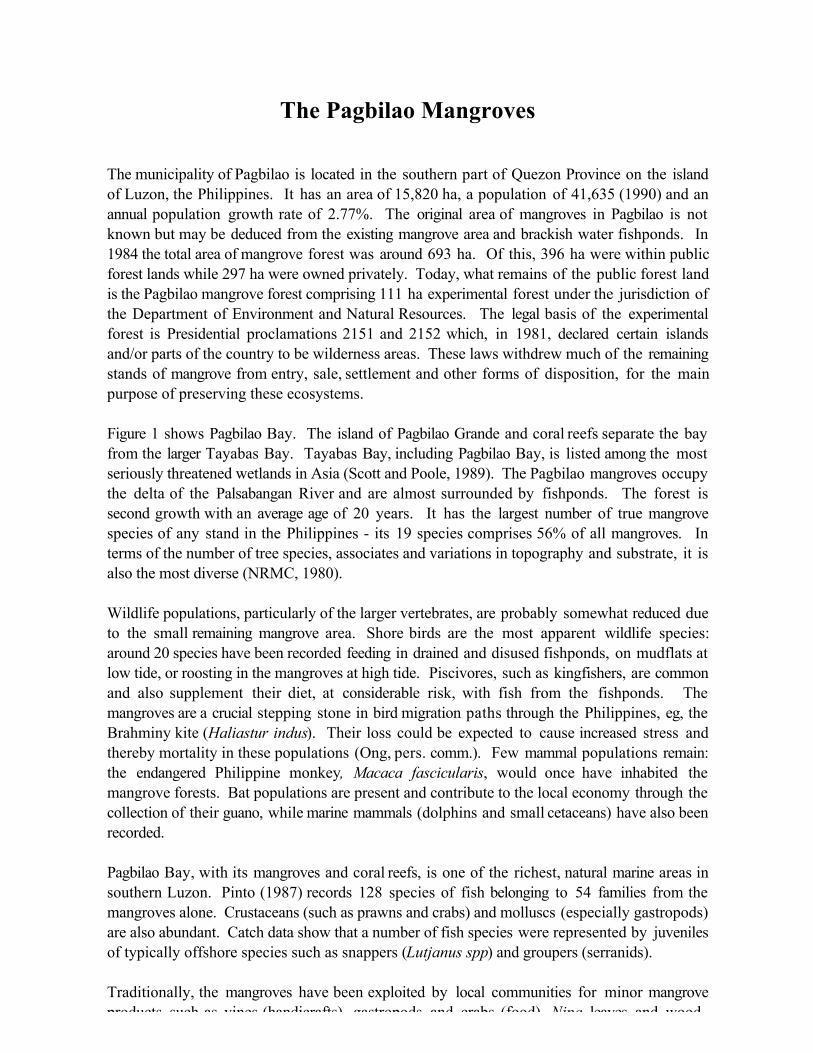
The Pagbilao Mangroves
The municipality of Pagbilao is located in the southern part of Quezon Province on the islandof Luzon, the Philippines. It has an area of 15,820 ha, a population of 41,635 (1990) and anannual population growth rate of 2.77%. The original area of mangroves in Pagbilao is notknown but may be deduced from the existing mangrove area and brackish water fishponds. In1984 the total area of mangrove forest was around 693 ha. Of this, 396 ha were within publicforest lands while 297 ha were owned privately. Today, what remains of the public forest landis the Pagbilao mangrove forest comprising 111 ha experimental forest under the jurisdiction ofthe Department of Environment and Natural Resources. The legal basis of the experimentalforest is Presidential proclamations 2151 and 2152 which, in 1981, declared certain islandsand/or parts of the country to be wilderness areas. These laws withdrew much of the remainingstands of mangrove from entry, sale, settlement and other forms of disposition, for the mainpurpose of preserving these ecosystems.
Figure 1 shows Pagbilao Bay. The island of Pagbilao Grande and coral reefs separate the bayfrom the larger Tayabas Bay. Tayabas Bay, including Pagbilao Bay, is listed among the mostseriously threatened wetlands in Asia (Scott and Poole, 1989). The Pagbilao mangroves occupythe delta of the Palsabangan River and are almost surrounded by fishponds. The forest issecond growth with an average age of 20 years. It has the largest number of true mangrovespecies of any stand in the Philippines - its 19 species comprises 56% of all mangroves. Interms of the number of tree species, associates and variations in topography and substrate, it isalso the most diverse (NRMC, 1980).
Wildlife populations, particularly of the larger vertebrates, are probably somewhat reduced dueto the small remaining mangrove area. Shore birds are the most apparent wildlife species:around 20 species have been recorded feeding in drained and disused fishponds, on mudflats atlow tide, or roosting in the mangroves at high tide. Piscivores, such as kingfishers, are commonand also supplement their diet, at considerable risk, with fish from the fishponds. Themangroves are a crucial stepping stone in bird migration paths through the Philippines, eg, theBrahminy kite (Haliastur indus). Their loss could be expected to cause increased stress andthereby mortality in these populations (Ong, pers. comm.). Few mammal populations remain:the endangered Philippine monkey, Macaca fascicularis, would once have inhabited themangrove forests. Bat populations are present and contribute to the local economy through thecollection of their guano, while marine mammals (dolphins and small cetaceans) have also beenrecorded.
Pagbilao Bay, with its mangroves and coral reefs, is one of the richest, natural marine areas insouthern Luzon. Pinto (1987) records 128 species of fish belonging to 54 families from themangroves alone. Crustaceans (such as prawns and crabs) and molluscs (especially gastropods)are also abundant. Catch data show that a number of fish species were represented by juvenilesof typically offshore species such as snappers (Lutjanus spp) and groupers (serranids).
Traditionally, the mangroves have been exploited by local communities for minor mangroveproducts such as vines (handicrafts), gastropods and crabs (food), Nipa leaves and wood

(construction), and plants and fungi (medicines). In the 1970s, however, they were cut forFigure 1 The Pagbilao Region

commercial fuelwood and charcoal - a major cause of degradation. These activities (with theexception of shell and crab collection) have been prohibited since 1981, although illegal cuttingof pole-sized trees is still evident (Carandang and Padilla, 1996a).
Fishpond development occurred primarily during the 1980s on sites where the mangrove coverhad been degraded. Mangrove strips were maintained to stabilise the dikes and embankmentssurrounding the ponds. Aquaculture in the study area is exclusively monoculture of milkfish(Chanos chanos) by extensive or semi-intensive means (Figure 2). Fishponds are owned bywealthy individuals (a general and an ambassador own fishponds in the study area) who neitherlive in the municipality nor employ local residents to manage them. Figure 2. Fishponds near the Pagbilao mangrove forest
There is a trend in the Philippines towards more intensive aquaculture - higher stocking density,more frequent cropping, use of artificial feeds, fertilisers and pesticides (Padilla and Tanael,1996). Surpluses and wastes from the ponds are released into the nearby aquatic environmentand so may enter the mangrove ecosystem. Soils under mangroves are often acidic and, sinceacidic soils are not suitable for aquaculture, lime may be applied during construction and/orpreparation of ponds for stocking. This may lead to the discharge of very alkaline effluentsinto the aquatic and mangrove environments.
The coastal villages of Pagbilao are dependent on the ecosystem’s support of fishery resourceswhich includes mud crabs and gastropods (foun1`d in and near the mangroves), marine crabs,fish and prawns (taken from the bay). Commercial fishing using trawls is prohibited in the bay

so artisanal techniques are used, including corrals, traps, bottom set gill nets, and hooks andlines.

Environmental Functions of Mangroves
The purpose of this section is to define and elaborate on the concept of environmental functionand hence to specify the environmental functions of the Pagbilao mangroves. A variety ofterms, such as functions, uses, attributes, products, and amenities, have been used to describewhat the natural environment contributes to human societies in order to attribute ananthropocentric perspective to ecology. These terms have been applied both to specify and toclassify the full range of ecological values for inclusion in management deliberations. The term‘environmental function’ is used here. Environmental function has been defined as theprovision of environmental goods and/or services by the natural environment for human use (eg.Braat et al., 1979; de Groot, 1992). De Groot may also be credited with giving the term formby devising a lucid terminology and classification of functions (Figure 3). A total of 37functions grouped into four categories - regulation, carrier, production and information - areidentified.
Mangroves perform nearly all of these functions. However, there is a high degree of interactionamong them. For example, all of the production functions are ultimately dependent on theregulation functions ‘fixation of solar energy and biomass production’, ‘storage and recycling oforganic matter’ and ‘storage and recycling of nutrients’. The ‘storage and recycling of wastesand surpluses’ by mangrove ecosystems also contributes to the ‘regulation of the chemicalcomposition of the oceans’. ‘Fixation of solar energy and biomass production’ also contributesto the ‘regulation of the chemical composition of the atmosphere’ and also to the ‘regulation oflocal and global climate’. While the long list of environmental functions supports the argumentthat mangroves are valuable, interdependencies among functions lead to complications andultimately to confusion. Communication is more effective if the message is simple. Further, itis legitimate to ask why two or more functions should be specified if the ultimate result is onlyone good or service.
The following definition of ‘environmental function’ has been adopted:
a set of ecological processes responsible for the provision of anenvironmental good or service for human use.
The main feature of such a definition is the one-on-one match between environmental functionand good/service. Further, identification of environmental functions is driven by specificationof the goods or services produced. This adds weight to the anthropocentric perspective forecologists, as well as encouraging economists to take more consideration of ecosystems.
Goods and services from mangrove ecosystems
This section discusses the range of environmental goods and services provided by mangroveecosystems as a first step towards identifying the environmental functions of the Pagbilaomangroves (following section). The discussion is based on IUCN (1983), Fisilier (1990), James(1991a & b), Ruitenbeek (1992), Groombridge (1992) and Hirsch and Mauser (1992).

Figure 3: Functions of the natural environment (adapted from de Groot, 1992)

Food and beverages from mangrove ecosystems include fish, crustaceans, shellfish, seacucumbers, other invertebrates, wildlife, honey, condiments, vegetables, tea substitutes, sugar,alcohol, cooking oil, vinegar and fermented drinks. Traditional medicines may also be derivedfrom (plant, fungal, etc.) species. Fish and crustaceans are caught or grown in ponds locatedwithin the mangrove ecosystem. Mangroves may also provide fodder for livestock during thedry season. Mangrove ecosystems also supply raw materials: wood, leaves, Nipa shingles andtannins are used in building and construction. Tannins are also used in the manufacture oftextiles for clothing and household fabrics. Raw materials for industrial purposes include timberand pulp/chipwood from commercial forestry operations and products from plantations ofNipa fruticans which is used to make alcohol for biochemical industries. Mangroves supplyfuel and energy products in firewood and the manufacture of charcoal. Juvenile fish andshellfish suitable for (aqua)cultivation may be captured in mangrove ecosystems. Mangrovepropagules may be collected, reared in nurseries then transplanted in (government-sponsored)reafforestation and afforestation programmes1. Ornamental resources, especially feathers andflowers, may also be derived from mangrove ecosystems.
Species taken from non-mangrove environments, in particular offshore fish and shellfish, maystill constitute an environmental good of mangrove ecosystems. Mangrove ecosystems arewidely held to be primary nursery areas for commercially important species (eg, MacNae,1974; Christensen 1982; WRI and IUCN, 1986) and may contribute to offshore productivityvia the outwelling of detritus (eg,. Carter, 1988). These paradigms have been questioned inrecent years (eg. Ong, 1984 in Fisilier, 1990; Robertson and Duke, 1987; Parrish, 1989; andThollot et al., 1991). It would appear that the picture is much more complicated: the nurseryfunction may be different for different species; some mangroves act more as a sink rather thanas a source of detritus; considerable interaction occurs among mangroves and nearby sea grassbeds, coral reefs and mud flats.
Mangroves stand anchored in inter-tidal and supra-tidal substrates which are frequentlywaterlogged and anoxic. The problem of supplying air to the roots is solved by above-groundroot systems (see Figures 4 and 5) which are an essential element of this ecosystem's physicalstructure. These root systems retard water flow, which leads to a number of environmentalservices. The quiet environment not only encourages sediments to settle but also inhibits theirresuspension. Stabilisation of sediments provides protection to shorelines and associatedshore-based activities, and can even lead to progradation and land gains. Further, the resistancewhich mangroves offer to water flow is particularly important during extreme weather eventssuch as cyclones, typhoons and hurricanes. Mangrove ecosystems mitigate against floodingand flood damage by dissipating the energy of floodwaters.
Mangrove ecosystems function as a sink. Sedimentary processes as well as uptake byorganisms filter through-flowing waters, incorporating extracted substances in the sedimentsand/or in the ecosystem’s biomass. Substances may derive from natural sources as well asvarious human activities such as agriculture (fertiliser and pesticide surpluses), industry(industrial wastes) and settlements (sewage). Consequently mangrove ecosystems mayperform a waste disposal service. The location of fishponds in or adjacent to mangrove
1 This activity occurs in the study area. It was not identified in the literature cited.

ecosystems is, in part, dependent on this service. Mangroves are also a sink for carbon dioxide,and so help mitigate against the Greenhouse Effect.
Figure 4. Mangroves on the coastal edge of the Pagbilao mangrove forest
Interest in species found in mangrove ecosystems may be direct (eg, as a source of food) orindirect. Indirect interest tends to stem from a general appreciation of life and the desire for itto be available for future generations. These interests may be expressed passively or actively(ecotourism). Specific aspects within this biodiversity issue include endangered species,migratory species and species with potential commercial value (eg, to the pharmaceuticalindustry). Ecotourism linked to migratory species may not be in the vicinity of the mangroveecosystems at all, and may even occur in another country.
Mangrove ecosystems also provide the space and a suitable substrate for human activities.Human settlements may be located within or in the vicinity of mangroves and may bepopulated by indigenous peoples with subsistence lifestyles dependent on the ecosystem.Mangroves also provide space for cultivation. Aquaculture, rice cultivation and Nipa palmplantations may be located in or adjacent to mangrove ecosystems. Recreation and tourism arenot activities that spring to mind when considering mangroves, but ecotourism associated withmangroves is developing. Legislation may be enacted to give protection to mangrove

ecosystems from (over)use and development.

Figure 5. Growth forms of the mangrove species Rhizophora and Avicennia

Mangroves provide services which are associated with knowledge. The knowledge thatmangrove ecosystems and associated species exist provides an aesthetic service to someindividuals. Others acquire spiritual and religious, or cultural and artistic inspiration. This isparticularly the case for indigenous populations. Heritage values as well as scientific andeducational information may also be derived. Finally, mangrove ecosystems may providedisservices, such as facilitating the breeding of malaria-carrying mosquitoes.
Environmental functions of the Pagbilao mangroves
Table 1 identifies a diversity of environmental goods and services provided by the Pagbilaomangroves (a subset of those discussed in the previous section), the environmental functionsand ecological processes involved in their provision, and current and potential users of thenatural mangrove forest. The terminology of de Groot (1992) is used with some modification.The production of water (for use by fishponds) is, for the sake of simplicity, accredited to themangroves. Technically it is a product of the environment which mangroves occupy. Nodisservices are identified and malaria does not occur in the study area.

Table 1. Environmental functions of the Pagbilao mangroves

Feedbacks and Linkages in Mangrove Use
Table 1 shows that some ecological processes are common to more than one environmentalfunction, clearly indicating the interconnectedness within the ecosystem. Should commonprocesses be compromised, the repercussions could be felt over a wide range of users.Evaluation of alternative management strategies should take into account this wider picture ofeconomic-ecological interaction. The systems diagrams presented in this section offer such anintegrated approach. The meaning of the various symbols is shown in Figure 6. The diagramsmake use of the basic building blocks of systems analysis, viz. stocks, flows and othervariables. Added to these are environmental goods and services and problem variables (seeFigure 6). Figure 6. Explanation of symbols used.
Environmental good or service
Problem x which, if it occurs,will affect variable y
x y
Stock or state variable
Addition to or subtraction from a stock
Variable b is influencedby variable a: b = f(a)
a b
Problem variable
The systems diagrams are presented in Figures 8-12; Figure 7 shows how the diagrams arelinked. The quality of mangrove cover drives the ecological processes (Figure 8) which controlthe environmental functions and so the supply of environmental goods and services (Figures 9and 10). Use of these goods and services contributes value to the users (Figures 11 and 12).An environmental ‘problem’ develops with overuse where demand for any good or serviceexceeds its supply. A problem may trigger feedbacks within the ecosystem, or generate costsvia linkages between the ecological and the economic systems.
Aggregate land use and ecological processes
Two quality categories for mangrove cover- good and degraded - are identified in Figure 8, withdegradation and regrowth generating dynamics between them. Mangroves are removed withfishpond development; historically, this has concentrated on degraded sites. Currentinformation on the profitability of fish farming suggests that the costs incurred in removingmangroves no longer constrain pond development, with the result that fishpond developmenton sites with good mangrove cover is now possible.

Figure 7. Structure of the systems diagrams

Figure 8: Aggregate dynamics and ecological processes
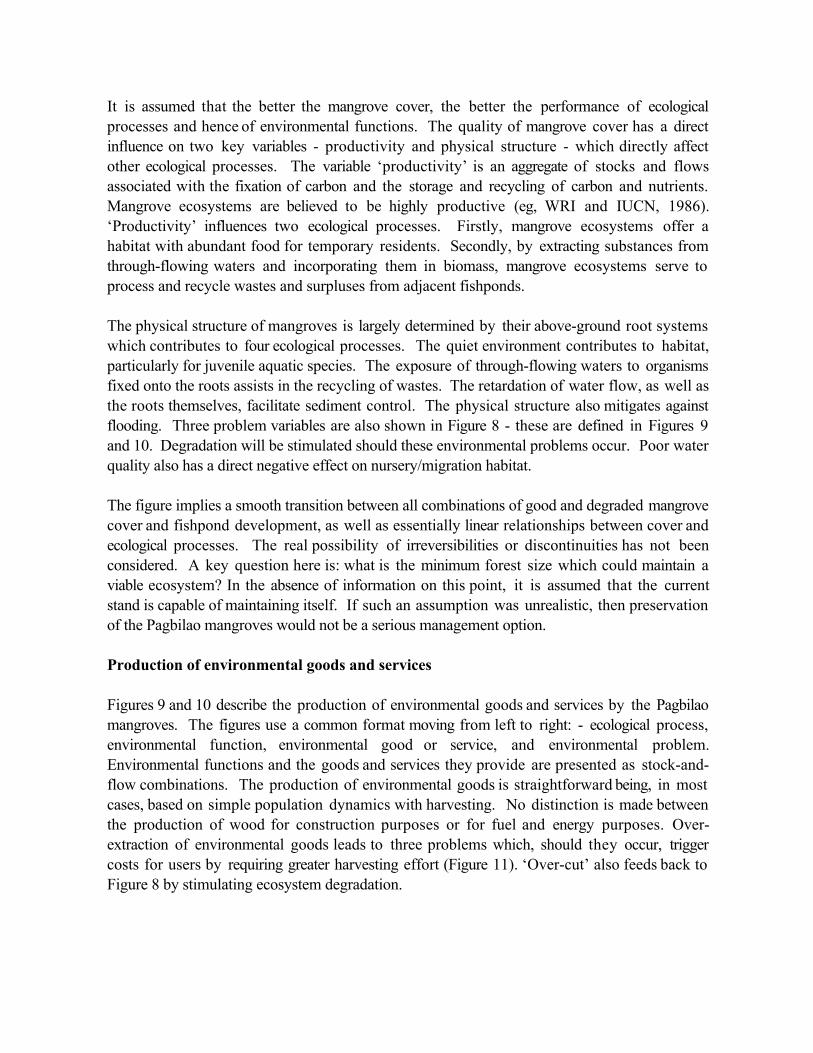
It is assumed that the better the mangrove cover, the better the performance of ecologicalprocesses and hence of environmental functions. The quality of mangrove cover has a directinfluence on two key variables - productivity and physical structure - which directly affectother ecological processes. The variable ‘productivity’ is an aggregate of stocks and flowsassociated with the fixation of carbon and the storage and recycling of carbon and nutrients.Mangrove ecosystems are believed to be highly productive (eg, WRI and IUCN, 1986).‘Productivity’ influences two ecological processes. Firstly, mangrove ecosystems offer ahabitat with abundant food for temporary residents. Secondly, by extracting substances fromthrough-flowing waters and incorporating them in biomass, mangrove ecosystems serve toprocess and recycle wastes and surpluses from adjacent fishponds.
The physical structure of mangroves is largely determined by their above-ground root systemswhich contributes to four ecological processes. The quiet environment contributes to habitat,particularly for juvenile aquatic species. The exposure of through-flowing waters to organismsfixed onto the roots assists in the recycling of wastes. The retardation of water flow, as well asthe roots themselves, facilitate sediment control. The physical structure also mitigates againstflooding. Three problem variables are also shown in Figure 8 - these are defined in Figures 9and 10. Degradation will be stimulated should these environmental problems occur. Poor waterquality also has a direct negative effect on nursery/migration habitat.
The figure implies a smooth transition between all combinations of good and degraded mangrovecover and fishpond development, as well as essentially linear relationships between cover andecological processes. The real possibility of irreversibilities or discontinuities has not beenconsidered. A key question here is: what is the minimum forest size which could maintain aviable ecosystem? In the absence of information on this point, it is assumed that the currentstand is capable of maintaining itself. If such an assumption was unrealistic, then preservationof the Pagbilao mangroves would not be a serious management option.
Production of environmental goods and services
Figures 9 and 10 describe the production of environmental goods and services by the Pagbilaomangroves. The figures use a common format moving from left to right: - ecological process,environmental function, environmental good or service, and environmental problem.Environmental functions and the goods and services they provide are presented as stock-and-flow combinations. The production of environmental goods is straightforward being, in mostcases, based on simple population dynamics with harvesting. No distinction is made betweenthe production of wood for construction purposes or for fuel and energy purposes. Over-extraction of environmental goods leads to three problems which, should they occur, triggercosts for users by requiring greater harvesting effort (Figure 11). ‘Over-cut’ also feeds back toFigure 8 by stimulating ecosystem degradation.

Figure 9. Production of environmental goods by the Pagbilao mangroves

Figure 10. Provision of environmental services by the Pagbilao mangroves

The products of fishponds are not environmental goods and so do not appear in Figure 9.While they may be species, they are still economic goods totally dependent on human inputs;environmental goods are dependent on ecological/environmental processes. A fish farm is a fishfactory, no different from a power plant occupying space once covered by ecosystems andusing water in the production of a good.
Ecological processes in the mangrove ecosystem may affect the structure of waterways, butbeyond this they have little influence on water volumes and flows. Water is used to flushfishponds which also releases contaminated water to the environment. Some portion of thesewastes and surpluses enters the mangrove ecosystem where they may be taken up byorganisms. The problem variable ‘poor water quality’ develops if the waste load exceeds thesystem’s capacity for removal. Poor water quality feeds back to Figure 8 by stimulatingdegradation and adversely affecting habitat. It also triggers costs for aquaculture by killing orretarding the growth of the cultured stock (Figures 11 and 12). Chemically persistentpesticides, antibiotics, etc. may accumulate in sediments, have direct toxic effects on species,and/or bioaccumulate in food chains. This may lead to adverse effects on biodiversity.
The services ‘shoreline protection’, ‘flood mitigation’ and ‘biodiversity’ are treated similarly. Itis assumed that there is a capacity for supplying these services as a result of the quality ofmangrove cover. This capacity is represented by a stock. Changes in the quality of coverfilters through various ecological processes to cause a change in this capacity. Theenvironmental problems ‘sediment instability’ and ‘flooding’ occur if the quality of mangrovecover declines such that insufficient capacity in relation to conditions in the bay remains. Bothproblems are linked to economic consequences (Figures 11 and 12) while sediment instabilityalso feeds back to stimulate ecosystem degradation (Figure 8). No problem variable isassociated with biodiversity. Feedbacks from a decline in biodiversity are uncertain, probablylong term, and so have been ignored. Rather biodiversity is viewed as the ultimate indicator ofecosystem quality. Its decline does not trigger costs, merely a reduction in the values derivedfrom this service.
The information content of the ecosystem is assumed to be related directly to the quality ofmangrove cover and the performance of ecological processes, as well as subject to changes incover and performance. The service provided is knowledge, a subset of the total informationcontained. No problem variable is identified, essentially for the same reasons as with a declinein biodiversity.
Value of goods and services provided by the mangrove forest
Figures 11 and 12 attempt to capture environmental-economic aspects of using the Pagbilaomangroves. Nine sectors are identified. The approach taken is to imply a net value per sectorbut considering only ‘environmental’ benefits and costs. The figures show an annual valuederived from using environmental goods and services (flows) accumulating in a net value persector (stocks). The catch of fish, crabs and shellfish contributes value to the artisanal fisheries.Mud crabs caught on-site comprise about 95% of the value of fisheries. Various goods, mainlyfor medicines and construction purposes, may be taken by locals from the mangrove ecosystemand so contribute to the value of the subsistence forestry sector. Should the problem variables

‘overfishing’, ‘overcut’ and ‘overuse biotic’ be triggered, costs to these two sectors will risewith increased effort required to harvest these environmental goods. Figure 11. Values of environmental goods by the Pagbilao mangroves

Figure 12. Values of environmental services by the Pagbilao mangroves
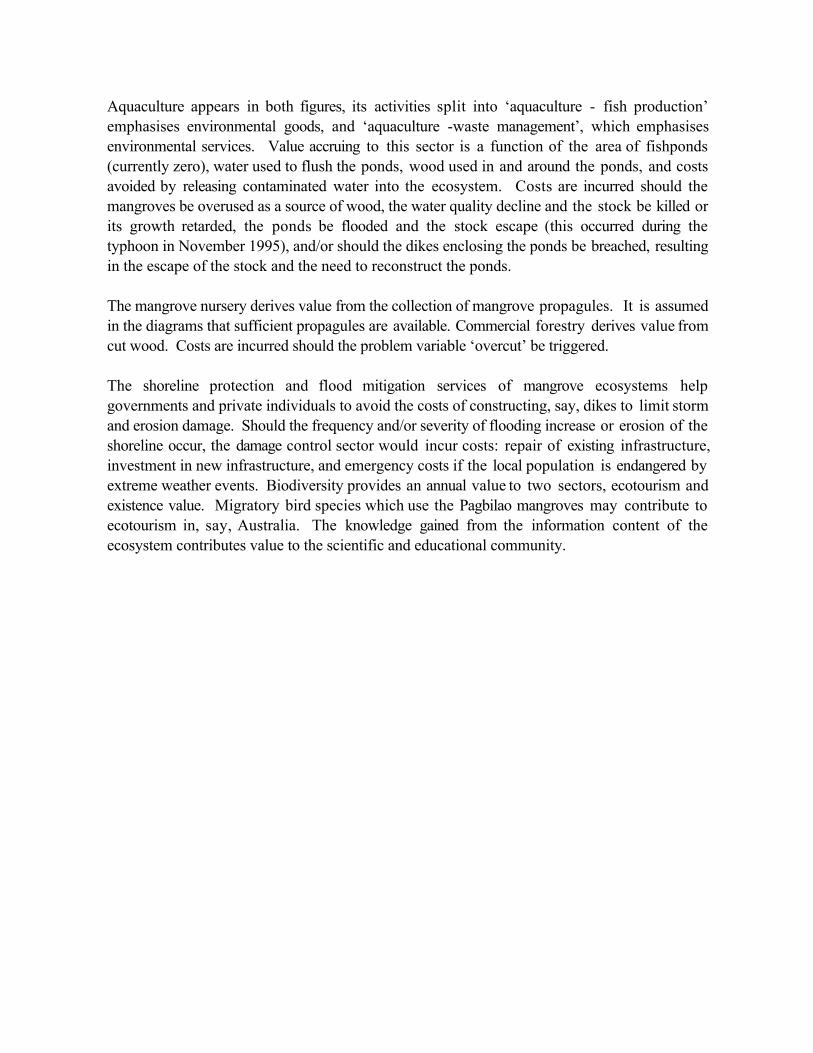
Aquaculture appears in both figures, its activities split into ‘aquaculture - fish production’emphasises environmental goods, and ‘aquaculture -waste management’, which emphasisesenvironmental services. Value accruing to this sector is a function of the area of fishponds(currently zero), water used to flush the ponds, wood used in and around the ponds, and costsavoided by releasing contaminated water into the ecosystem. Costs are incurred should themangroves be overused as a source of wood, the water quality decline and the stock be killed orits growth retarded, the ponds be flooded and the stock escape (this occurred during thetyphoon in November 1995), and/or should the dikes enclosing the ponds be breached, resultingin the escape of the stock and the need to reconstruct the ponds.
The mangrove nursery derives value from the collection of mangrove propagules. It is assumedin the diagrams that sufficient propagules are available. Commercial forestry derives value fromcut wood. Costs are incurred should the problem variable ‘overcut’ be triggered.
The shoreline protection and flood mitigation services of mangrove ecosystems helpgovernments and private individuals to avoid the costs of constructing, say, dikes to limit stormand erosion damage. Should the frequency and/or severity of flooding increase or erosion of theshoreline occur, the damage control sector would incur costs: repair of existing infrastructure,investment in new infrastructure, and emergency costs if the local population is endangered byextreme weather events. Biodiversity provides an annual value to two sectors, ecotourism andexistence value. Migratory bird species which use the Pagbilao mangroves may contribute toecotourism in, say, Australia. The knowledge gained from the information content of theecosystem contributes value to the scientific and educational community.
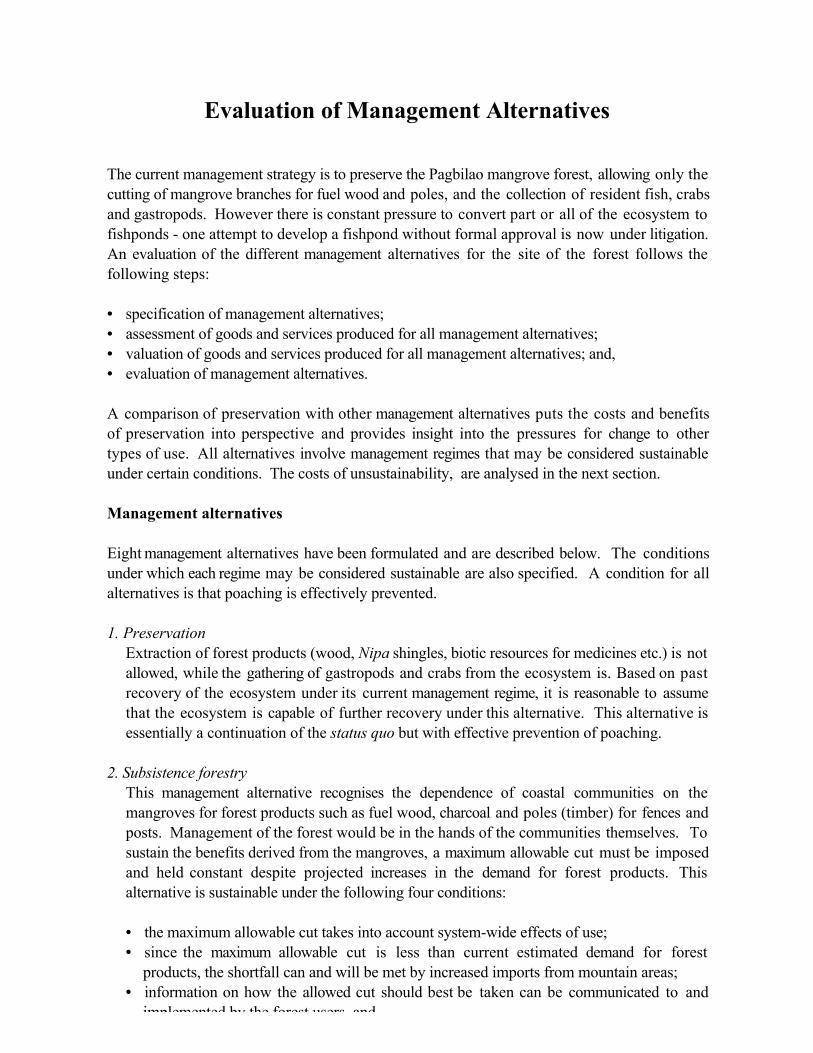
Evaluation of Management Alternatives
The current management strategy is to preserve the Pagbilao mangrove forest, allowing only thecutting of mangrove branches for fuel wood and poles, and the collection of resident fish, crabsand gastropods. However there is constant pressure to convert part or all of the ecosystem tofishponds - one attempt to develop a fishpond without formal approval is now under litigation.An evaluation of the different management alternatives for the site of the forest follows thefollowing steps:
• specification of management alternatives;• assessment of goods and services produced for all management alternatives;• valuation of goods and services produced for all management alternatives; and,• evaluation of management alternatives.
A comparison of preservation with other management alternatives puts the costs and benefitsof preservation into perspective and provides insight into the pressures for change to othertypes of use. All alternatives involve management regimes that may be considered sustainableunder certain conditions. The costs of unsustainability, are analysed in the next section.
Management alternatives
Eight management alternatives have been formulated and are described below. The conditionsunder which each regime may be considered sustainable are also specified. A condition for allalternatives is that poaching is effectively prevented.
1. Preservation Extraction of forest products (wood, Nipa shingles, biotic resources for medicines etc.) is notallowed, while the gathering of gastropods and crabs from the ecosystem is. Based on pastrecovery of the ecosystem under its current management regime, it is reasonable to assumethat the ecosystem is capable of further recovery under this alternative. This alternative isessentially a continuation of the status quo but with effective prevention of poaching.
2. Subsistence forestry This management alternative recognises the dependence of coastal communities on themangroves for forest products such as fuel wood, charcoal and poles (timber) for fences andposts. Management of the forest would be in the hands of the communities themselves. Tosustain the benefits derived from the mangroves, a maximum allowable cut must be imposedand held constant despite projected increases in the demand for forest products. Thisalternative is sustainable under the following four conditions:
• the maximum allowable cut takes into account system-wide effects of use;• since the maximum allowable cut is less than current estimated demand for forest
products, the shortfall can and will be met by increased imports from mountain areas;• information on how the allowed cut should best be taken can be communicated to and
implemented by the forest users, and
• entry into this sector is controlled. 3. Commercial forestry
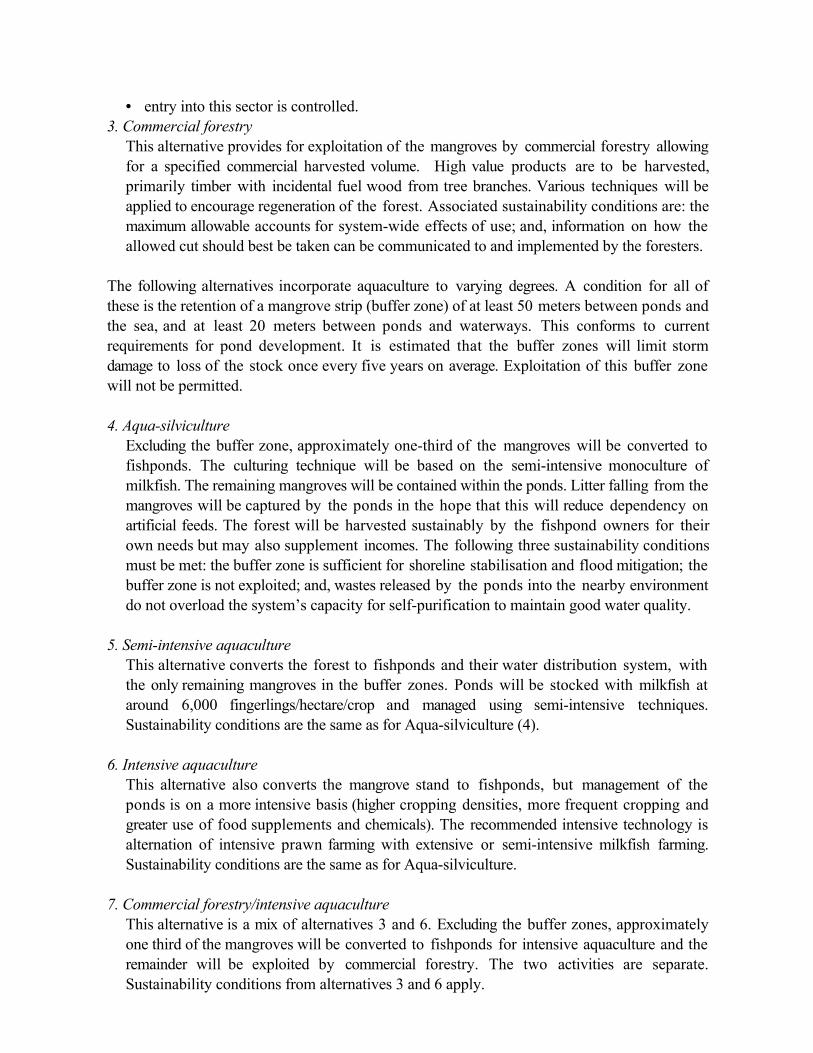
This alternative provides for exploitation of the mangroves by commercial forestry allowingfor a specified commercial harvested volume. High value products are to be harvested,primarily timber with incidental fuel wood from tree branches. Various techniques will beapplied to encourage regeneration of the forest. Associated sustainability conditions are: themaximum allowable accounts for system-wide effects of use; and, information on how theallowed cut should best be taken can be communicated to and implemented by the foresters.
The following alternatives incorporate aquaculture to varying degrees. A condition for all ofthese is the retention of a mangrove strip (buffer zone) of at least 50 meters between ponds andthe sea, and at least 20 meters between ponds and waterways. This conforms to currentrequirements for pond development. It is estimated that the buffer zones will limit stormdamage to loss of the stock once every five years on average. Exploitation of this buffer zonewill not be permitted.
4. Aqua-silviculture Excluding the buffer zone, approximately one-third of the mangroves will be converted tofishponds. The culturing technique will be based on the semi-intensive monoculture ofmilkfish. The remaining mangroves will be contained within the ponds. Litter falling from themangroves will be captured by the ponds in the hope that this will reduce dependency onartificial feeds. The forest will be harvested sustainably by the fishpond owners for theirown needs but may also supplement incomes. The following three sustainability conditionsmust be met: the buffer zone is sufficient for shoreline stabilisation and flood mitigation; thebuffer zone is not exploited; and, wastes released by the ponds into the nearby environmentdo not overload the system’s capacity for self-purification to maintain good water quality.
5. Semi-intensive aquaculture This alternative converts the forest to fishponds and their water distribution system, withthe only remaining mangroves in the buffer zones. Ponds will be stocked with milkfish ataround 6,000 fingerlings/hectare/crop and managed using semi-intensive techniques.Sustainability conditions are the same as for Aqua-silviculture (4).
6. Intensive aquaculture This alternative also converts the mangrove stand to fishponds, but management of theponds is on a more intensive basis (higher cropping densities, more frequent cropping andgreater use of food supplements and chemicals). The recommended intensive technology isalternation of intensive prawn farming with extensive or semi-intensive milkfish farming.Sustainability conditions are the same as for Aqua-silviculture.
7. Commercial forestry/intensive aquaculture This alternative is a mix of alternatives 3 and 6. Excluding the buffer zones, approximatelyone third of the mangroves will be converted to fishponds for intensive aquaculture and theremainder will be exploited by commercial forestry. The two activities are separate.Sustainability conditions from alternatives 3 and 6 apply.
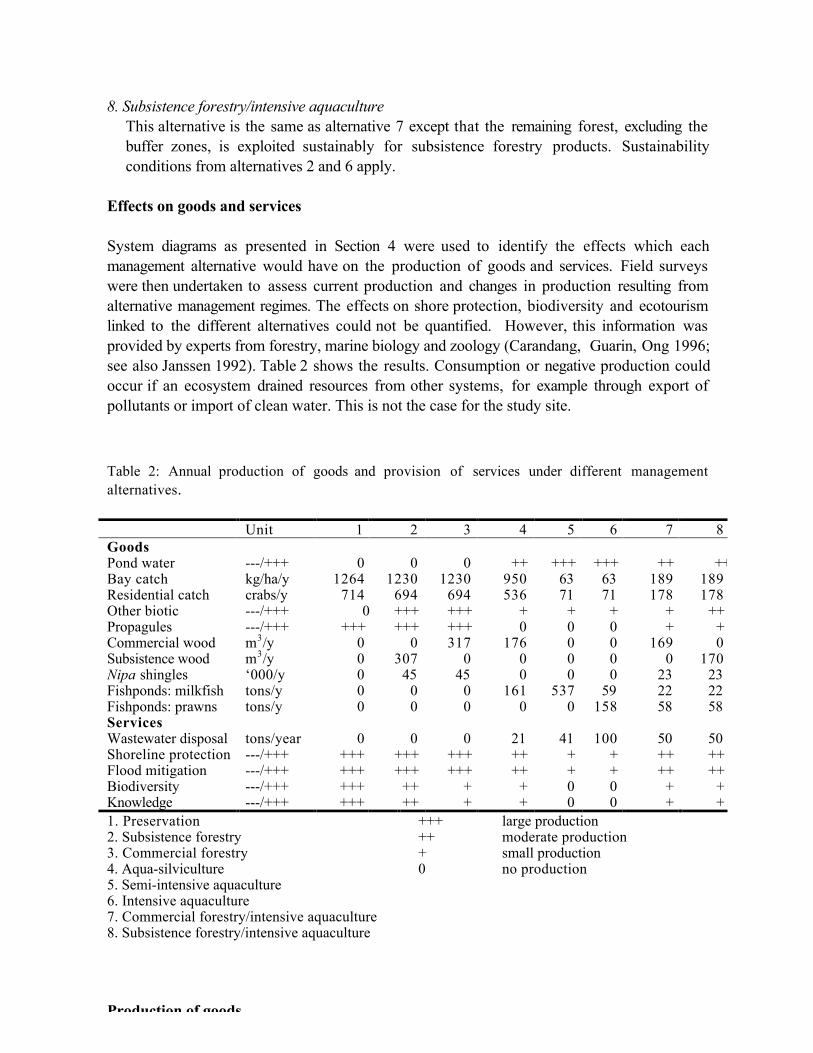
8. Subsistence forestry/intensive aquaculture This alternative is the same as alternative 7 except that the remaining forest, excluding thebuffer zones, is exploited sustainably for subsistence forestry products. Sustainabilityconditions from alternatives 2 and 6 apply.
Effects on goods and services
System diagrams as presented in Section 4 were used to identify the effects which eachmanagement alternative would have on the production of goods and services. Field surveyswere then undertaken to assess current production and changes in production resulting fromalternative management regimes. The effects on shore protection, biodiversity and ecotourismlinked to the different alternatives could not be quantified. However, this information wasprovided by experts from forestry, marine biology and zoology (Carandang, Guarin, Ong 1996;see also Janssen 1992). Table 2 shows the results. Consumption or negative production couldoccur if an ecosystem drained resources from other systems, for example through export ofpollutants or import of clean water. This is not the case for the study site. Table 2: Annual production of goods and provision of services under different managementalternatives.
Unit 1 2 3 4 5 6 7 8 Goods Pond water ---/+++ 0 0 0 ++ +++ +++ ++ ++ Bay catch kg/ha/y 1264 1230 1230 950 63 63 189 189 Residential catch crabs/y 714 694 694 536 71 71 178 178 Other biotic ---/+++ 0 +++ +++ + + + + ++ Propagules ---/+++ +++ +++ +++ 0 0 0 + + Commercial wood m3/y 0 0 317 176 0 0 169 0 Subsistence wood m3/y 0 307 0 0 0 0 0 170 Nipa shingles ‘000/y 0 45 45 0 0 0 23 23 Fishponds: milkfish tons/y 0 0 0 161 537 59 22 22 Fishponds: prawns tons/y 0 0 0 0 0 158 58 58 Services Wastewater disposal tons/year 0 0 0 21 41 100 50 50 Shoreline protection ---/+++ +++ +++ +++ ++ + + ++ ++ Flood mitigation ---/+++ +++ +++ +++ ++ + + ++ ++ Biodiversity ---/+++ +++ ++ + + 0 0 + + Knowledge ---/+++ +++ ++ + + 0 0 + + 1. Preservation +++ large production 2. Subsistence forestry ++ moderate production 3. Commercial forestry + small production 4. Aqua-silviculture 0 no production 5. Semi-intensive aquaculture 6. Intensive aquaculture 7. Commercial forestry/intensive aquaculture 8. Subsistence forestry/intensive aquaculture
Production of goods

Resident and transient fish species were sampled to assess fisheries productivity of themangrove reserve. The fisheries component of this study (Ong and Padilla 1996) also updatedinformation from previous, and more thorough studies (eg, de la Paz and Aragones 1985; Pinto1985 and 1988; Fortes 1994). The experimental forest supports both on-site (resident species)and off-site (transient species) fisheries. The estimation of sustainable harvest of fisheryresources presented difficulties as the fisheries surveys for this study, as well as previousstudies, did not cover stock assessment. Simplifying assumptions were made to arrive at somemeasure of abundance and productivity. The results show that the experimental forest supportsa small on-site fishery and contributes minimally to off-site fisheries. Use of a productionfunction would have provided a more precise approach to assess the impacts of themanagement alternatives on the value of off-site fisheries. However, this was precluded by thelimited knowledge on the complex interactions involved and the total lack of data on stock sizeover time (Spaninks and van Beukering 1997).
Fuel wood, timber and Nipa shingles are the primary forest products derived from the Pagbilaomangrove reserve. Subsistence forestry yields goods demanded by coastal communities, mostlyfuel wood, charcoal and poles (timber) for fences and posts. The quantification and valuation ofgoods and services proceeded from field surveys of the mangrove reserve in 1995. Three zonesor ecotones were identified: landward, middleward and seaward. Sample plots were establishedin each ecotone and tree density, tree dimensions and subsequently wood volume were measuredor computed. Litter traps were set to estimate litter fall and to determine nutrient content.Projected timber yield was estimated over time using an empirical equation for the Philippineswith age of stand and site index as explanatory variables. Subsistence forestry is estimated toproduce about 262 m3 of wood products compared to 272 m3 per year by commercial forestry;commercial forestry is therefore the more efficient (Carandang and Padilla, 1996).
The performance of aquaculture ponds converted from mangroves was also assessed (Padilla andTanael 1996a and b). Several studies were compared to assess the long-term prospects ofaquaculture operations in the mangrove reserve. The primary objective was to identify theappropriate (sustainable) aquaculture technology and the corresponding production levels.Conversion of the mangrove forest to fishponds results in high production levels. For Semi-intensive aquaculture production was estimated to exceed 597 tons/year of milkfish; forIntensive aquaculture of prawns alternating with extensive culture of milkfish, estimates of 66tons/year of milkfish combined with 175 tons of prawns were derived (Padilla and Tanael, 1996aand b).
Production of services
Waste water disposal is an environmental service used only by aquaculture. Padilla and Tanael(1996a and b) were able to quantify use of this service for the various aquaculture alternatives.Intensive aquaculture is the highest user due to higher stocking rates and the use of artificialfeeds, pesticides and fertilisers. For non-aquaculture alternatives it is assumed that no use isbeing made of the waste processing capacity of the mangrove forest. Use of the remainingservices is estimated qualitatively. While the buffer zones are intended to secure the coastalplain from erosion and flooding, this would still be less than that of an intact ecosystem, or of

one which is only two-thirds of its original size. Biodiversity and knowledge services are mostabundant in the Preservation alternative (1) and non-existent for Semi-intensive and Intensiveaquaculture (5 and 6). Of the remaining alternatives, subsistence forestry, with its softerintervention into the ecosystem, is considered to perform best with regards to these services.
Valuation of goods and services
Market prices and shadow prices of substitutes were used to value goods. Market prices of fishobserved at local markets during the field surveys were used to value fisheries. It is estimatedthat 87.75% of the landed price of fish covers the costs of harvesting, the remainder is the valueof the fish in-situ (NSCB 1996). The use value of the forest products derived from themangroves by subsistence forestry is net of gathering cost. When households are denied accessto mangrove forest resources, the shadow price attached to the forest products is equivalent tothe cost they incur in obtaining alternative products. Such a cost is equal to the market price ofthe alternative product plus the transport cost from the market to the point of use. Shadowprices for fuelwood and other goods not traded on the market were linked to the cheapestsubstitute. For commercial forestry net value is calculated using market prices of the timberproducts less the costs of transport, extraction and related costs incurred in managing the forest.Net value of aquaculture is calculated using data on production, market prices and operatingcosts of existing fishponds in the vicinity of the study site.
Net value of the management alternatives can be estimated using these results and is shown inTable 3. In this table values are combined to show the values produced according to economicsectors in the local economy: bay and residential catch are combined into fisheries, Nipa isincluded in subsistence and commercial forestry, and milkfish and prawns are combined intoaquaculture. Net values linked to other biotic resources and propagules are considered marginaland therefore ignored. Values shown are annual values for the entire study area. Sincealternatives are assumed to be sustainable, the time horizon can be assumed to be indefinite.With regard to aquaculture, the long life of ponds in the vicinity, some around 40 years old,lends support to this assumption. Development costs and other capital costs are valuedaccording to the borrowing rate for capital in real terms. Typhoon damage through flooding ofthe ponds or breaching of the dikes is included as a ten percent reduction of the annual harvest,based on two crops per year and loss of one crop once every five years.

Table 3. Net annual value of goods and services under different management alternatives.
Unit 1 2 3 4 5 6 7 8 Goods Fisheries ’000
pesos 165 161 161 124 8 8 40 40
Subsistence forestry ’000pesos
0 349 0 0 0 0 0 189
Commercialforestry
’000pesos
0 0 416 218 0 0 229 0
Aquaculture - fish ’000pesos
0 0 0 5648 18801
13577
4992 4992
Mangrove nursery 0/+++ + + + 0 0 0 0 0 Total goods ’000
pesos 165 510 577 5990 1880
9 1358
5 5261 5221
Services Aquaculture - waste 0/+++ 0 0 0 + ++ +++ ++ ++ Damage control 0/+++ +++ +++ +++ ++ + + ++ ++ Ecotourism 0/+++ +++ ++ 0 0 0 0 0 + Existence value 0/+++ +++ ++ ++ + 0 0 + + Information value 0/+++ +++ ++
+ ++ + 0 0 + +
Total services 0/+++ +++ +++
++ + + + + +
1 Preservation +++ large contribution to value 2 Subsistence forestry ++ moderate contribution to value 3 Commercial forestry + small contribution to value 4 Aqua-silviculture 0 no contribution to value 5 Semi-intensive aquaculture 6 Intensive aquaculture 7 Commercial forestry/intensiveaquaculture
8 Subsistence forestry/intensive aquaculture
For the five alternatives which permit harvesting of forest products, the highest value isgenerated by Commercial forestry (3). Aquaculture alternatives perform better than Forestry(2/3) and Preservation (1) in terms of the value of goods produced. Semi-intensive aquaculture(5) performs better than Intensive aquaculture (6) due to the high development costs linked tothe latter and to constraints set by sustainable management of the ponds. However, theperformance of both alternatives is very sensitive to changes in prices. Milkfish are producedfor the local market and their price level is relatively stable. The price of prawns is determinedon the world market and shows strong fluctuations. In this study a price of 185 pesos/kg isused for prawns. Should this price increase above 214 pesos/kg the value of goods produced byIntensive aquaculture will be higher than those produced by Semi-intensive aquaculture. Aqua-silviculture performs better than the alternatives combining forestry and aquaculture. Note thatthe mangrove nursery is unlikely to survive the conversion to fish farming.
Services are valued only qualitatively in Table 3 and an attempt is made to aggregate thesesources of value. The improvements to the ecosystem which Preservation (1) provides is felt

by all users permitted by this alternative. The main gains are felt by damage control (avoidedcosts), fisheries, the mangrove nursery, and existence and scientific values. No use is made ofthe ecosystem’s capacity to process wastes, and so this service scores a zero. However, such acapacity exists. The total value from services is considered a maximum for this alternative.Subsistence forestry (2) also scores a maximum, even though this alternative scores somewhatlower with regards to ecotourism and existence value sectors: harvesting of forest products isassumed to affect biodiversity adversely. Commercial forestry’s (2) aggregate score is lowerthan alternatives 1 and 2. This alternative precludes contributions to ecotourism as well asreducing biodiversity and information values. As with Subsistence forestry, the forest remainsintact and so its capacity to mitigate against flooding and prevent erosion is high.
The aquaculture alternatives (4 to 8) score poorly with the system’s capacity to provideservices for use. While the waste disposal capacity of the system is used in these alternatives,the buffer zones supply only a minimal capacity for damage control. Where more of the standis maintained, this capacity is larger. All alternatives, except that including subsistence forestry(8), preclude any contribution to ecotourism. Some existence and information values remain inalternatives where more mangroves than just the buffer zone are retained.
Comparison with other studies
A literature survey was conducted to compare results from the Pagbilao study with othermangrove studies (Spaninks and Beukering, 1997). Table 4 shows the results from this study(last column) compared with results from studies in Thailand, Fiji and Indonesia. To facilitatecomparison all results are presented in US$/ha. Please note that these values relate to differentyears. No data were available to adjust for inflation rates and changes in exchange rates in thedifferent countries. The values for forestry and fisheries are similar to those derived in the otherstudies. The value of aquaculture is listed as a negative value since this represents the foregonebenefits of not converting the forest to fishponds and can therefore be considered as anincremental cost of preservation. The value used by Lal (1990) for purification involvesconstruction of a sewage treatment plant. Since water pollution is not a problem in Pagbilao thisvalue cannot be attributed to waste disposal here.
Table 4. A comparison of net annual benefits of goods and services provided by mangrove forests(all values in US$/ha/year, 1US$=25 pesos).
Thailand Christensen
(1982)
Fiji Lal
(1990)
Indonesia Ruitenbeek
(1992)
Pagbilao
(1996)
Forestry 30 6 67 151 Fisheries 130 100 117 60 Agriculture 165 52 Aquaculture -2,106 -7,124 Erosion 3 Biodiversity 15 Local uses 230 33 Waste disposal 5,820


Ranking of management alternatives
Based on the value of total goods Semi-intensive aquaculture (5) is the most preferredalternative followed by Intensive aquaculture (6). Preservation (1) and also the forestryalternatives (2 and 3) generate substantially less value in terms of goods. Based on totalservices, however, Preservation (1) and Subsistence forestry rank higher and the aquaculturealternatives much lower.
Because the provision of services could not be valued it proved impossible to calculate totalvalue of the alternatives. This raises the question of whether the value of the services providedby Preservation (1) will be large enough to offset its lower value of goods. The difference intotal goods between the two alternatives as shown in Table 3 is more than 18 million pesos,almost US$6,500/ha/year (Table 4). Using the other studies presented in Table 4 to derive avery rough indication of the value of services, the Preservation alternative (1) would seemunlikely to generate total values higher than Semi-intensive aquaculture (5). Therefore, it may beconcluded that, on the basis of valuation, Semi-intensive aquaculture (5) is the most preferredalternative.
It is important to note that valuation has its limitations. Distribution of income is a centralpolitical issue, especially in developing countries. Benefits from fisheries are received by local,usually poor, fishermen, while benefits from fishponds, due to their high investment costs,accrue to distant, rich investors. Conversion of mangroves to fishponds therefore results in aunfavourable change in income distribution which is not reflected in total value. It also createsareas which are inaccessible to the local population. A second limitation of valuation is that itassumes the possibility of substitution between human and natural capital. This creates seriousdifficulties if irreversible effects, such as the loss of biodiversity, are to be included.

Costs of Unsustainability
The values of each management alternative were estimated in the previous section. Themanagement alternatives are designed to be sustainable, with sustainability holding under anumber of conditions. Failure of these conditions generates costs and/or reductions of benefits.The purpose of this section is to assess what could happen if certain conditions do not holdand the management alternatives fail the sustainability criteria (see also Parks and Bonifaz1994). Because sustainability is the norm, the effect of failure to meet this norm may be labelledthe ‘costs of unsustainability’. Four conditions are tested in this section:
• Failure of the buffer zones to mitigate against flooding and stabilising the shore;• Excessive extraction of wood• Poaching of wood products cannot be prevented; and,• Overloading of natural waste management to process and remove wastes and surpluses.
Effects may be traced through Figures 5-9 by linking failure of a condition with the problemvariable triggered and subsequent effects on the supply of environmental goods and services.The link between condition and problem variable is presented in Table 5 for each managementalternative. Table 6 presents total (monetary) value and effects on the provision ofenvironmental services when all sustainability conditions fail simultaneously. The discussionbelow explains how this table is derived. Table 5: Problem variables triggered by failure of management conditions
Condition 1 2 & 3 4 5 6 7 & 8 Failure of buffer zones
instability,flooding
instability, flooding
instability, flooding
instability,flooding
Excessive wood harvest
overcut overcut
Poaching of woodproducts
overcut,instability
overcut,instability
instability,flooding
instability, flooding
instability, flooding
overcut, instability,flooding
Overloading of naturalwaste management
poor waterquality
poor waterquality
poor waterquality, bio-accumulation
poor waterquality, bio-accumulation
1 Preservation 5 Semi-intensive aquaculture 2 Subsistence forestry 6 Intensive aquaculture 3 Commercial forestry 7 Commercial forestry/intensive aquaculture 4 Aqua-silviculture 8 Subsistence forestry/intensive aquaculture

Failure of the buffer zones
An essential condition of all alternatives including aquaculture (4-8) is the retention of bufferzones to ensure sediment stability and mitigate against flooding. If buffer zones are inadequatefor these purposes, the problem variables ‘instability’ and ‘flooding’ will be triggered (Figure 7).‘Instability’ stimulates ecosystem degradation (Figure 5) and will lead to the poorerperformance of all environmental functions.
Both ‘instability’ and ‘flooding’ cause direct costs to users (Figures 8 and 9). The bulk of thesecosts will be borne by aquaculture which will lose its stock more frequently. Aquaculturealternatives (4, 7 and 8), where more mangrove cover than just the buffer zones is retained, willbe less vulnerable to sediment instability and flooding and the impacts of these problems aremore likely to remain small-scale. There is the risk with Semi-intensive and Intensiveaquaculture (5 and 6) that sediment instability could spread beyond the study site and/or thatflood waters could penetrate further inland. Damage would then be incurred by more economicactivities, with costs borne by the damage control sector.
Excessive extraction of wood
Management alternatives 2, 3, 7 and 8 are based on the sustainable extraction of forestproducts. A condition with Subsistence forestry (2 and 8) is that entry into the sector can becontrolled so that extraction will not exceed a maximum allowable cut. Local demand for woodproducts already exceeds this maximum (Carandang and Padilla, 1996) and will only increasewith population growth. It is highly unlikely that agreements between government and localcommunities to limit entry into the subsistence forestry sector will be effective under suchpressure, with inevitable over-extraction. Similar controls are required for Commercial forestry(3 and 7) to limit the harvest to a maximum allowable cut. Given the pressure for short-termprofit maximisation, this condition is also likely to fail.
Excessive extraction of wood triggers the problem variable ‘overcut’ (Figure 6) in all alternativescontaining forestry. This, in turn, stimulates ecosystem degradation (Figure 5) and poorerperformance of environmental functions, with all mangrove users being worse off. The forestrysectors, with a limited duration of activities, will bear the brunt of the costs of unsustainability.
Poaching of wood products
A key condition for sustainable management is the effective prevention of poaching. Under thecurrent management regime, wood is poached by local residents for construction purposes andfuel, and by fishpond managers who use wood for fencing, reinforcing dikes, delivering feedingsupplements and for construction purposes. Given the local demand for wood and thedifficulties in limiting access to the mangrove ecosystem, it is highly unlikely that poaching canbe prevented. Two possible effects of wood poaching are identified.

Firstly, poaching would cause wood harvesting in all forestry alternatives to exceed themaximum allowable cut. It could also lead to a level of illegal wood extraction above theecosystem’s capacity for regeneration within the Preservation(1) alternative, given the growingdemand for wood products and their increasing availability within the mangrove ecosystem.The problem variable ‘overcut’ (Figure 6) would then be triggered. As discussed above, thiswould stimulate ecosystem-wide degradation (Figure 5) and reduce performance of allenvironmental functions.
Secondly, poaching will be concentrated in areas of easy access and particularly along the edgesof waterways. This may cause bank erosion and even trigger the problem variable ‘instability’(Figure 7). ‘Instability’ has implications for degradation (Figure 5). In alternatives excludingaquaculture, the impacts of poaching are likely to remain localised. However in alternativesincorporating aquaculture poaching could compromise the buffer zones, with impacts and costswhich have been discussed above.
Overloading of natural waste management
All alternatives including aquaculture depend on the system’s natural capacity to remove andprocess wastes and surpluses released into the natural environment. Semi-intensive andextensive aquaculture in Pagbilao Bay have not yet overloaded this capacity, although thepossibility exists that increasing aquaculture could exceed a threshold, resulting in water qualityproblems. The likelihood of this is greatest with intensive aquaculture techniques which usehigh stocking rates, chemicals to control pests and diseases, and feeding supplements.
‘Poor water quality’ is one of two problem variables which could be triggered (Figure 7). Thisnot only stimulates degradation, but also has direct impacts on the mangrove habitat (Figure 5).Poor water quality results in costs to aquaculture and, if persistent, these activities will becomeuneconomic. This is most likely for Intensive aquaculture (6) and possible for Semi-intensiveaquaculture (5). Alternatives 7 and 8, which comprise some intensive aquaculture couldexperience periodic problems with water quality; however it is assumed that this would reduce,but not compromise, the profitability of these activities.
The second problem variable, ‘bioaccumulation’, would be triggered only by intensiveaquaculture through the use of chemicals (see Figure 7). Bioaccumulation of persistentmicropollutants could have an adverse effect on biodiversity, and so on dependent activities(viz. ecotourism, existence value and information value). However these effects are relevantonly for aquaculture/forestry alternatives (7 and 8) since insufficient biodiversity andinformation remain with Intensive aquaculture (6).

Changes in the ranking of alternatives if all sustainability conditions fail
Failure of the sustainability conditions are not independent events. For example, inadequateenforcement of environmental regulations can result in inadequate buffer zones, excessiveextraction, poaching and unauthorised emissions of wastes. Table 6 shows for each good andservice the range of expected change in value if all sustainability conditions fail simultaneously.
These ranges are combined with the values of goods and services (Table 3) to calculate the valueof total goods and services. The table provides:
a) total goods and services (min) representing the pessimistic end of the ranges (↓,↓↓,↓↓↓=-33%, -66%,-100%),
b) total goods and services (max) representing the optimistic end of the ranges (↓,↓↓,↓↓↓=-0%, -33%,-66%) and
c) total goods and services (sust) representing sustainable conditions as listed in Table 3.
Table 6: Change in net annual value if all sustainability conditions are violated simultaneously. 1 2 3 4 5 6 7 8 Goods Fisheries ↓ ↓ ↓ ↓↓ ↓↓ ↓↓ ↓↓ ↓↓ Subsistence forestry ↓↓ ↓↓ Commercial forestry ↓↓ ↓↓ Aquaculture ↓ ↓↓↓ ↓↓↓ ↓↓ ↓↓ Mangrove nursery ↓ ↓ ↓ A: total goods (min) 111 227 249 4044 3 3 1789 1775 B: total goods (max) 165 395 440 5949 6398 4622 3525 3498 C: total goods (sust) 165 510 577 5990 18809 13585 5261 5221
Services Aquaculture ↓↓ ↓↓↓ ↓ ↓ Damage control ↓ ↓ ↓ ↓↓ ↓↓↓ ↓↓↓ ↓↓ ↓↓ Ecotourism ↓ ↓ ↓ Existence value ↓ ↓ ↓ ↓↓ ↓↓↓ ↓↓↓ Information value ↓ ↓ ↓ ↓↓ ↓↓↓ ↓↓↓ A: total services (min) ++ ++ + 0 0 0 0 0 B: total services (max) +++ +++ ++ + 0 0 0 + C: total services (sust) +++ +++ ++ + + + + +
1. Preservation ↓↓↓ large reduction in value (67-100%) 2. Subsistence forestry ↓↓ moderate reduction in value (33-67%) 3. Commercial forestry ↓ small reduction in value (0-33%) 4. Aqua-silviculture no reduction in value 5. Semi-intensive aquaculture 6. Intensive aquaculture 7. Commercial forestry/intensive aquaculture 8. Subsistence forestry/intensive aquaculture

From Table 6 it can be concluded that violating the sustainability conditions results in a lose-lose situation where the total value of all alternatives decline. Preservation shows a declinebecause of ecosystem degradation. The forestry alternatives show a decline in long term woodproduction combined with a decline in the provision of most services. The aquaculturealternatives face a loss in long term fish production. Although the pattern of changes differsconsiderably between alternatives, the ranking of alternatives is relatively insensitive to failureof these sustainability conditions. The rankings associated with total goods (max) are the sameas the ranking under sustainability, with Semi-intensive (5) at the first position andPreservation (1) at the last. However if the pessimistic values (total goods min) are comparedwith the ranking under sustainability, Semi-intensive aquaculture (5) and Intensive aquaculture(6) shift to last position. This is the disaster scenario for both alternatives where pollutionresults in the complete failure of operations. The most likely position between these extremesis difficult to predict. Uncertainty centres on two questions: how much waste can the systemmanage without water quality declining and at what stage are the effects of declining waterquality irreversible? In general, Semi-intensive aquaculture runs fewer risks than Intensiveaquaculture, as does partial conversion to aquaculture compared to conversion of the wholemangrove stand.
Conclusions and Recommendations
In this study ecological and economic information are combined to support the evaluation ofmanagement alternatives for the Pagbilao mangrove forest. A key problem which ecologists faceis the high degree of interconnectedness within and between ecosystems. This makes it difficultto predict what is going to happen let alone understand what is going on. The concept of‘environmental function’ is used in combination with systems diagrams to address thisproblem. System diagrams are used to identify and assess goods and services produced by theecosystem under different management regimes. These goods and services are then valued toassess the economic efficiency of the management regimes. This final section assesses theusefulness of the concept of environmental function, summarises the results of the study andoffers recommendations for further research.
Mangroves are complex systems which provide a variety of goods and services for human use.The high degree of interconnectedness within such ecosystems leads to uncertainty andunpredictability. In particular it means that environmental goods and services are rarelyproduced independently. The concept of environmental function was used in this study tocommunicate the environmental values of the Pagbilao mangroves. The interface betweenenvironmental supply and societal demand for goods and services from the mangroves couldthen be detailed. This was effective in demonstrating the complexity of ecosystem performanceto non-ecologists, and in particular the multiple interdependencies involved in providingenvironmental goods and services. Systems diagrams were used to envisage ecosystemperformance and to ‘think through’ what the alternative management options and theirassociated conditions implied in terms of future supply of mangrove goods and services. Incombination with valuation of selected products, the evaluation of alternative managementregimes was then based on the integration of ecological and economic information.
This study assessed the conversion of the 110.7 hectares of protected mangrove forest inPagbilao, Philippines into aquaculture, forestry and combined uses. Considerable effort wasinvested in data collection and modelling, although the results have to be used with care. Thisespecially holds for those linked to off-site fisheries. It proved to be very difficult to establish aclear link between the size of the mangrove forest and the value of off-site fisheries. Aproduction function approach proved to be unfeasible. Further, most services could not bevalued and so could only be included qualitatively. Given these limitations the following may beconcluded:
For the Pagbilao mangrove forest Semi-intensive aquaculture is the policy alternative with thehighest economic value. If sustainability conditions are not met total values of all alternativesare reduced. However, Semi-intensive aquaculture still produces the largest total value exceptunder extreme conditions.

Environmental services, such as biodiversity, shore protection and flood mitigation, need to bepriced very high to attribute Preservation with the highest value. However, if it is accepted thatpreservation of the mangrove forest is in the interest of the world community, it is unreasonablethat the Philippines should pay the price of preservation; the increcemental costs ofpreservation should be the responsibility of The Global Environmental Facility.
Although biodiversity is considered crucial to the decision to preserve the forest, it provedimpossible to put a monetary value on changes in biodiversity. This raises questions regardingthe limitations of valuation - is it possible to value irreversible effects such as the loss of life,the loss of ecosystems, the loss of species, the loss of works of art etc. Another crucial issue inthe case of Pagbilao is the distribution of wealth. The income from the fish ponds accrues todistant investors, while conversion to fish ponds creates areas inaccessible to the localpopulation. Equity issues cannot be addressed adequately using net value as a decisioncriterion.
Further research
• Further research on ecological linkages both within mangrove ecosystems as betweenmangrove and other coastal ecosystems is essential.
• Assessment of production functions between mangroves and mangrove-related products,such as fisheries, can be seen as an extension of these efforts. However, it is questionablewhether assessment of production is feasible in applications such as Pagbilao.
• Further research on approaches for valuing environmental services such as biodiversity isnecessary. This should include an appraisal of the appropriateness of valuation to supportdecisions including these types of environmental values.

References
Bennagen, E. and Cabahug, D. 1992. Mangrove Forest Accounting: Physical Accounts (TechnicalAppendices). The Philippine Natural Resources Accounting Project (NRAP Phase 1), Manilla.
Braat, L.C., van der Ploeg, S.W.F. and Bouma, F. 1979. Functions of the Natural Environment andEconomic-Ecological Analysis. Institute for Environmental Studies Publication No. 79-9. Institutefor Environmental Studies, Vrije Universiteit, Amsterdam, in co-operation with the World WildlifeFund.
Carandang A. 1996. Personal communication.
Carandang, A. and Padilla, J.E. 1996. “Assessment of Forest Resources of the Pagbilao MangroveForest.” In R. Janssen and J.E. Padilla (eds). 1997.
Carter, R.W.G. 1988. Coastal Environments: An Introduction to the Physical, Ecological andCultural Systems of Coastlines. Academic Press, London.
Christensen, B. 1982. Management and Utilisation of Mangroves in Asia and the Pacific.Environment Paper No. 3. Food and Agricultural Organisation, Rome.
Davies, J.P., Magsalay, P.M., Rigor, R., Mapalo, A. and Gonzales, H. 1990. A Directory ofPhilippine Wetlands. Vol. 1. AWBPFI, Cebu City, the Philippines.
De la Paz, R. and Aragones, N. 1985. “Mangrove Fishes of Pagbilao (Quezon Province, LuzonIsland), with Notes on their Abundance and Seasonality.” Nat. Appl. Sci. Bull. 37(2): 171-190.
Dickinson, E.C., Kennedy, R.S. and Parkes, K.C. 1990. The Birds of the Philippines. BOUChecklist No. 12. Dorset Press, Dorchester, UK.
Dixon, J.A. and Lal, P.N. 1994. “The Management of Coastal Wetlands: Economic Analysis ofCombined Ecological-Economic Systems.” In P. Dasgupta and K.G. Maler (eds). The Environmentand Emerging Development Issues. Clarendon Press, Oxford.
Fisilier, J.L. 1990. Living off the Tides: Strategies for the Integration of Conservation andSustainable Resource Utilization along Mangrove Coasts. Report of the Environmental Database onWetland Interventions (EDWIN), Leiden, the Netherlands.
Fortes, M.D. 1994. Mangrove Resource Valuation Project: Marine Ecology Component (FinalReport). Philippine Institute for Development Studies, Makati City, Philippines.
Guarin, F.Y. 1996. Personal communication.
Groombridge, B. (ed). 1992. Global Biodiversity: Status of the Earth’s Living Resources. Chapman& Hall, London.
Groot, R. de. 1993. Functions of Nature: Evaluation of Nature in Environmental Planning,Management and Decision Making. Wolters-Noordhoff, Groningen, the Netherlands.

Hirsch, D. and Mauser, A. 1992. The Economic Value of Mangroves. Two Case Studies: Mida Creekand Funzi Bay. School of Environmental Studies, Eldoret, Kenya and University of Amsterdam,The Netherlands.
Institute for Environmental Studies and Management. 1993. An Environmental Impact Statementfor the Quezon Coal-Fired Thermal Power Plant Project in Grande Island, Pagbilao, Quezon.
International Union for Conservation of Nature and Natural Resources. 1983. Global Status ofMangrove Ecosystem. IUCN Commission on Ecology Papers No. 3. IUCN, Switzerland.
James, R.F. 1991a. The Valuation of Wetlands: Approaches, Methods and Issues. PHPA/AWP.Sumatra Wetland Project Report No. 29. Asian Wetland Bureau, Bogor, Indonesia.
James, R.F. 1991b. Wetland Valuation: Guidelines and Techniques . PHPA/AWP. Sumatra WetlandProject Report No. 31, Asian Wetland Bureau, Bogor, Indonesia.
Janssen, R. 1992. Multiobjective Decision Support for Environmental Management. KluwerAcademic Publishers, Dordrecht.
Janssen, R. and Padilla, J.E. 1996. Valuation and Evaluation of Management Alternatives for thePagbilao Mangrove Forest. CREED Working Paper No 9. International Institute forEnvironment and Development (IIED), London and IVM, The Netherlands.
Janssen, R. and Padilla, J.E. (eds). 1997. Mangroves or Fishponds? Valuation and Evaluation ofManagement Alternatives for the Pagbilao Mangrove Forest CREED Final Report. Resources,Environment and Economics Centre for Studies, Inc, Pasig City, Philippines and the Institute forEnvironmental Studies (IVM), Amsterdam, The Netherlands.
Lal, P.N. 1990. Conservation or Conversion of Mangroves in Fiji. Occasional Papers of the East-West Environment and Policy Institute, paper No. 11.
Larsson, J., Folke, C. and Kautsky, N. 1993. Ecological Limitations and Appropriation ofEcosystem Support by Shrimp Farming in Columbia. Discussion Paper Series, No. 29. BeijerInstitute, Stockholm.
MacNae, W. 1974. Mangrove Forests and Fisheries. Indian Ocean Fishery CommissionIOFC/DEV/74/34. FAO and United Nations Development Programme, Rome.
Mann, K.H. 1982. Ecology of Coastal Waters. Blackwell, Oxford.
National Mangrove Committee. 1982. Initial Findings: an Assessment of Mangrove Areas asSpawning Grounds for Fishes and Crustaceans. Bakawan 2(2):3.
Natural Resources Management Centre. 1980. Mangrove Inventory of the Philippines usingLANDSAT Data. Bakawan 1(1).
National Statistical Coordination Board. 1996. A Case Study on Natural Resource Accounting:Philippine Marine Fishery Resources. National Statistical Coordination Board, Philippines.
Ong, P. 1996. Personal communication.
Ong, P. and Padilla, J.E. 1996. “Assessment of Fisheries-Related Functions of the PagbilaoMangrove Forest.” In R. Janssen and J.E. Padilla (eds). 1997.Padilla, J.E. and Tanael, M. 1996a. “Assessment of Milkfish and Prawn Culture in Brackish WaterPonds.” In R. Janssen and J.E. Padilla (eds). 1997.
Padilla, J.E. and Tanael, M. 1996b. “Evaluation of Integrated Aquaculture and Silviculture.” In R.Janssen and J.E. Padilla (eds). 1997.

Parish, J.D. 1989. “Fish Communities of Interacting Shallow-Water Habitats in Tropical OceanicRegions.” Mar. Ecol. Prog. Ser. 58:143-160.
Parks, P. and Bonifaz, M. 1994. “Non Sustainable Use of Renewable Resources: MangroveDeforestation and Mariculture in Ecuador.” Marine Resource Economics 9:1-18.
Pinto, L. 1985. Community Structure and Population Dynamics of Mangrove Fishes of Pagbilao,Quezon, Philippines. Ph.D. thesis, University of the Philippines, Diliman, Quezon City.
Pinto, L. 1988. “Population Dynamics and Community Structure of Fish in the Mangroves ofPagbilao, Philippines. Journal of Fish Biology 33 (Supp. A): 35-43.
Robertson, A.I. and Alongi, D.M. (eds). 1992. Tropical Mangrove Ecosystems. AmericanGeophysical Union. Washington, DC.
Robertson, A.I. and Duke, N.C. 1987. “Mangroves as Nursery Sites: Comparison of the Abundanceand Species Composition of Fish and Crustaceans in Mangroves and Other Near-shore Habitats inTropical Australia.” Marine Biology 96: 63-90.
Ruitenbeek, H.J. 1992. Mangrove Management: an Economic Analysis of Management Optionswith a Focus on Bintuni Bay, Irian Jaya. Environmental Management Development in IndonesiaProject (EMDI) Environmental Reports, 8. Jakarta and Halifax, Indonesia.
Scott, D.A. and Poole, C.M. 1989. A Status Overview of Asian Wetlands. No. 53. AWB, KualaLumpur.
Spaninks F. and van Beukering, P. 1997. Economic Valuation of Mangroves: Potential andLimitations. CREED Working Paper No 14. IIED, London and IVM, Vrije Universiteit,Amsterdam.
Thollot, P., Kulbicki, M. and Wantiez, L. 1991. “Temporal Patterns of Species Composition inThree Habitats of the St. Vincent Bay (New Caledonia): Coral Reefs, Soft Bottoms andMangroves.” In M. Ricard (ed). Proceedings ISRS Congress, Noumea, New Caledonia, pp 127-136.
World Resources Institute and the International Union for the Conservation of Nature. 1986.World Resource 1986. Basic Book, Inc., New York.
Zamora, P.M. 1989. “Philippine Mangroves: their Depletion, Conversion and DecreasingProductivity.” Wallaceana 58: 1-5.

List of tables
Table 1. Environmental functions of the Pagbilao mangrovesTable 2. Goods and services under different management alternativesTable 3. Annual contribution to total value of the management alternatives.Table 4. A comparison of net annual benefits of mangrove products and functions.Table 5: Problem variables triggered by failure of management conditionsTable 6. Change in annual contribution to total value of the management alternatives in
case of unsustainability.
List of figures
Figure 1. The Pagbilao region.Figure 2. Fishponds near the Pagbilao mangrove forest.Figure 3. Functions of the natural environment (adapted from Groot 1992).Figure 4. Mangroves on the coastal edge of the Pagbilao mangrove forest.Figure 5. Rhizophora and Avicennia mangals.Figure 6. Explanation of symbols used.Figure 7. Structure of the systems diagrams.Figure 8. Aggregate dynamics and ecological processes.Figure 9. Production of environmental goods by the Pagbilao mangroves.Figure 10. Provision of environmental services by the Pagbilao mangrovesFigure 11. Values of environmental goods provided by the Pagbilao mangroves.Figure 12. Values of environmental services provided by the Pagbilao mangroves.