the use of fly ash as an aggregate for...
TRANSCRIPT

THE USE OF FLY ASH AS AN AGGREGATE FOR FOUNDRY SAND
MOLD AND CORE PRODUCTION
Final Report June 1, 2001 thru April 30, 2002
prepared by Principal Investigators Professor Jerzy Sobczak and Mr. Robert M. Purgert
Authors Team:
1. BALINSKI Andrzej , D.Sc., Associate Professor 2. DARLAK Pawel, M.Sc.(Eng.), Researcher 3. SZOLC Maciej, Eng., Researcher
In cooperation with Dr. Natalie Sobczak
April 30, 2002
CBRC/DOE Grant Number CBRCE42
Submitted by: The Energy Industries of Ohio Park Center Plaza, Suite 200
6100 Oak Tree Boulevard Independence, OH 44131
1

Disclaimers
This report was prepared as an account of work sponsored by an agency of the United States Government. Neither the United States Government nor any agency thereof, nor any of their employees, makes any warranty, express or implied, or assumes any legal liability or responsibility for the accuracy, completeness, or usefulness or any information, apparatus, product, or process disclosed, or represents that its use would not infringe privately owned rights. Reference herein to any specific commercial product, process, or service by trade name, trademark, manufacturer, or otherwise does not necessarily constitute or imply its endorsement, recommendation, or favoring by the United States Government or any agency thereof. The views and opinions of authors expressed herein do not necessarily state or reflect those of the United States Government or any agency thereof. This report was prepared with the support of the U.S. Department of Energy, Federal energy Technology Center, through it’s Cooperative Agreement No. DE-FC26-998FT40028 with West Virginia University Research Cooperation. However, any opinions, findings, conclusions , or recommendations expressed herein are those of the author(s) and do not necessarily reflect the views of WVU or DOE.
2

I. Executive Summary
Coal is the major fuel burned for power production in the United States. In 1998, power production generated nearly 45 million tons of fly ash and over 10 million tons of bottom ash as part of the coal combustion byproduct waste stream. This material is composed of non-crystalline oxides of silicon (SiO2), aluminum (Al2O3), iron (Fe2O3), calcium (CaO) and minor quantities of other metal oxides (magnesium, sodium, titanium, potassium). The precise composition of fly and bottom ash varies depending on the source of the coal being burned. The physical properties of the ash vary with the type and uniformity of the coal, the operating parameters of the power plant and the collection methods employed to separate the ash from the combustion stream. Although some portion of this ash is used in beneficial applications primarily in the construction industry, significant portions are disposed of in landfills.
The foundry industry in the U.S. is comprised of approximately 3,000 independent companies found in all 50 states. While 85% percent of these companies are small businesses employing fewer than 100 people, the industry as a whole provides well paying jobs for over 200,000 people each year. With the exception of die casting, sand molds and cores are used in nearly every casting process practiced in the U.S. with foundries using about 100 million tons of sand per year in their operations. Only the largest foundries generate the amounts needed to justify the capital equipment necessary to reuse this sand in foundry applications or to process the sand into a relatively clean material for use in construction applications. Every year, 8 to 10 million cubic yards of this sand are placed in landfills at a yearly cost of $100 to $250 million dollars.
Aside from the disposal costs associated with casting sands the biggest concern surrounding its use in the foundry industry is employee exposure to crystalline silica. Common foundry sands are composed of crystalline silica (quartz) materials. As such, prolonged exposure to dusts form these sands can be the cause of silicosis. This is particularly true when very fine grades of sand are handled. The Occupational Safety and Health Agency (OSHA) has proposed lowering the allowable workplace exposure of crystalline silica by 50% to 0.05 mg/m3. This level of exposure might be difficult to achieve at many foundries. In addition, the record keeping, reporting, training and medical surveillance required under the new standards would be extremely time consuming and costly.
High silica sand is an extremely good material for casting molds because it has the ability to withstand the temperature of the molten metal, can absorb and transmit heat, and has sufficient permeability to allow gasses generated during casting to pass between the particles without causing casting defects. Fly ash and bottom ash materials have many of the same attributes. These materials have a very high melting point, can absorb and transmit heat during pouring and have the ability to allow gases to pass through a compacted mass.
Foundry sands are manufactured within strict particle size distributions to tailor the properties of the material to the intended casting process. The major difficulty with fly or bottom ash is the fact that it currently is generated in a process that is optimized for the combustion of coal. The particle size distribution that results is determined by combustion criteria without any thought for the properties required to use the resultant ash in any secondary application. However, it was found that it is possible to determine and modify the particle size distribution of fly ash or bottom ash
3

in such a manner that the resulting material could be acceptable as a replacement for foundry sand in some applications.
This project determined that fly ash could act as a replacement for foundry sand and has been justified in a number of ways. First, the use of fly ash would eliminate a portion of the total amount of material being sent to landfills. Granted, the fly ash or bottom ash so used would be landfilled in the same manner as the foundry sand currently in use. However, since the ash would be landfilled in any event, total volume of landfill material would be reduced by the quantity of sand replaced.
Secondly, the most problematic sand material handled by foundries are those fine grained sands with American Foundry Society (AFS) Grade Fineness Numbers higher than 90. These sands have nearly 80% of their grains smaller than 140 US Mesh. This is the sand that poses the greatest threat of dusting during handling and of inhalation by foundry workers. Since fly ash is extremely fine it is these very fine sands that may have the greatest prospect of being replaced by this alternative material. The non-crystalline nature of these ash materials could also reduce or eliminate the concern for crystalline silica exposure in applications using fine foundry sands.
Third, the ash products have a considerably lower bulk density than virgin sands. If they prove commercially suitable as a replacement for sands, the resulting molds will be much lighter than comparable sand molds. Handling the molds would become easier for foundry workers and injuries related to handling the molds would be reduced.
Fourth, Because of the low density of ash material this material is suspected to provide a much higher insulating value than typical foundry sands. This increased insulation would make it possible to pour thinner sections, particularly in light metal (aluminum and magnesium) castings without encountering freeze-off during the pour and should be more fully explored in future studies.
II. Introduction to Technical Report
Fly ash materials as a waste by-product, are produced during combustion of coal by thermal power plants and present a serious ecological problem associated with their storage and disposal [1-3]. Therefore, the development of suitable scientific, technical and economic solutions of fly ash utilization is very pressing and important.
Because of the complex physical and mechanical properties with respect to low price and low density, fly ash can be an extremely attractive material applicable for the synthesis of composites [2-5]. This very unique and inexpensive composite powder resource, unlike those synthetically produced in a favorable spherical form with wide ranges of size and density, may be suitable in various light weight structural applications particularly when creating Aluminum Metal Matrix Composites (MMC’s) known as ALFA (ALuminum – Fly Ash) Composites [6-9]. Another promising application of fly ash investigated under this project is its potential use as replacement for foundry sand in mold and core production.
This project undertook a scientific methodology to determine whether fly ash could be used in a number of applications substituting for traditional foundry sands in the production of metal castings. Studies to determine the effects of fly ash as an additive to green sand and as a filler for chemically bonded sand where undertaken in accordance with the Statement of Work included as Appendix 1 to the Final Report.
4
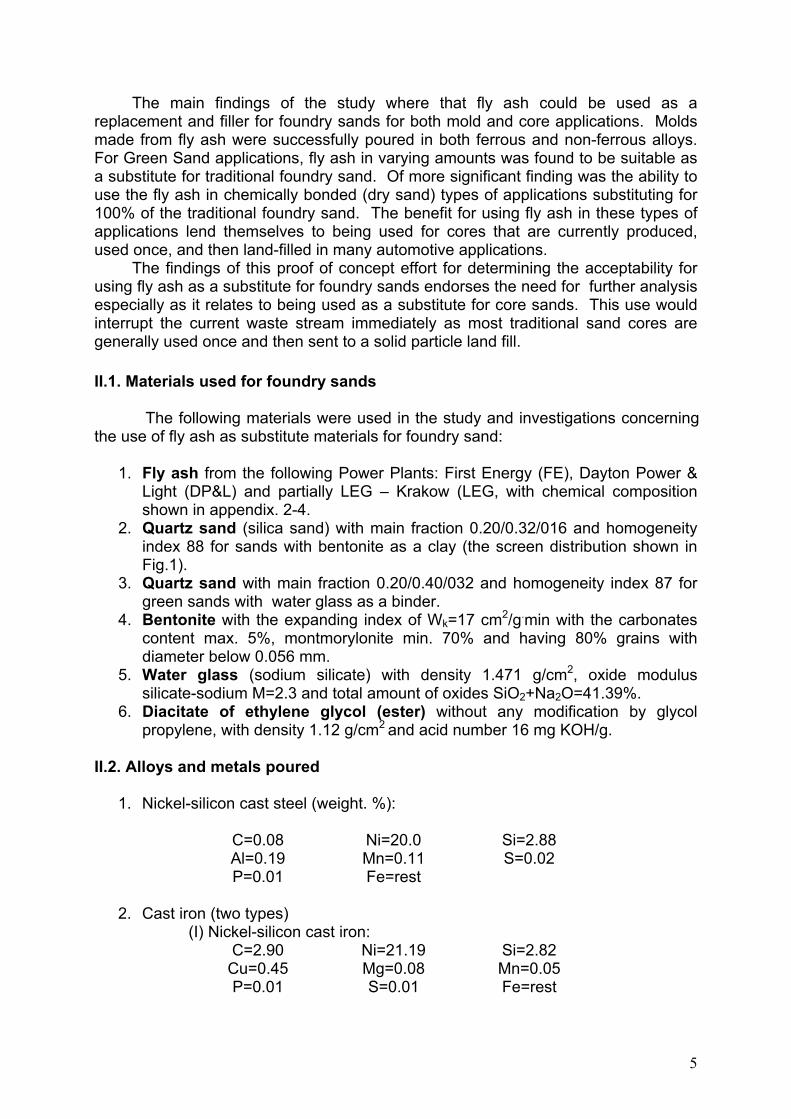
The main findings of the study where that fly ash could be used as a replacement and filler for foundry sands for both mold and core applications. Molds made from fly ash were successfully poured in both ferrous and non-ferrous alloys. For Green Sand applications, fly ash in varying amounts was found to be suitable as a substitute for traditional foundry sand. Of more significant finding was the ability to use the fly ash in chemically bonded (dry sand) types of applications substituting for 100% of the traditional foundry sand. The benefit for using fly ash in these types of applications lend themselves to being used for cores that are currently produced, used once, and then land-filled in many automotive applications.
The findings of this proof of concept effort for determining the acceptability for using fly ash as a substitute for foundry sands endorses the need for further analysis especially as it relates to being used as a substitute for core sands. This use would interrupt the current waste stream immediately as most traditional sand cores are generally used once and then sent to a solid particle land fill. II.1. Materials used for foundry sands
The following materials were used in the study and investigations concerning the use of fly ash as substitute materials for foundry sand:
1. Fly ash from the following Power Plants: First Energy (FE), Dayton Power &
Light (DP&L) and partially LEG – Krakow (LEG, with chemical composition shown in appendix. 2-4.
2. Quartz sand (silica sand) with main fraction 0.20/0.32/016 and homogeneity index 88 for sands with bentonite as a clay (the screen distribution shown in Fig.1).
3. Quartz sand with main fraction 0.20/0.40/032 and homogeneity index 87 for green sands with water glass as a binder.
4. Bentonite with the expanding index of Wk=17 cm2/g.min with the carbonates content max. 5%, montmorylonite min. 70% and having 80% grains with diameter below 0.056 mm.
5. Water glass (sodium silicate) with density 1.471 g/cm2, oxide modulus silicate-sodium M=2.3 and total amount of oxides SiO2+Na2O=41.39%.
6. Diacitate of ethylene glycol (ester) without any modification by glycol propylene, with density 1.12 g/cm2 and acid number 16 mg KOH/g.
II.2. Alloys and metals poured
1. Nickel-silicon cast steel (weight. %):
C=0.08 Ni=20.0 Si=2.88 Al=0.19 Mn=0.11 S=0.02 P=0.01 Fe=rest
2. Cast iron (two types)
(I) Nickel-silicon cast iron: C=2.90 Ni=21.19 Si=2.82
Cu=0.45 Mg=0.08 Mn=0.05 P=0.01 S=0.01 Fe=rest
5

(II) Nickel-chromium cast iron C=1.20 Ni=2.50 Cr=1.50
Mo=0.40 Mn=0.40 Si=0.19 P=0.01 S=0.01 Fe=rest
3. Silicon bronze (BK331)
Si=3.50 Zn=4.21 Mn=1.05 Fe=0.85 Cu=rest
4. Aluminum-silicon alloy (AK9)
Si=9.20 Mg=o.25 Mn=0.41 Fe=0.35 Fe=rest
5. Pure zinc
II.3. Apparatuses and devices used in the study to determine the applicability of fly ash as a substitute for traditional foundry sands
Figures 1.II-12.II show the apparatuses and devices used in experimental procedure as follows:
• Apparatus for size analysis, type LPze–2e (Fig.1.II) • Pneumatic screen, type LPzB–2 (Fig.2.II) • Standard edge runner sand mill, type LM–2 (for green sand) (Fig.3.II) • Standard ribbon sand mill (for chemically bonded sand) (Fig.4.II) • Standard rammer, type LUA-2e (Fig.5.II) • Laboratory press, type LPr-1 (Fig.6.II) • Three – chambers infrared drier, type LAp-3b (Fig.7.II) • Apparatus for strength test of foundry sand, type LRuE-2 (Fig.8.II) • Device for determination of tensile strength of green sand, type LRuw (Fig.9.II) • Apparatus for determination of foundry sand permeability, type LPiR-2E
(Fig.10.II) • Apparatus for determination of foundry sand friability, type LS-1 (Fig.11.II) • Device for making of foundry sand samples for the above tests (Fig.12.II)
III. Experimental Procedures Utilized
III.1. Fly ash characterization
As mentioned above, some basic characteristics of the fly ashes being investigated were given by the power plant operators/producers (see annexes 2-4). However, for future applications of fly ash as a constituent of foundry sand in mold and core production it was necessary to determine additional information on the physical properties of the fly ash such as dimensions (screen distribution), density, characteristic temperatures and chemical properties (e.g. pH value). III.1.1. Screen analysis
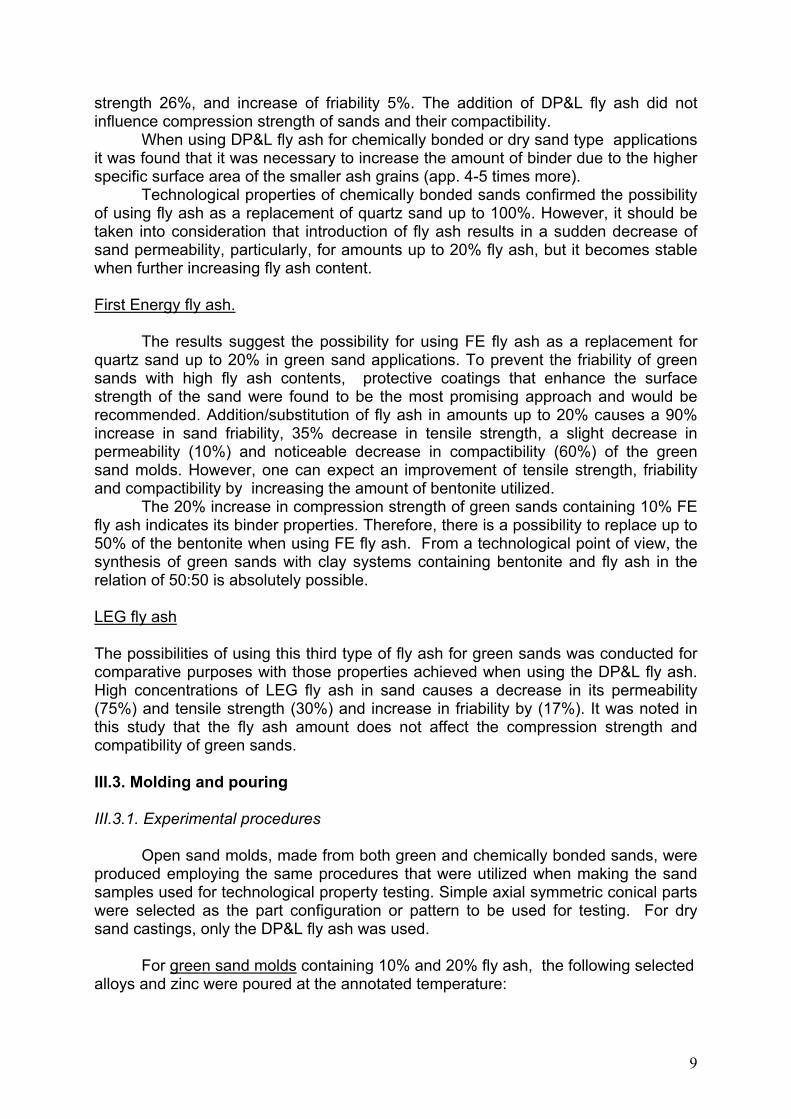
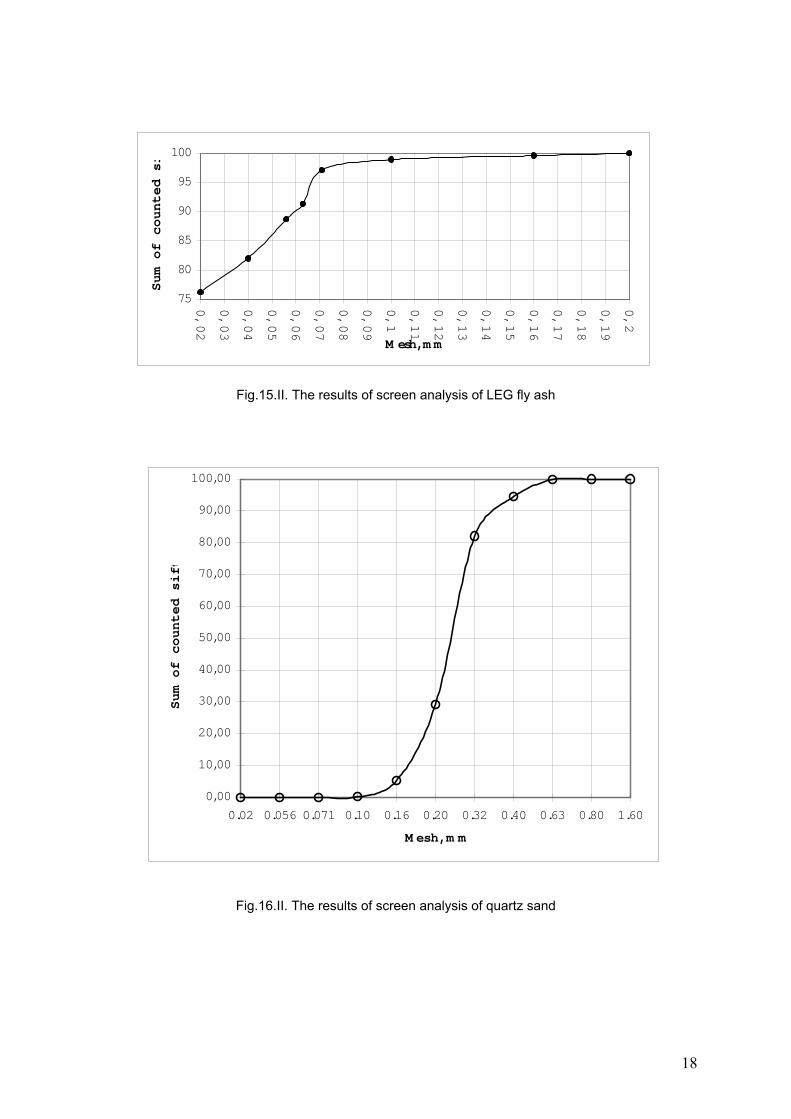
Screen analysis of the fly ash was accomplished using apparatus of type LpzE-2e (Fig. I.II). For comparison, the same methodology was used for quartz sand.
6

The results are shown in Figs. 1.III – 4.III. Generally, the grain dimensions of fly ash were found to be much smaller than those of quartz sand as expected III.1.2. Bulk density
Using a gravimetric technique the following values of bulk density db have been obtained for as-received materials:
• First Energy fly ash: db = 1.00 g/cm
3 (0.0362 lb/in3) • Dayton Power and Light fly ash: db = 1.04 – 1.08 g/cm
3 (0.0376 – 0.0.390 lb/in3) • LEG fly ash: db = 1.10 g/cm
3 (0.0398 lb/in3) • Quartz sand: db = 1.40 – 1.45 g/cm
3 (0.0506 – 0.0524 lb/in3 ) (true density of quartz is dt = 2.650 g/cm
3 (0.0957 lb/in3 ) All 3 types of fly ash showed approx. 40% higher bulk density than quartz sand.
III.1.3. Characteristic temperatures
The characteristic temperatures of the fly ashes to include the temperature of sintering, softening, melting and flow were estimated during the heating of fly ash cylindrical samples in air using a high temperature microscope PR-25/1750 (appex. 5 and 6). For each material, three samples were tested to determine the changes in sample height (red line) and wideness (blue line), its shape factor (green line) and flatness of the sample tip (khaki line). For comparison, the melting point of quartz sand was also measured. The results of these investigations are shown in Table 1.III.
Dayton Power & Light fly ash showed the characteristic temperatures much higher than First Energy fly ash, and lower when compared to quartz sand. The differences between these two fly ashes, most probably, resulted from of its chemical composition.
III.1.4. pH values
The pH values for a water solution of fly ashes (20 vol.%) measured by a litmus papers method showed pH=8.5 and pH=7.0 for First Energy and Dayton Power & Light ash, respectively.
III.2. Technological properties of foundry sand containing fly ash
III. 2.1. Green sands
Green (mechanically bonded) sands were prepared using a standard edge runner sand mill (Fig.3.II) according to the following composition (weight percent):
Sand grains – 93% Clay (bentonite) – 7% Water – 3.5% The sand grains contained quartz sand (basic mass) and a mixture of quartz
sand & fly ash – 5, 10 & 20%.
7

It was noticed, that FE fly ash, contrary to DP & L and LEG fly ashes, demonstrated bonding properties. It was decided to investigate the technological properties for a mixture of clay (bentonite + FE fly ash) containing 25.50% and 70% FE fly ash. 100% of FE fly ash green sand molds were also made. At the beginning, the loose ingredients (quartz sand + clay) were mixed for 2 minutes. After that, water was added and mixing was continued for an additional 6 minutes. The obtained sands were used to prepare the samples (Fig. 5.III) for investigation of the following technological properties:
- compression strength Rc
w, MPa - tensile strength Rm
w, MPa - permeability Pw, m · 10 –8 / Pa · s - friability Sw, % - compactibility Z, % All tests were carried out on 5 samples and an average value of each
characteristic was calculated. Additionally, the moisture of the sand was controlled during measurements of the technological parameters (note, the theoretically estimated value is 3.5%).
The results of tests are shown in Tables 2.III – 5.III. and in Figs. 17.III -20.III. III.2.2. Chemically bonded sands
Chemically bonded sands were prepared using a standard ribbon sand mill (Fig.4.II) according to the following composition (weight parts):
Fly Ash/Sand grains – 100.0 Binder system: Water–glass – 9.0 Diacetate of ethylene glycol – 15% of water-glass The above composition was optimized taking into account the high dispersion
of fly ash grains. To study technological properties, the samples of chemically bonded fly ash sands were prepared in the same manner as was employed for traditional green sands (see III.2.1) (Fig.21.III). All characteristics were measured after 3 and 24 hours of chemical hardening. The results of these investigations are shown in Table 6.III and Figs. 22.III – 23.III.
It was concluded that due to a lack of hardening reaction, the FE fly ash might not be suitable for the synthesis of “dry sand” molds with the selected binder used during these experiments (water-glass + diacetate of ethylene glycol). III.2.3. Findings
DP&L fly ash.
Using a common basis, the results of the established technological properties show promising applicability of DP&L fly ash as a replacement for quartz sand up to 20% for green sand applications. Higher fly ash content causes significant decrease in permeability, tensile strength and increases in friability of green sands. However, for 20% fly ash, the slope of sand permeability is about 80%, decrease of tensile
8
strength 26%, and increase of friability 5%. The addition of DP&L fly ash did not influence compression strength of sands and their compactibility.
When using DP&L fly ash for chemically bonded or dry sand type applications it was found that it was necessary to increase the amount of binder due to the higher specific surface area of the smaller ash grains (app. 4-5 times more).
Technological properties of chemically bonded sands confirmed the possibility of using fly ash as a replacement of quartz sand up to 100%. However, it should be taken into consideration that introduction of fly ash results in a sudden decrease of sand permeability, particularly, for amounts up to 20% fly ash, but it becomes stable when further increasing fly ash content. First Energy fly ash.
The results suggest the possibility for using FE fly ash as a replacement for quartz sand up to 20% in green sand applications. To prevent the friability of green sands with high fly ash contents, protective coatings that enhance the surface strength of the sand were found to be the most promising approach and would be recommended. Addition/substitution of fly ash in amounts up to 20% causes a 90% increase in sand friability, 35% decrease in tensile strength, a slight decrease in permeability (10%) and noticeable decrease in compactibility (60%) of the green sand molds. However, one can expect an improvement of tensile strength, friability and compactibility by increasing the amount of bentonite utilized.
The 20% increase in compression strength of green sands containing 10% FE fly ash indicates its binder properties. Therefore, there is a possibility to replace up to 50% of the bentonite when using FE fly ash. From a technological point of view, the synthesis of green sands with clay systems containing bentonite and fly ash in the relation of 50:50 is absolutely possible.
LEG fly ash The possibilities of using this third type of fly ash for green sands was conducted for comparative purposes with those properties achieved when using the DP&L fly ash. High concentrations of LEG fly ash in sand causes a decrease in its permeability (75%) and tensile strength (30%) and increase in friability by (17%). It was noted in this study that the fly ash amount does not affect the compression strength and compatibility of green sands. III.3. Molding and pouring III.3.1. Experimental procedures
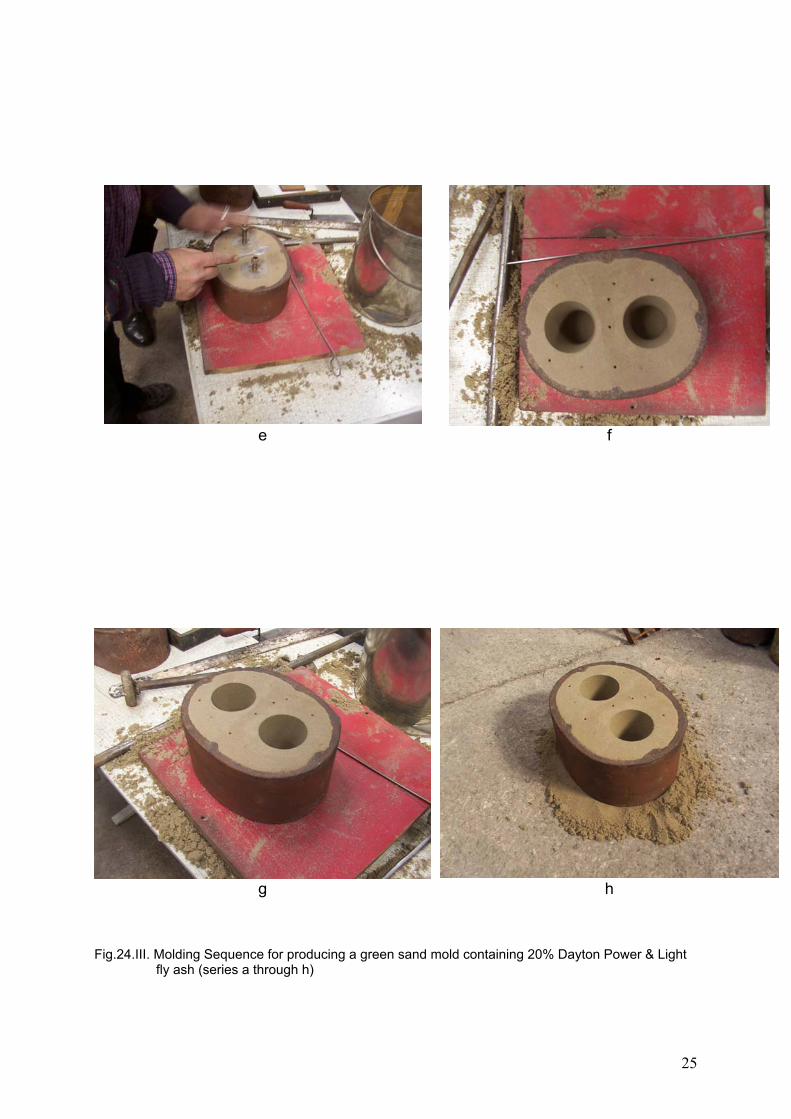
Open sand molds, made from both green and chemically bonded sands, were produced employing the same procedures that were utilized when making the sand samples used for technological property testing. Simple axial symmetric conical parts were selected as the part configuration or pattern to be used for testing. For dry sand castings, only the DP&L fly ash was used.
For green sand molds containing 10% and 20% fly ash, the following selected
alloys and zinc were poured at the annotated temperature:
9

1. Cast steel - 1500ºC (2733ºF)
2. Grey iron (I) - 1400ºC (2553ºF) Grey iron (II) - 1520ºC (2770ºF) 3. Silicon bronze - 1050ºC (1928ºF) 4. Aluminum alloy - 720ºC (1328ºF) 5. Zinc - 420ºC (788ºF)
For chemically bonded molds containing 100% fly ash, silicon bronze, aluminum and zinc alloys were also poured at the same temperatures used for green sands molds as indicated above. Figs. 24.III - 29.III show the subsequent steps of the molding and pouring procedures used while Fig. 30.III illustrates pouring into a chemically bonded 100% fly ash mold with a 100% fly ash core. The solidified castings were removed from the molds, cleaned to estimate the quality of their surfaces and then sectioned or cut to characterize vertical cross sections (Figs.31.III - 32.III). III.3.2. Findings Green sands
All selected alloys employed for this study are capable of being poured into molds using the green sand method containing up to 20% fly ash as a substitute for quartz sand. The surfaces of the obtained castings were free from any visible defects and/or reaction products formed between the molten metal and the sand (Fig. 31.III). Visual observation of cross sections showed that all castings were sound (Fig. 32 III). Among the selected alloys, only the nickel-silicon cast steel demonstrated a strong interaction with the sand (Fig. 32.IIIb). Therefore, to eliminate this unwanted phenomenon, the fly ash content was decreased to 10%. Chemically bonded sands
Silicon bronze, aluminum alloys and zinc were found capable of being successfully poured into chemically bonded sand molds containing up to 100% fly ash. The quality of these castings, estimated by visual characterization of casting surfaces and cross sections, was found to be very satisfactory. Additionally, further tests showed promising applicability of using 100% fly ash for core production (Figs. III). However, for this purpose, the binder system has to be optimized to reduce the core friability and permeability. Fig. III shows the difference between friability behaviors of two sands containing various amount of binder (water-glass) and 100% fly ash chemically bonded sands.
10

IV. Final conclusions 1. Fly ash can be utilized as a replacement and filler in foundry sands used in both green and dry sand molds and also for core production. The molds made from such foundry sands were successfully poured in many metals to include Fe-, Cu-, Al- and Zn- based alloys. 2. For green sand molds, all investigated fly ashes were found capable of being added up to amounts of 20% with their technological properties remaining at sufficient levels, which provides an opportunity for obtaining castings of satisfactory quality from sand cast grey iron, silicon bronze, aluminum alloys and zinc (taking into account casting surfaces and soundness). For nickel-silicon cast steel, an acceptable fly ash content in green sand was found to be warranted below 20% due to its strong interaction with such fly ash-sand. 3. Because of binder properties noted for FE fly ash, there is an opportunity to replace some clay (e.g. bentonite) by FE fly ash in green sand molds. 4. FE fly ash, however, does not demonstrate an applicability for the synthesis of chemically bonded sands, with the selected binder system used in these tests (water-glass + diacetate of ethylene glycol) due to a lack of hardening reaction. 5. The result of investigations have confirmed the possibility of using 100% DP&L fly ash as a replacement for traditional sand grains for the production of chemically bonded molds and cores. However, for wide-scale applications, the chemical composition and amount of binder should be optimized, especially to reduce the friability and permeability of chemically bonded sands.
References 1. Rohatgi P.K., “Low-Cost Fly Ash Containing Aluminum Matrix Composites”, JOM, 11 (1994),
55-59. 2. Rohatgi P.K., Guo R.K., “Low Cost Cast aluminum-Fly Ash Composites for Ultra Light
Automotive Application” Processing, Properties, and Applications of Cast Metal Matrix Composites, TMS publication, 1997, 157-168.
3. Rohatgi P.K. et al., “Cast Aluminum - Fly Ash Composites for Engineering Applications”, AFS Transactions, (1995) 575-586.
4. Rohatgi P.K. et al., “Influence of Squeeze Pressure of AlSi9Zn3Cu3Fe1MnMg (52K) Aluminum Alloy-Fly Ash Composites”, Transactions of the Foundry Research Institute, XLIII (3) (1993) 143-160.
5. Rohatgi P.K., Sobczak J., and Sobczak N., “Structure and Properties of Squeeze Cast Aluminum Alloy-Flyash Composites”, Proceedings ICCE-2, ed. D. Hui, Aug. 20-24, 1995, New Orleans, USA, 689-690.
6. Sobczak J., Sobczak N., and Rohatgi P.K., ”Using of Fly Ash for the Production of Light Weight Composites”, Advanced Light Alloys and Composites, ed. R. Ciach, NATO ASI Series, 3. High Technology, Kluwer Academic Publishers, 59 (1998), 109-115.
7. Sobczak J., Sobczak N., Purgert R.M., Rohatgi P.K. New Alfa Composites (Aluminum Alloys and Fly Ash): Fly Ash Waste Material for the Synthesis of Light Weight Low Cost Aluminum Matrix Composites. Proceedings of Seventeenth International Pittsburgh Coal Conference, Pittsburgh, Pennsylvania, USA, September 11-14, 2000, pp.1-14.
8. Rohatgi P.K., Sobczak J., Purgert R.M. The Properties of ALFA Composites. Proceedings of Seventeenth International Pittsburgh Coal Conference, Pittsburgh, Pennsylvania, USA, September 11-14, 2000, 13 pp.
9. Sobczak J., Sobczak N., Rohatgi P.K., Purgert R.M. Squeeze Casting of ALFA (AK12 Aluminum Alloy – Fly Ash) Composites. Proceedings of Seventeenth International Pittsburgh Coal Conference, Pittsburgh, Pennsylvania, USA, September 11-14, 2000, pp.1-23.
Approved by EIO President Robert M. Purgert and
FRI General Manager Jerzy TYBULCZUK, Ph.D, Prof.
11

FIGURES
12

Fig.1.II. Apparatus for size analysis, type LPze–2e
Fig.2.II. Pneumatic screen, type LPzB–2
Fig.3.II. Standard edge runner sand mill, type LM–2 (for green sand) (Fig.3.II)
13

Fig.4.II. Standard ribbon sand mill (for chemically bonded sand)
Fig.5.II. Standard rammer, type LUA-2e (Fig.5.II)
14

Fig.6.II. Laboratory press, type LPr-1
Fig.7.II. Three – chambers infrared drier, type LAp-3b
Fig.8.II. Apparatus for strength test of foundry sand, type LRuE-2
15

Fig.9.II. Device for determination of tensile strength of green sand, type LRuw
Fig.10.II. Apparatus for determination of foundry sand permeability, type LPiR-2E
Fig.11.II. Apparatus for determination of foundry sand friability, type LS-1
16

Fig.12.II. Device for making of foundry sand samples for the above tests
92
93
94
95
96
97
98
99
100
0,02 0,04 0,06 0,08 0,1 0,12 0,14 0,16
M esh, m m
Sum of counted si
Fig.13.II. The results of screen analysis of FE fly ash
60
65
70
75
80
85
90
95
100
0,02 0,04 0,06 0,08 0,1 0,12 0,14 0,16
M esh, m m
Sum of counted si
Fig.14.II. The results of screen analysis of DP&L fly ash
17
75
80
85
90
95
100
0,02
0,03
0,04
0,05
0,06
0,07
0,08
0,09
0,1
0,11
0,12
0,13
0,14
0,15
0,16
0,17
0,18
0,19
0,2
M esh, m m
Sum of counted si
Fig.15.II. The results of screen analysis of LEG fly ash
0,00
10,00
20,00
30,00
40,00
50,00
60,00
70,00
80,00
90,00
100,00
0.02 0.056 0.071 0.10 0.16 0.20 0.32 0.40 0.63 0.80 1.60
M esh, m m
Sum of counted sift
Fig.16.II. The results of screen analysis of quartz sand
18

0
50
100
150
200
250
300
0 5 10 15 20
Fly ash content, weight %
Technologic
propertie
Rcw x 1000
Rmw x10000Pw
Sw x 10
Z
Fig.17.III. Effect of amount of FE (First Energy Corporation) fly ash on technological properties of green sands (Rcw – compression strength, Rmw- tensile strength, Pw- permeability, Sw- friability, Z- compactibility)
0
50
100
150
200
250
300
0 5 10 15 20
Fly ash content, weight.%
Technologic
propertie
Rcwx1000
Rm wx10000
Pw
Swx100
Z
Fig.18.III. Effect of amount of DP&L (Dayton Power & Light) fly ash on technological properties of green sands (Rcw – compression strength, Rmw- tensile strength, Pw- permeability, Sw- friability, Z- compactibility)
19

0
50
100
150
200
250
300
0 5 10 15 20
Fly ash content, weight.%
Technologic
propertie Rcw x 1000
Rm w x 10000
Pw
Sw x 100
Z
Fig.19.III. Effect of amount of LEG fly ash on technological properties of green sands (Rcw – compression strength, Rmw- tensile strength, Pw- permeability, Sw- friability, Z- compactibility)
0
50
100
150
200
250
300
350
0 20 40 60 80 100
Fly ash am ount in bentonite, weight.%
Technologic
propertie
Rcwx1000
Rmwx10000
Pw
Swx10
Z
Fig.20.III. Effect of amount of FE fly ash in bentonite on technological properties of green sands (Rcw – compression strength, Rmw- tensile strength, Pw- permeability, Sw- friability, Z- compactibility)
20

a b
c d
e f
g h
21

i j
k l
m n
Fig.21.III. Mechanical property measurements for the samples of chemically bonded sand went through the above sequence of events. (Samples used for bending strength investigations (a-b) and procedures (e-h); Samples for investigating compression strength (c-d) and procedures (I-n))
22

0
1
2
3
4
5
6
0 20 40 60 80 100
Fly ash content, weight.%
Technologic
propertie
Rc3
Rc24
Rg3
Rg24
Fig.22.III. Effect of amount of DP&L fly ash on compression and bending strength of chemically bonded sand (Rc – compression strength, Rg- bending strength, Rc3, Rg3 - properties after 3 hrs chemical hardening, Rc24, Rg24 – the same after 24 hrs chemical hardening)
0
50
100
150
200
250
300
350
0 20 40 60 80 100
Fly ash am ount, weight.%
Permeability, m
2 10-8 / Pa
P3
P24
Fig.23.III. Effect of the amount of DP&L fly ash on permeability Pu of chemically bonded sands (P3, P24 – after 3 and 24 hrs of chemical hardening respectively)
23

Green Sand Molding of Fly Ash
a b
c d
24
e f
g h
Fig.24.III. Molding Sequence for producing a green sand mold containing 20% Dayton Power & Light
fly ash (series a through h)
25

Pouring a Green Sand/Fly Ash Mold
a b
c d
e f
Fig.25.III. Sequence of pouring a nickel-silicon cast steel alloy into a green sand mold made with 10% DP&L fly ash.
26

a b
c d
e f
27

g h
i j
k l
Fig.26.III. Sequence of pouring a cast iron alloy (I) using a 20% DP&L fly ash green sand mold
28
a b
c d
e f
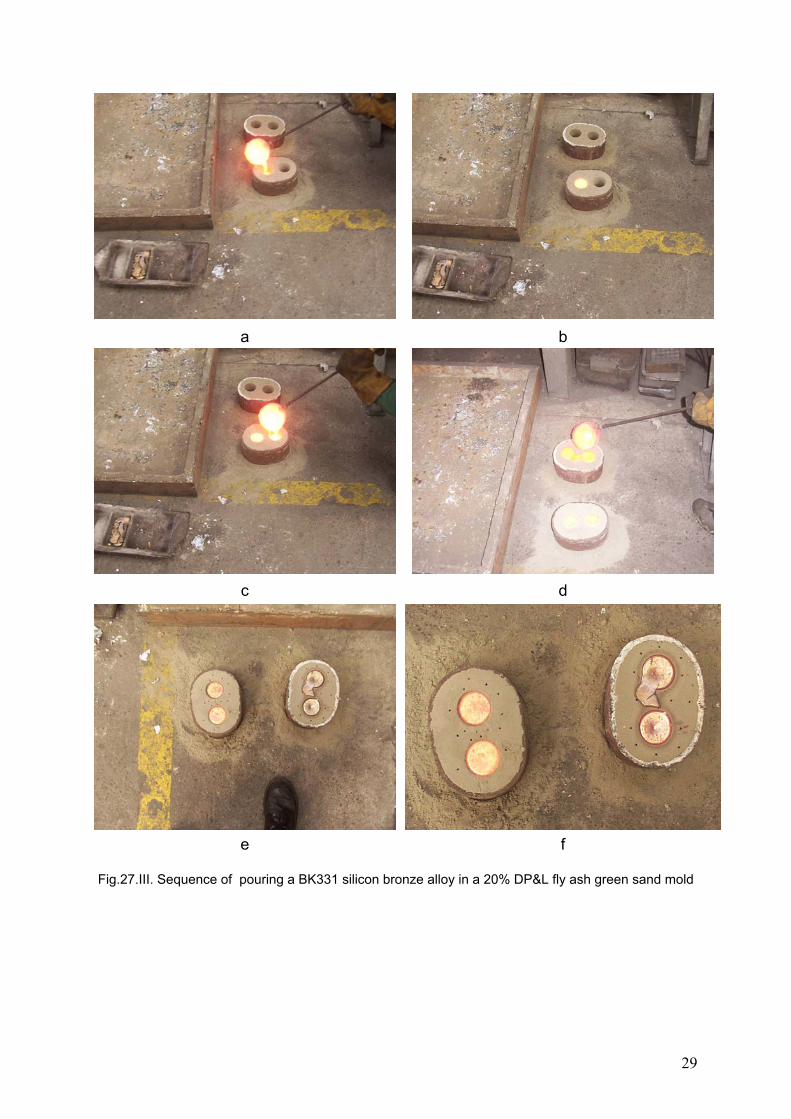
Fig.27.III. Sequence of pouring a BK331 silicon bronze alloy in a 20% DP&L fly ash green sand mold
29

a b
c d
e f
Fig.28.III. Sequence of pouring an AK9 aluminum alloy in 20% DP&L fly ash green sand mold
30

a b
c d
e f
Fig.29.III. Sequence of pouring a pure zinc alloy in a 20% DP&L fly ash green sand mold
31

a b
c d
Fig.30.III. Solidified casting from AK9 aluminum alloy in 100% DP&L fly ash chemically bonded sand mold with 100% DP&L fly ash core (chemically bonded)
32

a b
c d
e
f
33

h
g
i j
k l
Fig.31.III. Examples of sand castings: made from nickel-silicon cast steel in 10% DP&L fly ash green sand mold (a) and 20% fly ash green sand mold (b), made from cast iron (II) in 20% fly ash green sand mold (c), made from BK331 silicon bronze in 20% fly ash green sand mold (d) and 100% fly ash chemically bonded sand mold (e, f), made from AK9 aluminum alloy in 20% fly ash green sand mold (g, h) and 100% fly ash chemically bonded sand mold with core (100% fly ash) (I, j) , made from pure zinc in 20% fly as green sand mold (k) and 100% fly ash chemically bonded sand mold (l).
34

a b
c d
35

e f
g
36

h i
j k
Fig.32.III. Cross sections of castings made from investigated alloys and poured in green and chemically bonded sand molds. Grey iron (II) casting poured in 20% fly ash green sand mold (a), nickel-silicon cast steel casting poured in 20% fly ash green sand mold (b), BK331 silicon bronze castings poured in 20% fly ash green sand mold (c) and 100% fly ash chemically bonded sand mold (d), AK9 aluminum alloy castings poured in 20% fly ash green sand mold (e) and 100% fly ash chemically bonded sand mold (f), scheme of mould with core (g) and AK9 aluminum alloy casting poured in 100% fly ash chemically bonded sand mold with 100% fly ash core (h, i), pure zinc castings poured in 20% fly ash green sand mold (j) and 100% fly ash chemically bonded sand mold (k)
37

TABLES
38

Table 1.III.
Characteristic temperatures of investigated materials
Materials Temperatures
First Energy fly
ash Dayton Power &
Light fly ash Quartz sand
oC
1130
1176 – 1180 -
Sintering temperature
oF 2066 2150 – 2159
-
oC -
1478 – 1485 -
Softening temperature
oF -
2689 – 2705 -
oC
1183 - 1198
1625 – 1640
1710 - 1713 Melting temperature
oF
2161 – 2190
2959 – 2985
3115 - 3145
oC
1210 – 1217
1653 – 1662 -
Flow temperature
oF
2210 – 2224
3008 - 3025 -
39

Table 2.III
Effect of First Energy fly ash amount in sand grains on technological properties of green sands
Fly ash content
[weight.%]
Moisture of the sand
[%]
Compression strength
[MPa]
Tensile strength
[MPa]
Permeability
[m2 10-8/Pa s]
Friability
[%]
Compactibility
[%]
0 3,41 0,103 0,0148 260 2,36 685 3,37 0,131 0,0149 263 5,46 43
10 3,33 0,133 0,0141 257 10.24 3120 3,33 0,101 0,0095 230 24,64 27
Table 3.III Effect of Dayton Power & Light fly ash amount in sand grains on technological proprieties of green sands
Fly ash content
[weight.%]
Moisture of the sand
[%]
Compression strength
[MPa]
Tensile strength
[MPa]
Permeability
[m2 10-8/Pa s]
Friability
[%]
Compactibility
[%]
0 3,41 0,103 0,0148 260 2,36 685 3,43 0,104 0,0124 182 2,04 64
10 3,40 0,105 0,0122 133 2,16 6120 3,41 0,102 0,0109 58 2,47
40

Table 4.III
Effect of Dayton LEG fly ash amount in sand grains on technological proprieties of green sands
Fly ash content
[weight.%]
Moisture of the sand
[%]
Compression strength
[MPa]
Tensile strength
[MPa]
Permeability
[m2 10-8/Pa s]
Friability
[%]
Compactibility
[%]
0 3,41 0,103 0,0148 260 2,36 685 3,44 0,105 0,0145 177 1,96 63
10 3,45 0,101 0,0144 147 2,17 5920 3,42 0,101 0,0099 65 2,42 51
Table 5.III
Effect of First Energy fly ash amount in bentonite on technological proprieties of green sands
Fly ash content
[weight.%]
Moisture of the sand
[%]
Compression strength
[MPa]
Tensile strength
[MPa]
Permeability
[m2 10-8/Pa s]
Friability
[%]
Compactibility
[%] 0 3,41 0,103 0,0148 260 2,36 68
25 3,43 0,107 0,0133 233 3,24 6250 3,34 0,095 0,0130 227 5,08 4875 3,34 0,059 0,0058 193 31,46 39,2
100 3,32 0,0150 0 223 N.A. 34
41

Table 6.III
Effect of Dayton Power & Light fly ash amount in sand grains on technological properties of chemically bonded sands in relation to hardening time (3 and 24 hrs.)
Compression strength
[MPa] Bending strength
[MPa] Permeability [m2 10-8/Pa s]
Fly ash content
[weight.%] 3 h 24h 3h 24h 3h 24h0 1,91 3,83 0,62 1,91 257 307
20 2,5 5,0 0,76 2,42 64 3940 1.69 4,25 0,67 1,29 23 1860 1,08 3,14 0,33 0,84 21 1480 0,55 1,57 0,23 0,49 23 15100 0,43 0,69 0,13 0,25 13 14
1 ksi = 6.67 MPa
42

APPENDIXES
43

Appendix 1
Statement of Work
Issue Identification – The objective of the proposed project is to characterize and manipulate fly and bottom ash materials and evaluate their use as replacements for foundry sand in mold and core production. Work Tasks, Time and Resource Allocation – The following activities will be undertaken to accomplish the project objective:
1. Secure suitable quantities of coal fly ash and bottom ash through CHL Microspheres. The samples are expected to come from Dayton Power and Light, First Energy Corporation and possibly others.
2. Characterize existing coal ash products using AFS standard sand characterization test procedures. Measures will include ASF GFN, Screen Distribution, Bulk Density, Melting Point, LOI, pH Value, etc.
3. Investigate methods to fabricate coal-ash based foundry sand by screening and combining various portions of the fly and bottom ash materials. Characterize resultant blended material per tests in 2. Produce sufficient amounts of materials for mold/core production.
4. Investigate methods for agglomerating coal ash products into larger particles. Characterize resultant material per tests in 2. Produce sufficient amounts of materials for mold/core production.
5. Using the best coal ash material produced in Activities 3 and 4, fabricate test
molds and cores at the CDC in the following binder systems – Clay Water, Clay Oil, Sodium Silicate/Ester, Phenolic Urethane/Isocyanate/ amine< Phenolic/ester. Fabricate comparable test molds and cores from ”equivalent” silica foundry sand at the same time.
6. Pour each mold pair from the same melt for the following metals: 356 Aluminum, C874 Silicon Bronze, Class 30 Gray Iron, and 1040 Carbon Steel. Evaluate castings for surface finish and typical AFS casting parameters.
7. Prepare report on results of the test program. Submit report to AFS, NFFS, ASM, etc.
44

8. Demonstrate the technology at the CDC inviting local area foundry personnel and personnel from the Edison Materials Technology Center. Video tape and edit presentation.
Quality Assurance and Control – Characterization of coal ash materials and of synthetically produced coal ash foundry sands will be conducted under standard sand testing procedures published by the American Foundry Society. These tests are well known and understood and generate data that is reliable across the entire industry. Test molds, cores and test castings will be produced form coal ash aggregate and silica sand aggregate in a side-by-side process from common batches of binder and common melts of metal. Although there may be some variables that are unaccounted for in this procedure, the results will be of sufficient quality to draw broad conclusions regarding the success or failure of coal ash based foundry aggregates in the production of castings. Determination of Goals – The final information as to the suitability of coal ash based foundry sands will be generated from the test castings. Industry based standard evaluations of the castings, such as surface finish, porosity, shakeout difficulties, etc. will be made on the castings. Ideally, success would be measured by determining that castings produced from coal ash based materials are of equal quality to those from the silica sand aggregate. In the proposed evaluation, the anticipated result is an indication that coal ash materials hold the promise of replacing virgin sands. Follow-on work would be necessary to develop a full range of experience with the synthetic “sands” in order to present the fullest description of their characteristics and performance.
45

Appendix 2
MATERIAL SAFETY DATA SHEET - FLY ASH I. IDENTIFICATION
Manufacturer: Dayton Power and Light J.M. Stuart Generating Station Address: P. O. Box 468 Route 52 - 5 Miles East Aberdeen, Ohio 45101 Telephone: (513) 549-2641 Date Prepared: October 2001 Source of Generation: Combustion of Coal Intended Use: Structural fill; flow able fill; stabilizing agent; and roadway subgrade.
II. COMPOSITION AND HAZARD INFORMATION (1),(2)Major Components % OSHA PEL ACGIH TLV
Silica, SiO2* Aluminum Oxide, Al2O3 Iron Oxide, Fe2O3 Titanium Oxide, TiO2 Calcium Oxide, CaO Magnesium Oxide, MgO Sodium Oxide, Na2O Potassium Oxide, K2O Sulfur Trioxide, SO3 Phosphorus Pentoxide, P2O5
57.4 28.5
5.8 1.5 1.1 1.0 0.2 3.0 0.3 0.2
(see pg. 2 of 4) 15 mg/m3 (total); 5 mg/m3 (respirable) 10 mg/m3 15 mg/m3 5 mg/m3 15 mg/m3 -- -- -- --
(see pg. 2 of 4) 10 mg/m3 5 mg/m3 10 mg/m3 2 mg/m3 10 mg/m3 -- -- -- --
Trace Metals µg/g OSHA PEL ACGIH TLV Arsenic Barium Beryllium Cadmium Chromium Cobalt Copper Lead Manganese Nickel Selenium Silver Vanadium Zinc
78 960 15
0.9
170 60
140 70
200 120
5 <2
290 120
0.01 mg/m3 0.5 mg/m3 0.002 mg/m3; 0.005 mg/m3 (ceiling) 0.005 mg/m3 1 mg/m3 0.1 mg/m3 1 mg/m3 0.05 mg/m3 5 mg/m3 (ceiling) 1 mg/m3 0.2 mg/m3 0.01 mg/m3 0.5 mg/m3 (ceiling) 15 mg/m3 (total); 5 mg/m3 (respirable)
0.01 mg/m3 0.5 mg/m3 0.002 mg/m3 0.01 mg/m3 (insoluble); 0.002 mg/m3 (respirable) 0.5 mg/m3 0.02 mg/m3 1 mg/m3 0.05 mg/m3 0.2 mg/m3 0.1 mg/m3(soluble); 1 mg/m3(insoluble) 0.2 mg/m3 0.1 mg/m3(soluble) 0.05 mg/m3 10 mg/m3
Notes: (1) Chemical components are expressed as oxides. Actual composition may be oxides, silicates and aluminosilicates. (2) Actual composition will vary. The above breakdown is typical of fly ash from this facility.
46

II. COMPOSITION AND HAZARD INFORMATION (Continued) * Silica % of Total Fly Ash
Crystalline Quartz < 5% Cristobalite < 2% Tridymite < 4%
PEL ACGIH TLV Crystalline Quartz (respirable)
10 mg/m3 %SiO2+2
0.1 mg/m3
Crystalline Quartz (total)
30 mg/m3 %SiO2+2
Not Applicable (N/A)
Cristobalite (respirable)
5 mg/m3 (%SiO2+2)
0.05 mg/m3
Cristobalite (total)
15 mg/m3 (%SiO2+2)
N/A
Tridymite (respirable)
5 mg/m3 (%SiO2+2)
0.05 mg/m3
Tridymite (total)
15 mg/m3 (%SiO2+2)
N/A
In the above formula the % SiO2 refers to the % SiO2 in the airborne particulate sampled.
III. PHYSICAL/CHEMICAL CHARACTERISTICS Solubility in Water: 0.79 % (1)Specific Gravity: 2.2 Vapor Pressure: N/A
pH: 9.0 (1% slurry) Boiling Point: N/A Odor: None
Shipping Weight: 75 lb/ft3 (dry, loose state) (2)Typical Particle Size Distribution:
% Passing Sieve # Size 100.0 8 2.36-mm 99.7 16 1.18-mm 99.5 30 600-µm 99.2 50 300-µm 97.1 100 150-µm 83.8 200 75-µm
±84 % fines (pass #200) ±16 % sand (pass #4, retained #200) ±0.0 % gravel (retained #4)
Appearance: Fly ash is a solid material. It appears as gray finely graded silt-size particles.
Notes: (1) Specific gravity is the ratio of the mass of a unit volume of material (bottom ash) to the mass of the same volume of another material (usually water and both at the same temperature). Since specific gravity is a ratio, it is unitless.
(2) Typical particle size distribution is based on a representative samples. Slight variations are typical.
47

IV. FIRE AND EXPLOSION HAZARD DATA Flash Point: N/A Flammability Limits in Air: N/A Auto Ignition Temperature: N/A Fly ash is noncombustible.
V. REACTIVITY DATA Stability: Stable Incompatibility: Contact with powerful oxidizing agents may react violently
with the silica components of fly ash. Hazardous Decomposition on By-Products: None with normal handling. Hazardous Polymerization: Will Not Occur This material is the end product of the combustion of coal.
VI. HEALTH HAZARD DATA Routes of Entry: Inhalation, skin contact, eye, and ingestion. Health Hazards: Acute - Dust may irritate the respiratory tract, eyes and skin. Chronic - Prolonged exposure may cause skin irritation and
sensitization. Prolonged exposure to crystalline silica may cause silicosis. Silicosis is a fibrogenic condition of the lungs which may be disabling and cause death. Crystalline silica may cause cancer.
Carcinogens: Trace quantities of potentially toxic metals are found in this ash material.
The following are carcinogenic ratings by select governmental agencies for potentially carcinogenic constituents contained in the fly ash:
Carcinogens OSHA IARC NTP Silica-Cristobalite -- 2A 2 Silica-Crystalline -- 2A 2 Silica-Tridymite -- 2A -- Arsenic Yes 1 1 Beryllium -- 2A 2 Cadmium Oxide -- 2A 2 Chromium -- 1 1 Cobalt Oxide -- 2B -- Nickel -- -- -- Lead -- 2B 2
OSHA - Occupational Safety and Health Administration IARC - International Agency for Research on Cancer NTP - National Toxicological Program
48

VI. HEALTH HAZARD DATA (con’t)
Medical Conditions Generally Aggravated By Exposure: Pre-existing skin or respiratory conditions may be aggravated by
exposure to the fly ash dust. Emergency and First Aid Procedures: Avoid exposure to skin, eyes, or inhalation of dust. Wash eyes and
skin with water to remove dust. See a physician if symptoms from exposure persists. Seek medical attention if fly ash is ingested.
Other precautions: Protect skin with protective clothing. Protect eyes from particulate
exposure with goggles or safety glasses. Avoid breathing particulates by avoiding the generation of dust on the use of appropriate respiratory protective equipment.
VII. PRECAUTIONS FOR SAFE HANDLING AND USE When materials are released or spilled: Clean material up by avoiding the generation of airborne dust. For
example, vacuum material or wet material before sweeping. Waste Disposal: Not considered a hazardous waste. Dispose in compliance with state
and local regulations. Precautions: Avoid dusting. Avoid skin and eye contact.
VIII. CONTROL MEASURES Respiratory Protection: Use NIOSH-approved respirator for particulates (HEPA cartridge) as minimum respiratory protection. Ventilation: Use local ventilation if required to reduce dust levels in the breathing zone. Protective Clothing:
Gloves: Rubberized gloves as required to prevent skin exposure. Clothing: Protective clothing to prevent skin contact if necessary. Eye Protection: Glasses with side shields or goggles as required for the work practice. Hygiene Practices: Remove dust from exposed body parts by washing with soap and water.
References: 1. Chemical and Physical Laboratory Test Data - URS, 2001. 2. OSHA 1910.1000. 3. 1996 Threshold Limit Values (TLV) for Chemical Substances and Physical Agents,
Published by The American Conference of Governmental Industrial Hygienists (ACGIH). 4. IARC and NTP Chemical Limits, Published by Business and Legal Reports, Inc., Revised
11/95. 5. Patty's Industrial Hygiene and Toxicology, Volume 2, 3rd Revision, George D. Clayton,
Published by John Wiley and Sons.
49

Appendix 3
MATERIAL SAFETY DATA SHEET - BOTTOM ASH I. IDENTIFICATION
Manufacturer: Dayton Power and Light J.M. Stuart Generating Station Address: P. O. Box 468 Route 52 - 5 Miles East Aberdeen, Ohio 45101 Telephone: (513) 549-2641 Date Prepared: October 2001 Source of Generation: Combustion of Coal Intended Use: Structural fill; flowable fill; roadway subgrade; and drainage material
II. COMPOSITION AND HAZARD INFORMATION (1),(2)Major Components % OSHA PEL ACGIH TLV
Silica, SiO2* Aluminum Oxide, Al2O3 Iron Oxide, Fe2O3 Titanium Oxide, TiO2 Calcium Oxide, CaO Magnesium Oxide, MgO Sodium Oxide, Na2O Potassium Oxide, K2O Sulfur Trioxide, SO3 Phosphorus Pentoxide, P2O5
59.4 26.6
5.8 1.4 1.1 0.8 0.3 2.6 0.2
< 0.1
(see pg. 2 of 4) 15 mg/m3 (total); 5 mg/m3 (respirable) 10 mg/m3 15 mg/m3 5 mg/m3 15 mg/m3 -- -- -- --
(see pg. 2 of 4) 10 mg/m3 5 mg/m3 10 mg/m3 2 mg/m3 10 mg/m3 -- -- -- --
Trace Metals
µg/g OSHA PEL ACGIH TLV
Arsenic Barium Beryllium Cadmium Chromium Cobalt Copper Lead Manganese Nickel Selenium Silver Vanadium Zinc
<4 850 11
<0.5
140 65 71 7
170 76 <3
2 200 26
0.01 mg/m3 0.5 mg/m3 0.002 mg/m3; 0.0005 mg/m3 (ceiling) 0.005 mg/m3 1 mg/m3 0.1 mg/m3 1 mg/m3 0.05 mg/m3 5 mg/m3 (ceiling) 1 mg/m3 0.2 mg/m 0.01 mg/m3 0.5 mg/m3 (ceiling) 15 mg/m3 (total); 5 mg/m3 (respirable)
0.01 mg/m3 0.5 mg/m3 0.002 mg/m3 0.01 mg/m3 (insoluble); 0.002 mg/m3 (respirable) 0.5 mg/m3 0.02 mg/m3 1 mg/m3 0.05 mg/m3 0.2 mg/m3 0.1 mg/m3(soluble); 1 mg/m3(insoluble) 0.2 mg/m3 0.1 mg/m3(soluble) 0.05 mg/m3 10 mg/m3
Notes: (1) Chemical components are expressed as oxides. Actual composition may be oxides, silicates and aluminosilicates. (2) Actual composition will vary. The above breakdown is typical of bottom ash from this facility.
50

II. COMPOSITION AND HAZARD INFORMATION (Continued) * Silica % of Total Bottom Ash
Crystalline Quartz 3% Cristobalite < 2% Tridymite < 4%
PEL ACGIH TLV Crystalline Quartz (respirable)
10 mg/m3 %SiO2+2
0.1 mg/m3
Crystalline Quartz (total)
30 mg/m3 %SiO2+2
Not Applicable (N/A)
Cristobalite (respirable)
5 mg/m3 (%SiO2+2)
0.05 mg/m3
Cristobalite (total)
15 mg/m3 (%SiO2+2)
N/A
Tridymite (respirable)
5 mg/m3 (%SiO2+2)
0.05 mg/m3
Tridymite (total)
15 mg/m3 (%SiO2+2)
N/A
In the above formula the % SiO2 refers to the % SiO2 in the airborne particulate sampled. III. PHYSICAL/CHEMICAL CHARACTERISTICS
Solubility in Water: 0.80 % (1)Specific Gravity: 2.1 Vapor Pressure: N/A
pH: 7.9 (10% slurry) Boiling Point: N/A Odor: None
Shipping Weight: 51lb/ft3 (dry, loose state) (2)Typical Particle Size Distribution (unwashed): (2), (3)Typical Particle Size Distribution (washed):
% Passing Sieve # Size % Passing Sieve # Size 100.0 ¾-inch 100.0 ¾-inch 96.2 3/8-inch 99.1 3/8-inch 91.9 4 4.75-mm 96.8 4 4.75-mm 85.3 8 2.36-mm 91.1 8 2.36-mm 72.1 16 1.18-mm 76.5 16 1.18-mm 60.0 30 600-µm 63.5 30 600-µm 46.7 50 300-µm 47.2 50 300-µm 28.0 100 150-µm 24.4 100 150-µm 11.5 200 75-µm 7.3 200 75-µm
±12 % fines (pass #200) ±7 % fines (pass #200) ±80 % sand (pass #4, retained #200) ±90 % sand (pass #4, retained #200) ±8 % gravel (retained #4) ±3 % gravel (retained #4)
Appearance: Bottom ash is a solid material. It appears as gray, medium to fine sand-size particles.
51

Notes: (1) Specific gravity is the ratio of the mass of a unit volume of material (bottom ash) to the mass of the same volume of another material (usually water and both at the same temperature). Since specific gravity is a ratio, it is unitless.
(2) Typical particle size distribution is based on a representative samples. Slight variations are typical. (3) Washed bottom ash has a cleaner gradation and is a more porous drainage media.
IV. FIRE AND EXPLOSION HAZARD DATA Flash Point: N/A Flammability Limits in Air: N/A Auto Ignition Temperature: N/A Bottom ash is noncombustible.
V. REACTIVITY DATA Stability: Stable Incompatibility: Contact with powerful oxidizing agents may react violently with
the silica components of bottom ash. Hazardous Decomposition on By-Products: None with normal handling. Hazardous Polymerization: Will Not Occur This material is the end product of the combustion of coal.
VI. HEALTH HAZARD DATA Routes of Entry: Inhalation, skin contact, eye, and ingestion. Health Hazards: Acute - Dust may irritate the respiratory tract, eyes and skin. Chronic - Prolonged exposure may cause skin irritation and sensitization.
Prolonged exposure to crystalline silica may cause silicosis. Silicosis is a fibrogenic condition of the lungs which may be disabling and cause death. Crystalline silica may cause cancer.
Carcinogens: Trace quantities of potentially toxic metals are found in this ash material. The
following are carcinogenic ratings by select governmental agencies for potentially carcinogenic constituents contained in the bottom ash:
Carcinogens OSHA IARC NTP Silica-Cristobalite -- 2A 2 Silica-Crystalline -- 2A 2 Silica-Tridymite -- 2A -- Arsenic Yes 1 1 Beryllium -- 2A 2 Cadmium Oxide -- 2A 2 Chromium -- 1 1 Cobalt Oxide -- 2B -- Nickel -- -- -- Lead -- 2B 2
OSHA - Occupational Safety and Health Administration IARC - International Agency for Research on Cancer NTP - National Toxicological Program
52

VI. HEALTH HAZARD DATA (con’t) Medical Conditions Generally Aggravated By Exposure: Pre-existing skin or respiratory conditions may be aggravated by
exposure to the bottom ash dust. Emergency and First Aid Procedures: Avoid exposure to skin, eyes, or inhalation of dust. Wash eyes and
skin with water to remove dust. See a physician if symptoms from exposure persists. Seek medical attention if bottom ash is ingested.
Other Precautions: Protect skin with protective clothing. Protect eyes from particulate
exposure with goggles or safety glasses. Avoid breathing particulates by avoiding the generation of dust on the use of appropriate respiratory protective equipment.
VII. PRECAUTIONS FOR SAFE HANDLING AND USE When materials are released or spilled: Clean material up by avoiding the generation of airborne dust. For
example, vacuum material or wet material before sweeping. Waste Disposal: Not considered a hazardous waste. Dispose in compliance with state
and local regulations. Precautions: Avoid dusting. Avoid skin and eye contact.
VIII. CONTROL MEASURES Respiratory Protection: Use NIOSH-approved respirator for particulates (HEPA cartridge) as
minimum respiratory protection. Ventilation: Use local ventilation if required to reduce dust levels in the breathing zone. Protective Clothing:
Gloves: Rubberized gloves as required to prevent skin exposure. Clothing: Protective clothing to prevent skin contact if necessary. Eye Protection: Glasses with side shields or goggles as required for the work practice. Hygiene Practices: Remove dust from exposed body parts by washing with soap and water.
References: 1. Chemical and Physical Laboratory Test Data - URS, 2001. 2. OSHA 1910.1000. 3. 1996 Threshold Limit Values (TLV) for Chemical Substances and Physical Agents,
Published by The American Conference of Governmental Industrial Hygienists (ACGIH).
4. IARC and NTP Chemical Limits, Published by Business and Legal Reports, Inc., Revised 11/95.
5. Patty's Industrial Hygiene and Toxicology, Volume 2, 3rd Revision, George D. Clayton, Published by John Wiley and Sons.
53

Appendix 4
Chemical composition of LEG fly ash
Oxide Content after heating at 800ºC Content as received
SiO2 51.11 45.54 Al2O3 26.40 23.3 Fe2O3 7.93 7.07 CaO 4.74 4.22 MgO 3.41 3.04 Na2O 0.65 0.58 K2O 3.19 2.84 SO3 0.53 0.47 TiO2 1.05 0.94 P2O5 0.43 0.38 BaO 0.10 0.09
Lost of incognition – 10.89
TOTAL 99.54 99.59
54

Appendix 5
Sintering temperature = 1130 ºC (2066ºF) Softening temperature = --------- Melting temperature = 1183°C (2160ºF) Flow temperature = 1217°C (2222ºF)
Sample height Shape factor Wideness Flatness of the sample tip
Data for FE fly ash
55

Appendix 6
Data for DP&L fly ash
Sample height Shape factor Wideness Flatness of the sample
Sintering temperature = 1176°C (2148ºF) Softening temperature = 1478°C (2692ºF) Melting temperature = 1625°C (2957ºF) Flow temperature = 1653°C (3007ºF)
56