the use of freeway shoulders to increase capacity · testing the concept of increasing roadway...
TRANSCRIPT
l. Report No. 2. Government Accession- No.
FHWATX78-210-2 4. Title and Subtitle
THE USE OF FREEWAY SHOULDERS TO INCREASE CAPACITY
7. Authorf s)
William R. McCasland 9. Performing Organization Name and Address
Texas Transportation Institute Texas A&M University College Station, TX 77843
~~--------------~~--------------------------~ 12. Sponsoring Agency Name and Address
Texas State Department of Highways and Public Transportation
Transportation Planning Division P. ·a. Box 5051; Austin, TX 78763
15. Supplementary Notes
Work done in cooperation with FHWA, DOT.
TECHNICAL REPORT STANDARD TITLE PAGE
3. Recipient's Catalog No.
5. R eoort Date
September, 1978 6. Performing Organization Code
8. Performing Organization Report No.
Research Report 210-2 10. Work Unit No.
11. Contract or Grant No.
Study 2-18-77-210 13. Type of Report and Period Covered
Interim _ September 1976 September 1978
14. Sponsoring Agency Code
Study title: Evaluation of Urban Freeway Modifications.
16. Abstract
Every sector of urban transportation faces the problems of r1s1ng costs, limited funds, and depleting resources with which to provide for increasing travel demands. Getting the greatest production out of the existing transportation facilities is the goal of every transportation agency. The Texas State Department of Highways and Public Transportation recently approved for testing the concept of increasing roadway capacity on urban freeways by restriping the mainline pavement with narrower lane widths and encroaching on the shoulder to create one additional lane. for travel.
Two modified sections of U.S. 59 Southwest Freeway in Houston were selected for study. Before and after data were collected over a four-year period to determine the effectiveness of reconfiguring the surface geometries of free·ways.
17. Key Words
Narrow lanes, travel on freeway shoulders freeway accident analysis, freeway operation.
18. Distribution Statement
No Restrictions. This document is available to the public through the National Technical Information Service, Springfield, Virginia 22161
19. Security Classif. (of this report) 20. Security Classif. (of this page) 21· No. of Pages 22. Price
Unclassified Unclassified 58 Form DOT F 1700.7 ce-s9l

THE USE OF FREEWAY SHOULDERS TO INCREASE CAPACITY
by
William R. McCasland Research Engineer
Research Report Number 210-2
Evaluation of Urban Freeway Modifications
Research Study Number 2-18-77-210
Sponsored by State Department of Highways and Public Transportation
In Cooperation with the U.S. Department of Transportation
Federal Highway Administration
Texas Transportation Institute Texas A&M University
College Station, Texas
September 1978
ACKNOWLEDGEMENTS
The Texas Transportation Institute wishes to express its appreciation
to the following individuals and organizations for their help in providing
the study area and in collecting the information and data: R. G. Biggs,
Mislea Musa and Larry Galloway, Houston District; and Herman Haenel,
Frank Cooper, Harold Cooner, Austin Headquarters of the Texas State Depart
ment of Highways and Public Transportation.
ii
ABSTRACT
Every sector of urban transportation faces the problems of rising costs,
limited funds, and depleting resources with which to provide for increasing
travel demands. Getting the greatest production out of the existing trans
portation facilities is the goal of every transportation agency. The Texas
State Department of Highways and Public Transportation recently approved for
testing the concept of increasing roadway capacity on urban freeways by
restriping the mainline pavement with narrower lane widths and encroaching
on the shoulder to create one additional lane for travel.
Two modified sections of U.S. 59 Southwest Freeway in Houston were
selected for study. Before and after data were collected over a four-year
period to determine the effectiveness of reconfiguring the surface geomet
ries of freeways.
DISCLAIMER
The contents of this report reflect the views of the author who is
responsible for the facts and accuracy of the data presented herein. The
contents do not necessarily reflect the official views or policies of the
Federal Highway Administration. This report does not constitute a standard,
specification, or regulation.
Key Words: Narrow lanes, travel on freeway shoulders, freeway accident
analysis, freeway operation.
iii

SUMMARY
This report is concerned with the operational efficiency and safety
of freeways with surface geometries that have been modified to provide
additional capacity. Every urban area in the country experiences traffic
congestion to some extent. When the congestion becomes so extensive and
repetitive, measures to increase the capacity or to reduce the demand
should be undertaken. However, sufficient funds to make major changes to
urban freeways may not be available and in some instances, space may be
so limited as to rule out normal expansions in roadway width. One approach
that many transportation agencies are considering is the downscoping of
design standards to achieve greater capacity at lower cost.
The usual method to accomplish this is to reduce lane widths and to
reduce or eliminate the roadway shoulders and create an additional lane for
travel. The modification is considered to be temporary until sufficient
funding is available for major reconstruction or until alternative modes
or routes of travel are available to reduce the traffic demand.
The application of reduced standards should be undertaken with care to
achieve the expected operational improvements without undue hazard to the
public. This study evaluated two typical freeway sections that were modi
fied to determine the operational effectiveness and safety experience over
a four-year period.
The operational improvements in increasing capacity were realized in
one of the two sections. The other section required additional length of
the modified roadway to achieve the expected usage. The resultant improve
ment in traffic congestion more than offset the cost of the modifications.
iv
The additional lane formed by the partial shoulder and mainline
pavement carried more than 2,000 vheicles during the peak period. The
total traffic delay was significantly reduced as a result of the in
creased traffic flow. Immediately after the implementation, it was
estimated that 1,000 vehicle-hours of delay per day were saved.
The principal concern of most transportation agencies was with the
safety of the operation when lateral clearances were reduced and emer
gency parking areas were reduced or eliminated. The experience in the
Houston study was that accident rates declined during the two years follow
ing the modification for each of the four time periods studied (24 hour,
peak periods, daytime, nighttime). The severity of accidents was not
significantly changed. The reduction is accident rates occurred while the
ADT was increasing at a rate of 11.5 percent annually to reach a volume
level of over 200,000 vehicles per day. The accident experience is similar
to projects of this type implemented in other sections of the country.
The greatest difficulty experienced in Houston was maintaining the
pavement surface and delineation. The shoulders were not designed for
travel and required patching and structural maintenance. The lane lines
were often moved to an area on the pavement that had oil accumulations.
The narrow lanes also encouraged encroachment on the lane lines) requiring
greater than normal maintenance.
Nevertheless, the cost to install and maintain the added capacity,
$ 38,700, was very low in comparison to the benefits derived by the motoring
public.
v

IMPLEMENTATION STATEMENT
The primary purpose of this research project was to determine if a
freeway cross section with narrow lanes and limited shoulders can produce
travel benefits with safety. This report concludes that modifications of
surface geometries is an effective and safe way to increase capacity.
Several conditions are offered to agencies considering implementation
of this solution: the modified section should be as short as possible;
the section should be maintained at a level that will provide good lane
delineation and rideability; the modification should be considered as a
temporary solution to be returned to normal design standards when funds
and conditions warrant; finally, some form of emergency parking should be
provided in the modified section, if possible.
vi

TABLE OF CONTENTS
Page
I. INTRODUCTION • • • • • . • • • • • • • • • • • • • . • • • • • • • • • • • • • • • . • . . • • • • • • • • • • 1
STUDY SITE DESCRIPTION •••••••.••..••••••••••••••.••..•.• 1
II. RESULTS...................................................... 7
OPERATIONAL CHARACTERISTICS • . • • • • • • • • • • • • • • • . • • • • • • • . • • • 7
ACCIDENT ANALYSIS • • • • • • • • • • • • • • • • • . • • . • • • • • . • • • • • • . • • • • • 19
BENEFIT-COST ANALYSIS ••..••..•.••••.••.••.••..••.••.••.• 46
DESIGN AND MAINTENANCE REQUIREMENTS..................... 48
III. CONCLUSIONS • . . • • • • • • • • • • • • • • • • • • • • • • • • • • • • . • • • . • . . • • • . . . • • . • • 50
REFERENCES • • • • . • • • • • . • • • • . • • • • . . • • • • • • • • • • • • • • . • • • • • • • • • • . • • . • • . . 51
vii

Figure
2
LIST OF FIGURES
Study Sites ~ U~ S~ 59 Southwest Freeway in Houston
Cross Section Reconfiguration - Four Lanes to Five Lanes . . . . . . . . ....
3
4
3 Cross Section Reconfiguration - Three Lanes to Four Lanes . . . . . . . . . . . . . . . . . . . . . . . . 6
4
5
6
7
8
9
10
11
Onet ~nd (Jwo t Hour Trqfftc )!olwme.s ~, PJ~ pe.~kPeriod - Section 3 . . • • . . • • . • . •
Volume Count on U.S. 59 Southbound at Westpark
Input~Output Flow Rates for U.S. 59 Southbound Between I.H. 610 and Westpark Overpass ...
Peak Period Usage of the Shoulder Lane of U.S. 59 Southwest Freeway - Section 2 .....
24-Hour Usage of the Shoulder Lane on U.S. 59 Southwest Freeway - Sections 2 and 3
Peak Period Accident Rates by Section Outbound U.S. 59 ......... .
Peak Period Accident Rates by Section Inbound U.S. 59 ....
Poisson Tests for Significance .....
viii
10
14
16
18
20
26
30
35

Table
1
2
3
4
5
6
7
LIST OF TABLES
Peak Period Volumes for Section 2 Bottleneck
Peak Period Volumes for Section 3 Bottleneck .
Peak Period Throughput for Section 3 . . ..
Accident Experience - Total Reported Accidents .
Accident Experience - Total Reported Accidents Outbound . . . . . . . . . . . . . . . . . . .
Accident Experience - Peak Two Hours - Outbound
Accident Experience p Total Reported Accidents Inbound . . . . . . . . . . . . . . . . . . .
8
] 1
12
22
23
25
27
8 Accident Experience - Peak Two Hours - Inbound . 28
9 Accident Experience - Total Reported Accidents ~ Outbound Modified vs. Unmodified . . . . . . . . . . . . . 31
10 Accident Experience - Two Hours Peak ~ Outbound Modified vs. Unmodified . . . . . . . . . . . . . . . . . 32
11 Direction of Change in Accident Rates and Tests for Significance . . . . . . . . . . 36
12
13
14
15
16
17
Angular Accident Analysis ~ Frequency
Angular Accident Analysis ~ Rates
Angular Accident Analysis ~ Percent of Total Accidents ............. .
Accident Severity Analysis ~ Frequency .
Accident Severity Analysis - Rate
Accident Severity Analysis - Percent of Total Ace i dents . . . . . . . . . . . . . . . . .
ix
• • . . 39
40
41
43
44
. . . . 45

I. INTRODUCTION
Travel demands on urban freeways continue to increase, and state high
way departments are unable to build new facilities at a rate to prevent the
development and spread of traffic congestion. Techniques that reduce or
control travel demands, such as ramp control, priority operations for high
occupancy vehicles, and modal shifts, are being developed and implemented,
but vehicular demands continue to increase. Low cost, temporary measures
to increase the capacity of the urban freeway systems are needed. Texas,
like most states, has programs to identify and eliminate bottlenecks on
the urban freeways by widening bridges and pavements, relocating ramps,
constructing continuous frontage roads, and eliminating capacity reducing
geometric features. These betterment programs will be accelerated as time
and money permit, but the type of improvement discussed in this report is
designed to solve or alleviate capacity problems immediately and at low
costs. California is conducting a similar betterment program (l,£,~ & !),
and a recent state-of-the-art report suggests using shoulders on freeways
for travel (~). This project in Houston, one of the first to be under
taken by the Texas State Department of Highways and Public Transportation
(SDHPT), has unique design and traffic requirements that will contribute
to the knowledge of freeway operations and design.
STUDY SITE DESCRIPTION
The Southwest Freeway (U.S. 59) in Houston is a radial freeway that
varies in design from six to ten lanes. At the interchange of the I.H. 610
Freeway, the growth in traffic has been at an annual rate of 8.5 percent
and, the Average Daily Traffic (ADT) on both intersecting freeways in 1978
1

exceeded 200,000 vehicles. The traffic demand on sections adjacent to the
interchange exceeded the capacity for several hours of the day. Major
reconstruction to increase capacity will be necessary to relieve the con
gestion, but temporary relief to this sector of U.S. 59 was provided in
1976 when the SDHPT designed and implemented a reconfigured cross section
for the freeway to provide another lane for travel by narrowing the existing
main lanes and encroaching on the right shoulder. The added lane was opened
on May 1, 1976 and accommodated travel 24 hours per day. Emergency parking
areas were provided on both sides of the roadway, except on bridge struc
tures where the right shoulder was preempted totally for travel.
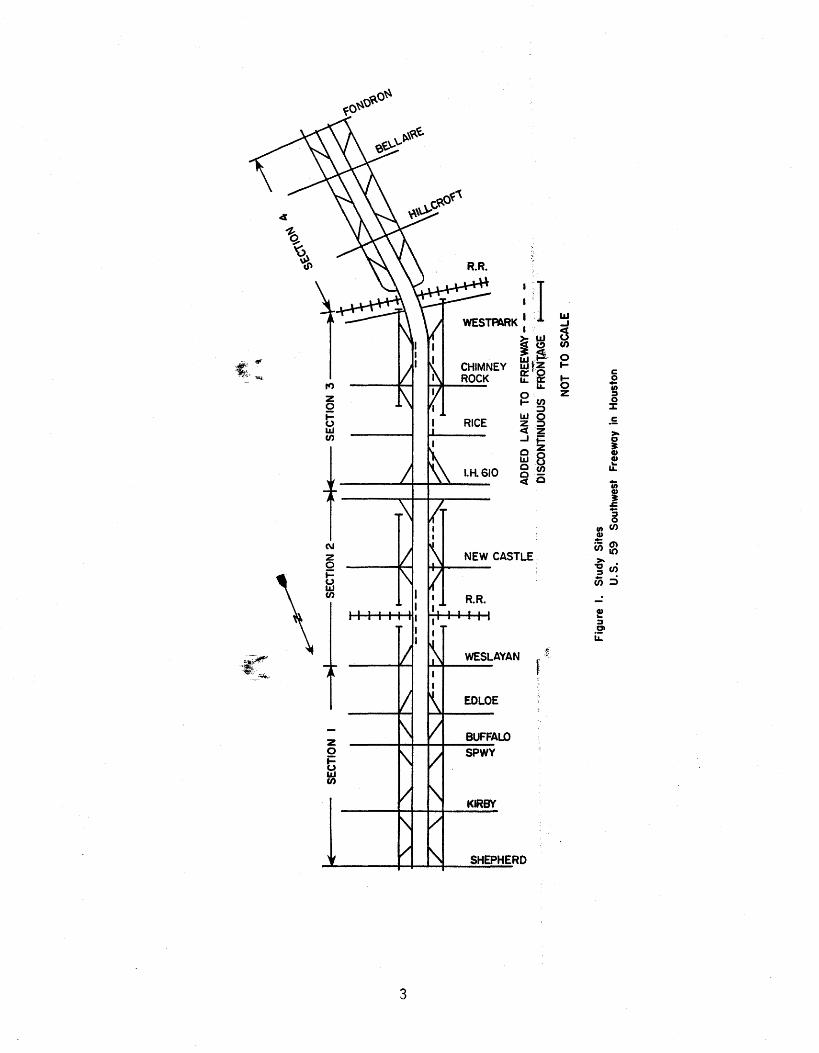
The study site was divided into four sections, two on either side of
directional interchange with I.H. 610 (Figure 1).
Section 1: Shepherd to Weslayan
This section is 3.1 km (1.9 miles) long and is adjacent to the
modified sections on the downtown end of the freeway. The surface geomet
ries were not modified, but traffic conditions were affected by the changes
in Sections 2 and 3.
Section 2: Weslayan to I.H. 610
This section is 1.9 km (1.2 miles) long with a cross section before
restriping of 3.1 m x 14.6 m x 3.1 m, with four 3.6 m (12ft) concrete lanes,
and two 3.1 m (ln ft) asphalt concrete shoulders in both directions. On
the outbound (southbound) lanes, the cross section was restriped to
3.1 m x 16m x 1.7 m (10ft x 52.5 ft x 5.5 ft), with five 32m (10.5 ft)
lanes, 3.1 m (10ft) half median and 1.7 m (5.5 ft) right shoulders (Figure 2).
The right shoulder was eliminated at the two bridges over the railroad and
Newcastle intersection.
2
\ t?'
""
z 0 i= ~ en
3
WESTPARK : I "' I .J
~ ILl 8 31: (!) en ~ ~-- .... o Iff~
II. 6 ~ en z LLJ:::> zg <lZ .Jj:: cZ LLJ8 g!!? <(0
-~
..:

121
I \
12 1 12'
BEFORE (FOUR LANES)
AFTER (FIVE LANES)
'
(1 foot = 0.3 metres)
12 1
Figure 2. Cross Section Reconfiguration Four Lanes to Five Lanes
4
On the inbound (northbound) lanes, a minor change was made to the cross
section between the Newcastle entrance ramp and the Weslayan exit ramp. The
shoulder was converted to a travel lane, the width of the right lane was
reduced, but the other lane widths were unchanged.
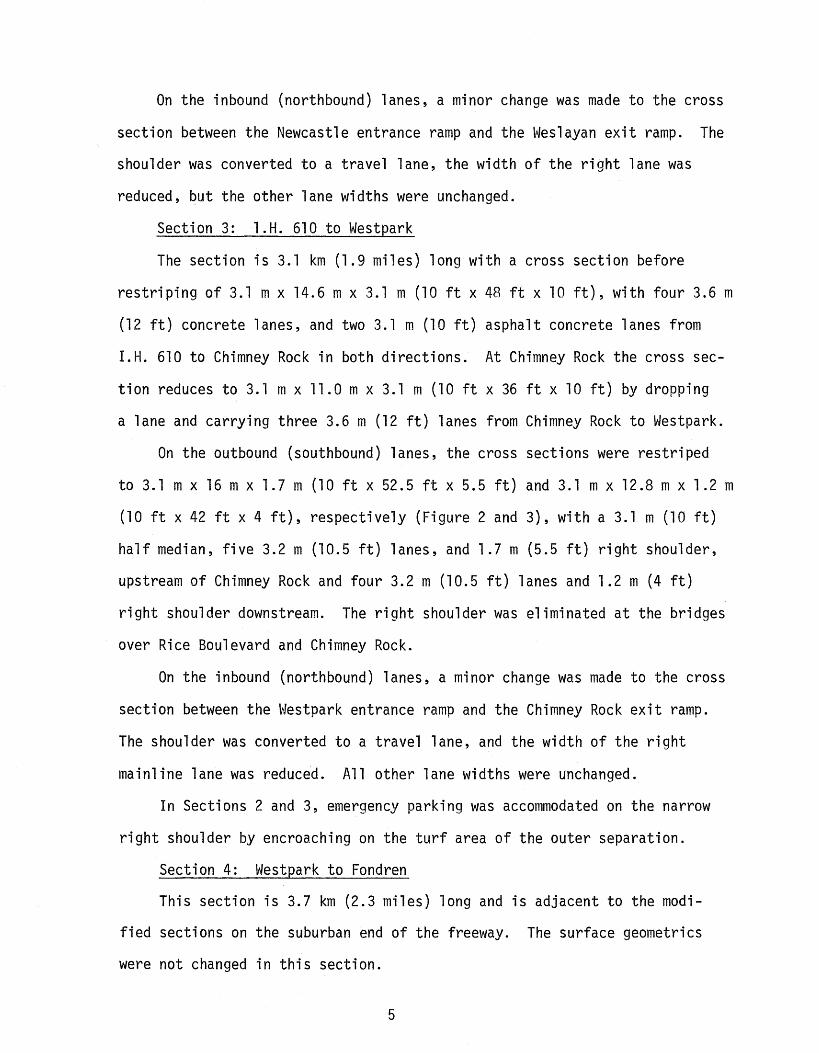
Section 3: l.H. 610 to Westpark
The section is 3.1 km (1.9 miles) long with a cross section before
restriping of 3.1 m x 14.6 m x 3.1 m (10ft x 48ft x 10ft), with four 3.6 m
(12ft) concrete lanes, and two 3.1 m (10ft) asphalt concrete lanes from
I.H. 610 to Chimney Rock in both directions. At Chimney Rock the cross sec
tion reduces to 3.1 m x 11.0 m x 3.1 m (10ft x 36ft x 10ft) by dropping
a lane and carrying three 3.6 m (12 ft) lanes from Chimney Rock to Westpark.
On the outbound (southbound) lanes, the cross sections were restriped
to 3.1 m x 16m x 1.7 m (10ft x 52.5 ft x 5.5 ft) and 3.1 m x 12.8 m x 1.2 m
(10ft x 42ft x 4ft), respectively (Figure 2 and 3), with a 3.1 m (10ft)
half median, five 3.2 m (10.5 ft) lanes, and 1.7 m (5.5 ft) right shoulder,
upstream of Chimney Rock and four 3.2 m (10.5 ft) lanes and 1.2 m (4ft)
right shoulder downstream. The right shoulder was eliminated at the bridges
over Rice Boulevard and Chimney Rock.
On the inbound (northbound) lanes, a minor change was made to the cross
section between the Westpark entrance ramp and the Chimney Rock exit ramp.
The shoulder was converted to a travel lane, and the width of the right
mainline lane was reduced. All other lane widths were unchanged.
In Sections 2 and 3, emergency parking was accommodated on the narrow
right shoulder by encroaching on the turf area of the outer separation.
Section 4: Westpark to Fondren
This section is 3.7 km (2.3 miles) long and is adjacent to the modi
fied sections on the suburban end of the freeway. The surface geometries
were not changed in this section.
5
12' \
12'
BEFORE · (THREE LANES)
\ 10.5 1 10.5'
AFTER (FOUR LANES)
(1 foot = 0.3 metres)
12'
Figure 3. Cross Section Reconfiguration Three Lanes to Four Lanes
6
II. RESULTS
Although modifications were made in both directions of the freeway,
the operational analysis was concentrated on the major modifications on
the outbound (southbound) directions, but the safety analysis was conducted
on both directions.
OPERATIONAL CHARACTERISTICS
Study Section 2: Weslayan to I.H. 610 - Southbound
This section is the last bottleneck upstream of the I.H. 610 inter
change. Traffic demand for this section comes from the four main lanes and
two high volume entrance ramps at Edloe and Weslayan interchanges. The
freeway lanes normally queue upstream from the Newcastle exit ramp for a
distance of 3.2 or more km: (2 or more miles), and ramp queues at Edloe and
Weslayan often exceed 100 vehicles.
The capacity of the bottleneck was approximately 7,600 VPH, but peak
hour flow rates of 7,800 VPH were observed, as the traffic occasionally
encroached on the shoulder upstream of the Newcastle exit ramp.
After the conversion from 4 to 5 lanes of travel, the peak hour volume
through the bottleneck was unchanged, and the total 2-hour peak period volume
increased only 3 percent (Table 1A). An analysis of the lane usage indicated
that traffic did not use the added lane in a manner that would increase the
flow rates through the bottleneck section.
The level of service was improved within the section, but the total
delay was not reduced significantly. The bottleneck was shifted approxi
mately 100 metres upstream of the merge point of the Weslayan entrance ramp.
7

TABLE 1A
PEAK PERIOD VOLUMES FOR SECTION 2 SOUTHBOUND BOTTLENECK
AFTER RESTRIPING
Vehicles Per Peak Hour
Vehicles Per 2-Hour Peak
Before Restriping
7,870
14,180
TABLE 1B
After Restriping
7,830
14,600
PEAK PERIOD VOLUMES FOR SECTION 2 SOUTHBOUND BOTTLENECK
AFTER EXTENSION OF ADDED LANE
Vehicles Per Peak Hour
Vehicles Per 2-Hour Peak
After Restriping
7,830
14,600
8
After Extension of Restriping
8,280
15,170
Percent Change
0
+3.0
Percent Change
+5.7
+3.9

To encourage a more effective use of the added lane, the SDHPT extended
the new shoulder lane upstream to the Edloe entrance ramp. This resulted
in significant increases of 5.7 percent in peak hour volume and 3.9 percent
in the two hour volume (Table 18). Greater increases would be possible if
the capacity of the downstream interchange with I.H. 610 were increased.
Study Section 3: I.H. 610 to Westpark - Southbound
The Westpark overpass has a geometric design that usually would result
in a bottleneck; horizontal and vertical curvature; no shoulders; and, dis
continuous frontage roads. However, the volumes on upstream ramps established
the bottleneck at a location between the Chimney Rock entrance ramp and the
Westpark exit ramp. High traffic demand was maintained at this bottleneck
by the high volumes entering the section from the main lanes and the I.H.
610 connection ramps, upstream of the lane drop at Chimney Rock. Heavy
congestion and queueing were maintained throughout the peak period.
The capacity of the bottleneck was 5,800 VPH, but peak hour flows of
6,000 VPH were observed as the Westpark exiting traffic encroached on the
shoulder.
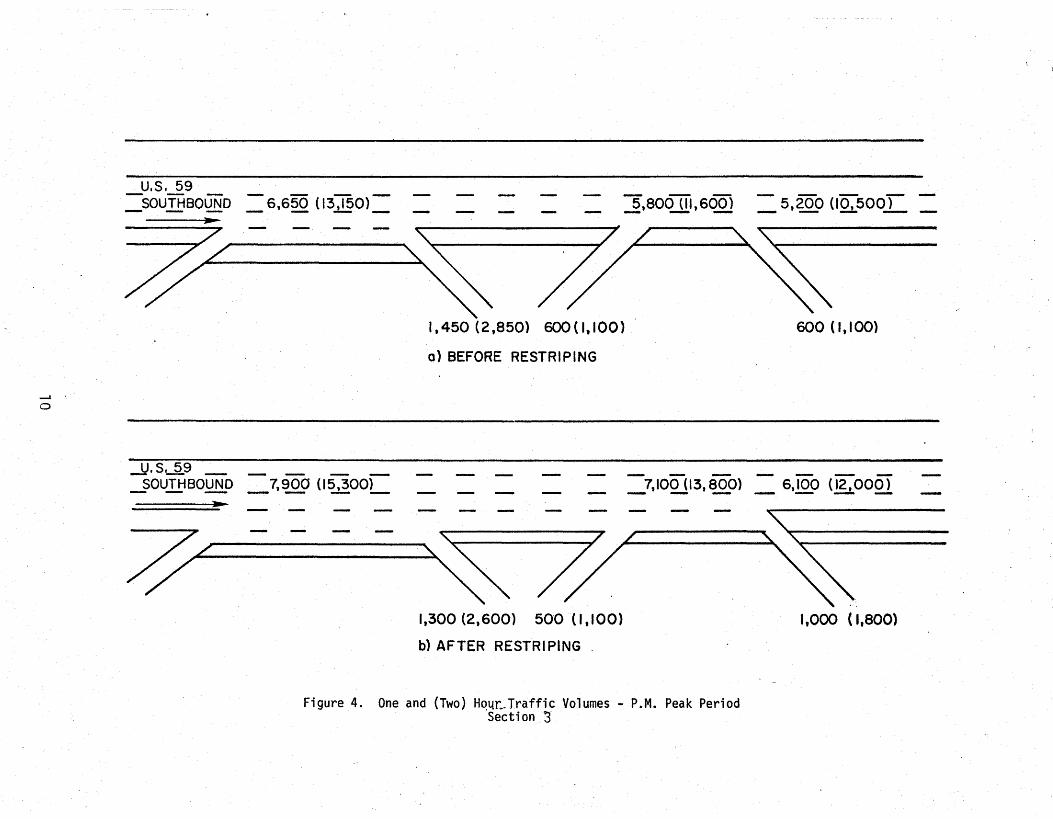
In contrast to Study Section 2, the addition of one lane for travel
from the I.H. 610 connections had a significant impact on traffic volumes
(Figure 4). The peak hour volumes and throughput of the section increased~
The bottleneck was observed to shift downstream to the Westpark overpass
(Tables 2 and 3).
The increase in travel was due in part to the improvement in flow
through this section. Traffic that used the Chimney Rock exit and frontage
road as a bypass of freeway congestion remained on the freeway, thus reducing
the traffic demand on the congested intersection at Chimney Rock.
9
__. 0
u.s. 59 SOUTHBOUND = 6,6~ { 13,150) =
.JJ. S~9 _ _ _ _ _ _sOUTHBOUND _7,900 (15,300L
a} BEFORE RESTRIPING
5,800 (11,600) = 5,200 (10,500).
600 ( 1,100}
7,100 (13,800) = 6,100 (12,000)
~ - - - - ,-:~~~-~-- 7. . ./ . ·~·· ·····='. ~. .
// '~7/ .~ 1,300 (2,600) 500 (1,100)
b) AFTER RESTRIPING .
Figure 4. One and (Two) H~4r~Traffic Volumes - P.M. Peak Period Section '3
I ,000 ( 1,800)
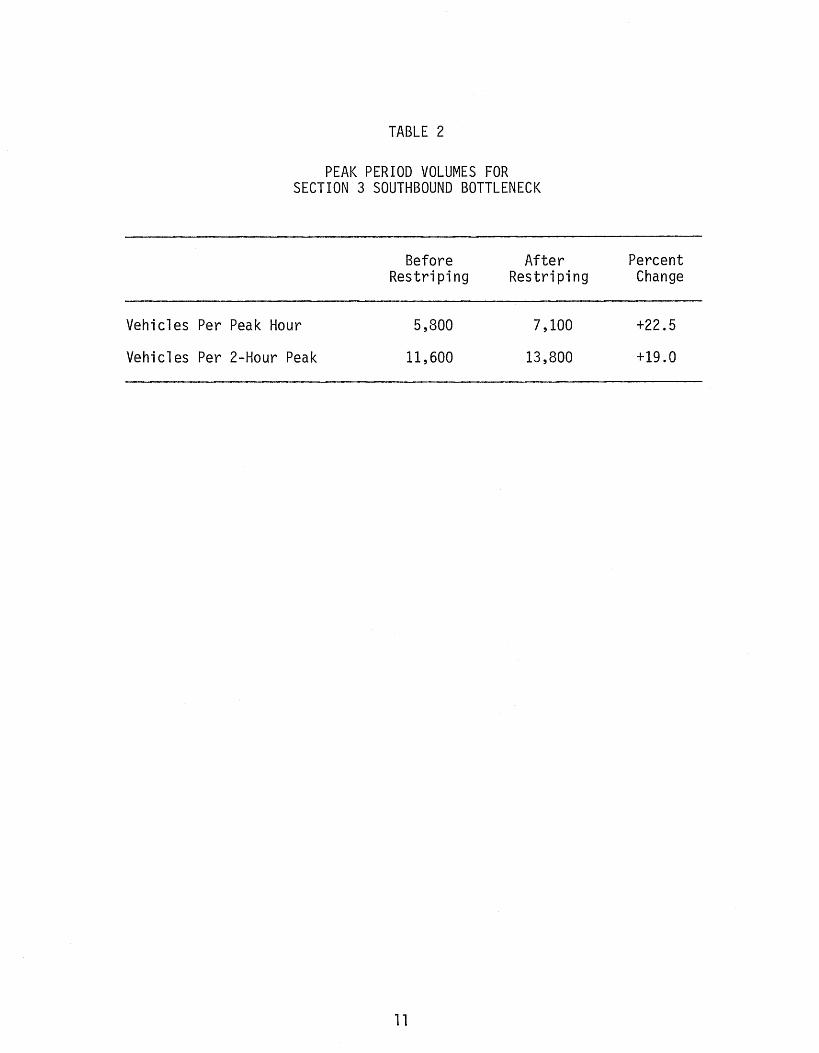
TABLE 2
PEAK PERIOD VOLUMES FOR SECTION 3 SOUTHBOUND BOTTLENECK
Vehicles Per Peak Hour
Vehicles Per 2-Hour Peak
Before Restriping
5,800
11,600
11
After Restriping
7,100
13,800
Percent Change
+22.5
+19.0
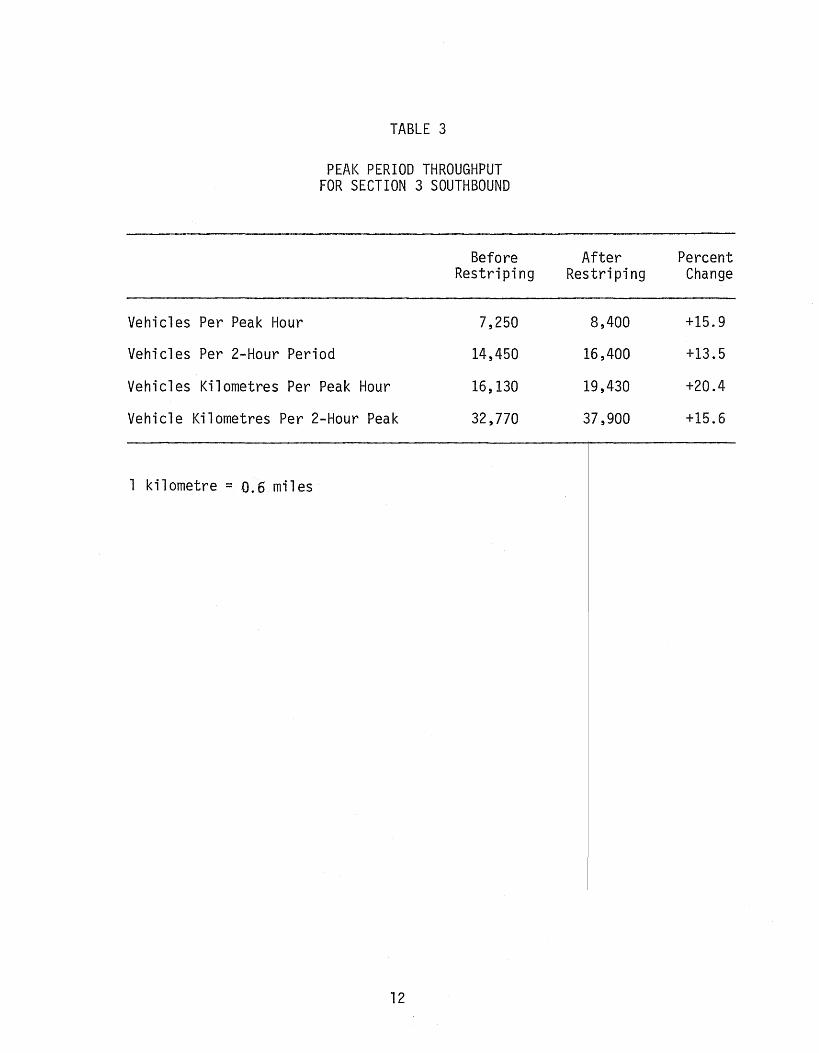
TABLE 3
PEAK PERIOD THROUGHPUT FOR SECTION 3 SOUTHBOUND
Before Restriping
Vehicles Per Peak Hour 7,250
Vehicles Per 2-Hour Period 14,450
Vehicles Kilometres Per Peak Hour 16,130
Vehicle Kilometres Per 2-Hour Peak 32,770
1 kilometre = 0.6 miles
12
After Percent Restriping Change
8,400 +15.9
16,400 +13.5
19,430 +20.4
37,900 +15.6

Because of the grades and horizontal curvature, the high flow rates
and volumes through the Westpark overpass bottleneck (12,000 VPH for two
hours) were not expected (Figure 5). However, these data were confirmed,
and the following factors are offered in explanation:
1. The percent of trucks was very low (1.3 percent).
2. The percent of small vehicles was high (20 percent).
3. The speeds approaching and leaving the overpass were
maintained at a high level throughout the peak period,
because of the high volume, high speed exit ramps on both
sides of the overpass.
4. The volume using the added lane upstream of the Westpark
exit was high.
5. Demand for the three through lanes at the Westpark exit ramp
was high throughout the peak period. Some vehicles merged
into the through lanes from the added lane at or near the
termination of the lane at the Westpark exit ramp.
6. Although the overpass has a 5 percent grade and is on a
3-degree horizontal curve, the sight distance, lateral
clearances, and design features are adequate for high
volume, high speed operation.
7. Driving performance may be more efficient when entering a
section of freeway with standard width lanes after traveling
several minutes in a section with narrow lanes. A lane is considered
to be narrow if the width is less than 12 feet.
8. The population of motorists using this freeway could be classified
as aggressive drivers who tend to over-drive traffic conditions.
This results in better operational efficiency, but also a
13

CJ)
w _J u :t: w > z 1-z :::> 0 u w I-::> z :E
600
5001-----'
400
,-, • r1
.-, I I I I ' I L J I 1 I I I
, r..l l. '\.J L.J L.J
300
200
I
I I L..}.-, I
t._l , I I L .,.
' L------
BEFORE RESTRIPING - - - - -
AFTER RESTRIPING
L() 100
0~--------~---------------------~--------------------4:00PM 4:30 5:00 5:30 6:00
TIME OF DAY
Figure 5. Volume Count on U. S. 59 Southbound at Westpark
14

hi9her accident rate than other freeways with less - . ~ . - ' . ' .. ; ' . ag.gress1 ve motor1 sts.
To determine the effects of the added capacity on traffic delays, traf-
fie demand for the sections over the two-hour period was assumed to be con-
stant before and after the restriping.
The demand curve is represented by the input curve in Figure 6. The
output curve is the sum of the volumes at the Westpark overpass, Westpark
exit ramp and Chimney Rock exit ramp. The output curve before restriping
indicates traffic congestion between 4:20 and 6:10 PM.
The output after restriping causes the length of congestion to be re-
duced by 20 minutes to 5:50 PM and the total amount of delay to be reduced
by 1,100-vehicle hours per day.
Although the demand curve was assumed to be unchanged in order to
measure the effects on traffic delays, in fact, the traffic volumes after
two years of operation have increased. The peak period demand increased
by 14 percent, whereas the ADDT increased by 8.7 percent. The increase
in peak period traffic is especially significant in comparison to the 2
percent increase the year before restriping.
Therefore, the length of congestion has remained the same or increased
slightly, but the section now accommodates 1,950 more vehicles during the
two-hour peak period.
The level of service has been improved particularly for the ramp exit
volumes. But since the demand for the section has increased and still
exceeds the capacity of the bottleneck, congestion persists throughout
the peak period.
15

()) LO
u) :::)
(.!)
z >~
16,000
~a:: ..J ~ 14,000 01-zcn <[lJJ
(.!)3 z 0 12,000 -z 0::<[
wo 1--Z<.O w - 10,000
:c (f)..: wz .-Jw Uw :c 3 8,000 Wt->w LJ...m 00 6 000 0::: z , w:::l alg :E:c ::li-z:::) 4,000
0 w(J)
>~ -<t ~--~ <[ w 2.,000 .-Jw ::let: :ELJ... :::) u
.I o/ 4:00PM
LENGTH OF CONGESTION 'BEFORE' ·l I
LENGTH OF CONGESTION
ESTIMATED INPUT -- --OUTPUT BEFORE RESTRIPING OUTPUT AFTER RESTRIPI NG - - -REDUCTION IN DELAY (I tOO VEH. HRS.)
s:oo 5:30 s:oo 6:30 TIME OF DAY
Figure 6. Input-Output Flow Rates
,, '
for U. S. 59 Southbound Between I. H. 610 and Westpark Overpass
Driver Acceptance - Shoulder Lane Usage
The key to a successful freeway reconfiguration is the usage of the
added lane. In this project the lane was composed partly of the right
shoulder and partly of the mainline pavement. Several factors against its
usage were: the texture and contrast of the two pavement materials; the
restrictive lateral clearance on the approaches to bridges; and the
condition of the riding surface. Factors in favor of its use were: the
high percent of local traffic, particularly during the peak periods; and
the high volumes of traffic throughout the day. In order to test the
effectiveness of the low cost design, no major construction or mainte
nance activities were conducted to minimize the adverse factors during the
first year of the project. If the concept proved to be successful, then
a more permanent design was to be implemented.
Study Section 2: Weslayan to I.H. 610 Southbound
There was no special signing used to designate the shoulder lane for
travel, although a sign indicating the absence of a paved shoulder was
added later. Lane arrows were used downstream of the Weslayan entrance
ramp to encourage the full use by entering traffic, but only 30 percent
(Movement R3) remained in the lane (Figure 7). The contrast between the
concrete acceleration lane taper and the asphalt concrete shoulder appeared
to guide the entrance ramp traffic out of the shoulder lane. Peak period
usage by mainline traffic (F1) was high, but the traffic entered the lane
too late to improve upstream flow rates. As noted in the previous section,
this section was improved by extending the lane upstream to the next en
trance ramp at Edloe.
The extension of this lane was implemented by the SDHPT in August 1978.
This enabled many of the vehicles that originate upstream of the Weslayan
17

....;..1
00
-~L::/~- - -/ # --=====-=~:.!i::=-=~~~
~~'\.~ .
-::4..~~ e:,v~
~~
MOVEMENT · 2 HOUR VOLUME PEAK HOUR VOLUME
RI+R2
R3
Fl
Ll
L2
710 450
320 140
1,700 970
710 470
1,310 640
Figure 7. Peak Period Usage of the Shoulder Lane on U. S. 59 Southwest Freeway .. Section 2
ramp to merge and weave into the shoulder lane prior to the bottleneck sec
tion. The usage of the shoulder lane for the peak two-hour period increased
significantly. from 1150 vehicles per hour to 1550 vehicles per hour.
The lane is available for 24 hours, but it is used primarily during
the peak period when all other lanes become congested. The average daily
traffic in the lane was 8,155 vehicles, with approximately 25 percent usage
during the peak period (Figure 8). Since the opening of the lane extension
to Edloe, the usage has increased by 40 percent. to 11,750 vehicles per day.
Study Section 3: I.H. 610 to Westpark- Southbound
Usage of the shoulder lane in Study Section 3 was much greater. Although
the lane was 11 black and white 11 pavement, the riding surface and lateral clear
ances were better than Section 2. The high exiting volumes at the Chimney
Rock and Westpark exits account for much the success of the lane. The
average daily traffic in the lane was 13,445 vehicles, and the peak period
usage was approximately 20 percent (Figure 8). The greater use in the off
peak period was also a measure of the acceptability of the design in compari
son to Section 2.
ACCIDENT ANALYSIS
Both inbound and outbound directions of the four sections were studied
in the accident analysis. Since the first and last sections of the four
were not modified, their accident experience was used as control sections
to measure the impact of the geometric changes in the two interior sections.
Also, a two-year before and after comparison of the modified sections was
made. Because of the growth in traffic volumes on the freeway, accident
rates were used to evaluate the changes in accident experience.
There were several factors other than the geometric modifications that
influenced the accident experience: a new section of freeway connecting
19

1,250
1,000
en w ...J u J: 750 w
N > ·0
z 1-z 500 ::> 0 u >-:..J a:: ::> 0 J:
24 HR. VOL.
SECTION I AT NEW CASTLE 8,155
SECTION 2 AT RICE -·-·-~-},-ue~ 13,445
r-, r-1 I I , I
• r-J ' f
,._... L." I : ..... J
... - ..r-- .J
r-
r-1 .--J I I I I I I
I I I
-, I· I I L.,
I I I ,. • ., L I I _ ..
L.. -, I I ..... ,
--1
I L-... '
'--~ t .... -..... -.
s:ooA 12 NOON
TIME OF DAY
s:ooP
Figure 8. ?~-~our Usage of the Shoulder Lane on U. S. 59. Southwest Freeway - Sections 2 and 3
I I
12MDNT.

I-45 was opened in October 1974; a ramp control system was installed in
August 1975; and, the length of Daylight Savings Time was changed in 1975.
No' attempt was made in this report to relate the accident experience to
these and other events.
Total and Peak Period Accident Summary
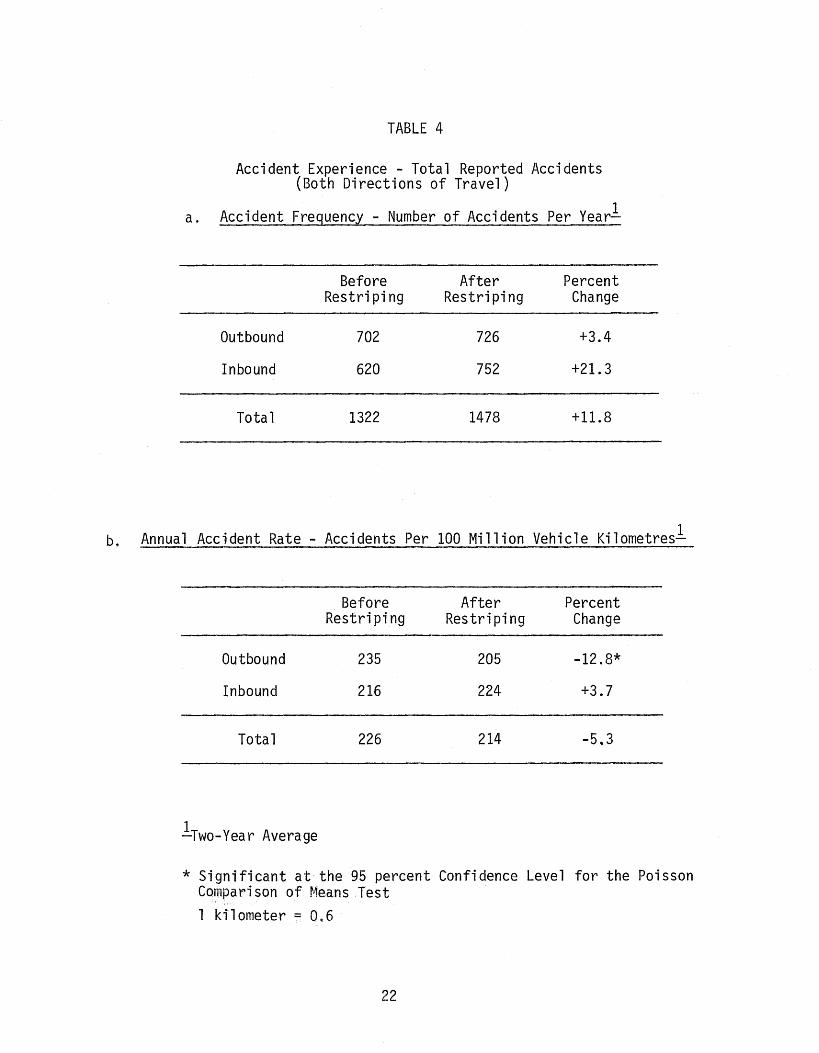
The average annual number of accidents has increased for both direc
tions of travel for the entire 7.3 mile length of the study area. However,
the outbound direction which received the greatest benefit from the capacity
improvements increased only 3.4 percent, while the inbound direction in
creased by 21.3 percent (Table 4a). When the accidents are expressed in
rates, the outbound accident experience actually decreased by 12.8 percent
and the inbound increased by 3.7 percent (Table 4b). The reduction in the
outbound accident rate was significant when tested by the Poisson Comparison
of Means Test at the 95 percent level. All tests of significance will use
this conservative comparison, unless specified in the analysis. Because
of the large changes in volumes, only the accident rates were tested for
significant change.
Outbound Direction
The accident experience in both of the outbound modified sections
decreased in the two years following the geometric changes (Table 5).
The reduction in accident rates were significant, with Section 2 having
the lower rates and greater percent reductions than Section 3. This
was probably due to two things: first, Section 3 has more merging and lane
changing, resulting in more vehicle conflicts; second, the added capacity
in Section 2 was not fully utilized because of the location of the start
of the lane. Thus, there was a reduction in lane density in this section,
compared to Section 3.
21
b.
TABLE 4
Accident Experience - Total Reported Accidents (Both Directions of Travel)
a. Accident Frequency - Number of Accidents Per Yearl
Outbound
Inbound
Total
Before Restriping
702
620
1322
After Restriping
726
752
1478
Percent Change
+3.4
+21.3
+11.8
Annual Accident Rate - Accidents Per 100 Million Vehicle Kilometresl
Outbound
Inbound
Total
1 -Two-Year Average
Before Restriping
235
216
226
After Restriping
205
224
214
Percent Change
-12.8*
+3.7
-5.3
* Significant at the 95 percent Confidence Level for the Poisson Comparison of r,1eans Test 1 kilometer = 0.6
22
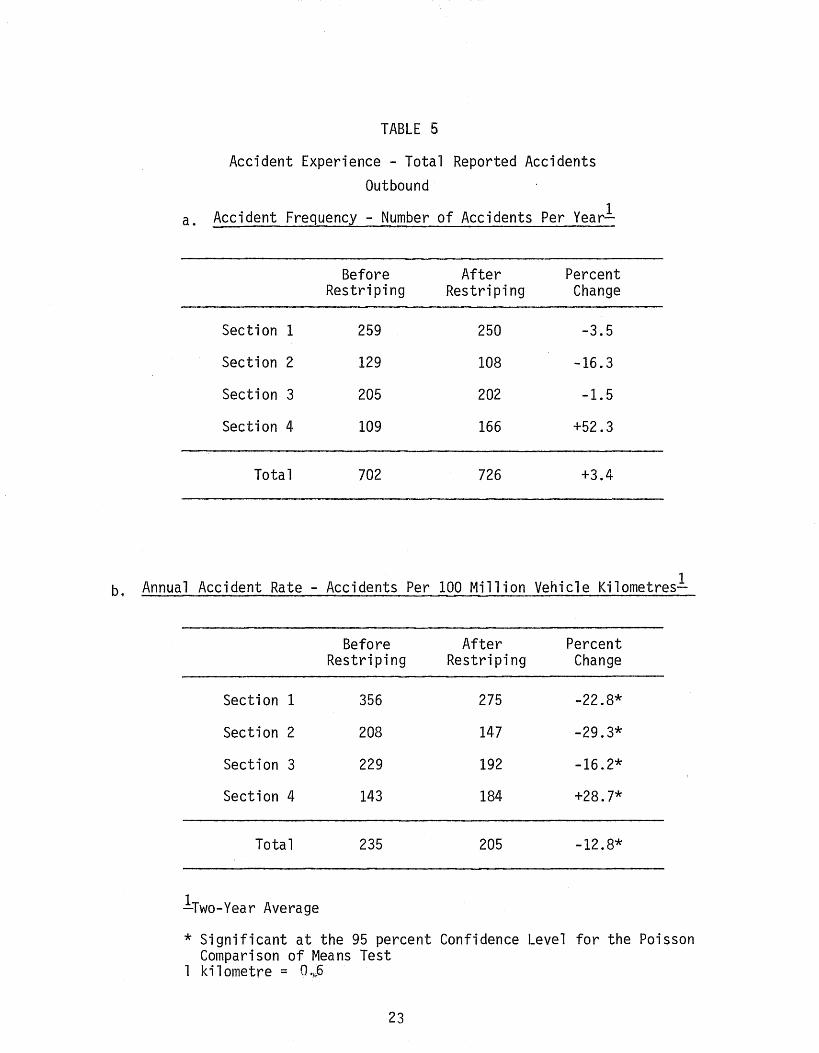
TABLE 5
Accident Experience - Total Reported Accidents Outbound
a. Accident Frequency - Number of Accidents Per Yearl
Before After Percent Restriping Restriping Change
Section 1 259 250 -3.5
Section 2 129 108 -16.3
Section 3 205 202 -1.5
Section 4 109 166 +52.3
Total 702 726 +3.4
b. Annual Accident Rate - Accidents Per 100 Million Vehicle Kilometresl
Before After Percent Restriping Restriping Change
Section 1 356 275 -22.8*
Section 2 208 147 -29.3*
Section 3 229 192 -16.2*
Section 4 143 184 +28.7*
Total 235 205 -12.8*
lTwo-Year Average
* Significant at the 95 percent Confidence Level for the Poisson Comparison of Means Test
1 ki 1 ometre = 0 ."'6
23
Section 1 had a reduction in accident rates which could be attributed
in part tm better operations in downstream Sections 2 and 3. The increase
in accident rate for Section 4 may also be attributable to a worsened quality
of flow (increased demand but no increase in capacity) in Section 4 after
improvement of Sections 2 and 3.
The major operational benefits of the added lane were realized in the
peak periods. Therefore, the larger reductions in accident frequencies and
rates during this period of heavy usage were significant (Tables 6a and 6b).
For the two years prior to the striping changes, the peak period acci
dent rates for the four outbound sections decreased in order from the up
stream section to the downstream section (Figure 9). The probable reason
for this trend was the congestion in the two interior sections which backed
up into the first upstream section. The downstream section number 4 is free
flow. In the second year, the same pattern holds, but some rates particularly
in the downstream sections increased as travel and congestion increased.
After the restriping in 1976-77, the upstream rates decrease signifi
cantly, but the downstream section continued to increase as travel increased.
Further reductions are evident in the second year after restriping as the
usage of the added lane increased.
Inbound Direction
The accident experience in the two inbound modified sections is mixed.
For the total accidents, Section 2 increases and Section 3 decreases, both
in frequency and rate. The modifications on the inbound sections do not
affect off"peak travel and thus it is difficult to explain the total
accident data in Tables 7a and 7b. However, in Tables 8a and Bb, the peak
24

TABLE 6
Accident Experience - Peak Two Hours Outbound
a. Accident Frequency - Number of Accidents Per Yearl
Before After Percent Restriping Restriping Change
Section 1 80 46 -42.5
Section 2 43 13.5 -68.6
Section 3 38 30 -21.1
Section 4 12.5 22 +76.0
Total 173.5 111.5 -35.7
b. Annual Accident Rate - Accidents Per 100 Million Vehicle Kilometresl
Before After Percent Restriping Restriping Change
Section 1 812 432 -46.8*
Section 2 601 171 -71. 5*
Section 3 369 265 -28.2
Section 4 141 225 +59.6
Total 484 284 -41. 3*
lrwo-Year Average
* Significant at the 95 percent Confidence Level for the Poisson Comparison of Means Test
1 kilometre = 0.6 miles
25

800
700
~
> ~ 0
600 0 .......... (f) ~ z w
500 0 (.)
~ I
(f) w ~ 400 0::
~ z w 0 u u 300 <(
0 0 0:: w a.. ~ 200 <( w a..
100
0
SECTION I
SECTION 2
SECTION 3
SECTION 4
TOTAL
Direction of Travel
1974. 1975 1976 1977 TIME
FIGURE 9- PEAK PERIOD ACCIDENT RATES BY SECTION OUTBOUND U.S. 59
26
VZZLZJ
II IIIII
ftllllll!!llll!!ll!lli
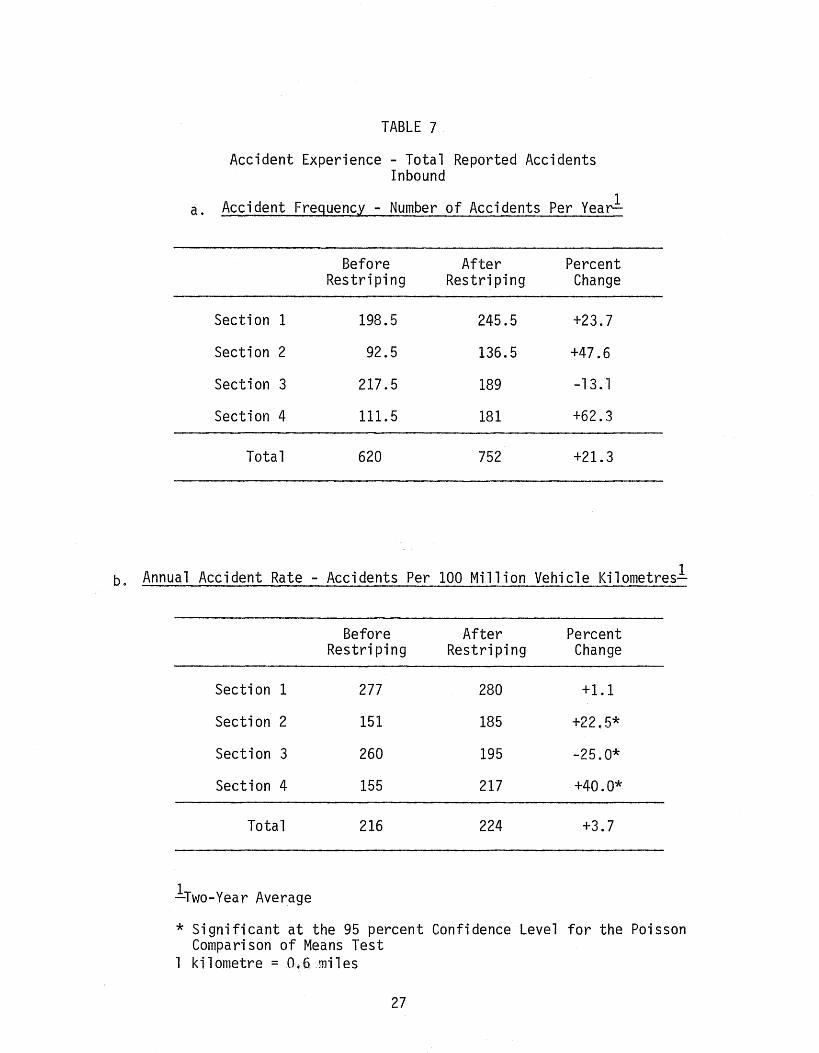
TABLE 7
Accident Experience - Total Reported Accidents Inbound
a. Accident Frequency - Number of Accidents Per Yearl
Before After Percent Restriping Restriping Change
Section 1 198.5 245.5 +23.7
Section 2 92.5 136.5 +47.6
Section 3 217.5 189 -13.1
Section 4 111.5 181 +62.3
Total 620 752 +21.3
b. Annual Accident Rate - Accidents Per 100 Million Vehicle Kilometresl
Before After Percent Restriping Restriping Change
Section 1 277 280 +1.1
Section 2 151 185 +22.5*
Section 3 260 195 -25.0*
Section 4 155 217 +40.0*
Total 216 224 +3.7
lTwo-Year Average
* Significant at the 95 percent Confidence Level for the Poisson Comparison of Means Test
1 kilometre = 0.6 miles
27

TABLE 8
Acci~ent Experience ~ Peak Two Hours Inbound
Accident Frequency - Number of Accidents Per Yearl a. -
Before After Percent Restriping Restriping Change
Section 1 29.5 25.0 -15.2
Section 2 32.0 16.5 -48.4
Section 3 52.5 17.0 -67.6
Section 4 19.5 10.5 -46.1
Total 133.5 69.0 -48.3
b. Annual Accident Rate - Accidents Per 100 Million Vehicle Kilometresl
Before After Percent Restriping Restriping Change
Section 1 271 205 -24.4
Section 2 445 230 -48.3*
Section 3 530 173 -67.3*
Section 4 229 130 -43.2
Total 364 178 -51.1*
lTwo-Year Average
* Significant at the 95 percent Confidence Level for the Poisson Comparison of Means Test
1 kilometre = 0.6 miles
28
period analyses indicate consistent improvement in frequency and rates
when the added lane was most beneficial.
In Figure 10~ the pattern of accident rates in 1974 follows the same
trend of the outbound direction, with the exception of the upstream Section 4.
This was probably due to the fact that traffic congestion inbound had not
encroached on this section.
In 1975, increases in accident rates correspond to large increases in
travel caused by the opening of a new section of freeway.
After the minor restriping in Sections 2 and 3, the accident rates
during the peak periods were reduced significantly.
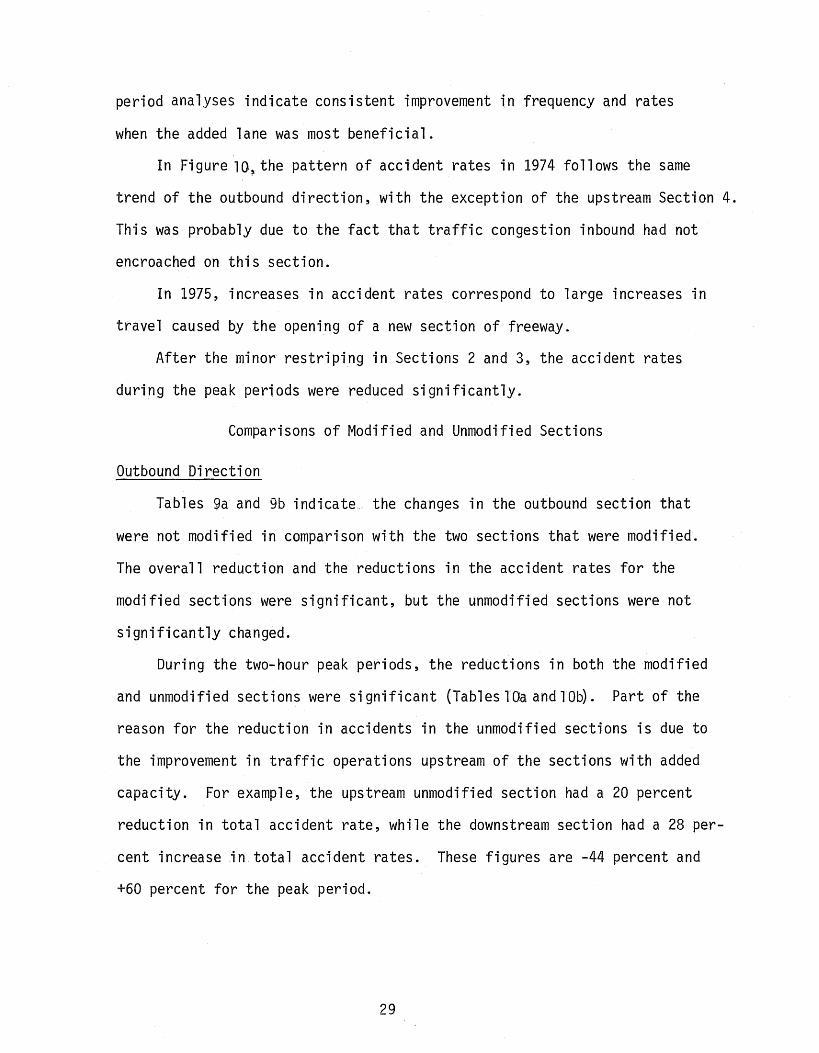
Comparisons of Modified and Unmodified Sections
Outbound Direction
Tables 9a and 9b indicate. the changes in the outbound section that
were not modified in comparison with the two sections that were modified.
The overall reduction and the reductions in the accident rates for the
modified sections were significant, but the unmodified sections were not
significantly changed.
During the two-hour peak periods, the reductions in both the modified
and unmodified sections were significant (Tables lOa and lOb). Part of the
reason for the reduction in accidents in the unmodified sections is due to
the improvement in traffic operations upstream of the sections with added
capacity. For example, the upstream unmodified section had a 20 percent
reduction in total accident rate, while the downstream section had a 28 per
cent increase in total accident rates. These figures are -44 percent and
+60 percent for the peak period.
29

800 Section 4
Section 3 ezzz21
Section 2 •••• 700 Section ijjrij iijj jiijijiljlii II
Total ~
'> :E
600 Direction of Travel 0 0
' en J-z LLI
500 0 u ~ I
en w ~ 400 a:: J-z LLI 0 u
300 u <(
0 0 0:: w a.. ~
200 <( w a..
100
0 1974 1975 1976 1977.,
TIME
FIGURE 10 - PEAK PERIOD ACCIDENT RATES BY SECTION INBOUND U.S. 59
30
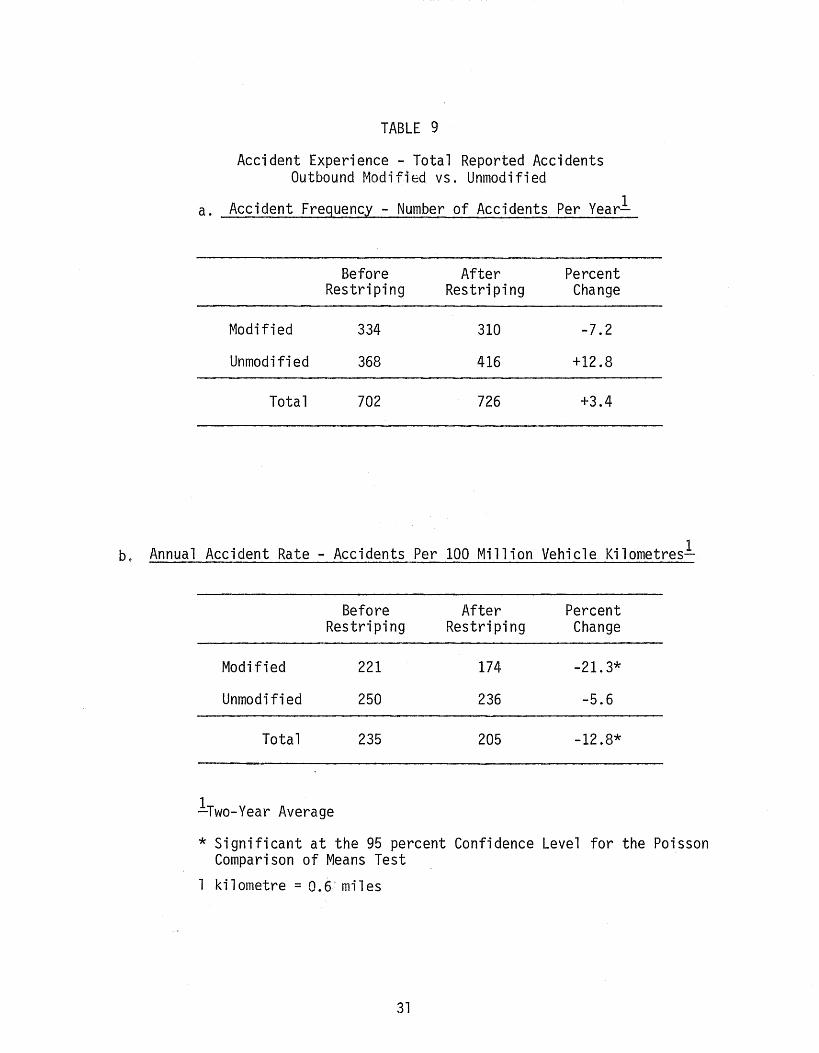
TABLE 9
Accident Experience - Total Reported Accidents Outbound Modified vs. Unmodified
a. Accident Frequency - Number of Accidents Per Yearl
Modified
Unmodified
Total
Before Restriping
334
368
702
After Restriping
310
416
726
Percent Change
-7.2
+12.8
+3.4
b~ Annual Accident Rate - Accidents Per 100 Million Vehicle Kilometresl
Modified
Unmodified
Total
Before Restriping
221
250
235
lTwo-Year Average
After Restriping
174
236
205
Percent Change
-21.3*
-5.6
-12.8*
* Significant at the 95 percent Confidence Level for the Poisson Comparison of Means Test
1 kilometre = 0.6· miles
31
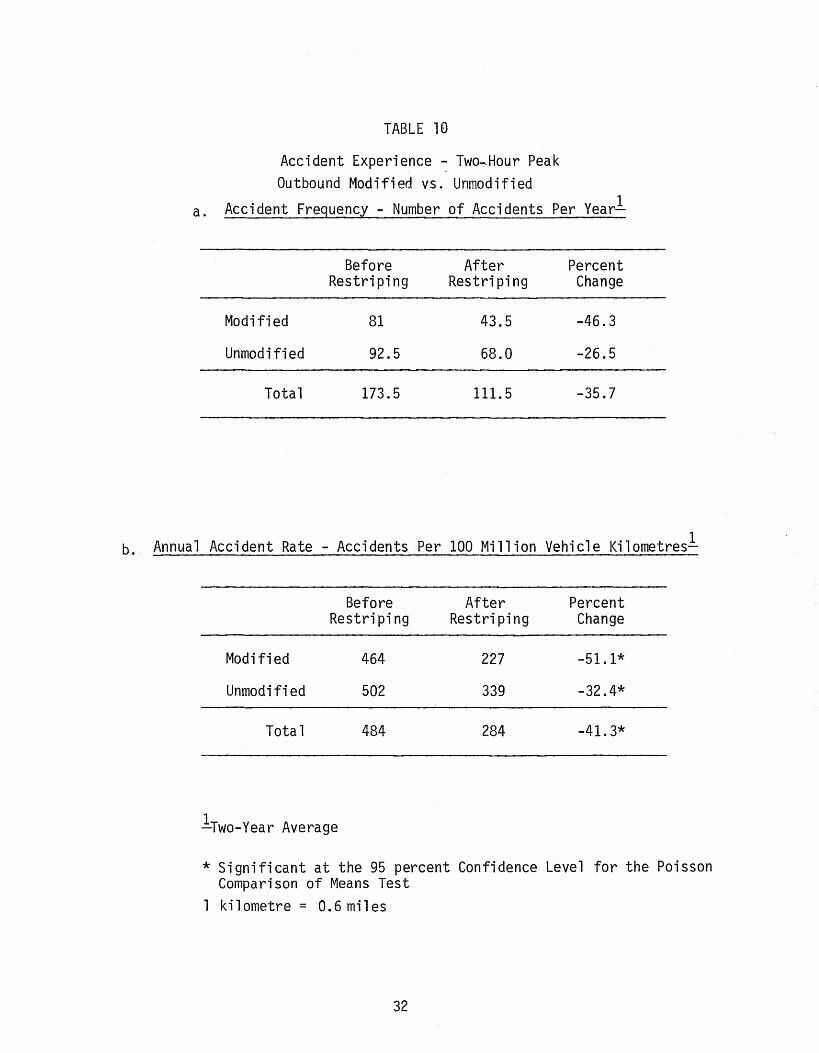
TABLE 10
Accident Experience - Two~Hour Peak Outbound Modified vs. Unmodified
a. Accident Frequency - Number of Accidents Per Yearl
Modified
Unmodified
Total
Before Restriping
81
92.5
173.5
After Restriping
43.5
68.0
111.5
Percent Change
-46.3
-26.5
-35.7
b. Annual Accident Rate -Accidents Per 100 Million Vehicle Kilometres.!..
Modified
Unmodified
Total
Before Restriping
464
502
484
lTwo-Year Average
After Restriping
227
339
284
Percent Change
-51.1*
-32.4*
-41. 3*
* Significant at the 95 percent Confidence Level for the Poisson Comparison of Means Test
1 kilometre = 0.6 miles
32
Summary of Tests for Significance
In addition to the conservative Poisson Comparison of Means Test, the
liberal Poisson Distribution Test was applied to all sections in before
and after analyses for the following time periods; 24-Hour (24); Two-Hour
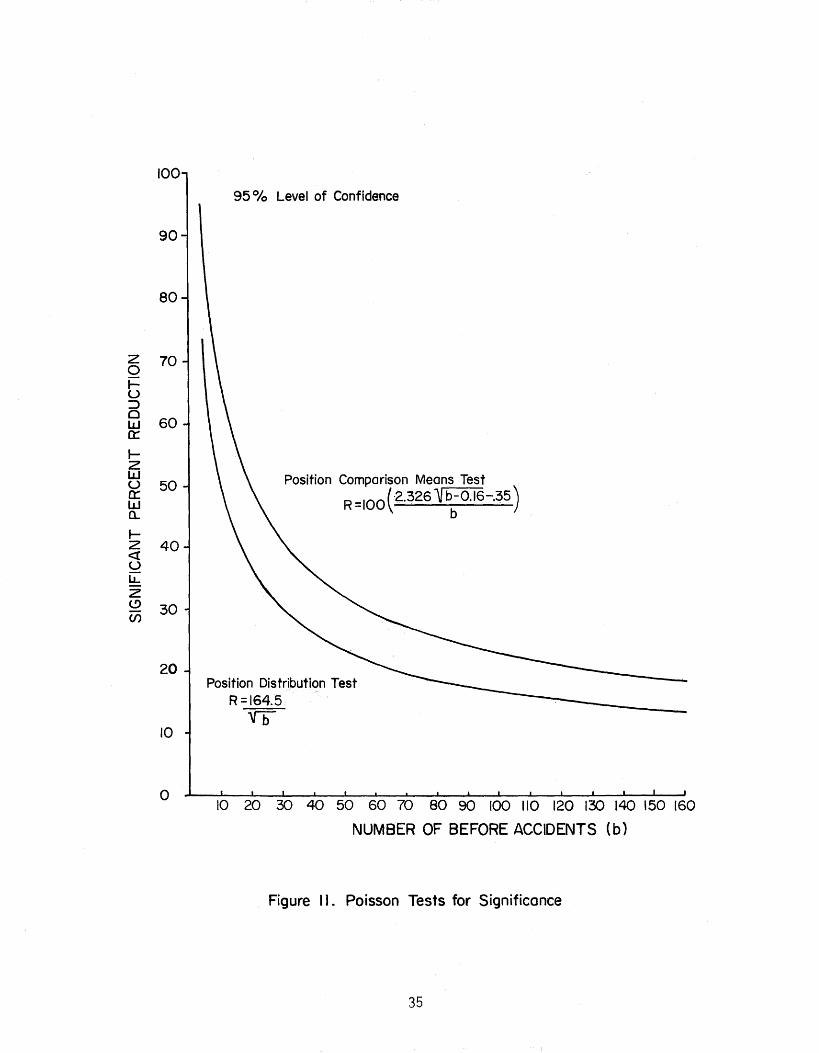
Peak Period (P); Daytime (D); Nighttime (N) (Figure 11). (?) If the con-
servative test is satisfied, it can be stated that it is 95 percent certain
that the change in accident experience is significant. If only the liberal
test is satisfied, more data should be collected before a statement of
significance is made. If neither test is satisfied, then it is 95 percent
certain that no change is attributed to the change in conditions. Table 11
summarized the direction of change in accident rates, and the tests that
are satisfied by the data.
In the preparation of this paper it was noted by two reviewers that
the use of the Poisson Comparison of Means Test was suspect. It was
suggested that since the number of samples are large, a test using a normal
approximation to the binomial distribution would be appropriate. These
tests were conducted with the following results.
• all tests that were determined to have significance with the
Comparison of the Means Tests were confirmed.
t One time period (Section 1, Inbound, Daytime) was found to be
significant (Table 11).
• Two sections tested significant for changes in angular accidents
(Table 13).
33
24-Hour Time Period - (24)
In the outbound direction, the reductions in accident, rates in the two
modified Sections 2 and 3 and the upstream Section 1 were significant. Only
the downstream Section 4 had an increase which was also significant. The
travel in this section was increased greatly. The total rate for the sum
of the four sections was significantly reduced.
In the inbound direction, only the modified Section 3 was reduced
significantly. This decrease was somewhat surprising, since the increase
in capacity was only useful during the peak period, and for a short section.
However, the total rate for the sum of the four sections increased, but
not significantly.
The results of the 24- our analysis supports the statement that the
narrow lanes and reduction in shoulder widths did not increase the accident
experience of the freeway.
Two-Hour Peak Hour Period - (P)
The outbound direction experienced the same changes in accident rates
during the peak periods as he total 24-hour period, but because of the low
number of accidents for Sec ions 3 and 4, the results only satisfied the
liberal tests and were, the inconclusive. However, the total rates
for the peak period did satisfy the conservative test, indicating that the
improved capacity resulted in a reduction in overall accident experience.
The inbound direction lso had a reduction in accident rates throughout
the four sections. The only unusual result was the reduction in rate in the
34
100
90
80
z 70 0 1-u :::> ~ 60 a: 1-2 LI.J u 50 0:: w a.. 1-2 40 <( u LL 2
~ 30
20
10
0
95 °/o Level of Confidence
Position Comparison Means Test
R =I00(2.326"\J b~O.IG-.35)
Position Distribution Test R=l64.5
"'Vi)
10 20 30 40 50 60 70 80 90 100 110 120 130 140 150 160
NUMBER OF BEFORE ACCIDENTS (b)
Figure I I. Poisson Tests for Significance
35

TABLE 11
DIRECTION OF CHANGE IN ACCIDENT RATES AND TESTS FOR SIGNIFICANCE
OUTBOUND INBOUND
Section Time Period Time Period Number 24 p D N 24 p D
+
*
1 - * - * - * - * + - -(N)
2 - * - * - * - * + * - * +
3 - * - (L) - - * - * - * - *
4 + * + (L) + * - + * - (L) + ( L)
Total - * - * - (L) - * + - * - *
Accident Rate Reduced
Accident Rate Increased
Significant at the 95 percent Confidence Level for the Poisson Comparison of Means Test (Conservative)
(L) Significant at the 95 percent Confidence Level for the Poisson Distribution Test (Liberal)
(N) Significant at the 95 percent confidence level for the Normal
Approximation Test
36
N
+ (L)
+ *
+
+ *
+ *
downstream Section 1, but the change was not significant.
Daytime Period - (D)
Two-thirds of the travel occurred during the 12 hours defined
as the Daytime Period. Therefore, the accident experience will generally
follow the 24-hour results, as it did with the outbound direction. However,
the total rate change was significant for the daytime period only for the
liberal tests. On the inbound direction, there was a significant decrease
in the overall accident rate for the daytime period.
Nighttime Period - (N)
There was much concern that the narrow lanes, offset from the pavement
joints, would be difficult to follow at night. Also, the reduced shoulder
widths might be more hazardous at night. The results in Table 11 indicate
that the modified sections in the outbound direction at night had significant
reductions in rates, and that the overall rate was also reduced.
In the inbound direction, the nighttime rates were all increased.
Since there was a narrowing of the main lanes and limited reduction in
shoulder widths, the increases must be attributable to other causes, such
as increased travel.
In summary, the tests generally support the hypothesis that narrow
lanes and reduced shoulder widths are not more hazardous, when they are
accompanied by an effective increase in capacity. This increase in
37
capacity may also reduce the accident experience of adjacent upstream
sections whose designs were not modified, by reducing the time and severity
of congestion that originates downstream.
An Analysis of the Type of Accidents
One of the concerns for the safety of operations in sections with
narrow lanes was that the reduction in lateral clearance would result in
higher accident rates, and in an increase in accidents involving vehicles
in adjacent lanes. The accident records were coded by the following
types of accidents:
1 . Rear End
2. Fixed Object
3. Other (Pedestrian, Bicycle, Overturn, etc.)
4. Sideswipe
5. Left Turn
6. Right Turn
7. At an angle
The last four types represented accidents that more than likely
involved vehicles in adjacent lanes or at ramp terminals. An analysis of
the sum of these four types grouped under a general category of angular
accidents was made with data from one year before the restriping and two
years after restriping.
38
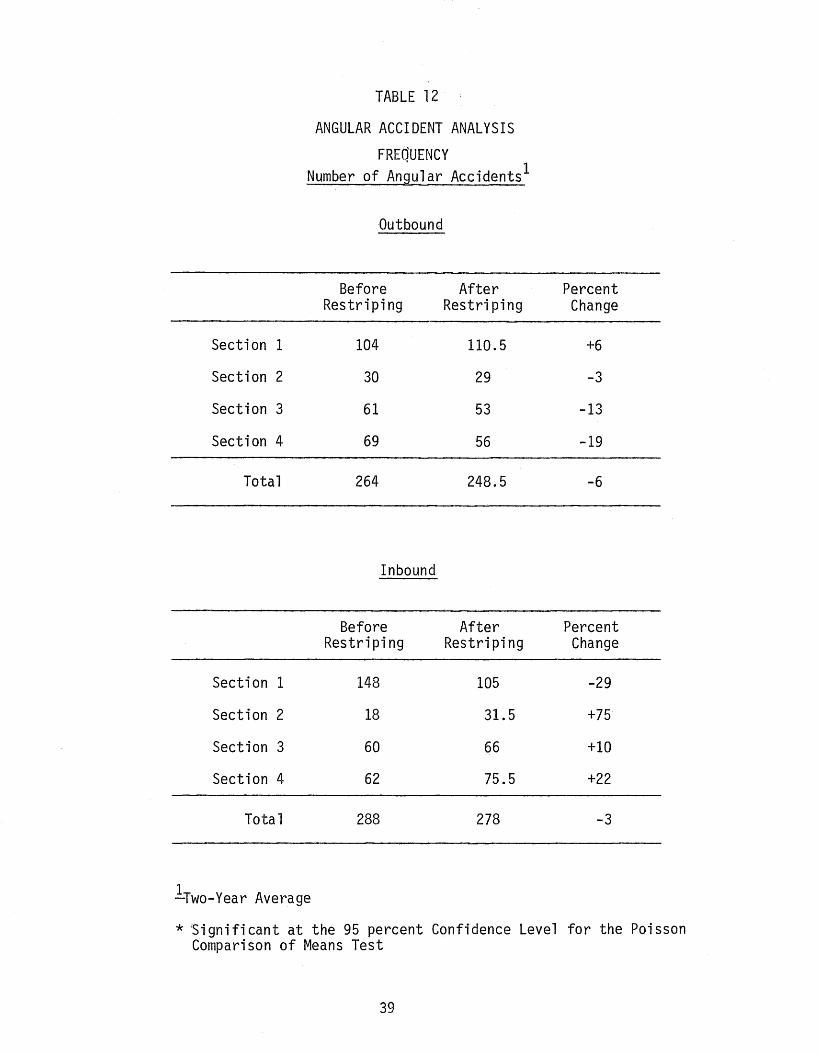
TABLE 12
ANGULAR ACCIDENT ANALYSIS
FRE~UENCY
Number of Angular Accidents1
Outbound
Before After Restriping Restriping
Section 1 104 110.5
Section 2 30 29
Section 3 61 53
Section 4 69 56
Total 264 248.5
Inbound
Before After Restriping Restriping
Section 1 148 105
Section 2 18 31.5
Section 3 60 66
Section 4 62 75.5
Tota 1 288 278
lrwo-Year Average
Percent Change
+6
-3
-13
-19
-6
Percent Change
-29
+75
+10
+22
-3
* Significant at the 95 percent Confidence Level for the Poisson Comparison of Means Test
39
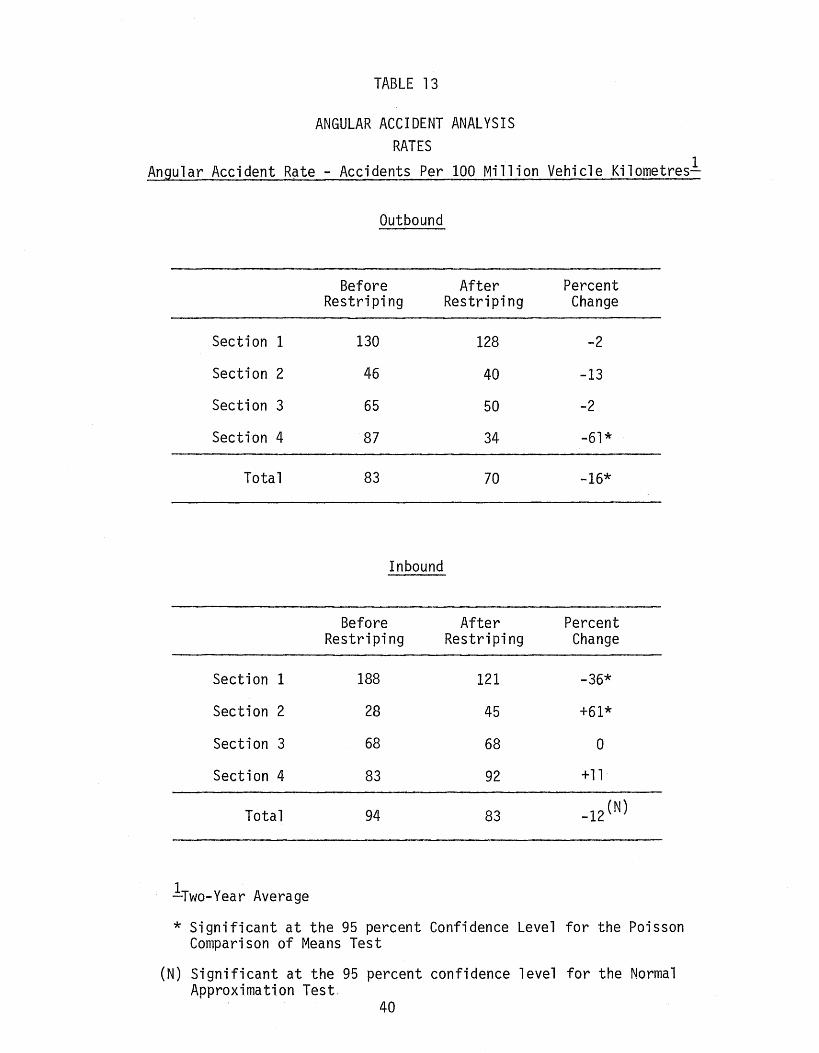
TABLE lB
ANGULAR ACCIDENT ANALYSIS RATES
Angular Accident R~te - Accidents Per 100 Million Vehicle Kilometresl
Outbound
Before After Percent Restriping Restriping Change
Section 1 130 128 -2
Section 2 46 40 -13
Section 3 65 50 -2
Section 4 87 34 -61*
Total 83 70 -16*
Inbound
Before After Percent Restriping Restriping Change
Section 1 188 121 -36*
Section 2 28 45 +61*
Section 3 68 68 0
Section 4 83 92 +ll
Total 94 83 -12(N)
lTwo-Year Average
* Significant at the 95 percent Confidence Level for the Poisson Comparison of Means Test
(N) Significant at the 95 percent confidence level for the Normal Approximation Test
40

Section 1
Section 2
Section 3
Section 4
Total
Section 1
Section 2
Section 3
Section 4
Total
TABLE 14
ANGULAR ACCIDENT ANALYSIS
PERCENT OF TOTAL ACCIDENTS1
Outbound
Before After Restriping Restriping
36 44
22 27
23 26
48 34
32 34
Inbound
Before After Restriping Restriping
57 43
19 23
27 35
43 42
40 37
1 : -Two-Year Average
Percent Change
+22*
+23
+13
-29*
+6
Percent Change
-25*
+21
+30*
-2
-8
* A level of significance of 0.05 was accepted in the Binomial Test of Proportions.
41
On the outbound lanes, the critical sections which had narrow lanes
were Sections 2 and 3. The frequency and rate of angular accidents
decreased, but the percent of total accidents increased. None of the changes,
were large enough to satisfy the statistical tests (Tables 12, 13 and 14).
However, Section 4, which had no geometric modifications, had a significant
reduction in angular accident rate and percent of total accidents.
The inbound lanes, which were not narrowed to increase capacity, were
subjected to greater accident potential by increased traffic demand which
results in more angular accidents (Tables 12 and 13). Section 1 is th~
exception in that it had sufficient capacity to accommodate the increased
demand. The percent of total accidents that were classified as angular
accidents declined, but the number of accidents were too small to satisfy
the test of significance (Table 14).
The conclusion of the analysis of type of accident was that no
definite statement can be made as to the effect of the narrower lanes on
angular accidents.
An Analysis of Accident Severity
The impact that the change in the pavement surface geometries may have
on the severity of accidents was investigated. The number of accidents
reporting an injury or fatality was analyzed by rates and percent of total
by section (Tables 15, 16, and 17).
The critical outbound Sections 2 and 3 had reductions in the severe
accident rates, but dtd not satisfy the. stati.sti:ca 1 test of s.t~ntftcance ..
However, the fact that the accident experience decreased was important.
42
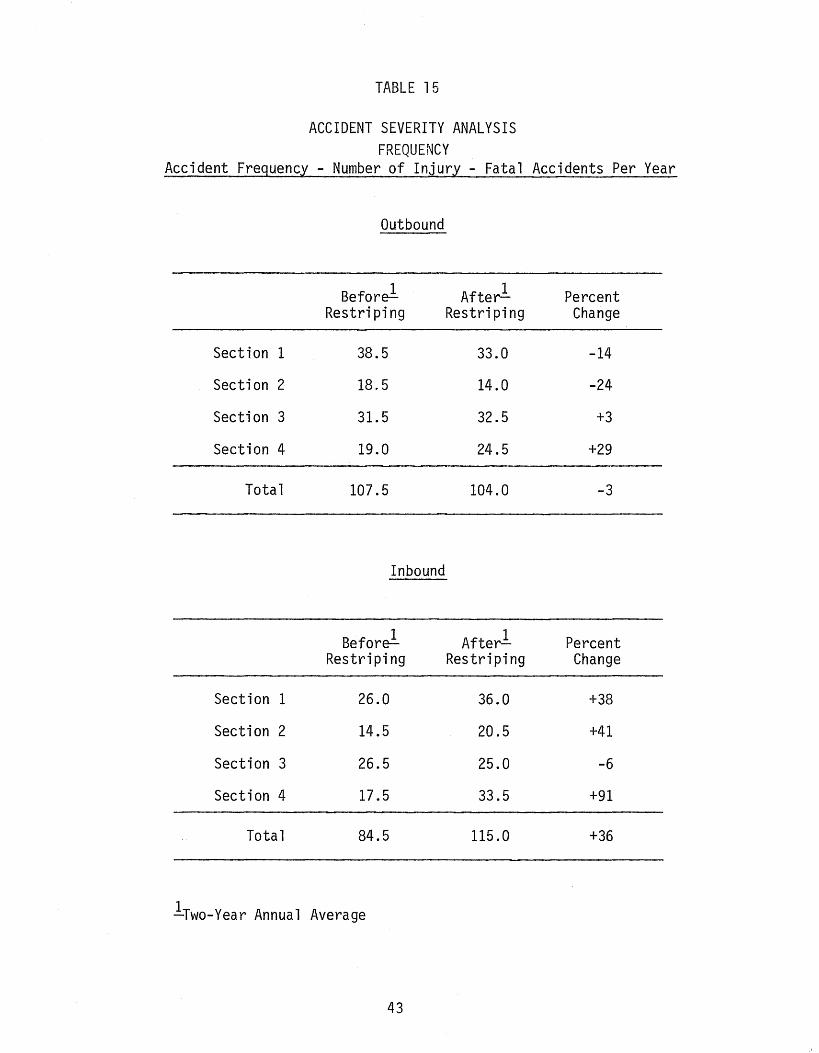
TABLE 15
ACCIDENT SEVERITY ANALYSIS FREQUENCY
Accident Frequency - Number of Injury - Fatal Accidents Per Year
Outbound
Before-!- Afterl Percent Restriping Restriping Change
Section 1 38.5 33.0 -14
Section 2 18.5 14.0 -24
Section 3 31.5 32.5 +3
Section 4 19.0 24.5 +29
Total 107.5 104.0 -3
Inbound
Before.!.. Afterl Percent Restriping Restriping Change
Section 1 26.0 36.0 +38
Section 2 14.5 20.5 +41
Section 3 26.5 25.0 -6
Section 4 17.5 33.5 +91
Total 84.5 115.0 +36
lTwo-Year Annual Average
43

TABLE 16
ACCIDENT SEVERITY ANALYSIS
RATES Accident Rate - Injury - Fatal Accidents
100 Million Vehicle Kilometres
Outbound
Before!- Afterl Percent Restriping Restriping Change
Section 1 54 38 -30
Section 2 30 19 -37
Section 3 35 31 -11
Section 4 25 27 +8
·ratal 36 29 -19
Inbound
Before!- Afterl Percent Restriping Restriping Change
Section 1 36 41 +14
Section 2 24 29 +21
Section 3 32 26 -19
Section 4 25 41 +64
Total 30 34 +13
lTwo-Year Annual Average
44

TABLE 17
ACCIDENT SEVERITY ANALYSIS PERCENT OF TOTAL ACCIDENTS
Percent of Total Accidents Having An Injury or Fatality
Outbound Direction
Before.!. 1 After- Percent Restriping Restriping Change
Section 1 14.8 13.2 -11
Section 2 14.3 13.0 -9
Section 3 15.4 16.1 +5
Section 4 17.4 14.8 -15
Total 15.3 14.3 -7
Inbound Direction
Before.!. After.!. Percent Restriping Restriping Change
Section 1 13.1 14.7 +12
Section 2 15.8 15.0 -5
Section 3 12.2 13.2 +8
Section 4 15.7 18.5 +18
Total 13.6 15.3 +13
.!.Two-Year Annual Average
45
Only Section 4, inbound, experienced a significant change in the rates
of injury and fatal accidents. This section had no changes in the lane
configuration but did have a large increase in volumes and congestion.
The total inbound section had an increase in severe accidents, while
the outbound had a decrease in severe accidents.
The conclusion drawn from this analysis is that the ~configured
section! of the freeway did not produce_a significant change in the number and
rate of severe accidents for the study period of two years after modifica
tions.
BENEFIT-COST ANALYSIS
Benefits of the restriping in Section 2 have not been realized at this
time. It is estimated, however, that with the extension of the lane to the
Edloe entrance, a significant reduction in vehicle delay will be achieved.
Section 3 achieved a significant increase in capacity as a result of
the added lane, and resulted in a 13.5 percent increase in the number of
vehicles exiting this section in the peak two-hour period. The estimated
savings in total travel time were calculated to be 1 ,100-vehicle hours
per day for 14~600 vehicles. With 1.3 persons per vehicle occupancy rate,
a cost of $6.59* per vehicle hour for private vehicles resulted in a savings
of $7,249 per weekday or $906,125 annually, assuming 50 percent incident
free days~
Fuel savings were realized with the reduction in travel time. Each
vehicle saved an average of 4.52 minutes. This represents the time dif
ference of 9 minutes at 32 km/h (20 mph) and 4.48 minutes at 64 km/h
(40 mph) over 4.83 k·ilometres (3 miles). Running cost at 32 km/h (20 mph)
1s 7.12* cents per vehicle kilometre (11.46* cents per vehicle mile); at
*Prices used in this calculation taken from Reference (~) and updated to 1977
46

* * 64 km/h (40 mph), it is 4.74 cents per vehicle kilometre (7.62 cents per
vehicle mile). Therefore a savings of ($0.09712 -.$0·0474 ) for 14 600 ' veh1cle-k1lometre ' vehicles traveling 4.83 kilometres is equal to $1,678.33 in operating costs
per day or $209,791 per year,) for 125 incident-free days.
Approximately 75 percent of the operating costs can be attributed to
fuel. Therefore, the number of litres (gallons) of gasoline conserved by
the improvement was estimated to be:
($209,791) (.75) (~~j~g*) = t,l26,755 litres (256,080 gallons)
Similar calculations of benefits can be made for noise and air pollu-
tion and traffic accidents, but they were not included in this analysis.
Therefore, total annual benefits were calculated to be $1,115,916.
The cost of restriping the lanes was $38,700. The project required the
following work items: relocation of two lighting standards and three road-
side warning signs; modification of a metal guard beam section and two curb
inlets; removal of sections of curb, traffic buttons, and paint; application
of asphalt overlay strip to smooth pavement--shoulder transition; stabili-
zation of shoulders; and application of paint strips. Lane lines were
restriped after three months at a cost of $471, and additional lane markings
and lane arrows were added at Weslayan ramp at a cost of $157.
Some work was required in the outer separation that was used as emer-
gency parking areas. Inadequate strength during wet weather caused the
material to rut very badly. Costs for this work were absorbed in normal
maintenance, but this extra expense should be included as an annual cost
of maintaining the installation.
* Prices used in this calculation taken from Reference (~)and updated to 1977
47

The benefit to cost ratio for this project was $1,115,916 to $39,328
or 28:1. Annual costs to maintain the system have not been calculated at
this time but should be considerably less than $40,000. At some
time in the future, the shoulders will deteriorate and will be replaced
at an estimated cost of $275,600 or $39,245 annually.* However, it is
anticipated that when this construction is programmed, the new design will
provide for an added lane with shoulder, in order to return the sectiori
to standard cross section.
DESIGN AND MAINTENANCE REQUIREMENTS
Cross sections were designed with uniform lane widths of 3.2 metres
(10.5 ft) because of the following considerations:
1. The median shoulder width was maintained at 3.05 metres (10 ft)
because of the small mountable curb and drainage inlets in the
median.
2. A paved right shoulder was desired where practical.
3. The volume of large vehicles using this freeway during peak
periods was very low (2-3 percent).
4. The minimum desirable width for travel on freeways was con
sidered to be 3.2 metres (10.5 ft).
The cross"sections were changed in a transition zone of 250 metres
(820 ft). The old stripes and delineator buttons were removed by main
tainer blades and sandblasting, and new paint stripes were placed. The
paint tended to wear quickly because of vehicle encroachment, as well as
oil and dirt accumulations. New stripes, placed after three months of
·* Uniform series capital recovery factor of 0.1424 for i=7%, n=10 years
48
operation have worn very well, but new stripes and buttons will be placed
after 15 months of operation.
The shoulder lanes have held up well under the increasing volumes of
traffic. The turf area in the outer separation that has been used for
emergency parking has become very rutted and requires considerable mainte
nance. New stabilized shoulders will be provided in these areas.
The longitudinal joint between the mainline pavement and the old
shoulder pavement has widened, requiring maintenance. However, the quality
and safety of the ride over the joint has not been reduced substantially.
49
III. CONCLUSIONS
1. Adding a lane for travel in a freeway bottleneck section produces
benefits in travel time, safety and quality of operation and travel
accommodated.
2. Acceptance by the public of these temporary solutions is high.
3. The additional capacity in a converted roadway section reduces the
accident rates, thus offsetting any increase in accident potential
attributable to narrow lanes and fewer emergency parking areas.
4. Additional capacity can be achieved at very low costs by recon
figuring existing roadway and parking pavements. Benefits to cost
ratios for these projects are very attractive.
5. Reconfigured roadways require additional maintenance to provide
adequate lane delineation, structural integrity of the shoulder
lane and emergency parking areas.
50

REFERENCES
1. Estep, A.C. and Moskowitz, Karl. Getting the Most out of a Freeway
System. California Department of Transportation, TRB Special Report
153.
2. Green, W.R.
portation.
Freeway Reconditioning. California Department of Trans
Paper presented to AASHTO, July 1975.
3. Rooney, Fred. Restriping Freeways for Added Lanes. California Division
of Highways, 1972.
4. Endo, G. and Spinello, J.J. Evaluation Santa Monica Freeway Viaduct
Widening (Westbound Interstate Route 10). California Department of
Transportation, 1973.
5. Portigo, Josette M. State-of-the-Art Review of Paved Shoulders.
Michigan Department of State Highways and Transportation, TRB Research
Record 594.
6. Buffington, Jesse L. and McFarland, William F. Benefit-Cost Analysis:
Updated Unit Cost and Procedures. Texas Transportation Institute
Research Report 202-2, 1975.
7. Laughland, John C. et al., Roy Jorgensen Associates. Methods for
Evaluating Highway Safety Improvements. NCHRP Report 162.
51