the use of nth order equations to describe the action of...
TRANSCRIPT

506
612 . h i . 45 : 5 4 1 .1 2 7 .
The Use o f nth Order Equations to Describe the Action of SimpleHcemolysins.
By E ric P onder and James F ranklin Y eager.
(Communicated by Sir Edward Sharpey-Schafer, F.R.S.—Received May 6, 1930.)
(From Washington Square College, New York University.)
Contents.
Introduction ......................................................................Methods—
(a) Time dilution curves ............................. .(b) Percentage haemolysis curves .................
Time-dilution and percentage haemolysis curves—(a) Numerical example ........................................(b) Method of evaluating constants ....................
Variations in n—(a) Different lysins .................................................(b) Different cells ................... ................................(c) Effect of temperature ....................................(d) Effect of added substances ............................
The R-notation..................................................................Summary ..........................................................................References.........................................................................
Page506
507508
511513
522522523523524530531
Introduction.The purpose of this paper is to introduce a fundamental modification into
the theory which deals with the kinetics of haemolytic reactions. Hitherto it has been found sufficient to treat the reaction between the lysin and the cell component with which it reacts as one of the first order ; now, as a result of improved methods of investigation, it is necessary to treat it as a reaction of the nt\\ order, i.e., as one in which varying-sized groups of molecules may be imagined as reacting with one another. As a result of this modification, the equations hitherto used for describing the kinetics of simple haemolysins become special cases of much more general expressions, which are not only able to describe haemolytic phenomena over greater ranges with greater accuracy, but which are in all probability applicable to a much greater diversity of haemolytic reactions.
on May 28, 2018http://rspb.royalsocietypublishing.org/Downloaded from

Action o f Simple Hcemolysins. 507
I. Methods.
1. Time-dilution Curves.—In previous investigations it lias been the practice to discontinue observations of the time required for complete lysis after from 45 to 60 minutes, the reason for this being two-fold : (a) that it is difficult to define end-points when the lytic process is slow, and (6) that very slight errors in the quantity of cells or of lysin in the system lead to great errors in the time for complete lysis, owing to the fact that the time-dilution curve, as it approaches its asymptote, runs nearly parallel to the time axis. The endpoints over 60 minutes are accordingly apt to be unreliable and irregular, and in all previous researches we have ignored them by supposing that the asymptote of the curve may be placed only a little above the last observed point, i.e. that the curve is rapidly approaching its asymptote after from 30 to 60 minutes. Recently, however, we have been able to make sufficiently consistent observations of the time for complete lysis up to times as long as 300 to 360 minutes, and the fallacious nature of the former treatment has become apparent ; the time-dilution curves, in fact, can now be shown to rise above the lines which were formerly supposed to be asymptotes, while at the same time the simple equations of former papers have been found insufficient to describe the curves as nowT obtained.
Even if the desirability of continuing observations for more than 60 minutes is realised, it is by no means easy to define the end-points. I t is, indeed, difficult even to describe the small differences in technique on which the success of the attempt depends, for these protracted observations can be made only with the most minute attention to detail and after much practice. In general, however, the technique employed is the same as previously described (1), but two small modifications are necessary.
(i) Since some of the haemolytic systems require to be observed for periods of 5 or 6 hours, it is necessary to use a water-bath large enough to contain about 50 tubes at one time, for otherwise it is not practicable to plot a number of time-dilution curves in one working day ; further, the temperature of the bath must be much more accurately controlled than hitherto. We use a Monel metal water-bath. 30 inches long, 11 inches deep, and 6 inches wide, stirred with jets of compressed air, and regulated to 0-02° ; this bath is arranged as previously described, so that the tubes containing the haemolytic systems are seen through glass walls against a ruled background lit by reflected light. The lower part of the bath contains a large copper spiral through which cold water can be circulated when the temperature of the bath is required to be less than
2 p 2
on May 28, 2018http://rspb.royalsocietypublishing.org/Downloaded from

508 E. P onder and J . F. Y eager.
that of the room. As the loss of temperature which occurs when the warmed suspension is added to the warmed lysin is proportional to the difference in temperature between the room and the water-bath, the latter is kept in a room whose temperature can be adjusted between 20° and 30° ; in some cases, when curves are being plotted at low temperatures, work is carried out in a refrigerator room which can be kept constant between 1° and 15°.
(ii) In observing the time required for complete lysis, at least two end-points may be selected ; these differ by less than 1 per cent., but are nevertheless clearly distinguishable by eye. The first end-point is taken when the black lines of the background are clearly distinguishable through the tube containing the haemolytic system ; this corresponds to about 99 per cent, lysis. The second end-point is taken wThen the contents of the tube are perfectly clear and free from even slight cloudiness; this corresponds to complete lysis. As a rule it is immaterial which end-point is taken, so long as the observer is consistent; in plotting time-dilution curves up to 300 minutes, however, the second endpoint must always be used if consistent values are to be obtained for the prolonged times. Neglect of this apparently trivial point results in serious underestimation of the end-points for the higher dilutions of lysin and renders the subsequent calculations virtually valueless.
2. Percentage Haemolysis Curves.—It is impossible to investigate the kinetics of haemolytic systems fully unless the methods of measuring percentage haemolysis are as satisfactory as the methods of obtaining time-dilution curves, since consideration of the latter curves alone may lead to quite misleading conclusions. Percentage haemolysis curves of sufficient accuracy, however, are by no means easy to obtain. A number of methods, none wholly satisfactory, have been suggested, all utilising some method of measuring the intensity of light transmitted through, the haemolysing suspension. The radiometer method, proposed by one of us, requires a considerable quantity of cell suspension (20 c.c.), and is incapable of measuring rapid changes owing to the lag of the radiometer (2). The simple opacimeter method proposed by Jacobs, and also the ingenious method of the same investigator in which a glowing filament is matched against a background consisting of the haemolysis suspension, both suffer from the disadvantage that they do not readily follow changes in the important range from 0 to 30 per cent, lysis. The method employing the selenium cell has this same disadvantage, and may possess an even more serious one in addition, for, as already stated, it is impossible to obtain consistent readings unless special precautions are employed to eliminate the effects of photoelectric fatigue (3). The extent to which this can be done
on May 28, 2018http://rspb.royalsocietypublishing.org/Downloaded from

depends very much on the particular kind of selenium cell employed, and we have had such unsatisfactory experience with the various types of selenium cell on the market that we have abandoned the method for that described below, in which a potassium cell is used in place of selenium. In this connection may be mentioned the potassium cell method of Kesten and Zucker (4). This is a null method, and does not follow rapid changes satisfactorily ; it is unsatisfactory in another respect also, for in our hands at least, it exhibits considerable instability, therein resembling most combinations of photoelectric cells with amplifying circuits.
The apparatus now employed is shown in fig. 1, and consists of a rectangular water-jacketed cell, of 3 c.c. capacity, interposed between a source of light and
Action o f Simple 509
Fig. 1.—Apparatus for measuring percentage haemolysis. L, light; l, lens ; W, rotating wheel; S, slot, behind which is the water-jacketted cell containing the suspension ; P, potassium cell in case.
a potassium photoelectric cell connected in series with a mirror galvanometer and a high-tension battery, the negative pole of which is earthed. The potassium cell used is one of the vacuum type, gas-filled cells being apparently much more unstable. I t is surrounded by a light-proof shield containing a window,
on May 28, 2018http://rspb.royalsocietypublishing.org/Downloaded from

510 E. Ponder and J . F. Yeager.
1 cm. square, in line with the lower part of the glass cell and with the filament of the light. The light itself is a 6-volt projection lamp, lit from an accumulator. On no account must the source of light be operated on the ordinary laboratory electric supply, which is too inconstant for the purpose. A lens mounted rigidly on a small optical bench, which also supports the lamp, renders the light beam parallel and directs it through the cell suspension into the window of the photoelectric cell.
In order to obtain intermittent illumination of the photoelectric cell, which, like the selenium cell previously described, is best used in connection with a ballistic galvanometer, a rotating shutter is placed between the lens and the cell containing the haemolytic system. This shutter, in the form of a wheel with an adjustable slot cut out near its periphery, can be made to rotate once every 15 seconds, 30 seconds, 60 seconds, or 300 seconds, and in this way the photoelectric cell is exposed to the light four times a minute, twice a minute, once a minute, or once every 5 minutes, for a period dependent on the length of the slot. Against the revolving shutter rest two light strips of copper connected to the terminals of the galvanometer ; these are adjusted in such a way that both touch the wheel, thus keeping the galvanometer short-circuited except during the time when the shutter allows the photoelectric cell to be illuminated; when this illumination of the cell occurs, one strip fails to make contact with the wheel, and the galvanometer becomes undamped. The sequence of events accordingly is as follows :—The photoelectric cell is first unilluminated and the galvanometer is damped. The wheel rotates continuously. Just before the cell is to be illuminated the one copper strip fails to make contact; the galvanometer becomes undamped, the photoelectric cell is immediately afterwards illuminated, and the extent of the swing of the galvanometer read. Just as the mirror swings back towards zero, however, the strip again makes contact with the wheel; the galvanometer is at once damped, and almost immediately thereafter the shutter comes between the photoelectric cell and the light. The light is thus left on constantly and the photoelectric cell subjected to intermittent illuminations of equal duration and at equal intervals ; the fact that the exposures are made automatically is a great advantage, for, since a reading is taken at every rotation of the wTheel, successive readings are 15, 30, 60, or 300 seconds apart, as the case may be.
The apparatus is used exactly as described in (3), the lysin and the components of the haemolytic system (totally 1*6 c.c.) being placed in the glass cell and 0 • 4 c.c. of cell suspension, kept in a pipette in a thermos flask, being added at a suitable time. Readings of the galvanometer are made as they occur, and
on May 28, 2018http://rspb.royalsocietypublishing.org/Downloaded from

Action o f Simple Hcemolysins. 511
are converted into values for percentage haemolysis by use of a calibration curve. The haemolytic system is kept stirred by a fine jet of compressed air ; unless this is done, suspensions in the range of 0 to 20 per cent, haemolysis may show variable light transmission. Kesten and Zucker, who mention this variable light transmission and regard it as constituting a serious difficulty, account for it on the grounds of crenation of the cells of the suspension ; it is, however, entirely due to insufficient stirring, and can easily be eliminated.
In constructing the calibration curve, an important modification has been introduced. Previously we prepared the series of standards representing 0 per cent., 10 per cent., ..., 100 per cent, haemolysis from the blood from which the standard cell suspension is prepared ; we now prepare the same standards from the cell suspension itself. To prepare a 10 per cent, standard, for example, (>•1 c.c. of suspension is added to 4 c.c. of saline ; the cells are then haemolysed by freezing and thawing, and 0-9 c.c. of cell suspension added. The contents of the tube then exactly represented 10 per cent, haemolysis in a haemolytic system containing 0*4 c.c. of standard suspension in a total volume of 2 c.c. Other standards are prepared similarly, and the galvanometer reading corresponding to each obtained.
The last consideration is that of the precision which can be expected of the method in practice. Kesten and Zucker, for instance, regard their percentage haamolysis readings, made by their potassium cell method, as correct to ± 0*5 per cent., but we think that such a precision, not only in their method, but in any method of measuring percentage haemolysis, is quite unattainable. In the potassium cell method described above, for example, the precision is about the same as in the radiometer method or the selenium cell method, i.e., ± 3 per cent, between 0 per cent, and 20 per cent., i 2 per cent, between 20 per cent, and 60 per cent., and about ± 1 per cent, as complete lysis is approached. The errors are even greater when rapid haemolysis is being investigated, for the exposure of the photoelectric cell is not instantaneous, and the degree of lysis thus increases even during the taking of each reading.
II. Time-dilution and Percentage Curves.
In all recent work concerned with the fitting of formulae to curves obtained for the action of simple haemolysis it has been assumed that the “ fundamental reaction ” between the cells and the lysin is one in which the latter combines with some component of the former, thus forming a new compound, as a result of the formation of which the integrity of the cells is destroyed. Thus the quantity of cell component, S, destroyed is proportional to the quantity
on May 28, 2018http://rspb.royalsocietypublishing.org/Downloaded from

of the reaction is
( 1 )
( 2)
where c is the initial quantity of lysin, where t is the time required to produce lysis of an arbitrary number of red cells, and where S is large compared to c. Since it is assumed that the complete lysis of n cells corresponds to the utilisation of a constant quantity of lysin, we obtain, by putting x — const., and varying c in (2), a relation between the time for complete lysis of n cells and c the initial concentration of lysin ; when plotted, this gives the time-dilution curve for the lysin. If we are concerned with the number of cells, N, hsemolysed from moment to moment by a particular concentration of lysin from the beginning of the reaction until its completion, we solve (2) simultaneously with an expression of the general type.
n — n0f (1 + xfa 1)mi(1 — x/a2)mtdx, (3)
512 E. Ponder and J . F. Yeager.
of lysin, x, used up in the system, and the velocity given by
whencedxjdt = Jc (c — x)
t = j log —— ’ k c — x
or with the integral of some other type of frequency distribution, and obtain the S-shaped percentage haemolysis curves. (For all details of this earlier treatment, see (3) and (5).)
To show the way in which this treatment requires to be modified if protracted observations are made, we shall use a numerical example in which a time-dilution curve is obtained by the usual methods described above, the observations being extended to cover a period of 300 minutes.
(a) The following observations refer to a time-dilution curve for saponin acting on a standard cell suspension at 25° :—
Dilution, 1 in. c, microgm. t, experimental t, calculated.
10,000 200 0-5 0-7620,000 100 1-3 1-7630,000 66-6 3 1 3 0940,000 50 0 5-0 5-450,000 40-0 12-5 13-0
The calculated results in the last column are obtained from expression (2) with x = 39*0, k — O'03125, and agree quite well with the observed ones,although the excess of the calculated values over the observed values in the high concentrations is very apparent.
on May 28, 2018http://rspb.royalsocietypublishing.org/Downloaded from
Action o f Simple Hemolysins. 513
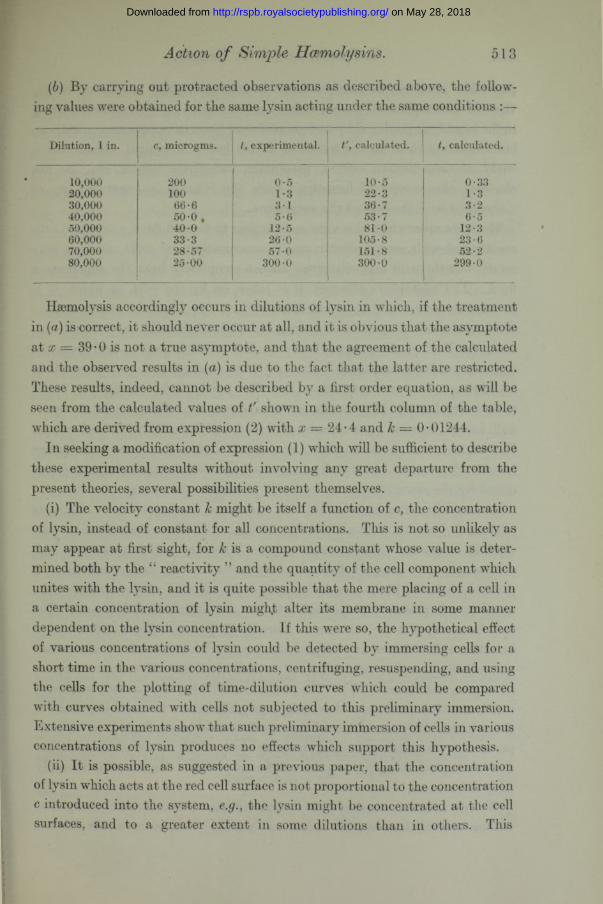
(6) By carrying out protracted observations as described above, the following values were obtained for the same lysin acting under the same conditions :—
Dilution, 1 in. c, microgms.!
t, experimental. t \ calculated. | t, calculated.
10,000 200 0-5 10-5 0-3320,000 100 1-3 22-3 1-330,000 66-6 3-1 36-7 3-240,000 50-0 . 5-6 53-7 6-550,000 40-0 12-5 81-0 12-360,000 33-3 26-0 105-8 23-670,000 28-57 57-0 151-8 52-280,000 25-00 300-0 300-0 299-0
Haemolysis accordingly occurs in dilutions of lysin in which, if the treatment in (a) is correct, it should never occur at all, and it is obvious that the asymptote at x — 39 • 0 is not a true asymptote, and that the agreement of the calculated and the observed results in (a) is due to the fact that the latter are restricted. These results, indeed, cannot be described by a first order equation, as will be seen from the calculated values of t' shown in the fourth column of the table, which are derived from expression (2) with = 24*4 and k = 0-01244.
In seeking a modification of expression (1) which will be sufficient to describe these experimental results without involving any great departure from the present theories, several possibilities present themselves.
(i) The velocity constant k might be itself a function of c, the concentration of lysin, instead of constant for all concentrations. This is not so unlikely as may appear at first sight, for k is a. compound constant whose value is determined both by the “ reactivity ” and the quantity of the cell component which unites with the lysin, and it is quite possible that the mere placing of a cell in a certain concentration of lysin might alter its membrane in some manner dependent on the lysin concentration. If this wrere so, the hypothetical effect of various concentrations of lysin could be detected by immersing cells for a short time in the various concentrations, centrifuging, resuspending, and using the cells for the plotting of time-dilution curves which could be compared with curves obtained with cells not subjected to this preliminary immersion. Extensive experiments show that such preliminary immersion of cells in various concentrations of lysin produces no effects which support this hypothesis.
(ii) I t is possible, as suggested in a previous paper, that the concentration of lysin which acts at the red cell surface is not proportional to the concentration c introduced into the system, e.g., the lysin might be concentrated at the cell surfaces, and to a greater extent in some dilutions than in others. This
on May 28, 2018http://rspb.royalsocietypublishing.org/Downloaded from

514 E. Ponder and J . F. Yeager.
possibility must be discussed at some length, principally in relation to the views of Christophers (17), who, basing his conclusions on observations relating to the haemolysis produced by various acids and bases in various concentrations, but extending them to the action of simple lysins in general, claims that a study of time-dilution curves, percentage haemolysis curves, etc., do not elucidate the process of haemolysis since the lysin is concentrated on, or “ absorbed by ” the cells of the suspension.
The facts upon which this view rests appear to be as follows : (a) if red cells are treated wTith comparatively small concentrations of acids, no lysis may result, but the acid may disappear almost completely from the supernatant fluid. As Christophers observes, it is taken up by the cells, in which it is presumably neutralised by intracellular buffers. ( After some time (an hour or more) the cells so treated hsemolyse, although all the acid has been neutralised. (c) Even if the same cells are washed so as to remove acid from the supernatant fluid, haemolysis occurs as if the washing had not taken place. (d) High concentrations of acid, on the other hand, produce rapid lysis before their neutralisation is complete or even extensive. These facts are quite well known, having been already described by Bodansky (18) and others. Christophers uses them, however, to support a view that haemolysis cannot (even in the cases of lysins such as saponin and sodium taurocholate) be determined by the concentration of free lysin present in the system.
We may first inquire whether this conclusion is supported by the facts relating to lysis by acids and bases, and it is easy to see that these are susceptible of quite a different explanation. When the acid is present in high concentration, it acts, as Bodansky concludes, on the cell membrane ; it probably behaves like a simple lysin, and the velocity of the action on the membrane is probably proportional to the concentration of free acid. The fact, however, that the acid can be neutralised by intracellular buffers makes its action unlike that of any simple lysin, for even when it is wholly neutralised the osmotic pressure within the cell is such that the cell volume increases (Hampson and Maizels (19) ). The resultant stretching of an already weakened membrane thus produces a slow lysis, even although no free acid is present in the system. Only the action of unneutralised acid, accordingly, can be compared with the action of a simple lysin, the lysis which occurs after neutralisation is complete being due to quite a different process. Similar remarks apply to lysis by bases.
We may next ask whether there is any evidence of concentration of saponin, sodium taurocholate, sodium oleate, and similar lysins, on or within the red
on May 28, 2018http://rspb.royalsocietypublishing.org/Downloaded from

Action o f Simple Hcemolyxins. 515
cells. The answer may be supplied by three types of experiment:—(a) Cells are added to lysin in the usual way, and, after as long a time as can be allowed without haemolysis commencing, are thrown down by a fast centrifuge. The concentration of saponin of lysin in the supernatant fluid is then determined. Experiments of this kind are very difficult, for the surface-active lysins are adsorbed on the glass of the tubes and of pipettes used for transference, but they indicate very clearly indeed that the lysin is not significantly concentrated on or within the cells, (b) The cells thrown down in the above experiments haemolyse very slowdy when the supernatant fluid has been removed, thus showing that the lysin in the supernatant fluid is involved in the lysis, (c) The sudden dilution of a haemolytic system with saline, at any stage of the lytic process, delays haemolysis, as it should do, by reducing the concentration of free lysin. All these experiments indicate that no measurable concentration of lysin occurs on or in the cells, and the results, together with the recognition of the fact that haemolysis by acids and bases require a special treatment wdiich allows for osmotic effects, justify us in setting aside Christophers’ interpretations.
(iii) I t is possible that the fundamental reaction, while being one in which the velocity is a function of the quantity of free lysin, is a reaction of more than the first order. This may occur in the following way. Suppose that the lysins concerned are not perfectly dispersed, but that they exist in the form of aggregates of molecules of varying sizes, as may be expected from their semi- colloidal nature. Then an aggregate of 1, 2, 3, ... molecules may react with each molecule of the cell component S, and if each such molecule of S requires the interaction of a number of lysins (say, 6, for example) it may obtain them by 6 additions of aggregates of 1, 3 additions of aggregates of 2, 2 additions of aggregates of 3, one addition of an aggregate of 6, or any one of a number of combinations of these possibilities. If, for example, the lysin existed in aggregates of 6 only, then the expression
dx/dt = k (c — x)would describe the velocity of the reaction, as in (1), but if it existed in aggregates of 3 only, then
dxjdt = k(c — )2would express the velocity. Thus, in general, if the lysin were to exist in aggregates of varying numbers, we should have the velocity given by
dxjdt = k(c — x)n, (4)whence, if 1/p = n,
kt = " f — l \ c P (c “ ®) j >(5)
on May 28, 2018http://rspb.royalsocietypublishing.org/Downloaded from

516 E. Ponder and Ji F. Yeager.
in which nor 1/p would be the value of the ratio (mean number of combining molecules)/(mean number of molecules per aggregate), and would have a meaning somewhat similar to that of the index n in Hill’s equation for the dissociation of oxyhsemoglobin. The value of n, moreover, would in general be greater than unity, and would not, as a rule, be a simple integer.
Whether the manner of its derivation is correct or not, expression (5) has been found to describe closely the time-dilution curves of all the simple haemolysis examined. In the case of the particular example given above, for instance, it provides the calculated time t shown in the last column, and these agree very closely with the experimental times over the entire range of the curve. The values assigned to the constants in this case were x = 24-4 microgrammes, n = 1 • 8 and k = 0 • 005952. Other instances of the applicability of the expression will be given later on.
Considering next the percentage haemolysis curves, it will be clear that these must be described by the simultaneous solution of (5) and (3), instead of (2) and another expression similar to (3), which may be called (3a), if the modification of theory is to hold. I t would seem at first sight an easy matter to decide whether this is so or not. Provided, however, that we restrict ourselves to the investigation of the percentage haemolysis curves for dilutions of lysins which complete lysins in 30 minutes or less, it is by no means easy (for technical reasons, among others) to detect the inadequacy of expressions (2) and (3a). This is best illustrated by giving a number of experimental and calculated
Fig. 2.—Integrals of frequency distributions, human red cells and saponin. For explanation see text. The upper scale on the abscissa applies to curve A, the lower scale to curve B.
on May 28, 2018http://rspb.royalsocietypublishing.org/Downloaded from

percentage haemolysis curves corresponding to the time-dilution curve used as an example above.
First we shall tabulate the data for the dilutions 1 in 30.000, 1 in 40,000, and 1 in 50,000. P is the percentage lysis observed at various times t. P (5) (3) indicates the percentage lysis calculated from expression (5) with x = 24-4, n = 1 • 8, and k = 0 • 005952, together with a frequency integral described by expression (3), shown in fig. 2, A. P (2) (3a) is the percentage lysis calculated from expression (2) with x = 39-0 and k = 0-03125, together with a frequency integral shown in fig. 2, B, and described by an expression, denoted by (3a), of the same general type as (3).
Action o f Simple Hcemolysins. 517
1 in 30,000.
t .................................. 0-5 1 0 1-5 2-0 2-5 3 0p .................................... 2 55 80 91 96 99P<5)(3) ........................ 2 54 83 93 97 99P (2 ) (3a) ........................ 0 25 64 85 94 99
1 in 40,000.
t .................................. 1 0 1-5 2-0 2-5 4 0 5-0P .................................. 7 37 65 75 95 98P(5)(3) ...................... 9 40 64 78 95 98P (2) (3a) .................. 6 25 55 72 93 98
1 in 50,000.
t ................................. 2-0 3 0 4 0 5-0 8-0 10-0P ................................. 16 55 75 85 95 99P(5)(3) ...................... 17 57 76 86 96 98P (2)(3a) ...................... 17 57 76 86 96 98
The curious thing about these percentage haemolysis curves is that, with the exception of the italicised observations, the values of P obtained could be used to support either the combination of (5) and (3) or of (2) and (3a), the sole difference being that the frequency curve used in conjunction with (5) would be more symmetrical than that used in conjunction with (2), as may be seen from fig. 2, in which the integrals of the two distributions are shown. Thus, to decide whether expressions (5) and (3) are preferable to expressions (2) and (3a) we would first have to decide that the frequency integral described by (3) is preferable to that described by (3a). This we cannot do on any a priori grounds.
Such comparatively restricted observations as these, accordingly, do not clearly indicate that the theory adopted in previous papers is inferior to the
on May 28, 2018http://rspb.royalsocietypublishing.org/Downloaded from

518 E. Ponder and J . F. Y eager.
present modification. Further, it is to be remembered that, in practice, even the italicised discrepancies might not arouse suspicion, for the curves rise very steeply, and quite a small error in timing either the commencement of the reaction or the moment of the reading would go far in the direction of abolishing them. In view of the fact that the galvanometer reading is not instantaneous, this is a very significant point.*
The percentage haemolysis curves for the higher dilutions, however, show that expressions (2) and (3«) must be rejected in favour of (5) and (3).
1 in 60,000.
t ................................. 2-0 3-0 4 0 5-0 6-0 10-0p ................................. 6 25 47 65 74 92P(5)(3) ...................... 5 23 44 63 75 93P (2) (3a) .................. 6 32 50 67 75 91
1 in 70,000.
t ..............................1 3-0 4-0 5-0 7-0 9-0 20-0P ................................. 1 23 44 68 30 95P (5) (3) ...................... ! 6 22 39 67 80 96P (2) (3a)......................S 15 36 49 66
1 in 80,000.
t ................................. 4 0 5-0 6-0 7-0 8-0 10-0P .................................. 5 17 32 40 51 64P(5)(3) ...................... 7 17 30 42 53 67P (2) (3a)...................... .... 15 40
None of the italicised observations could be accounted for by assuming a first-order reaction occurring in a heterogeneous population, identical to that postulated in the case of the higher concentrations, but all are consistent with the idea of the fundamental reaction being of the type expressed by (5) and the integral of the distribution of resistances being as shown in fig. 2, A.
* The discrepancies might not arouse suspicion for another, and perhaps more important reason, viz., that photometers embodying selenium or potassium cells are apt to be unreliable, as opposed to merely inaccurate in the sense that each reading has a considerable attached error. By this we mean that, although the apparatus may have, say, ± 3 per cent, error when working efficiently, this efficient working is dependent on so many factors, and may fall off so suddenly, that a very much larger error attaches to each reading if all possibilities of variation are to be allowed for. This unreliability naturally gives rise to a lack of confidence in the results, and one is always inclined to attribute unexpected observations to error, even if the discrepancies exceed the error which the method is known to possess when working efficiently.
on May 28, 2018http://rspb.royalsocietypublishing.org/Downloaded from

Action o f Simple 519
Before leaving this example, it must be emphasised that the question of the most usual form of the frequency distribution of resistances is by no means disposed of. The correct distribution in the case of the above example presents a considerable negative skewness ; in certain other cases, however, the distribution is much more symmetrical. Except for remarking that the form of the distribution is not only different in different animals, but also in members of the same species, little can be said until more extended observations are made, although the evidence at present points to an asymmetrical distribution with a negative skewness being the most common form. Some such cases are mentioned in (3). The distributions given by Kesten (6) and by Kesten and Zucker (4), if properly analysed, are negatively skew, although not nearly so skew as the former author thinks, nor as skew as the distribution whose integral is shown in fig. 2, A ; most of the distributions given by Orahovats (7), on the other hand, are fairly symmetrical. Perhaps the most important point to be mentioned at present is that the use of a combination of two expressions such as (2) and (3a), in place of two such as (5) and (3), always results in the deduced distribution being more positively skew than the true distribution, especially if the value of n is high, i.e.,a negatively skew distribution appears more symmetrical, and a symmetrical distribution appears positively skewr. The apparent symmetry of some of the curves reported in (3) may be due to this fact, and it is quite possible that a Pearsonian curve of type IV may always be necessary to describe the distribution of red cell resistances.
The above example illustrates excellently the reasons for considering the “ fundamental reaction ” to be a reaction of the nth order rather than one of the first order only, and it now remains, before passing to the consideration of the factors which bring about a variation in the value of to describe the simplest method whereby the value of the three constants in (5) can be found. The procedure is best illustrated by an example. Suppose, for instance, that we require to find the value of the constants for the following experimental time- dilution curve for saponin :—'
s. t. S. t.
10,000 0-75 00,000 14-320,000 1 0 70,000 47-030,000 2 1 80,000 00-040,000 3-8 90,000 180 050,000 9-7 100,000 600-0
on May 28, 2018http://rspb.royalsocietypublishing.org/Downloaded from

520
The first step is to assign a value to x, the position of the asymptote. This is done by inspection, and in this case we can tentatively put x 19-8 ; this corresponds to a dilution of 1 in 101,000, and S — 101,000 is the highest ordinate of the curve. This ordinate is now regarded as 100 per cent, (much in the same way as we speak of the highest ordinate of an oxyhsemoglobin dissociation curve as 100 per cent.), and we proceed to find values of $ which correspond to 12-2 per cent., 24-4 per cent., 36-6 per cent., ... 97-6 per cent., as in the tables below.* The times corresponding to each such value of S is now read ofi from the plotted time-dilution curve, and the results appear in the first three columns of the following table :—
E. Ponder and J . F . Yeager.
Per cent. P. ! Dilution. t. t for 85 • 4 per cent. t for P per cent.
12-2 12,322 0-25 460-024-4 24,644 1-4 82-136-6 36,966 3-3 34-848-8 49,288 7-7 14-961-0 61,610 17-0 6-7673-2 73,932 41 0 2-885-4 86,254 115 1-097-6 98.576 500 0-23
100-0 101,000 co —
The next step is to calculate the last column of the table, by dividing the time corresponding to 85 • 4 per cent, by the times for each of the other values of P. These values are then compared with the values in the horizontal columns of the following table, which show the values of the ratio ( for 85*4 per cent.)/p for P per cent.) for the above value of P, and for all the values of from 1 - 0 to 3-0.
* These particular values of P (12-2, 24*4, etc.) are used rather than values at more obvious intervals ( e.g ., P = 10, 20, etc.) merely because we carried out our first complete calculations for the former.
on May 28, 2018http://rspb.royalsocietypublishing.org/Downloaded from

Action o f Simple Hcemolysins. 521
P, per cent.
n 12-2 24-4 36-6 48-8 61-0 73-2 85-4 97-61-0 14-4 6-80 4 1 3 2-83 1-87 1-43 1 0 0-5061 1 18-6 9-50 4-77 3-08 2-25 1-52 1 0 0-4601-2 26-1 10-4 6-27 3-67 2-42 1-61 1 0 0-4121-3 35-4 131 6-86 4-14 2-63 1-70 1 0 0-3661-4 47-8 161 8-10 4-73 2-88 1-76 1 0 0-3191-5 65-1 20-0 10-4 5-37 3 1 7 1-88 1 0 0-2741-6 87-6 24-9 11-5 611 3-49 1-97 1-0 0-2391-7 116 31-6 13-8 7-02 3-96 2 1 3 1 0 0-2061-8 158 40-1 16-3 8-03 4-24 2-21 1 0 0-1741-9 237 49-9 19-5 9-23 4-65 2-32 1 0 0-1452-0 290 63-5 23-6 10-6 5-20 2-48 1 0 0-1242-1 393 79-8 28-3 12-4 5-75 2-63 1-0 0-1052-2 555 100 34-3 14-3 6-42 2-80 1 0 0-0882-3 747 129 41-4 16-5 7-16 2-98 1 0 0-0742-4 1064 162 50-0 20 0 7-94 3 1 7 1 0 0-0612-5 1442 211 61-2 22-5 8-91 3-40 1 0 0-0512-6 2004 267 74-5 26-1 10-0 3-64 1 0 0-0432-7 2696 344 90-0 31-0 11-3 3-89 1 0 0-0352-8 3863 499 111 36-7 12-7 4-17 1 0 0-0292-9 5308 569 136 42-5 13-8 4-45 1 0 0-0243 0 7929 793 168 50-4 15-9 4-78 1 0 0-019
The best agreement is seen to be in the column for n — 2 • 2, which is accordingly selected as a sufficiently good value for this constant. We can now find how well the theoretical curve will fit the experimental values, by assuming that the point § = 86,254, P = 85*4, t = 115 is correct, and then calculating the values of t from the theoretically correct values of the ratios shown in the column for n = 2 *2 in the table. This gives the following :—
P. 8 . Ratio for «.=2-2. ty calculated. t, experimental.
12-2 12,322 555 0-21 0-2524-4 24,644 100 11 5 1-436-6 36,966 34-3 3-35 3-348-8 49,288 14-3 8-0 7-761-0 61,610 6-42 17-9 17-073-2 73,932 2-80 41-0 41-085-4 86,254 1-00 115-0 115-097-6 98,576 0-088 1307-0 500-0
100-0 101,000 — oo 00
With the exception of the value of the point for § = 98,576, situated at the extreme of the curve, the calculated and experimental values show a very close agreement, the greatest difference being only 0 • 9 minute. The discrepancy at the extreme end of the curve, however, may be disregarded in considering whether the fit is satisfactory or not, for the calculated value of this last point is extremely sensitive to changes in the value of x, while the experimental
VOL. cvi.—b . 2 Q
on May 28, 2018http://rspb.royalsocietypublishing.org/Downloaded from

522 E. Ponder and J . F . Y eager.
value is apt to be unreliable ; a discrepancy, accordingly, is to be expected, and can often be lessened by recalculation with a slight change in the value of x. The recalculation, in a case such as this, would not be undertaken without some special reason.
The last step in the fitting process is to find the value of This is done by inserting the values t = 115, x = 19-8, c = 23*19, and = 1/2-2 in (5) andsolving for k. In this case the value found is 0-0015.
III. Variations in n.
The most important modification of the previous theory which has been made in this paper is the recognition that an expression of the wth order is more applicable to the “ fundamental reaction ” than is an expression of the first order, and it is therefore of particular interest to define the conditions under which changes in the constant n occur. Such conditions are doubtless very numerous, and their study as yet has been barely begun ; four points, however, can be briefly mentioned : (a) the value of n obtained with different lysins ; (b) the value obtained when different kinds of red cell are hsemolysed by the same lysin; (c) the effect of temperature ; and (d) the effect of the addition of various substances to the haemolytic system.
(а) Under comparable conditions there appears to be a value of n typical of the lysin employed. When a standard suspension of human cells is used, for example, the value of n, at 25°, usually lies between 2 • 0 and 2 • 4 for saponin, between 1-5 and 1*8 for sodium taurocholate, and between 1-0 and 1-5 for sodium oleate. The values vary somewhat with different specimens of the lysins, e.g., we have in this laboratory two specimens of saponin, one of which gives a value of nof 1-8 with human blood, and the other of which gives a value of 2-2. In the case of the bacterial lysins, on the other hand, the value of n appears to be more nearly unity than in the case of most lysins examined.
(б) The results of a comparatively few observations indicate that even with the same lysin, e.g., saponin, the value of n depends to some extent on the type of cell used in the haemolytic system. In the case of saponin the variations seem to be small, at least where the observations are restricted to the cells of the ordinary laboratory animals. This follows at once from the fact that, although the asymptotes of the time-dilution curves vary considerably, the curves themselves do not cross, as they would necessarily do if n were to vary also (8). The cells of the camels, however, seem to constitute rather a special case, for Loo (9) finds that they are excellently fitted up to times as long as 70 minutes by expression (2) ; even if the use of (5) is preferable, n cannot be
on May 28, 2018http://rspb.royalsocietypublishing.org/Downloaded from

523
greater than about 1*3, or it would be impossible to obtain such a good fit over so great a range. The saponin time-dilution curves for chicken blood, on the other hand, although fitted over a limited range by expression (2) (10), are best fitted by expression (5) with a value of n of about 2-0 ; the same remark applies to curves for reptilian cells, and so it appears that the fundamental reaction is quite generally of the nth order.
In the case of sodium taurocholate, however, appears to vary considerably when the lysin acts on different cells, for the time-dilution curves for the cells of different animals cross very frequently, even though the position of the asymptotes varies less than in the case of saponin (8, 11).
(c) A full description of the way in which simple haemolytic systems behave with temperature will be found elsewhere (12) ; in the meantime it is necessary to mention only the effect on the constant n. In systems containing saponin or sodium taurocholate, this constant significantly increases with temperature ; in a system containing human red cells and the former lysin, for example, n — 1 • 3 at 5°, 1 • 4 at 10°, 2 • 4 at 25°, 2 • 6 at 30°, and about 3 • 0 at 35°. In the case of the latter lysin the increase with temperature is not so striking, but a change nevertheless occurs from about 1-1 at 5° to more than 2*0 at 35°. If the meaning given above to nis correct, this increase might result either from a diminution in the state of aggregation of the lysin or from a modification of the properties of the cell component which reacts with the lysin ; further investigation, however, is required before any explanation of the result can be given.
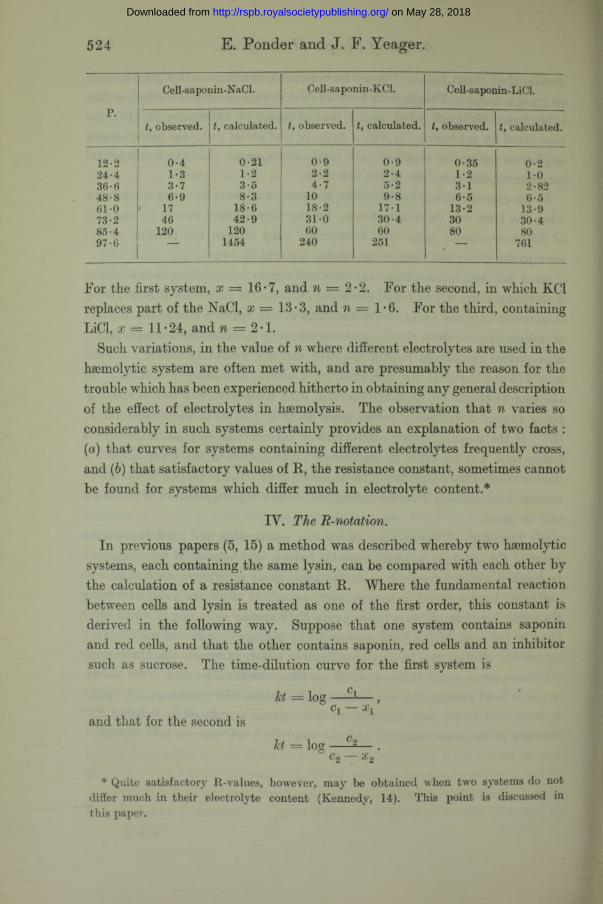
(d) The effect of the addition of various accelerators and inhibitors on the value of the constant n is very variable indeed, and no general conclusion can be reached without extensive investigation. Some substances, such as glucose and other sugars, seems to have scarcely any effect at all, the value of n being the same, for example, in a cell-saponin-NaCl system as in one in which more than 50 per cent, of the NaCl is replaced by glucose. Other substances, such as certain electrolytes, have a considerable effect, of which the three time- dilution curves given below provide an illustration. The first is for a cell- saponin-NaCl system, the second for a cell-saponin-KCl system (in which the 0-8 c.c. of 0-85 per cent. NaCl of the first system is replaced by 0-8 of a KC1 solution of the same tonicity), and the third for a cell-saponin-LiCl system.
Action o f Simple Hcemolysins.
2 q 2
on May 28, 2018http://rspb.royalsocietypublishing.org/Downloaded from
524 E. Ponder and J . F. Y eager.
Cell-saponin-NaCl. Cell-saponin-KCl. Ceb-saponin-LiCl.
p.t, observed. t, calculated. t, observed. ty calculated. ty observed. ty calculated.
12-2 0-4 0-21 0-9 0-9 0-35 0-224-4 1-3 1-2 2-2 2-4 1-2 1 036-6 3-7 3-5 4-7 5-2 3 1 2-8248-8 6-9 8-3 10 9-8 6-5 6-561-0 17 18-6 18-2 171 13-2 13-973-2 46 42-9 31-0 30-4 30 30-485-4 120 120 00 60 80 8097-6 — 1454 240 251 — 761
For the first system, x = 16*7, and n — 2*2. For the second, in which KC1replaces part of the NaCl, x = 13-3, and = 1*6. For the third, containing LiCl, x = 11-24, and n = 2-1.
Such variations, in the value of n where different electrolytes are used in the haemolytic system are often met with, and are presumably the reason for the trouble which has been experienced hitherto in obtaining any general description of the effect of electrolytes in haemolysis. The observation that n varies so considerably in such systems certainly provides an explanation of two facts : (a) that curves for systems containing different electrolytes frequently cross, and ( b)that satisfactory values of R, the resistance constant, sometimes cannot be found for systems which differ much in electrolyte content.*
IY. The R
In previous papers (5, 15) a method was described whereby two haemolytic systems, each containing the same lysin, can be compared with each other by the calculation of a resistance constant R. Where the fundamental reaction between cells and lysin is treated as one of the first order, this constant is derived in the following way. Suppose that one system contains saponin and red cells, and that the other contains saponin, red cells and an inhibitor such as sucrose. The time-dilution curve for the first system is
Jet = log - - 1— ,ci xi
and that for the second isJet = log ■ c«— .
C 2 # 2
* Quite satisfactory R-values, however, may be obtained when two systems do not differ much in their electrolyte content (Kennedy, 14). This point is discussed in this paper.
on May 28, 2018http://rspb.royalsocietypublishing.org/Downloaded from

Action o f Simple Hcemolysins. 525
The method is to compare concentrations which take equal times to produce lysis, and so we have
Now suppose that the saponin-cell-sucrose system is R times as resistant as the saponin-cell system, i.e., that R times as much lysin is needed to produce the same result. Then xx = Rx2, and so
log Clq Rir2
from which it follows thatCi — Rc2,
( 6)
(7)
and that the result of plotting cl5 any concentration of lysin in the saponin- cell-sucrose system, against c2, the concentration which produces lysis in the same time in the saponin-cell system, will be a straight line with a slope of R. This line, moreover, will terminate in a point where cx = xx and c2 = The fact that this linear relation exists has been confirmed by a number of observers, and the above method of finding the resistance constant has been used not only in most of our own investigations, but also by Kennedy in his study of the effect of electrolytes (14), by Bodansky in his researches on the effect of pH (16), and by Loo (9) in his paper on the blood of the camels. I t is accordingly very important to find the way in which (7) is modified when expression (5) is used to describe the time-dilution curves instead of expression (2), and when the position of the asymptotes is determined from observations lasting many hours instead of from observations lasting only 20 or 30 minutes.
Under these circumstances, the true asymptotes, which we shall call xx and x.{, will correspond to considerably higher lysin dilutions than do the “ asymptotes ” xx and x2, which correspond very nearly to the dilutions of lysin which take about 30 minutes to complete haemolysis. As before, xx = Ra^', but (6) now requires to be replaced by
( c 2~ x 2r)m~ c 2m = - R ~ cim, (8)
where m — (p — 1) /p.When m is not an integer (i.e., when n or p are not integers), an expression
similar to (7) cannot be readily obtained from (8), but the general effect of the substitution of the reaction of the nth order for the reaction of the first order
on May 28, 2018http://rspb.royalsocietypublishing.org/Downloaded from

526 E. Ponder and J . F. Y eager.
can be seen from the expressions which correspond to (7) when m — 1-0 and 2*0 respectively. In the first case n — 2 and
cx — hCg . c2 —Cj_ - '
In the second case = 3, and
Cj — Rc2 • ( ^ Cl x \ ) ( c 2 ^ 2 ) 2
(2c2 x 2 )(<q
(9)
( 10)
When the reaction is of a higher order than the first, accordingly, the relation between cx and c2 is represented, not by a straight line with a slope of R, butby a very flat curve in which cx is generally less than Rc2; only at the point in which the curve terminates ( i.e., where cx — and c2 = x2r) does this simplerelation hold, for at all other points the relation between cx and c2 is a function of the difference of these concentrations from the concentrations at the asymptotes of their respective curves, as well as of the order of the reaction, e.g., of the ratio (c2 — a?2')/(c1 — xx ), where = 2.
The importance of these facts is (a) that all values of R hitherto obtained, since they have been calculated from observations restricted to about 30 minutes, require to be revised, but (6) that since the values and c2 obtained when t = 30 minutes (about) bear an approximately constant relation to the values which would be obtained when t = 300 minutes the values of R hitherto obtained probably deviate from the true values in an approximately constant manner. The reason for the existence of this approximately constant relation is not difficult to appreciate if an actual example is considered. Consider two time-dilution curves described by (5), in one of which a cell-saponin system x = 20 microgrammes, and in the other of which a cell-saponin-aspartic acid
system x = 10 microgrammes. In each, and k = 0-01. The followingtable shows tx and t2 the times for complete lysis in the two systems respectively:
8. tv 8. tv 12*
10,000 0-6 0-2 80,000 160 2720,000 2-5 1 0 90,000 400 3830,000 6-5 2 0 100,000 — 5040,000 130 5-0 120,000 — 9150,000 25-0 8-0 140,000 — 16360,000 45 0 130 160,000 320
By plotting the curves and reading off values of cx and c2 corresponding to equal values of t, we obtain the following table :—
on May 28, 2018http://rspb.royalsocietypublishing.org/Downloaded from

Action o f Simple Hcemolysins. 527
t. cv Cg« Cl / C2*
0-6 200 0 1250 1-6025 100 0 62-5 1-606-5 66-6 43-5 1-53
13 50 0 33-3 1-5025 400 26-0 1-5345 33-3 20-8 1-60
160 250 14-3 1-74320 22-7 12-5 1-82
oo 20 0 100 2-00
These values of c1 and c2 are plotted against each other in fig. 3, A, and can be seen to lie on a curve so flat as to be almost a straight line. This curve
Fig. 3.—For explanation see text.
terminates where cx = x{ = 20, and c2 = = 10, i.e., the value of R in (9)is x{\x2 =2*0, and calculation will show that cx is always related to c2 inthe manner described by (9). If observations are restricted to the first 20-40
on May 28, 2018http://rspb.royalsocietypublishing.org/Downloaded from
528 E. P onder and J . F. Y eager.
minutes, on the other hand, and if (7) is used on the supposition that = 1, the points will be supposed to lie on a straight line whose slope is approximately 1-6, and this value will be assigned to R in (7), whereas the true value, obtained from the true asymptotes xx and is 2-0. Provided the observations are so restricted, however, expression (7), with a value of R of 1*6 will describe the results excellently, except that account will require to be taken of the intercept on the c2 axis, expression (7) being replaced by cx = R (c2 — &), which, to avoid confusion, we shall now write
C1 == C' (C2 )̂> (11)
and the value 0*002 being assigned to k The straight line drawn through the points derived from this limited range of observations, however, does not pass through the point where cx = 20 and c2 = 10, but terminates in a point corresponding to the two supposedly asymptotic concentrations, i.e., two concentrations a little less than those which produce lysis in a time of from 20 to 40 minutes. In this case the terminal point would be where = 30, c2 = 20, from which c = c2/c2 = 1*5, approximately the same value as for the slope of the line.
This example will serve to illustrate three general conclusions which can be drawn from it and similar cases :—
(i) If observations are restricted as they have been in all previous investigations, and if the time-dilution curves are treated as those resulting from a first order reaction, instead of from a reaction of a higher order, the value of R (or of C) obtained when the two systems are compared by plotting against c2 is always less than the true value. I t is impossible, however, to say how much less the resistence will appear, for the straight line drawn through the experimental points really passes through points which fall on a curve ; its slope, accordingly, has very little real meaning, for if it passes very closely through the points in one part of the experimental range, it must pass less closely through points in other parts, its exact position, in fact, being rather arbitrarily susceptible of adjustment. The values of R obtained in previous investigations are thus certainly too small, but the general validity of arguments based on the values nevertheless remains much the same, for a detailed investigation would probably show that C, the slope of the line drawn through the values of cx and c2 for the limited range, is quite a simple function of R, the relative resistance of the system as judged by the ratio of the true asymptotes of their time-dilution curves. Comparison of expressions (7) and (9), indeed, suggest that, when n = 2, R is approximately proportional to C2.
on May 28, 2018http://rspb.royalsocietypublishing.org/Downloaded from

Action o f Simple Hcemolysins. 529
(ii) The fact that the plotting of cx against c2 results in a flat curve where the fundamental reaction is of a higher order than the first accounts for the appearance of the small intercept k referred to in expression (11). This constant has always been treated as an empirical constant, and an attempt has been already made to show that it might arise from the relation between c1 and c2 not being truly linear (5) ; the above consideration, however, makes the lack of linearity quite clear, and shows that the constant k arises as a result of using a straight line to approximate to the curve.
(iii) I t has always been difficult to explain the fact that, even when great quantities of an inhibitor or an accelerator are used in a haemolytic system, the value of R found, by treating the lytic reaction as one of the first order and using expression (7) or (11), is never greater than about 3-0 or less than about 0-3, i.e., added substances appear unable to vary the resistance more than tenfold, whereas a much greater variation might reasonably be expected (13, 15). An extreme case arises when glucose is used as an inhibitor, for, if a system containing 2*0 c.c. of 0 8 5 NaCl has a resistance of unity, a system containing 1-959 c.c. of isotonic glucose and only 0-041 c.c. of 0-85 NaCl has an R value of 3 • 0 ; a system containing no electrolyte at all, on the other hand, has probably an infinite resistance, and one would expect the removal of 98 per cent, of the electrolyte to result in the resistance being increased more than three times. I t has been shown above, however, that the values of R obtained in these earlier investigations are too low ; the effect of added substances must, therefore, be greater than has been supposed, and it is probable that, when the investigations are repeated by improved methods, the hitherto inexplicable failure of most substances to alter the resistance more than slightly will be shown to be due to the use of a faulty method of analysing the results.
Finally, there remains to be considered a case which has been already mentioned, in which the addition of an accelerator or an inhibitor to a haemolytic system alters both the resistance of the system (as judged by the position of the asymptote) and the order of the reaction, i.e., the value of Under these circumstances, unless the change in the value of n is quite small, the linear, or almost linear, relation between cx and c2 disappears altogether, and cx is related to c2 by a curve. Such a curve is shown in fig. 3, B, the data being derived from the experiment, quoted earlier in this paper, in which NaCl is replaced in a haemolytic system by KC1. The effect of the replacement is to decrease the resistance of the system from unity to 0 • 83, and at same time to change the value of n from 2 • 2 to 1 • 6 ; as a result, the relation between cx and c2 is curvilinear, and such that it would be impossible to draw any straight
on May 28, 2018http://rspb.royalsocietypublishing.org/Downloaded from

530 E. Ponder and J . F. Yeager.
line which would pass even approximately through the points. This at once indicates that the value of n has changed ; indeed, if a straight line can be drawn through the points with reasonable accuracy, and a.reasonably constant value of R obtained therefrom, one may be certain that no great variation in n has occurred.*
As may be judged from the frequency with which satisfactory R-values are obtained when accelerators and inhibitors are added to haemolytic systems, extensive changes in the order of the reaction are not very common. The addition of electrolytes may bring about such changes, as has already been mentioned, but perhaps the best example of the failure to obtain R-values as a result of a change having occurred in the value of n is the case in which an attempt is made to compare haemolytic systems at different temperatures. In such cases the relation between cx and c2 is usually curvilinear, and no value can be assigned to the resistance constant except by expressing the value of x1jx2 obtained from the position of the asymptotes.
Y. Summary.
When the kinetics of simple haemolytic systems containing saponin, sodium taurocholate, or other simple lysins, together with washed mammalian red cells, are investigated by improved methods which are described in this paper, the results are found to be best described by an expression of the wth order instead of by one of the first order (“ monomolecular ”), taking place in a population of cells whose resistances are distributed according to one or another type of frequency curve. The first order reaction which has hitherto been postulated describes the result quite well over the limited range which has been investigated hitherto, but is based on assumptions which are seen to be wrong when the experimental range is sufficiently extended.
The value of n determining the order of the reaction which is now supposed to be proceeding varies between about 1*0 and about 3*0, the most usual values, at ordinary temperatures, being between 1*5 and 2-0. The value of n varies, however, with the nature of the lysin, with the temperature, and probably with the type of cell, and is also affected by the addition to the haemolytic system of some accelerators and inhibitors. I t is tentatively suggested that the value of this constant is determined by the lysin existing in aggregates of varying size, and by the lysin reacting with some cell component, the molecules of which present varying affinities for the lysin molecules ;
* If the change in n is very great, the relation may appear linear once more, but the slope and position of the line are such as to show immediately what has occurred.
on May 28, 2018http://rspb.royalsocietypublishing.org/Downloaded from

Action o f Simple Hcemolysins. 531
even if this suggestion proves to be incorrect, however, the equation developed from it are useful in that they provide a very complete description of the phenomena.
The type of frequency curve which describes the distribution of red cell resistance to the lysin is probably always negatively skew, the degree of skewness, however, varying considerably. In previous papers the distribution has been supposed, in many cases at least, to be of a symmetrical type, but it is probable that this symmetry is spurious, and the result of treating the reaction between cells and lysin monomolecular, when it is really of a higher order.
While the treatment of the reaction between cells and lysin as one of a higher order than the first constitutes quite a fundamental change in the theory of the kinetics of simple hemolysins, it is shown that the conclusions of most previous investigations require no essential modification. On the other hand, quite a number of observations, inexplicable on the previously adopted theory, become readily explicable on the newer hypothesis.
REFERENCES.
(1) Ponder, ‘ Roy. Soc. Proc.,’ B, vol. 95, p. 42 (1923).(2) Ponder, ‘ Roy. Soc. Proc.,’ B, vol. 95, p. 382 (1923).(3) Ponder, ‘ Roy. Soc. Proc.,’ B, vol. 101, p. 193 (1927).(4) Kesten and Zucker, ‘ Amer. J. Physiol.,’ vol. 87, pp. 263-281 (1928).(5) Ponder, ‘ Roy. Soc. Proc.,’ B, vol. 100, p. 199 (1926).(6) Kesten, ‘ Amer. J. Physiol.,’ v61. 91, p. 1 (1929).(7) Orahovats, ‘ J. Physiol.,’ vol. 61, p. 447 (1926).(8) Ponder, Yeager & Charipper, ‘ Quart. J. Exp. Physiol.,’ vol. 19, pp. 181 and 273
(1928-29).(9) Loo, ‘ Chinese J. Physiol.,’ vol. 3, p. 325 (1929).
(10) Shattuck, ‘ J. General Physiol.,’ vol. 12, p. 17 (1928).(11) Yeager, ‘ J. General Physiol.,’ vol. 9, p. 779 (1928).(12) Ponder and Yeager, ‘ J. of Exp. Biology ’ press).(13) Yeager, ‘ Quart. J. Exp. Physiol.,’ vol. 19, p. 219 (1929).(14) Kennedy, ‘ Biochem. J.,’ vol. 19, p. 318 (1925).(15) Ponder, ‘ Roy. Soc. Proc.,’ B, vol. 99, p. 461 (1926).(16) Bodansky, ‘ J. Biol. Chemistry,’ vol. 82, p. 567 (1929).(17) Christophers, ‘ Indian J. Med. Research,’ vol. 17, p. 533 (1929).(18) Bodansky, ‘ J. Biol. Chemistry,’ vol. 79, p. 229 (1928).(19) Hampson and Maizels, * J. Physiol.,’ vol. 63, p. 1 (1927).
on May 28, 2018http://rspb.royalsocietypublishing.org/Downloaded from