the use of passive integrated transponder (pit) tags as a ... reports/pit tag symposium... · idaho...
TRANSCRIPT

Assessing the use of PIT Tags as a Tool to Monitor Adult Chinook
Salmon Returns to Idaho
John CassinelliRegional Fisheries Biologist
Idaho Department of Fish and Game
PSMFC PIT Tag WorkshopStevenson, WA
January 25 – 27, 2011

Chinook PIT Tagging• Since 2006, IDFG has been increasing PIT tagging
numbers in an effort to have a representative group of tagged fish in each Chinook release
Hatchery Release SiteBY 2009 # PIT
Tagged ChinookClearwater Clear Creek 17,100
Crooked River 22,200
Powell Pond 17,100
Red River 12,000
Selway River 17,100
McCall SF Salmon River 52,000
Pahsimeroi Pahsimeroi River 21,400
Rapid River Rapid River 52,000
Sawtooth Upper Salmon River 21,400
Total PITs 232,300

Chinook PIT Tagging• Since 2006, IDFG has been increasing PIT tagging
numbers in an effort to have a representative group of tagged fish in each Chinook release
• The purpose of this increase in tags is to generate stock-specific SARs back to Lower Granite Dam

Chinook PIT Tagging• Since 2006, IDFG has been increasing PIT tagging
numbers in an effort to have a representative group of tagged fish in each Chinook release
• The purpose of the increase in tags is to generate stock-specific SARs back to Lower Granite Dam
• However, other benefits include the ability to generate stock and age specific:– In-season return estimates
– Inter-dam conversion rates
– Run timing over dams
– Fallback / reascension rates
– After – hours passage rates

• Since 2009, PIT detections have been monitored throughout the adult return at Bonneville, McNary, Ice Harbor, and Lower Granite dams
Tag Monitoring
• Since 2009, PIT detections have been monitored throughout the adult return at Bonneville, McNary, Ice Harbor, and Lower Granite dams
• Detections of Run-At-Large (monitor mode) tags in returning fish are used to generate in- and post-season return estimates, by hatchery, release site, and age
• These expanded return estimates are then combined, by brood year, to generate stock specific SARs
Tag Monitoring

Other Benefits - In Season Return Estimates
Release Group 2010 Granite Pre-Season Adult Forecast
Final Lower Granite Adult Estimate
Dworshak 8,729 3,735
Kooskia 1,691 3,666
Selway 2,496 1,632
Powell 2,496 729
SF Clearwater 3,726 3,758
Total Clearwater R. 19,138 13,520Rapid River 76,153 22,038
Sawtooth 1,644 762
Pahsimeroi 9,775 5,196
McCall SFSR 31,755 10,275
Total Salmon R. 119,327 38,271
TOTAL 138,465 51,791

• This monitoring also provides more robust stock and age specific data for:
– Inter-dam conversion rates
Other Benefits – Inter-Dam Conversion Rates
Hatchery Release Site
Adults From Bonneville To: Jacks From Bonneville To:
McNaryLower
GraniteMcNary
Lower Granite
Clearwater SF Clearwater River 75.0% 74.5% 100.0% 83.3%
Clearwater Powell Pond 74.1% 71.6% 87.5% 71.2%
Clearwater Selway River 75.0% 68.1% 100.0% 100.0%
McCall SF Salmon River 75.7% 72.5% 96.6% 94.8%
Pahsimeroi Pahsimeroi Hatchery 82.0% 79.7% 100.0% 91.7%
Rapid River Rapid River Hatchery 73.8% 67.9% 100.0% 90.0%
Sawtooth Sawtooth Hatchery 88.9% 88.3% 100.0% 100.0%
AVERAGE 77.8% 74.7% 97.7% 90.1%

• This monitoring also provides more robust stock and age specific data for:
– Run timing and vulnerability to / availability for downriver fisheries
Other Benefits – Run Timing
0%
10%
20%
30%
40%
50%
60%
70%
80%
90%
100%
110%
Perc
ent o
f Run
LGD Arrival Date
SF Salmon RiverPahsimeroiSawtoothPowellSF ClearwaterSelwayRapid River

• This monitoring also provides more robust stock and age specific data for:
– Fallback / reascension rates at each dam
Other Benefits – Fallback/Reascension
Lower Granite Dam ADULTS (2- and 3-Ocean) JACKS (1-Ocean)
Release LocationPITs at
LGDFallback /
ReascensionPercent
PITs at LGD
Fallback / Reascension
Percent
Clear Creek NA NA NA 25 2 8.0%
Crooked River 37 4 10.8% 6 0 0.0%
Powell Pond 26 2 7.7% 6 0 0.0%
Selway River 72 3 4.2% 13 1 7.7%
Pahsimeori Ponds 70 3 4.3% 13 1 7.7%
Sawtooth Hatchery 47 0 0.0% 11 0 0.0%
Knox Bridge 287 20 7.0% 71 7 9.9%
Rapid River 463 27 5.8% 44 3 6.8%
TOTAL 1,002 59 5.9% 189 14 7.4%

• This monitoring also provides more robust stock and age specific data for:
– After-hours passage rates at each dam
Other Benefits - After-Hours Passage
Lower Granite Dam ADULTS (2- and 3-Ocean) JACKS (1-Ocean)
Release LocationPITs at
LGDAfter-Hours
PassagePercent
PITs at LGD
After-Hours Passage
Percent
Clear Creek NA NA NA 25 0 0.0%
Crooked River 37 1 2.7% 6 1 16.7%
Powell Pond 26 2 7.7% 6 0 0.0%
Selway River 72 2 2.8% 13 0 0.0%
Pahsimeori Ponds 70 4 5.7% 13 0 0.0%
Sawtooth Hatchery 47 0 0.0% 11 0 0.0%
Knox Bridge 287 8 2.8% 71 7 9.9%
Rapid River 463 12 2.6% 44 0 0.0%
TOTAL 1,002 29 2.9% 189 8 4.2%

What are the Shortcomings?

• Estimates of tags in release groups are based solely on number marked and tagged minus on-station shedding/mortality
What are the Shortcomings?

• Estimates of tags in release groups are based solely on number marked and tagged minus on-station shedding/mortality
• Issues such as post-release tag shedding and differential survival result in lower representation of tagged fish in the returning population
What are the Shortcomings?

• Estimates of tags in release groups are based solely on number marked and tagged minus on-station shedding/mortality
• Issues such as post-release tag shedding and differential survival result in lower representation of tagged fish in the returning population
• There is evidence that expanding PIT tagged adults by juvenile tagging rates underestimates the return
• Historically, rates of tagged fish in adult returns have been difficult to determine because hand scanning at hatchery racks in not 100% efficient
What are the Shortcomings?

How are we Addressing Issues?

• At some facilities, we have started experimenting with a fish pump array system to provide a true PIT tag number as fish are loaded onto trucks prior to release
• Hope to get a better idea of true on station shedding / survival
How are we Addressing Issues?Estimates of Actual Tags in the Release

YearFish Tagged (minus
observed on-station mortality)
Exit Array Detection Efficiency
No. PIT Tags
Detected
Corrected PIT Tag
Detections
No. PIT Tags Not Detected
% PIT Tags Retained
% PIT Tags Lost
2000 47,748 0.917 43,353 47,277 471 0.990 0.010
2001 55,091 0.968 52,795 54,540 551 0.990 0.010
2002 183,923 0.940 172,092 183,077 846 0.995 0.005
2003 184,473 0.974 177,488 182,226 2,247 0.988 0.012
2004 51,969 0.997 51,076 51,230 739 0.986 0.014
2005 51,975 0.979 50,360 51,440 535 0.990 0.010
2006 96,975 0.996 95,514 95,898 1,077 0.989 0.011
2007 104,675 0.995 102,181 102,694 1,981 0.981 0.019
2008 51,689 0.908 46,117 50,790 899 0.983 0.017
AVE 92,058 0.964 87,886 91,019 1,039 0.988 0.012
PIT tagged Chinook salmon smolts volitionally outmigrating from Rapid River ponds
How are we Addressing Issues?Estimates of Actual Tags in the Release
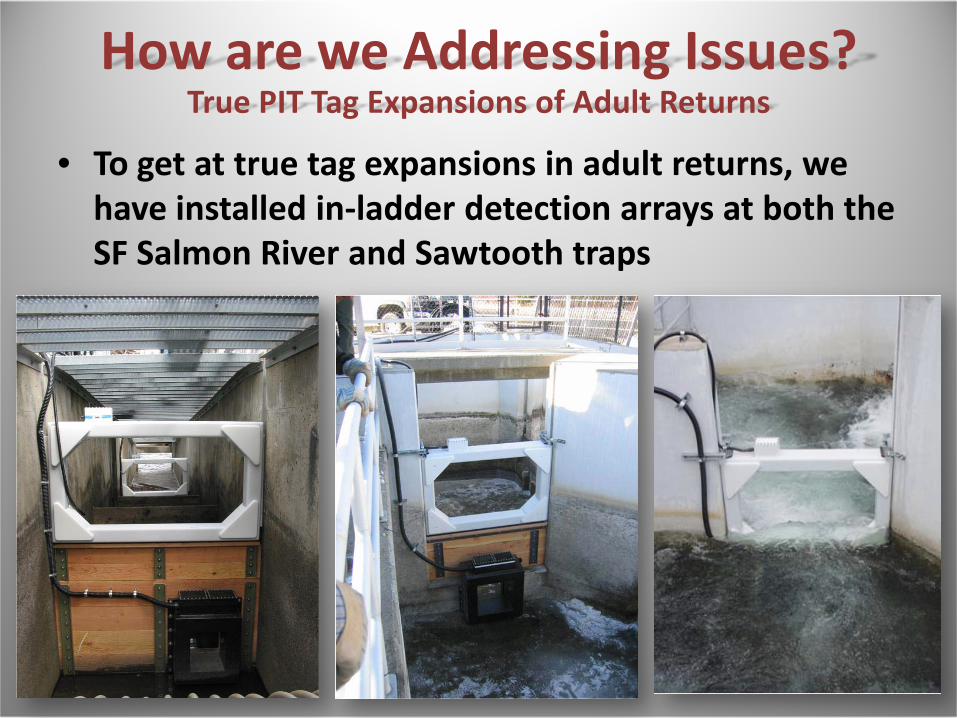
• To get at true tag expansions in adult returns, we have installed in-ladder detection arrays at both the SF Salmon River and Sawtooth traps
How are we Addressing Issues?True PIT Tag Expansions of Adult Returns

• To get at true tag expansions in adult returns, we have installed in-ladder detection arrays at both the SF Salmon River and Sawtooth traps
• We have found that in-ladder array systems were 98 – 100% efficient for the two years they have been operated
How are we Addressing Issues?True PIT Tag Expansions of Adult Returns

• We have also found that conventional hand scanning for PIT Tags, as fish are worked up out of the trap, only detects 70 – 90% of the tags in returning fish
How are we Addressing Issues?True PIT Tag Expansions of Adult Returns

• In addition, we have found the rate of PIT tagged fish in adult returns is highly variable from the rate at which fish are tagged as juveniles
Corrected Expansions
TrapBrood Year
Juvenile Expansion
Rate1-Ocean 2-Ocean 3-Ocean
Sawtooth 2005 73.8 77.0
Sawtooth 2006 12.8 14.4 /
Sawtooth 2007 20.0 23.6 / /
SF Salmon River 2004 31.2 44.4
SF Salmon River 2005 31.0 37.0 158.0
SF Salmon River 2006 28.8 33.5 46.2 /
SF Salmon River 2007 30.2 35.5 / /
How are we Addressing Issues?True PIT Tag Expansions of Adult Returns

• In addition, we have found the rate of PIT tagged fish in adult returns is highly variable from the rate at which fish are tagged as juveniles
• We have found that PIT Tag expansions rates in adult returns range from 12 – 60% higher than the expansions at juvenile tagging
• The level of underestimation appears to vary across years, locations, and between age-classes
How are we Addressing Issues?True PIT Tag Expansions of Adult Returns

• Having true tag proportions in adult returns allows us to correct expansion rates and adjust our estimates at the dams– However these adjustments are post-season
LOWER GRANITE DAM Corrected Detections**
Brood Year
Expansion* RAL @ LGD R2R LGDCorrected Estimate
Original Est. from Juv. Tag Rate
2005 158.0 2 0 316 622006 46.2 214 71 9,959 6,2342007 35.5 55 16 1,969 1,677
12,244 7,973
SF SALMON RIVER TRAP Raw PIT Tag Detections
Brood Year
Original Expansion
RAL @ STR R2R STREstimated Number
Actual Rack Corrected Exp.
2005 31.0 1 1 32 159 158.02006 28.8 107 30 3,112 4,974 46.22007 30.2 35 11 1,068 1,255 35.5
4,212 6,388
How are we Addressing Issues?True PIT Tag Expansions of Adult Returns

• Having true tag proportions in adult returns allows us to correct expansion rates and adjust our estimates at the dams– However these adjustments are post-season
• This is the most extreme example we have seen– The same correction for 2010 Sawtooth Chinook
increased the LDG estimate from 905 to 1,021 fish
How are we Addressing Issues?True PIT Tag Expansions of Adult Returns

• Data from a double marking study of BY 2006 Chinook released in the Lochsa River in 2008 showed a tag shed rate of 11.1% in 1-Ocean jack returns and 30.5% in 2-Ocean adult returns
Brood Year
Return Year
RAL PITs Needed to
Meet Trap #
Actual RAL PITs Trapped
Estimate of Shed
Tags
Remaining Missing
Tags
2006 2009 25 16 2 7
2006 2010 93 50 28 15
How are we Addressing Issues?Tag Shedding and Differential Survival

• However, there does not appear to be survival differences between the PIT and non-PIT tagged groups
BY 2006 Returning in 2009 and 2010
# CWT's Released
# CWT's Returned
2009
# CWT's Returned
2010
Total CWT Returns
Total CWT Return Rate
Treatment 18,941 8 36 44 0.23%
Control 23,207 12 31 43 0.19%
How are we Addressing Issues?Tag Shedding and Differential Survival

• It is our desire to conduct a larger scale double mark study for both Chinook and steelhead at multiple sites across multiple brood years
• We hope to add in-ladder PIT antenna systems to remaining Chinook salmon traps
How are we Addressing Issues?Moving Forward

• PIT tags provide a tool to get stock-specific run timing, conversion, post- and in-season estimates, reascension and after-hours passage rates of adult returns at 4 of the 8 lower Columbia and Snake River dams
Summary

• PIT tags provide a tool to get stock-specific run timing, conversion, post- and in-season estimates, reascension and after-hours passage rates of adult returns at 4 of the 8 lower Columbia and Snake River dams
• While PIT estimates provide a better tool for estimating returns, issues like tag shedding and mortality cause these estimates to be low
Summary

• PIT tags provide a tool to get stock-specific run timing, conversion, post- and in-season estimates, reascension and after-hours passage rates of adult returns at 4 of the 8 lower Columbia and Snake River dams
• While PIT estimates provide a better tool for estimating real-time returns, issues like tag shedding and mortality cause these estimates to be low
• Through the use of in-trap and pump array systems, we are able to correct expansions by stock and age for certain return groups, post-season
• We will continue to monitor the differential rates at which PIT tagged fish occur in adult returns and hope to further study shed and differential survival rates though a future large-scale double mark study
Summary

• Lower Snake River Compensation Plan
• PSMFC Mark Crew
• Hatchery Staffs
• Comparative Survival Study
• Idaho Power Company
• Forrest Bohlen
• Paul Bunn
• Laurie Janssen
• Nez Perce Tribe
• ODFW
• WDFW
• Biomark
Acknowledgements

Questions?