the use of phosphoric acid as an alternative phosphorus
TRANSCRIPT

The use of phosphoric acid as an alternative
phosphorus source in broiler chicken production
December 2017
Supervisor: Dr E Pieterse
Co-supervisor: Prof LC Hoffman
Thesis presented in fulfilment of the requirements for the degree of
MASTER OF SCIENCE IN ANIMAL SCIENCE
in the Faculty of AgriSciences at Stellenbosch University
By
Mark Ben Kirstein

i
Declaration
By submitting this thesis electronically, I declare that the entirety of the work contained therein is my
own, original work, that I am the sole author thereof (save to the extent explicitly otherwise stated),
that reproduction and publication thereof by Stellenbosch University will not infringe any third party
rights and that I have not previously in its entirety or in part submitted it for obtaining any
qualification.
Date: December 2017
Copyright © 2017 Stellenbosch University
All rights reserved
Stellenbosch University https://scholar.sun.ac.za
ii
General abstract
In the broiler industry, it has become common practice to supplement diets with feed grade
phosphates and in doing so provide sufficient available phosphorus to meet the birds’ requirements.
Supplemented phosphates provide a large portion of the total available phosphorus within the diet
and any small differences in the availability could have significant effects on whether or not the bird
meets its nutritional requirements for phosphorus. If the bird’s phosphorus requirements are not met,
the implications are detrimental, not only to the bird but also to the farmers’ flock productivity. Two
experiments were conducted; the objectives of the first experiment were to assess the phosphorus
bioavailability and nutrient and mineral coefficient of total tract digestibility (CTTD) of a feed grade
inorganic phosphate source, defluorinated phosphoric acid by means of a digestibility study. Five
treatments were used in this trial. Two diets made the basis of the treatments, a summit diet, only
supplemented with mono-dicalcium phosphate (MDCP), and a dilution diet, only supplemented with
phosphoric acid. These were mixed in ratios of 100:0, 75:25, 50:50, 25:75: and 0:100 respectively.
The second experiment assessed the effect of supplementing broiler diets with either defluorinated
phosphoric acid or defluorinated and desulfonated phosphoric acid. The control diet used was
supplemented with MDCP. The phosphoric acids were included in the diets at two inclusion levels,
based on dietary total phosphorus levels and available phosphorus levels. Furthermore, during the
mixing of the diets, the phosphoric acids were either added to the diets’ grain component (maize,
soybean 46 and full fat soya meal) before any of the remaining macro minerals were added or added
to the diet last after all the other ingredients had been sufficiently incorporated. These treatment
differences resulted in eight test dietary treatments. The objectives for this experiment were threefold:
(i) to evaluate the effects of the dietary treatments on production parameters; (ii) to determine the
influence of the dietary treatments on carcass characteristics and meat quality and (iii) to investigate
the effect of the dietary treatments on broiler organ weights, intestinal pH and bone parameters. The
phosphorus bioavailability of the phosphoric acid (PA) showed to be greatest and revealed high
digestibility values of all nutrients and minerals. For the second experiment, both PAs resulted in
ideal measurements of the production parameters (live weight, cumulative weight gain, cumulative
intake, feed conversion ratio, average daily gain, European production efficiency factor and protein
efficiency ratio) regardless of when the PA was added to the diet during mixing. However, when acid
inclusion levels were based on the diet’s total phosphorus, these values decreased significantly
irrespective of the method of mixing. Liveability was also affected by treatment differences, as a
result of sodium poisoning in the control diet on day 14 for approximately 26 hours, and P deprivation
Stellenbosch University https://scholar.sun.ac.za

iii
in the final week of the trial. Concerning the carcass characteristics and meat quality, carcass portion
weights of the thigh, drumstick and wing, as well as the breast colour CIE-Lab L*, a* and b*
measurements together with the chroma values showed differences. Hue angle was not significantly
affected by the treatment differences. No obvious indication was found for the cause of the portion
weight difference, and the breast colour, although different, was found to be normal for all treatments.
Bone breakage strength was affected by dietary treatment differences. The birds that were fed diets
with sufficient PA inclusion levels, based on the dietary available phosphorus, had significantly
greater breakage strength and were not affected by the different mixing methods used between
treatments. Organ weights relative to body weight, tibia calcium and phosphorus content and the pH
reading of the small intestine, except the cecum, were not influenced by the dietary treatment
differences. The cecum from birds of all the treatments was found to be more acidic than normal.
Overall, the results show PA to be a highly available phosphorus supplement in broiler diets with
competitive CTTD values. Furthermore, PA’s were not the cause of any negative effects on growth
performance, carcass characteristics, meat quality, gut and bone parameters. Therefore, these two
inorganic phosphate sources are ideal sources of phosphorus and can be used in broiler diets to ensure
growth and production are maintained as expected with no adverse effects on the bird’s health.
Stellenbosch University https://scholar.sun.ac.za

iv
Algemene opsomming
In die braaikuiken industrie is dit algemene praktyk om voere met voergraad fosfate aan te vul ten
einde voldoende fosfor (P) te voorsien om aan die diere se behoefte te voldoen. Hierdie aanvullings
voorsien die grootste gedeelte van die totale beskikbare P in die dieet en ʼn klein verandering in die
beskikbaarheid kan bepalend wees of daar aan die P behoeftes voldoen word al dan nie. Indien daar
nie aan die behoeftes voldoen word nie is die gevolge nadelig, nie net vir die dier nie maar ook vir
die effektiwiteit van die produsent.
Twee proewe is uitgevoer; die doelwitte van die eerste proef was om die P biobeskikbaarheid en
nutriënt- en minerale verteerbaarheid van voergraad anorganiese fosfaatbronne en defluorineerde
fosforsuur (PA) te bepaal deur middel van ʼn verteringsproef. Die proef het uit vyf behandelings
bestaan. Twee diëte is gemeng as die basis vir die behandelings, ʼn maksimum insluitingsdieet en ʼn
verdunningsdieet. Die maksimum insluitingsdieet het slegs mono-dikalsium fosfaat (MDCP) bevat
terwyl die verdunningsdieet slegs PA bevat het as P bron. Hierdie twee diëte is vermeng in ʼn
verhouding van 100:0, 75:25, 50:50, 25:75: en 0:100. Die tweede proef het ten doel gehad om die
invloed van die gebruik van gedefluorineerde PA en gedefluorineerde en gedesulfoneerde PA op die
produksieparameters en vleiskwaliteitseienskappe van braaikuikens te bepaal. Die PA’e is ingesluit
by twee insluitingspeile gebaseer op die totale (tP) en beskikbare P (aP) vlakke. Verder is die
vermenging van die PA’e gevariëer. In die een geval is die PA gemeng met die graan komponent
(mielies, soja oliekoekmeel en volvet soja) voordat die res van die voormengsel bygevoeg is of die
PA’e is toegevoeg aan die einde van die mengproses nadat alle ander bestanddele reeds toegevoeg is.
Hierdie het tot agt behandelings aanleiding gegee. Die doelwit van die proef was drievoudig: (i) om
die invloed van die behandelings op produksieparameters te bepaal; (ii) om die invloed van die
behandelings op karkas- en vleiskwaliteit eienskappe te bepaal en (iii) om die invloed van die
behandelings op orgaanmassa, ingewands pH en beenparameters te bepaal. Die P-beskikbaarheid
van die gedefluorineerde PA was die hoogste en het ook aanleiding gegee tot die hoogste
verteerbaarheidswaardes vir alle ander nutriënte en minerale. Beide PA’e het aanleiding gegee tot
ideale produksie parameters (lewende massa, massa toename, kumulatiewe voerinname,
voeromsetverhouding, gemiddelde daaglikse toename, Europese produksie effektiwiteit faktor en
proteïen effektiwiteit verhouding), hierdie resultaat was onverwant aan die mengprosedure. Wanneer
insluitingspeile van P gebaseer was op totale P het hierdie waardes aansienlik verswak en
oorlewingstempo was ook negatief beïnvloed. Die verswakte oorlewing was eerstens as gevolg van
Stellenbosch University https://scholar.sun.ac.za

v
die oorvoorsiening van Na vir ongeveer 26 uur vanaf dag 14 en tweedens as gevolg van P tekorte
tydens die laaste week van die proef. Karkaseienskappe en vleiskwaliteit (porsie massa, borsvleis
kleur) is deur behandeling beïnvloed maar die rede hiervoor was nie ooglopend nie. Alle kleur
metings was normaal vir alle behandelings en verskille wat gemeet is, was klein en verslille is
waarskynlik nie met die blote oog waarneembaar nie. Beensterkte is deur behandeling beïnvloed. Die
kuikens wat voer ontvang het volgens aP het sterker bene gehad as die wat voer volgens tP ontvang
het. Die mengmetode het geen invloed op beensterkte gehad nie. Orgaanmassa uitgedruk as
verhouding tot liggaamsmassa, tibia Ca en P inhoud en pH van die dunderm is nie deur behandeling
beïnvloed nie. Samevattend kan dit gestel word dat die gebruik van PA ʼn hoogs beskikbare P bron
vir braaikuikens is met geen negatiewe uitwerking op produksieparameters, karkas- of vleiskwaliteit
eienskappe, SVK of been parameters nie.
Stellenbosch University https://scholar.sun.ac.za

vi
Acknowledgements
I would like to express my sincerest appreciation and gratitude to the follow people and institutions:
Firstly to Dr Elsje Pieterse at the Department of Animal Sciences, Stellenbosch University, for all her
support, guidance and advice throughout my time spent here at Stellenbosch University.
Professor Louw Hoffman for all your help, let it be academic related or not. For this I will always be
grateful.
Protea Chemicals and Stephan Breytenbach, for the opportunity to pursue a master’s degree under
your guidance and without worries of a monetary basis.
Professor Daan Nel for your help with the countless statistical analyses.
Mrs Beverly Ellis and all the lab assistants, Michael, Janiene and Jonas, at the Department of Animal
Science for all your help during my lengthy time spent in a lab coat.
To my fellow students who helped during my trials and my lab work. Without your help I would not
have coped. And to those who were there for a coffee break or a chat during the writing period, thank
you very much.
Lastly to my family for their endless support and encouragement throughout my Master’s and
Undergraduate degree.
Stellenbosch University https://scholar.sun.ac.za

vii
Notes
The language and style used in this thesis are in accordance with the requirements of the South
African Journal of Animal Science with changes to improve readability. This thesis represents a
compilation of manuscripts where each chapter is an individual entity and some repetition between
chapters is therefore unavoidable.
Stellenbosch University https://scholar.sun.ac.za
viii
Abbreviations
ADG Average daily gain
AME Apparent metabolisable energy
ANOVA Analysis of variance
Al Aluminium
aP Available phosphorus
Bo Boron
Ca Calcium
Cu Copper
DF Defluorinated
DFS Defluorinated and desulfonated
EPEF European production efficiency factor
FCR Feed conversion ratio
Fe Iron
g Grams
h Hours
iP Inorganic phosphate
K Potassium
kg Kilograms
kPa Kilopascals
M Mol
M Metres
Mg Magnesium
mg/g Milligrams per gram
ml Mili litres
mm Mili metres
Mn Manganese
N Newton
Na Sodium
N/g Newton per gram
npP Non-phytate phosphorus
P Phosphorus
PA Phosphoric acid
PER Protein efficiency ratio
pHi Initial pH (15 minutes post mortem)
pHu Ultimate pH (24 hours post mortem)
tP Total phosphorus
Zn Zinc
Stellenbosch University https://scholar.sun.ac.za
ix
Table of contents
Declaration ............................................................................................................................................ i
General abstract .................................................................................................................................... ii
Algemene opsomming ........................................................................................................................ iv
Acknowledgements ............................................................................................................................. vi
Notes .................................................................................................................................................. vii
Abbreviations .................................................................................................................................... viii
Table of contents ................................................................................................................................. ix
Chapter 1 ............................................................................................................................................ 1
General Introduction ............................................................................................................................ 1
References ........................................................................................................................................ 3
Chapter 2 ............................................................................................................................................ 1
Literature Review ................................................................................................................................. 1
2.1 Introduction ........................................................................................................................... 1
2.2 Physiology ............................................................................................................................. 2
2.3 Broiler Requirements ............................................................................................................ 4
2.4 Phosphorus Availability ........................................................................................................ 5
2.4.1 Definition of Terms ........................................................................................................ 5
2.4.2 Evaluation of bioavailability .......................................................................................... 6
2.4.3 Qualitative measurements .............................................................................................. 6
2.4.4 Quantitative measurements .......................................................................................... 10
2.4.5 In Vitro Tests ................................................................................................................ 11
Stellenbosch University https://scholar.sun.ac.za

x
2.5 Phosphorus Sources ............................................................................................................. 11
2.5.1 Plant feed phosphorus .................................................................................................. 11
2.5.2 Animal feed phosphorus .............................................................................................. 12
2.5.3 Inorganic feed phosphates ............................................................................................ 13
2.6 Factors Influencing P Availability ...................................................................................... 14
2.6.1 Calcium and Ca: P Ratio .............................................................................................. 16
2.6.2 Vitamin D ..................................................................................................................... 16
2.6.3 Interactions ................................................................................................................... 17
2.6.4 Phytate .......................................................................................................................... 18
2.6.5 Phytase ......................................................................................................................... 19
2.6.6 Hydration state ............................................................................................................. 20
2.6.7 Inorganic phosphate source .......................................................................................... 20
2.7 Conclusion ........................................................................................................................... 21
2.8 References ........................................................................................................................... 22
Chapter 3 .......................................................................................................................................... 30
Evaluation of phosphorus bioavailability and total intestinal tract digestibility of phosphoric acid in
broiler diets ........................................................................................................................................ 30
3.1 Abstract ............................................................................................................................... 30
3.2 Introduction ......................................................................................................................... 30
3.3 Materials and Methods ........................................................................................................ 32
3.3.1 Birds and housing......................................................................................................... 32
3.3.2 Treatments, diets and trial procedure ........................................................................... 33
3.3.3 Data collection ............................................................................................................. 36
3.3.4 Feed and faecal analysis ............................................................................................... 36
3.4 Statistical analysis ............................................................................................................... 40
Stellenbosch University https://scholar.sun.ac.za

xi
3.5 Results and discussion ......................................................................................................... 40
3.5.1 Bioavailability .............................................................................................................. 40
3.5.2 Coefficient of total tract digestibility ........................................................................... 43
3.6 Conclusion ........................................................................................................................... 47
3.7 References ........................................................................................................................... 48
Chapter 4 .......................................................................................................................................... 56
The effects of phosphoric acid on broiler production parameters ..................................................... 56
4.1 Abstract ............................................................................................................................... 56
4.2 Introduction ......................................................................................................................... 56
4.3 Materials and Methods ........................................................................................................ 58
4.3.1 Birds and housing......................................................................................................... 58
4.3.2 Treatments and experimental diets .............................................................................. 58
4.3.3 Data Collection ............................................................................................................ 65
4.4 Statistical analysis ............................................................................................................... 66
4.5 Results and discussion ......................................................................................................... 66
4.5.1 Live weight and cumulative weight gain ..................................................................... 66
4.5.2 Cumulative intake ........................................................................................................ 72
4.5.3 Feed conversion ratio ................................................................................................... 74
4.5.4 Average daily gain, PER, EPEF and liveability ........................................................... 75
4.6 Conclusion ........................................................................................................................... 77
4.7 References ........................................................................................................................... 78
Chapter 5 .......................................................................................................................................... 81
Influence of phosphoric acid on carcass characteristics and meat quality ......................................... 81
Stellenbosch University https://scholar.sun.ac.za
xii
5.1 Abstract ............................................................................................................................... 81
5.2 Introduction ......................................................................................................................... 81
5.3 Materials and methods......................................................................................................... 84
5.5.1 Birds, housing and experimental procedure ................................................................. 84
5.5.2 Carcass characteristics and physical measurements .................................................... 85
5.4 Statistical analysis ............................................................................................................... 86
5.5 Results and Discussion ........................................................................................................ 86
5.5.1 Carcass characteristics ................................................................................................. 86
5.5.2 Physical measurements ................................................................................................ 90
5.6 Conclusion ........................................................................................................................... 93
5.7 References ........................................................................................................................... 94
Chapter 6 .......................................................................................................................................... 98
The effects of phosphoric acid on organ and gut measurements and bone parameters of broiler
chickens .............................................................................................................................................. 98
6.1 Abstract ............................................................................................................................... 98
6.2 Introduction ......................................................................................................................... 98
6.3 Materials and methods....................................................................................................... 100
6.3.1 Bone breakage strength .............................................................................................. 101
6.3.2 Bone mineral content ................................................................................................. 102
6.3.3 Organ weights and gizzard score ............................................................................... 102
6.3.4 pH measurements ....................................................................................................... 103
6.4 Statistical analysis ............................................................................................................. 103
6.5 Results and discussion ....................................................................................................... 103
6.5.1 Bone Breakage Strength............................................................................................. 103
6.5.2 Mineralisation ............................................................................................................ 105
Stellenbosch University https://scholar.sun.ac.za

xiii
6.5.3 Gizzard score .............................................................................................................. 106
6.5.4 Organ weights ............................................................................................................ 107
6.5.5 Intestinal pH ............................................................................................................... 111
6.6 Conclusion ......................................................................................................................... 112
6.7 References ......................................................................................................................... 113
Chapter 7 ........................................................................................................................................ 119
General conclusion ........................................................................................................................... 119
Addendum A ................................................................................................................................... 121
Stellenbosch University https://scholar.sun.ac.za
1
Chapter 1
General Introduction
The South African poultry industry contributes the largest value to the country's total gross
agricultural production and provides the country’s customer with a highly affordable protein
source (Bureau for Food and Agricultural Policy & National Agrucultural Marketing Council,
2016). To cope with the demands of the market for affordable protein, the modern broiler is
reaching marketable weight earlier and earlier (Kleyn & Chystal, 2014; Beski et al., 2015). The
need to meet the ever-developing broiler requirements places nutritional advances at the
forefront of development so as to ensure the modern broiler’s growth is achieved and to
maintain sustainable broiler production. Therefore, diet formulation requires sufficient
knowledge of the raw ingredients intended to be used, such that the birds receive maximum
nutrient availability (Beski et al., 2015).
Poultry diets are predominantly plant based with a shift away from animal protein sources.
However, animal protein sources are known to have a high mineral availability, whereas plant
sources have minerals which are predominantly bound in the form of phytate, causing them to
be less readily available to monogastric animals (Driver, 2004; Rodehutscord, 2013). This
gives rise to supplementing diets with inorganic mineral sources. Phosphorus (P) is one of the
essential minerals required for sufficient growth and development due to its role in skeletal
development as well as several metabolic processes (Suttle, 2010). Therefore, nutritionists
must ensure the dietary requirements for P are met. However, due to the uncertainty around the
availability of the P from different inorganic phosphate (iP) sources as well as the implications
of undersupplying P, diets have been oversupplied with iP (Viljoen, 2001). This has led to
excess P being excreted, resulting in potential environmental pollution of the soils and ground
water (Waldroup, 1999) as well as an unnecessary waste of money, as dietary supplements
have a tendency to be expensive. Interactions between different minerals which cause a
reduction in the availability of the minerals within the diet have also been a cause for the
oversupply. Minerals and their requirements were initially focused on one at a time, and this
has been proven to be incorrect as mineral interactions have been reported (Nugara & Edwards,
1963; Davies & Reid, 1979; Henry & Miles, 2000). It now has been accepted that to obtain a
Stellenbosch University https://scholar.sun.ac.za

2
desired response, mineral concentrations need to be included to the diet according to the
animal’s requirements as well as in relation to other minerals (Hemati Matin et al., 2013).
The main objective in optimizing dietary P levels is to avoid deficiencies so as to maintain
animal health and performance (Rodehutscord, 2013); a drop in P intake has negative effects
on the growth and welfare of a growing bird (Driver et al., 2005). In order to avoid the negative
effects of P deficiencies, knowledge of the availability of the P and the P levels in the iP source
is important. The most commonly used iP sources within South Africa are calcium phosphates.
These are manufactured through reacting calcium salts with phosphoric acid (PA) (Viljoen,
2001), to produce mono-, di- or mono-dicalcium phosphates with P bio-availabilities of 84, 77
and 79%, respectively (Viljoen, 2001). Indications are that these iP sources are becoming
scarcer and alternative P sources are being sought; phosphoric acid (PA) has been identified as
being such a potential source of P suitable for inclusion in broiler diets. Yet very little is known
about the potential of PA in monogastric animals’ diets. Therefore, the aim of this study was
to investigate the potential of PA as an inorganic P source on broiler production. Specific study
objectives included:
i. To evaluate the phosphorus bioavailability and nutrient coefficient of total tract
digestibility of defluorinated PA.
ii. To assess the production performance of broiler chickens fed a diet supplemented with
defluorinated PA and defluorinated and desulfonated PA.
iii. To assess the effect of defluorinated PA and defluorinated and desulfonated PA on
carcass characteristics and meat quality.
iv. To assess the effect of defluorinated PA and defluorinated and desulfonated PA on
organ, gut and bone parameters of broiler chickens.
v. To determine whether the inclusion levels of the PA, based on the dietary total or
available phosphorus levels, have an effect on the parameters mentioned in objectives
ii, iii and iv.
vi. To determine whether the mixing sequence used when adding the PA to the feed
influences any of the parameters mentioned in objectives ii, iii and iv.
Stellenbosch University https://scholar.sun.ac.za
3
References
Beski, S. S. M., Swick, R. A., & Iji, P. A. 2015. Specialized protein products in broiler chicken
nutrition: A review. Anim. Nutr. 1: 47-53.
Bureau for Food and Agricultural Policy, & National Agricultural Marketing Council. 2016.
Evaluating the competitiveness of the South African broiler value chain.
http://www.economic.gov.za/entities-external-links/entities-reports-a-research/621-
idc--poultry-project-report--dec-2016 Accessed on 01/06/2017.
Davies, N. T., & Reid, H. 1979. An evaluation of the phytate, zinc, copper, iron and manganese
contents of, and Zn availability from, soya-based textured-vegetable-protein meat-
substitutes or meat-extenders. Br. J. Nutr. 41: 579-589.
Driver, J. 2004. Performance and bone quality of the modern broiler chicken as influenced by
dietary calcium, phosphorus, phytase and 1-alpha-hydroxycholecalciferol. PhD Diss.
Univ. of Georgia, Athens, Georgia.
Driver, J. P., Pesti, G. M., Bakalli, R. I., & Edwards, H. M. 2005. Calcium requirements of the
modern broiler chicken as influenced by dietary protein and age. Poult. Sci. 84: 1629-
1639.
Hemati Matin, H. R., Dashtbin, F., & Salari, J. 2013. Absorption and macromineral interactions
in broiler production: An overview. Glob. Vet. 11: 49-54.
Henry, P., & Miles, R. 2000. Interactions among the trace minerals. Ciência Anim. Bras. 1: 95-
105.
Kleyn, R., & Chystal, P. 2014. Feeding the young broiler chick in practice: A review.
https://spesfeed.com/2014/04/feeding-the-young-broiler-chick-in-practice-a-review-
by-riick-kleyn-1-and-peter-chystal-2/ Accessed on 28/08/2017.
Nugara, D., & Edwards, H. M. J. 1963. Influence of dietary Ca and P levels on the Mg
requirement of the chick. J. Nutr. 80: 181-184.
Rodehutscord, M. 2013. Determination of phosphorus availability in poultry. Worlds. Poult.
Sci. J. 69: 687-698.
Stellenbosch University https://scholar.sun.ac.za

4
Suttle, N. F. 2010. Mineral nutrition of livestock (4th ed.). CABI publishing, Wallingford,
Oxfordshire, UK. pp 54-167.
Viljoen, J. 2001. Quality of feed phosphate supplements for animal nutrition. S. Afr. J. Anim.
Sci. 2: 13-19.
Waldroup, P. W. 1999. Nutritional approaches to reducing phosphorus excretion by poultry.
Poult. Sci. 78: 683-691
Stellenbosch University https://scholar.sun.ac.za

1
Chapter 2
Literature Review
2.1 Introduction
Living organisms rely heavily on phosphorus (P) to ensure everyday processes within the body
run smoothly. Phosphorus not only is a major component of the skeleton, but its involvement
in every phase of metabolism is of great importance, due to P being an essential component
within organic compounds (Soares, 1995). Within the broiler industry, the major portion of
phosphorus fed to chickens is supplied through plants and fishmeal. However, lately more
information has been brought to light on the use of inorganic feed phosphates and their
importance as a feed component is growing worldwide. The use of inorganic phosphates (iP)
has come about as much of plant P is bound to phytate, which makes the P highly unavailable
to monogastric animals (Van der Klis & Versteegh, 1999). On the other hand, P from inorganic
sources is of high availability, leading to broiler diets being supplemented with these inorganic
phosphates to meet the birds’ requirements (Viljoen, 2001).
Phosphorus is essential to normal growth of broilers and due to the birds ever increasing
demands for proper skeletal growth and body maintenance, an oversupply of P within diets has
become the norm (Waldroup, 1999). This is to avoid the consequences of undersupplying P,
namely; poor performance in growth, poor skeletal development which effects carcass quality,
and high mortalities (Waldroup, 1999). An oversupply of P leads to lowering absorption
efficiency of P from the gastrointestinal tract, kidney P excretion increases and faecal P levels
increases. Furthermore, excessive excretion of P has been found to pollute soils and water
systems; the later causing eutrophication (De Groote & Huyghebaert, 1997). Therefore, there
is a need to minimize the levels of excreted P from animals. This can be achieved by supplying
adequate amounts to meet the requirements of the animal and no more. In addition to the
environmental effects of excessive use of inorganic phosphate sources, the global phosphate
resources needed for the production of feed phosphates are diminishing (Rodehutscord, 2013).
This makes handling and use of the inorganic P sources a vital focus in ensuring a sustainable
agricultural industry.
Stellenbosch University https://scholar.sun.ac.za

2
Supplying diets with adequate P requires knowledge of the source’s P availability; inorganic
feed phosphates are not equally available due to the different biological values of these
phosphates. The biological value is indicative of the amount of P which can be utilized within
the phosphate (Waldroup, 1999; Rodehutscord, 2013), and further on will be referred to as the
bioavailability. A number of methods have been employed as measurements of P
bioavailability; these are quantitative measures, qualitative measures and in vivo measures
(Shastak & Rodehutscord, 2013).
The purpose of this review is to give a better understanding of P and its involvement in growth
and development of broiler chickens. Different methods of P bioavailability determination are
discussed and factors that play a role in P availability as a whole are also elucidated on.
2.2 Physiology
Phosphorus (P) is one of the essential minerals required by broilers and is the second most
abundant mineral in the body, second only to calcium (Ca). However, P fulfils most known
functions within the body, from structural to metabolic functions (Soares, 1995), namely:
Plays a large part in skeletal development and maintenance, as the skeleton houses the
largest concentration of P in the body (80%). It is also a storage depot for Ca and P (Soares,
1995).
Plays a role in cell wall formation by being an integral part of the phospholipids (Soares,
1995).
Can be found involved in processes of energy storage and metabolism. Certain phosphates,
for example adenosine diphosphate (ADP) and adenosine triphosphate (ATP), are found
within the muscle cells and play a role in energy storage and utilization (Driver, 2004).
Plays a role in the acid-base balance of the body, as well as the pH balance (Miles & Henry,
1997).
It has involvement in cell growth and differentiation. Phosphorus is found in the structure
of nucleic acids (Soares, 1995).
Plays a role in voluntary intake and feed utilization efficiency in chickens (Bar & Hurwitz,
1984).
In the chicken, the gizzard is where available P is solubilised and becomes available, as
orthophosphate, for digestion. The duodenum and jejunum is where absorption of P occurs in
Stellenbosch University https://scholar.sun.ac.za
3
the digestive tract, as the pH and absorptive capacity of the intestinal mucosa is ideal for such.
However, absorption is not isolated to only these two compartments; absorption still takes place
after the duodenum and jejunum although at a lower rate, as the rate of passage of the digesta
is mostly too fast for thorough absorption. Furthermore, the control over the absorption of
available P, when compared to the other minerals, is limited in birds (Hegsted, 1973). The P
content of the body is regulated through the urinary system (Leske & Coon, 2002). Phosphorus
excretion generally occurs when daily P intake exceeds what is required to support a bird’s
steady physiological state (Leske & Coon, 2002). Various factors pay a role in P absorption.
These include the P and Ca levels in the diet, levels of vitamin D, P source, the Ca: P ratio,
intestinal pH and the antagonistic effects of other minerals such as Zn and Cu (Soares, 1995;
McDonald et al., 1995; Van der Klis & Versteegh, 1999). The amount of phytase present in
the bird also plays an important role in P requirements and absorption (Viljoen, 2001; Payne,
2005; Kleyn, 2013; Rodehutscord, 2013; Franklin, 2015). The role of phytase is discussed in
section 2.6.5.
Phosphorus together with Ca are the two most important minerals to a chicken (Kleyn, 2013).
It is for this reason, as well as their interactions with one another before and after absorption
(Soares, 1995) and the fact that excessive quantities of one leads to poor use of the other (Van
der Klis & Versteegh, 1999), that one cannot consider or discuss the one fully without mention
of the other.
An imbalanced Ca: P ratio is known to limit the use of P (Mc Donald et al., 1997). High levels
of Ca is said to reduce the availability of P as it is excreted in the form of calcium phosphate
(Ca-P complex) and this can lead to P deficiencies if critical levels are reached (Harrold et al.,
1983; Kleyn, 2013). Poor P utilization by birds due to adverse ratios of Ca and P have been
attributed to:
Reduced P absorption at high levels of Ca as the Ca-P complex is excreted.
Excretion of absorbed P when Ca levels are low (Van der Klis & Versteegh, 1999).
The first symptoms of a P deficiency can be seen in young birds where the skeleton develops
abnormally (Kleyn, 2013). The initial results of deficiencies in P is a drop in the phosphate
levels of the blood plasma. Anselme (2003) and Kleyn (2013) speak of further P deficiencies
causing loss of appetite, weakness and even death. Under close post mortem examination, the
Stellenbosch University https://scholar.sun.ac.za

4
ribs are deformed and the larger bones such as the tibia and femur are rubbery and easily
broken: this is a condition known as rickets (Kleyn, 2013). Other symptoms of deficiencies
include tibial dyschondroplasia and osteomalacia (Waldroup, 1999; Anselme, 2003).
2.3 Broiler Requirements
Phosphorus requirements in broilers are discussed in concurrence with calcium (Ca), due to the
interactions between the two within a diet. As mentioned, any deficiencies or oversupply of
one in the body will lead to a under or oversupply of the other (Driver, 2004).
The mineral requirements of chickens have generally been calculated using the factorial
approach, which takes the birds maintenance and production requirements, age, genotype and
performance level into consideration (Mc Donald et al., 2011). In poultry, P requirements are
centred on the intake of non-phytate phosphorus (npP) and this is expressed as available P
(Driver, 2004). However, this assumption is incorrect as npP does not take into account the fact
that not all npP is completely available and also that some of the phytate bound phosphorus
can be utilized to meet P requirements (Leske & Coon, 2002). Table 2.1 shows the requirements
of Ca and inorganic P for broilers.
Table 2.1 Inorganic Phosphorus and Calcium Requirements for Broilers (National Research
Council, 1994)
Age (weeks) Inorganic Phosphorus (%) Calcium (%)
0-3 0.45 1.00
4-6 0.35 0.9
7-8 0.3 0.8
Numerous research findings exist from which these recommendations are based on however,
most of the research findings were published between 1952 and 1983. The modern commercial
broiler has changed dramatically from that for which these recommendations were made with
special reference to growth, utilization of nutrients, feed conversion ratio, structural bone
characteristics and carcass characteristics (Dhandu & Angel, 2003). This is due to changes in
management practices, changes related to the diet as well as genetic selection (Havenstein et
Stellenbosch University https://scholar.sun.ac.za
5
al., 1994; Williams et al., 2000). Havenstein et al. (1994) concluded that advances in genetics
is the reason for most of the variation between the old and modern bird, followed closely by
changes in the diets and their composition. More specifically, the modern bird has a greater
feed utilization efficiency and diets are formulated to meet the fast growing birds’
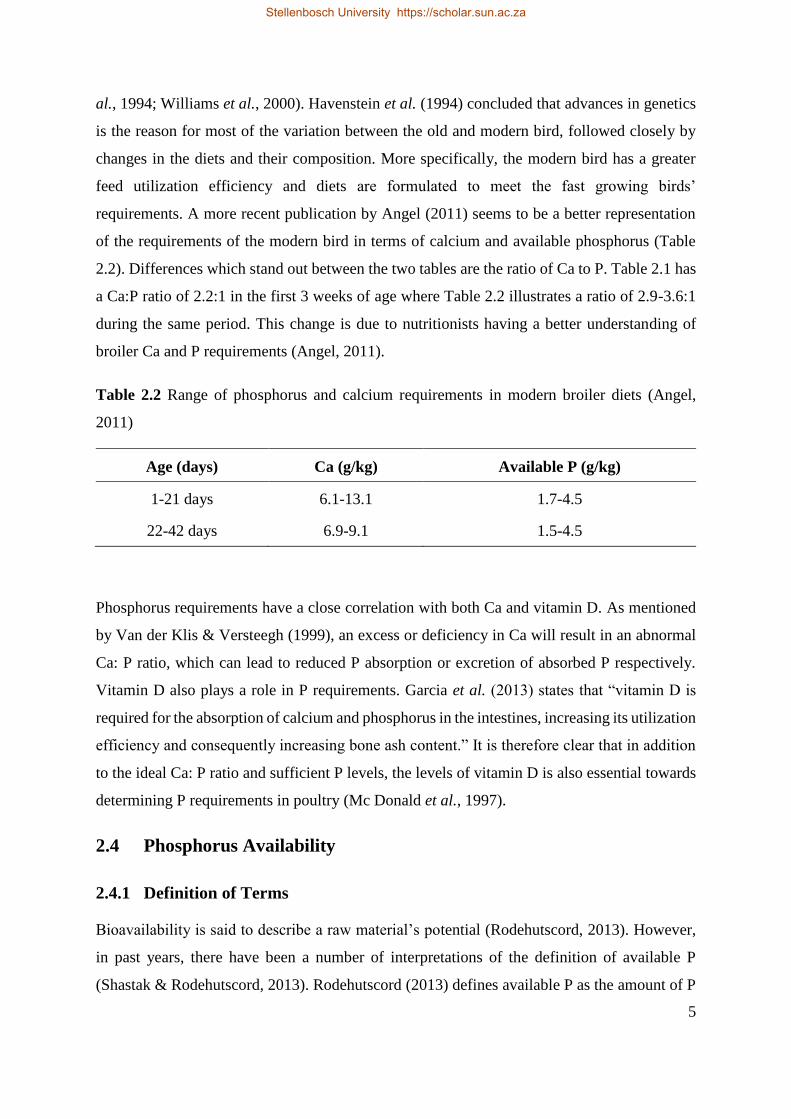
requirements. A more recent publication by Angel (2011) seems to be a better representation
of the requirements of the modern bird in terms of calcium and available phosphorus (Table
2.2). Differences which stand out between the two tables are the ratio of Ca to P. Table 2.1 has
a Ca:P ratio of 2.2:1 in the first 3 weeks of age where Table 2.2 illustrates a ratio of 2.9-3.6:1
during the same period. This change is due to nutritionists having a better understanding of
broiler Ca and P requirements (Angel, 2011).
Table 2.2 Range of phosphorus and calcium requirements in modern broiler diets (Angel,
2011)
Age (days) Ca (g/kg) Available P (g/kg)
1-21 days 6.1-13.1 1.7-4.5
22-42 days 6.9-9.1 1.5-4.5
Phosphorus requirements have a close correlation with both Ca and vitamin D. As mentioned
by Van der Klis & Versteegh (1999), an excess or deficiency in Ca will result in an abnormal
Ca: P ratio, which can lead to reduced P absorption or excretion of absorbed P respectively.
Vitamin D also plays a role in P requirements. Garcia et al. (2013) states that “vitamin D is
required for the absorption of calcium and phosphorus in the intestines, increasing its utilization
efficiency and consequently increasing bone ash content.” It is therefore clear that in addition
to the ideal Ca: P ratio and sufficient P levels, the levels of vitamin D is also essential towards
determining P requirements in poultry (Mc Donald et al., 1997).
2.4 Phosphorus Availability
2.4.1 Definition of Terms
Bioavailability is said to describe a raw material’s potential (Rodehutscord, 2013). However,
in past years, there have been a number of interpretations of the definition of available P
(Shastak & Rodehutscord, 2013). Rodehutscord (2013) defines available P as the amount of P
Stellenbosch University https://scholar.sun.ac.za

6
used to meet the animal’s requirements relative to the total dietary P, whereas other
interpretations define it in terms of the form in which P is bound. For example, the National
Research Council (1994) defined available P as the amount of non-phytate P within a diet.
Angel (2011) defines available P (aP) as the amount of P absorbed by the animal from the diet
and this definition is consistent with that of Rodehutscord (2013).
A number of available methods, which are used to determine the “bio”availability estimate,
has given rise to many different definitions said to explain phosphorus utilization. The most
widely used definition explains a nutrient’s bioavailability as the amount of intake which the
intestine is able to absorbed and make available for use within the body (Gueguen, 1994).
2.4.2 Evaluation of bioavailability
Due to variations in bioavailability of phosphorus within poultry feeds, there have been a
number of methods developed to quantify phosphorus availability. These are divided into three
groups, namely: qualitative measurements, quantitative measurements and in vitro tests.
(Shastak & Rodehutscord, 2013).
2.4.3 Qualitative measurements
Qualitative measurements of bio-available P include bone ash content, bone breakage strength,
blood P content and growth assays (Shastak & Rodehutscord, 2013). These bioassays only
indicate a relative biological value and so cannot provide a measure of true P bioavailability.
Furthermore, as these are qualitative measures they do not provide a quantitative measure of P
bioavailability and so are limited in terms of value when performing diet formulations (Lima
et al., 1997).
2.4.3.1 Bone ash content
The bone is a strong indicator for P bioavailability as ~80% of the total retained P is located
within the skeleton. The remaining 20% is said to be found within the bird’s tissues (De Groote
& Huyghebaert, 1997). For many years the testing of bioavailability has been focused on bone
ash content (Shastak & Rodehutscord, 2013). Heuser & Norris (1926), who used Ca and P
content of the tibia bone ash as a gauge of bone mineralisation, performed one of the first such
studies. Nelson and Walker (1964) reported bone ash content as an accurate measurement of
Stellenbosch University https://scholar.sun.ac.za

7
dietary P levels. In addition, a later study by Nelson (1967) stated that one of the most sensitive
methods of P evaluation was that of bone ash content.
Much literature has been published over time which identifies bone ash content as a strong
method for estimation of P bioavailability; see for example Gillis et al. (1954), Hurwitz, (1964)
or Lima et al. (1997). Gillis et al. (1954) performed one of the first studies to use tibia ash
concentration to quantify P availability for chickens. Comparing the tibia ash percentage from
chickens fed a given test P source to that of chickens fed a reference P source (beta-tricalcium
phosphorus) they were able to gain a relative biological value of the test source. Hurwitz
(1964), based on the regression of tibia P as a function of total P intake in growing chicks, was
able to find a constant ratio between tibia P and whole carcass P, opening up the idea that tibia
P could prove to be a good indication of whole carcass P content. However, the sensitivity of
using the tibia over the femur has been questioned (Moran & Todd, 1994; Angel et al., 2006).
Furthermore, it has been found that obtaining ash content from the tibia and femur is laborious
in that the cleaning of the bones is tedious and the fat extraction period is rather lengthy
(Shastak & Rodehutscord, 2013). A much earlier study by Baird & MacMillan (1942) proposed
the use of toe ash instead of tibia ash as a response criterion in the evaluation of calcification
of Vitamin D. They found that the use of toe ash reduced the labour and time spent cleaning
bones. Furthermore, there was no need to sacrifice the birds. Yoshida & Hoshii (1977) used
toe ash as a determinant for available P and reported it to be as sensitive in assessing P
bioavailability as when using tibia ash.
The length which an experiment is carried out for is said to effect bone ash studies (Shastak,
2012; Shastak & Rodehutscord, 2013). The first to find observations where bone ash was
effected by the experiment duration was Ammerman et al. (1961). Using a degerminated corn-
soybean meal diet, they evaluated P supplements in 10 and 28-day bioassays. Their results
showed that the 28-day bioassay had greater sensitivity when obtaining data for a tibia ash
response curve, than that of the 10-day bioassay. Other aspects, which might affect the
bioavailability of an individual sample, is the phosphate reference, response criteria and the
diets’ Ca levels.
2.4.3.2 Bone breakage strength
The strength of bone is said to be the bone’s ability to handle stress before it actually breaks
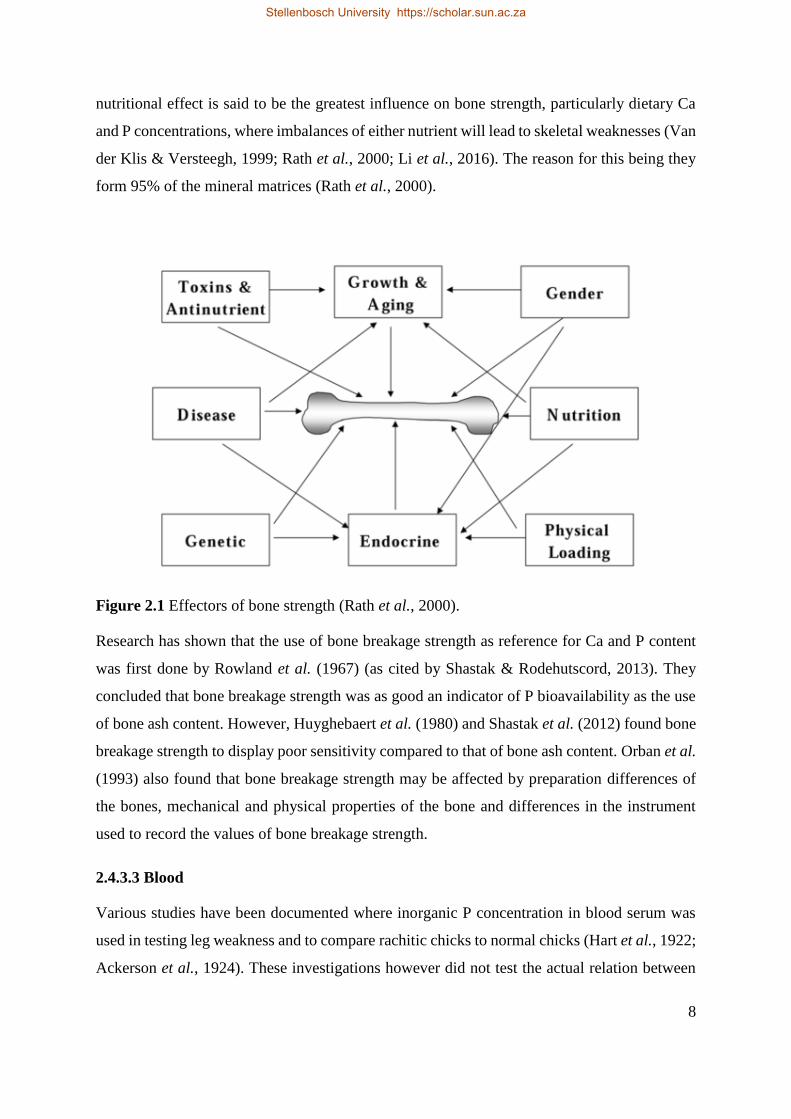
(Rath et al., 2000). Bone strength can be affected through various factors (Figure 2.1). The
Stellenbosch University https://scholar.sun.ac.za
8
nutritional effect is said to be the greatest influence on bone strength, particularly dietary Ca
and P concentrations, where imbalances of either nutrient will lead to skeletal weaknesses (Van
der Klis & Versteegh, 1999; Rath et al., 2000; Li et al., 2016). The reason for this being they
form 95% of the mineral matrices (Rath et al., 2000).
Figure 2.1 Effectors of bone strength (Rath et al., 2000).
Research has shown that the use of bone breakage strength as reference for Ca and P content
was first done by Rowland et al. (1967) (as cited by Shastak & Rodehutscord, 2013). They
concluded that bone breakage strength was as good an indicator of P bioavailability as the use
of bone ash content. However, Huyghebaert et al. (1980) and Shastak et al. (2012) found bone
breakage strength to display poor sensitivity compared to that of bone ash content. Orban et al.
(1993) also found that bone breakage strength may be affected by preparation differences of
the bones, mechanical and physical properties of the bone and differences in the instrument
used to record the values of bone breakage strength.
2.4.3.3 Blood
Various studies have been documented where inorganic P concentration in blood serum was
used in testing leg weakness and to compare rachitic chicks to normal chicks (Hart et al., 1922;
Ackerson et al., 1924). These investigations however did not test the actual relation between
Stellenbosch University https://scholar.sun.ac.za
9
the levels of P concentration in the blood to that of the diet concentration. Gardiner first did
this in 1962. In these experiments, he found there was a linear relationship between the levels
of plasma inorganic P and dietary inorganic P supplementation. A further publication two years
later indicates that plasma inorganic P can be used as a measure for relative P availability
(Hurwitz, 1964). Bansal (1990) concluded that although serum inorganic P constitutes a very
small percentage of the total P in the body, it does give an indication as to the chickens’
phosphorus status. A report by Cupisti & Kalantar-Zadeh (2013) found normal levels of P in
the plasma to be 2.5-4.5 mg/dl, and these yields are usually the same as that found in the serum.
Lima et al. (1997) experimented with three different levels of phosphorus supplemented diets
(0.1, 0.2, and 0.3%) and the basal diet was formulated to have all the required nutrients except
for phosphorus. They were able to conclude a distinct increase in plasma P as the level of
supplementation increased.
2.4.3.4 Growth
Broilers (particularly modern broiler lines) tend to be more prone to variations in performance
through changes in mineral supply as their mineral body reserves are low and their growth rates
are high (Shastak & Rodehutscord, 2013). Therefore, use of growth or body weight to obtain
the bioavailability of different phosphorus sources is possible. A number of studies have been
conducted in the past years where body weight and bone ash, be it tibia or toe ash, were used
to find the P and Ca bioavailability (Buckner et al., 1930; Gillis et al., 1948; Summers et al.,
1959; Vandepopuliere et al., 1961; Huyghebaert et al., 1980). Huyghebaert et al. (1980)
experimented with different P sources to find their relative biological value (bioavailability).
The criterion used to assess the bioavailability was live weight gain, feed conversion ratio, and
bone breaking strength, bone ash percentage and bone ash P content. Controlled feeding
ensured that all chickens had similar average intake throughout the experiment. This ensured
that the effect of organic P was consistent for all the groups, therefore, any changes in these
criteria, with an increase in P supplementation, relate to the supplemented P only. In their
conclusion, they found there to be a positive effect on all aspects as the level of inorganic P
increased. The findings of Summers et al. (1959) and Vandepopuliere et al. (1961) led to their
conclusion that growth or body weight is as good of an indicator of P bioavailability as bone
ash. This is in cognate to that found later by Potter et al. (1995) who states that the body weight
gain and bone ash based bioassays results in similar P bioavailability estimations. However
Stellenbosch University https://scholar.sun.ac.za

10
Huyghebaert et al. (1980), as well as Nelson & Walker (1964) and Shastak (2012) concluded
that using growth for P bioavailability is not suitable.
2.4.4 Quantitative measurements
2.4.4.1 Retention Studies
Qualitative measurements of bioavailability (bone, growth or blood) provide a relative
bioavailability. This information has little value when formulating diets as the actual retention
values are required to analyse the animal’s performance with regard to the diet consumed
(Shastak & Rodehutscord, 2013). Furthermore retention values help in understanding the
optimal requirements of phosphorus such that there are minimal amounts of P in the bird’s
excreta (Leske & Coon, 2002). As the amount of phosphorus utilization varies between
different feedstuffs, retention values take into account the non-phytate phosphorus as well as
the phytate phosphorus which is available, making it vital for feed formulations (Leske &
Coon, 2002).
To obtain a retention value for phosphorus one might measure the total collected excreta or
with the help of an indigestible marker, the retention value may be calculated. De Groote &
Huyghebaert (1997) investigated the bioavailability of P as influenced by two bio-assays,
namely toe ash percent and retention. Their experiment followed a seven-day adaption period,
with a four-day balance period and collection of the total excreta thereafter. The conclusion
was that there was no change in the relative bioavailability of P between the two bio-assays.
Van der Klis and Versteegh (1996) and Shastak et al. (2012) did similar studies with similar
findings.
2.4.4.2 Digestibility
Pre-caecal digestibility is a well-known method used to assess protein quality. This method
ensures the post-ileal microbial activity does not affect the results. The importance of this is
that in P availability studies, it implies that the urine contribution can be excluded and the
urinary excretion of P is a major pathway when intake is higher than required (Rodehutscord,
2009). Therefore the results are not confounded by urinary excretion even if the intake of P is
in excess of what is required by the bird (Li et al., 2016). A further advantage is that the
sensitivity of the method to the dietary level of P is less than other methods making it a further
desired method of P bioavailability assessment (Rodehutscord et al., 2012). This method
Stellenbosch University https://scholar.sun.ac.za

11
provides one with the amount of available P which can be used as a quantitative estimate of
phosphorus bioavailability (Li et al., 2016). However, Rodehutscord et al. (2012) found the
length of the ileum used when collecting the digesta influenced the results.
2.4.5 In Vitro Tests
The use of a chick assay to assess availability of P is labour intensive, time consuming and
expensive (Waldroup, 1999), and in an attempt to develop a faster and less expensive method,
the in vitro method was developed. However, this method was only applicable to iP sources
and furthermore, the studies conducted have had conflicting results leading to questions being
asked regarding the viability of the method (Waldroup, 1999).
An attempt by Bird et al. (1945), to link availability of P from different sources using bioassays
with chicks to the solubility of P in dilute acid (0.25% HCL) led to the conclusion that solubility
is a fast, yet imprecise, method of estimating availability. Gillis et al. (1948) further tested the
same data in 0.4% HCL and reported that its usefulness in estimating the availability is limited.
Gillis et al. (1962) later compared the solubility of different calcium phosphate sources to the
bone ash percentage in chicks and turkeys; the authors found no correlation between the
solubility tests and the bone ash responses. A more recent study by Gueguen (1999) stated that
water solubility should not be considered as an acceptable indicator for availability of
phosphates. It is therefore clear that no reliable method of evaluation of P availability through
in vitro is available (Shastak & Rodehutscord, 2013).
2.5 Phosphorus Sources
Phosphorus typically found in broiler diets is said to originate from three sources: plant feed
sources, animal feed sources and inorganic minerals (Mc Donald et al., 1997). With plant and
animal P being the largest supplier to the diet’s total phosphorus content (Viljoen, 2001a).
Nonetheless, the amount of P available within these sources is low, making supplementation
with inorganic P sources necessary (Soares, 1995; Viljoen, 2001a)
2.5.1 Plant feed phosphorus
It is a well-known fact that the majority of a broiler diet comprises of cereals, grains, seeds and
some by-products, all of which contain a certain percentage of phosphorus (0.9-14.2%) (Van
der Klis & Versteegh, 1999). However, near 70% percent of this phosphorus is unavailable to
Stellenbosch University https://scholar.sun.ac.za
12
monogastric animals (Viljoen, 2001a) as a particular portion of P is bound in the form of phytic
acid and can only be liberated by the enzyme phytase, which is produced during germination
(Viljoen, 2001a). Ruminants use endogenous phytase, which is present in the rumen to
hydrolyse the phytate P in order to render the phosphorus available (Raun et al., 1956).
However, monogastric animals lack this endogenous phytase leaving much of the phytate P
unavailable to the animal (Touchburn et al., 1999).
It was later assumed that the amount of P available to monogastric animals is one third of the
total P content. On the other hand, Van der Klis & Versteegh (1999) found there to be huge
variation in the phytate P of different plant feeds as well as within the sources themselves.
Reasons for this may be due to variations between the grains and seeds in terms of the phytase
present during germination.
2.5.2 Animal feed phosphorus
There are a number of ingredients commonly used in broiler feeds that are of animal origin and
are known to have a high phosphorus content (Viljoen, 2001a). The availability of this P is
considerably lower than that of the inorganic P sources, however it has a greater availability
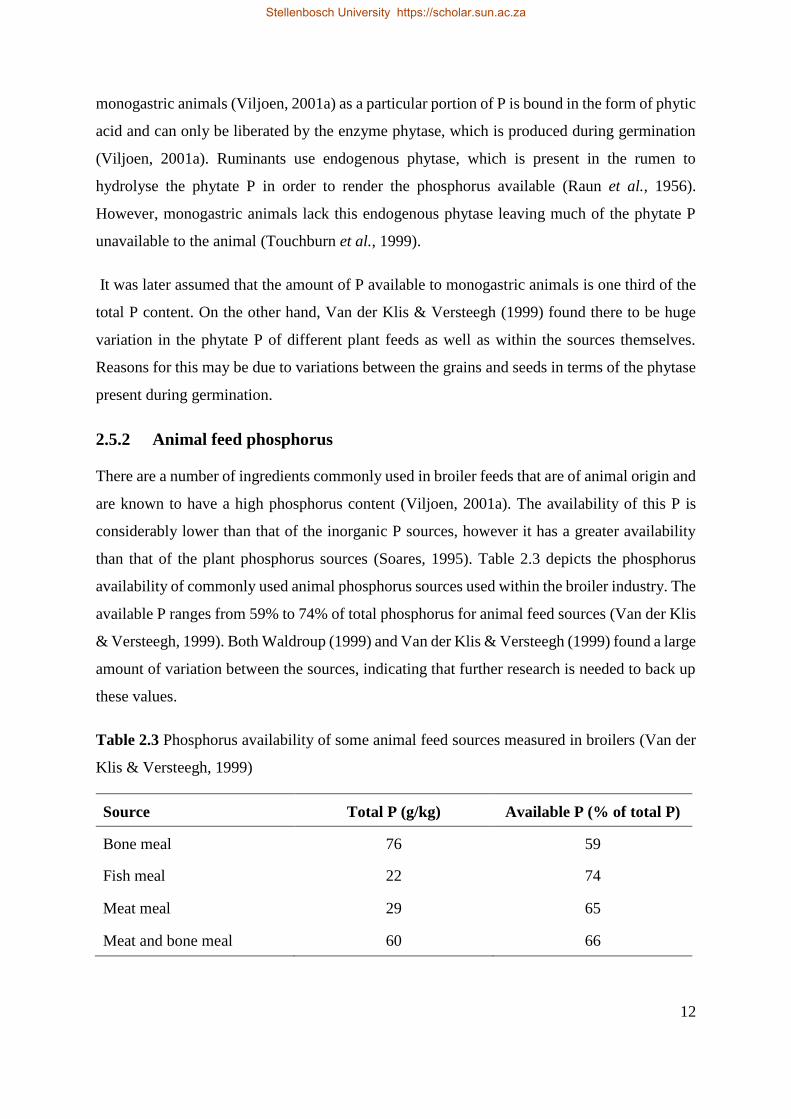
than that of the plant phosphorus sources (Soares, 1995). Table 2.3 depicts the phosphorus
availability of commonly used animal phosphorus sources used within the broiler industry. The
available P ranges from 59% to 74% of total phosphorus for animal feed sources (Van der Klis
& Versteegh, 1999). Both Waldroup (1999) and Van der Klis & Versteegh (1999) found a large
amount of variation between the sources, indicating that further research is needed to back up
these values.
Table 2.3 Phosphorus availability of some animal feed sources measured in broilers (Van der
Klis & Versteegh, 1999)
Source Total P (g/kg) Available P (% of total P)
Bone meal 76 59
Fish meal 22 74
Meat meal 29 65
Meat and bone meal 60 66
Stellenbosch University https://scholar.sun.ac.za

13
2.5.3 Inorganic feed phosphates
Before the late 1940’s, bone meal and phosphate rock were the most utilized P sources in
animal feeds. Since then there has been an increased demand for supplements with higher P
levels (Viljoen, 2001). The most common of these, which have been produced, tested and used,
have been listed in Table 2.4 together with their calcium and phosphorus percentages,
respectively. The most common compounds used within South Africa for animal use are mono-
dicalcium phosphate (MDCP) and dicalcium phosphate (DCP) (Viljoen, 2001).
Table 2.4 Inorganic feed phosphate supplements being utilized (Viljoen, 2001).
Product Ca (%) P (%)
Monosodium phosphate 0 25
Monocalcium phosphate*** 16 22
Monocalcium phosphate** 17 25
Mono-dicalcium phosphate* 18 21
Dicalcium phosphate**** 20 18
Dicalcium phosphate** 28 20
Tricalcium phosphate** 39 20
Defluorinated rock phosphate 34 18.5
*= hydrate **= anhydrate ***monohydrate ****= dihydrate
These calcium phosphate sources (MCP, DCP, TCP and MDCP) are mixtures of mono-, di-
and tricalcium phosphates formed by reacting phosphoric acid with calcium salts. The ratios of
these phosphates, which ultimately leads to the name by which the product is called, depend
on the conditions under which the reaction takes place; namely heat, water and pressure.
Furthermore, these conditions have an effect on the bioavailability of the product. An example
is dicalcium phosphate (DCP) produced through a reaction between defluorinated phosphoric
acid and a single or multiple lime source(s). This reaction, depending on conditions during
manufacture, results in either an anhydrate or a dehydrate product. These are both DCP,
however, the anhydrous form has been found to have an exceptionally lower bioavailability
than that of the hydrous form (Viljoen, 2001). Another form of phosphates, known as
defluorinated phosphates, are a product of a reaction between phosphoric acid and sodium
bicarbonate which is then calcined at 1.25 °C (Waldroup, 1999). This process is seen to be
Stellenbosch University https://scholar.sun.ac.za

14
more difficult to control that that used for calcium phosphate production, and as a result, there
is a much greater variability between the biological values compared to the calcium phosphates.
The choice of a particular inorganic supplement over another depends on its bioavailability,
cost, impurities it may contain, its’ handling properties and accessibility to the local market.
Most importantly is the relation between the amount of P it contains and the availability thereof.
Table 2.5 is a list of commonly utilized inorganic phosphate sources together with their
phosphorus compositions.
Table 2.5 Common inorganic phosphate sources and their phosphorus compositions (Van der
Klis & Versteegh, 1999).
Product Total P
(g/kg)
Average Total P
(g/kg)
Available P
(g/kg)
Monosodium phosphate 224 224 206.1
Monocalcium phosphate 220-228 226 189.8
Mono-dicalcium phosphate* 205-225 213 168.3
Dicalcium phosphate** 175-215 197 108.4
Dicalcium phosphate* 170-210 181 139.4
Defluorinated phosphate 175-195 180 106.2
*hydrous **anhydrous
2.6 Factors Influencing P Availability
There are a large number of factors affecting P availability that include the P form, Ca diet
concentration, ratio of Ca: P within the diet, Vitamin D3, protein, energy, fat, interactions of P
with other nutrients, particle size and feed processing, feed consumption, sex, age and growth
rate and management factors such as lighting and ambient temperature (Li et al., 2016). Prior
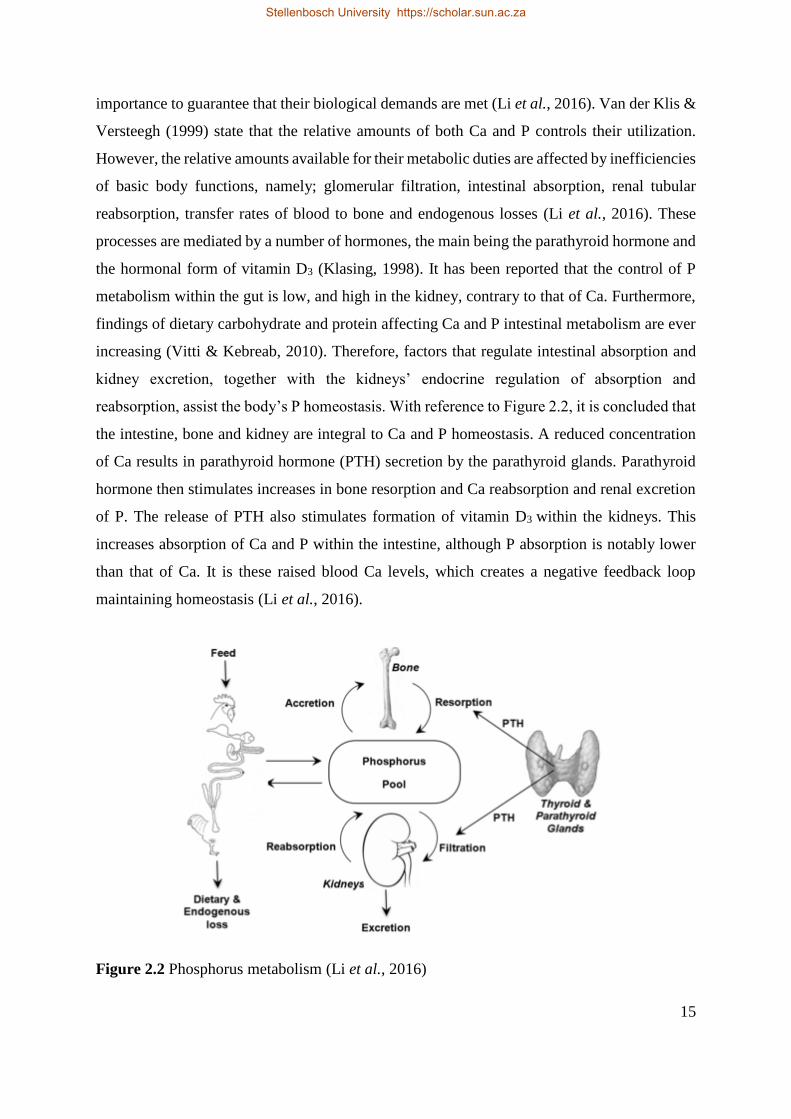
to discussing these factors, an understanding of the metabolism of phosphorus is required
(Figure 2.2).
Homeostasis of phosphorus is closely related to the metabolism of calcium (Ca) and vitamin
D. The skeleton is the primary storage facility for both Ca and P. This is where anionic and
cationic forms of P and Ca respectively bind, forming hydroxyapatite, giving the bone matrix
its rigidity (Van der Klis & Versteegh, 1999). This bone matrix is continually utilized and
reabsorbed. Therefore, coordination of the metabolism of these essential minerals is of utmost
Stellenbosch University https://scholar.sun.ac.za
15
importance to guarantee that their biological demands are met (Li et al., 2016). Van der Klis &
Versteegh (1999) state that the relative amounts of both Ca and P controls their utilization.
However, the relative amounts available for their metabolic duties are affected by inefficiencies
of basic body functions, namely; glomerular filtration, intestinal absorption, renal tubular
reabsorption, transfer rates of blood to bone and endogenous losses (Li et al., 2016). These
processes are mediated by a number of hormones, the main being the parathyroid hormone and
the hormonal form of vitamin D3 (Klasing, 1998). It has been reported that the control of P
metabolism within the gut is low, and high in the kidney, contrary to that of Ca. Furthermore,
findings of dietary carbohydrate and protein affecting Ca and P intestinal metabolism are ever
increasing (Vitti & Kebreab, 2010). Therefore, factors that regulate intestinal absorption and
kidney excretion, together with the kidneys’ endocrine regulation of absorption and
reabsorption, assist the body’s P homeostasis. With reference to Figure 2.2, it is concluded that
the intestine, bone and kidney are integral to Ca and P homeostasis. A reduced concentration
of Ca results in parathyroid hormone (PTH) secretion by the parathyroid glands. Parathyroid
hormone then stimulates increases in bone resorption and Ca reabsorption and renal excretion
of P. The release of PTH also stimulates formation of vitamin D3 within the kidneys. This
increases absorption of Ca and P within the intestine, although P absorption is notably lower
than that of Ca. It is these raised blood Ca levels, which creates a negative feedback loop
maintaining homeostasis (Li et al., 2016).
Figure 2.2 Phosphorus metabolism (Li et al., 2016)
Stellenbosch University https://scholar.sun.ac.za

16
2.6.1 Calcium and Ca: P Ratio
Calcium is essential to bone and shell formation as well as blood clotting and muscle
contraction (Li et al., 2016). The bioavailability of calcium within raw plant materials is
relatively low as a result of the high phytate content (Li et al., 2016). An increase in the
concentration of Ca and P within the diet can affect the digestion of both these minerals. Too
high levels of Ca and low levels of P has been shown to have negative effects on performance
in poultry (Li et al., 2016). The elevated Ca concentration causes an increase in the pH of the
gastrointestinal tract which is turn causes a decrease in P absorption and retention (Hurwitz &
Bar, 1965; Li et al., 2016). The increased Ca concentration also increases the gastrointestinal
pH and decreases phytate hydrolysis through the increased binding of Ca to phytate phosphorus
(Guinotte et al., 1995; Manangi & Coon, 2008). High levels of P also decreases the absorption
of Ca from the gut (Keshavarz & Austic, 1990).
Due to the effect dietary Ca levels has on P availability, deliberation has been held with regards
to maintaining a constant level of Ca or a Ca: P ratio when performing P availability tests.
Nelson & Walker (1964) found that a Ca: P ratio of 2: 1 is ideal, as it closely resembles that
retained by the chickens and meets their requirements. This was later confirmed by Leske &
Coon (2002) and Manangi & Coon (2008) who both found this ratio to maximize retention of
P.
2.6.2 Vitamin D
As mentioned in section 2.4.1, vitamin D plays has an integral role in Ca and P metabolism. It
is for this reason that diets now include vitamin D as a supplement. Vitamin D’s role in
absorption of Ca and P and regulation of the secretion of PTH increases bone ash density which
is linked to a decreased occurrence of bone injuries and disorders (Driver et al., 2005; Garcia
et al., 2013). The use of vitamin D supplements provides metabolised vitamin D to the animals,
causing an increased efficiency and reduced energy use (Garcia et al., 2013). Studies have also
shown that the form of vitamin D may play a part in reduced P excretion (Garcia et al., 2013).
Isomers of vitamin D also have the potential to act together with microbial phytase, causing an
improved P utilization in chicken diets (Roberson & Edwards, 1994; Mitchell & Edwards,
1996). Edwards (1993) reported that new isomers of Vitamin D have the ability to enhance the
intestinal phytase within broiler diets. Han et al. (2012) found the use of one alpha-
hydroxycholecalciferol (1α-OH D3) to improve chicken growth, meat colour as well as the tibia
Stellenbosch University https://scholar.sun.ac.za

17
quality when birds were fed P-deficient diets, further illustrating the importance and efficiency
of vitamin D in P retention. However, excess addition of vitamin D have shown to have no
further effect on productivity after saturation levels within the body are met (Li et al., 2016)
and much like many of the other minerals, knowledge on its role in P absorption on a molecular
level, is still limited.
2.6.3 Interactions
Minerals are crucial to everyday life due to their roles as protein stabilizers, enzyme cofactors,
regulators of acid-base balance and the secondary messengers (Hemati Matin et al., 2013).
Previously, the study of minerals and their requirements focused on one individual mineral at
a time. This however has been proven incorrect as interactions between minerals have been
reported (Nugara & Edwards, 1963; Davies & Reid, 1979; Henry & Miles, 2000). Now, animal
nutritionists agree that there is some degree of interaction between all dietary nutrients (Henry
& Miles, 2000), and there is a general understanding that to obtain the desired response from
an animal, there are ideal concentrations of each nutrient in relation to others (Hemati Matin et
al., 2013). Nonetheless, we do not have a complete understanding of the impact of these
interactions on the absorption, excretion, storage and utilization of other minerals (Henry &
Miles, 2000; Hemati Matin et al., 2013). The known interactions P has with other minerals are
depicted in Figure 2.3. The most prominent of these interactions is that with Ca and magnesium
(Mg)(Hemati Matin et al., 2013; Kleyn, 2013). The importance of P with Ca has been
highlighted in sections 2.6.1. Phosphorus can be found all over in nature; however, it is never
available in its free state. It is known to combine spontaneously and vigorously with oxygen
(Hemati Matin et al., 2013). Excess levels of Ca and P have been shown to cause an increase
in chickens’ Mg requirements (Nugara & Edwards, 1963). An increase in Mg by 0.2-0.4% has
shown to alleviate these effects (Chicco et al., 1967). However, an increase in Mg by 0.6%
negatively affected bone growth and mineralization irrespective of the dietary Ca and P levels.
This suggests that Mg metabolism may be related to the hormones and enzymes responsible
for bone mineralization (Hemati Matin et al., 2013).
Stellenbosch University https://scholar.sun.ac.za

18
Figure 2.3 Some of the known interactions between phosphorus and other minerals in the diet
(adapted from Kleyn, 2013).
2.6.4 Phytate
Phytate, a salt of phytic acid, is a compound which is naturally found within plant feedstuffs
(Reddy et al., 1982). Phosphorus and inositol are primarily stored in the form of phytate within
seeds (Hídvégi & Lásztity, 2002). Phytate also plays a role in maintaining homeostasis of P
levels and is very important for germination of seeds as well as plant growth itself (Lott et al.,
2000). Phytic acid has been found to form insoluble salts by creating complexes with divalent
or trivalent cations rendering their availability to absorption within the digestive system low
(Cheryan & Rackis, 1980; Singh, 2008). Phytic acid is known to reduce the availability of Ca
(Lönnerdal et al., 1989), P (Harrold et al., 1983), zinc (Davies & Olpin, 1979; Lönnerdal et al.,
1989), Mg (Brink et al., 1991) and iron (Brune et al., 1992).
Phytate bound phosphorus (in the form of phytic acid) originates from plant feed stuffs and a
large portion of this is unavailable to monogastric animals (Viljoen, 2001). Therefore, there is
need for supplementation of P using iP. Presence of this phytate bound P within the basal diet
may cause reduced P availability from a highly available source (Harrold et al., 1983).
However, there is reason to believe that excess available P within the basal diet could cause
Stellenbosch University https://scholar.sun.ac.za

19
further reduced P absorption from the test source as well (Viljoen, 2001; Leske & Coon, 2002;
Li et al., 2016). It is therefore clear that the P composition of the diet as well as any factors that
may affect phytate phosphorus use within the diet may cause misinterpretations of the results.
2.6.5 Phytase
Phytase is a digestive enzyme which catalyses the release of P from phytic acid, and is currently
the only enzyme known to break this bond (Shaw et al., 2010). In essence, the inositol
phosphate molecule is liberated to revert back to inositol, freeing the phosphate molecule,
giving it the potential to be absorbed and utilized by the animal (Viljoen, 2001). However, this
enzyme is found to be deficient within monogastric animals, therefore phytate hydrolysis is
low (Applegate et al., 2003; Classen et al., 2010). A large portion of P in cereal grains used in
poultry feed is bound within phytic acid and this is otherwise known as phytate phosphorus
(Viljoen, 2001). This P has varying availability but much of it is unavailable (Viljoen, 2001;
Leske & Coon, 2002). The low P availability as well as high levels of phytate phosphorus loss
through excretion causes for dietary supplementation with inorganic P. Loss of this phytate
phosphorus is detrimental; firstly, P is a big role player in much of the functions within the
body as mentioned in section 2.2.2 and the P in the manure can have environmental
implications in the form of for example, water eutrophication (Waldroup, 1999; Driver, 2004;
Rodehutscord, 2009; Classen et al., 2010; Shastak, 2012; Li et al., 2016).
Supplementation with exogenous phytase significantly increases phytate phosphorus
utilization in poultry (Baxter et al., 2003; Angel et al., 2006; Bougouin et al., 2014). Not only
does it hydrolyse the bond between phytate and P but also the bonds between phytate and other
minerals (mentioned in section 2.6.3) leading to an overall increase in the availability of these
minerals (Kornegay et al., 1996). However, the phytate and dietary phosphorus levels have the
potential to influence phytase efficiency. Diets with varying phytic acid and low npP levels
were supplemented with exogenous phytase (Ravindran et al., 2000). It was reported by the
authors that an increase of 18.6% in phytate phosphorus digestibility was found between diets
with phytic acid levels of 10.4 and 15.7 g/kg. Both diets had a low npP level of 0.23 g/kg.
However, the phosphorus digestibility decreased when the diets had adequate npP levels.
Bearing in mind that phytase liberates other minerals; it is possible that this hydrolysis of the
bonds between phytate and phytate-bound proteins increases the availability of the proteins.
Stellenbosch University https://scholar.sun.ac.za
20
Sebastial et al. (1997) reported that phytase would reduce the phytate levels within a diet and
consequently improve amino acid digestibility through reducing the effects phytate has on
proteases. Moreover, due to the expense of phytase supplement in diets, the enhanced protein
utilization improves the cost effectiveness of the phytases.
2.6.6 Hydration state
The manufacturing of iP results in the formation of either a hydrous or an anhydrous product.
This is subject to the quality of raw materials used and the conditions during manufacturing
(Viljoen, 2001). The hydrous form has been found to have a much greater P availability
compared to the anhydrous form (Potter et al., 1995; De Groote & Huyghebaert, 1997; Van
der Klis & Versteegh, 1999; Viljoen, 2001). Potter et al. (1995) reported monohydrated MCP
to have the highest availability than any of the other sources. De Groote & Huyghebaert (1997)
revealed the availability values for a hydrous and anhydrous DCP to be 74.2% and 63.3%,
respectively and Van der Klis & Versteegh (1999) reported values of 77 and 55%, respectively
for the same sources.
2.6.7 Inorganic phosphate source
It is now common knowledge to assume that not all phosphorus found within the diet is 100%
available. However, inorganic sources have been identified to contain the highest P availability
and that differences are present between the various sources (Viljoen, 2001). In addition, as
mentioned earlier, a portion of plant phosphates are bound to phytic acid causing it to be
unavailable to chickens hence its mention being unnecessary.
A test using the three calcium phosphates (mono-, di- and tri-) performed by Gillis et al. (1962),
found the monocalcium phosphate (MCP) to have the highest P availability, followed by
dicalcium (DCP) with tricalcium phosphate (TCP) having the lowest P availability. However,
there have been variations in the actual values of P bioavailability. Findings by Potchanakorn
& Potter (1987) reported average values of P bioavailability of 92.6, 81.2 and 69.6% for MCP,
DCP and defluorinated phosphate, respectively. This is similar to findings of Gillis et al. (1962)
in terms of MCP and DCP P availability however, exact value differences between the two
studies are evident. In one trial by De Groote & Huyghebaert (1997), values of 78.1 and 74.2%
for MCP and DCP respectively where reported whilst in the second trial the values increased
by 8.7 and 9.8%, respectively. However, defluorinated rock phosphates were not tested in the
Stellenbosch University https://scholar.sun.ac.za

21
second study. This illustrates how availabilities can differ between sources as well as within
the sources. Table 2.6 shows the variation in available P between the inorganic phosphates to
be between 55 and 92%. An earlier study by Huyghebaert et al. (1980) tested a number of
commercial phosphates for broilers against a reference source (di-Na-phosphate). Particularly
two defluorinated rock phosphates were evaluated; percentage of P were 18.5 and 18.11 with
available P at 96 and 94%, respectively. A later study by Potchanakorn & Potter (1987) found
similar phosphorus percentage results when testing two defluorinated rock phosphates.
However, the reported availabilities of the two sources were substantially lower at 69.9 and
75.5%, respectively.
Table 2.6 Common inorganic feed phosphates and their availabilities (Van der Klis &
Versteegh, 1999)
Phosphate Source Available P
(% of total P) Available P (g/kg)
Dicalcium Phosphate (anhydrous) 55 108.4
Dicalcium Phosphate (hydrous) 77 139.4
Monocalcium Phosphate 84 189.8
Mono-dicalcium Phosphate 79 168.3
Monosodium phosphate 92 206.1
2.7 Conclusion
In light of all that has been discussed above, the importance of phosphorus in the broiler
industry is evident. More specifically, the importance of formulating a diet to meet the needs
of a broiler without over supplying P, and in doing so, removing the implications that excess P
has on the environment and also increasing the farmer’s profit margins is self-evident.
However, all sources of phosphorus vary in terms of availability and a number of effectors
within the diet may alter these values further. Therefore, it is of utmost importance to ensure
the availability of the P in the source is known, making sure the method used to assess
availability allows for accurate assignment of a P bioavailability value before using it in
production. Furthermore, the method needs to be repeatable and be applicable to any
phosphorus source.
Stellenbosch University https://scholar.sun.ac.za

22
Phosphoric acid (PA) in poultry diets is not widely used due to no viable PAs being available.
However, a defluorinated PA and a defluorinated and desulfonated PA has become available
locally. Therefore, it is important to conduct a study assessing the bioavailability of P in the
PAs and furthermore determine what effects the PAs have on production parameters and
physical carcass characteristics whilst being subjected to the same conditions.
2.8 References
Ackerson, C. W., Blish, M. J., & Mussehl, F. E. 1924. A study of phosphorus, calcium and
alkaline reserve of the blood Sera of normal and rachitic chicks. J. Biol. Chem. 63: 75-
84.
Ammerman, C. B., Douglas, C. R., Davis, G. K., & Harms, R. H. 1961. Comparison of
Phosphorus Availability Assay Techniques for Chicks. Poult. Sci. 40: 548-553
Angel, R. 2011. Calcium and phosphorus in broilers and laying hens. In: The 22nd annual
Australian Poultry Science Symposium. Sydney, New South Wales. pp 30-42.
Angel, R., Saylor, W. W., Mitchell, A. D., Powers, W., & Applegate, T. J. 2006. Effect of
dietary phosphorus, phytase, and 25-hydroxycholecalciferol on broiler chicken bone
mineralization, litter phosphorus, and processing yields. Poult. Sci. 85: 1200-1211.
Anselme, P. 2003. Phosphorus in poultry nutrition. Key elements for performance and animal
health. In: Feed Magazine. 1: 1-4.
Applegate, T. J., Angel, R., & Classen, H. L. 2003. Effect of dietary calcium, 25-
hydroxycholecalciferol, or bird strain on small intestinal phytase activity in broiler
chickens. Poult. Sci. 82: 1140-1148.
Baird, F. D., & MacMillan, M. J. 1942. Use of toes rather than tibiae in A.O.A.C. chick method
of vitamin D determinations. J. Assoc. Off. Agric. Chem. 25: 518-524.
Bar, A., & Hurwitz, S. 1984. Egg shell quality, medullary bone ash, intestinal calcium and
phosphorus absorption, and calcium-binding protein in phosphorus-deficient hens.
Poult. Sci. 63: 1975-1979.
Stellenbosch University https://scholar.sun.ac.za
23
Baxter, C. A., Joern, B. C., Ragland, D., Sands, J. S., & Adeola, O. 2003. Phytase, high-
available-phosphorus corn, and storage effects on phosphorus levels in pig excreta. J.
Environ. Qual. 32: 1481-1489.
Bougouin, A., Appuhamy, J. A. D. R. N., Kebreab, E., Dijkstra, J., Kwakkel, R. P., & France,
J. 2014. Effects of phytase supplementation on phosphorus retention in broilers and
layers: a meta-analysis. Poult. Sci. 93: 1981-1892.
Brink, E. J., Dekker, P. R., Van Beresteijn, E. C. H., & Beyhen, A. C. 1991. Inhibitory effect
of dietary soybean protein vs. casein on magnesium absorption in rats. J. Nutr. 121:
1374-1381.
Brune, M., Rossander-Hulten, L., Hallberg, L., Gleerup, A., & Sandberg, A. 1992. Iron
absorption from bread in humans: inhibiting effects of cereal fibre, phytate and inositol
phosphates with different numbers of phosphate groups. J. Nutr. 122: 442-449.
Buckner, G. D., Martin, J. H., & Insko, W. M. 1930. Calcium and phosphorous requirements
of the growing chick. Poult. Sci. 9: 235-238.
Cheryan, M., & Rackis, J. 1980. Phytic acid interactions in food systems. C R C Crit. Rev.
Food Sci. Nutr. 13: 297-335.
Chicco, C. F., Ammerman, C. B., Van Walleghem, P. A., Waldroup, P. W., & Harms, R. H.
1967. Effects of varying dietary ratios of magnesium, calcium and phosphorus in
growing chicks. Poult. Sci. 46: 368-373.
Classen, H. L., Maenz, D. D., & Caruthers, C. 2010. Ingredient considerations, totals phytate
concentrations and susceptibility of phytate to hydrolysis. In: 1st International Phytase
Summit. pp 173-177.
Davies, N. T., & Olpin, S. E. 1979. Studies on the phytate : zinc molar contents in diets as a
determinant of Zn availability to young rats. Br. J. Nutr 41: 591-603.
Davies, N. T., & Reid, H. 1979. An evaluation of the phytate, zinc, copper, iron and manganese
contents of, and Zn availability from, soya-based textured-vegetable-protein meat-
substitutes or meat-extenders. Br. J. Nutr. 41: 579-589.
Stellenbosch University https://scholar.sun.ac.za

24
De Groote, G., & Huyghebaert, G. 1997. The bio-availability of phosphorus from feed
phosphates for broilers as influenced by bio-assay method, dietary Ca-level and feed
form. Anim. Feed Sci. Technol. 69: 329-340.
Dhandu, A. S., & Angel, R. 2003. Broiler nonphytin phosphorus requirement in the finisher
and withdrawal phases of a commercial four-phase feeding system. Poult. Sci. 82:
1257-1265.
Driver, J. 2004. Performance and bone quality of the modern broiler chicken as influenced by
dietary calcium, phosphorus, phytase and 1-alpha-hydroxycholecalciferol. PhD Diss.
Univ. of Georgia, Athens, Georgia.
Driver, J. P., Pesti, G. M., Bakalli, R. I., & Edwards, H. M. 2005. Calcium requirements of the
modern broiler chicken as influenced by dietary protein and age. Poult. Sci. 84: 1629-
1639.
Edwards, H. M. 1993. Dietary 1,25-dihydroxycholecalciferol supplementation increases
natural phytate phosphorus utilization in chickens. J. Nutr. 123: 567-77.
Garcia, A. F. Q. M., Murakami, A. E., Do Amaral Duarte, C. R., Rojas, I. C. O., Picoli, K. P.,
& Puzotti, M. M. 2013. Use of vitamin D3 and its metabolites in broiler chicken feed
on performance, bone parameters and meat quality. Asian-Australasian J. Anim. Sci.
26: 408-415.
Gardiner, E. E. 1962. The relationship between dietary phosphorus level and the level of
plasma inorganic phosphorus of chicks. Poult. Sci. 41: 1156-1163.
Gillis, M. B., Norris, L. C., & Heuser, G. F. 1948. The Utilization by the chick of phosphorus
from different sources. J. Nutr. 35: 195-207.
Gillis, M. B., Norris, L. C., & Heuser, G. F. 1954. Studies on the biological value of inorganic
phosphates. J. Nutr. 52: 115-125.
Gueguen, L. 1994. Determination of availability. In: Feed Mix: the international journal on
feed, nutrition and technology. Special issue on Phosphates. Misset International. pp
12-15.
Stellenbosch University https://scholar.sun.ac.za
25
Guinotte, F., Gautron, J., Nys, Y., & Soumarmon, A. 1995. Calcium solubilization and
retention in the gastrointestinal tract in chicks (Gallus domesticus) as a function of
gastric acid secretion inhibition and of calcium carbonate particle size. Br. J. Nutr. 73:
125-139.
Han, J. C., Wang, Y. L., Qu, H. X., Liang, F., Zhang, J. L., Shi, C. X., Zhang, X. L., Li, L.,
Xie, Q., Wang, C. L., Yan, Y. Y., Dong, X. S., & Cheng, Y. H. 2012. One alpha-
hydroxycholecalciferol improves growth performance, tibia quality, and meat color of
broilers fed calcium- and phosphorus-deficient diets. Asian-Australasian J. Anim. Sci.
25: 267-271.
Harrold, R. L., Slanger, W. D., Haugse, C. N., & Johnson, R. L. 1983. Phosphorus
bioavailability in the chick: effects of protein source and calcium level. J. Anim. Sci.
57: 1173-1181.
Hart, E. B., Halpin, J. G., & Steenbock, H. 1922. The nutritional requirements of baby chicks
II. Further Study of Leg Weakness in Chickens. J. Biol. Chem. 52: 379-386.
Havenstein, G. B., Ferket, P. R., Scheideler, S. E., & Larson, B. T. 1994. Growth, liveability,
and feed conversion of 1957 vs 1991 broilers then fed ‘typical’ 1957 and 1991 broiler
diets. Poult. Sci. 73: 1785-1794.
Hegsted, D. M. 1973. Calcium and phosphorus. In: Modern nutrition in health and disease. Lea
and Febiger, Philadelphia. pp 163-174. (cited by Payne, 2005).
Hemati Matin, H. R., Dashtbin, F., & Salari, J. 2013. Absorption and macromineral interactions
in broiler production: An overview. Glob. Vet. 11: 49-54.
Henry, P., & Miles, R. 2000. Interactions among the trace minerals. Ciência Anim. Bras. 1: 95-
105.
Hídvégi, M., & Lásztity, R. 2002. Phytic acid content of cereals and legumes and interaction
with proteins. Period. Pol Yyechnica Ser. Chem. Eng. 46: 59-64.
Hurwitz, S. 1964. Estimation of net phosphorus utilization by the ‘slope’ method. J. Nutr. 84:
83-92.
Stellenbosch University https://scholar.sun.ac.za
26
Hurwitz, S., & Bar, A. 1965. Absorption of calcium and phosphorus along the gastrointestinal
tract of the laying fowl as influenced by dietary calcium and egg shell formation. J.
Nutr. 86: 433-438.
Huyghebaert, G., Groote, G. D. E., & Keppens, L. 1980. The relative biological availability of
phosphorus in feed phosphates for broilers. Annales de zootechnie. 29: 245-263.
Keshavarz, K., & Austic, R. E. 1990. Effects of dietary minerals on acid-base balance and
eggshell quality in chickens. J. Nutr. 120: 1360-1369.
Klasing, K. C. 1998. Comparative avian nutrition. CAB International, Wallingford, UK. pp 16-
236.
Kleyn, R. 2013. Chicken Nutrition. A guide for nutritionists and poultry professionals. Context
Products Ltd, Packington, Leicestershire, England. pp 67-78.
Kornegay, E. T., Denbow, D. M., Yi, Z., & Ravindrant, V. 1996. Response of broilers to graded
levels of microbial phytase added to maize-soyabean-meal-based diets containing three
levels of non-phytate phosphorus. Br. J. Nutr. 75: 839-852.
Leske, K., & Coon, C. 2002. The development of feedstuff retainable phosphorus values for
broilers. Poult. Sci. 81: 1681-1693.
Li, X., Zhang, D., Yang, T., & Bryden, W. 2016. Phosphorus bioavailability: A key aspect for
conserving this critical animal feed resource with reference to broiler nutrition.
Agriculture. 6: 1-25.
Lima, F. R., Mendonc, C. X., Alvarez, J. C., Ghion, E., & Leal, P. M. 1997. Biological
evaluations of commercial dicalcium phosphates as sources of available phosphorus for
broiler chicks. Poult. Sci. 72: 1707-1713.
Lönnerdal, B., Sandberg, A. S., Sandström, B., & Kunz, C. 1989. Inhibitory effects of phytic
acid and other inositol phosphates on zinc and calcium absorption in suckling rats. J.
Nutr. 119: 211-214.
Lott, J. N. A., Ockenden, I., Raboy, V., & Batten, G. D. 2000. Phytic acid and phosphorus in
crop seeds and fruits: a global estimate. Seed Sci. Res. 10: 11-33.
Stellenbosch University https://scholar.sun.ac.za

27
Manangi, M. K., & Coon, C. N. 2008. Phytate phosphorus hydrolysis in broilers in response to
dietary phytase, calcium, and phosphorus concentrations. Poult. Sci. 87: 1577-1586.
Mc Donald, P., Edwards, R. A., Greenhalgh, J. F. D., & Morgan, C. A. 1997. Animal Nutrition.
5th ed. Longman Press. Prentice Hall, Eddinburgh Gate, Harlow, Essex. pp 101-105
Miles, R. D., & Henry, P. R. 1997. Defluorinated phosphate may provide advantages.
Feedstuffs. pp 12-15. (cited by Payne, 2005)
Mitchell, R. D., & Edwards, H. M. 1996. Effects of phytase and 1,25-dihydroxycholecalciferol
on phytate utilization and the quantitative requirement for calcium and phosphorus in
young broiler chickens. Poult. Sci. 75: 95-110.
Moran, E. T., & Todd, M. C. 1994. Continuous sub-marginal phosphorus with broilers and the
effect of pre-slaughter transportation: carcass defects, further-processing yields, and
tibia-femur integrity. Poult. Sci. 73: 1448-1457.
National Research Council. 1994. Nutrient Requirements of Poultry (9th ed.). National
Academy Press, Washington, D.C, USA.
Nugara, D., & Edwards, H. M. J. 1963. Influence of dietary Ca and P levels on the Mg
requirement of the chick. J. Nutr. 80: 181-184.
Payne, S. G. 2005. The phosphorus availability of feed phosphates in broilers. MSc (Agric),
Stellenbosch Univ. South Africa.
Potter, L. M., Potchanakorn, M., Ravindran, V., & Kornegay, E. T. 1995. Bioavailability of
phosphorus in various phosphate sources using body weight and toe ash as response
criteria. Poult. Sci. 74: 813-820.
Rath, N. C., Huff, G. R., Huff, W. E., & Balog, J. M. 2000. Factors regulating bone maturity
and strength in poultry. Poult. Sci. 79: 1024-1032.
Raun, A., Cheng, E., & Burroughs, W. 1956. Phytate phosphorus hydrolysis and availability
to rumen microorganisms. J. Agric. Fd Chem. 4, 869–871.
Stellenbosch University https://scholar.sun.ac.za
28
Ravindran, V., Cabahug, S., Ravindran, G., Selle, P. H., & Bryden, W. L. 2000. Response of
broiler chickens to microbial phytase supplementation as influenced by dietary phytic
acid and non-phytate phosphorous levels. II. Effects on apparent metabolisable energy,
nutrient digestibility and nutrient retention. Br. Poult. Sci. 41: 193-200.
Reddy, N. R., Sathe, S. K., & Salunkhe, D. K. 1982. Phytates in legumes and cereals. Adv.
Food Res. 28: 1-92.
Roberson, K. D., & Edwards, H. M. 1994. Effects of 1,25-dihydroxycholecalciferol and
phytase on Zinc utilization in broiler chicks. Poult. Sci. 73: 1312-1326.
Rodehutscord, M. 2009. Approaches and challenges for evaluating phosphorus sources for
poultry. In: World Poultry Science Association, 17th European Symposium for Poultry
Nutrition. Edinburgh, UK. pp 2-6.
Rodehutscord, M. 2013. Determination of phosphorus availability in poultry. Worlds. Poult.
Sci. J. 69: 687-698.
Rodehutscord, M., Dieckmann, A., Witzig, M., & Shastak, Y. 2012. A note on sampling digesta
from the ileum of broilers in phosphorus digestibility studies. Poult. Sci. 91: 965-971.
Shastak, Y. 2012. Evaluation of the availability of different mineral phosphorus sources in
broilers. PhD (Agric) Dissertation, University of Hohenheim, Germany.
Shastak, Y., & Rodehutscord, M. 2013. Determination and estimation of phosphorus
availability in growing poultry and their historical development. Worlds. Poult. Sci. J.
69: 569-586.
Shaw, A. L., Blake, J. P., & Gordon, R. W. 2010. Evaluation of commercial phytase enzymes
on performance and tibia-breaking strength of male broiler chicks. J. Appl. Poult. Res.
19: 415-421.
Singh, P. K. 2008. Significance of phytic acid and supplemental phytase in chicken nutrition:
a review. A Rev. Worlds Poult. Sci. J. 64: 553-580.
Stellenbosch University https://scholar.sun.ac.za

29
Soares, J. 1995. Phosphorus bioavailability. In: Bioavailability of Nutrients for Animals:
Amino Acids, Minerals, Vitamins. Academic Press, San Diego, California, USA. pp
257-294.
Summers, J. D., Slinger, S. J., Pepper, W. F., Motzok, I., & Ashton, G. C. 1959. Availability
of phosphorus in soft phosphate and phosphoric acid and the effect of acidulation of
soft phosphate. Poult. Sci. 38: 1168-1179.
Touchburn, S. P., Sebastian, S., & Chaves, E. R. 1999. Phytase in poultry nutrition. In: Recent
developments in animal nutrition. Nottingham University Press, Nottingham, UK. pp
147-164.
Van der Klis, J. D., & Versteegh, H. A. J. 1999. Phosphorus nutrition of poultry. In: Recent
Developments in Poultry Nutrition 2. Nottingham University Press, Nottingham, UK.
pp 309-320.
Vandepopuliere, J. M., Ammerman, C. B., & Harms, R. H. 1961. The relationship of calcium-
phosphorus ratios to the utilization of plant and inorganic phosphorus by the chick.
Poult. Sci. 40: 951-957.
Viljoen, J. 2001. Quality of feed phosphate supplements for animal nutrition. S. Afr. J. Anim.
Sci. 2: 13-19.
Vitti, D. M. S. S., & Kebreab, E. 2010. Phosphorus and calcium utilization and requirements
in farm animals. CAB International, Wallingford, Oxfordshire, UK. pp 6-111
Waldroup, P. W. 1999. Nutritional approaches to reducing phosphorus excretion by poultry.
Poult. Sci. 78: 683-691.
Williams, B., Solomon, S., Waddington, D., Thorp, B., & Farquharson, C. 2000. Skeletal
development in the meat-type chicken. Br. Poult. Sci. 41: 141-149.
Yoshida, M., & Hoshii, H. 1977. Improvement of Biological Assay to Determine Available
Phosphorus with Growing Chicks. Japanese Poult. Sci. 14: 33-44.
Stellenbosch University https://scholar.sun.ac.za
30
Chapter 3
The evaluation of phosphorus bioavailability and total intestinal
tract digestibility of phosphoric acid in broiler diets
3.1 Abstract
This study assessed the bioavailability of phosphorus (P) in defluorinated phosphoric acid, as
well as the nutrient (fibre, fat, ash and protein) and mineral digestibility and apparent
metabolisable energy of broiler chicken diets supplemented with defluorinated PA. Fifty day-
old chicks were assigned to one of five dietary treatments. A summit and a dilution diet were
mixed to contain the same amount of available P. The summit diet used a standard mono-
dicalcium phosphate (MDCP) as its source of P supplement and the dilution diet used
defluorinated PA as its source of P supplement. The treatment diets were then mixed to contain
different ratios of the summit and dilution diet. These ratios were 100:0, 75:25, 50:50, 25:75
and 0:100 respectively. From day 0-14 the birds were on the same diet. The birds were then
placed into individual cages that had been allocated with one of the five treatment diets. The
birds were allowed to adapt to their respective feeds for four days. Thereafter, the trial
commenced, where the faecal samples, daily intake and refusal samples were collected every
morning. Treatment significantly affected the P bioavailability, as well as the coefficient of the
total tract digestibility (CTTD) values of P, sodium (Na), iron (Fe), copper (Cu), zinc (Zn),
manganese (Mn) and aluminium (Al). The P bioavailability was the highest for the diet with
100% PA as its source of P supplement. This diet further revealed ideal CTTD values for all
nutrients and minerals.
3.2 Introduction
The level of nutrient ingestion, digestion and absorption can be related to the performance level
of an animal. Animals with access to highly digestible feed tend to perform better than those
fed feed with poor digestibility. Superior growth performance has been found in broilers fed
on feeds with particularly high dry matter, ether extract, crude protein and phosphorus
digestibility values (Emami et al., 2013; Thiamhirunsopit et al., 2014). Formulation of modern
broiler diets requires ingredients that have a known digestibility value, which can be
incorporated into the formulation, allowing for the best performance from the animal and
Stellenbosch University https://scholar.sun.ac.za

31
reduced waste in terms of undigested nutrients. Chemical analysis can be used to determine the
value of an ingredient for supplying a particular nutrient. However, actual values can only be
obtained after allowing for losses, which occur during digestion, absorption and metabolism
(Borin et al., 2002).
Phosphorus (P) is the second most abundant element for a broiler and plays a vital role in both
the soft and hard tissue of the body (de Carvalho Mello et al., 2012). The requirements and
absorption of P are influenced by numerous factors (De Groote & Huyghebaert, 1997;
Kornegay, 2000; Driver, 2004; Angel, 2010; de Carvalho Mello et al., 2012; Shastak, 2012; Li
et al., 2016). Broiler diets consist primarily of plant origin, which has variable levels of total P
(tP)(0.9-17.2%)(Van der Klis & Versteegh, 1999). However, a large portion of this P (70%) is
bound to phytate and monogastric animals lack phytase enzymes, which liberates P from its
chemical bond to phytate (Classen et al., 2010); therefore, much of the phytate bound P is
considered unavailable (Viljoen, 2001a; Leske & Coon, 2002). This has led to broiler diet
supplementation with inorganic phosphates (iP) with greater levels of available P (aP)(Viljoen,
2001a). However, P supplements are expensive and P excretion caused by an oversupply of P
is known to be damaging to the environment (De Groote & Huyghebaert, 1997). Diets therefore
need an accurate supply of P to alleviate these issues as far as possible and knowledge of
bioavailability values of the iP sources (Rodehutscord, 2013) as well as the requirements during
different production stages is essential (Viljoen, 2001b).
The full absorption and utilization of an element is never attainable, as losses occur through
normal digestion and metabolism. Many techniques have been developed to determine what
portion of the element an animal will utilize and this has led to a number of terms being used,
which can cause confusion. The most often used terminology is digestibility and bioavailability
and these are frequently confused with one another (Viljoen, 2001b). Using P as an example,
“digestibility is the amount of phosphorus ingested minus the amount voided in the faeces,
including exogenous losses” whilst bioavailability is “the portion of a mineral that is retained
in the body” (Viljoen, 2001b).
Studies on P bioavailability date back as far as the late 1920’s. Thereafter, determination and
comparison of the available P content in different P sources have developed considerably, with
a number of published studies testing the P availability of commercial and experimental
phosphate sources within the broiler industry (Gillis et al., 1962; Nelson & Walker, 1964;
Stellenbosch University https://scholar.sun.ac.za

32
Huyghebaert et al., 1980; Potchanakron & Potter, 1987; Potter et al., 1995; Lima et al., 1997;
De Groote & Huyghebaert, 1997; Van der Klis & Versteegh, 1999; Rama Rao & Ramasubba
Reddy, 2001a; Leske & Coon, 2002; Li et al., 2016)
Factors that influence the choice of P supplement include the bioavailability, cost, accessibility,
handling properties and the chemical composition (Payne, 2005). Within South Africa, mono-
dicalcium phosphate (MDCP) and dicalcium phosphate (DCP) are the commonly used iP
sources (Viljoen, 2001a) that have 79%, and 77% available P respectively (Van der Klis &
Versteegh, 1999). All of these products are made by reacting calcium salts with phosphoric
acid (PA)(Lima et al., 1997; Viljoen, 2001a). However, the iP products have been known to
contain undesirable elements owing to the nature of the raw materials used. These elements are
fluorine (F), lead (Pb), mercury (Hg) and arsenic (As), with the possibility of being toxic to
animals and negatively influencing P availability (Viljoen, 2001a; Rama Rao & Ramasubba
Reddy, 2003) In light of this, the objectives of this study are:
i. To investigate the bioavailability of defluorinated phosphoric acid by means of a
digestibility study.
ii. To evaluate the effects of defluorinated phosphoric acid on nutrient and mineral
apparent digestibility coefficients.
3.3 Materials and Methods
3.3.1 Birds and housing
Before any trials were performed, ethical clearance was obtained from Stellenbosch University
Ethics Board, clearance number SU-ACUM13-00006. For the purpose of this trial, 50 day-old
Cobb 500 chicks were obtained from a commercial hatchery and transported to Stellenbosch
University experimental farm, Mariendahl, where the trial was conducted. Five cages (0.9m by
0.6m) were initially used to house the chicks for the first 14 days at a stocking density of 10
chicks per cage. Thereafter, the birds were separated into individual cages (0.45m by 0.6m),
which had been allocated with one of five dietary treatments. Each cage was equipped with a
nipple drinker and feeder. After an adaption period and the sample collection period, the birds
were returned to their initial cages, with the same stocking density as before being separated,
and grown out until slaughter at 35 days of age. The lighting and environmental humidity and
temperature within the house were maintained according to the Cobb 500 standards throughout
Stellenbosch University https://scholar.sun.ac.za
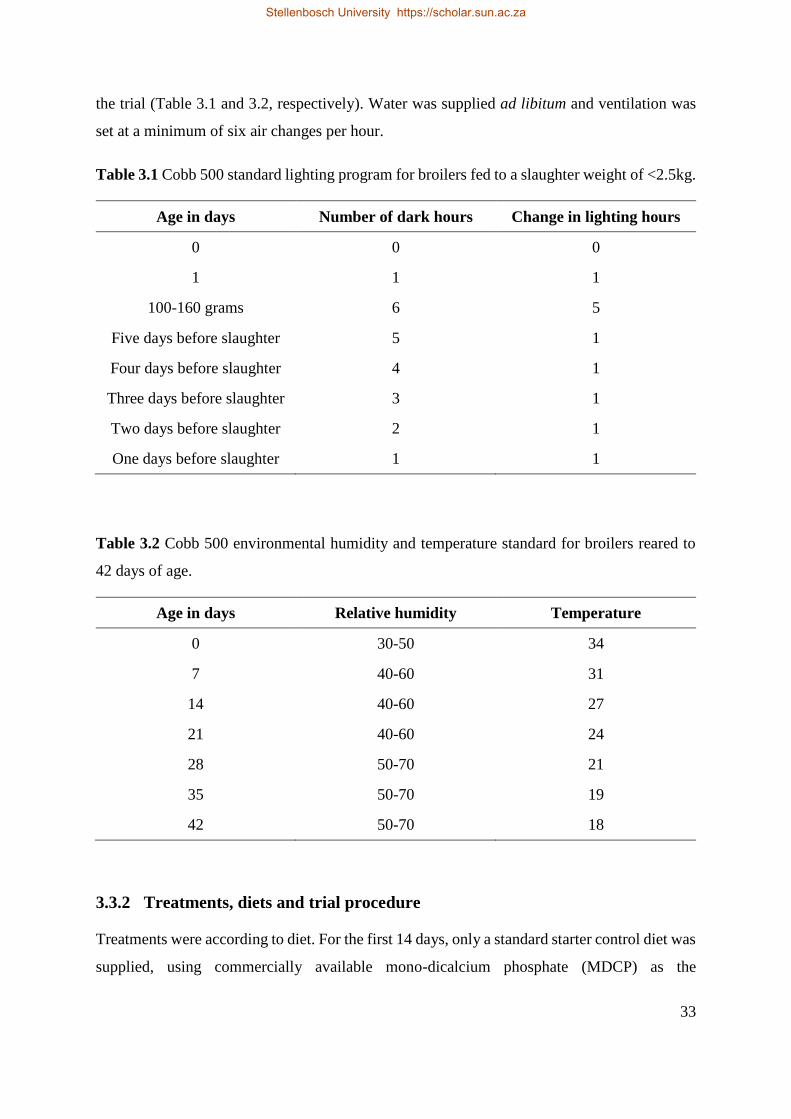
33
the trial (Table 3.1 and 3.2, respectively). Water was supplied ad libitum and ventilation was
set at a minimum of six air changes per hour.
Table 3.1 Cobb 500 standard lighting program for broilers fed to a slaughter weight of <2.5kg.
Age in days Number of dark hours Change in lighting hours
0 0 0
1 1 1
100-160 grams 6 5
Five days before slaughter 5 1
Four days before slaughter 4 1
Three days before slaughter 3 1
Two days before slaughter 2 1
One days before slaughter 1 1
Table 3.2 Cobb 500 environmental humidity and temperature standard for broilers reared to
42 days of age.
Age in days Relative humidity Temperature
0 30-50 34
7 40-60 31
14 40-60 27
21 40-60 24
28 50-70 21
35 50-70 19
42 50-70 18
3.3.2 Treatments, diets and trial procedure
Treatments were according to diet. For the first 14 days, only a standard starter control diet was
supplied, using commercially available mono-dicalcium phosphate (MDCP) as the
Stellenbosch University https://scholar.sun.ac.za

34
supplemented phosphorus source. Formulation was performed using Winfeed. Thereafter, two
grower and finisher diets were formulated, namely a summit diet, containing a standard MDCP
as the supplemented phosphorus source, and a dilution diet containing a defluorinated
phosphoric acid as the supplemented phosphorus source. Table 3.3 shows the composition of
the diets. The dilution and summit diets were blended in ratios of 100:0; 75:25; 50:50; 25:75
and 0:100 respectively. These diets were then used for the remaining duration of the trial. All
diets were mixed at Mariendahl experimental farm and fed as mash diets.
At day 14, birds were separated into individual cages where they adapted to their respective
experimental diets for four days. From day 18, to the end of the 4 day sampling period, feed
intake and refusal were measured to determine daily feed intake. On day 18, the cages were
fitted with faecal collection trays, which had been outlined with a clear sheet of plastic. Faecal
trays were cleared daily. Each bird was supplied with a specific amount of feed, in grams, based
on the amounts obtained during the adaptation period. These amounts were bird specific.
Stellenbosch University https://scholar.sun.ac.za

35
Table 3.3 Ingredient (%) and calculated nutrient composition of the broiler grower and finisher
diets used in the trial
Ingredients Grower Finisher
Dilution Summit Dilution Summit
Maize 51.5 51.1 57.6 57.2
Soybean full fat 15.0 15.0 15.0 15.0
Soybean 46 24.8 24.9 18.8 18.9
L-lysine HCl 0.2 0.2 0.2 0.2
DL methionine 0.4 0.4 0.3 0.3
L-threonine 0.1 0.1 0.1 0.1
Vit+min premix* 0.2 0.2 0.2 0.2
Limestone 1.5 2.2 1.5 2.1
Salt 0.2 0.2 0.2 0.2
MDCP 1.5
1.3
Sodium bicarbonate 0.18 0.2 0.2 0.2
Phosphoric acid
0.9
0.9
Oil - sunflower
Calculated nutrient composition
4.5 4.6 4.6 4.7
AME (MJ/kg) 13.2 13.2 13.4 13.4
Dry matter (%) 88.9 88.9 88.7 88.7
Crude protein (%) 21.9 21.9 19.6 19.6
Crude fibre (%) 3.2 3.2 3.0 3.0
Crude fat (%) 9.5 9.6 9.8 9.9
Calcium (%) 0.9 0.9 0.9 0.9
Phosphorous (%) 0.7 0.7 0.6 0.7
Available phosphorous (%) 0.5 0.5 0.4 0.4
Lysine (%) 1.4 1.4 1.2 1.2
Methionine (%) 0.7 0.7 0.6 0.6
Threonine (%) 0.9 0.9 0.8 0.8
*Vitamin and mineral premix.
AME- apparent metabolisable energy.
MDCP- mono-dicalcium phosphate known as Kynofos 21, a South African produced product with a known ratio of
monocalcium phosphate to di-calcium phosphate ratio of 75:25.
Stellenbosch University https://scholar.sun.ac.za
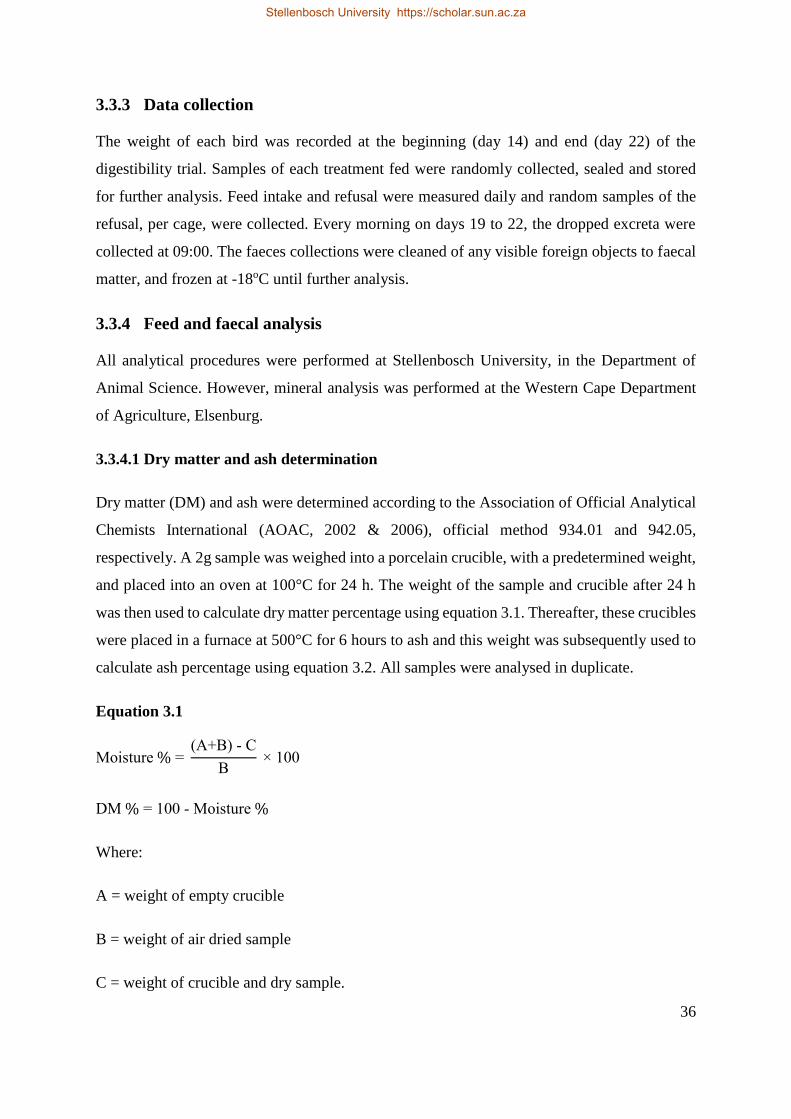
36
3.3.3 Data collection
The weight of each bird was recorded at the beginning (day 14) and end (day 22) of the
digestibility trial. Samples of each treatment fed were randomly collected, sealed and stored
for further analysis. Feed intake and refusal were measured daily and random samples of the
refusal, per cage, were collected. Every morning on days 19 to 22, the dropped excreta were
collected at 09:00. The faeces collections were cleaned of any visible foreign objects to faecal
matter, and frozen at -18oC until further analysis.
3.3.4 Feed and faecal analysis
All analytical procedures were performed at Stellenbosch University, in the Department of
Animal Science. However, mineral analysis was performed at the Western Cape Department
of Agriculture, Elsenburg.
3.3.4.1 Dry matter and ash determination
Dry matter (DM) and ash were determined according to the Association of Official Analytical
Chemists International (AOAC, 2002 & 2006), official method 934.01 and 942.05,
respectively. A 2g sample was weighed into a porcelain crucible, with a predetermined weight,
and placed into an oven at 100°C for 24 h. The weight of the sample and crucible after 24 h
was then used to calculate dry matter percentage using equation 3.1. Thereafter, these crucibles
were placed in a furnace at 500°C for 6 hours to ash and this weight was subsequently used to
calculate ash percentage using equation 3.2. All samples were analysed in duplicate.
Equation 3.1
Moisture % = (A+B) - C
B × 100
DM % = 100 - Moisture %
Where:
A = weight of empty crucible
B = weight of air dried sample
C = weight of crucible and dry sample.
Stellenbosch University https://scholar.sun.ac.za

37
Equation 3.2
Ash % = D - A
sample mass× 100
Where:
A = weight of empty and dry crucible
D = weight of crucible and ash
Thereafter the organic matter was calculated as follows (Equation 3.3):
Equation 3.3
Organic matter % = 100 - Ash %
3.3.4.2 Crude fat determination
The Diethyl Ether Reagent extraction method as described by the AOAC (2006), official
method 920.39 was used for crude fat determination method. This method incorporates boiling
a 2 g sample with added ethanol and hydrochloric acid 38% for 30 minutes. The sample was
then placed into a separating funnel with 25 ml diethyl ether added and shaken for 1 minute.
This was then repeated, however, using petroleum ether and allowed to settle until a distinctive
division could be seen where by the top layer was poured out into a fat cup of a pre-determined
weight. This was then repeated with 15 ml of diethyl ether and petroleum ether. The fat cups
were then placed on a 60 °C sand bath to allow all the ether to evaporate for ±30 minutes. The
weight thereafter was used to calculate fat percentage.
3.3.4.3 Crude protein determination
Crude protein content was determined through measuring the total nitrogen content with the
use of a LECO FP528 machine, as described by the AOAC (2002), official method 992.15.
The LECO FP528 was first calibrated with ALFALFA (LECO reference material), which has
a known nitrogen content of 3.62 ± 0.5. An aluminium foil crucible with 0.1g of feed or faeces
Stellenbosch University https://scholar.sun.ac.za

38
was then placed into the LECO FP528. The crude protein of the sample was then calculated
using equation 3.4.
Equation 3.4
Crude protein (%) = Nitrogen (%) × 6.25
3.3.4.4 Crude fibre determination
Crude fibre analysis was performed with the ANKOM Fibre analyser using the Filter Bag
Technique. Approximately 1 g of sample was sealed, through heat, in a weighed ANKOM filter
bag. These where soaked in petroleum ether for 10 minutes, to de-fat the sample, and then
removed and allowed to air dry. The air-dry bags were then placed into the ANKOM and
agitated at 100 ºC with approximately 2 litres of sulphuric acid solution (0.255N) for 40
minutes. After the 40 minutes, the H2SO4 solution was removed and hot water used to rinse the
samples twice whilst still within the ANKOM. The samples were then agitated in a similar
manner as before however, using a sodium hydroxide solution (0.313N). Subsequent rinsing
took place, twice, after the 40 minutes of agitation. Thereafter, the samples were removed and
soaked in acetone for 5 minutes and allowed to air dry. After air-drying, the samples were
placed in a 100 ºC oven for two to four hours. The samples were then removed and the weights
recorded before ashing at 500 ºC for five hours. The ash samples where then weighed and the
crude fibre determination made using equation 3.5.
Equation 3.5
Crude fibre % = 100 × W3 − (W1 × C1)
W2
Where:
W1 = bag tare weight
W2 = sample weight
W3 = weight of organic matter (loss of weight on ignition of bag and fibre)
C1 = Ash corrected blank bag factor (loss of weight on ignition of blank bag/original blank
bag).
Stellenbosch University https://scholar.sun.ac.za

39
3.3.4.5 Gross energy
The gross energy values were determined using the IKA calorimetric system C200. After
calibration by combustion of benzoic tables with known calorific value, samples were pelleted
and placed individually into the decomposition vessel. The vessel was then filled with oxygen
to a pressure of 3000 kPa and placed into the calorimeter for combustion. The MJ/kg reading
was taken as the gross energy value.
3.3.4.6 Bioavailability
Calculation of bioavailability of P was calculated according to equation 3.6. This calculation
takes into account the P that not only originates from the iP but also from the feed components
(maize, soybean full fat and soya 46).
Equation 3.6
Bioavailability (%) = Total ingested P - Excreted P
Total ingested P×100
Where:
Total ingested P = P originating from maize, soybean full fat, soya 46 and the supplemented P.
3.3.4.7 Coefficient of total tract digestibility
The coefficient of total tract digestibility of each nutrient analysed was calculated using
equation 3.7 all on dry matter bases.
Equation 3.7
Nutrient consumed = Nutrientanalysed in feed × Dry matterintake
Nutrient excreted = Nutrientanalysed in excreta× Dry matterexcreta
Digested nutrient = Nutrient consumed - Nutrient excreted
Coefficient of total tract digestibility = Digested nutrient
Nutrient consumed
Stellenbosch University https://scholar.sun.ac.za

40
3.3.4.8 Mineral analysis
Feed and faecal samples were sent to the Western Cape Department of Agriculture located at
Elsenburg, for mineral element analysis. Analysis was completed according to the combustion
method 6.1.1 described by Agricultural Laboratory association of Southern Africa (ALASA,
2007). Each ashed sample received 5 ml of 6 M hydrochloric acid and was subsequently placed
in a 50ºC oven for 30 minutes. Thereafter 35 ml of distilled water was added and filtered into
a bottle. Extra distilled water was added to reach a final volume of 50 ml. Elements were
measured on an iCAP 6000 Series Inductive Coupled Plasma (ICP) Spectrophotometer
(Thermo Electron Corporation, Strada Rivoltana, 20090 Rodana, Milan, Italy) fitted with a
vertical quartz torch and Cetac ASX-520 autosampler. The element concentrations were
calculated using iTEVA Analyst software. Elements measured were phosphorus, calcium,
magnesium, potassium sodium, iron, copper, zinc, manganese, boron and aluminium.
3.4 Statistical analysis
All statistical analysis was performed using the general linear models procedure in
STATISTICA (Dell Inc., 2016). The general assumptions of normal and homoscedastic data
was first tested before any other analyses. All dietary treatment effects were analysed by one
way (ANOVA) analysis of variance at a significance level of 0.05. If the data was significant,
Bonferroni’s post hoc test was performed to analyse the difference between the diets.
3.5 Results and discussion
3.5.1 Bioavailability
The first objective of the current study was to investigate the P bioavailability of defluorinated
phosphoric acid. As Table 3.4 shows, there is a significant difference in P bioavailability
between the dietary treatments. Treatment 0:100 has a greater (p≤0.05) P bioavailability than
the other treatments and diets 75:25 and 50:50 have the lowest (p≤0.05) P bioavailability.
Treatment 0:100 comprises solely of the summit diet, which has the test P source (defluorinated
PA) as its supplementary P source.
Knowledge of a nutrients bioavailability is important for accurate feed formulation (Viljoen,
2001b; Singh, 2008; Rodehutscord et al., 2012; Li et al., 2016), which in turn ensures little and
potentially harmful nutrient loss to the environment (Viljoen, 2001b; Leske & Coon, 2002;
Stellenbosch University https://scholar.sun.ac.za

41
Maguire et al., 2005; Rodehutscord, 2009, 2013) and reduces feed costs (Viljoen, 2001b;
Rodehutscord et al., 2012; Rodehutscord, 2013). Previously, the available P (aP) of plant feed
sources was taken as the total phosphorus (tP) minus the phytate P, because phytate P was
assumed completely unavailable and non-phytate phosphorus (npP) was also assumed to be
fully digested. However, Van der Klis and Versteegh (1996) found the aP in plant feed sources
to be greater than the tP minus phytate P, and npP to be between 55-92% available for use by
broilers. Furthermore, inorganic phosphate (iP) sources were considered as npP and therefore
are seen to be completely available. This however not the case, highlighting the need to assess
the P availability of all feedstuffs (De Groote & Huyghebaert, 1997; Viljoen, 2001b).
Table 3.4 Mean (± standard error) calculated phosphorus bioavailability from chickens fed
diets which had different ratios of a dilution diet that had mono-dicalcium phosphate as its
phosphorus source and summit diet that had phosphoric acid as its phosphorus source.
Treatment Bioavailability (%)
100:0 79.087b ± 1.506
75:25 67.395d ± 2.206
50:50 63.409d ± 1.992
25:75 73.747c ± 1.272
0:100 84.460a ± 0.746 a,b means within columns that have different superscripts differ significantly (p≤0.05)
100:0= 100% dilution diet and 0% summit diet.
75:25= 75% dilution diet and 25% summit diet.
50:50= 50% dilution diet and 50% summit diet.
25:75= 25% dilution diet and 75% summit diet.
0:100= 0% dilution diet and 100% summit diet.
Due to the increased realization of P importance in poultry nutrition, numerous studies have
assessed the bioavailability of various P sources (Heuser & Norris, 1926; Baird & MacMillan,
1942; Bird et al., 1945; Gillis et al., 1948, 1954, 1962; Summers et al., 1959; Hurwitz, 1964;
Nelson & Walker, 1964; Nelson, 1967; Pensack, 1974; Huyghebaert et al., 1980; Potchanakron
& Potter, 1987; Van der Klis & Versteegh, 1996; Lima et al., 1997; Leske & Coon, 2002;
Shastak, 2012). These studies show variation between their bioavailability results, as well as
with the current study. The variation might be attributed to the method of bioavailability
determination (see Chapter 2.4). Potchanakorn and Potter (1987) calculated the relative
bioavailability of MCP, DCP and defluorinated phosphate firstly using body weight and
Stellenbosch University https://scholar.sun.ac.za

42
secondly using toe ash percentage as the response criterion. For body weight, the P
bioavailability values of the MCP, DCP and defluorinated phosphate were 89.7%, 78.9% and
71.5% respectively. However, the use of toe ash percentage resulted in values of 95.4%, 83.7%
and 73.7%, respectively for the same sources. Potter et al. (1995) also used body weight and
toe ash as response criteria for calculating P bioavailability of phosphoric acid (PA) and MCP
using DCP as the reference source (set at 100% available). Bioavailability values for the two
response criterion (body weight and toe ash) were reported to be 89% and 97%, respectively
for PA, and 112.9% and 110.7%, respectively for MCP. These results differ greatly from that
of the current study and this may be due to different methods of determination, as a digestibility
procedure was used to assess bioavailability in the present study. Van der Klis and Versteegh
(1996) reported MDCP to have a 79% available phosphorus by means of a retention study,
which is similar to that found in the current study. It is therefore clear that the method of
determination plays a role in the results and so it is necessary to determine a standard method
which should be used through all bioavailability studies in order to alleviate these differences
attributed to methodology. Further cause for differences may be differences in the P sources
themselves. As mentioned in section 3.2, MCP and DCP are produced through reacting PA
with calcium salts. However, both MCP and DCP are not pure products but mixtures of MCP
and DCP (Lima et al., 1997). Therefore, a MCP source must contain at least 80% MCP to be
classified as such. Mono-dicalcium phosphate, much like DCP, has a wide variation in
bioavailability and composition between two different sources of the same name. For example,
a MDCP may have a MCP:DCP ratio of 50:50 to 80:20 possibly giving rise to a large degree
of variation (Viljoen, 2001a; b). Furthermore, the production of calcium phosphates can be
either hydrated or anhydrated, depending on the manufacturing process, with the hydrous form
being of greater bioavailability than the anhydrous form (Viljoen, 2001a).
The levels of P within a supplemented P source can lead to differences in P bioavailability
(Payne, 2005). The reference source used in the current study, known as Kynofos 21, is a South
African produced MDCP with a known ratio of MCP:DCP of 75:25 (Viljoen, 2001a; KK
Animal Nutrition (Pty) Ltd, 2010). When looking at earlier studies on P bioavailability, which
have used both MCP and DCP, it is clear that MCP is normally more available to the animal
than DCP (Huyghebaert et al., 1980; Potchanakron & Potter, 1987; Potter et al., 1995; Van der
Klis & Versteegh, 1996; Viljoen, 2001a). Viljoen (2001a) states that Kynofos 21 has a
favourable bioavailability due to its high ratio of MCP:DCP and therefore does not differ
Stellenbosch University https://scholar.sun.ac.za
43
significantly from the bioavailability results of pure MCP’s. The defluorinated PA used in the
current study has a known P content of 20.9-22.7% and the MDCP has a known P content of
21% (KK Animal Nutrition (Pty) Ltd, 2010). As both sources used in the summit and dilution
diet have the same levels of P within their composition, P levels cannot be the cause for the
differences in the bioavailability.
Animal nutritionists are now in agreement that there is some degree of interaction between
mineral elements within a diet (Henry & Miles, 2000). Although, a full understanding of these
interactions and their effects on absorption, storage, utilization and excretion of other minerals
is not readily available (Henry & Miles, 2000; Hemati Matin et al., 2013). The interaction of
calcium (Ca) and P however, has been extensively studied (Buckner et al., 1930;
Vandepopuliere et al., 1961; Nelson & Walker, 1964; Chicco et al., 1967; Harrold et al., 1983;
Guinotte et al., 1995; De Groote & Huyghebaert, 1997; Henry & Miles, 2000; Heaney &
Nordin, 2002; Leske & Coon, 2002; Driver et al., 2005; Manangi & Coon, 2008; Vitti &
Kebreab, 2010; de Carvalho Mello et al., 2012; Liu et al., 2013). To summarize this interaction;
an increase or decrease in dietary Ca or P levels can lead to a decrease in the availability of the
other. In poultry, an ideal ratio of Ca:P has been reported to be no wider than 2:1 (Nelson &
Walker, 1964; Leske & Coon, 2002; Manangi & Coon, 2008; Hemati Matin et al., 2013) as
this ensures the interaction of the two minerals do not influence their availability to the bird.
The current study had for both the dilution and summit diets a calculated Ca:P ratio of 1.8:1.
Therefore an adverse Ca:P ratio is not the cause for the decrease in P bioavailability. The only
logical explanation for the cause of depression in P bioavailability values of the intermediary
diets is due to interactions between the calcium salts from MDCP and the PA after mixing the
feeds together, which affected the utilization of the available P. This, however, will require
further research for confirmation.
3.5.2 Coefficient of total tract digestibility
The second objective was to evaluate the effects of defluorinated PA on nutrient and mineral
digestibility coefficients. It is clear that differences (p≤0.05) in coefficient of total tract
digestibility (CTTD) values occur between dietary treatments for P, sodium (Na), iron (Fe),
copper (Cu), zinc (Zn), manganese (Mn), and aluminium (Al) (Table 3.5). No significant
differences were found for CTTD values of apparent metabolisable energy (AME), protein, fat,
fibre, ash, Ca, magnesium (Mg), potassium (K) and boron (Bo). Minerals are divided into two
Stellenbosch University https://scholar.sun.ac.za

44
classes: macro-minerals and micro-minerals with macro-minerals being needed in large
amounts and micro-minerals in smaller amounts (Wilson & Beyer, 2000). Macro-minerals that
are of importance in the current study include Ca, P, Mg, K, and Na and relevant micro-
minerals include Cu, Fe, Mn and Zn. As mentioned in sections 2.6.3 and 3.5.2, interactions
occur between all dietary nutrients, including minerals, within a diet. This being said, there is
no clear explanation as to the effects of the mineral interactions on absorption and utilization
of other minerals. This might be due to mineral interactions having the ability to take place in
the feed, intestine and even at a cellular level (Hemati Matin et al., 2013). In a review by Henry
and Miles (2000), it was noted that minerals interact with one another more actively through
their capability to form chemical bonds. Generally, in broiler production, the mineral
requirement is expressed as a mean of the flock’s requirements (National Research Council,
1994). Nutritionists therefore ensure sufficient nutrients are available for those birds above the
mean by oversupplying by a certain margin, and in doing so give grounds for mineral
interactions to take place.
Leg disorders are an on-going issue for the modern broiler that is selected for fast growth.
Problems occur due to the weight gain being faster than the rate of bone development, resulting
in porous and fragile bones (Rath et al., 2000; Garcia et al., 2013). Phosphorus and Ca together
constitute 95% of the bone’s mineral matrices, making them the primary nutrients for bone
development (Rath et al., 2000). Furthermore, the minerals and nutrients in poultry diets need
to be available for absorption such that they can be utilized by the bird, making it vital to
quantify the digestibility values of the different sources of both P and Ca. The current study
revealed ideal CTTD values for Ca and P in all the diets. However, differences occurred
between the treatments for P CTTD. Treatments 100:0 and 0:100 revealed the greatest P CTTD
values; however, they did not differ from treatments 75:25 and 25:75 whilst treatment 50:50
had the lowest P CTTD values. With reference to Table 3.2, treatment diet 0:100 also has the
highest P bioavailability, allowing the conclusion to be made that the CTTD values of P,
together with that of Ca, is sufficient to allow for ideal skeletal bone development and
maintenance. Magnesium has a known association with Ca and P (Chicco et al., 1967; Driver
et al., 2005; Hemati Matin et al., 2013; Kleyn, 2013). High consumption of Ca or P heightens
Mg deficiencies and may reduce the absorption of Mg (Hemati Matin et al., 2013). The current
study shows CTTD values of 0.70-0.78% for Mg. Therefore, it is clear that Mg deficiencies
did not occur in any of the treatments.
Stellenbosch University https://scholar.sun.ac.za

45
Potassium and Na play part in the body’s acid-base equilibrium (Kleyn, 2013), and their
electrolytes prove vital to muscle, metabolic and nerve functions (Wilson & Beyer, 2000).
Kleyn (2013) states that the chance of K deficiency is very rare as it is difficult to formulate
diets with a K level below 0.5%. Furthermore, the body has the ability to regulate absorption
of K through tissue protein decomposition which can compensate for the deficiency (Živkov
Baloš et al., 2016). Dietary Na levels are recommended to be 0.15% for young birds (Živkov
Baloš et al., 2016). However, Murakami et al. (1997) suggested that formulation for 21 day
old broilers to have 0.25% salt inclusion, which is the source of Na in a diet. Excess levels of
both K and Na cause an increase in water uptake, which in turn can result in an electrolyte
imbalance (Kleyn, 2013). The current study showed results of sufficient digestibility of both K
and Na and no increases in water uptake was evident, illustrating the dietary levels were
sufficient. However, the differences seen in CTTD values of Na illustrate a decrease in
digestibility when the summit and dilution diets are mixed together. Particular reference must
be made to diet 25:75. It is unclear as to the reason for this drop but it may be a cause of
interaction between the two inorganic phosphorus sources.
Stellenbosch University https://scholar.sun.ac.za
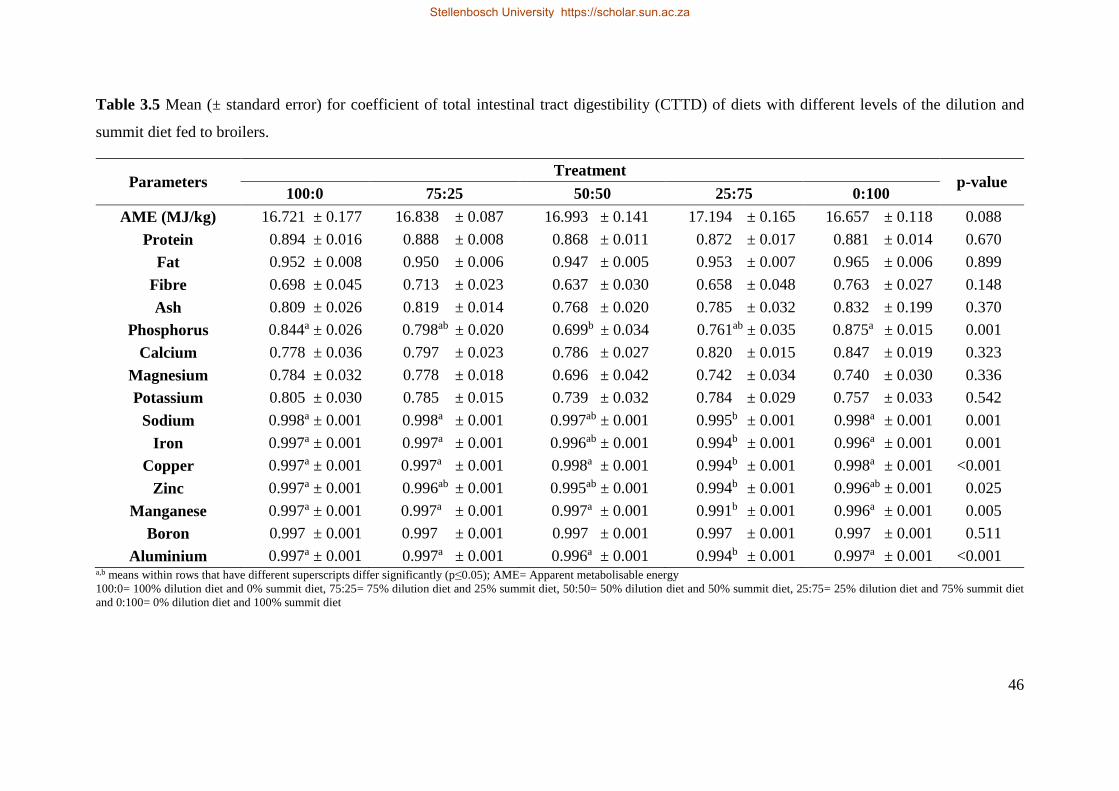
46
Table 3.5 Mean (± standard error) for coefficient of total intestinal tract digestibility (CTTD) of diets with different levels of the dilution and
summit diet fed to broilers.
Parameters Treatment
p-value 100:0 75:25 50:50 25:75 0:100
AME (MJ/kg) 16.721 ± 0.177 16.838 ± 0.087 16.993 ± 0.141 17.194 ± 0.165 16.657 ± 0.118 0.088
Protein 0.894 ± 0.016 0.888 ± 0.008 0.868 ± 0.011 0.872 ± 0.017 0.881 ± 0.014 0.670
Fat 0.952 ± 0.008 0.950 ± 0.006 0.947 ± 0.005 0.953 ± 0.007 0.965 ± 0.006 0.899
Fibre 0.698 ± 0.045 0.713 ± 0.023 0.637 ± 0.030 0.658 ± 0.048 0.763 ± 0.027 0.148
Ash 0.809 ± 0.026 0.819 ± 0.014 0.768 ± 0.020 0.785 ± 0.032 0.832 ± 0.199 0.370
Phosphorus 0.844a ± 0.026 0.798ab ± 0.020 0.699b ± 0.034 0.761ab ± 0.035 0.875a ± 0.015 0.001
Calcium 0.778 ± 0.036 0.797 ± 0.023 0.786 ± 0.027 0.820 ± 0.015 0.847 ± 0.019 0.323
Magnesium 0.784 ± 0.032 0.778 ± 0.018 0.696 ± 0.042 0.742 ± 0.034 0.740 ± 0.030 0.336
Potassium 0.805 ± 0.030 0.785 ± 0.015 0.739 ± 0.032 0.784 ± 0.029 0.757 ± 0.033 0.542
Sodium 0.998a ± 0.001 0.998a ± 0.001 0.997ab ± 0.001 0.995b ± 0.001 0.998a ± 0.001 0.001
Iron 0.997a ± 0.001 0.997a ± 0.001 0.996ab ± 0.001 0.994b ± 0.001 0.996a ± 0.001 0.001
Copper 0.997a ± 0.001 0.997a ± 0.001 0.998a ± 0.001 0.994b ± 0.001 0.998a ± 0.001 <0.001
Zinc 0.997a ± 0.001 0.996ab ± 0.001 0.995ab ± 0.001 0.994b ± 0.001 0.996ab ± 0.001 0.025
Manganese 0.997a ± 0.001 0.997a ± 0.001 0.997a ± 0.001 0.991b ± 0.001 0.996a ± 0.001 0.005
Boron 0.997 ± 0.001 0.997 ± 0.001 0.997 ± 0.001 0.997 ± 0.001 0.997 ± 0.001 0.511
Aluminium 0.997a ± 0.001 0.997a ± 0.001 0.996a ± 0.001 0.994b ± 0.001 0.997a ± 0.001 <0.001 a,b means within rows that have different superscripts differ significantly (p≤0.05); AME= Apparent metabolisable energy
100:0= 100% dilution diet and 0% summit diet, 75:25= 75% dilution diet and 25% summit diet, 50:50= 50% dilution diet and 50% summit diet, 25:75= 25% dilution diet and 75% summit diet
and 0:100= 0% dilution diet and 100% summit diet
Stellenbosch University https://scholar.sun.ac.za
Stellenbosch University https://scholar.sun.ac.za

47
No differences were found in protein CTTD values. An earlier study by Hwangbo et al. (2009)
reported both corn and soya bean meal protein CTTD values to be 98%. The current study
made use of the same protein sources in the diets yet the CTTD values were lower than that
found by Hwangbo et al. (2009). The lower CTTD values in the current study may be a result
of protein quality, as protein quality is determined by amino acid (AA) profiles and all meals
contain different AA profiles (Boland et al., 2013). For example, a protein may contain all the
essential amino acids required. However, if it is deficient in a single AA, then the digestibility
of the protein is at its highest just before this essential AA has been depleted.
As mentioned, significant differences in CTTD values occur for Fe, Cu, Zn, Mn, and Al.
Dietary treatment 25:75 recorded the lowest CTTD for each of these minerals respectively;
however, it was statistically similar to diets 0:100, 50:50 and 75:25 for Zn and diet 50:50 for
Fe. Wilson and Beyer (2000) note that these minerals are generally supplied in sufficient
concentrations by other ingredients such as soya meal, maize and bone meal. Furthermore, the
use of premixes when formulating diets ensure these micro and macro mineral levels are
adequate for ideal broiler maintenance and production.
3.6 Conclusion
This study set out to assess the P bioavailability of defluorinated PA as well as the nutrient and
mineral digestibility coefficient values of a diet supplemented with defluorinated PA. The
bioavailability trial showed significant differences between the dietary treatments. The diet
supplemented with PA showed a significantly higher P bioavailability than the rest. The P
bioavailability of the intermediary diets showed a significant decrease to those that received
only one P supplement. The cause of this was inconclusive; however, it was thought to be due
to interactions between the two iP sources. Further research is required to confirm this
assumption. Dietary treatments showed to have a significant effect on CTTD values of P, Na,
Fe, Cu, Zn, Mn, and Al. It is concluded that defluorinated PA has a desirable P bioavailability
and its use in a diet results in competitive CTTD values. Research on the use of defluorinated
PA is warranted to assess its effects on broiler production performance and ultimately meat
production and quality.
Stellenbosch University https://scholar.sun.ac.za

48
3.7 References
Agricultural Laboratory association of Southern Africa (ALASA), 2007. Agrilasa handbook of
feeds and plant analysis-2nd ed. Macro-and trade elements method no. 6.1.1.
AOAC International. (2002). Dumas Combustion Method. AOAC Official Method 992.15. In:
Official Methods of Analysis (17th ed). Association of Official Analytical Chemists,
Inc., Arlington, Virginia, USA.
AOAC International. (2002). Loss on drying (moisture) at 95-100 °C for feed. AOAC Official
method 934.01. In: Official Methods of Analysis (17th ed). Association of Official
Analytical Chemists, Inc., Arlington, Virginia, USA.
AOAC International. (2006). Official methods of analysis Proximate Analysis and Calculations
of Crude Fat (CF). AOAC Official method 920.39. In: Official Methods of Analysis
(17th ed). Association of Official Analytical Chemists, Inc., Arlington, Virginia, USA.
AOAC International. (2006). Official methods of analysis Proximate Analysis and Calculations
Ash Determination (Ash). AOAC Official method 942.05. In: Official Methods of
Analysis (17th ed). Association of Official Analytical Chemists, Inc., Arlington,
Virginia, USA.
Angel, R. 2010. Calcium and phosphorus requirements in poultry. In: The 1st International
Phytase Summit. Washington, D.C., USA. pp 65-71.
Baird, F. D., & Macmillan, M. J. 1942. Use of toes rather than tibiae in A.O.A.C. chick method
of vitamin D determinations. J. Assoc. Off. Agric. Chem. 25: 518-524.
Bird, H. R., Mattingly, J. P., Trros, H. W., Hammond, J. C., Kellogg, W. L., Clark, T. B.,
Weakley, C. E., J., & Landingham, Van, A. H. 1945. Nutritive evaluation of
defluorinated phosphates and other phosphorus supplements. 2. Defluorinated
phosphates as phosphorus supplements for chicks. J. Assoc. Off. Agric. Chem. 28: 118-
129.
Boland, M. J., Raea, A. N., Vereijkenb, J. M., Meuwissenc, M. P. M., Fischerd, A. R. H., van
Boekele, M. A. J. S., Rutherfurda, S. M., Gruppenf, H., Moughana, P. J., & Hendriks,
Stellenbosch University https://scholar.sun.ac.za

49
W. H. 2013. The future supply of animal-derived protein for human consumption.
Trends Food Sci. Technol. 29: 62-73.
Borin, K., Ogle, B., & Lindberg, J. E. 2002. Methods and techniques for the determination of
amino acid digestibility: A Review. Livest. Res. Rural Dev. 14. Article 51.
Buckner, G. D., Martin, J. H., & Insko, W. M. 1930. Calcium and phosphorous requirements
of the growing chick. Poult. Sci. 9: 235-238.
de Carvalho Mello, H. H., Gomes, P. C., Rostagno, H. S., Albino, L. F. T., da Rocha, T. C., de
Almeida, R. L., & Calderano, A. A. 2012. Dietary requirements of available phosphorus
in growing broiler chickens at a constant calcium: Available phosphorus ratio. Rev.
Bras. Zootec. 41: 2323-2328.
Centeno, C., Arija, I., Viveros, A., & Brenes, A. A. 2007. Effects of citric acid and microbial
phytase on amino acid digestibility in broiler chickens. Br. Poult. Sci. 48: 469-479.
Chicco, C. F., Ammerman, C. B., Van Walleghem, P. A., Waldroup, P. W., & Harms, R. H.
1967. Effects of varying dietary ratios of magnesium, calcium and phosphorus in
growing chicks. Poult. Sci. 46: 368-373.
Classen, H. L., Maenz, D. D., & Caruthers, C. 2010. Ingredient considerations, totals phytate
concentrations and susceptibility of phytate to hydrolysis. In: 1st International Phytase
Summit. Washington, D.C., USA. pp 173-177.
De Groote, G., & Huyghebaert, G. 1997. The bio-availability of phosphorus from feed
phosphates for broilers as influenced by bio-assay method, dietary Ca-level and feed
form. Anim. Feed Sci. Technol. 69: 329-340.
Dell Inc. (2016). Dell Statistica (data analysis software system), version 13. software.dell.com.
Driver, J. 2004. Performance and bone quality of the modern broiler chicken as influenced by
dietary calcium, phosphorus, phytase and 1-alpha-hydroxycholecalciferol. PhD Diss.
Univ. of Georgia, Athens, Georgia.
Stellenbosch University https://scholar.sun.ac.za

50
Driver, J. P., Pesti, G. M., Bakalli, R. I., & Edwards, H. M. 2005. Calcium requirements of the
modern broiler chicken as influenced by dietary protein and age. Poult. Sci. 84: 1629-
1639.
Emami, N. K., Naeini, S. Z., & Ruiz-Feria, C. A. 2013. Growth performance, digestibility,
immune response and intestinal morphology of male broilers fed phosphorus deficient
diets supplemented with microbial phytase and organic acids. Livest. Sci. 157: 506-
513.
Garcia, A. F. Q. M., Murakami, A. E., Do Amaral Duarte, C. R., Rojas, I. C. O., Picoli, K. P.,
& Puzotti, M. M. 2013. Use of vitamin D3 and its metabolites in broiler chicken feed
on performance, bone parameters and meat quality. Asian-Australasian J. Anim. Sci.
26: 408-415.
Gillis, M. ., Edwards Jr, M. ., & Young, R. 1962. Studies on the availability of calcium
orthophosphates to chickens and turkeys. J. Nutr. 78: 155-161.
Gillis, M. B., Norris, L. C., & Heuser, G. F. 1948. The utilization by the chick of phosphorus
from different sources. J. Nutr. 35: 195-207.
Gillis, M. B., Norris, L. C., & Heuser, G. F. 1954. Studies on the biological value of inorganic
phosphates. J. Nutr. 52: 115-125.
Guinotte, F., Gautron, J., Nys, Y., & Soumarmon, A. 1995. Calcium solubilization and
retention in the gastrointestinal tract in chicks (Gallus domesticus) as a function of
gastric acid secretion inhibition and of calcium carbonate particle size. Br. J. Nutr. 73:
125-139.
Harrold, R. L., Slanger, W. D., Haugse, C. N., & Johnson, R. L. 1983. Phosphorus
bioavailability in the chick: effects of protein source and calcium level. J. Anim. Sci.
57: 1173-1181.
Heaney, R. P., & Nordin, B. E. C. 2002. Calcium effects on phosphorus absorption:
implications for the prevention and co-therapy of osteoporosis. J. Am. Coll. Nutr. 21:
239-244.
Stellenbosch University https://scholar.sun.ac.za

51
Hemati Matin, H. R., Dashtbin, F., & Salari, J. 2013. Absorption and macromineral interactions
in broiler production: An overview. Glob. Vet. 11: 49-54.
Henry, P., & Miles, R. 2000. Interactions among the trace minerals. Ciência Anim. Bras. 1: 95-
105.
Heuser, G. F., & Norris, L. C. 1926. Rickets in chicks: I. Variations in the antirachitic potency
of different brands of cod liver oil. Poult. Sci. 6: 9-17.
Hurwitz, S. 1964. Estimation of net phosphorus utilization by the ‘slope’ method. J. Nutr. 84:
83-92.
Huyghebaert, G., Groote, G. D. E., & Keppens, L. 1980. The relative biological availability of
phosphorus in feed phosphates for broilers. 29: 245-263.
Hwangbo, J., Hong, E. C., Jang, A., Kang, H. K., Oh, J. S., Kim, B. W., & Park, B. S. 2009.
Utilization of house fly-maggots, a feed supplement in the production of broiler
chickens. J. Environ. Biol. 30: 609-614.
KK Animal Nutrition (Pty) Ltd. 2010. Kynofos 21 elite product information.
http://www.kkan.com/pdf/Kynofos%2021%20Elite.pdf Accessed on 09/08/2017.
Kleyn, R. 2013. Chicken Nutrition. A guide for nutritionists and poultry professionals. Context
Products Ltd, Packington, Leicestershire, England. pp 67-78.
Kornegay, E. T. 2000. Digestion of phosphorus and other nutrients : the role of phytases and
factors influencing their activity. In: Enzymes in Farm Animal Nutrition. CAB
International publishing, Wallingford, UK. pp 237-271.
Leske, K., & Coon, C. 2002. The development of feedstuff retainable phosphorus values for
broilers. Poult. Sci. 81: 1681-1693.
Li, X., Zhang, D., Yang, T., & Bryden, W. 2016. Phosphorus bioavailability: A key aspect for
conserving this critical animal feed resource with reference to broiler nutrition. Agri. 6,
1-25
Stellenbosch University https://scholar.sun.ac.za

52
Lima, F. R., Mendonc, C. X., Alvarez, J. C., Ghion, E., & Leal, P. M. 1997. Biological
evaluations of commercial dicalcium phosphates as sources of available phosphorus for
broiler chicks. Poult. Sci. 72: 1707-1713.
Liu, J. B., Chen, D. W., & Adeola, O. 2013. Phosphorus digestibility response of broiler
chickens to dietary calcium-to-phosphorus ratios. Poult. Sci. 92: 1572-1578.
Maguire, R. O., Dou, Z., Sims, J. T., Brake, J., & Joern, B. C. 2005. Dietary strategies for
reduced phosphorus excretion and improved water quality. J. Environ. Qual. 34: 2093-
2103.
Manangi, M. K., & Coon, C. N. 2008. Phytate phosphorus hydrolysis in broilers in response to
dietary phytase, calcium, and phosphorus concentrations. Poult. Sci. 87: 1577-1586.
Martinez-Amezcua, C., Parsons, C. M., & Baker, D. H. 2006. Effect of microbial phytase and
citric acid on phosphorus bioavailability, apparent metabolisable energy, and amino
acid digestibility in distillers dried grains with solubles in chicks. Poult. Sci. 85: 470-
475.
Murakami, A. E., Watkins, S. E., Saleh, E. A., England, J. A., & Waldroup, P. W. 1997.
Estimation of the sodium and chloride requirements for the young broiler chick. J. Appl.
Poult. Res. 6: 155-162.
National Research Council. 1994. Nutrient Requirements of Poultry (9th ed.). National
Academy Press, Washington, D.C, USA.
Nelson, T. S. 1967. The utilization of phytate phosphorus by poultry- A review. Poult. Sci. 46:
862-871.
Nelson, T. S., & Walker, A. C. 1964. The biological evaluation of phosphorus compounds: A
summary. Poult. Sci. 43: 94-98.
Nourmohammadi, R., Hosseini, S. M., Saraee, H., Arab, A., & Arefinia, H. 2011. Plasma
thyroid hormone concentrations and pH values of some GI-Tract segments of broilers
fed on different dietary citric acid and microbial phytase levels. J. Anim. Vet. Adv. 10:
1450-1454.
Stellenbosch University https://scholar.sun.ac.za

53
Payne, S. G. 2005. The phosphorus availability of feed phosphates in broilers. MSc (Agric),
Stellenbosch Univ. South Africa.
Pensack, J. M. 1974. Biological availability of commercial feed phosphates. Poult. Sci. 53:
143-148.
Potchanakron, M., & Potter, L. M. 1987. Biological values of phosphorus from various sources
for young turkeys. Poult. Sci. 66: 505-513.
Potter, L. M., Potchanakorn, M., Ravindran, V., & Kornegay, E. T. 1995. Bioavailability of
Phosphorus in various phosphate sources using body weight and toe ash as response
criteria. Poult. Sci. 74: 813-820.
Rama Rao, S. V., & Ramasubba Reddy, V. 2001. Relative Bio-availability of different
phosphorous supplements in broiler and layer chicken diets. In: Asian-Australasian
Journal of Animal Sciences 2001. pp 979-985.
Rama Rao, S. V, & Ramasubba Reddy, V. 2003. Relative bio-availability and utilisation of
phosphatic fertilisers as sources of phosphorus in broilers and layers. Br. Poult. Sci. 44:
96-103.
Rath, N. C., Huff, G. R., Huff, W. E., & Balog, J. M. 2000. Factors regulating bone maturity
and strength in poultry. Poult. Sci. 79: 1024-1032.
Rodehutscord, M. 2009. Approaches and challenges for evaluating phosphorus sources for
poultry. In: World Poultry Science Association, 17th European Symposium for Poultry
Nutrition. Edinburgh, UK. pp 2-6.
Rodehutscord, M. 2013. Determination of phosphorus availability in poultry. Worlds. Poult.
Sci. J. 69: 687-698.
Rodehutscord, M., Dieckmann, A., Witzig, M., Shastak, Y., L., B. W., & P., P. J. 2012. A note
on sampling digesta from the ileum of broilers in phosphorus digestibility studies.
Poult. Sci. 91: 965-971.
Shastak, Y. 2012. Evaluation of the availability of different mineral Phosphorus sources in
broilers. PhD (Agric) Dissertation, University of Hohenheim, Germany.
Stellenbosch University https://scholar.sun.ac.za
54
Shastak, Y., & Rodehutscord, M. 2013. Determination and estimation of phosphorus
availability in growing poultry and their historical development. Worlds. Poult. Sci. J.
69: 569-586.
Shastak, Y., Witzig, M., Hartung, K., Bessei, W., & Rodehutscord, M. 2012. Comparison and
evaluation of bone measurements for the assessment of mineral phosphorus sources in
broilers. Poult. Sci. 91: 2210-2220.
Shaw, A. L., Blake, J. P., & Gordon, R. W. 2010. Evaluation of commercial phytase enzymes
on performance and tibia-breaking strength of male broiler chicks. J. Appl. Poult. Res
19: 415-421.
Singh, P. K. 2008. Significance of phytic acid and supplemental phytase in chicken nutrition:
a review. A Rev. Worlds poult. Sci. J. 64: 553-580.
Summers, J. D., Slinger, S. J., Pepper, W. F., Motzok, I., & Ashton, G. C. 1959. Availability
of Phosphorus in Soft Phosphate and Phosphoric Acid and the Effect of Acidulation of
Soft Phosphate. Poult. Sci. 38: 1168-1179.
Thiamhirunsopit, K., Phisalaphong, C., Boonkird, S., & Kijparkorn, S. 2014. Effect of chili
meal (chiliapsicum frutescens LINN.) on growth performance, stress index, lipid
peroxidation and ileal nutrient digestibility in broilers reared under high stocking
density condition. Anim. Feed Sci. Technol. 192: 90-100.
Vandepopuliere, J. M., Ammerman, C. B., & Harms, R. H. 1961. The relationship of calcium-
phosphorus ratios to the utilization of plant and inorganic Phosphorus by the chick.
Poult. Sci. 40: 951-957.
Van der Klis, J. D., & Versteegh, H. A. J. 1996. Phosphorus nutrition of poultry. In: Recent
advances in animal nutrition. Nottingham University Press, Nottingham, UK. pp 71-83.
Van der Klis, J. D., & Versteegh, H. A. J. 1999. Phosphorus nutrition of poultry. In: Recent
developments in poultry nutrition 2. Nottingham University Press, Nottingham, UK. pp
309-320.
Stellenbosch University https://scholar.sun.ac.za
55
Viljoen, J. 2001a. Quality of feed phosphate supplements for animal nutrition. S. Afr. J. Anim.
Sci. 2: 13-19.
Viljoen, H. 2001b. Utilisation of feed phosphates : fact or confusion?. Afma Matrix, pp 24–27.
Vitti, D. M. S. S., & Kebreab, E. 2010. Phosphorus and calcium utilization and requirements
in farm animals. CAB International, Wallingford, Oxfordshire, UK. pp 6-111.
Waldroup, P. W. 1999. Nutritional approaches to reducing phosphorus excretion by poultry.
Poult. Sci. 78: 683-691.
Wilson, K. J., & Beyer, R. S. 2000. Poultry nutrition information for the small flock. Kansas
State Univ. Agric. Exp. Stn. Coop. Ext. Serv. http://krex.k-
state.edu/dspace/bitstream/handle/2097/21651/KSUL0009KSREEPPUBSEP80a.pdf?
sequence=1 Accessed on 29/08/2017.
Živkov Baloš, M., Jakšić, S., Knežević, S., Kapetanov, M., & Baloš, M. Ž. 2016. Electrolytes
- sodium, potassium and chlorides in poultry nutrition. Arh. Vet. Med. 9: 31-42.
Stellenbosch University https://scholar.sun.ac.za

56
Chapter 4
The effects of phosphoric acid on broiler production parameters
4.1 Abstract
A 35-day study was conducted to determine the effect of two phosphoric acids (PA)
(defluorinated (DF) and defluorinated and desulfonated (DFS) phosphoric acid) as the
inorganic phosphate (iP) source on broiler production parameters. Five hundred and forty day-
old Cobb500 broilers were randomly allocated to one of nine treatments with six replications
per treatment and ten birds per replicate. The control diet (Con) received a commercially
available mono-dicalcium phosphate (MDCP) as the inorganic phosphate source; the diet
received P inclusion levels based on available phosphorus (aP) levels and was mixed with the
grains of the diet. The remaining eight treatment diets received the iP source at one of two
inclusion levels that were based on the dietary aP or total phosphorus (tP) levels. Furthermore,
they received one of the two PA sources (DF or DFS) which was mixed in either with the grains
(G) of the diet, before other micro-ingredients, or last (L) during the mixing of the feed.
Therefore, the nine trial diets were 1. Con. 2. aP-DF-G. 3. aP-DF-L. 4. tP-DF-G. 5. tP-DF-L.
6. aP-DFS-G. 7. aP-DFS-L. 8. tP-DFS-G. 9. tP-DFS-L. Live weights and feed intakes were
measured weekly until slaughter. Significant (p≤0.05) differences were found between
treatments in live weight, cumulative weight gain, cumulative intake, feed conversion ratio,
average daily gain, liveability, protein efficiency ratio and European production efficiency
factor. The mixing of the PA into the diet (G or L) showed no effect on production parameters
as well as the PA (DF or DFS) used. Diets with P inclusion levels based on aP showed improved
results over those with tP inclusion levels regardless of the PA and the mixing method used.
4.2 Introduction
Phosphorus (P) is the second most abundant mineral element within the body and is essential
to the growth and development of an animal. It also has the most known functions within the
animal body than any other mineral (Mc Donald et al., 2011). Its most vital role being that of
formation and maintenance of the skeletal structure and the role it plays in the many metabolic
processes which it is involved with. Phosphorus also plays a role in utilization efficiency of
feed as well as voluntary feed intake (Bar & Hurwitz, 1984), which are two of the underlying
foci of this chapter.
Stellenbosch University https://scholar.sun.ac.za

57
The largest portion of South Africa’s broiler diets is plant based, and much of the P found in
poultry diets originate from the plant component of the diet (Driver, 2004). A particular portion
of this P is bound to phytate in the form of phytic acid (maize= 85% and soya bean= 62%)
(Ravindran et al., 1994). Phytate occurs naturally in plants, acting as a primary storage device
for P (Hídvégi & Lásztity, 2002). Phytate however, acts as an anti-nutrient (Davies & Reid,
1979), with negative effects on the utilization of P which ultimately limits broiler performance
(Sohail & Roland, 1999). Furthermore, the increase in demand of P, from the birds, for skeletal
growth and maintenance as well as the attempt to avoid consequences of insufficient P in the
diet, have led to the use of inorganic phosphorus supplements, with higher available P (aP)
levels, administered in excessive amounts to meet the bird’s dietary P requirements (Waldroup,
1999). However, negative environmental impact of the excretion of excessive levels of dietary
inorganic phosphorus, has led to limitations of their use in alternative feed formulation
strategies (Maguire et al., 2005).
The main P supplements used in animal feeds until the late 1940’s were soft rock phosphates
and bone meal. However, due to constant development of the broiler industry, there is greater
demand for high-P concentration supplements. This has given rise to a number of
manufacturing techniques being developed to produce inorganic phosphates with the highest P
content possible (Viljoen, 2001). The most common of these being calcium phosphates and
defluorinated rock phosphate. Calcium phosphates include monocalcium phosphate (MCP),
dicalcium phosphate (DCP) and mono-dicalcium phosphates (MDCP). These are produced by
reacting calcium salts with phosphoric acid (PA) (Lima et al., 1997; Waldroup, 1999; Viljoen,
2001). Defluorinated phosphate rock is produced through a reaction between phosphate rock,
PA and sodium carbonate (Waldroup, 1999). This process is however very difficult to control
and results in great variation in the biological values. This makes the defluorinated rock
phosphates less desirable than the calcium phosphates (Waldroup, 1999).
Feed costs for broiler production account for near 70% of the total costs of the business (Teguia
& Beynen, 2005) and due to yearly crop yields dropping as a result of global warming (Dar &
Gowda, 2013), constraints on the producer due to feed costs will only increase. Furthermore,
the increase in demand from the consumer for broiler meat places more pressure on the
producer to maintain production. Producers are therefore forced to reduce the cost of feed
without compromising performance of the flock (Selle & Ravindran, 2007). The use of
Stellenbosch University https://scholar.sun.ac.za

58
phosphoric acid (PA) as the inorganic phosphorus source may potentially reduce the cost of
feed. This can be possible as PA is used to produce the other inorganic phosphate sources and
using it directly leads to the elimination of a production process, which may reduce costs.
However, the efficiency of PA in broiler production is unknown. Thus the aim of the current
study is to assess the efficacy of defluorinated phosphoric acid and defluorinated and
desulfonated phosphoric acid in broiler diets. The study objectives were:
i. To determine the effects of the two PAs on production performance of commercial
broilers.
ii. To investigate the effects of these PAs at two different inclusion levels based on the
dietary total or available phosphorus levels, on production performance.
iii. To evaluate the effects of the two PAs on broiler production performance after being
mixed into the feed in one of two sequences.
4.3 Materials and Methods
4.3.1 Birds and housing
Five hundred and forty day-old broiler chicks (Cobb 500) where collected from a commercial
hatchery and transported to Mariendahl experimental farm of Stellenbosch University.
Vaccination against infectious bursal disease (IBD) and Newcastle disease took place at the
hatchery. On arrival at Mariendahl, the birds where weighed in groups of ten and randomly
allocated to one of 54 cages. Each cage is equipped with two nipple drinkers and a tube feeder.
Lighting and humidity and temperature within the house was maintained according to Cobb
500 standards (see Table 3.1 and 3.2 respectively). Water and feed were supplied ad libitum
throughout the trial. Ethical clearance for the trial was obtained from Stellenbosch University
Ethics Board; number SU-ACUM13-00006.
4.3.2 Treatments and experimental diets
The chicks were allocated to one of nine treatments. Treatment diet differences include the
supplemented phosphorus (P) source used, how the P source was mixed with the feed and the
formulations or P inclusion levels. The control diet (Con), contained a commercially available
mono-dicalcium phosphate (MDCP) source with inclusion levels based on available
phosphorus (aP) levels and mixed in with the grains of the diet. The remaining eight treatments
Stellenbosch University https://scholar.sun.ac.za

59
had P inclusion levels based on dietary available (aP) or total phosphorus (tP) calculations of
the diet. Therefore, the feed formulation were either based on dietary aP or tP levels. The two
treatment supplemental phosphorus sources were either a defluorinated (DF) phosphoric acid
or a defluorinated and desulfonated (DFS) phosphoric acid. Feeds were mixed in one of two
manners; the P mixed into the grain (maize, soya 46 and full fat soya) (G) of the feed, therefore
added before any of the micro ingredients, or the P was added last (L) after all the other
ingredients had sufficient time to be thoroughly distributed throughout the feed. Concise
treatment explanations are available in Table 4.1. The feed was allocated as follows; 900g
starter diet (Table 4.2 and 4.3), 1200g grower diet (Table 4.4 and 4.5) and finisher until
slaughter (Table 4.6 and 4.7). The different diets were all mixed at Mariendahl experimental
farm, Stellenbosch, and were fed as mash.
Table 4.1 The dietary treatment descriptions used throughout the trial.
Treatment Description
Con Control, formulated for available phosphorus, using MDCP which was mixed
with the grains
aP-DF-G Formulated for available phosphorus using defluorinated PA which was
mixed with the grains
aP-DF-L Formulated for available phosphorus using defluorinated PA which was
mixed in last at the end of the mixing process
tP-DF-G Formulated for total phosphorus using defluorinated PA which was mixed
with the grains
tP-DF-L Formulated for total phosphorus using defluorinated PA which was mixed in
last at the end of the mixing process
aP-DFS-G Formulated for available phosphorus using defluorinated and desulfonated
PA which was mixed with the grains
aP-DFS-L Formulated for available phosphorus using defluorinated and desulfonated
PA which was mixed in last at the end of the mixing process
tP-DFS-G Formulated for total phosphorus using defluorinated and desulfonated PA
which was mixed with the grains
tP-DFS-L Formulated for total phosphorus using defluorinated and desulfonated PA
which was mixed in last at the end of the mixing process
Stellenbosch University https://scholar.sun.ac.za

60
Table 4.2 Starter diet ingredient composition (%) used during the trial.
Available Phosphorus Total Phosphorus
Ingredients Con DF DFS DF DFS
Maize 38.37 38.54 38.54 39.87 39.86
Soybean full fat 44.52 44.17 44.17 41.45 41.47
Soybean 46 12.03 12.29 12.29 14.23 14.21
L-lysine HCl 0.32 0.32 0.32 0.32 0.32
DL methionine 0.43 0.43 0.43 0.42 0.42
L-threonine 0.09 0.09 0.09 0.09 0.09
Vit+min premix* 0.25 0.25 0.25 0.25 0.25
Limestone 1.53 2.50 2.50 2.51 2.51
Salt 0.24 0.24 0.24 0.23 0.23
MDCP 2.06
Sodium bicarbonate 0.18 0.17 0.17 0.18 0.17
Oil - sunflower
DF Phosphoric acid 1.02 0.46
DFS Phosphoric acid 1.02 0.47
*Vitamin and minerals premix
MDCP: mono-dicalcium phosphate
Con: control diet
DF: defluorinated phosphoric acid
DFS: defluorinated and desulfonated phosphoric acid
Stellenbosch University https://scholar.sun.ac.za
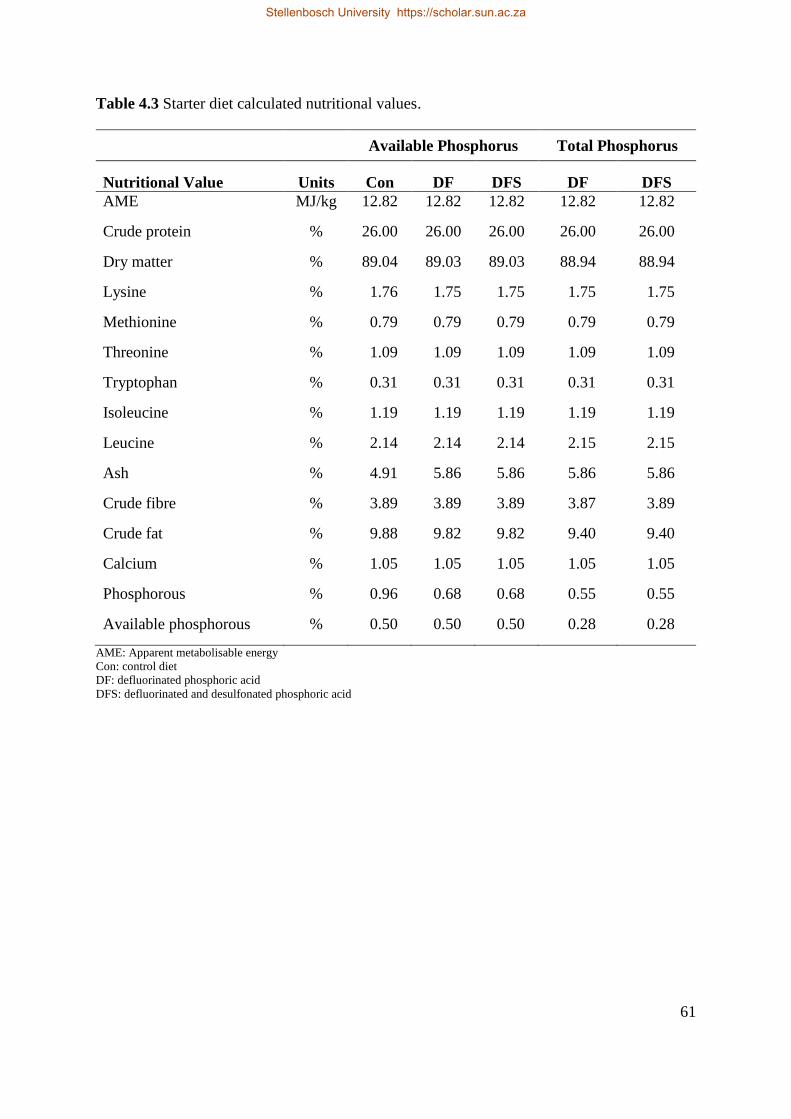
61
Table 4.3 Starter diet calculated nutritional values.
Available Phosphorus Total Phosphorus
Nutritional Value Units Con DF DFS DF DFS
AME MJ/kg 12.82 12.82 12.82 12.82 12.82
Crude protein % 26.00 26.00 26.00 26.00 26.00
Dry matter % 89.04 89.03 89.03 88.94 88.94
Lysine % 1.76 1.75 1.75 1.75 1.75
Methionine % 0.79 0.79 0.79 0.79 0.79
Threonine % 1.09 1.09 1.09 1.09 1.09
Tryptophan % 0.31 0.31 0.31 0.31 0.31
Isoleucine % 1.19 1.19 1.19 1.19 1.19
Leucine % 2.14 2.14 2.14 2.15 2.15
Ash % 4.91 5.86 5.86 5.86 5.86
Crude fibre % 3.89 3.89 3.89 3.87 3.89
Crude fat % 9.88 9.82 9.82 9.40 9.40
Calcium % 1.05 1.05 1.05 1.05 1.05
Phosphorous % 0.96 0.68 0.68 0.55 0.55
Available phosphorous % 0.50 0.50 0.50 0.28 0.28
AME: Apparent metabolisable energy
Con: control diet
DF: defluorinated phosphoric acid
DFS: defluorinated and desulfonated phosphoric acid
Stellenbosch University https://scholar.sun.ac.za

62
Table 4.4 Grower diet ingredient composition (%) used during the trial.
Available Phosphorus Total Phosphorus
Ingredients Con DF DFS DF DFS
Maize 50.04 50.07 50.07 50.29 50.28
Soybean full fat 21.76 22.52 22.52 28.04 27.98
Soybean 46 19.90 19.31 19.31 15.05 15.09
L-lysine HCl 0.20 0.12 0.12 0.19 0.19
DL methionine 0.37 0.37 0.37 0.37 0.37
L-threonine 0.11 0.11 0.11 0.11 0.11
Vit+min premix* 0.25 0.25 0.25 0.25 0.25
Limestone 1.31 2.18 2.18 2.17 2.17
Salt 0.25 0.25 0.25 0.25 0.25
MDCP 1.84
Sodium bicarbonate 0.16 0.16 0.16 0.15 0.15
Oil - sunflower 3.81 3.68 3.68 2.70 2.71
DF phosphoric acid 0.91 0.43
DFS phosphoric acid 0.91 0.43
*Vitamin and minerals premix
Con: control diet
MDCP: mono-dicalcium phosphate
DF: defluorinated phosphoric acid
DFS: defluorinated and desulfonated phosphoric acid
Stellenbosch University https://scholar.sun.ac.za

63
Table 4.5 Grower diet calculated nutritional values.
Available Phosphorus Total Phosphorus
Nutritional Value Units Con DF DFS DF DFS
AME MJ/kg 13.48 13.47 13.47 13.46 13.46
Crude protein % 22.05 22.07 22.07 22.16 22.16
Dry matter % 88.90 88.90 88.90 88.76 88.76
Lysine % 1.38 1.38 1.38 1.38 1.38
Methionine % 0.69 0.69 0.69 0.69 0.69
Threonine % 0.95 0.95 0.95 0.95 0.95
Tryptophan % 0.26 0.26 0.26 0.26 0.26
Isoleucine % 0.99 0.99 0.99 0.99 0.99
Leucine % 1.90 1.90 1.90 1.91 1.91
Ash % 4.17 5.02 5.02 5.04 5.04
Crude fibre % 3.29 3.31 3.31 3.41 3.40
Crude fat % 10.00 10.00 10.00 10.00 10.00
Calcium % 0.90 0.90 0.90 0.90 0.90
Phosphorous % 0.86 0.61 0.60 0.50 0.50
Available phosphorous % 0.45 0.45 0.45 0.26 0.26
AME: Apparent metabolisable energy
Con: control diet
DF: defluorinated phosphoric acid
DFS: defluorinated and desulfonated phosphoric acid
Stellenbosch University https://scholar.sun.ac.za

64
Table 4.6 Finisher diet ingredient composition (%) used during the trial.
Available Phosphorus Total Phosphorus
Ingredients Con DF DFS DF DFS
Maize 57.10 56.99 56.85 56.99 56.98
Soybean full fat 15.00 17.73 17.73 21.13 21.05
Soybean 46 18.90 16.86 16.86 14.24 14.30
L-lysine HCl 0.20 0.20 0.20 0.19 0.19
DL methionine 0.32 0.32 0.32 0.32 0.32
L-threonine 0.10 0.10 0.10 0.10 0.10
Vit+min premix* 0.25 0.25 0.25 0.25 0.25
Limestone 1.29 2.09 2.09 2.08 2.08
Salt 0.24 0.25 0.25 0.03 0.03
MDCP 1.71
Sodium bicarbonate 0.17 0.17 0.17 0.16 0.16
Oil - sunflower 4.72 4.35 4.35 3.75 3.76
DF phosphoric acid 0.84 0.55
DFS phosphoric acid 0.84 0.55
*Vitamin and minerals premix
Con: control diet
MDCP: mono-dicalcium phosphate
DF: defluorinated phosphoric acid
DFS: defluorinated and desulfonated phosphoric acid
Stellenbosch University https://scholar.sun.ac.za

65
Table 4.7 Finisher diet calculated nutritional values.
Available Phosphorus Total Phosphorus
Nutritional Value Units Con DF DFS DF DFS
AME MJ/kg 13.72 13.71 13.71 13.71 13.71
Crude protein % 19.64 19.69 19.69 19.74 19.74
Dry matter % 88.73 88.70 88.70 88.61 88.61
Lysine % 1.21 1.21 1.21 1.21 1.21
Methionine % 0.61 0.61 0.61 0.61 0.61
Threonine % 0.84 0.84 0.84 0.85 0.85
Tryptophan % 0.22 0.22 0.22 0.22 0.22
Isoleucine % 0.87 0.87 0.87 0.87 0.87
Leucine % 1.75 1.75 1.75 1.76 1.76
Ash % 3.83 4.63 4.63 4.64 4.64
Crude fibre % 3.03 3.07 3.07 3.13 3.13
Crude fat % 9.91 10.00 10.00 10.00 10.00
Calcium % 0.85 0.85 0.85 0.85 0.85
Phosphorous % 0.80 0.56 0.56 0.50 0.50
Available phosphorous % 0.42 0.42 0.42 0.30 0.31
AME: Apparent metabolisable energy
Con: control diet
DF: defluorinated phosphoric acid
DFS: defluorinated and desulfonated phosphoric acid
4.3.3 Data Collection
All birds were weighed at placement and weekly thereafter until slaughter at 35 days of age.
Cage weight was recorded and an average weight per bird was calculated, correcting for
mortalities. Mortalities were recorded twice daily with all dead birds being weighed. Feed
consumption per pen was calculated weekly until slaughter, making sure to correct for
mortalities. Live weights and feed remaining were used for calculations of weekly feed intake,
feed conversion ratio (FCR) (equation 4.1), cumulative feed intake, average daily gain (ADG),
protein efficiency ratio (PER) (equation 4.2) and European production efficiency factor (EPEF)
Stellenbosch University https://scholar.sun.ac.za

66
(equation 4.3). European production efficiency factor takes into account liveability, which is
the percentage of birds surviving until slaughter expressed as a percentage of birds placed.
The formulae used for calculations of coefficients and ratios are as follows:
Equation 4.1
Feed conversion ratio =Cumulative feed intake (g)
Average live weight gain per chick (g)
Equation 4.2
Protein Efficiency Ratio = Weight Gain (g)
(Weekly Feed Intake (g)×Protein %)/100
Equation 4.3
European production efficacy factor =Liveability (%) × Live weight at slaughter (g)
Age (days) ×Feed conversion ratio×100
4.4 Statistical analysis
Statistical analysis was performed using STATISTICA (Dell Inc., 2016). The assumptions for
normality and homoscedasticity were investigated first using Levene’s test and thereafter
further analysis were performed. A significance level of p≤0.05 was used. Further tests were
done by one-way analysis of variance (ANOVA) with the Bonferroni LSD post hoc test.
Average daily gain (ADG) was calculated by means of simple linear regression with change in
weight over time. The subsequent regression function was taken as the ADG and these were
compared between treatments.
4.5 Results and discussion
4.5.1 Live weight and cumulative weight gain
The effects of defluorinated PA and defluorinated and desulfonated PA on live weights and
cumulative weight gain are depicted in Tables 4.8 and 4.9. No differences (p>0.05) were found
at hatch (day 0) for live weights across any treatments signifying no differences in weight at
the start of the trial. However, on day 7 significant differences between the dietary treatment
live weights were found, and for every weekly weighing there after until the end of the trial
Stellenbosch University https://scholar.sun.ac.za

67
(Table 4.8). On day 7, treatment aP-DF-G had the highest mean live weight and remained the
highest throughout the trial. On day 14, a trend is noticed between treatment diets formulated
for aP (Con, aP-DF-G, aP-DF-L, aP-DFS-G and aP-DFS-L) and treatment diets formulated for
tP (tP-DF-G, tP-DF-L, tP-DFS-G and tP-DFS-L). Those diets formulated for aP were seen to
have consistently higher mean live weights than those formulated for tP, and this trend is
evident from day 14 through to day 35; Figure 4.1 illustrates the mean weekly gain in live
weight between all the dietary treatments (growth curve). However, Figure 4.2 may be a better
representation of the trend previously referred to. This graph has been made such that the
control stands alone and all the diets formulated for aP are represented by a single line as well
as all those formulated for tP. It is clear that by day 14 the birds fed the control and diets
formulated for aP had begun to gain weight faster than those fed diets formulated for tP. At
day 35, there is significant difference between all the diets formulated for aP and those for tP
(as seen by use of the superscripts in Table 4.8) and both Figure 4.1 and 4.2 illustrate these
differences. Significant differences in cumulative weight gain was found throughout the trial.
Similar to the live weights results, dietary treatment aP-DF-G recorded the highest cumulative
weight gains throughout the trial. Furthermore, a trend is noticeable between diets formulated
for aP and tP, and again those formulated for aP had the higher cumulative weight gains.
On day 21, the birds which were fed diets formulated for aP were found to have a 19.3% greater
mean live weight than those formulated for tP, irrespective of the PA used and the method in
which the PA was added to the feed (Table 4.8). The diets formulated according to dietary aP
levels had 0.50% aP and those formulated according to dietary tP levels have 0.28% aP. Shaw
et al. (2010) reported a 52.9% increase in body weight on day 21 between birds fed diets with
non-phytate phosphorus (npP) levels of 0.45% (standard P levels) and 0.25% (low P levels).
The term npP refers to the amount of P plant source that is not bound to phyate and therefore
is available to the bird. The cause of these differences between the two studies may be partially
due to the difference in Ca:P ratios. The current study has Ca:P ratios between diets formulated
for aP and tP of 2.1:1 and 3.8:1, respectively. That reported by Shaw et al. (2010) show the
Ca:P ratios to be 3.04:1 for the diets with standard P levels and 5.72:1 for the diets with low P
levels. Inaccurate ratios of Ca and P has been reported to decrease P utilization (Harrold et al.,
1983; Mc Donald et al., 2011). The adverse ratios, generally greater dietary Ca levels, reduce
P availability by forming insoluble calcium phosphates in the gastrointestinal tract (Heaney &
Nordin, 2002; Mc Donald et al., 2011). Therefore, as the levels of aP are further decreased, Ca
Stellenbosch University https://scholar.sun.ac.za

68
levels increase further, creating wider ratios which affects P utilization and so overall
development and growth is affected.
No significant differences were seen between the types of PA used provided their inclusion
levels were the same. An assumption could be made that the diets which had the PA included
to the grains have greater mean weights. However, after closer inspection this assumption is
ruled out as the level of significance for treatments with the PA included to the grains are not
different from those with the PA included last. Therefore, the type of PA and the method of
mixing the PA into the feed had no effect on live weight and cumulative weight gain.
Figure 4.1 Mean live weight of birds fed the dietary treatments from placement to slaughter.
0
200
400
600
800
1000
1200
1400
1600
1800
2000
2200
Day 0 Day 7 Day 14 Day 21 Day 28 Day 35
Control
aP-DF-G
aP-DF-L
aP-DFS-G
aP-DFS-L
tP-DF-G
tP-DF-L
tP-DFS-G
tP-DFS-L
Live
weight
gain
(kg)
Day of weighing
Stellenbosch University https://scholar.sun.ac.za

69
Figure 4.2 Mean live weight of birds fed the control diet and diets that received P inclusion
based on the dietary available phosphorus (aP) levels and dietary total phosphorus (tP) levels.
0
200
400
600
800
1000
1200
1400
1600
1800
2000
2200
Day 0 Day 7 Day 14 Day 21 Day 28 Day 35
Control
aP
tP
Day of weighing
Live
weight
gain
(kg)
Stellenbosch University https://scholar.sun.ac.za
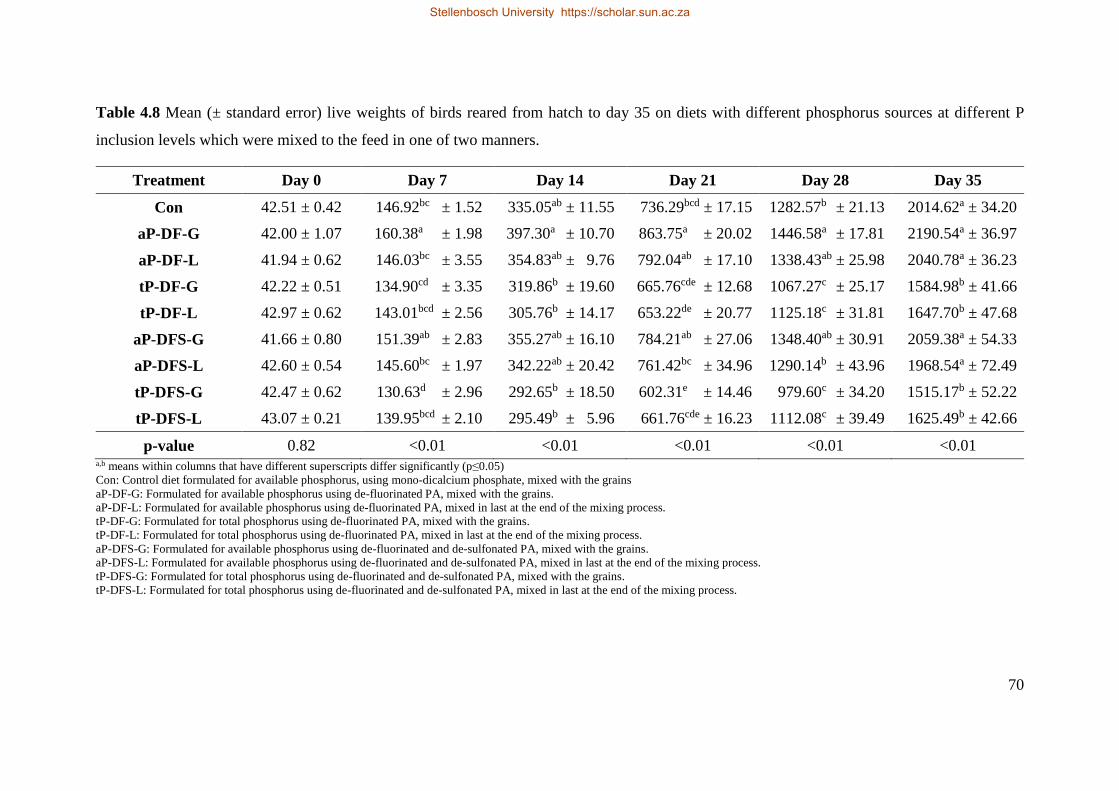
70
Table 4.8 Mean (± standard error) live weights of birds reared from hatch to day 35 on diets with different phosphorus sources at different P
inclusion levels which were mixed to the feed in one of two manners.
Treatment Day 0 Day 7 Day 14 Day 21 Day 28 Day 35
Con 42.51 ± 0.42 146.92bc ± 1.52 335.05ab ± 11.55 736.29bcd ± 17.15 1282.57b ± 21.13 2014.62a ± 34.20
aP-DF-G 42.00 ± 1.07 160.38a ± 1.98 397.30a ± 10.70 863.75a ± 20.02 1446.58a ± 17.81 2190.54a ± 36.97
aP-DF-L 41.94 ± 0.62 146.03bc ± 3.55 354.83ab ± 9.76 792.04ab ± 17.10 1338.43ab ± 25.98 2040.78a ± 36.23
tP-DF-G 42.22 ± 0.51 134.90cd ± 3.35 319.86b ± 19.60 665.76cde ± 12.68 1067.27c ± 25.17 1584.98b ± 41.66
tP-DF-L 42.97 ± 0.62 143.01bcd ± 2.56 305.76b ± 14.17 653.22de ± 20.77 1125.18c ± 31.81 1647.70b ± 47.68
aP-DFS-G 41.66 ± 0.80 151.39ab ± 2.83 355.27ab ± 16.10 784.21ab ± 27.06 1348.40ab ± 30.91 2059.38a ± 54.33
aP-DFS-L 42.60 ± 0.54 145.60bc ± 1.97 342.22ab ± 20.42 761.42bc ± 34.96 1290.14b ± 43.96 1968.54a ± 72.49
tP-DFS-G 42.47 ± 0.62 130.63d ± 2.96 292.65b ± 18.50 602.31e ± 14.46 979.60c ± 34.20 1515.17b ± 52.22
tP-DFS-L 43.07 ± 0.21 139.95bcd ± 2.10 295.49b ± 5.96 661.76cde ± 16.23 1112.08c ± 39.49 1625.49b ± 42.66
p-value 0.82 <0.01 <0.01 <0.01 <0.01 <0.01 a,b means within columns that have different superscripts differ significantly (p≤0.05)
Con: Control diet formulated for available phosphorus, using mono-dicalcium phosphate, mixed with the grains
aP-DF-G: Formulated for available phosphorus using de-fluorinated PA, mixed with the grains.
aP-DF-L: Formulated for available phosphorus using de-fluorinated PA, mixed in last at the end of the mixing process.
tP-DF-G: Formulated for total phosphorus using de-fluorinated PA, mixed with the grains.
tP-DF-L: Formulated for total phosphorus using de-fluorinated PA, mixed in last at the end of the mixing process.
aP-DFS-G: Formulated for available phosphorus using de-fluorinated and de-sulfonated PA, mixed with the grains.
aP-DFS-L: Formulated for available phosphorus using de-fluorinated and de-sulfonated PA, mixed in last at the end of the mixing process.
tP-DFS-G: Formulated for total phosphorus using de-fluorinated and de-sulfonated PA, mixed with the grains.
tP-DFS-L: Formulated for total phosphorus using de-fluorinated and de-sulfonated PA, mixed in last at the end of the mixing process.
Stellenbosch University https://scholar.sun.ac.za
Stellenbosch University https://scholar.sun.ac.za

71
Table 4.9 Mean (± standard error) cumulative weight gain of birds reared from hatch to day 35 on diets with different phosphorus sources at
different P inclusion levels which were mixed to the feed in one of two manners.
Treatment Day 0-7 Day 0-14 Day 0-21 Day 0-28 Day 0-35
Con 104.41bc ± 1.49 292.54ab ± 11.28 593.22bcd ± 20.87 1157.41a ± 53.59 1887.98a ± 85.11
aP-DF-G 118.38a ± 1.93 355.30a ± 10.07 821.75a ± 19.40 1404.58a ± 18.06 2148.20a ± 30.43
aP-DF-L 104.10bc ± 3.43 287.11ab ± 10.03 702.08ab ± 16.10 1303.60a ± 30.51 1980.55a ± 40.47
tP-DF-G 91.85cd ± 3.36 275.90b ± 19.55 620.72cd ± 14.30 1032.99c ± 25.10 1418.78b ± 27.27
tP-DF-L 98.85bcd ± 3.36 263.17b ± 4.47 605.84d ± 18.48 1089.62bc ± 37.17 1578.22b ± 68.51
aP-DFS-G 108.72ab ± 3.43 314.32ab ± 15.46 743.27ab ± 26.40 1307.46a ± 30.14 2004.45a ± 51.45
aP-DFS-L 103.00bc ± 1.91 299.62ab ± 20.18 718.20bc ± 35.27 1257.28ab ± 36.88 1922.86a ± 59.45
tP-DFS-G 88.16d ± 3.23 250.18b ± 18.28 555.98d ± 14.98 938.27c ± 36.06 1416.21b ± 42.88
tP-DFS-L 97.17bcd ± 1.80 254.37b ± 6.62 620.64cd ± 17.18 1066.0c ± 35.28 1566.51b ± 47.38
p-value <0.01 <0.01 <0.01 <0.01 <0.01 a,b means within columns that have different superscripts differ significantly (p≤0.05)
Con: Control diet formulated for available phosphorus, using mono-dicalcium phosphate, mixed with the grains
aP-DF-G: Formulated for available phosphorus using de-fluorinated PA, mixed with the grains.
aP-DF-L: Formulated for available phosphorus using de-fluorinated PA, mixed in last at the end of the mixing process.
tP-DF-G: Formulated for total phosphorus using de-fluorinated PA, mixed with the grains.
tP-DF-L: Formulated for total phosphorus using de-fluorinated PA, mixed in last at the end of the mixing process.
aP-DFS-G: Formulated for available phosphorus using de-fluorinated and de-sulfonated PA, mixed with the grains.
aP-DFS-L: Formulated for available phosphorus using de-fluorinated and de-sulfonated PA, mixed in last at the end of the mixing process.
tP-DFS-G: Formulated for total phosphorus using de-fluorinated and de-sulfonated PA, mixed with the grains.
tP-DFS-L: Formulated for total phosphorus using de-fluorinated and de-sulfonated PA, mixed in last at the end of the mixing process.
Stellenbosch University https://scholar.sun.ac.za
Stellenbosch University https://scholar.sun.ac.za
72
4.5.2 Cumulative intake
The results of cumulative feed intake are shown in Table 4.10. On day 0-7 and day 0-14 there
are no significant differences seen in cumulative feed intake. Differences in cumulative feed
intake are however evident on days 0-21, 0-28 and 0-35 (p<0.01). Treatment aP-DF-G has the
highest intake for days 0-7, -14 and -21. Thereafter, birds fed the Con treatment diet had the
highest intake (day 0-28 and 0-35). However, there is no difference between the Con and aP-
DF-G as well as the other diets formulated for aP on these days. Chickens which received
treatment tP-DFS-G had the lowest intake throughout the trial.
Viveros et al. (2002) reports differences (p≤0.05) in the broiler feed intake of diets with
different npP levels. It was reported that birds fed diets with npP levels of 0.35 and 0.22% had
significantly greater feed consumption than those fed diets with npP levels of 0.27 and 0.14%,
respectively. These findings are similar to that found in the current study as diets which
received PA inclusion levels based on aP (aP= 0.42-0.50%) had higher intake than the tP (aP=
0.26-0.30%) diets. These two studies are not comparable as one refers to the npP levels and the
other aP levels, however the application where the higher P levels results in higher intake is
the same. It is also clear that the type of PA used and the method of incorporating it into the
diet had no significant effect on intake provided the diets P inclusion levels are the same.
Suttle (2010) states that there is a correlation between appetite loss and phosphorus deprivation.
This seems to be the case on days 0-21, 0-28 and 0-35. More particularly in the last two weeks
of the trial (day 0-28 and 0-35). The treatment diets with P inclusion levels based on tP levels
(aP= 0.26-0.30%) resulted in lower cumulative intakes than those with P inclusion levels based
on aP (aP= 0.42-0.45%). Therefore, as theorised by Suttle (2010), loss of appetite and
subsequent P deprivation initially started between days 14 and 21, as no significant differences
in intake occurred between days 0-7 and -14. Although the p-value for day 0-14 (p= 0.086)
indicated a tendency to differ; this could indicate that the initial onset of deprivation may have
occurred earlier.
Stellenbosch University https://scholar.sun.ac.za

73
Table 4.10 Mean (± standard error) cumulative intake (g) of birds reared from hatch to day 35 on diets with different phosphorus sources at
different P inclusion levels which were mixed to the feed in one of two manners.
Treatment Day 0-7 Day 0-14 Day 0-21 Day 0-28 Day 0-35
Con 139.78 ± 3.35 323.78 ± 11.57 1032.68abc ± 29.28 2077.46a ± 66.74 3236.58a ± 69.05
aP-DF-G 151.27 ± 3.70 372.53 ± 11.22 1138.77a ± 40.92 1997.92a ± 40.66 3143.19a ± 77.32
aP-DF-L 146.07 ± 3.12 338.27 ± 5.89 1091.70ab ± 16.65 1956.57a ± 30.39 3032.64a ± 66.29
tP-DF-G 141.17 ± 7.48 332.00 ± 17.63 967.36abc ± 30.60 1661.49cd ± 28.89 2242.41b ± 74.97
tP-DF-L 142.22 ± 8.34 325.51 ± 17.57 947.37bc ± 24.29 1673.32bcd ± 40.40 2383.38b ± 63.16
aP-DFS-G 141.78 ± 6.35 337.03 ± 11.26 1073.03ab ± 21.94 1919.35ab ± 36.82 3019.67a ± 89.52
aP-DFS-L 143.15 ± 4.84 325.08 ± 18.02 1028.72abc ± 64.45 1850.05abc ± 75.41 2877.85a ± 34.84
tP-DFS-G 130.53 ± 6.77 284.03 ± 25.05 884.62c ± 44.49 1553.02d ± 60.15 2242.43b ± 96.95
tP-DFS-L 142.75 ± 6.21 305.67 ± 27.96 970.44abc ± 31.42 1679.33bcd ± 65.10 2450.90b ± 96.49
p-value 0.56 0.09 <0.01 <0.01 <0.01 a,b means within columns that have different superscripts differ significantly (p≤0.05)
Con: Control diet formulated for available phosphorus, using mono-dicalcium phosphate, mixed with the grains
aP-DF-G: Formulated for available phosphorus using de-fluorinated PA, mixed with the grains.
aP-DF-L: Formulated for available phosphorus using de-fluorinated PA, mixed in last at the end of the mixing process.
tP-DF-G: Formulated for total phosphorus using de-fluorinated PA, mixed with the grains.
tP-DF-L: Formulated for total phosphorus using de-fluorinated PA, mixed in last at the end of the mixing process.
aP-DFS-G: Formulated for available phosphorus using de-fluorinated and de-sulfonated PA, mixed with the grains.
aP-DFS-L: Formulated for available phosphorus using de-fluorinated and de-sulfonated PA, mixed in last at the end of the mixing process.
tP-DFS-G: Formulated for total phosphorus using de-fluorinated and de-sulfonated PA, mixed with the grains.
tP-DFS-L: Formulated for total phosphorus using de-fluorinated and de-sulfonated PA, mixed in last at the end of the mixing process.
Stellenbosch University https://scholar.sun.ac.za
Stellenbosch University https://scholar.sun.ac.za

74
4.5.3 Feed conversion ratio
Results of feed conversion ratios (FCR) for the current study are depicted in Table 4.11. The
feed conversion ratio is a measure of how efficiently the animal uses the nutrients available to
it. No significant difference in FCR was seen at week 2 (day 0-14) and 5 (day 0-35), however,
treatment differences (p≤0.05) are seen at week 1 (day 0-7), 3 (day 0-21) and 4 (day 0-28). In
week 1, birds fed the aP-DF-G treatment diet recorded the best (lowest) FCR and this treatment
continued to have the best FCR through the trial. In week 3, the Con treatment diet had the
highest FCR and treatment tP-DFS-G recorded the highest FCR in week 4. The remainder of
all the treatments were intermediary for both weeks.
Butcher and Nilipour (2002) reported a FCR value of no more than 1.85 is essential for broiler
production to be normal and a lower FCR is more beneficial and indicates positive results.
Therefore, the feed in the current study was used efficiently throughout the trial as all FCR
values are all below 1.85. The diets with P inclusion levels based on aP resulted in lower,
therefore better, FCR values than the Con diet throughout the trial. The control diet closely
resembled commercially available diets therefore the PA’s prove to be an effective iP sources
in maintaining a good FCR.
Stellenbosch University https://scholar.sun.ac.za

75
Table 4.11 Mean (± standard error) feed conversion ratios of birds reared from hatch to day 35
on diets with different phosphorus sources at different P inclusion levels which were mixed to
the feed in one of two manners.
Treatment Day 0-7 Day 0-14 Day 0-21 Day 0-28 Day 0-35
Con 1.37ab ± 0.03 1.11 ± 0.03 1.60a ± 0.03 1.61ab ± 0.04 1.59 ± 0.02
aP-DF-G 1.28b ± 0.03 1.05 ± 0.02 1.38c ± 0.02 1.42c ± 0.03 1.46 ± 0.02
aP-DF-L 1.41ab ± 0.05 1.09 ± 0.04 1.47abc ± 0.03 1.50bc ± 0.02 1.53 ± 0.02
tP-DF-G 1.54a ± 0.05 1.21 ± 0.05 1.56ab ± 0.03 1.61ab ± 0.01 1.58 ± 0.04
tP-DF-L 1.43ab ± 0.05 1.24 ± 0.09 1.57ab ± 0.04 1.54abc ± 0.04 1.52 ± 0.04
aP-DFS-G 1.30b ± 0.04 1.08 ± 0.04 1.45abc ± 0.03 1.47bc ± 0.01 1.51 ± 0.01
aP-DFS-L 1.39ab ± 0.05 1.10 ± 0.06 1.43bc ± 0.04 1.47bc ± 0.05 1.49 ± 0.04
tP-DFS-G 1.48ab ± 0.03 1.13 ± 0.06 1.59ab ± 0.05 1.66a ± 0.01 1.58 ± 0.04
tP-DFS-L 1.47ab ± 0.08 1.20 ± 0.09 1.56ab ± 0.02 1.57ab ± 0.03 1.57 ± 0.04
p-value <0.01 0.25 <0.01 <0.01 0.06 a,b means within columns that have different superscripts differ significantly (p≤0.05)
Con: Control diet formulated for available phosphorus, using mono-dicalcium phosphate, mixed with the grains
aP-DF-G: Formulated for available phosphorus using de-fluorinated PA, mixed with the grains.
aP-DF-L: Formulated for available phosphorus using de-fluorinated PA, mixed in last at the end of the mixing process.
tP-DF-G: Formulated for total phosphorus using de-fluorinated PA, mixed with the grains.
tP-DF-L: Formulated for total phosphorus using de-fluorinated PA, mixed in last at the end of the mixing process.
aP-DFS-G: Formulated for available phosphorus using de-fluorinated and de-sulfonated PA, mixed with the grains.
aP-DFS-L: Formulated for available phosphorus using de-fluorinated and de-sulfonated PA, mixed in last at the end of the
mixing process.
tP-DFS-G: Formulated for total phosphorus using de-fluorinated and de-sulfonated PA, mixed with the grains.
tP-DFS-L: Formulated for total phosphorus using de-fluorinated and de-sulfonated PA, mixed in last at the end of the mixing
process.
4.5.4 Average daily gain, PER, EPEF and liveability
The dietary treatment effects on average daily gain (ADG), European production efficiency
ratio (EPER), protein efficiency ratio (PER) and liveability are presented in Table 4.12.
Significant differences were found in all these scientific calculations. Dietary treatment aP-DF-
G reported the highest ADG, EPEF, PER and liveability. These calculations take into account
live weight, weight gain and feed intake, all of which treatment aP-DF-G had performed the
best. Also, all the diets formulated for aP resulted in better values than those formulated for tP.
The mortality rate of 6.5% for the current study is much higher than that which is acceptable
for a flock (2%). However, 1.45% of the deaths were unexpectedly recorded by the control
treatment in the beginning of the grower phase. After post-mortem inspection on the first two
Stellenbosch University https://scholar.sun.ac.za

76
of these birds was completed, it was found that the deaths were caused by sodium (Na)
poisoning. This occurred at the beginning of the grower feeding period on day 14. The birds
received the grower feed at approximately 08:00 and an issue was noticed the next morning at
06:00 and after realisation of the poisoning the feed was removed at approximately 10:00 am.
This means the birds had access to the high Na feed only for approximately 26 hours. Thereafter
birds only had access to water for approximately five hours to allow for ‘flushing’ of the birds
system whilst new feed was being mixed and once the new feed was completed the birds were
given the feed immediately. The birds were then monitored closely for the remainder of the
day to ensure no further issues occurred. This might be seen as something which could affect
the birds overall growth and therefore, the statistical analysis for all the data obtained within
this chapter was rerun without the control diet’s data being included in the analysis. The rerun
showed very little difference between the two sets of statistical analysis (Addendum A) and so
it was concluded that this error had no effect on the overall production of the birds fed the
control diet and the control could still be compared to as a commercial broiler diet yielding
results that would normally be obtained in industry. A further 3.52% of the deaths occurred in
the last week (week 5) of the trial. These deaths came only from the treatment diets that had P
inclusion levels based on the dietary tP levels. Of this 3.52%, 0.95% were culled due to leg
disorders and 2.57% of the deaths were due to morbidity. It has been reported that excessive
undersupply of P can result in high mortalities (Waldroup, 1999). Furthermore, it was
mentioned in section 4.5.2 that the onset of P deprivation occurred in week 3 of the trial. The
conclusion can therefore be made that during week 5 the P deprivation had become fatal.
To obtain the best production efficiency from a flock, the following minimum values should
be adhered to: at 35 days, a live slaughter weight between 1.5-2 kg, with a FCR less than 1.85,
ADG greater than 50g and finally an EPEF value greater than 260 (Butcher & Nilipour, 2002).
All treatments’ live weight and FCR values are better than the minimum stated by Butcher and
Nilipour (2002). Although all the diets formulated for tP are on the borderline of the minimum
for live weight. All diets formulated for aP meet minimum requirements for ADG and EPEF
whereas those formulated for tP do not meet these minimum standards, except for treatments
tP-DFS-L and tP-DF-L, which are slightly above the minimum EPEF value. The calculation of
EPEF value includes the liveability of the flock. Therefore, the low liveability seen in
treatments formulated for tP, due to P deprivation, may be cause for the low EPEF values for
these treatments.
Stellenbosch University https://scholar.sun.ac.za

77
The PER is the amount of weight gained for every unit of protein intake, and a PER value
below 1.5 is indicative of low dietary protein quality as well as low protein utilization (Johnson
& Parsons, 1997). The current study shows the treatments (p≤0.05) affected PER, with the
control treatment having the lowest PER value (PER= 2.87). However, all PER values obtained
indicate that the dietary protein was utilized efficiently.
Table 4.12 Mean (± standard error) average daily gain (ADG), European production efficiency
ratio (EPER), protein efficiency ratio (PER) and liveability of birds reared from hatch to day
35 on diets formulated for total or available phosphorus, using phosphoric acid as the
phosphorus source and different mixing sequences
Treatment ADG (g) EPEF PER Liveability (%)
Con 57.56b ± 0.98 306.65c ± 15.38 2.87e ± 0.03 85.00b ± 5.00
aP-DF-G 62.59a ± 1.06 428.29a ± 8.19 3.32a ± 0.05 100.00a ± 0.00
aP-DF-L 58.31b ± 1.04 368.19b ± 10.68 3.24ab ± 0.04 96.67a ± 2.11
tP-DF-G 45.29c ± 1.19 236.13e ± 8.70 2.90de ± 0.06 83.33b ± 6.15
tP-DF-L 47.08c ± 1.32 292.61c ± 21.65 3.09bc ± 0.08 93.33ab ± 3.33
aP-DFS-G 58.84ab ± 1.55 384.77b ± 14.47 3.36a ± 0.02 98.33a ± 1.67
aP-DFS-L 56.24b ± 2.07 364.05b ± 13.18 3.16bc ± 0.06 96.67a ± 2.11
tP -DFS-G 43.29c ± 1.49 244.92de ± 24.50 3.01cde ± 0.06 90.00ab ± 5.16
tP-DFS-L 46.44c ± 1.22 278.33cd ± 13.97 3.04cd ± 0.08 93.33ab ± 2.11
p-value <0.01 <0.01 <0.01 0.02 a,b means within columns that have different superscripts differ significantly (p≤0.05)
Con: Control diet formulated for available phosphorus, using mono-dicalcium phosphate, mixed with the grains
aP-DF-G: Formulated for available phosphorus using de-fluorinated PA, mixed with the grains.
aP-DF-L: Formulated for available phosphorus using de-fluorinated PA, mixed in last at the end of the mixing process.
tP-DF-G: Formulated for total phosphorus using de-fluorinated PA, mixed with the grains.
tP-DF-L: Formulated for total phosphorus using de-fluorinated PA, mixed in last at the end of the mixing process.
aP-DFS-G: Formulated for available phosphorus using de-fluorinated and de-sulfonated PA, mixed with the grains.
aP-DFS-L: Formulated for available phosphorus using de-fluorinated and de-sulfonated PA, mixed in last at the end of the
mixing process.
tP-DFS-G: Formulated for total phosphorus using de-fluorinated and de-sulfonated PA, mixed with the grains.
tP-DFS-L: Formulated for total phosphorus using de-fluorinated and de-sulfonated PA, mixed in last at the end of the mixing
process.
4.6 Conclusion
The current study was implemented to determine the effects of defluorinated phosphoric acid
and defluorinated and desulfonated phosphoric acid at two inclusion levels that were mixed
into the diet in two different manners on broiler production performance. A distinct
Stellenbosch University https://scholar.sun.ac.za

78
improvement in the treatments with P inclusion levels based on aP is evident in the
measurements of live weight, cumulative weight gain, cumulative intake and the calculations
of FCR, ADG, EPEF and PER. This is regardless of the PA and mixing method used. The
lower liveability in the control (typical of a commercial diet) was due to sodium poisoning
which occurred when the birds were first given access to the grower feed. However, P
deprivation occurred in the final stages of the trial in the treatments with low P inclusion levels
(based on tP) and this deprivation accounts for the majority of the mortalities. The method used
when mixing the PA into the diet had no effect on production performance. Diets which used
the PA with inclusion levels based on aP showed consistently similar, and in some instances
better values in all measurements, except for cumulative intake, when compared to the control
diet. As the control diet is based on a diet that is used commercially, the conclusion can be
made that both defluorinated PA and defluorinated and desulfonated PA are effective inorganic
phosphorus sources that will maintain, and at times improve broiler production performance,
on condition that P inclusion levels are sufficient to allow it.
4.7 References
Bar, A., & Hurwitz, S. 1984. Egg shell quality, medullary bone ash, intestinal calcium and
phosphorus absorption, and calcium-binding protein in phosphorus-deficient hens. Poult.
Sci. 63: 1975-1979.
Butcher, G. D., & Nilipour, A. H. 2002. Numbers for successful poultry production. University
of Florida, Institute of Food and Agricultural Sciences. (cited by Uushona et al., 2015)
Dar, W., & Gowda, C. 2013. Declining agricultural productivity and global food security. J.
Crop Improv. 27: 242-254.
Davies, N. T., & Reid, H. 1979. An evaluation of the phytate, zinc, copper, iron and manganese
contents of, and Zn availability from, soya-based textured-vegetable-protein meat-
substitutes or meat-extenders. Br. J. Nutr. 41: 579-89.
Dell Inc. (2016). Dell Statistica (data analysis software system), version 13. software.dell.com.
Driver, J. 2004. Performance and bone quality of the modern broiler chicken as influenced by
dietary calcium, phosphorus, phytase and 1-alpha-hydroxycholecalciferol. PhD Diss.
Univ. of Georgia, Athens, Georgia.
Stellenbosch University https://scholar.sun.ac.za

79
Harrold, R. L., Slanger, W. D., Haugse, C. N., & Johnson, R. L. 1983. Phosphorus
Bioavailability in the chick: Effects of protein source and calcium level. J. Anim. Sci. 57:
1173-1181.
Heaney, R. P., & Nordin, B. E. C. 2002. Calcium effects on phosphorus absorption:
implications for the prevention and co-therapy of osteoporosis. J. Am. Coll. Nutr. 21: 239-
244.
Hídvégi, M., & Lásztity, R. 2002. Phytic acid content of cereals and legumes and interaction
with proteins. Period. Pol Yyechnica Ser. Chem. Eng. 46: 59-64.
Johnson, M. L., & Parsons, C. M. 1997. Effects of raw material source, ash content, and assay
length on protein efficiency ratio and net protein ratio values for animal protein meals.
Poult. Sci. 76: 1722-1727.
Lima, F. R., Mendonc, C. X., Alvarez, J. C., Ghion, E., & Leal, P. M. 1997. Biological
evaluations of commercial dicalcium phosphates as sources of available phosphorus for
broiler chicks. Poult. Sci. 72: 1707-1713.
Maguire, R. O., Dou, Z., Sims, J. T., Brake, J., & Joern, B. C. 2005. Dietary strategies for
reduced phosphorus excretion and improved water quality. J. Environ. Qual. 34: 2093-
2103.
Mc Donald, P., Edwards, R. A., Greenhalgh, J. F. D., & Morgan, C. A. 2011. Animal nutrition.
7th ed. Pearson Education Limited, Prentice Hall, Edinburgh Gate, Harlow, Essex. pp
112-121.
Ravindran, V., Ravindran, G., & Sivalogan, S. 1994. Total and phytate phosphorus contents of
various foods and feedstuffs of plant origin. Food Chem. 50: 133-136.
Selle, P. H., & Ravindran, V. 2007. Microbial phytase in poultry nutrition. Anim. Feed Sci.
Technol. 135: 1-41.
Shaw, A. L., Blake, J. P., & Gordon, R. W. 2010. Evaluation of commercial phytase enzymes
on performance and tibia-breaking strength of male broiler chicks. J. Appl. Poult. Res 19:
415-421.
Stellenbosch University https://scholar.sun.ac.za

80
Sohail, S. S., & Roland, D. a. 1999. Influence of supplemental phytase on performance of
broilers four to six weeks of age. Poult. Sci. 78: 550-555.
Suttle, N. F. 2010. Mineral Nutrition of Livestock. 4th ed. CABI publishing, Wallingford,
Oxfordshire, UK. pp 54-167.
Teguia, A., & Beynen, A. C. 2005. Alternative feedstuffs for broilers in Cameroon. Livest.
Res. Rural Dev. 17. Art #34.
Uushona, T. 2015. Black soldier fly (Hermetia illucens) pre-pupae as a protein source for
broiler production. MSc (Agric), Stellenbosch Univ. South Africa.
Viljoen, J. 2001. Quality of feed phosphate supplements for animal nutrition. South African
Anim. Sci. 2: 13-19.
Viveros, A., Brenes, A., Arija, I., & Centeno, C. 2002. Effects of microbial phytase
supplementation on mineral utilization and serum enzyme activities in broiler chicks fed
different levels of phosphorus. Poult. Sci. 81: 1172-1183.
Waldroup, P. W. 1999. Nutritional approaches to reducing phosphorus excretion by poultry.
Poult. Sci. 78: 683-69.
Stellenbosch University https://scholar.sun.ac.za

81
Chapter 5
Influence of phosphoric acid on carcass characteristics and meat
quality
5.1 Abstract
Carcass characteristics and breast and thigh meat quality of broiler chickens fed diets
supplemented with either a defluorinated phosphoric acid (DF) or a defluorinated and
desulfonated phosphoric acid (DFS) were investigated. The control diet used a standard mono-
dicalcium phosphate (MDCP) as the phosphorus source with the inclusion levels calculated
according to dietary available phosphorus (aP) levels. A further eight treatment diets were also
mixed with one of the respective phosphorus source that was added either to the grains (G) or
added last during the mixing of the diets (L). Phosphoric acid (PA) inclusion levels were made
according to dietary aP or total phosphorus (tP) levels. Five hundred and forty Cobb 500 broiler
chicks were randomly allocated to the treatment diets and slaughtered at 35 days of age.
Treatment effects were not significant for the breast and thigh initial and ultimate pH, hue
angle, dressing percentage, muscle percentage, bone percentage, skin and fat percentage as
well as the portion weights of the breast and thigh. Breast meat colour CIE-Lab measurement
(L*, a* and b*) as well as chroma values were affected on the tP-DF-L dietary treatment and
was significantly lighter (higher L* values) than the other breasts and recorded significantly
higher chroma values. The tP-DFS-L treatment indicated significantly heavier drumstick and
wing portion weights. It was concluded that neither of the phosphoric acids nor the method of
mixing had negative effects on carcass characteristics or the meat quality of the breast and thigh
muscle. However, P inclusions levels did effect live, warm and cold carcass weights.
5.2 Introduction
The poultry industry has seen a trend whereby consumers, who once preferred purchasing the
whole bird; now prefer to purchase only the portion of the bird they are willing to eat. These
portions are more known in industry as secondary processed products (Dransfield & Sosnicki,
1999; Zhao et al., 2012). Secondary processing, also known as value adding, is a result of the
modern lifestyle of higher disposable income and less available time on hand to cook. This has
led to consumers being able and willing to pay an extra amount for partially prepared products
Stellenbosch University https://scholar.sun.ac.za
82
(Owens et al., 2010). Due to this change in consumer preference, the industries’ marketing
strategies have to be re-assessed to account for the change. Much of todays’ poultry is being
processed into higher value products such as breasts and de-boned pieces (Young et al., 2001).
Meeting the demands of the consumer means the birds need a desirable carcass conformation,
as well as larger edible portion yields (Bogosavljevic-Boskovic et al., 2010). The preferred
portions are the breast, drumstick (leg), thigh and wing and are represented as a percentage of
the carcass weight. The success of the broiler industry depends greatly on the producers’ ability
to increase the yields of these portions of the carcass (Guerrero-Legarreta, 2010). Producers
also need to maintain structural integrity of the bone to ensure this growth can take place, with
emphasis on calcium and phosphorus specifically (Angel, 2011). This is due to phosphorus and
calcium forming the building blocks of the skeleton (Soares, 1995). Therefore, it is essential to
ensure the dietary phosphorus level meets the bird’s daily requirements. Much of the dietary P
is of plant origin (Van der Klis & Versteegh, 1999). However, this source of P is predominately
unavailable to monogastric animals and so their diets need P supplements to alleviate any
shortages. Much of these supplements are inorganic phosphates (iP) (Viljoen, 2001). The
increase in demand for iP supplements has led to an increase in research and development in
this field, illustrating the significance of potentially using phosphoric acid (PA) as an inorganic
phosphate source.
Meat quality in general is a complex topic that has various aspects to it. Not only do carcasses
need to have good carcass composition and slaughter yields but also need to be aesthetically
pleasing to the eye with good sensory and nutritional characteristics (Bogosavljevic-Boskovic
et al., 2010). All these aspects add to the quality of the meat; poultry meat included.
The colour of meat is of great importance (Fanatico et al., 2007). It is the first feature a
consumer notices when considering to buy a meat product and this is more specific to value
added products (Fanatico et al., 2007). When purchasing meat products, a consumer generally
has two preferences; appearance (colour) and palatability (Kropf, 1980). Palatability is
determined ultimately by the overall meat quality of the product; therefore, due to consumers
having little means of determining meat quality, they must make their decision solely based on
the appearance of the product.
Stellenbosch University https://scholar.sun.ac.za

83
Considerable development has been made in growth efficiency and portion yields of poultry
(Havenstein et al., 2003). However, failure to improve meat quality characteristics has led to
defects in the meat products such as DFD (dark, firm and dry) and PSE (pale, soft and
exudative) (Souza et al., 2011). These defects are a result of muscle pH changes post-mortem.
Another phenomenon that is gaining publicity in the poultry industry is woody breast condition
(WBC). Woody breast condition is characterised by unappealing tactile defects on the raw
breast fillet, which causes it to be firmer than the normal breast fillet, as well as to have lower
protein functionality in further processed products (Mudalal et al., 2014; Sihvo et al., 2014).
Woody breast condition is said to be associated with the fast growth of the modern broiler
(Mutryn et al., 2015). This unappealing appearance of the fillet may have negative effects on
the sale potential of the fillet (Kuttappan et al., 2016).
Post-mortem pH changes are vital to maintaining the functional properties of meat, with a sharp
drop in pH soon after death being characteristic of PSE meat (Castellini et al., 2008). The
ultimate pH of a muscle affects the myoglobin’s ability to express the red colour in meat (Souza
et al., 2011). The post-mortem pH drop is determined by the muscles glycolytic enzyme
activity, therefore, the ultimate pH is affected by the muscles glycogen reserves at point of
slaughter (Fanatico et al., 2007). Lonergan et al. (2003) reported a strong positive correlation
between pH and redness (a*) and negative correlation between pH and lightness values of meat.
Little has been reported on the effects of PA on carcass characteristics and the physical
measurements of pH and colour of broiler chicken meat. Therefore, this study’s objectives were
to:
i. Assess the effects of two different types of phosphoric acids on carcass weights,
portion weights, dressing percentage, meat pH and colour.
ii. Evaluate the effects of adding the phosphoric acids to the diet at two inclusion levels
on carcass weights, portion weights, dressing percentage, meat pH and colour.
iii. Determine the effects of adding the phosphoric acid to the diet at different intervals
during the mixing process on carcass weights, portion weights, dressing percentage,
meat pH and colour.
Stellenbosch University https://scholar.sun.ac.za

84
5.3 Materials and methods
5.5.1 Birds, housing and experimental procedure
A thorough explanation of the chickens, housing, diets and experimental procedures is found
in Chapter 4. Briefly, nine dietary treatments were randomly designed into six replicates per
treatment with ten birds per replicate. The first treatment is the control, which received a
standard commercial mono-dicalcium phosphate. This was added to the grains during the
mixing of the feed (G). Formulations and therefore inclusion levels of the MDCP were
calculated according to available phosphorus (aP). The two sources of PA were added either to
the grains (maize, soya 46 and full fat soya) during mixing, or added last after all other
ingredients had been thoroughly mixed together (L). Inclusion levels of PA were calculated
either according to aP or total phosphorus (tP) levels of the diet. This gave rise to a further
eight treatment diets:
1. aP-DF-G: Formulated for available phosphorus using de-fluorinated PA, mixed with
the grains.
2. aP-DF-L: Formulated for available phosphorus using de-fluorinated PA, mixed in last
at the end of the mixing process.
3. tP-DF-G: Formulated for total phosphorus using de-fluorinated PA, mixed with the
grains.
4. tP-DF-L: Formulated for total phosphorus using de-fluorinated PA, mixed in last at the
end of the mixing process.
5. aP-DFS-G: Formulated for available phosphorus using de-fluorinated and de-
sulfonated PA, mixed with the grains.
6. aP-DFS-L: Formulated for available phosphorus using de-fluorinated and de-sulfonated
PA, mixed in last at the end of the mixing process.
7. tP-DFS-G: Formulated for total phosphorus using de-fluorinated and de-sulfonated PA,
mixed with the grains.
8. tP-FDS-L: Formulated for total phosphorus using de-fluorinated and de-sulfonated PA,
mixed in last at the end of the mixing process.
The respective diets were offered ad libitum to day-old broiler chickens. Treatment
specifications are explained fully in Table 4.1. From each cage, one bird close to the mean
Stellenbosch University https://scholar.sun.ac.za

85
weight of the birds in the cage was selected for slaughter at day 35. It was argued that this
selection would minimise the effect of the Na poisoning in the Control treatment as discussed
in the previous chapter and that the birds were representative of their treatments and were all
healthy. Broilers were slaughtered according to standard commercial practice at a commercial
abattoir. This involved electrical stunning (50-70 volts; 3-5 seconds), followed by
exsanguination.
5.5.2 Carcass characteristics and physical measurements
After slaughter, the birds were scalded, defeathered and eviscerated. The initial muscle pH of
the right thigh and breast was determined within 15 minutes of slaughter using a portable,
calibrated (buffers pH 4.0 and 7.0 at room temperature) Crison pH25 meter. Following initial
pH readings, the carcasses were hung in cold storage at 4°C for 24 hours. Ultimate pH was
determined in a similar manner to that of the initial pH, however in the left thigh and breast
muscles after 24 hours in cold storage.
Live weight, warm carcass and cold carcass weight (24 hrs post mortem) were recorded. The
percentile difference between the live weight and the hot carcass weight were used to calculate
dressing percentage. Commercial portion yields were determined using a portion cutter and
cutting the cold carcass in half. Thereafter, the wings were removed by cutting between the
scapula and coracoid. Removal of the thigh and drumstick required an incision above the thigh,
cutting behind the pubic bone, toward the acetabulum. The thigh and drumstick were then
separated with a perpendicular cut to the joint connecting the two cuts. Weights of the separate
portions were recorded using a Mettler PC 4400 scale (Mettler-Toledo, Switzerland). These
portion weights, expressed as a percentage relative to the chilled carcass weight, gave the
percentage of the component yields.
The right breast portion was skinned and deboned, where after the weights of the muscle, bone
and skin and fat were separately recorded for determination of muscle, bone and skin and fat
percentage. The muscle was then cut in half and allowed to bloom for 30 minutes at 8 ºC. The
meat colour was measured using a CIE-Lab colour meter (BYK-Gerdner GmbH, Gerestried,
Germany). Measurements taken were L* (lightness), a* (redness) and b*(yellowness).
Triplicate measurements were taken over the exposed meat and the average calculated. The
Stellenbosch University https://scholar.sun.ac.za

86
hue angle and chroma values of the breast was calculated using equations 5.1 and 5.2
respectively.
Equation 5.1
Chroma (C*) = √(a*)2+(b*)
2
Equation 5.2
Hue (hab)= tan-1 (b*
a*)
5.4 Statistical analysis
All statistical analyses were performed using the general linear models procedure in
STATISTICA (Dell Inc., 2016). All data were tested for homoscedasticity and normality using
Levene’s test before any further analysis was performed. If the assumptions were correct
(p>0.05), a one-way analysis of variance (ANOVA) was performed with Bonferroni LSD post
hoc test to analyse any differences between the treatments diets.
5.5 Results and Discussion
5.5.1 Carcass characteristics
5.5.1.1 Dressing percentage and carcass component yield
Diet influenced the live weight, as well as warm and cold carcass weights (p≤0.05) of the
broilers (Table 5.1). However, even though the selection of the specific birds per replication
per diet would have led to these differences (particularly live weight); these differences are still
representative of the effect of the diets on the overall growth of the broilers (see Chapter 4).
The aP-DF-G treatment group (defluorinated PA with inclusion levels calculated according to
aP and mixed with the grains) yielded the highest weights and the tP-DFS-L group the lowest.
Portion differences were miniscule between the P sources, provided the P inclusion levels were
the same (based on either dietary tP or aP levels). Portions from treatments with P inclusion
levels, and therefore formulations, based on dietary available phosphorus levels (aP= 0.42-
0.50%) differ significantly (heavier) from those based on dietary total phosphorus levels (aP=
0.26-0.30%) in all weights.
Stellenbosch University https://scholar.sun.ac.za

87
Table 5.1 Mean (± standard error) of live weight and warm and cold carcass weight of broilers
reared until 35 days of age on feeds formulated and mixed in different manners using two
different phosphoric acids.
Treatment Live weight (g) Warm carcass weight (g) Cold carcass weight (g)
Con 2003.8abcd ± 103.6 1359.4abc ± 67.6 1344.5abcd ± 68.2
aP-DF-G 2323.7a ± 69.6 1607.8a ± 46.2 1593.0a ± 46.1
aP-DF-L 2084.6abc ± 80.8 1433.1ab ± 56.4 1419.3ab ± 56.8
tP-DF-G 1629.5de ± 135.9 1049.7d ± 84.5 1066.0de ± 91.4
tP-DF-L 1833.5bcde ± 55.5 1212.9bcd ± 28.4 1199.5bcde ± 27.6
aP-DFS-G 2031.7abc ± 65.2 1408.6abc ± 50.9 1389.3abc ± 49.6
aP-DFS-L 2121.7ab ± 38.8 1394.7abc ± 54.8 1382.7abc ± 56.2
tP-DFS-G 1703.0cde ± 80.6 1129.8cd ± 58.9 1115.5cde ± 59.7
tP-DFS-L 1544.2e ± 60.8 1004.2d ± 64.2 995.0e ± 63.5
p-value <0.01 <0.01 <0.01 a,b means within columns that have different superscripts differ significantly (p≤0.05)
Con: Control diet formulated for available phosphorus, using mono-dicalcium phosphate, mixed with the grains.
aP-DF-G: Formulated for available phosphorus using de-fluorinated PA, mixed with the grains.
aP-DF-L: Formulated for available phosphorus using de-fluorinated PA, mixed in last at the end of the mixing process.
tP-DF-G: Formulated for total phosphorus using de-fluorinated PA, mixed with the grains.
tP-DF-L: Formulated for total phosphorus using de-fluorinated PA, mixed in last at the end of the mixing process.
aP-DFS-G: Formulated for available phosphorus using de-fluorinated and de-sulfonated PA, mixed with the grains.
aP-DFS-L: Formulated for available phosphorus using de-fluorinated and de-sulfonated PA, mixed in last at the end of the
mixing process.
tP-DFS-G: Formulated for total phosphorus using de-fluorinated and de-sulfonated PA, mixed with the grains.
tP-DFS-L: Formulated for total phosphorus using de-fluorinated and de-sulfonated PA, mixed in last at the end of the mixing
process.
Dressing percentage is the marketable higher value portion of a carcass and is influenced by
visceral growth and muscle growth. No differences in dressing percentage, muscle, bone, skin
and fat percentage was found (p>0.05) between the treatments (Table 5.2). These findings are
similar to those reported by Kozlowski et al. (2009), with reference to the effects of dietary
phosphorus levels on dressing percentage. However, Çimrin and Demirel, (2008) who tested
diets with inadequate available phosphorus (0.20, 0.22, 0.28 and 0.30% aP) to that with
adequate available phosphorus (0.44, 0.44, 0.25 and 0.50% aP), found the birds which received
diets with adequate aP to have higher (p≤0.05) dressing percentage. Although these two studies
are not comparable to the current study due to both testing different phytases in broiler
production, the treatments do correlate with this study with regard to the levels of aP. The
Stellenbosch University https://scholar.sun.ac.za
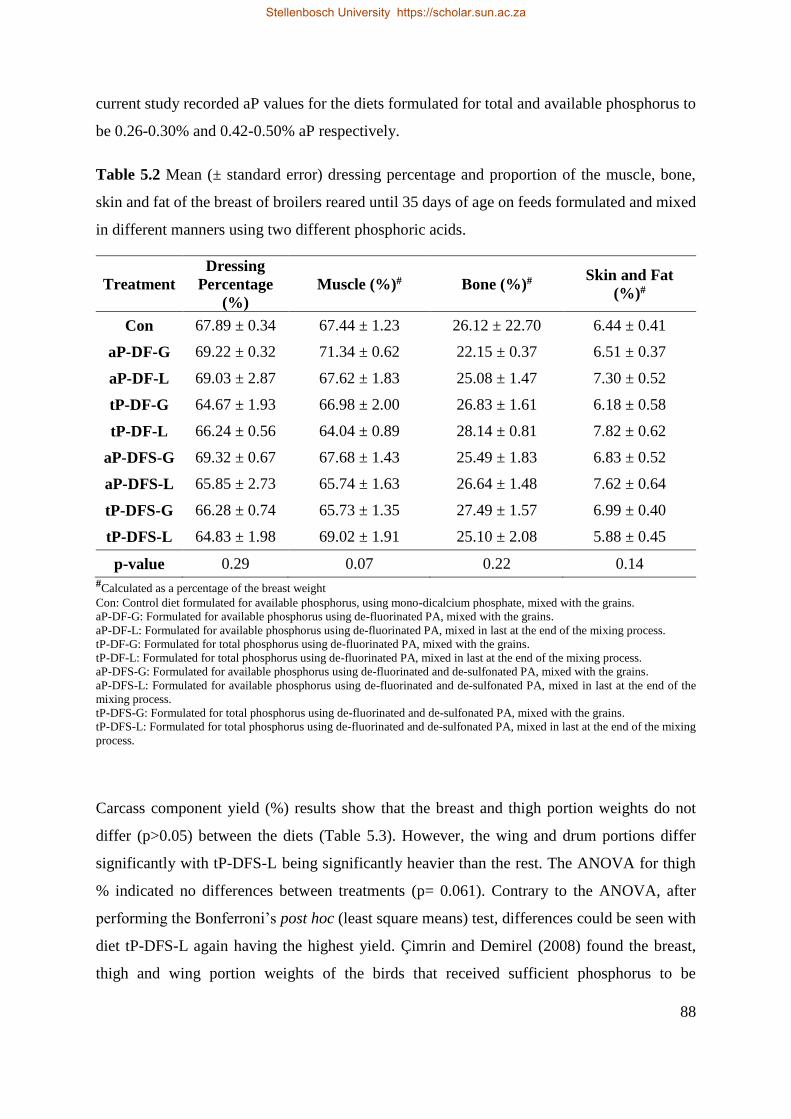
88
current study recorded aP values for the diets formulated for total and available phosphorus to
be 0.26-0.30% and 0.42-0.50% aP respectively.
Table 5.2 Mean (± standard error) dressing percentage and proportion of the muscle, bone,
skin and fat of the breast of broilers reared until 35 days of age on feeds formulated and mixed
in different manners using two different phosphoric acids.
Treatment
Dressing
Percentage
(%)
Muscle (%)# Bone (%)# Skin and Fat
(%)#
Con 67.89 ± 0.34 67.44 ± 1.23 26.12 ± 22.70 6.44 ± 0.41
aP-DF-G 69.22 ± 0.32 71.34 ± 0.62 22.15 ± 0.37 6.51 ± 0.37
aP-DF-L 69.03 ± 2.87 67.62 ± 1.83 25.08 ± 1.47 7.30 ± 0.52
tP-DF-G 64.67 ± 1.93 66.98 ± 2.00 26.83 ± 1.61 6.18 ± 0.58
tP-DF-L 66.24 ± 0.56 64.04 ± 0.89 28.14 ± 0.81 7.82 ± 0.62
aP-DFS-G 69.32 ± 0.67 67.68 ± 1.43 25.49 ± 1.83 6.83 ± 0.52
aP-DFS-L 65.85 ± 2.73 65.74 ± 1.63 26.64 ± 1.48 7.62 ± 0.64
tP-DFS-G 66.28 ± 0.74 65.73 ± 1.35 27.49 ± 1.57 6.99 ± 0.40
tP-DFS-L 64.83 ± 1.98 69.02 ± 1.91 25.10 ± 2.08 5.88 ± 0.45
p-value 0.29 0.07 0.22 0.14 #Calculated as a percentage of the breast weight
Con: Control diet formulated for available phosphorus, using mono-dicalcium phosphate, mixed with the grains.
aP-DF-G: Formulated for available phosphorus using de-fluorinated PA, mixed with the grains.
aP-DF-L: Formulated for available phosphorus using de-fluorinated PA, mixed in last at the end of the mixing process.
tP-DF-G: Formulated for total phosphorus using de-fluorinated PA, mixed with the grains.
tP-DF-L: Formulated for total phosphorus using de-fluorinated PA, mixed in last at the end of the mixing process.
aP-DFS-G: Formulated for available phosphorus using de-fluorinated and de-sulfonated PA, mixed with the grains.
aP-DFS-L: Formulated for available phosphorus using de-fluorinated and de-sulfonated PA, mixed in last at the end of the
mixing process.
tP-DFS-G: Formulated for total phosphorus using de-fluorinated and de-sulfonated PA, mixed with the grains.
tP-DFS-L: Formulated for total phosphorus using de-fluorinated and de-sulfonated PA, mixed in last at the end of the mixing
process.
Carcass component yield (%) results show that the breast and thigh portion weights do not
differ (p>0.05) between the diets (Table 5.3). However, the wing and drum portions differ
significantly with tP-DFS-L being significantly heavier than the rest. The ANOVA for thigh
% indicated no differences between treatments (p= 0.061). Contrary to the ANOVA, after
performing the Bonferroni’s post hoc (least square means) test, differences could be seen with
diet tP-DFS-L again having the highest yield. Çimrin and Demirel (2008) found the breast,
thigh and wing portion weights of the birds that received sufficient phosphorus to be
Stellenbosch University https://scholar.sun.ac.za

89
significantly heavier than those with insufficient P. Angel et al. (2006) also found the birds
receiving sufficient P to have significantly greater femur and tibia bone weights as well as tibia
mineral density. A percentage of the portion weight differences might therefore be attributed
to greater bone densities. These results differ to findings within the current study, as one of the
treatments with the low P levels, diet tP-DFS-L (aP= 0.26-0.30%), gave rise to the highest
portion yields as mentioned earlier. There is no biological explanation for the differences in
these results (from that reported in the literature). It may, however, be attributed to the cutting
method used when portioning the carcass which allowed for variation between these three
different studies. Tables 5.1-5.3 indicate that the adding of the PA to the feed during mixing to
have no effect on the carcass characteristics.
Table 5.3 Mean (± standard error) cold carcass component yield of the breast, thigh, leg and
wing from broilers reared until 35 days of age on feeds formulated and mixed in different
manners using two different phosphoric acids.
Treatment Breast %# Thigh %# Drum %# Wing %#
Con 39.56 ± 0.97 28.59ab ± 0.79 13.96cd ± 0.23 15.21e ± 0.85
aP-DF-G 41.33 ± 0.44 27.69abc ± 0.74 13.98cd ± 0.26 15.75cde ± 0.40
aP-DF-L 40.22 ± 1.19 28.14ab ± 0.47 14.45bcd ± 0.27 16.67bcde ± 1.06
tP-DF-G 39.55 ± 1.16 27.54abc ± 1.13 14.36bcd ± 0.56 18.06ab ± 0.84
tP-DF-L 39.58 ± 0.60 26.97bc ± 0.79 15.34ab ± 0.42 17.45abcd ± 0.67
aP-DFS-G 39.24 ± 0.98 28.45ab ± 0.55 14.90abc ± 0.36 17.52abc ± 0.26
aP-DFS-L 40.51 ± 0.66 29.29a ± 0.88 13.83cd ± 0.36 15.42de ± 0.74
tP-DFS-G 38.20 ± 1.56 25.81c ± 0.62 13.59d ± 0.27 17.97ab ± 0.93
tP-DFS-L 38.81 ± 1.84 29.28a ± 0.83 15.69a ± 0.54 18.97a ± 0.47
p-value 0.71 0.06 <0.01 <0.01
#calculated as a percentage of the carcass weight a,b means within columns that have different superscripts differ significantly (p≤0.05)
Con: Control diet formulated for available phosphorus, using mono-dicalcium phosphate, mixed with the grains.
aP-DF-G: Formulated for available phosphorus using de-fluorinated PA, mixed with the grains.
aP-DF-L: Formulated for available phosphorus using de-fluorinated PA, mixed in last at the end of the mixing process.
tP-DF-G: Formulated for total phosphorus using de-fluorinated PA, mixed with the grains.
tP-DF-L: Formulated for total phosphorus using de-fluorinated PA, mixed in last at the end of the mixing process.
aP-DFS-G: Formulated for available phosphorus using de-fluorinated and de-sulfonated PA, mixed with the grains.
aP-DFS-L: Formulated for available phosphorus using de-fluorinated and de-sulfonated PA, mixed in last at the end of the
mixing process.
tP-DFS-G: Formulated for total phosphorus using de-fluorinated and de-sulfonated PA, mixed with the grains.
tP-DFS-L: Formulated for total phosphorus using de-fluorinated and de-sulfonated PA, mixed in last at the end of the mixing
process.
Stellenbosch University https://scholar.sun.ac.za

90
5.5.2 Physical measurements
5.5.2.1 Colour and pH
The influence of PA on initial pH (pHi) and ultimate pH (pHu) of the breast and thigh muscles
shows no significant difference (p>0.05) between diets on all muscle pH recordings (Table
5.4).
Table 5.4 Mean (± standard error) initial and ultimate pH measurements (CIE-Lab) for the
breast and thigh muscle recorded from broilers reared until day 35 of age on feeds formulated
and mixed in two different manners using two different phosphoric acids.
Treatment Breast Thigh
pHi pHu pHi pHu
Con 6.24 ± 0.08 6.05 ± 0.04 6.40 ± 0.04 6.18 ± 0.06
aP-DF-G 6.28 ± 0.06 6.13 ± 0.05 6.26 ± 0.07 6.30 ± 0.04
aP-DF-L 6.23 ± 0.09 6.05 ± 0.04 6.18 ± 0.09 6.20 ± 0.05
tP-DF-G 6.05 ± 0.08 6.17 ± 0.07 6.28 ± 0.05 6.36 ± 0.08
tP-DF-L 6.27 ± 0.09 5.95 ± 0.05 6.27 ± 0.04 6.16 ± 0.05
aP-DFS-G 6.13 ± 0.05 6.06 ± 0.04 6.39 ± 0.05 6.32 ± 0.04
aP-DFS-L 6.07 ± 0.08 6.12 ± 0.05 6.29 ± 0.07 6.30 ± 0.07
tP-DFS-G 6.12 ± 0.08 5.90 ± 0.15 6.35 ± 0.11 6.27 ± 0.05
tP-DFS-L 6.25 ± 0.08 6.00 ± 0.04 0.39 ± 0.02 6.27 ± 0.05
p-value 0.27 0.13 0.25 0.17 a,b means within columns that have different superscripts differ significantly (p≤0.05)
Con: Control diet formulated for available phosphorus, using mono-dicalcium phosphate, mixed with the grains.
aP-DF-G: Formulated for available phosphorus using de-fluorinated PA, mixed with the grains.
aP-DF-L: Formulated for available phosphorus using de-fluorinated PA, mixed in last at the end of the mixing process.
tP-DF-G: Formulated for total phosphorus using de-fluorinated PA, mixed with the grains.
tP-DF-L: Formulated for total phosphorus using de-fluorinated PA, mixed in last at the end of the mixing process.
aP-DFS-G: Formulated for available phosphorus using de-fluorinated and de-sulfonated PA, mixed with the grains.
aP-DFS-L: Formulated for available phosphorus using de-fluorinated and de-sulfonated PA, mixed in last at the end of the
mixing process.
tP-DFS-G: Formulated for total phosphorus using de-fluorinated and de-sulfonated PA, mixed with the grains.
tP-DFS-L: Formulated for total phosphorus using de-fluorinated and de-sulfonated PA, mixed in last at the end of the mixing
process.
Meat colour can be measured either by instrumental analysis or human appraisal (Zhu et al.,
1999). Colour measurements by the human eye are highly subjective and the sensitivity of the
visual method is not the same as that of the instrumental analysis (Brewer & McKeith, 1999;
Zhu et al., 1999). Therefore, colour differences illustrated by instrumental means are not
Stellenbosch University https://scholar.sun.ac.za

91
always noticed by the human eye. The treatment had an effect (p≤0.05) on breast colour CIE-
lab L*, a* and b* measurements as well as the chroma values, however, they did not affect the
breasts’ hue angle (Table 5.5). The Hue angle indicates the meat’s colour with respect to the
colour spectrum (red, yellow, orange, green, blue or violet), with an angle scale starting at 0°,
to which the colour red is assigned, and ending at 90° which is assigned to yellow (Ponsano et
al., 2004). No significant differences are evident in the treatment’s hue angles, however, all
angles were greater than 85° and therefore the meat is a near-yellow colour. Chroma is an
attribute which illustrates the meat’s colour intensity or saturation. The chroma scale ranges
from 0 to 60, with higher values indicating a more saturated colour. All chroma values of the
current study were found to be on lower end of this scale, which is representative of a less
saturated or intense colour shown by the meat. As mentioned, differences (p≤0.05) in chroma
values between the treatments were observed, however, these saturation differences may be
difficult to observe by the naked eye. Breast meat from the birds fed the tP-DF-L treatment diet
had the highest recorded mean L* and b* values as well as chroma values. The higher L*
indicates a paler meat colour than that of other treatments. Treatment tP-DF-G had the highest
mean a* values. The lowest mean L* values were recorded for the tP-DF-G diet indicating the
breast meat to be the darkest, however; it did not differ significantly from treatments aP-DF-G
aP-DFS-L and tP-DFS-L. The lowest mean a* and b* values were recorded on the breasts of
the chickens receiving diet aP-DFS-L. Han et al. (2012) reported L*, a* and b* measurements
of 47.34, 10.65 and 18.74, respectively for the breast meat of birds fed phosphorus deficient
diets (aP= 0.13%). These values differ from the deficient phosphorus (aP= 0.26-0.30%) diets
(tP-DF-G, tP-DF-L, tP-DFS-G and tP-DFS-L) found within the current study as the L*, a* and
b* measurements for these vary between 49.25-52.88, 0.05-0.69 and 11.60-11.49, respectively.
Totosaus et al. (2007) reported that normal values of a* and b* for chicken breasts are 1.4 and
10.3, respectively. In the current study, b* values are close to that considered normal, however,
the a* values were lower than that considered normal, indicating a reduced redness of the meat.
All the L* values fall within the range of normality for poultry.
Stellenbosch University https://scholar.sun.ac.za

92
Table 5.5 Mean (± standard error) colour measurements (CIE-Lab) for the breast muscle gathered from broilers reared until day 35 of age on feeds
formulated and mixed in two different manners using two different phosphoric acids.
Treatment Chroma Hue Breast
L* a* b*
Con 10.58ab± 0.32 85.09 ± 0.76 50.53bc ± 0.64 0.51ab ± 0.21 10.53bcde ± 0.32
aP-DF-G 10.01ab± 0.26 85.42 ± 0.66 51.48ab ± 0.65 -0.17cd ± 0.20 9.97de ± 0.27
aP-DF-L 10.99ab± 0.37 86.35 ± 0.87 50.54bc ± 0.42 0.54ab ± 0.23 10.95abcd ± 0.35
tP-DF-G 11.12ab± 0.39 85.44 ± 0.91 49.25c ± 0.59 0.69a ± 0.24 11.06abc ± 0.39
tP-DF-L 11.53a ± 0.20 86.40 ± 0.70 52.88a ± 0.83 0.05bc ± 0.22 11.49a ± 0.20
aP-DFS-G 10.85ab± 0.41 85.59 ± 0.84 50.53bc ± 0.53 0.25abc ± 0.21 10.09cde ± 0.41
aP-DFS-L 9.85b ± 0.35 85.03 ± 0.50 51.62ab ± 0.73 -0.58d ± 0.16 9.81e ± 0.36
tP-DFS-G 11.38ab± 0.45 86.16 ± 0.70 51.04b ± 0.75 0.21abc ± 0.21 11.34ab ± 0.46
tP-DFS-L 11.22ab± 0.38 86.72 ± 0.62 52.17ab ± 0.52 0.19abc ± 0.21 11.19ab ± 0.38
p-value 0.69 <0.01 <0.01 <0.01 <0.01 a,b means within columns that have different superscripts differ significantly (p≤0.05)
Con: Control diet formulated for available phosphorus, using mono-dicalcium phosphate, mixed with the grains.
aP-DF-G: Formulated for available phosphorus using de-fluorinated PA, mixed with the grains.
aP-DF-L: Formulated for available phosphorus using de-fluorinated PA, mixed in last at the end of the mixing process.
tP-DF-G: Formulated for total phosphorus using de-fluorinated PA, mixed with the grains.
tP-DF-L: Formulated for total phosphorus using de-fluorinated PA, mixed in last at the end of the mixing process.
aP-DFS-G: Formulated for available phosphorus using de-fluorinated and de-sulfonated PA, mixed with the grains.
aP-DFS-L: Formulated for available phosphorus using de-fluorinated and de-sulfonated PA, mixed in last at the end of the mixing process.
tP-DFS-G: Formulated for total phosphorus using de-fluorinated and de-sulfonated PA, mixed with the grains.
tP-DFS-L: Formulated for total phosphorus using de-fluorinated and de-sulfonated PA, mixed in last at the end of the mixing process.
Stellenbosch University https://scholar.sun.ac.za
Stellenbosch University https://scholar.sun.ac.za

93
A number of studies have been conducted in an attempt to acquire pH and CIE-Lab
measurements of broiler meat which gives rise to a normal colour that is pleasing to the
consumer (Fletcher, 1999; Van Laack et al., 2000; Qiao et al., 2001). There is a strong
correlation between meat colour and pH, specifically that lighter meat with higher L* values
generally shows lower pH values and vice versa for dark meat (Mancini & Hunt, 2005). Pale
meat with high L* values are indicative of poor meat quality (Chen et al., 2013). This being
said, there is much variation in published studies regarding normal colour meat’s L* values in
chickens. Fletcher (1999) reported a value of 45.6, Van Laack et al. (2000) reported 55.1 and
Qiao et al. (2001) reported values between 48 and 53 for normal meat. Van Laack et al. (2000)
also reported ultimate pH values for normal meat to be 5.96 and 5.70 for pale meat whilst Qiao
et al. (2001) reported dark meat to have a pH of 6.23 and higher. Therefore, the results in the
current study show the meat to be normal in colour for all treatments, as the L* values fall
between the extremes of that reported by Qiao et al. (2001). Furthermore, all breast pHi and
pHu values are greater than that which Van Laack et al. (2000) reported as indicative of pale,
soft and exudative meat. A number of the thigh pHu values are above 6.23 and so may be
considered as dark meat; the reasons for these higher pH values are not clear, as the ante-
mortem treatments were similar for all birds. No clear trends in the data illustrate that adding
the PA to the grains or adding it last in the feed mixing process have an effect on breast colour
and pH and thigh pH.
5.6 Conclusion
The present study assessed the effects of two different phosphoric acids and their application
methods on the carcass characteristics and meat colour and pH of broilers grown under standard
commercial conditions. Live weight, as well as cold and warm carcass weight was not affected
by the source of phosphorus, provided that the diets were formulated for the correct amount of
available phosphorus. The order of mixing the PA into the diet had no effect on any of the
measurements taken in the study. Overall, the two phosphoric acids did not influence breast
and thigh pH. Differences were observed in the breast muscle CIE-Lab measurements (L*, a*
and b*) and chroma values. However, the conclusion was made that neither pH nor diet
differences give cause for the variation seen in the breast colour, therefore further studies will
be needed to assess this variation. The conclusion was made that defluorinated PA and
Stellenbosch University https://scholar.sun.ac.za

94
defluorinated and desulfonated PA can be used as a source of phosphorus in broiler diets with
no adverse negative effects on the carcass characteristics or quality of the meat.
5.7 References
Angel, R. 2011. Calcium and phosphorus in broilers and laying hens. In: 22nd annual
Australian Poultry Science Symposium. Sydney, New South Wales. pp 30-42.
Angel, R., Saylor, W. W., Mitchell, A. D., Powers, W., & Applegate, T. J. 2006. Effect of
dietary phosphorus, phytase, and 25-hydroxycholecalciferol on broiler chicken bone
mineralization, litter phosphorus, and processing yields. Poult. Sci. 85: 1200-1211.
Bogosavljevic-Boskovic, S., Mitrovic, S., Djokovic, R., Doskovic, V., & Djermanovic, V.
2010. Chemical composition of chicken meat produced in extensive indoor and free range
rearing systems. African J. Biotechnol. 9: 9069-9075.
Brewer, M. S., & McKeith, F. K. 1999. Consumer-rated quality characteristics as related to
purchase intent of fresh pork. J. Food Sci. 64: 171-174 .
Castellini, C., Berri, C., Bihan-Duval, E. Le, & Martino, G. 2008. Qualitative attributes and
consumer perception of organic and free-range poultry meat. Worlds. Poult. Sci. J. 64:
500-512.
Chen, X., Jiang, W., Tan, H. Z., Xu, G. F., Zhang, X. B., Wei, S., & Wang, X. Q. 2013. Effects
of outdoor access on growth performance , carcass composition , and meat characteristics
of broiler chickens. Poult. Sci. 92: 435-443.
Çimrin, T., & Demirel, M. 2008. Effect of dietary phytase and some antioxidants on the
fattening performance of broilers. J. Appl. Anim. Res. 34: 55-59.
Dell Inc. (2016). Dell Statistica (data analysis software system), version 13. software.dell.com.
Dransfield, E., & Sosnicki, A. A. 1999. Relationship between muscle growth and poultry meat
quality. Poult. Sci. 78: 743-746.
Fanatico, A. C., Pillai, P. B., Emmert, J. L., & Owens, C. M. 2007. Meat quality of slow-and
fast-growing chicken genotypes fed low-nutrient or standard diets and raised indoors or
Stellenbosch University https://scholar.sun.ac.za

95
with outdoor access. Poult. Sci. 86: 2245-2255.
Fletcher, D. L. 1999. Broiler breast meat color variation, pH, and texture. Poult. Sci. 78: 1323-
1327.
Guerrero-Legarreta, I. 2010. Handbook of Poultry Science and Technology. 5th ed. John Wiley
& Sons, Inc. Hoboken, New jersey. pp 293-327.
Han, J. C., Wang, Y. L., Qu, H. X., Liang, F., Zhang, J. L., Shi, C. X., Zhang, X. L., Li, L.,
Xie, Q., Wang, C. L., Yan, Y. Y., Dong, X. S., & Cheng, Y. H. 2012. One alpha-
hydroxycholecalciferol improves growth performance, tibia quality, and meat color of
broilers fed Calcium- and Phosphorus-deficient diets. Asian-Australasian J. Anim. Sci.
25: 267-271.
Havenstein, G. B., Ferket, P., & Qureshi, M. 2003. Carcass composition and yield of 1957
versus 2001 broilers when fed representative 1957 and 2001 broiler diets. Poult. Sci. 82:
1500-1508.
Kozlowski, K., Jankowski, J., & Jeroch, H. 2009. Efficacy of different phytase preparations in
broiler rations. 12: 389-393.
Kropf, D. H. 1980. Effects of retail display conditions on meat colour. In: Proceedings in
annual reciprocal meat conference. Purdue University, Indiana, USA. pp 15-32.
Kuttappan, V. A., Hargis, B. M., & Owens, C. M. 2016. White striping and woody breast
myopathies in the modern poultry industry : a review. Poult. Sci. 95: 2724-2733.
Lonergan, S., Deeb, N., Fedler, C., & Lamont, S. 2003. Breast meat quality and composition
in unique chicken populations. Poult. Sci. 82: 1990-1994.
Mancini, R. A., & Hunt, M. C. 2005. Current research in meat color. Meat Sci. 71: 100-121.
Mudalal, S., Lorenzi, M., Soglia, F., Cavani, C., & Petracci, M. 2014. Implications of white
striping and wooden breast abnormalities on quality traits of raw and marinated chicken
meat. Animal. 9: 728-734.
Mutryn, M. F., Brannick, E. ., Fu, W., Lee, W. ., & Abasht, B. 2015. Characterization of a
Stellenbosch University https://scholar.sun.ac.za
96
novel chicken muscle disorder through differential gene expression and pathway analysis
using RNA-sequencing. BMC Genomics 16: 399-418.
Owens, C. M., Alvarado, C. Z., & Sams, A. R. 2010. Poultry meat processing. CRC Press,
Raylor and Francis Group, Boca Raton, Florida. pp 51-174.
Ponsano, E., Pinto, M., Garcia-Neto, M., & Lacava, P. 2004. Performance and color of broilers
fed diets containing rhodocyclus gelatinosus biomass. Brazilian J. Poult. Sci. 6: 237-242.
Qiao, M., Fletcher, D. L., Smith, D. P., & Northcutt, J. K. 2001. The effect of broiler breast
meat colour on pH, moisture, water-holding capacity, and emulsification capacity. Poult.
Sci. 80: 676-680.
Sihvo, H.-K., Immonen, K., & Puolanne, E. 2014. Myodegeneration with fibrosis and
regeneration in the pectoralis major muscle of broilers. Vet. Pathol. 51: 619-623.
Soares, J. 1995. Phosphorus bioavailability. In: Bioavailability of Nutrients for Animals:
Amino Acids, Minerals, Vitamins. Academic Press, San Diego, California. pp 257-294.
Souza, X. R., Faria, P. B., & Bressan, M. C. 2011. Proximate composition and meat quality of
broilers reared under different production systems. Brazilian J. Poult. Sci. 13: 15-20.
Totosaus, A., Pérez-Chabela, M., Guerrero, I., & Nollet, L. 2007. Colour of fresh and frozen
poultry. In: Handbook of Meat, Poultry and Seafood Quality. Blackwell Publishing,
Ames, Iowa, USA. pp 455-465.
Van der Klis, J. D., & Versteegh, H. A. J. 1999. Phosphorus nutrition of poultry. In: Recent
Developments in Poultry Nutrition 2. Nottingham University Press, Nottingham, UK. pp
309-320.
Van Laack, R. L., Liu, C. H., Smith, M. O., & Loveday, H. D. 2000. Characteristics of pale,
soft, exudative broiler breast meat. Poult. Sci. 79: 1057-1061.
Viljoen, J. 2001. Quality of feed phosphate supplements for animal nutrition. South African
Anim. Sci. 2: 13-19.
Young, L. L., Northcutt, J. K., Buhr, R. J., Lyon, C. E., & Ware, G. O. 2001. Effects of age,
Stellenbosch University https://scholar.sun.ac.za
97
sex, and duration of postmortem aging on percentage yield of parts from broiler chicken
carcasses. Poult. Sci. 80: 376-379.
Zhao, J. P., Zhao, G. P., Jiang, R. R., Zheng, M. Q., Chen, J. L., Liu, R. R., & Wen, J. 2012.
Effects of diet-induced differences in growth rate on metabolic, histological, and meat-
quality properties of 2 muscles in male chickens of 2 distinct broiler breeds. Poult. Sci.
91: 237-247.
Zhu, L. G., & Brewer, M. S. 1999. Relationship between instrumental and visual color in a
raw, fresh beef and chicken model system. J. Muscle Foods 10: 131-146.
Stellenbosch University https://scholar.sun.ac.za

98
Chapter 6
The effects of phosphoric acid on organ and gut measurements
and bone parameters of broiler chickens
6.1 Abstract
The purpose of this study was to evaluate the effects of defluorinated phosphoric acid (DF) and
defluorinated and desulfonated phosphoric acid (DFS) on organ weight, intestinal pH, gizzard
erosion scores and bone breakage as well as bone mineralisation of broiler chickens. The
following nine treatment diets were used: 1. The control (Con); 2. Formulated for available
phosphorus (aP) using DF and mixed with the grains of the diet (G) (aP-DF-G); 3. Formulated
for aP using DF, mixed in at the end of the mixing process (L) (aP-DF-L); 4. Formulated for
total phosphorus (tP) using DF, that was mixed with the grains (tP-DF-G); 5. Formulated for
tP using DF, mixed in at the end of the mixing process (tP-DF-L) 6. Formulated for aP using
DFS, that was mixed with the grains (aP-DFS-G); 7. Formulated for aP using DFS, mixed in
at the end of the mixing process (aP-DFS-L); 8. Formulated for tP using DFS, that was mixed
with the grains (tP-DFS-G); 9. Formulated for tP using DFS, mixed in at the end of the mixing
process (tP-DFS-L). No treatment differences were found for heart and bursa of Fabricius
weights as well as weights of the heart, liver, gizzard, spleen and bursa of Fabricius relative to
body weight as well as the spleen to bursa ratio (p>0.05). Differences, however, were found in
the gizzard, spleen and liver weights (p≤0.05). No significant difference was found in the
proventriculus, duodenum, jejunum and ileum but differences can be seen in the cecum (p=
0.014). Significant differences are evident in the bone strength, the diets formulated for aP
being significantly stronger than those formulated for tP.
6.2 Introduction
The major gut functions of digestion, absorption and intestinal barrier are very important in
monogastric nutrition. Fast and efficient production rely heavily on these processes and
optimization should be performed with minimal nutrient use (Van der Klis & Jansman, 2002).
Not only is the digestive tract essential for digestion and absorption, but it is also the largest
immunological organ as it is the first site of protection against pathogens (Choct, 2009). For
efficient nutrient digestion and absorption, one needs to ensure that the health and integrity of
Stellenbosch University https://scholar.sun.ac.za

99
the gastro-intestine are maintained. Young broilers need to develop their gastrointestinal tract
(GIT) quickly to keep up with the birds’ nutritional demands (Uni et al., 1996; Iji et al., 2001).
Therefore, the bird’s GIT has to develop concurrently with the bird (Uni et al., 1998). However,
digestion may be highly compromised during the first eight days due to lower enzyme activity
(Nitson et al., 1991), specifically when they are fed diets with anti-nutritional factors. An
example of this is the myoinositol hexaphosphate (IP6) compound. This is found in grains
bound to phosphorus and is known as phytate. Much has been reported on the anti-nutritional
factors of phytate (Gillis et al., 1954; Ammerman et al., 1961; Hurwitz & Bar, 1965; De Groote
& Huyghebaert, 1997; Kornegay, 2000; Angel, 2010; Kleyn, 2013; Shastak & Rodehutscord,
2013).
The pH of the digesta is one of the most influential factors of nutrient bioavailability (Pang &
Applegate, 2007). It is of utmost importance that the GIT pH is maintained constant at the
optimal level, as even small changes can significantly affect mineral digestion and absorption
(Bristol, 2003). Therefore, digesta pH readings could be used as an indication of gut health and
nutrient absorption (Bristol, 2003). Furthermore, pH is important to keep animals healthy by
maintaining a good balance of pathogenic and non-pathogenic microorganisms (Pang &
Applegate, 2007). This has been seen in the case of neonatal rabbits where gastric acidity
protected the rabbits against translocation of potentially pathogenic bacteria (Dinsmore et al.,
1997).
A bird’s immune status is affected by nutrient deficiencies (Kwak et al., 1999). This is
illustrated by the findings of Kwak et al. (1999), where low levels of arginine caused the
lymphoid organs to develop poorly. Two lymphoid organs are of significance to the current
study, namely the bursa of Fabricius and spleen, of which both are important to the immune
system (Yegani & Korver, 2008). Lymphoid organs resist host invasion by pathogens, fight
against infections and most importantly, ensure productivity is not affected during an infectious
attack (Kwak et al., 1999). Feed has the ability to alter organs’ structural integrity through feed
granule size (Engberg et al., 2002), as well as the nutritional composition (Fasina et al., 2006).
Therefore, knowledge of the nutritional quality of feed is essential for good growth and
development of the organs and the bird as a whole (Ensminger, 1992).
The skeleton (bone) is a dynamic tissue which can be influenced by nutritional, physiological
and physical factors (Rath et al., 2000). Over the years, genetic selection for rapidly growing
Stellenbosch University https://scholar.sun.ac.za

100
broilers has resulted in greater instances of bone development problems and loss of structural
bone integrity, otherwise referred to as skeletal disorders (Williams et al., 2000). Skeletal
disorders are some of the most common problems found in poultry production (Kestin et al.,
1992). They not only affect the birds’ welfare status, but can reduce growth and be the cause
of higher mortality rates. as well as increase the occurrence of carcass downgrading (Williams
et al., 2000). Furthermore, inadequate levels of calcium and phosphorus within the diet may
lead to bone fractures and deformities (Driver, 2004). Bone status can be an indicator of the
mineral adequacy of the diet and the degree of bone mineralisation affects the strength of the
bone. Bone ash has been used to determine the quantity of phosphorus deposition in the bone
and bone breaking force as an indicator of bone strength (Shastak, 2012).
Phosphorus clearly plays an important role in skeletal development and maintenance (Soares,
1995), pH and maintenance of the digestive tract (Miles & Henry, 1997). Therefore objectives
of this study were:
i. To investigate the effects of a defluorinated phosphoric acid and a defluorinated and
desulfonated phosphoric acid as the phosphorus source on organ weights, gizzard
scores and intestinal pH.
ii. To investigate the effects of the phosphoric acids on tibia phosphorus and calcium
content as well as to determine their effects on tibia bone strength.
iii. To evaluate the effects of adding the phosphoric acids to the diet at two inclusion levels
on parameters mentioned in objectives i and ii.
iv. To determine the effects of adding the phosphoric acid to the diet at different intervals
during the mixing process on parameters mentioned in objectives i and ii.
6.3 Materials and methods
Extensive details on experimental layout, diets, animals and the housing are given in Chapter
4. To provide a concise description, nine treatments were allocated evenly and randomly to
fifty-four cages with ten replicates per cage. The treatment diets are as follows:
1. Con: Control diet formulated for available phosphorus, using a mono-dicalcium
phosphate, which was mixed with the grains.
2. aP-DF-G: Formulated for available phosphorus using a de-fluorinated PA, that was
mixed with the grains.
Stellenbosch University https://scholar.sun.ac.za

101
3. aP-DF-L: Formulated for available phosphorus using de-fluorinated PA, mixed in at
the end of the mixing process.
4. tP-DF-G: Formulated for total phosphorus using de-fluorinated PA, which was mixed
with the grains.
5. tP-DF-L: Formulated for total phosphorus using de-fluorinated PA, mixed in at the end
of the mixing process.
6. aP-DFS-G: Formulated for available phosphorus using de-fluorinated and de-
sulfonated PA, which was mixed with the grains.
7. aP-DFS-L: Formulated for available phosphorus using de-fluorinated and de-sulfonated
PA, mixed in at the end of the mixing process.
8. tP-DFS-G: Formulated for total phosphorus using de-fluorinated and de-sulfonated PA,
which was mixed with the grains.
9. tP-DFS-L: Formulated for total phosphorus using de-fluorinated and de-sulfonated PA,
mixed in at the end of the mixing process.
The diets were fed ad libitum until slaughter at 33 days of age. On day 33, one bird per pen
was randomly selected from near the pens’ mean weight and slaughtered according to standard
commercial practice.
6.3.1 Bone breakage strength
Both tibias were removed post slaughter and frozen at -20ºC until further analysis. The right
tibia was thawed and cleaned of any adherent tissue of any sort before the weight was recorded.
Thereafter, breaking strength was determined by a three point bending test as described by
Fleming et al., (1998) using an Instron® tensile machine with a maximum force of 2 kilo-
newton (kN). This method is in accordance with that prescribed by Fleming et al. (1998). The
centre of the bone was marked and placed between two 10 mm retaining bars set 40 mm apart.
A 10 mm diameter crosshead probe approached the anterior of the tibia at a speed of 30
mm/min. The maximum load, before failure occurred, was recorded as the breaking strength
(N). Breaking force relative to bone weight was calculated using Equation 6.1.
Equation 6.1
Breaking force (N/g) = Force (N)
Bone weight (g)
Stellenbosch University https://scholar.sun.ac.za

102
6.3.2 Bone mineral content
The left tibia bone was thawed and cleaned of any adherent tissue. Official method 934.01 of
the AOAC (2002) was used to determine dry matter of the bone. The bones were placed in a
dry porcelain crucible and dried for 24 hours at 100ºC. Thereafter, the bones were placed in a
desiccator for 30 minutes and subsequently weighed. Defatting then took place by submerging
the bones in petroleum ether for 48 hours after breaking the bone in half to facilitate defatting
(Rama Rao & Ramasubba Reddy, 2001). The bones were then dried at 100ºC for 24 hours to
obtain fat free dry bone weight. Subsequently, the fat free bones were placed in a furnace at
600ºC for 24 hours to obtain fat-free bone ash percentage. All bone weights were measured
using a Mettler AE 200 scale (Mettler-Toledo, Switzerland) with 0.0001g accuracy.
Mineral analysis of the ashed bone samples were performed at the Western Cape Department
of Agriculture in Elsenburg according to the combustion method No. 6.1.1 in ALASA (2007).
An in-depth description of the procedure is given in section 3.3.4.8.
6.3.3 Organ weights and gizzard score
All intestinal pH recordings and organ weights were taken at Mariendahl Experimental farm
(Stellenbosch University, Western Cape). Five organs, the heart, gizzard, spleen, liver and
bursa of Fabricius, were removed from the fresh carcass immediately after slaughter and
weighted using a Mettler PC 4400 laboratory scale (Mettler-Tolado, Switzerland). A
longitudinal cut through the gizzard allowed it to be opened and cleaned of any remaining feed.
After cleaning and weighing, the gizzard was scored for gizzard erosion using an ordinal scale
shown in Table 6.1.
Table 6.1 Gizzard erosion scoring scale.
Score Description
0 No erosion
1 Slight erosion (rough epithelia)
2 Modest erosion (rough and distinct gaps)
3 Severe erosion (rough, gaps and ulcers showing on the stomach wall)
4 Extreme erosion (rough, gaps, ulcers and separation of the epithelia from the
stomach wall)
Stellenbosch University https://scholar.sun.ac.za

103
6.3.4 pH measurements
After organ removal, pH measurements were taken from the proventriculus, duodenum,
jejunum (near the centre), ileum and cecum using a calibrated (buffers pH 4.0 and 7.0 at room
temperature) Crison pH25 meter (Alella, Barcelona). The electrode was inserted into the
middle of the area of the intestine to be measured and between every reading the probe was
rinsed with distilled water.
6.4 Statistical analysis
Data from the trial were analysed using STATISTICA (Dell Inc., 2016). The assumptions of
homoscedasticity and normality were investigated prior to any further analyses. The test
significance was set at p≤0.05. All treatment effects were analysed using one-way (ANOVA)
analysis of variance and Bonferroni’s post hoc (least square means) test for the significant data,
except gizzard erosion scores. Gizzard erosion scores were analysed using the chi-squared test
of STATISTICA.
6.5 Results and discussion
6.5.1 Bone Breakage Strength
The results of bone strength are shown in Table 6.2. The breaking strength results are expressed
as the force required to break the bone in Newton (N) and as the breaking force required per
gram of bone (N/g). Differences were evident between treatments within both parameters
(p≤0.05). A significant increase in breaking strength (N) and breaking strength per gram of
bone (N/g) was distinctive between treatments formulated for total (tP) and available
phosphorus (aP) where treatments formulated for aP had greater values throughout indicating
stronger bones. Formulating for aP and tP has an effect on the inclusion levels of the P source,
with those diets formulated according to aP receiving higher P inclusion levels than that made
according to tP. Venäläinen et al. (2006) tested the effects of different levels of aP (3.5, 4.0,
4.5 and 5.0 g/kg aP) on tibia bone breakage. Results of the study showed no differences in bone
breakage between the different levels of aP. This was not the case with the study at hand. The
current study recorded aP values for the diets formulated for tP and aP to be 0.26-0.30% and
0.42-0.50%, respectively, and the results, with reference to P inclusion levels on bone breakage,
are in agreement with those obtained by Shaw et al. (2010) and Aureli et al. (2011). Shaw et
Stellenbosch University https://scholar.sun.ac.za

104
al. (2010) tested three phytase enzymes on male broiler chicks with one treatment having low
amounts of available phosphorus (aP) (aP= 0.25%). They found the diet with low aP to cause
a substantially lower tibia breaking force to that with adequate aP (aP= 0.45%). Aureli et al.
(2011) also had a negative control with aP of 0.30%, yielding similar results to that of Shaw et
al. (2010). However, these studies are not entirely comparable to the current study as they test
the effects of phytases. Nevertheless, their results illustrate the negative effects insufficient aP
in the diet has on tibia bone strength.
There is little clear information indicating a difference in tibia strength with reference to the
PA used in the diet. The same can be said for the method of mixing the PA in with the feed.
The conclusion can therefore be made that the defluorinated and the defluorinated and
desulfonated phosphoric acid are sufficient in maintaining bone strength when used as the
dietary phosphorus source, provided the inclusion levels are adequate for maintenance.
Stellenbosch University https://scholar.sun.ac.za
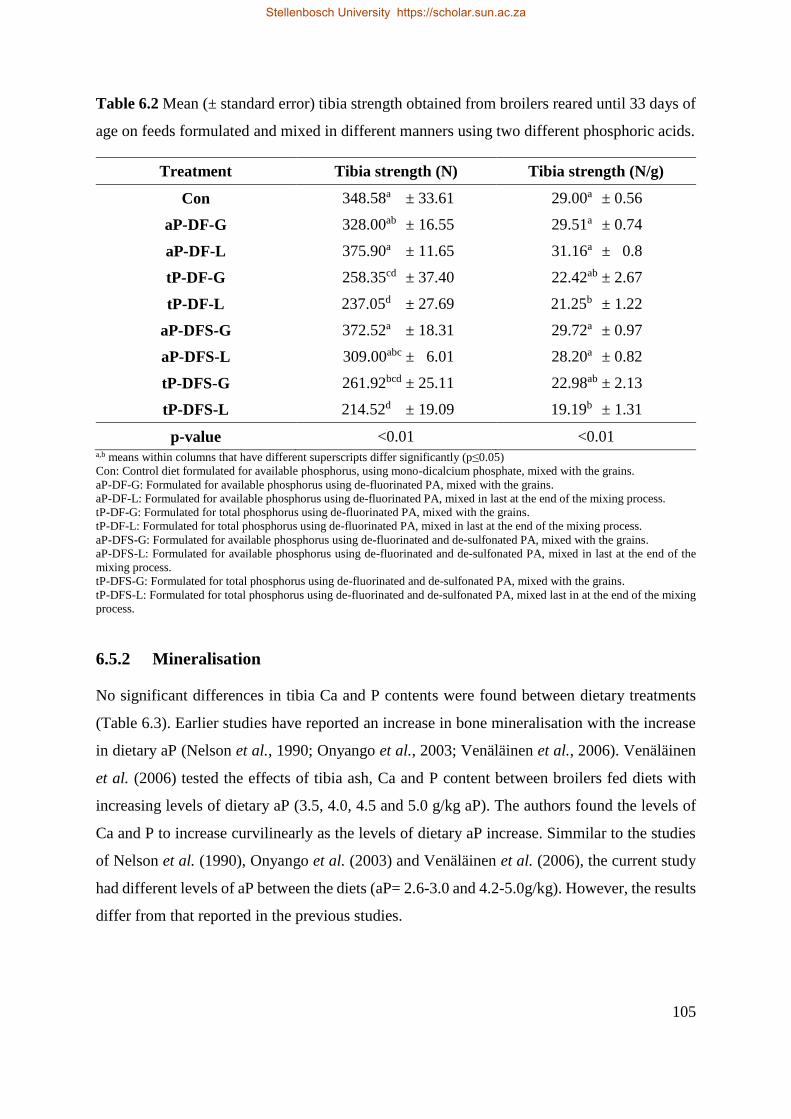
105
Table 6.2 Mean (± standard error) tibia strength obtained from broilers reared until 33 days of
age on feeds formulated and mixed in different manners using two different phosphoric acids.
Treatment Tibia strength (N) Tibia strength (N/g)
Con 348.58a ± 33.61 29.00a ± 0.56
aP-DF-G 328.00ab ± 16.55 29.51a ± 0.74
aP-DF-L 375.90a ± 11.65 31.16a ± 0.8
tP-DF-G 258.35cd ± 37.40 22.42ab ± 2.67
tP-DF-L 237.05d ± 27.69 21.25b ± 1.22
aP-DFS-G 372.52a ± 18.31 29.72a ± 0.97
aP-DFS-L 309.00abc ± 6.01 28.20a ± 0.82
tP-DFS-G 261.92bcd ± 25.11 22.98ab ± 2.13
tP-DFS-L 214.52d ± 19.09 19.19b ± 1.31
p-value <0.01 <0.01 a,b means within columns that have different superscripts differ significantly (p≤0.05)
Con: Control diet formulated for available phosphorus, using mono-dicalcium phosphate, mixed with the grains.
aP-DF-G: Formulated for available phosphorus using de-fluorinated PA, mixed with the grains.
aP-DF-L: Formulated for available phosphorus using de-fluorinated PA, mixed in last at the end of the mixing process.
tP-DF-G: Formulated for total phosphorus using de-fluorinated PA, mixed with the grains.
tP-DF-L: Formulated for total phosphorus using de-fluorinated PA, mixed in last at the end of the mixing process.
aP-DFS-G: Formulated for available phosphorus using de-fluorinated and de-sulfonated PA, mixed with the grains.
aP-DFS-L: Formulated for available phosphorus using de-fluorinated and de-sulfonated PA, mixed in last at the end of the
mixing process.
tP-DFS-G: Formulated for total phosphorus using de-fluorinated and de-sulfonated PA, mixed with the grains.
tP-DFS-L: Formulated for total phosphorus using de-fluorinated and de-sulfonated PA, mixed last in at the end of the mixing
process.
6.5.2 Mineralisation
No significant differences in tibia Ca and P contents were found between dietary treatments
(Table 6.3). Earlier studies have reported an increase in bone mineralisation with the increase
in dietary aP (Nelson et al., 1990; Onyango et al., 2003; Venäläinen et al., 2006). Venäläinen
et al. (2006) tested the effects of tibia ash, Ca and P content between broilers fed diets with
increasing levels of dietary aP (3.5, 4.0, 4.5 and 5.0 g/kg aP). The authors found the levels of
Ca and P to increase curvilinearly as the levels of dietary aP increase. Simmilar to the studies
of Nelson et al. (1990), Onyango et al. (2003) and Venäläinen et al. (2006), the current study
had different levels of aP between the diets (aP= 2.6-3.0 and 4.2-5.0g/kg). However, the results
differ from that reported in the previous studies.
Stellenbosch University https://scholar.sun.ac.za

106
The bones status is a common tool used to indicate a diet’s mineral adequacy. It is also well
known that Ca and P are major minerals responsible for bone formation (Soares, 1995; Mc
Donald et al., 2011). Therefore, any deficency or inadequacy of these minerals should result in
lower mineral levels in the bone. The reasons for this not occuring in the current study cannot
be explained and therefore further research must be persued in order to obtain the possible
answers.
Table 6.3 Mean (± standard error) calcium and phosphorus content (as a % of bone ash) of a
fat free tibia bone from broilers reared until 33 days of age on feeds formulated and mixed in
different manners using two different phosphoric acids.
Treatment Calcium Phosphorus Ca:P
Con 69.80 ± 17.99 21.65 ± 3.19 3.36 ± 1.32
aP-DF-G 63.12 ± 15.25 22.95 ± 4.72 2.96 ± 1.31
aP-DF-L 63.36 ± 14.38 22.29 ± 3.15 2.92 ± 0.84
tP-DF-G 65.36 ± 10.74 25.66 ± 4.28 2.66 ± 0.87
tP-DF-L 59.13 ± 11.31 21.90 ± 4.69 2.83 ± 0.90
aP-DFS-G 53.99 ± 12.01 24.40 ± 3.52 2.26 ± 0.60
aP-DFS-L 67.60 ± 17.53 23.74 ± 2.32 2.89 ± 0.88
tP-DFS-G 67.70 ± 13.47 23.59 ± 2.25 2.86 ± 0.46
tP-DFS-L 57.15 ± 10.72 22.12 ± 2.24 2.59 ± 0.64
p-value 0.55 0.58 0.74
Con: Control diet formulated for available phosphorus, using mono-dicalcium phosphate, mixed with the grains.
aP-DF-G: Formulated for available phosphorus using de-fluorinated PA, mixed with the grains.
aP-DF-L: Formulated for available phosphorus using de-fluorinated PA, mixed in last at the end of the mixing process.
tP-DF-G: Formulated for total phosphorus using de-fluorinated PA, mixed with the grains.
tP-DF-L: Formulated for total phosphorus using de-fluorinated PA, mixed in last at the end of the mixing process.
aP-DFS-G: Formulated for available phosphorus using de-fluorinated and de-sulfonated PA, mixed with the grains.
aP-DFS-L: Formulated for available phosphorus using de-fluorinated and de-sulfonated PA, mixed in last at the end of the
mixing process.
tP-DFS-G: Formulated for total phosphorus using de-fluorinated and de-sulfonated PA, mixed with the grains.
tP-DFS-L: Formulated for total phosphorus using de-fluorinated and de-sulfonated PA, mixed last in at the end of the mixing
process.
6.5.3 Gizzard score
The scoring of gizzard erosion is the visual analysis of the gizzard for lesions or blood spots
within the gizzard lining as a result of the dietary treatments, once it has been cut open and
cleaned of any remaining feed. A number of factors have been identified which lead to gizzard
erosion taking place. These factors are feed structure, nutritional deficiencies, infections,
Stellenbosch University https://scholar.sun.ac.za

107
mycotoxins, microbial colonisation and congenital factors (Gjevre et al., 2013). Results found
within the current study are reported in Table 6.4. In the present study, very few severe cases
of gizzard erosion were present. Therefore, phosphoric acid, be it defluorinated or defluorinated
and desulfonated, had no adverse effects on the gizzard no matter the inclusion levels of the
PA nor the procedure used during the mixing of the feed.
Table 6.4 Mean (± standard error) gizzard erosion obtained from broilers reared until 33 days
of age on feeds formulated and mixed in different manners using two different phosphoric
acids.
Treatment Gizzard score
0 1 2 3 4
Con 0 2 2 2 0
aP-DF-G 0 1 2 2 1
aP-DF-L 0 0 3 3 0
tP-DF-G 0 0 4 2 0
tP-DF-L 0 0 3 3 0
aP-DFS-G 0 1 2 3 0
aP-DFS-L 0 3 3 0 0
tP-DFS-G 0 2 3 1 0
tP-DFS-L 0 1 3 2 0
Chi-square p-value 0.60
Con: Control diet formulated for available phosphorus, using mono-dicalcium phosphate, mixed with the grains.
aP-DF-G: Formulated for available phosphorus using de-fluorinated PA, mixed with the grains.
aP-DF-L: Formulated for available phosphorus using de-fluorinated PA, mixed in last at the end of the mixing process.
tP-DF-G: Formulated for total phosphorus using de-fluorinated PA, mixed with the grains.
tP-DF-L: Formulated for total phosphorus using de-fluorinated PA, mixed in last at the end of the mixing process.
aP-DFS-G: Formulated for available phosphorus using de-fluorinated and de-sulfonated PA, mixed with the grains.
aP-DFS-L: Formulated for available phosphorus using de-fluorinated and de-sulfonated PA, mixed in last at the end of the
mixing process.
tP-DFS-G: Formulated for total phosphorus using de-fluorinated and de-sulfonated PA, mixed with the grains.
tP-DFS-L: Formulated for total phosphorus using de-fluorinated and de-sulfonated PA, mixed last in at the end of the mixing
process.
6.5.4 Organ weights
The results of organ weight (g) and organ weight relative to body weight (%), together with
spleen to bursa ratio, are shown in Tables 6.5 and 6.6 respectively. No significant differences
Stellenbosch University https://scholar.sun.ac.za

108
were recorded in the heart and the bursa weighs between the treatments. Differences (p≤0.05)
were observed in the liver, spleen and gizzard. However, these differences were alleviated
(p>0.05) when expressed as a percentage of live weight, and no differences were found in the
spleen to bursa ratio (p>0.05). The broilers fed a diet formulated for aP with a defluorinated
phosphoric acid as the phosphorus source which had been mixed into the grain content of the
diet, were found to have the highest organ weights, not only for those which were found to be
significantly different between dietary treatment but for all the organ weights recorded. This
might be a result of the birds being heavier in weight, however, when expressed relative to
body weight the differences were alleviated and so this cannot be the case. Further research
will be needed to pin point the cause of heavier organ weights seen in this treatment.
When assessing the immune status of a chicken, the measurement of the lymphoid organ
weights is known to be an accurate tool off assessment (Heckert et al., 2002). The increase in
lymphoid organ weight may indicate an improved immune system (Nourmohammadi et al.,
2011). However, one must be aware of the implications that an excessive immune response
might have on the performance of the bird (Collett et al., 2005). A reduced bursa weight is
indicative of stress or possible viral infection (Pope, 1991).
Stellenbosch University https://scholar.sun.ac.za

109
Table 6.5 Mean (± standard error) organ weights obtained from broilers reared until 33 days
of age on feeds formulated and mixed in different manners using two different phosphoric
acids.
Treatment Heart (g) Liver (g) Gizzard (g) Spleen (g) Bursa (g)
Con 10.13 ± 1.16 35.25b ± 5.04 29.09abc ± 4.68 1.59bc ± 0.28 4.33 ± 1.37
aP-DF-G 13.13 ± 2.78 41.68a ± 6.71 32.60a ± 4.65 2.12a ± 0.61 5.41 ± 1.11
aP-DF-L 11.67 ± 1.31 34.52b ± 1.73 31.19ab ± 3.04 1.95ab ± 0.35 3.38 ± 1.24
tP-DF-G 11.24 ± 1.61 30.87bc ± 6.72 23.13d ± 3.57 1.41cd ± 0.42 3.34 ± 1.06
tP-DF-L 12.37 ± 2.34 32.18bc ± 3.46 26.21bcd ± 6.66 1.44cd ± 0.28 3.82 ± 2.25
aP-DFS-G 12.17 ± 2.74 36.01ab ± 4.60 32.40a ± 7.31 1.71abc ± 0.37 4.14 ± 0.98
aP-DFS-L 11.94 ± 2.16 33.90b ± 3.44 28.37abcd ± 4.61 1.66bc ± 0.41 4.40 ± 2.00
tP-DFS-G 10.32 ± 2.32 27.92c ± 6.46 23.01d ± 4.74 1.07d ± 0.37 3.34 ± 0.78
tP-DFS-L 10.33 ± 1.66 31.33bc ± 4.45 24.21cd ± 3.16 1.43cd ± 0.39 3.17 ± 1.23
p-value 0.19 <0.01 <0.01 <0.01 0.15 a,b means within columns that have different superscripts differ significantly (p≤0.05)
Con: Control diet formulated for available phosphorus, using mono-dicalcium phosphate, mixed with the grains.
aP-DF-G: Formulated for available phosphorus using de-fluorinated PA, mixed with the grains.
aP-DF-L: Formulated for available phosphorus using de-fluorinated PA, mixed in last at the end of the mixing process.
tP-DF-G: Formulated for total phosphorus using de-fluorinated PA, mixed with the grains.
tP-DF-L: Formulated for total phosphorus using de-fluorinated PA, mixed in last at the end of the mixing process.
aP-DFS-G: Formulated for available phosphorus using de-fluorinated and de-sulfonated PA, mixed with the grains.
aP-DFS-L: Formulated for available phosphorus using de-fluorinated and de-sulfonated PA, mixed in last at the end of the
mixing process.
tP-DFS-G: Formulated for total phosphorus using de-fluorinated and de-sulfonated PA, mixed with the grains.
tP-DFS-L: Formulated for total phosphorus using de-fluorinated and de-sulfonated PA, mixed last in at the end of the mixing
process.
Stellenbosch University https://scholar.sun.ac.za

110
Table 6.6 Mean (± standard error) organ weights relative to body weight and the spleen to bursa ratio obtained from broilers reared until 33 days
of age on feeds formulated and mixed in different manners using two different phosphoric acids.
Treatment Heart (%) Liver (%) Gizzard (%) Spleen (%) Bursa (%) Spleen:Bursa
Con 0.51 ± 0.10 1.77 ± 0.22 1.48 ± 0.33 0.09 ± 0.01 0.22 ± 0.08 0.39 ± 0.11
aP-DF-G 0.57 ± 0.14 1.81 ± 0.36 1.41 ± 0.21 0.09 ± 0.04 0.23 ± 0.05 0.42 ± 0.19
aP-DF-L 0.56 ± 0.05 1.67 ± 0.17 1.50 ± 0.11 0.09 ± 0.01 0.16 ± 0.06 0.62 ± 0.15
tP-DF-G 0.72 ± 0.23 1.73 ± 0.26 1.46 ± 0.30 0.08 ± 0.02 0.21 ± 0.05 0.43 ± 0.11
tP-DF-L 0.68 ± 0.16 1.76 ± 0.20 1.43 ± 0.35 0.08 ± 0.02 0.21 ± 0.12 0.47 ± 0.22
aP-DFS-G 0.59 ± 0.11 1.78 ± 0.21 1.58 ± 0.27 0.08 ± 0.02 0.20 ± 0.03 0.43 ± 0.13
aP-DFS-L 0.55 ± 0.12 1.60 ± 0.18 1.35 ± 0.28 0.08 ± 0.02 0.21 ± 0.11 0.40 ± 0.08
tP-DFS-G 0.62 ± 0.18 1.65 ± 0.37 1.35 ± 0.24 0.06 ± 0.02 0.20 ± 0.04 0.32 ± 0.10
tP-DFS-L 0.68 ± 0.13 2.05 ± 0.37 1.58 ± 0.26 0.09 ± 0.03 0.21 ± 0.09 0.47 ± 0.08
p-value 0.22 0.26 0.75 0.18 0.92 0.07
Con: Control diet formulated for available phosphorus, using mono-dicalcium phosphate, mixed with the grains.
aP-DF-G: Formulated for available phosphorus using de-fluorinated PA, mixed with the grains.
aP-DF-L: Formulated for available phosphorus using de-fluorinated PA, mixed in last at the end of the mixing process.
tP-DF-G: Formulated for total phosphorus using de-fluorinated PA, mixed with the grains.
tP-DF-L: Formulated for total phosphorus using de-fluorinated PA, mixed in last at the end of the mixing process.
aP-DFS-G: Formulated for available phosphorus using de-fluorinated and de-sulfonated PA, mixed with the grains.
aP-DFS-L: Formulated for available phosphorus using de-fluorinated and de-sulfonated PA, mixed in last at the end of the mixing process.
tP-DFS-G: Formulated for total phosphorus using de-fluorinated and de-sulfonated PA, mixed with the grains.
tP-DFS-L: Formulated for total phosphorus using de-fluorinated and de-sulfonated PA, mixed last in at the end of the mixing process.
Stellenbosch University https://scholar.sun.ac.za
Stellenbosch University https://scholar.sun.ac.za

111
6.5.5 Intestinal pH
The gut environmental conditions play a major role in nutrient digestion and absorption
(Rahmani et al., 2005). The internal surface of the small intestine (SI) is surrounded by luminal
fluid. This fluid maintains the micro environment in which the digestion and absorption of
nutrients take place (Mitchell & Lemme, 2008). The pH of the gastrointestinal tract (GIT) is
affected by a number of factors, such as the kind of nutrients in the intestine, chicken health as
a whole and the microflora of the intestines. Furthermore, the pH in different sections of the
GIT affects the digestion and absorption of nutrients there (Rahmani et al., 2005).
No significant differences in the pH values of the proventriculus, duodenum, jejunum and
ileum were found between the dietary treatments of the current study (Table 6.7). Differences
were, however, seen in the cecum (p= 0.014). As expected, the pH of the luminal fluid
increased from the proximal to the distal area of the SI. However, all values do portray a higher
acidity, as the pH of the SI is generally found to lie between 6.5 and 7.5 (Simon & Igbasan,
2002). Van der Klis & Jansman (2002) reported normal pH values specific to the duodenum,
jejenum and ileum to range between 5.5-6.2, 5.8-6.9 and 6.3-8.0, respectively. The current
study’s values are on the acidic extremes of both of these studies. This higher acidity in the SI
is advantageous as it has been reported to increase nutrient absorption (Rahmani et al., 2005);
yet Rayssiguier & Remesy (1977) reported a decrease in cecal pH as a result of increased
microbial fermentation through higher substrate levels within the cecum of rats. This means a
larger concentration of nutrients were not absorbed in the SI sections preceding the cecum.
Perhaps the fact that a PA was used could explain these lower pH values. However, the control
diet uses a commercial MDCP and had similar pH values to those diets using the PA
throughout. Therefore, further research will be required to explain these results.
Stellenbosch University https://scholar.sun.ac.za

112
Table 6.7 Mean (± standard error) pH of various areas of the digestive tract obtained from
broilers reared until 33 days of age on feeds formulated and mixed in different manners using
two different phosphoric acids.
Treatment Proventriculus Duodenum Jejunum Ileum Cecum
Con 2.63 ± 0.97 5.52 ± 0.55 5.76 ± 0.24 5.99 ± 0.30 5.83bc ± 0.17
aP-DF-G 2.57 ± 0.89 5.52 ± 0.31 5.72 ± 0.24 5.73 ± 0.32 5.68c ± 0.41
aP-DF-L 2.88 ± 0.55 5.07 ± 0.75 5.73 ± 0.78 6.01 ± 0.53 6.04bc ± 0.33
tP-DF-G 2.66 ± 0.87 5.36 ± 0.47 5.74 ± 0.14 5.67 ± 0.22 5.76bc ± 0.49
tP-DF-L 3.27 ± 0.93 5.20 ± 0.47 5.75 ± 0.21 5.81 ± 0.23 5.71bc ± 0.39
aP-DFS-G 2.96 ± 0.70 5.69 ± 0.24 5.77 ± 0.10 6.07 ± 0.28 6.14ab ± 0.16
aP-DFS-L 3.13 ± 1.52 5.74 ± 0.27 5.75 ± 0.20 5.98 ± 0.51 6.51a ± 0.38
tP-DFS-G 3.51 ± 1.04 5.51 ± 0.34 5.74 ± 0.27 5.52 ± 0.25 5.88bc ± 0.63
tP-DFS-L 3.36 ± 1.14 5.69 ± 0.19 5.79 ± 0.19 5.81 ± 0.20 6.14abc ± 0.31
p-value 0.68 0.14 1.00 1.78 0.01 a,b means within columns that have different superscripts differ significantly (p≤0.05)
Con: Control diet formulated for available phosphorus, using mono-dicalcium phosphate, mixed with the grains.
aP-DF-G: Formulated for available phosphorus using de-fluorinated PA, mixed with the grains.
aP-DF-L: Formulated for available phosphorus using de-fluorinated PA, mixed in last at the end of the mixing process.
tP-DF-G: Formulated for total phosphorus using de-fluorinated PA, mixed with the grains.
tP-DF-L: Formulated for total phosphorus using de-fluorinated PA, mixed in last at the end of the mixing process.
aP-DFS-G: Formulated for available phosphorus using de-fluorinated and de-sulfonated PA, mixed with the grains.
aP-DFS-L: Formulated for available phosphorus using de-fluorinated and de-sulfonated PA, mixed in last at the end of the
mixing process.
tP-DFS-G: Formulated for total phosphorus using de-fluorinated and de-sulfonated PA, mixed with the grains.
tP-DFS-L: Formulated for total phosphorus using de-fluorinated and de-sulfonated PA, mixed last in at the end of the mixing
process.
6.6 Conclusion
The aim of the present research was to examine the effects of a defluorinated and a
defluorinated and desulfonated phosphoric acid (PA), which were mixed into the diet in two
different procedures and at two inclusion levels, tibia breaking strength and tibia phosphorus
and calcium content, gizzard scores, organ weights and intestinal pH.
Supplementing broiler diets with PA shows no improvement nor deterioration in tibia breaking
strength provided the inclusion levels of PA were sufficient. Those fed a diet with sufficient P
levels had significantly higher breaking strength than those fed diets deficient in P. Only organ
weighs of the heart and bursa of Fabricius were unaffected by the treatment differences. Liver,
Stellenbosch University https://scholar.sun.ac.za

113
gizzard and spleen weights were affected by the dietary treatments; however, after expressing
the organ weights relative to whole body weight, no differences were evident. Alteration in the
spleen to bursa ratio was not found. Therefore, it is concluded that PA had no effect on the
immune system. Gizzard score, tibia Ca and P content and pH recordings of the proventriculus,
duodenum, jejunum and ileum were unaffected by the differences in dietary treatments.
Differences were found in the pH recordings of the cecum. These intestinal pH recordings were
seen to be lower than that typically found in literature and this may be a result of the PA.
6.7 References
Agricultural laboratory association of Southern Africa (ALASA). 2007. Agrilasa handbook of
feeds and plant analysis 2nd ed. Macro- and trade elements method no. 6.1.1
Ammerman, C. B., Douglas, C. R., Davis, G. K., & Harms, R. H. 1961. Comparison of
Phosphorus availability assay techniques for chicks. Poult. Sci. 40: 548-553.
Angel, R. 2010. Calcium and phosphorus requirements in poultry. In: The 1st International
Phytase Summit. Washington, D.C., USA. pp 65-71.
Aureli, R., Faruk, M. U., Cechova, I., Pedersen, P., Elvig-Joergensen, S., Fru, F., & Broz, J.
2011. The efficacy of a novel microbial 6-phytase expressed in Aspergillus oryzae on
the performance and phosphorus utilization in broiler chickens. Int. J. Poult. Sci. 10:
160-168.
Bristol, R. H. 2003. Phytate update. In: Mineral Writes. Iowa Limestone Co., Des Moines. pp
1-4. (cited by Pang & Applegate, 2007).
Choct, M. 2009. Managing gut health through nutrition. Br. Poult. Sci. 50: 9-15.
Collett, S. R., Lyons, T. P., & Jacques, K. A. 2005. Strategies for improving gut health in
commercial broiler operations. In: Proceedings of Alltech’s 21st annual symposium,
Lexington, Kentucky, USA. pp 17-30.
Stellenbosch University https://scholar.sun.ac.za

114
De Groote, G., & Huyghebaert, G. 1997. The bio-availability of phosphorus from feed
phosphates for broilers as influenced by bio-assay method, dietary Ca-level and feed
form. Anim. Feed Sci. Technol. 69: 329-340.
Dell Inc. (2016). Dell Statistica (data analysis software system), version 13. software.dell.com.
Dinsmore, J. E., Jackson, R. J., & Smith, S. D. 1997. The protective role of gastric acidity in
neonatal bacterial translocation. J. Pediatr. Surg. 32: 1014-1016.
Driver, J. 2004. Performance and bone quality of the modern broiler chicken as influenced by
dietary calcium, phosphorus, phytase and 1-alpha-hydroxycholecalciferol. PhD Diss.
Univ. of Georgia, Athens, Georgia.
Engberg, R. M., Hedemann, M. S., & Jensen, B. B. 2002. The influence of grinding and
pelleting of feed on the microbial composition and activity in the digestive tract of
broiler chickens. Br. Poult. Sci. 44: 569-579.
Ensminger, M. E. 1992. Poultry science: Animal Agricultural series. 3rd ed. Interstate
Publishers INC, Danville, Illinois., USA. pp 121-146.
Fasina, Y. O., Classen, H. L., Garlich, J. D., Black, B. L., Ferket, P. R., Uni, Z., & Olkowski,
A. A. 2006. Response of turkey poults to soybean lectin levels typically encountered in
commercial diets. 2. Effect on intestinal development and lymphoid organs. Poult. Sci.
85: 870-877.
Gillis, M. B., Norris, L. C., & Heuser, G. F. 1954. Studies on the biological value of inorganic
phosphates. J. Nutr. 52: 115-125.
Gjevre, A., Kaldhusdal, M., & Eriksen, G. S. 2013. Gizzard erosion and ulceration syndrome
in chickens and turkeys: a review of causal or predisposing factors. Avian Pathol. 42:
297-303.
Heckert, R. A., Estevez, I., Russek-Cohen, E., & Pettit-Riley, R. 2002. Effects of density and
perch availability on the immune status of broilers. Poult. Sci. 81: 451-457.
Stellenbosch University https://scholar.sun.ac.za

115
Hurwitz, S., & Bar, A. 1965. Absorption of calcium and phosphorus along the gastrointestinal
tract of the laying fowl as influenced by dietary calcium and egg shell formation. J.
Nutr. 86: 433-438.
Iji, P. A., Saki, A., & Tivey, D. R. 2001. Body and intestinal growth of broiler chicks on a
commercial starter diet. 1. Intestinal weight and mucosal development. Br. Poult. Sci.
42: 505-513.
Kestin, S. C., Knowles, T. G., Tinch, A. E., & Gregory, N. G. 1992. Prevalence of leg weakness
in broiler chickens and its relationship with genotype. Vet. Rec. 131: 190-194.
Kleyn, R. 2013. Chicken Nutrition. A guide for nutritionists and poultry professionals. 1st Ed.
Context Products Ltd, Packington, Leicestershire, England. pp 67-78.
Kornegay, E. T. 2000. Digestion of phosphorus and other nutrients : the Role of Phytases and
Factors Influencing Their Activity. In: Enzymes in Farm Animal Nutrition. CABI
publishing, Wallingford, UK. pp 237-271.
Kwak, H., Austic, R., & Dietert, R. 1999. Influence of dietary arginine concentration on
lymphoid organ growth in chickens. Poult. Sci. 78: 1536-1541.
Mc Donald, P., Edwards, R. A., Greenhalgh, J. F. D., & Morgan, C. A. 2011. Animal Nutrition.
7th ed. Pearson Education Limited, Prentice Hall, Edinburgh Gate, Harlow, Essex. pp
112-121.
Miles, R. D., & Henry, P. R. 1997. Defluorinated phosphate may provide advantages.
Feedstuffs (USA). pp 12–15.
Mitchell, M. A., & Lemme, A. 2008. Examination of the composition of the luminal fluid in
the small intestine of broilers and absorption of amino acids under various ambient
temperatures measured in vivo. Int. J. Poult. Sci. 7: 223-233.
Nelson, T. S., Harris, G. C., Kirby, L. K., & Johnson, Z. B. 1990. Effect of calcium and
phosphorus on the incidence of leg abnormalities in growing broilers. Poult. Sci. 69:
1496-1502.
Stellenbosch University https://scholar.sun.ac.za

116
Nitson, Z., Dunnington, E. A., & Siegel, P. B. 1991. Organ growth and digestive enzyme levels
to fifteen days of age in lines of chickens differing in body weight. Poult. Sci. 70: 2040-
2048.
Nourmohammadi, R., Hosseini, S. M., Saraee, H., Arab, A., & Arefinia, H. 2011. Plasma
thyroid hormone concentrations and pH values of some GI-Tract segments of broilers
fed on different dietary citric acid and microbial phytase levels. J. Anim. Vet. Adv. 10:
1450-1454.
Onyango, E. M., Hester, P. Y., Stroshine, R., & Adeola, O. 2003. Bone densitometry as an
indicator of percentage tibia ash in broiler chicks fed varying dietary calcium and
phosphorus levels. Poult. Sci. 82: 1787-1791.
Pang, Y., & Applegate, T. J. 2007. Effects of dietary copper supplementation and copper source
on digesta pH, calcium, zinc, and copper complex size in the gastrointestinal tract of
the broiler chicken. Poult. Sci. 86: 531-537.
Pope, C. R. 1991. Pathology of lymphoid organs with emphasis on immunosuppression. Vet.
Immunol. Immunopathol. 30: 31-44.
Rahmani, H., Speer, W., & Modirsanei, M. 2005. The effect of intestinal pH on broiler
performance and immunity. Proc. 15th European Symposium on poultry nutrition,
Balatonfured, Hungary. pp 338-340.
Rama Rao, S. V., & Ramasubba Reddy, V. 2001. Utilisation of different phosphorus sources
in relation to their fluorine content for broilers and layers. Br. Poult. Sci. 42: 376-383.
Rath, N. C., Huff, G. R., Huff, W. E., & Balog, J. M. 2000. Factors Regulating Bone Maturity
and Strength in Poultry. Poult. Sci. 79, 1024-1032.
Rayssiguier, Y., & Remesy, C. 1977. Magnesium absorption in the caecum of rats related to
volatile fatty acids production. INRA Editions. Ann. Rech. Vet. 8: 105-110.
Shastak, Y. 2012. Evaluation of the availability of different mineral phosphorus sources in
broilers. PhD (Agric) Dissertation, University of Hohenheim, Germany.
Stellenbosch University https://scholar.sun.ac.za
117
Shastak, Y., & Rodehutscord, M. 2013. Determination and estimation of phosphorus
availability in growing poultry and their historical development. Worlds. Poult. Sci. J.
69: 569-586.
Shaw, A. L., Blake, J. P., & Gordon, R. W. 2010. Evaluation of commercial phytase enzymes
on performance and tibia-breaking strength of male broiler chicks. J. Appl. Poult. Res
19: 415-421.
Simon, O., & Igbasan, F. 2002. In vitro properties of phytases from various microbial origins.
Int. J. Food Sci. Technol. 37: 813-822.
Soares, J. 1995. Phosphorus bioavailability. In: Bioavailability of Nutrients for Animals:
Amino Acids, Minerals, Vitamins. Academic Press, San Diego, California, USA. pp
257-294.
Uni, Z., Ganot, S., & Sklan, D. 1998. Posthatch development of mucosal function in the broiler
small intestine. Poult. Sci. 77: 75-82.
Uni, Z., Noy, Y., & Sklan, D. 1996. Development of the small intestine in heavy and light
strain chicks before and after hatching. Br. Poult. Sci. 37: 63-71.
Van der Klis, J. D., & Jansman, A. J. M. 2002. Optimising nutrient digestion, absorption and
gut barrier function in monogastrics: Reality or illusion. In: Nutrition and Health of the
Gastrointestinal Tract. Wageningen Academic Publishers, Wageningen, Netherlands.
pp 15-36.
Venäläinen, E., Valaja, J., & Jalava, T. 2006. Effects of dietary metabolisable energy, calcium
and phosphorus on bone mineralisation, leg weakness and performance of broiler
chickens. Br. Poult. Sci. 47: 301-310.
Viveros, A., Brenes, A., Arija, I., & Centeno, C. 2002. Effects of microbial phytase
supplementation on mineral utilization and serum enzyme activities in broiler chicks
fed different levels of phosphorus. Poult. Sci. 81: 1172-1183.
Stellenbosch University https://scholar.sun.ac.za

118
Williams, B., Solomon, S., Waddington, D., Thorp, B., & Farquharson, C. 2000. Skeletal
development in the meat-type chicken. Br. Poult. Sci. 41: 141-149.
Yegani, M., & Korver, D. R. 2008. Factors affecting intestinal health in poultry. Poult. Sci. 87:
2052-2063.
Stellenbosch University https://scholar.sun.ac.za
119
Chapter 7
General conclusion
The primary objective of the first experiment within this study was to evaluate the phosphorus
(P) bioavailability of a defluorinated phosphoric acid (DF) when supplemented into broiler
diets. The secondary objective was to determine the effects of this phosphoric acid (PA) on
nutrient and mineral digestibility. Both objectives were completed by means of a digestibility
study. Phosphorus bioavailability results showed the dilution diet (100% DF) to have higher
mean P bioavailability than the other diets. The depreciation in P bioavailability from the
treatments that had the summit and dilution diet mixed together was taken to be a cause of
interaction between the two phosphate sources. The dilution diet also resulted in greater
coefficient of total tract digestibility (CTTD) values of protein, P, calcium, magnesium,
potassium, iron, sodium, copper, zinc, manganese, boron and aluminium. A higher digestibility
of protein gives rise to a better amino acid balance within the diet which is advantageous to the
bird. The knowledge of the P bioavailability value and the higher P bioavailability of
defluorinated PA gives the opportunity for nutritionists to formulate diets closer to the birds’
requirements. This leads to less P excretion and therefore the negative effects on the
environment can be reduced. Furthermore, as inorganic phosphates are very expensive,
formulating a diet which better meets requirements results in less wastage and ultimately
reduced feed costs.
As pertaining to the second experiment, not only was a defluorinated PA utilized but also
defluorinated and desulfonated (DFS) phosphoric acid. The dietary treatment differences
resulted in significant differences in live weight, cumulative weight gain, cumulative intake,
feed conversion ratio, average daily gain, European production efficiency factor and protein
efficiency ratio. However, these differences were not caused by the type of inorganic phosphate
supplement used, but by the inclusion levels of these phosphates and this was regardless of the
method of incorporation into the diet. Diets that received P supplementation based on the diets
amount of total phosphorus were negatively affected and this is backed up by the liveability
results that indicated possible P deprivation in the final week of the trial. When assessing
broiler carcass characteristics and meat quality, the breast portion weight and breast and thigh
Stellenbosch University https://scholar.sun.ac.za
120
pH were not affected by the treatment differences, whereas the wing, thigh and drumstick
portion weights and the breast colour CIE-Lab measurements (L*, a* and b*), as well as the
chroma values, were influenced by treatments. After closer deliberation it was concluded that
the dietary treatments were not the cause of the portion weight differences, but rather the cutting
of the portions. Breast colour was all found to fall within the range that is considered normal
despite the differences between the treatments. Breast hue angle was not influenced by the
dietary treatment differences.
Weights of the spleen, liver and gizzard were significantly different; however, when expressed
relevant to the bird’s body weight, the differences were lost. Expressing the weights relative to
body weight removes any differences that may have been caused by variation in the bird’s size
and therefore organ weight. The spleen:bursa ratio reported no significant difference between
the treatments and hence the treatments did not affect the birds immune status. Differences in
bone breakage strength indicate that the different levels of P inclusion is important to bone
development and was not influenced by the type of P supplement nor of the method of
incorporation into the diet. Bone mineralisation revealed no difference in the bones calcium
(Ca) and P content as well as the Ca:P ratio within the bone. The pH readings of the
proventriculus, duodenum, jejunum and ileum were unaffected by the dietary treatments.
However, the cecum showed differences in pH and may be a cause of increased unabsorbed
substrate reaching the cecum allowing for greater fermentation.
It can, therefore, be concluded that defluorinated PA and defluorinated and desulfonated PA
are viable inorganic phosphate sources which can be used within broiler diets to meet the birds
P requirements. The PA’s reported no adverse effects on the birds’ welfare nor production
potential, provided P inclusion levels were sufficient. Further research is recommended to
obtain the best inclusion level of PA such that the requirements are met with the least amount
of P excretion possible.
Stellenbosch University https://scholar.sun.ac.za

121
Addendum A
Table A-1 Mean (± standard error) live weights of birds reared from hatch to day 35 on diets with different phosphorus sources at different P
inclusion levels which were mixed to the feed in one of two manners without the control diet.
Treatment Day 0 Day 7 Day 14 Day 21 Day 28 Day 35
aP-DF-G 42.00 ± 1.07 160.38a ± 1.98 397.30a ± 10.70 863.75a ± 20.02 1446.58a ± 17.81 2190.54a ± 36.97
aP -DF-L 41.94 ± 0.62 146.03bc ± 3.55 354.83ab ± 9.76 792.04ab ± 17.10 1338.43ab ± 25.98 2040.78a ± 36.23
tP-DF-G 42.22 ± 0.51 134.90cd ± 3.35 319.86b ± 19.60 665.76cd ± 12.68 1067.27c ± 25.17 1584.98b ± 41.66
tP -DF-L 42.97 ± 0.62 143.01bcd ± 2.56 305.76b ± 14.17 653.22d ± 20.77 1125.18c ± 31.81 1647.70b ± 47.68
aP -DFS-G 41.66 ± 0.80 151.39ab ± 2.83 355.27ab ± 16.10 784.21ab ± 27.06 1348.40ab ± 30.91 2059.38a ± 54.33
aP -DFS-L 42.60 ± 0.54 145.60bc ± 1.97 342.22ab ± 20.42 761.42bc ± 34.96 1290.14b ± 43.96 1968.54a ± 72.49
tP -DFS-G 42.47 ± 0.62 130.63d ± 2.96 292.65b ± 18.50 602.31d ± 14.46 979.60c ± 34.20 1515.17b ± 52.22
tP -DFS-L 43.07 ± 0.21 139.95bcd ± 2.10 295.49b ± 5.96 661.76cd ± 16.23 1112.08c ± 39.49 1625.49b ± 42.66
p-value# 0.775 <0.01 <0.01 <0.01 <0.01 <0.01 a,b means within columns that have different superscripts differ significantly (p≤0.05)
aP-DF-G: Formulated for available phosphorus using de-fluorinated PA, mixed with the grains.
aP-DF-L: Formulated for available phosphorus using de-fluorinated PA, mixed in last at the end of the mixing process.
tP-DF-G: Formulated for total phosphorus using de-fluorinated PA, mixed with the grains.
tP-DF-L: Formulated for total phosphorus using de-fluorinated PA, mixed in last at the end of the mixing process.
aP-DFS-G: Formulated for available phosphorus using de-fluorinated and de-sulfonated PA, mixed with the grains.
aP-DFS-L: Formulated for available phosphorus using de-fluorinated and de-sulfonated PA, mixed in last at the end of the mixing process.
tP-DFS-G: Formulated for total phosphorus using de-fluorinated and de-sulfonated PA, mixed with the grains.
tP-DFS-L: Formulated for total phosphorus using de-fluorinated and de-sulfonated PA, mixed in last at the end of the mixing process. # p-value of the respective statistical analysis after the removal of the control diet due to potential differences caused by an increase in sodium at the start of the grower feeding period. Refer to
section 4.5.4, page 79 for further explanations.
Stellenbosch University https://scholar.sun.ac.za
Stellenbosch University https://scholar.sun.ac.za

122
Table A-2 Mean (± standard error) cumulative weight gain of birds reared from hatch to day 35 on diets with different phosphorus sources at
different P inclusion levels which were mixed to the feed in one of two manners without the control diet.
Treatment Day 0-7 Day 0-14 Day 0-21 Day 0-28 Day 0-35
aP-DF-G 118.38a ± 1.93 355.30a ± 10.07 821.75a ± 19.40 1404.58a ± 18.06 2148.20a ± 30.43
aP-DF-L 104.10bc ± 3.43 287.11ab ± 10.03 702.08ab ± 16.10 1303.60a ± 30.51 1980.55a ± 40.47
tP-DF-G 91.85cd ± 3.36 275.90b ± 19.55 620.72cd ± 14.30 1032.99bc ± 25.10 1418.78b ± 27.27
tP-DF-L 98.85bcd ± 3.36 263.17b ± 4.47 605.84d ± 18.48 1089.62b ± 37.17 1578.22b ± 68.51
aP-DFS-G 108.72ab ± 3.43 314.32ab ± 15.46 743.27ab ± 26.40 1307.46a ± 30.14 2004.45a ± 51.45
aP-DFS-L 103.00bc ± 1.91 299.62ab ± 20.18 718.20bc ± 35.27 1257.28a ± 36.88 1922.86a ± 59.45
tP-DFS-G 88.16d ± 3.23 250.18b ± 18.28 555.98d ± 14.98 938.27c ± 36.06 1416.21b ± 42.88
tP-DFS-L 97.17bcd ± 1.80 254.37b ± 6.62 620.64cd ± 17.18 1066.0bc ± 35.28 1566.51b ± 47.38
p-value# <0.01 <0.01 <0.01 <0.01 <0.01 a,b means within columns that have different superscripts differ significantly (p≤0.05)
aP-DF-G: Formulated for available phosphorus using de-fluorinated PA, mixed with the grains.
aP-DF-L: Formulated for available phosphorus using de-fluorinated PA, mixed in last at the end of the mixing process.
tP-DF-G: Formulated for total phosphorus using de-fluorinated PA, mixed with the grains.
tP-DF-L: Formulated for total phosphorus using de-fluorinated PA, mixed in last at the end of the mixing process.
aP-DFS-G: Formulated for available phosphorus using de-fluorinated and de-sulfonated PA, mixed with the grains.
aP-DFS-L: Formulated for available phosphorus using de-fluorinated and de-sulfonated PA, mixed in last at the end of the mixing process.
tP-DFS-G: Formulated for total phosphorus using de-fluorinated and de-sulfonated PA, mixed with the grains.
tP-DFS-L: Formulated for total phosphorus using de-fluorinated and de-sulfonated PA, mixed in last at the end of the mixing process. # p-value of the respective statistical analysis after the removal of the control diet due to potential differences caused by an increase in sodium at the start of the grower feeding period. Refer to
section 4.5.4, page 79 for further explanations.
Stellenbosch University https://scholar.sun.ac.za
Stellenbosch University https://scholar.sun.ac.za
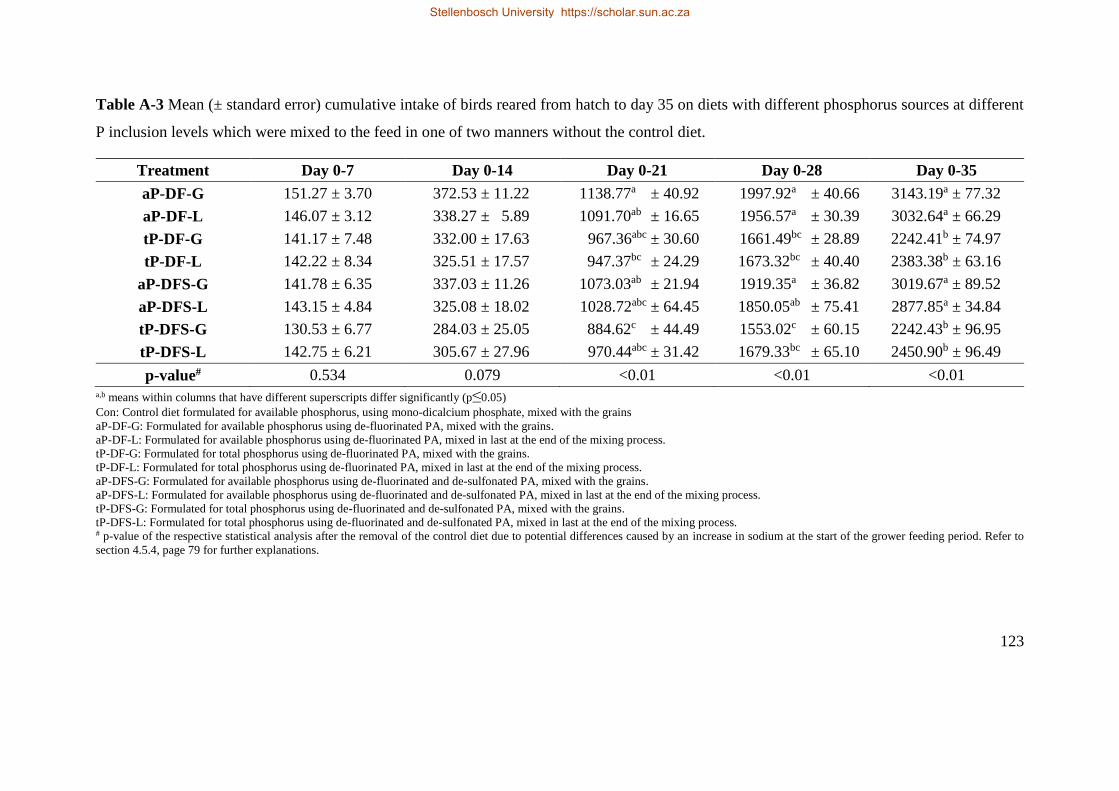
123
Table A-3 Mean (± standard error) cumulative intake of birds reared from hatch to day 35 on diets with different phosphorus sources at different
P inclusion levels which were mixed to the feed in one of two manners without the control diet.
Treatment Day 0-7 Day 0-14 Day 0-21 Day 0-28 Day 0-35
aP-DF-G 151.27 ± 3.70 372.53 ± 11.22 1138.77a ± 40.92 1997.92a ± 40.66 3143.19a ± 77.32
aP-DF-L 146.07 ± 3.12 338.27 ± 5.89 1091.70ab ± 16.65 1956.57a ± 30.39 3032.64a ± 66.29
tP-DF-G 141.17 ± 7.48 332.00 ± 17.63 967.36abc ± 30.60 1661.49bc ± 28.89 2242.41b ± 74.97
tP-DF-L 142.22 ± 8.34 325.51 ± 17.57 947.37bc ± 24.29 1673.32bc ± 40.40 2383.38b ± 63.16
aP-DFS-G 141.78 ± 6.35 337.03 ± 11.26 1073.03ab ± 21.94 1919.35a ± 36.82 3019.67a ± 89.52
aP-DFS-L 143.15 ± 4.84 325.08 ± 18.02 1028.72abc ± 64.45 1850.05ab ± 75.41 2877.85a ± 34.84
tP-DFS-G 130.53 ± 6.77 284.03 ± 25.05 884.62c ± 44.49 1553.02c ± 60.15 2242.43b ± 96.95
tP-DFS-L 142.75 ± 6.21 305.67 ± 27.96 970.44abc ± 31.42 1679.33bc ± 65.10 2450.90b ± 96.49
p-value# 0.534 0.079 <0.01 <0.01 <0.01 a,b means within columns that have different superscripts differ significantly (p≤0.05)
Con: Control diet formulated for available phosphorus, using mono-dicalcium phosphate, mixed with the grains
aP-DF-G: Formulated for available phosphorus using de-fluorinated PA, mixed with the grains.
aP-DF-L: Formulated for available phosphorus using de-fluorinated PA, mixed in last at the end of the mixing process.
tP-DF-G: Formulated for total phosphorus using de-fluorinated PA, mixed with the grains.
tP-DF-L: Formulated for total phosphorus using de-fluorinated PA, mixed in last at the end of the mixing process.
aP-DFS-G: Formulated for available phosphorus using de-fluorinated and de-sulfonated PA, mixed with the grains.
aP-DFS-L: Formulated for available phosphorus using de-fluorinated and de-sulfonated PA, mixed in last at the end of the mixing process.
tP-DFS-G: Formulated for total phosphorus using de-fluorinated and de-sulfonated PA, mixed with the grains.
tP-DFS-L: Formulated for total phosphorus using de-fluorinated and de-sulfonated PA, mixed in last at the end of the mixing process. # p-value of the respective statistical analysis after the removal of the control diet due to potential differences caused by an increase in sodium at the start of the grower feeding period. Refer to
section 4.5.4, page 79 for further explanations.
Stellenbosch University https://scholar.sun.ac.za
Stellenbosch University https://scholar.sun.ac.za

124
Table A-4 Mean (± standard error) feed conversion ratios of birds reared from hatch to day 35
on diets with different phosphorus sources at different P inclusion levels which were mixed to
the feed in one of two manners without the control diet.
Treatment Day 0-7 Day 0-14 Day 0-21 Day 0-28 Day 0-35
aP-DF-G 1.28b ± 0.03 1.05 ± 0.02 1.38b ± 0.02 1.42d ± 0.03 1.46 ± 0.02
aP-DF-L 1.41ab ± 0.05 1.09 ± 0.04 1.47ab ± 0.03 1.50bcd ± 0.02 1.53 ± 0.02
tP-DF-G 1.54a ± 0.05 1.21 ± 0.05 1.56a ± 0.03 1.61ab ± 0.01 1.58 ± 0.04
tP-DF-L 1.43ab ± 0.05 1.24 ± 0.09 1.57a ± 0.04 1.54abcd ± 0.04 1.52 ± 0.04
aP-DFS-G 1.30b ± 0.04 1.08 ± 0.04 1.45ab ± 0.03 1.47cd ± 0.01 1.51 ± 0.01
aP-DFS-L 1.39ab ± 0.05 1.10 ± 0.06 1.43ab ± 0.04 1.47bcd ± 0.05 1.49 ± 0.04
tP-DFS-G 1.48ab ± 0.03 1.13 ± 0.06 1.59a ± 0.05 1.66a ± 0.01 1.58 ± 0.04
tP-DFS-L 1.47ab ± 0.08 1.20 ± 0.09 1.56a ± 0.02 1.57abc ± 0.03 1.57 ± 0.04
p-value# <0.01 0.247 <0.01 <0.01 0.118 a,b means within columns that have different superscripts differ significantly (p≤0.05)
Con: Control diet formulated for available phosphorus, using mono-dicalcium phosphate, mixed with the grains
aP-DF-G: Formulated for available phosphorus using de-fluorinated PA, mixed with the grains.
aP-DF-L: Formulated for available phosphorus using de-fluorinated PA, mixed in last at the end of the mixing process.
tP-DF-G: Formulated for total phosphorus using de-fluorinated PA, mixed with the grains.
tP-DF-L: Formulated for total phosphorus using de-fluorinated PA, mixed in last at the end of the mixing process.
aP-DFS-G: Formulated for available phosphorus using de-fluorinated and de-sulfonated PA, mixed with the grains.
aP-DFS-L: Formulated for available phosphorus using de-fluorinated and de-sulfonated PA, mixed in last at the end of the
mixing process.
tP-DFS-G: Formulated for total phosphorus using de-fluorinated and de-sulfonated PA, mixed with the grains.
tP-DFS-L: Formulated for total phosphorus using de-fluorinated and de-sulfonated PA, mixed in last at the end of the mixing
process. # p-value of the respective statistical analysis after the removal of the control diet due to potential differences caused by an
increase in sodium at the start of the grower feeding period. Refer to section 4.5.4, page 79 for further explanations.
Stellenbosch University https://scholar.sun.ac.za

125
Table A-5 Mean (± standard error) average daily gain (ADG), European production efficiency
ratio (EPER), protein efficiency ratio (PER) and liveability of birds reared from hatch to day
35 on diets formulated for total or available phosphorus, using phosphoric acid as the
phosphorus source and different mixing sequences without the control diet.
Treatment ADG (g) EPEF PER Liveability (%)
aP-DF-G 62.59a ± 1.06 428.29a ± 8.19 3.32a ± 0.05 100.00a ± 0.00
aP-DF-L 58.31a ± 1.04 368.19b ± 10.68 3.24ab ± 0.04 96.67ab ± 2.11
tP-DF-G 45.29b ± 1.19 236.13e ± 8.70 2.90de ± 0.06 83.33b ± 6.15
tP-DF-L 47.08b ± 1.32 292.61c ± 21.65 3.09bc ± 0.08 93.33ab ± 3.33
aP-DFS-G 58.84a ± 1.55 384.77b ± 14.47 3.36a ± 0.02 98.33ab ± 1.67
aP-DFS-L 56.24a ± 2.07 364.05b ± 13.18 3.16bc ± 0.06 96.67ab ± 2.11
tP-DFS-G 43.29b ± 1.49 244.92de ± 24.50 3.01cde ± 0.06 90.00ab ± 5.16
tP-DFS-L 46.44b ± 1.22 278.33cd ± 13.97 3.04cd ± 0.08 93.33ab ± 2.11
p-value# <0.01 <0.01 <0.01 0.032 a,b means within columns that have different superscripts differ significantly (p≤0.05)
Con: Control diet formulated for available phosphorus, using mono-dicalcium phosphate, mixed with the grains
aP-DF-G: Formulated for available phosphorus using de-fluorinated PA, mixed with the grains.
aP-DF-L: Formulated for available phosphorus using de-fluorinated PA, mixed in last at the end of the mixing process.
tP-DF-G: Formulated for total phosphorus using de-fluorinated PA, mixed with the grains.
tP-DF-L: Formulated for total phosphorus using de-fluorinated PA, mixed in last at the end of the mixing process.
aP-DFS-G: Formulated for available phosphorus using de-fluorinated and de-sulfonated PA, mixed with the grains.
aP-DFS-L: Formulated for available phosphorus using de-fluorinated and de-sulfonated PA, mixed in last at the end of the
mixing process.
tP-DFS-G: Formulated for total phosphorus using de-fluorinated and de-sulfonated PA, mixed with the grains.
tP-DFS-L: Formulated for total phosphorus using de-fluorinated and de-sulfonated PA, mixed in last at the end of the mixing
process. # p-value of the respective statistical analysis after the removal of the control diet due to potential differences caused by an
increase in sodium at the start of the grower feeding period. Refer to section 4.5.4, page 79 for further explanations.
Stellenbosch University https://scholar.sun.ac.za