the users comprehension of ternary relationships in ...ils.unc.edu/mspapers/2639.pdf · users’...
TRANSCRIPT

USERS’ COMPREHENSION OF TERNARY RELATIONSHIPS IN EXTENDED ENTITY RELATIONSHIP MODEL AND OBJECT
MODELING TECHNIQUE
By
Zhihui Liu
A Master’s paper submitted to the faculty of the School of Information and Library Science of the University of North Carolina at Chapel Hill in partial fulfillment of
the requirement for the degree of Master of Science in Information Science.
Chapel Hill, North Carolina November, 2000
Approved by:
______________________
Stephanie W. Haas
Advisor

2
Zhihui Liu. Users’ Comprehension of Ternary Relationships in Extended Entity Relationship Model and Object Modeling Technique. A Master’s paper for the M.S. in I.S. degree. November, 2000. 60 pages. Advisor: Stephanie W. Haas
This article describes a comparative study on users’ understanding of ternary
relationships in two kinds of conceptual data modeling techniques: extended entity
relationship model (EER) and object modeling technique (OMT). Through literature
review, the author realized that there were very few studies that focused specifically on
ternary relationships in conceptual data modeling, let alone on users’ understanding of
ternary relationships. The author conducted an online study on users’ understanding of
ternary relationships in EER and OMT models with the hypothesis that there was no
difference between these two models for users' comprehension of ternary relationships.
The result indicates that there is a significant difference in users’ understanding of ternary
relationships in EER and OMT models. Users understand ternary relationships better in
OMT model than in EER Model.
Headings:
Ternary Relationships-Users’ Comprehension
Conceptual Data Modeling
Extended Entity Relationship Model
Object Modeling Technique
3
Table of Contents
1. Introduction ................................................................................................................. 7
2. Literature Review ...................................................................................................... 9
2.1. Relational Theory and Conceptual Data Models ..................................................... 9
2.2. ER/EER Model....................................................................................................... 11
2.3. OO/OMT Model..................................................................................................... 14
2.4. Ternary Relationships ............................................................................................ 19
2.5. Users’ Comprehension of EER and OO Models.................................................... 23
3. Methodology............................................................................................................. 29
3.1. Research Model...................................................................................................... 29
3.2. Research Procedure ................................................................................................ 31
3.3. Data Analysis and the Results................................................................................ 33
EER Group Correctness ................................................................................................ 35
4. Conclusion................................................................................................................. 39
References ...................................................................................................................... 40
Appendix A: Consent Form....................................................................................... 43
Appendix B: Background Survey Questionnaire ................................................. 46
Appendix C: Online EER Questionnaire................................................................ 48
Appendix D: Online OO Questionnaire ................................................................. 50

4
Appendix E: EER Lecture.......................................................................................... 52
Appendix F: OMT Lecture ........................................................................................ 56

5
List of Tables
Table 1: Basic Concept in Codd’s Theory .......................................................................... 9
Table 2: Basic Correspondence between EER and OMT ................................................. 17
Table 3: Advantages and Disadvantages of ER/EER and OO/OMT Models: .................. 18
Table 4: Comparison of Previous Studies on Users’ Comprehension of EER and OO
Models....................................................................................................................... 28
Table 5: Background Data for the EER and OMT Groups ............................................... 34
Table 6: Correct Answers from the EER and OMT Groups for Each Question............... 35
Table 7: Numbers of Correct Answers for Each Group and Their Distribution ............... 37
Table 8: T-test of the Numbers of Correct Answers between EER and OMT Groups..... 38

6
List of Figures Figure 1: Basic Diagrams (Teorey et al., 1986, 200)........................................................ 11
Figure 2: Chen’s ER Constructs (Teorey et al., 1986, 202).............................................. 12
Figure 3: Subclass and Super-class Notational Diagram .................................................. 13
Figure 4: Basic OMT Model Diagram (Premerlani and Blaha, 1994).............................. 16
Figure 5: 1:M: N Ternary Relationships in EER Model ................................................... 19
Figure 6: Ternary Relationship in OMT Model ................................................................ 20
Figure 7: Three Binary Relationships in an EER Diagram............................................... 21
Figure 8: Research Model ................................................................................................. 29
Figure 9: Department Project Diagram for EER Groups .................................................. 36

7
Users’ Comprehension of Ternary Relationships in Extended Entity
Relationship Model and Object Modeling Technique
1. Introduction
Currently, the most popular data modeling technique in information analysis and database
development is the entity relationship (ER) or the extended entity relationship (EER)
model, introduced by Peter Chen in 1976. Object Oriented data modeling is becoming
more and more attractive to database researchers and is regarded as the third generation
of data modeling technology, following the classical data modeling (such as relational
model, network model and hierarchical model), and semantic data modeling (such as ER
and EER models) (Gray, Kulkarni and Paton, 1992).
Ternary relationships are real-world phenomena. They have been shown to be difficult to
model in both EER and Semantic Object Model (SOM) by Bock and Ryan (Bock and
Ryan, 1993). Users’ understanding of a model is regarded as one of the criteria for
evaluating conceptual modeling languages (Halpin and Bloesch, 1999). Comparative
studies of users’ understanding between ER/EER and OO models have been conducted
several times in the past (Hardgrave & Dalal, 1995; Lee & Choi, 1998; Shoval &
Frumermann, 1994).

8
The results of users’ understanding of ternary relationships from the previous studies
suggested that ternary relationships were significantly easier to comprehend with the
EER model (Shoval and Frumermann, 1994), and OMT was faster to use and to
understand both simple and complex problems (Hardgrave & Dalal, 1995).
With which model is it easier for users’ to understand ternary relationships, EER or OMT
model? Previous studies did not offer any clear answer. Therefore, I decided to conduct
a comparative online study on users’ comprehension of ternary relationships in EER and
OMT models.

9
2. Literature Review 2.1. Relational Theory and Conceptual Data Models
Relational theory was first introduced by E. F. Codd in 1970. It introduced concepts such
as items, relations and relationships. Items or relationships can be described or
considered as tables of values. Each column in these tables represents a descriptive
attribute. Each row, or tuple, in the table is an instance of the entity (either an item or a
relationship). The unique identifier of each row is called a primary key, which is an
attribute or a combination of attributes of a table (Codd, 1970).
Table 1: Basic Concept in Codd’s Theory
Table-Dog
Dogid (Attribute)�
Breed (Attribute)�
Dog_name (Attribute)�
1� Poodle� Fifi�
2� Mixed� Boris�
3� St. Bernard�Allen�
Conceptual data modeling was proposed in an ANSI SPARC report in 1975 following
relational theory. A conceptual data model is a high-level data model using concepts
familiar to application users, such as entities, attributes and relationships. It achieves the
abstraction of a physical database by using a simple effective graphical representation of
real world objects, relationships, etc. Relational models, ER, EER models and OO

10
models are all conceptual data modeling techniques (Gray et al., 1992). A conceptual
data model
“…provides a good explanation and representation way to help users and system developers to identify data requirements and constraint,…discover high level problem structuring, and establish a common ground for them to communicate with each other about system functions…It is also helpful to understand how an existing system can be modified” (Sanders, 1995, 11).
11
2.2. ER/EER Model
The entity relationship data model (ER model) has been popular in the data-modeling
world ever since its publication by Peter Chen. Chen’s form of ER model uses basic
graphical symbols to conceptually represent data organization: rectangles represent
entities/tables, ovals represent attributes, and diamond shapes connected to the entities by
the connection lines represent the relationships (Figure 1).
Figure 1: Basic Diagrams (Teorey et al., 1986, 200)
( Q W L W\
$ WWU LE X WH
5 H OD W LR LQ V K LS
: H D N: H D N ( Q W L W \
Depending on the number of entity types involved in a relation, we define relationship
degrees or types. The most common relationship type is the binary relationship, which
involves two entity types in a relationship. Figure 2 outlines Chen’s notations.

12
Figure 2: Chen’s ER Constructs (Teorey et al., 1986, 202)
ER modeling emphasizes simplicity and readability. As a useful tool to capture real-
world data requirements in a simple, meaningful and logical way, it has been a successful
communication tool between database designers and developers. It is also easy to learn
and easy to translate into SQL (Structured Query Language) data definitions, and
therefore proves to be very useful for relational database implementations (Teorey,
1993).
However, the ER model lacks substructures for entities and relationships. For example,
there might be different functional titles for employees in a company. We might need to
show this kind of detailed information in our data model diagrams. Unfortunately, the

13
ER model is not capable of expressing such constructs. The lack of substructure for
entities and relationships will
“…fail to fully capture a data modeler’s intent, especially for large, complex applications” (Michael R. Blaha et al., 1988, 415). Extended entity relationship (EER) modeling is an enhanced entity relationship modeling
(Elmasri, Navathe, 2000). EER applies all of the concepts of ER modeling, but in
addition, it is expanded to include concepts like subclass and super-class, specialization,
generalization and category.
Figure 3: Subclass and Super-class Notational Diagram
The EER model does add more semantics to database modeling. Specifically,
generalization in EER models allows database designers to refine structures of entities
and add details as needed. It gives database designers the “flexibility” to choose proper
level of abstraction for each context to make the database design “robust” and
“extensible” (Michael R. Blaha et al., 1988).
SUBCLASS1
SUPERCLASS
SUBCLASS2

14
2.3. OO/OMT Model
Many people believe that object oriented (OO) data modeling represents the real world
closely. Object oriented data modeling regards the real world things or the abstract of the
world as objects. Dogs, cars, books are objects. Dog owners, publishers, jobs and
salaries are also objects.
OO model has its advantages in ease for object structure identification in a system,
inheritance of properties and methods, ability to model complex objects, support for
object identities, and separation of public and private portions of objects (Navathe, 1992;
Sanders, 1995; Gray, Kulkarni, and Paton, 1999). However, OO modeling is also
criticized for its challenge to data modelers, for the successful use of OO modeling
requires combined skills in OO programming and database design (Robert Vermeulen,
1996).
There are four main versions of OO modeling technique: Semantic Object Model (SOM),
Object Role Modeling (ORM), Unified Modeling Language (UML) and Object Modeling
Technique (OMT).
Among these four modeling technologies, SOM is said to be similar to EER, although it
does not have the concept of relationship, as all relationships are represented as attributes
(Lee and Choi, 1998). ORM is based on NIAM (Nijssen Information Analysis

15
Methodology), which is widely used in Europe. UML is an industry standard language
now, but it has a strong programming flavor with many constructs designed to assist
developers of object-oriented codes (Lee and Choi, 1998, Halpin and Bloesch, 1999).
OMT model is claimed to be an improvement to ER (Blaha et al., 1988). For the purpose
of my study, I will focus on the OMT model.
The Object Modeling Technique (OMT) consists of three views of modeling systems:
object model, dynamic model and functional model. For the purpose of my study, we
will look at the object model only. It is an entity-based model and consists of concepts
such as classes, attributes and associations. A class is defined as a group of objects with
similar properties (object attributes), common behaviors (operations and state diagrams),
and similar relationships to other objects. An attribute is a data value held by objects in
their class. A link is a physical or conceptual connection between object instances. An
association is a group of links with common structures and common semantics. The
number of instances of one class that relate to a single instance of an associated class is
specified as multiplicity (Blaha and Premerlani, 1998). (See Figure 4 for basic OMT
object model diagram)

16
Figure 4: Basic OMT Model Diagram (Premerlani and Blaha, 1994)
&ODVV
&ODVV
2QH RU =HUR
([DFWO\ RQH
Many (zero or more)&ODVV
&ODVV 2QH RU PRUH���
&ODVV
&ODVV�
&ODVV
$WWULEXWH
$WWULEXWH
$VVRFLDWLRQ�
&ODVV &ODVV
0XOWLSOLFLW\ RI DVVRFLDWLRQ�
The model’s inventors once said that the OMT model was a tested extensible, expressive,
intuitive and easy to use and understand modeling technique. It was a straightforward
integration with object-oriented programs. It promotes database integrity and integration,
for the object paradigm helps to bridge the semantic gap between databases and
applications (Blaha, Premerlani, Rumbaugh, 1988, 425).
Table2 and Table 3 on the following two pages summarize the comparative studies on
model coverage, model connectivity, model advantages and disadvantages between the
ER/EER and the OO/OMT models (Elmasri and Navathe, 1999; Blaha and Premerlani,
1998; Blaha et al., 1988; Navathe, 1992; Sanders, 1995; Gray et al., 1999; Teorey, 1993
and Vermeulen, 1996).

17
Table 2: Basic Correspondence between EER and OMT
ER/EER Model OMT/Object Model
Cardinality-constraint on number of elements in a collection Multiplicity-constraint on the size of collection
COVERAGE
Relationship Type Degree
• Unary
• Binary
• Ternary
Multiplicity of Association
• Reflective association
P E R S O Np a re n t
ch ild
• Binary CLASS1 CLASS2
• TernaryASSO C IAT E
CLASS
CLASS1 CLASS3
CLASS2
1:1� �
Exactly one&ODVV ([DFWO\RQH
1:M
�0
One or zero
&ODVV 2QH RU =HUR
M:N0 1
Zero or more (many)Class Many
Connectivity
One or more
&ODVV 2QH RU PRUH���

18
Table 3: Advantages and Disadvantages of ER/EER and OO/OMT Models:
ER/EER Model OO/OMT Model
ADVANTAGES • Simplicity and Flexibility
• Readability and expressiveness
• Add more semantics to data models
• Met the requirements of most complex databases with
its specialization, generalization and category concepts
• Tested extensibility
• Fewer symbols than EER, but these symbols are
meaningful and expressive
• Bear closer resemblance to reality
• Support for object identity
DISADVANTAGES • Lack of object identifier
• Lack of object methods
• Lack of structural and behavioral inheritance
• Limitations in modeling the real world objects
• Data focused
• Influenced by database
• Challenge for data modeler, require combination of
OO programming and database design technology

19
2.4. Ternary Relationships
A ternary relationship is a relationship type of degree three, that is, a relationship with
three entities involved. There are four forms of ternary relationships (Teorey, 1999): one
to one to one (1:1:1), one to one to many (1:1:M), one to many to many (1:M:N), and
many to many to many (M:N:P). Any entity in a ternary relationship is considered to be
“one” if only one occurrence of it can be associated with one occurrence of each of the
other two associated entities. It is “many” if more than one occurrence of it is associated
with one occurrence of each of the other two associated entities. In both cases, one
occurrence of each of the other two entities is given as a premise.
Figure 5: 1:M: N Ternary Relationships in EER Model
INSTRUCTOR COURSE
SEMESTER
OFFERS1 M
N
The above ternary relationship “OFFERS” in Figure 5 is a 1:M:N relationship. This
relationship associates three entities: instructor, semester and course. For a certain course
in a certain semester, there is one and only one occurrence of “instructor” associated. For
a certain instructor and a certain course, there could be many occurrences of “semester”

20
associated. For a certain instructor in a certain semester, there could be more than one
occurrence of “course” offered.
The same semantic ternary relationship can be expressed in the OMT Model as:
Figure 6: Ternary Relationship in OMT Model
INSTRUCTOR
COURSE
SEMESTER OFFERS
DELIVERED_ COURSEcourseId
semesterIdinstructorId
Candidate key for ternary association: { (courseId, semesterId)}
By comparing the above two models of the same ternary relationships, we can see that an
OMT model diagrammatically adds an associated class “DeliveredCourse” as another
entity and the candidate key for this ternary association. However, it does not have the
concept of cardinality. In the EER diagram, the cardinalities between each entity are
expressed on the diagram, but it does not have any conceptually associated entity shown
on the diagram. According to the 100% principle of ISO, a conceptual language ideally
should be able to completely model all details about the application domain that are
conceptually relevant (ISO, 1982). Therefore, both OMT and EER models are
incomplete according to the 100% principle.

21
For the ternary relationships in Figure 5 and Figure 6, one might wonder if they could be
translated into 3 binary relationships. Should we include ternary constructs or only
binary relationships in conceptual data modeling? There is no definite answer to this
question. It depends on what you are modeling.
“In general, a ternary relationship type represents more information than do three binary relationship types. Which relationship type to choose depends on the semantics or meaning of the particular situation being represented” (Elmasri and Navathe, 2000, pp. 98).
For example, if we translate Figure 5 into three binary relationships: “teaches”,
“teaches_in” and “taught_in”, the diagram will look like this:
Figure 7: Three Binary Relationships in an EER Diagram
INSTRUCTOR COURSE
SEMESTER
TEACHES
TEACHES_IN TAUGHT_IN
NM
M
N N
M
The binary relationships between instructor and semester are many to many (M:N). The
relationships between semester and course are many to many (M:N), and the
relationships between instructor and course are also many to many (M:N).
By comparing with the original ternary relationship (1:M: N), it appears that the
relationships between the three entities have changed from a single ternary 1:M:N to

22
three binary M:N relationships. In fact, the meaning of the three binary relationships is
different from the single ternary relationship.
The diagram in Figure 5 can be expressed as: for a certain course in a certain semester,
there can be only one instructor associated. A course offered by an instructor can be
offered in many semesters. An instructor in a certain semester can teach many courses
(with the assumption that no allied instructors for the same class are allowed.). In
Figure 7, the diagram can be expressed as: an instructor teaches many courses. An
instructor can teach in many semesters. A course can be taught in many semesters. It
does not necessarily imply an instance of (semester, instructor, course).
To tell the difference between a ternary relationship type and three binary relationships,
one needs to know how many entities have to be associated with an occurrence of an
entity. If each occurrence of the two other associated entities is needed to decide one
instance of an entity, this relationship is a ternary relationship. Otherwise, we can
decompose a ternary relationship into three binary relationships.
All in all, a ternary relationship is a complex real-world situation. It is difficult to model
a ternary relationship correctly. However, it is important to have a technique that is as
easy to use and understand as possible, while still being accurate and complete.

23
2.5. Users’ Comprehension of EER and OO Models
Comparison of users' comprehension of ER/EER models and the Object Oriented data
models started with Bock and Ryan in 1993.
They compared EER and Kroenke’s object oriented model in a laboratory study. The
method they used was the classical post-test-only control group design. Thirty-eight
subjects were equally divided into two groups where each group was trained in one of the
two modeling methods with the same instructor and the same content. The training lasted
8 hours in total with 4 two-hour blocks in several days. The tasks for the study objects
were to model the provided information system descriptions in EER or Kroenke’s model.
The grading scheme followed the protocol used by Batra et al.: presence, absence or
correct use of pieces like entity or object, identifier, relationship and category of entity or
object were evaluated from 0 to 1. Zero points were granted for completely incorrect
answers and one point for completely correct ones. Incorrectness referred to missing a
description or representing a description wrongly or differently from the specification
given in the task description (Bock and Ryan, 1993).
Their study demonstrated that the most common mistakes by the subjects were due to
their inability to recognize the degree of the relationships as ternary. Even when the
subjects recognized the degree of the relationships as ternary, they incorrectly modeled
the connectivity of the relationship. Overall, they claimed that both EER and Kroenke’s

24
models had low degrees of success in representing ternary relationships (Bock and Ryan,
1993).
Ternary relationships do exist in information systems. Their study revealed that it is hard
to model correctly the connectivity in ternary relationships, even when a subject realized
the degree of the relationships as ternary. Does this imply that users had difficulty
understanding connectivity in ternary relationships? If a ternary relationship’s
connectivity is modeled in EER correctly, will users still have difficulties in
understanding and interpreting it?
Shoval and Frumermann (1994) compared users’ comprehension of OO and EER models
in 1994. The purposes of their study were to determine whether there was a difference in
overall comprehension between the two schema diagrams and whether there was any
difference in any of the specific categories of constructs in each model. Seventy-eight
participants were divided into 2 groups. The participants were asked to complete a
questionnaire with a set of 48 “true” and “false” statements about facts in the conceptual
schemas. The same instructor taught the two groups with the same content in the same
amount of time (1.5 hours). The motivation for the students came from the notion that
their performance in this study would be tied to their final course grade. The level of
comprehension was measured by counting the number of correct answers. Based on the
average scores in each group, the researchers determined if there were significant
differences in comprehension between these two models.

25
Their controlled experiment indicated that there were significant differences in
understanding facts related to ternary relationships. Participants found it significantly
easier to comprehend ternary relationships with the EER model (Shoval and
Frumermann, 1994).
This study seemed to have answered the question arising from the previous study, i.e.,
whether ternary relationships were easier to understand with the EER model, although it
is hard to represent ternary relationships successfully in the EER model.
Hardgrave and Dalal studied users’ understanding of EER and OO models in 1995.
Fifty-six entry-level database designers (students enrolled in a database management
systems course at a major Midwest university) were divided into 4 groups (for simple and
complex task levels, and for both OMT and EER models). Each group was given a one-
hour lecture on the EER or OMT model. The experiment design was the between-
subjects post-test-only approach. The participants were asked to answer multiple-choice
questions for either the EER or OMT model (5 points for simple tasks and 10 for
complex tasks). They focused their study on model understanding, time-to-understand,
and perceived ease-of-use.
Their experimental results suggested that there was no significant difference in the
numbers of correct answers of model understanding or perceived ease-of-use between
EER and OMT models. The only difference between EER and OMT models was that the
26
OMT model was significantly faster to understand, for both simple and complex
problems.
My question is which model is easier for users to understand ternary relationships, EER
or OMT model. Given that with OMT it is faster to understand simple and complex
problems, and ternary relationships are one class of complex problems, does it imply that
OMT model is easier to understand than EER model?
Lee and Choi (1998) conducted a study on users’ comprehension of EER and OO models
on 100 subjects (28 graduates, 72 undergraduates); with twenty-eight experienced with
the EER model. They randomly divided the users into 4 groups. Each group was trained
for 1.5 hours with one of the four conceptual data modeling techniques: EER, SOM,
ORM, and OMT. The participants were then asked to model the described information
system in one of the four conceptual models. Their study focused on model correctness,
modeling time, and perceived ease-of-use.
Lee and Choi’s study established that both EER and OMT were better than SOM and
ORM for beginners. There was no significant difference between EER experienced and
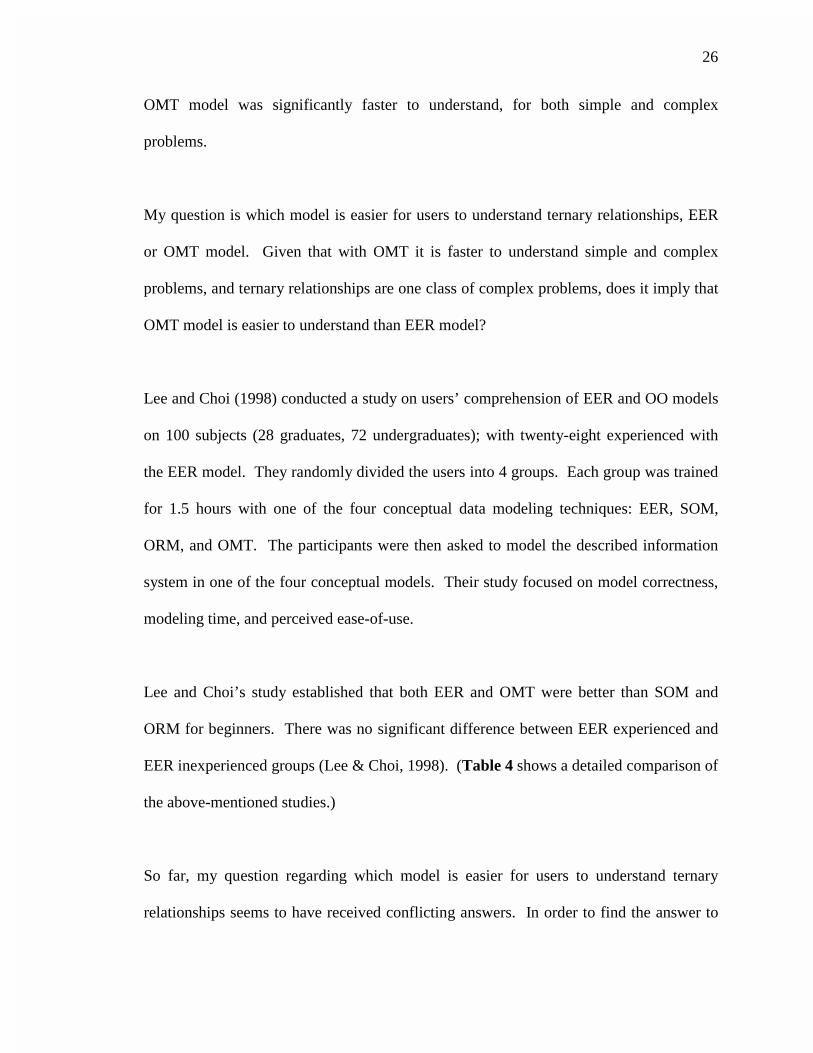
EER inexperienced groups (Lee & Choi, 1998). (Table 4 shows a detailed comparison of
the above-mentioned studies.)
So far, my question regarding which model is easier for users to understand ternary
relationships seems to have received conflicting answers. In order to find the answer to

27
this question, I conducted an online study on users understanding of ternary relationships
in EER and OMT model.
28
Table 4: Comparison of Previous Studies on Users’ Comprehension of EER and OO Models
User Group Tasks Evaluation Results 1993
Bock & Ryan
38 undergraduates and graduate students in IS major divided into 2 groups
Model an information system according to the provided system description in EER or Kroenke’s OO model
Modeling correctness Both EER and SOM models had low degrees of success in representing ternary relationships
1994
Shoval &
Frumermann
78 students divided into 2 groups
Answer a questionnaire with forty-eight “true” or “false” statements about facts in the conceptual schemas.
Overall comprehension of schema and specific categories of constructs of schema
It was significantly easier to comprehend ternary relationships with EER model.
1995
Hardgrave & Dalal
56 entry-level database designers
Answer multiple-choice questions in either EER or OMT model (5 points for simple task and 10 for complex task).
Model understanding, Time-to-understand, Perceived ease-of-use.
OMT model was faster to use and understand, for both simple and complex tasks.
1998
Lee & Choi
28 graduates, 72 undergraduates
Model an information system according to provided system description in EER, SOM, ORM or OMT
Model correctness, Modeling time, and Perceived ease of use.
EER and OMT were better than SOM and ORM for beginners; No significant differences between EER pre-experienced and inexperienced groups

29
3. Methodology 3.1. Research Model
The research model used for this study is shown in Figure 8, which was originally
proposed by Jenkins and was used in all of the previous studies (Batra, et al., 1990; Bock
and Ryan, 1993; Hardgrave and Dalah, 1994; and Lee and Choi, 1998).
Figure 8: Research Model
'$7$ 02'(/
92/817((56
3(5)250$1&(
7$6.
((5
207
*UDGXDWH
VWXGHQWV LQ
6FKRRO RI
,QIRUPDWLRQ
DQG /LEUDU\
6FLHQFH DW
81&�&KDSHO
+LOO
6WDWHPHQW RQ
VFKHPD FRQVWUXFW
RI WHUQDU\
UHODWLRQVKLSV
8VHUV
FRPSUHKHQVLRQ
The objective of this study was to compare users’ comprehension of ternary relationships
in EER and OMT models in order to determine whether there is any significant difference
in users’ comprehension. My hypothesis for this study was that there would be no or

30
minimal difference in users’ comprehension of ternary relationships in extended entity
relationship model or object modeling technique.
Participants in my study were graduate student volunteers from the School of Information
and Library Science (SILS) at UNC-Chapel Hill. The total number of participants who
finished the whole study was 60. I called for volunteers by sending a broadcast email
message to the SILS graduate student mailing list. There was no inducement or
obligation for the participation. The volunteers were asked to complete a background
questionnaire and read one web lecture before they proceeded to complete the study
questionnaire. The volunteers’ performances were evaluated on the percentages of
correct answers to the statements on the questionnaire.

31
3.2. Research Procedure
A. I sent out the call-for-volunteer email message to the graduate student email list at
the School of Information and Library Science at UNC-Chapel Hill in early October. At
the same time, I sent out the URL for the background survey questionnaire
(http://dbserv.ils.unc.edu/projects/liuz/bg.htm) (Appendix B) and asked those who were
willing to participate to submit their answers online.
B. After receiving the participants’ survey background inputs, I divided the volunteers
into two groups randomly, one for the EER group and the other for the OMT group. At
the same time, consent letters (Appendix A) for the study were placed in their campus
mail folders. For those who could not come to the campus to pick up the consent letter, a
soft copy of the consent letter was sent electronically to them instead. Those who
decided to participate in my study after reading the soft copy of the consent letter sent me
an email indicating their willingness to continue the second part of my study.
C. Another email with the URLs for each group's web lecture and questionnaire was sent
to the participants (http://dbserv.ils.unc.edu/projects/liuz/eer.htm (Appendix C and
Appendix E) or http://dbserv.ils.unc.edu/projects/liuz/oo.htm (Appendix D and
Appendix F)) after I divided the participants into two study groups.

32
In the email, each participant received his/her ID for the second part of the study. The
reason for sending them IDs is that my password-protected web database is made up of
three tables: one is the background input table, another one is the EER input table and the
third one is the OMT input table. Each input volunteer got an ID automatically when
he/she first submitted his/her background survey inputs online and those inputs went into
the background input table automatically. I made automatic ID in the background input
table the primary key. A participant’s input ID for the second part of the study is a
foreign key in the EER or OMT input table, referencing background input table (ID). In
this way, I can connect each participant’s background with his/her study result.
The participants were asked to fill in their study IDs when they submitted the answers
online. Their inputs went to my password-protected EER or OMT table in the database.
The volunteers could work on their web lecture and questionnaire wherever and
whenever they wanted to, as long as they could access the web.
D. I sent a thank-you letter to the participants to show my appreciation and gratitude for
their participation after the study was completed.

33
3.3. Data Analysis and the Results
Totally ninety volunteers took part in the background survey study and they were divided
into two groups randomly, 45 in each group. They were sent the URL and IDs for the
second part of my study. A total of sixty volunteers finished the second part: 30 from the
EER group and 30 from the OMT group. The return rates for both groups were
coincidentally equal, at 66.7%. Table 4 summarizes the results of the background survey
(Appendix B). The two groups had overall similar backgrounds.

34
Table 5: Background Data for the EER and OMT Groups
Background Area EER group (totally: 30 people)
OO group (totally: 30 people)
• Humanities 16 15 • Science 4 9 • Arts 4 1
Undergraduate major
• Others 6 5 • Novice 14 13 ER experience • Experienced 16 17 • Novice 16 20 OO experience • Experienced 14 10 • Novice 17 18 Database experience • Experienced 13 12 • INLS162-System Analysis 19 18 • INLS256-Database System I 13 10 • INLS258-Database System II 7 4 • INLS 259-Web Database 1 2
Class-taken
• None 10 10 • Read articles in database field 16 22 • Used Microsoft Access 26 22 • Designed a database from scratch 14 19 • Used other DB software extensively 5 4 • Used other DB software occasionally 14 14
General Experience:
• Learned OO programming language 4 9

35
There were only minor differences in the numbers of volunteers with an under major in
arts or OO programming language experience between the EER group and the OMT
group.
Table 6 shows the number of correct answers from both groups for each question.
Table 6: Correct Answers from the EER and OMT Groups for Each Question
EER Group Correctness OMT Group Correctness
Question
Number
Number of Correct
Answers
Percentage
Number of Correct
Answers
Percentage
1 26 86.7% 28 93.3%
2 16 53.3% 19 63.3%
3 27 90.0% 28 93.3%
4 23 76.6% 21 70.0%
5 21 70.0% 27 90.0%
6 27 90.0% 29 96.7%
7 22 73.3% 28 93.3%
Neither of the two groups fared well for question 2 in the questionnaire. For the EER
group, fourteen out of thirty subjects (14/30=46.7%) gave the wrong answer, while
eleven out of thirty (11/30=36.7%) from the OMT group gave

36
the wrong answer. The question was: an employee may work on many projects in a
certain city, true or false? The diagram is shown in Figure 9.
Figure 9: Department Project Diagram for EER Groups
According to this diagram, the correct answer is False. A certain worker in a certain city
can work on only one project at a time. The question itself is a tricky one, since one
would assume, out of common sense, that an employee could work on many projects in a
certain city.
This result might imply that those who answered wrongly to this question did not look at
the diagram carefully. It might also imply that users’ interpretation of a model diagram is

37
influenced by their common senses, or social backgrounds. In situations like these, it is
crucial to have clear and easy to understand models.
Table 7 lists the numbers and percentages of correct answers for each group, and their
distribution within the two groups. It suggests that both groups have fairly high numbers
of people answering the questions correctly, or mostly correctly.
Table 7: Numbers of Correct Answers for Each Group and Their Distribution
Questions (Totally 7 questions)
EER Group (Totally 30 people)
OMT Group (Totally 30 people)
Number of correct
answers
Correct Percentage
Number of people
Percentage in the group
Number of people
Percentage in the group
7 100.0 4 13.3 7 23.3
6 85.7 12 40.0 16 53.3
5 71.4 7 23.3 7 23.3
4 57.1 6 20.0 0 0
3 42.8 1 3.3 0 0
2 0 0 0 0 0
1 0 0 0 0 0
A T-test comparing the overall numbers of correct answers of these two groups with the
hypothesis that there is no difference between EER and OMT group is shown in Table 8.

38
Table 8: T-test of the Numbers of Correct Answers between EER and OMT Groups
T-test: Two-Sample Assuming Equal Variances EER OMT
Mean 0.771428571 0.857142857 Variance 0.023363828 0.009852217 Observations 30 30 Pooled Variance 0.016608023 Hypothesized Mean Difference 0 Df 58 t Stat -2.575964522 P(T<=t) one-tail 0.006282839 t Critical one-tail 1.671553491 P(T<=t) two-tail 0.012565679 t Critical two-tail 2.001715984
The difference between the mean scores of EER and OMT groups was obvious. The
percentage of correct answers in the EER group was 77.14%, while in the OMT group it
was 85.71%. It also appeared clear to us that both groups had fairly high numbers of
correct answers. The two-tail P value in the T-test was 0.012565679. It was small
enough to reject my original hypothesis that there was no significant difference for users’
understanding of ternary relationships. OMT users did better on the test than EER users,
which may indicate that OMT was easier to understand for ternary relationships.

39
4. Conclusion
It is interesting to observe that there was a slight significant difference between EER and
OMT models for users’ understanding of ternary relationships. From the results of this
study, we can say that users can understand ternary relationships better in the OMT
model than in the EER model.
However, ternary relationships are complex relationships. The relationship types used in
this study were “one to one to many” and “many to many to many”. This study did not
cover “one to many to many” or “one to one to one” relationships. In addition, only
seven questions were asked regarding the ternary relationships in this study. It would be
better if we could have room for more questions and to cover every type of ternary
relationships.
Nevertheless, we believe the current research results are meaningful and will be useful
for further evaluations of EER and OO/OMT models. There is definitely a need to learn
which model is easier for users to understand ternary relationships.

40
References
1. Batra, Dinesh, Hoffer, Jeffrey A., Bostrom, Robert P. (1990). Comparing
representations with relational and EER models. Communications of the ACM,
33, 2, 1990, 126-139.
2. Blaha, Michael, Premerlani, William (1998). Object-oriented modeling and design for
database applications. Prentice Hall, 1998, 13-53.
3. Blaha, Michael R., Premerlani, William J., Rumbaugh, James E. (1988). Relational
database design using an object-oriented methodology. Communications of the
ACM, 31, 4, 1988, 414-425.
4.Bock, D.B. & Ryan, T. (1993). Accuracy in modeling with extended entity-
relationship and object oriented data model. Journal of Database Management, 4,
4, 1993, 30-39
5. Chen, P.P. (1976). The entity-relationship model: toward a unified view of data.
ACM Transactions on Database Systems, 1, 1, 1976.
6. Codd, E.F. (1970). A relational model for large shared data banks.
Communications of the ACM, 13, 6, 1970.
7. Elmasri, Ramez and Navathe, Shamkant (2000). Fundamentals of database systems.
Third Edition, Addison Wesley, 73-105.
41
8. Gray, Peter M.D, Kulkarni, Krishnarao G., Paton, Norman W. (1992). Object-oriented
databases-a semantic data model approach, Prentice Hall International Series in
Computer Science, 1992, 2-13.
9. Hardgrave, B.C.; Dalal, N.P. (1995). Comparing object-oriented and extended-entity-
relationship data models. Journal of database management, 6, 3, 1995, 15-21.
10. ISO (1982.) Concepts and terminologies for the conceptual schema and the
information base, Ed. J. van Griethuysen, ISO/TC97/SC5/WG3-N695 Report.
New York: ANSI.
11. Lee, H. & Choi, B.G., (1998). A comparative study of conceptual data modeling
techniques. Journal of Database Management, 9, 2, 1998, 26-35.
12. Navathe, Shamkant B. (1992). Evolution of data modeling for databases,
Communications of the ACM, 35, 9, 1992, 112-123.
13. Premerlani, William J. and Blaha, Michael R. (1994). An approach for reverse
engineering of relational databases. Communications of the ACM, 37, 5, 1994,
42-49.
14. Shoval, P. & Frumermann, I. (1994). OO and EER conceptual schemas: a
comparison of user comprehension. Journal of Database Management, 5, 4, 1994,
28-38.
15. Teorey, Toby J., Yang, Dongqing, Fry, James P. (1986). A logical design
methodology for relational databases using the extended entity-relationship
model. Computing Surveys, 18, 2, 1986, 197-222.
16. Teorey, Toby J (1993). Database design and modeling. Morgan Kaufmann
Publishers, Inc.1993

42
17. Vermeulen, Robert (1996). Upgrading relational databases with objects, SIGS-Books
& Multimedia, 1996

43
Appendix A: Consent Form
Introduction to the Study:
• I am inviting you to be in a research study of users comprehension of ternary relationships (a kind of relationships involving three participants) in extended entity relationship model (EER: a kind of notational diagram to show the relationships between different objects.) and object modeling technique (OMT: a kind of notational diagram to show the relationships between different objects.) for my master’s thesis.
• EER and OMT model are two of the most popular data modeling techniques nowadays and ternary relationships are hard to model in both EER and OMT model.
• I am studying which modeling technique makes ternary relationships easier to understand.
• There will be about 60 participants for this study.
Purpose:
• The purpose of this study is to see how well users understand ternary relationships in EER or OMT model and which model is easier for users to understand.
• I hope to give suggestions like how much we should talk about ternary relationships in database class based on the result of this study.
What Will Happen During the Study:
This is what will happen during the study: 1. Fill in the online database background survey questionnaire.
• 7 multiple choice questions • it will take you 5-10 minutes on it. • Submit your input online within 10 days.
2. Based on your database experience, I will send you another URL about the web
lecture to read and questions to answer.
• 4-page lecture with lots of pictures to help you understand the concepts in data modeling.
• 11 true/false questions to answer according to the model picture after you finish reading the lecture part.

44
• It will take you around ½ hour. • Submit your answer within 12 days.
3. If you have any questions or concerns about being in this study, you should call my advisor Stephanie W. Haas at 919-962-8360 , email [email protected] or call me Zhihui Judy Liu at (919) 933-8753, email [email protected].
Your Privacy is Important:
• I will keep it private who participates and who does not participate.
• When I send you the URL of the page you are going to read and answer the questions on it, I will send the email individually.
• Any information I get in the study will be recorded in my password-protected database when you submit the form online automatically. Each answer will be a record in an access database, which can only be viewed by me.
• When the study is finished, the name and email address will be destroyed from the database.
• I will not use your name in any of the information we get from this study or in any of the research reports.
Risks and Discomforts:
I do not know of any personal risk or discomfort you will have from being in this study.
Your Rights:
• You decide on your own whether or not you want to be in this study.
• Your decision to participate or not will not be revealed to anyone other than me, and will have no effect on your work at SILS.
• If you decide to be in the study, you will have the right to stop being in the study at any time.
Institutional Review Board Approval:
• The Academic Affairs Institutional Review Board (AA-IRB) of the University of North Carolina at Chapel Hill has approved this study.
• If you have any concerns about your rights in this study you may contact the Chair of the AA-IRB, David A. Eckerman, at CB# 4100, 201 Bynum Hall, UNC-CH, Chapel Hill, NC 27599-4100, (919) 962-7761 email: [email protected] .
Summary:
• I understand this is a research study to see how well users understand ternary relationships in extended entity relationship model or object-oriented model.

45
• If I agree to be in the study, I will be asked to take part in 2 tasks that may include:
o Fill out and submit the database background survey on line, which will take me around 5 minutes).
o Read the 4-page web lecture before answering 11 questions and submit the answers online, which will take me around ½ hour.
I have had the chance to ask any questions I have about this study, and they have been answered for me. I have read the information in this consent form, and I agree to be in the study. There are two copies of this form. I will keep one copy and return the other to the investigator.
________________________________
(Signature of Participant)
________________________________
(DATE)
Addendum:
1. Ternary relationships: a kind of relationships involving three participants to define this relationship. For example: the relationships between class, student, and teacher can be defined as ternary relationships “offers”. Three objects involved in this relationships named “offers”: teacher, student and class.
2.EER Model: a kind of notational diagram to describe the relationships between different objects.
3.OMT Model: a kind of notational diagram to describe the relationships between different objects.
I have met the standard for using specialized language in consent letter.

46
Appendix B: Background Survey Questionnaire
Background Survey for the Experiment of Users Comprehension of
Ternary Relationships
Full Name:
Email Address:(required)
1. My undergraduate major was in: (Pick one)
����� Sciences ����� Arts ����� Humanities ����� Other
2. I have taken the following courses at SILS:(check all those apply)
����� INLS 162 (System Analysis) ����� INLS 256 (Database I ) ����� INLS 258 (DatabaseII ) ����� INLS 259 (Web database) ����� None of above
3. I have the following database experience:(check all apply)
����� I have read articles in database field.
����� I have used Microsoft Access.
����� I have designed a database from scratch.
����� I have used other database software extensively.
����� I have used other database software occasionally.
����� I have learned object oriented programming languages.
����� I have no experience with database at all.
4. On the whole, in terms of database experience, I consider myself an :1=absolute beginner, 5= expert
����� 1 ����� 2 ����� 3 ����� 4 ����� 5
47
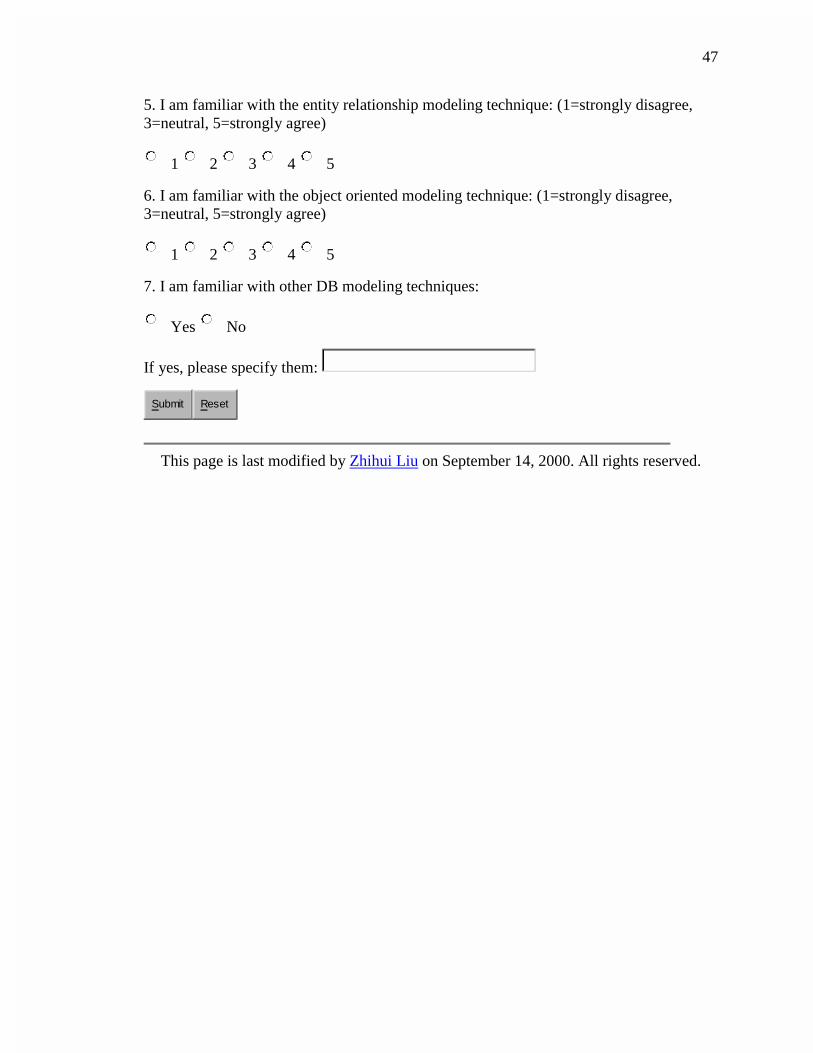
5. I am familiar with the entity relationship modeling technique: (1=strongly disagree, 3=neutral, 5=strongly agree)
����� 1 ����� 2 ����� 3 ����� 4 ����� 5
6. I am familiar with the object oriented modeling technique: (1=strongly disagree, 3=neutral, 5=strongly agree)
����� 1 ����� 2 ����� 3 ����� 4 ����� 5
7. I am familiar with other DB modeling techniques:
����� Yes ����� No
If yes, please specify them:
Submit Reset
This page is last modified by Zhihui Liu on September 14, 2000. All rights reserved.

48
Appendix C: Online EER Questionnaire
Ternary Relationships in Extended Entity Relationship Model (EER model)
Please read the lecture part on modeling technique before answering the following questions regarding the right department project diagram:
1. An employee may apply a given set of skills on a particular project.
����� True ����� False
2. An employee may work on many projects in a certain city.
����� True ����� False
3. Many employees may work on a certain project with a certain skill.
����� True ����� False
4. An employee uses skills he/she possesses in at least one project.
����� True ����� False
5. Many employees can work on many projects in many cities.
����� True ����� False
6. A project worked on by an employee can be in many cities.
����� True ����� False
7. A project needs many skills, a worker may work on many projects and a worker may possess many skills.
49
����� True ����� False
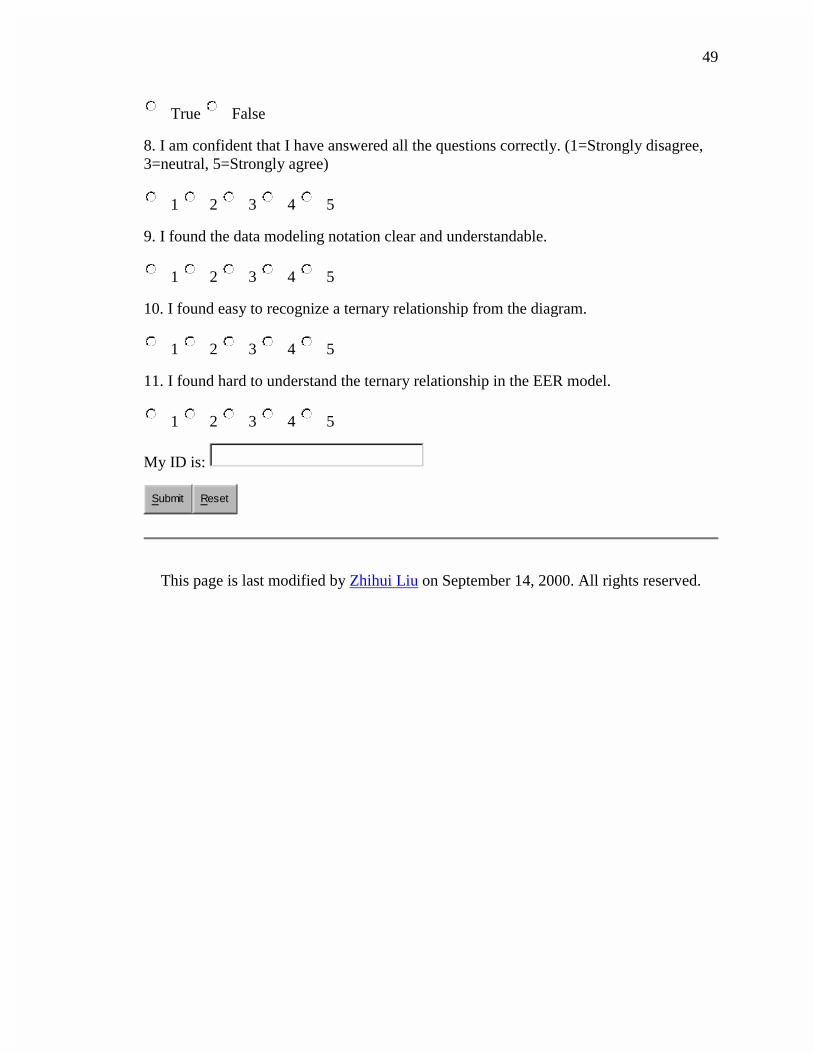
8. I am confident that I have answered all the questions correctly. (1=Strongly disagree, 3=neutral, 5=Strongly agree)
����� 1 ����� 2 ����� 3 ����� 4 ����� 5
9. I found the data modeling notation clear and understandable.
����� 1 ����� 2 ����� 3 ����� 4 ����� 5
10. I found easy to recognize a ternary relationship from the diagram.
����� 1 ����� 2 ����� 3 ����� 4 ����� 5
11. I found hard to understand the ternary relationship in the EER model.
����� 1 ����� 2 ����� 3 ����� 4 ����� 5
My ID is:
Submit Reset
This page is last modified by Zhihui Liu on September 14, 2000. All rights reserved.

50
Appendix D: Online OO Questionnaire
Ternary Relationships in Object Modeling Technique
(OMT model)
Please read the lecture part of the modeling technique before finishing the following questions regarding the department project diagram:
1. An employee may perform many skills on a particular project.
����� True ����� False
2. An employee may work on many projects in a certain city.
����� True ����� False
3. Many employees may work on a certain project with a certain skill.
����� True ����� False
4. An employee uses skills he/she possesses in at least one project.
����� True ����� False
5. Many employees can work on many projects in many cities.
����� True ����� False
6.An employee who works on a project can live in many cities.
����� True ����� False

51
7. A project needs many skills, a worker may work on many projects and a worker may possess many skills.
����� True ����� False
8. I am confident that I have answered all the questions correctly. (1=Strongly disagree, 3=neutral, 5=Strongly agree)
����� 1 ����� 2 ����� 3 ����� 4 ����� 5
9. I found the data modeling notation clear and understandable.
����� 1 ����� 2 ����� 3 ����� 4 ����� 5
10. I found it's easy to recognize a ternary relationship from the diagram.
����� 1 ����� 2 ����� 3 ����� 4 ����� 5
11. I found it's hard to understand the ternary relationship in OOmodel.
����� 1 ����� 2 ����� 3 ����� 4 ����� 5
My ID is: (can be found in the email message.)
Submit Reset
This page is last modified by Zhihui Liu on September 14, 2000. All rights reserved.

52
Appendix E: EER Lecture
Ternary Relationships in Extended Entity Relationship Modeling (EER) �
Object | attribute | relationship | binary relationships | ternary relationships
The world is full of things. We abstract those things and call them objects. Dogs, cats and cars are things/objects we can see. Doctors, nurses, teachers are objects too. This kind of objects describes the roles of people. An object can also be an incident like a flight, an interaction like marriage, or a specification like computer model. The information about an abstract object can be represented by a table, which is also called entity. For example:
DOG
Dog_name� Breed� Favorite_food�Birth_date� Owner_name�
Fifi� poodle� dry� 04/01/98� Tiger Miller�
Boris� mix� canned� 03/02/99� Bob Cook�
Allen� St. Bernard� canned� 05/06/98� Susan Wang�
� � � � �
A column in the table represents a characteristic or attribute of the object. We represent a particular instance
A column in the table represents a characteristic or attribute of the object. We represent a particular instance of the object (a single real world thing) by a row in the table. The unique attribute in a row is called candidate key. We can choose one or more than one key. We can choose one or more than one candidate keys as a primary key of the table.
This man is Tiger Miller. He is one of the dog owners in a dog club. The following is a dog owner table:

53
DOG OWNER
Owner_name� Address� Phone�Tiger Miller� 100 Pine Street, Chapel Hill, NC, 27514� 919-914-5555�
Al Smith� 10 Oak Street, Chapel Hill, NC, 27516� 919-933-8888�
You might have noticed the attribute "Owner_name" appeared in both the dog and the dog owner table.. If Tiger Miller does have a Poodle dog called Fifi , there is a relationship between these two objects. A relationship is the abstraction of a set of associations that hold systematically between different kinds of things in the real world.
�
The relationships between dog owner and dog can be expressed like :
Dog owner OWNS dog.
Dog IS OWNED BY dog owner.
Relationships involving two objects are called binary relationships. Depending on the number of instances of an object that participate in each instance of the relationship, there are one to one(1:1) relationships, one to many (1:M) relationships and many to many (M:N) relationships.
For the previous relationships between dog owners and dogs, their relationship is 1:M. A dog owner can have one or many dogs, a dog can be owned by only one dog owner. We can also use a diagram called entity relationships to express our notation on this relationship:
1:M relationships:
We use rectangle to represent an entity /object and a diamond to represent a relationship. We also describe a relationship by putting the description in the diamond. The connection line can be denoted by one (1) or many ( M ). Other examples are:

54
1:1 relationships:
�
A state has only one governor and a governor can work for only one state.
M:N relationships:
�
�
A book can be written by one or more than one authors, an author can write one or more than one books. In entity relationship model, one or more than one instances involved in a relation is modeled as many in the diagram.
When there are three objects involved in a relationship, we call it ternary relationship. There are four main forms of relationships: one to one to one(1:1:1) , one to many to many(1:M:N), one to one to many(1:1:M) and many to many to many (M:N:N) relationships.
1:1:1 relationships:
�
A technician uses exactly one notebook for each project. (Tech 1 uses either Red or Green or white for project P1.) Each notebook for a certain project can be used by one technician at a time.( Notebook Red for P1 can be used be either Tech1 or Tech2 or Tech3.) A technician may still work on many projects and maintain different notebooks for different projects.
55
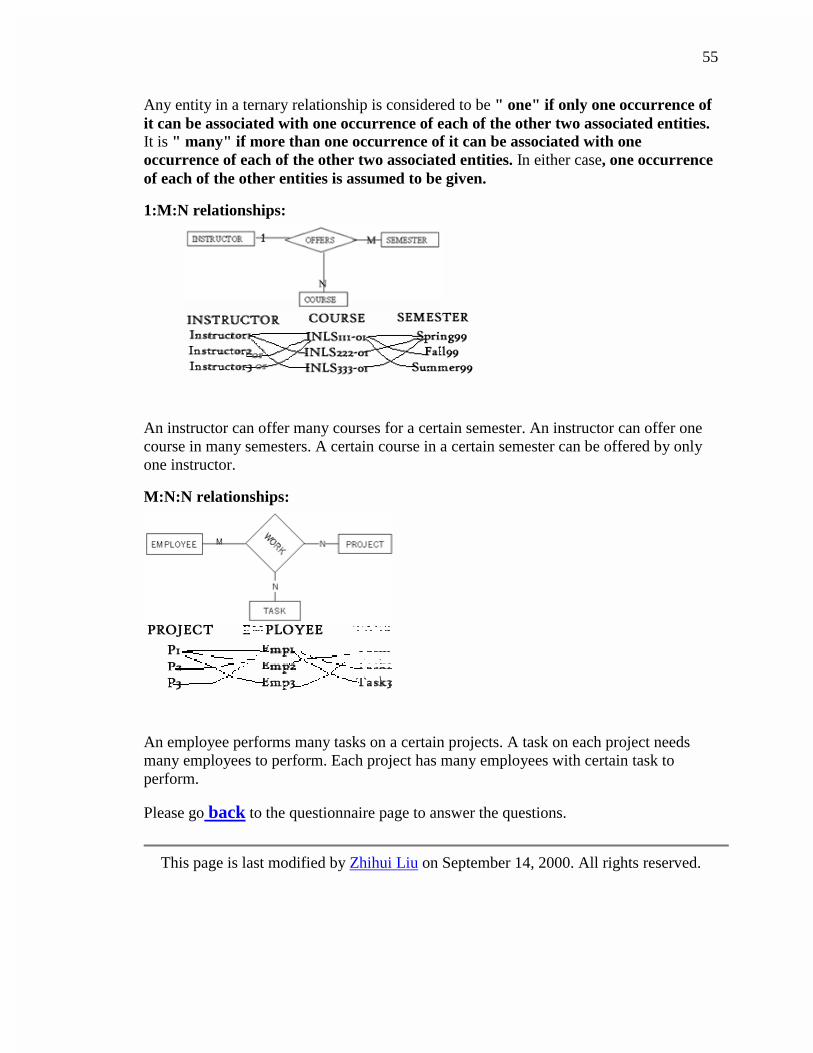
Any entity in a ternary relationship is considered to be " one" if only one occurrence of it can be associated with one occurrence of each of the other two associated entities. It is " many" if more than one occurrence of it can be associated with one occurrence of each of the other two associated entities. In either case, one occurrence of each of the other entities is assumed to be given.
1:M:N relationships:
�
An instructor can offer many courses for a certain semester. An instructor can offer one course in many semesters. A certain course in a certain semester can be offered by only one instructor.
M:N:N relationships:
�
An employee performs many tasks on a certain projects. A task on each project needs many employees to perform. Each project has many employees with certain task to perform.
Please go back to the questionnaire page to answer the questions.
This page is last modified by Zhihui Liu on September 14, 2000. All rights reserved.
56
Appendix F: OMT Lecture Ternary Relationships in Object Modeling Technique (OMT)
Object | Class | attribute | relationship | binary relationships | ternary relationships
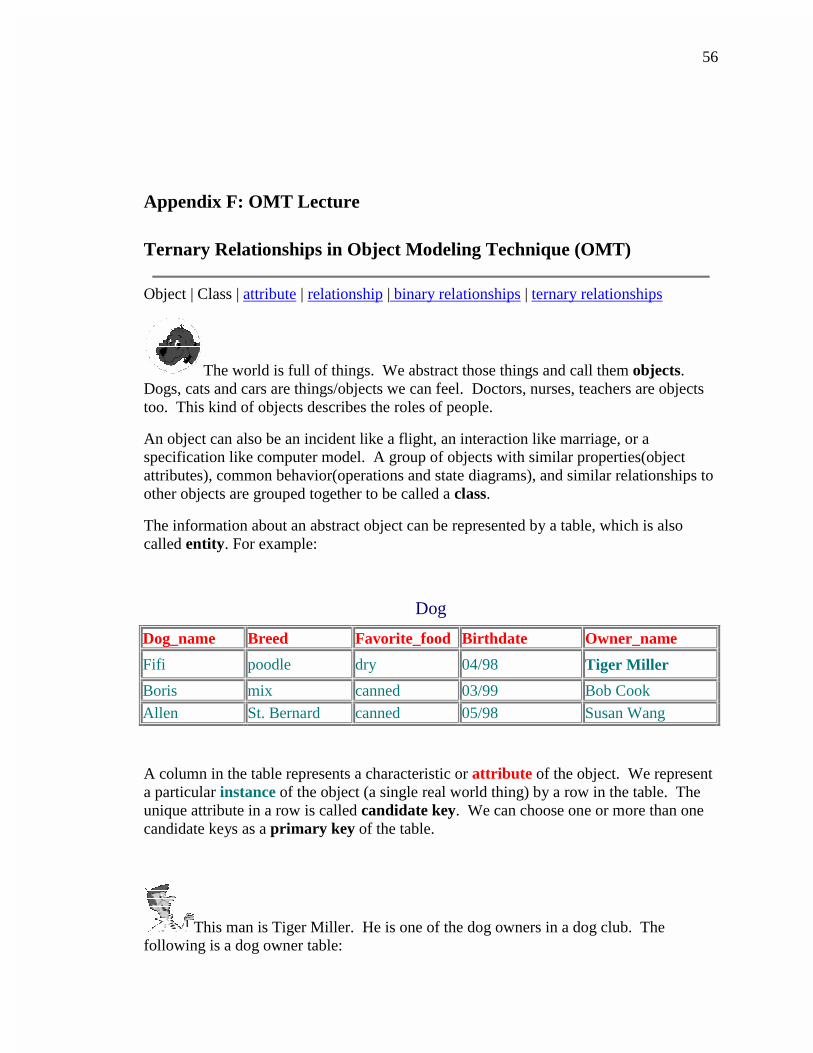
The world is full of things. We abstract those things and call them objects. Dogs, cats and cars are things/objects we can feel. Doctors, nurses, teachers are objects too. This kind of objects describes the roles of people.
An object can also be an incident like a flight, an interaction like marriage, or a specification like computer model. A group of objects with similar properties(object attributes), common behavior(operations and state diagrams), and similar relationships to other objects are grouped together to be called a class.
The information about an abstract object can be represented by a table, which is also called entity. For example:
Dog
Dog_name Breed Favorite_food Birthdate Owner_name
Fifi poodle dry 04/98 Tiger Miller
Boris mix canned 03/99 Bob Cook
Allen St. Bernard canned 05/98 Susan Wang
A column in the table represents a characteristic or attribute of the object. We represent a particular instance of the object (a single real world thing) by a row in the table. The unique attribute in a row is called candidate key. We can choose one or more than one candidate keys as a primary key of the table.
This man is Tiger Miller. He is one of the dog owners in a dog club. The following is a dog owner table:

57
DOG OWNER
Owner_name Address Phone
Tiger Miller 100 Pine Street, Chapel Hill, NC, 27514 919-914-5555
Al Smith 10 Oak Street, Chapel Hill, NC, 27516 919-933-8888
You might have noticed from above two tables that attribute "Owner_name" appeared in both the dog and the dog owner table. If Tim Miller does have a Poodle dog called Fifi, there is a relationship between these two objects. A relationship is the abstraction of a set of associations that hold systematically between different kinds of things in the real world.
The relationships between dog owner and dog can be expressed like :
Dog owner OWNS dog.
Dog IS OWNED BY dog owner.
Relationships involving two objects are called binary relationships. Depending on the number of instances of an object that participate in each instance of the relationship, there are one to one(1:1) relationships, one to many (1:M) relationships and many to many (M:N) relationships.
For the former relationships between dog owner and dog, their relationship is 1:M. A dog owner can have one or many dogs, a dog can be owned by one dog owner. We can also use a diagram called object modeling technique to express our notation on this relationship:
1:M relationships:
We use rectangle to represent a class, which is made up of objects. A line with solid circle at one end represents a relationship of many. A line with a circle at one end represents a relationship of zero or one.

58
We also put "1..* " together with the solid circle line to denote one or more association between two classes. The relationship between class DogOwner and Dog can be expressed like: a dog owner can own one or more than one dogs, a dog can be owned by zero or one dog owner. "Own" is the role between dog and dog owner class. Other examples are:
1:1 relationships:
We use one solid line to represent an exactly one to one relationship between two classes. A state has only one governor and a governor can work for only one state.
M:N relationships:
A book can be written by one or more than one author, an author can write one or more than one book. In entity relationship model, one or more than one instances involved in a relation is modeled as many in the diagram.
When there are three objects involved in a relationship, we call it ternary relationship. There are four main forms of relationships: one to one to one (1:1:1) , one to many to many(1:M:N), one to one to many(1:1:M) and many to many to many (M:N:P) relationships.
1:1:1 relationships:

59
we use a diamond as the notation for a ternary relationship. An associated class Technician_notebook_project is denoted by a box attached to an association with a dashed line.
A technician uses exactly one notebook for each project. (Tech 1 uses either Red or Green or white for project P1.) Each notebook for a certain project can be used by one technician at a time.( Notebook Red for P1 can be used be either Tech1 or Tech2 or Tech3.) A technician may still work on many projects and maintain different notebooks for different projects.
Any entity in a ternary relationship is considered to be " one" if only one occurrence of it can be associated with one occurrence of each of the other two associated entities. It is " many" if more than one occurrence of it can be associated with one occurrence of each of the other two associated entities. In either case, one occurrence of each of the other entities is assumed to be given.
1:M:N relationships:
The relationship between these three classes can be expressed like: an instructor can offer many courses for a certain semester. An instructor can offer one course in many semesters. A certain course in a certain semester can be offered by only one instructor.
M:N:P relationships:

60
An employee performs many tasks on a certain projects. A task on each project needs many employees to perform. Each project has many employees with certain task to perform.
Please go back to the questionnaire page to answer the questions.
�
This page is last modified by Zhihui Liu on September 14, 2000. All rights reserved.