the value assessment method for evaluating preventive ... · pdf filethe value assessment...
TRANSCRIPT

USACERL TECHNICAL REPORT P-91/35August 1991
US Army Corpsof EngineersConstruction EngineeringResearch Laboratory
AD-A240 190
The Value Assessment Method for EvaluatingPreventive Maintenance Activities
by °' DTICJames H. Johnson
ELECTEBecause the advantages of preventive mainte- SEP 1 1 1991nance (PM) are difficult to quantify and returns 0are often seen only in the long term, PM opera-tions are subject to frequent economic reviews. 0Maintenance managers need both technical and
cost data on each maintained unit to build aneffective, low-cost maintenance program basedon a practical cost benefit balance betweenscheduled (preventive) and repair maintenance.
The objective of this research was to develop astandard method to help maintenance managersat military installations determine the relativevalue and cost-effectiveness of PM activities.Information gathered by surveys and site visitswas used to create a foundation for selecting andperforming PM tasks. This foundation, the ValueAssessment Method, was then used to developa method for defining the value (or importance) ofa PM activity based on the mission and the cost-effectiveness of the activity.
The automated system proposed by this reportwill be adapted and programmed as a module ina commercial package (MAXIMO by PSDI). Iffield tests are successful, an upgraded versionwill be provided to the U.S. Army Engineeringand Housing Support Center for distribution toDirectorates of Engineering and Housing. 91-10237
Approved for public release; distribution is unlimited. 111IllllhllhIIiIIIIIIliihIIIl91 9 0 ) 3 5

The contents of this report are not to be used for advertising, publication,or promotional purposes. Citation of trade names does not constitute anofficial indorsement or approval of the use of such commercial products.The findings of this report are not to be construed as an official Depart-ment of the Army position, unless so designated by other authorizeddocuments.
DESTROY THIS REPORT WHEN IT IS NO LONGER NEEDED
DO NOT RETURN IT TO THE ORIGINATOR

REPORT DOCUMENTATION PAGE i M o. 0704-018
Pubic reporting burden for the oectioln of information a estimated to average 1 hour Pr response. rntIuding the time for reviwing -struction$, searching existing data sources,gathenng and mJntaining the data needed. and onpleting And reviewing the collection of information. Send comments regarding thi burden estimateli or ally other apect of !hscollection of information. ncludtng suggestion for reduing this burden. to Wasington Headquarer Sennos. Direcorate for information Operations aind Reports. 1215 ;effersonDavis Highway, Suie 1204. Arlington, VA 202-4302. and to the Office of Managemnt and Budget, Paperwork Reduction Prolec (0704-0188). Washington. DC 205M.
1. AGENCY USE ONLY (Leave Blank) 12. REPORT DATE j3. REPORT TYPE AND DATES COVERED
I August 1991 Final4. TITLE AND SUBTITLE 5. FUNDING NUMBERS
The Value Assessment Method for Evaluating Peventive MaintenanceActivities IAO E878-80261
6. AUTHOR(S)
James H. Johnson
7. PERFORMING ORGANIZATION NAME(S) AND ADORESS(ES) 8. PERFORMING ORGANIZATIONREPORT NUMBER
U.S. Army Construction Engineering Research Laboratory (USACERL)PO Box 9005 TR P-91/35
Champaign, IL 61826-9005
9. SPONSORINGMONITORING AGENCY NAME(S) AND ADDRESS(ES) 10. SPONSORING/MONITORINGAGENCY REPORT NUMBER
U.S. Army Engineering and Housing Support CenterATTN: CEHSC-FB-SFort Belvoir, VA 22060-5000
11. SUPPLEMENTARY NOTES
Copies are available from the National Technical Information Service, 5285 Port Royal Road,Springfield, VA 22161
129. DISTRIBUTION/AVAILABILITY STATEMENT 12b. DISTRIBUTION CODE
Approved for public release; distribution is unlimited.
13. ABSTRACT (Maximum 200 words)
Because the advantages of preventive maintenance (PM) are difficult to quantify and returns are often seenonly in the long term, PM operations are subject to frequent economic reviews. Maintenance managers need bothtechnical and cost data on each maintained unit to build an effective, low-cost maintenance program based on apractical cost benefit balance between scheduled (preventive) and repair maintenance.
The objective of this research was to develop a standard method to help maintenance managers at militaryinstallations determine the relative value and cost-effectiveness of PM activities. Information gathered by surveysand site visits was used to create a foundation for selecting and performing PM tasks. This foundation, the ValueAssessment Method, was then used to develop a method for defining the value (or importance) of a PM activitybased on the mission and the cost-effectiveness of the activity.
The automated system proposed by this report will be adapted and programmed as a module in a commercialpackage (MAXIMO by PSDI). If field tests are successful, an upgraded version will be provided to the U.S.Army Engineering and Housing Support Center for distribution to Directorates of Engineering and Housing.
14. SUBJECT TERMS I5 NUMBER OF PAGESpreventive maintenance cost effectiveness 44value assessment method 16. PRICE CODE
17. SECURITY CLASSIFICATION 18. SECURITY CLASSIFICATION 19. SECURFIY CLASSIFICATION 20. LIMITATION OF ABSI RACTOF REPORT OF THIS PAGE OF ABSIRACT
T I-:! .:'-*" Unclassified Unclassified SAR
NSN 7540-01-280-5500 S Form 298 (Re .2- )Presmd by ANSI SM 239-1829W 102

FOREWORD
This research was conducted for the U.S. Army Engineering and Housing Support Center (EHSC)under Interagency Order (IAO) E878-80261, dated September 1988. The EHSC technical monitor wasMike Smith (CEHSC-FB-S).
The work was performed by the Facility Systems Division (FS), U.S. Army Construction EngineeringResearch Laboratory (USACERL). The principal investigator was James Johnson. Assistance wasprovided by Michael Shamsie, with contributions by Robert Neathammer, Don Hicks, and JohnWilliamson. Dr. Michael J. O'Connor is Chief of USACERL-FS. The USACERL technical editor wasGloria J. Wienke, Information Management Office.
COL Everett R. Thomas is Commander and Director of USACERL, and Dr. L.R. Shaffer is TechnicalDirector.
Accesion For / ----
NTIS CR J&I T% ~O~o OTIC lAi3
Unanlou ce.91-1
ByDistibutio.
-A-
Dist "
2

CONTENTS
Page
SF 298 1
FOREWORD 2
LIST OF TABLES AND FIGURES 4
INTRODUCTION ................................................BackgroundObjectiveApproachScopeMode of Technology Transfer
2 PM MANAGEMENT REVIEW ....................................... 6Management MethodsSchedulingData Collection
3 COST BENEFIT ANALYSIS ....................................... 11GraphsExamples
4 THE VALUE ASSESSMENT METHOD ............................... 16Ordered PM ListingsProcessing the General PM ListExampleAutomated Analytical Support
5 CONCLUSIONS AND RECOMMENDATION ........................... 21ConclusionsRecommendation
APPENDIX A: A General List of PM Candidates forTypical Army Installations 22
APPENDIX B: Sample Maintenance Resource LevelsNeeded at Fort Typical 34
APPENDIX C: PACER Program Performance Objectives 36APPENDIX D: Cost Benefit Present Worth Computations 40
DISTRIBUTION
3

TABLES
Number Page
I Categories of Preventive Maintenance at Military Installations 6
2 Scheduling Priorities of PM Activities 7
3 Interim PM Task Preference List 19
4 Sample Preferred PM Task List for an Example PM Shop 20
FIGURES
1 The Optimum Level of Maintenance Performance 10
2 Correlation of PM Level and Elapsed Time (Years) Before Unit Failure 10
3 Regions of PM Cost Justification 11
4. Relationship of Maintenance Cost vs Years Between Major Expenditures 12
5 Detail of Lower Values for Figure 4 13
BI Correlation of the Net Present Worth of PM Costs and LOS Penalties 38
4

THE VALUE ASSESSMENT METHOD FOR EVALUATINGPREVENTIVE MAINTENANCE ACTIVITIES
I INTRODUCTION
Background
Because the advantages of preventive maintenance (PM) are difficult to quantify and the returns areoften seen only in the long term, PM operations are subject to fvequent economic reviews. Maintenancemanagers in Army installation Directorates of Engineering and Housing (DEHs) need effective methodsto defend PM activities because short-term funding limitations could lead to reduced PM and the long-termeffects could be very costly. Since the cost of maintaining an asset can often exceed its purchase price,PM managers must obtain the best return for the maintenance dollar. An effective, low-cost maintenanceprogram is based on a practical cost benefit balance between scheduled (preventive) and repairmaintenance. To best achieve this balance, maintenance managers need both technical and cost data oneach maintained unit (equipment, system, or component of a facility).
Objective
The objective of this research was to develop a standard method to help maintenance managers atmilitary installations determine the relative value and cost-effectiveness of PM activities.
Approach
The first step in this study was to mail a survey to several installations that have diverse PMactivities. The researcher then visited installations to verify and expand on the data provided. Based onthe survey responses and site visits, the researcher created a foundation for selecting and performing PMtasks. Using this foundation, the researcher then developed a concept for automating data collection andstorage and defining the value (or importance) of a PM activity based on the mission and the costeffectiveness of the activity.
Scope
This research was directed at evaluating individual PM activities; an overall evaluation of the totalPM program was not attempted.
Mode of Technology Transfer
The automated system proposed by the report will be adapted and programmed as a module in acommercial package (MAXIMO by PSDr). The complete software package is to be tested at the MadiganArmy Medical Center, Fort Lewis, WA. If test results are good, an upgraded version will be providedto the U.S. Army Engineering and Housing Support Center for distribution to DEHs.
5

2 PM MANAGEMENT REVIEW
Management Methods
PM management practices are based on priorities, the availability of human and financial resources,and technical data on the unit being maintained. When developing priorities, maintenance managersshould recognize that the reasons for keeping a PM task on the shop's work roster are different from thereasons for scheduling a PM task. The PM work roster is based on the value of a task to the installationand on the cost effectiveness of that task, whereas PM scheduling relates to the timeliness andcoordination of a task.
Survey and site visit data were organized into a list (Appendix A) according to the PM categorieslisted in Table 1. Although PM tasks related to medical facilities, mission support, and utilityplants/distribution systems are mandatory and may be removed only by a command decision, they areincluded to present a total PM picture. Tasks in the other categories are affected by local decisions.
Scheduling
Effective maintenance scheduling requires knowledge of priorities and available resources. Operatingsystems may need immediate, continuing, or intermittent inspection/servicing. Thus, PM scheduling maybe fixed (must be performed at a specific time), variable (required, but with some flexibility in the timeof performance), or optional (desired, but may be skipped without immediate consequences). The PMcategories are grouped in Table 2 by the order in which the PM tasks should be scheduled. Schedulingis accomplished by comparing the available resources with a listing of the total maintenance workload thatis detailed to a prioritized task level.
Table 1
Categories of Preventive Maintenance at Military Installations
Category Activity
A Hospitals and emergency medical facilitiesB Installation-mission supportC Utility generating systemD Utility distribution systemE Base safety/protection systemsF Sewage systemG Medical/dental outpatient clinicsH Base services supportI Domicile/housing supportJ Building habitability and srctural systemsK Waste collection and processing systems
6

Table 2
Scheduling Priorities of PM Activities
,Category Activity
FIXED SCHEDULE(Prescribed time PM inspections/servicing)
A HOSPITALS-life support equipment-monitoring/servicing systems-patient service systems
B' MISSION SUPPORT-communication/computer or mission-control centers-monitoring/environmental-control systems
C UTILITY PLANTS-inspection/servicing of operating units-check of instrumentation readings
F SEWAGE SYSTEM-sewage plant (operation and equipment checks)
VARIABLE SCHEDULE(Flexible time PM inspections/servicing)
E BASE SAFETY/PROTECTION SYSTEMS(Not usually a PM Shop responsibility)-police/base-security call systems-fire alarm box inspections-fire hydrants and their water supply system
G MEDICAL/DENTAL CLINICS-examination room utilities-buildi service
H BASE COMMISSARY SERVICES-perishable food storage and preparation equipment-monitoring/control systems
I DOMICILE/HOUSING SUPPORT
B MISSION SUPPORT STRUCTURES-command facilities-materials handling and storage facilities
D UTILITY DISTRIBUTION SYSTEMS-water system (pumps/valves servicing)-electrical system (substations/power-lines)-gas system (pressure checks/valves/leak-tests)-centrali7ed steam supply (P/T/%Sat/heat or vapor loss)
7
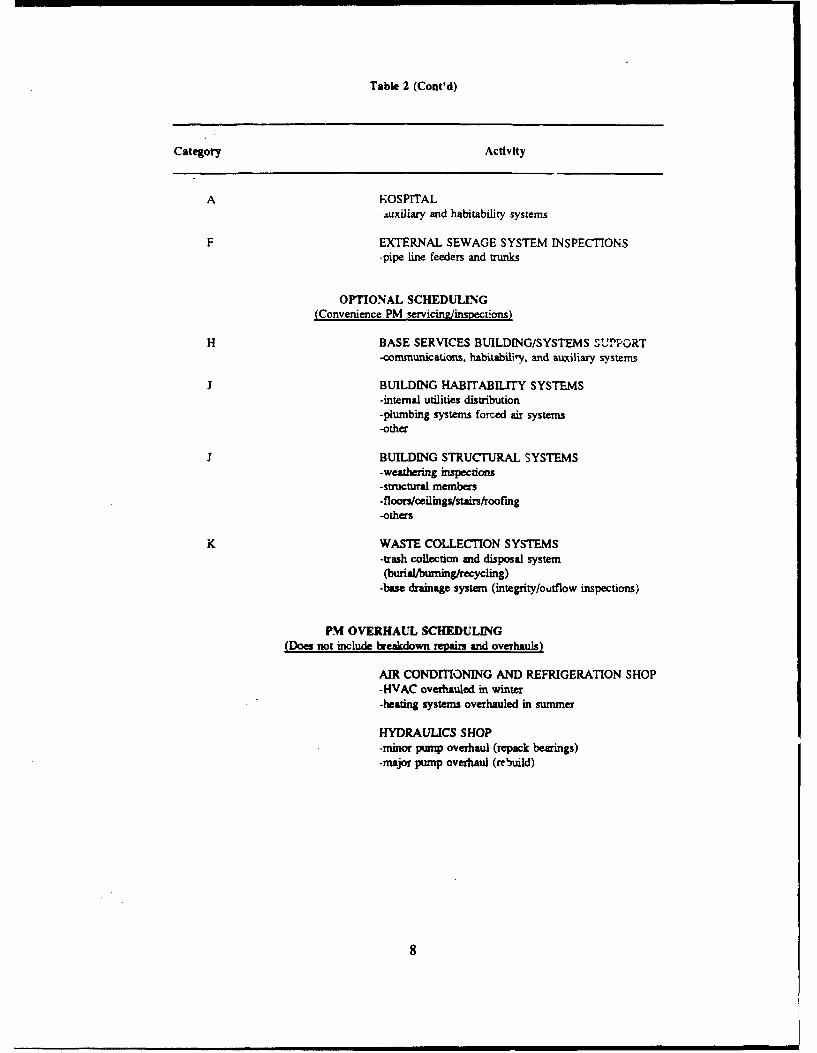
Table 2 (Cont'd)
Category Activity
A HOSPITAL-duxiliary and habitability systems
F EXTERNAL SEWAGE SYSTEM INSPECTIONS-pipe line feeders and trunks
OPIONAL SCHEDULING(Convenience PM sericinz/inspections)
H BASE SERVICES BUILDING/SYSTEMS SUrPORT-communications, habitability, and auxiliary systems
J BUILDING HABITABILITY SYSTEMS-internal utilities distribution-plumbing system forced air systems-other
I BUILDING STRUCIURAL SYSTEMS-weathering inspections-structurral members*floors/ceilingu/stairs/rooflng-others
K WASTE COLLECTION SYSTEMS-trash collection and disposal system(burialJburning/recycling)
-base drainage system (integrity/outflow inspections)
PM OVERHAUL SCHEDULING(Does not include breakdown reivairs and overhauls)
AIR CONDITIONING AND REFRIGERATION SHOP-HVAC overhauled in winter-heating systems overhauled in summer
HYDRAULICS SHOP-minor pwnp overhaul (repack beaings)-major pump overhaul (rebjuild)

Data Collection
Collecting and interpreting maintenance data is one key to effective PM management. Although itis easiest to collect maintenance data each time PM is completed, maintenance histories can be built fromoperation records. The history for each unit should include the installation date and inspectil Vmaintenance/repair records. The type and cost of replaced parts and the proposed maintenance scheduleshoLid also be recorded.
Figure 1 shows an "optimum" level of maintenance for either a specific system or an entireorganization. because it is difficult to obtain the quantitative information needed to create -cch a plot.managers can develop averages uased on local information, and apply the averages to this plot. FigureI assumes a fixed quality of maintenance. The optimum operating point can be improved either byminimizing the Loss Of Service (LOS) cost or by reducing te total maintenance costs (TMC). LOS isthe unit cost of not providing full maintenance plus the allocated costs of a higher rate of total systemdowntime and lowered customer good will. For an assessment to be meaningful, the LOS estimate mustbe held to reasonable values. The present worth LOS cost for a critical unit, generally, should not exceedthe cost of installing a standby for that unit.
Maintaining maintenance histories is made easier by microcomputers now available to most PMmanagers and by a broad Army vide data base known as the Integrated Facilities Systems forMini/Microcomputers (IFS-M). An automated data system can also help during scheduling of limitedpersonnel resources by compari ig a list of the maintenance needs to a prioritized task list. An automatedsystem also provides a data base for easy input or recall o17 the maintenance history for each unit serviced.Data base r-quirements for a typical installation are snown in Appendix ji.
Figure 2 shows the incidence of failure and/or prescribed major overhaul for varying rates of appliedPM as .ecorded for a fictitious unit X. All failure rate experience with the type uf unit being investigatedshould fall within the data point envelope shown by the dashed lines. PM levels (denoted byabbreviations) are labeled by the envelope from negligible (SAl) to extensive (M/W PM), moving up thegraph. For rudimentary PM and semiannual inspections, the mean time between failure ranges from 2 to5, with a median of about 3.2. The narrower the data envelope, the more confidence can be placed ir hecorrelation between PM and mean time between failure. The average of the data points (shown as a solidline) represents the best correlation between PM and failure rates. This type of analysis would help PMmanagers predict the effect of funding constraints on failure rates.
At most DEHs, the effect of PM on failure rates is not known precisely, if at all. PM economicstudies generally rely on sketchy historical data, shop expertise, and averaged data from literature. Evenso, an organized analysis using available data will be more accurate and more persuasive than"eyeballing."
9

MP
CTC
SINADEQUATE PM ECSIEP
0 Maintenance Personnel-Hours
TMC: Total Maintenance Costs (expenditures).LOS: Loss of Service Cost (unit cost of not providing full maintenance plus the allocated costs
of a higher rate total system downtime and lowered customer good will).NET: N=T cost of maintenance = TMC + LOS.MPC: Maintenance Program Cost = TMC + LOS. (This is the total operations cost that is due
to the level of maintenance perf rmed.)
Figure 1. The optimum level of maintenance performance.
30- WPM*
06.0 ,'-/ / / MPM
063.0 / PM
QPM/SMt I.0) data point / / AIPM
0.6 envelope---",,
0.3 here's / /Mlpm0
PM2.9 StPMISAl
0 ... ncreased Reliability-.0 1 2 3 4 5 6 7 8 9 10
Years between unit X breakdowns
SAL: Semiannual InspectionsS/M 1pm: Semiannua/Monthly Insp and Rudimentary PMA/S/Q PM: Annual/Semniannual/Quarterly, basic PMNS/Q PM: Annual/SernianualA~u rterly, full PMM/W PM: Monithly/Weely full PM
Figuee 2. Correlation of PM level and elapsed time (years) before unit failure.
10

3 COST BENEFIT ANALYSIS
Graphs
The benefits of a PM program are the net savings gained by performing PM on a particular unit overnot performing the PM. The cost benefit balance is the difference between what is spent on the unit andthe value received back from the unit. Determining these elements requires reliable maintenance andfailure-rate data collected over time. Managers can then define trends that can be used to estimate changesin cost relationships and to extend the life of the unit.
To gain a good understanding of the short- and long-term justifications for unit maintenance, PMmanagers should prepare generalized cost benefit graphs. A graph such as that in Figure 3 shows thedifference between performing PM at a spe%...fied level or not performing any PM, which requires payingthe future costs for fa" ire/repair or major overhaul. This type of approach can be useful even when onlyminimal data is available. Figure 4 uses the approach of Figure 3 to develop an actual cost justificationgraph for any unit PM over a 10-year review cycle. This graph approximates PM cost relationships asderived in Appendix C. Figure 5 is an expanded version of the lower values on the graph in Figure 4.
$00PMis\
TMC Justifiedw/o PM
PM Cost------------------ ----- -----
PMis-
Yieabeeens oMot MaitneE.niue
Figure 3. Regions of PM cost justification.
11

30
28 \
26 _ _K
24
22 LOSCurves
" 20-
t_ 16-.____ 5K __ _
0
! 12- 2KC \2 K
1 0
6-4- ____
4
0 _2 4 5 6 7 a 9 10
Years Between Major Expenditures
LOS: Toud Loss Of Service charges including Major Repair/Overhaul expense + lossof the UNIT's operation + etc.. for one scheduled downtime.
PM: Preventive Maintenance at a specified cost level.
Figure 4. Relationship of maintenance cost vs years between major expenditures.
12

19- LOS Cures
18 3OK I__ _ _PM
I 7 7 $/Unit
16- per year15 Z._K_ 0 _IOK 1 2500
.. 14
12 -.OK_ 2000
0 I _ __ 2.OK__
_ _ _ __ _ _ _ __ _ _ _
10
9 5 1500
6 i.OK 1 000
C. 5 _K750
2 g--"K"--
00 I 2 3 4 5 6 0
Years Between Major Expenditures
Figure 5. Detail of lower values for Figure 4.
Examples
The following paragraphs contain examples of the cost benefit analysis. The solution to the firstproblem is based on an approximation derived from Figure 4. The solution to the second problempresents three scenarios based on a more exact analysis.
Problem
The validity of spending PM funds on unit X is questioned. After ensuring that the PM applied tounit X is technically effective and efficient, PM management wishes to estimate the cost benefit ofperforming PM.
Assumptions
1. Unit X has PM performed at a net cost of $1000/year.2. Statistically, unit X can be in service for 10 years without a cost-significant breakdown.3. Historical data indicate that without PM, unit X will fail or have a major repair every 3 years.4. For every failure of unit X, the LOS penalty is estimated by a knowledgable DEH analyst to be
$5000.
13

Solution
Apply Figure 4 as follows:
1. On the X-axis, find the vertical line for 3 years between major expenditures.
2. Move up this line to the horizontal line corresponding to a PM of $1000/yr. read the 10-yearpresent worth of this PM on the Y-axis, which is approximately $6140.
3. Continue up the 3-year line to the LOS = 5K curve; note that the present worth of LOS (for morethan 3 failures over 10 years) on the Y-axis is approximately $8800.
4. To get an approximate cost benefit for unit X PM, subtract the PM present worth of step 2 from
the LOS present worth of step 3: $8800 - $6140 = $2660.
The cost benefit of performing PM at $1000/yr is $2660 for this unit over a 10-year period.
Problem
Quantitatively compare three PM scenarios (Case 1: Full PM; Case 2: Nominal PM; Case 3: NoPM) for an accessible deep-well, motor driven pump. Here the PM cost estimation graphs are notapplicable and detail computations must be used. Basic charges are as follows:
1. In each case, the pump and drive can be bought and installed for approximately $25,000. If thepump should break down, the repair charges will be approximately $5000. A $2000 downtime charge isassessed for any unscheduled repairs. Scheduled repairs and overhauls cost the same as unscheduledrepairs, but can be performed on weekends for $1000 (overtime plus other expenses).
2. Full PM and associated PM inspections are performed at a cost of $300/year with a $75 increaseevery 5 years because of system aging. Nominal PM and PM inspections can be performed at $120/yearwithout increase.
Assumptions
1. Either system removal and sales cost always equal salvage return, or salvage is not a factor.2. Interest is constant at 10 percent; future purchase inflation is balanced by money charges.3. The system will last for at least 20 years with full PM services, experiencing only one overhaul
in the last 10 years of its projected life (Case 1).4. The system will last for at least 15 years with nominal PM (inspections) and one major overhaul
(Case 2).5. The system will last for at least 10 years with no PM and one breakdown (Case 3).
14

Solution
Computations of Appendix D provide the folowir results:
CASE 1: Full PM, 20-year life, a 20-year study period.0 5 10 15 20
25K repair (5K) removaldowntime (2K)
PM @ $300/yr with $75/yr increments every 5 years.
Initial Outlay: $25,000Present Worth (PM): 3,153Present Worth (Overhaul):TOTAL $29,828
CASE 2: Nominal PM, 15-year life with a 5-year prorated replacement, a 20-year study period.0 5 10 15 20
25K overhaul (5K) + allocated costs of unitovertime (1K) replacement & future overhaul
(13.3K)PM (inspections) @ $120/yr for 20 years.
Initial Outlay: $25,000Present Worth (PM): 1,022Present Worth (Overhaul): 2,799PW(13.3K):TOTAL $32,005
CASE 3: No PM, 10-yr life with replacement, a 20-yr study period.0 5 10 15 20
25K repair (5K) + replacement (32.5K) repair (5K) + removaldowntime (2K) + overtime (1.0K) downtime (2K)
Initial Outlay: $25,000Present Worth (Repair 1): 4,345Present Worth (Replacement): 12,916Present Worth (Repair 2):' 1.676TOTAL $43,937
15

4 THE VALUE ASSESSMENT METHOD
The PM Value Assessment Method as described in this chapter can be used to justify specific PMactivities and/or to determine the least damaging workload deletions under mandated budget cuts. Itallows a prompt response to general or specific PM inquiries. The relative values of PM activities are notfixed and can change with DEH redirection, with modifications to or the phaseout of supported systems,and with changes in the needs of the installation. The dynamic methods indicated are well within thecapabilities of commercially available data base packages. Furthermore, because the same data base willbe used and updated with inspector and PM technician daily reports, the technical and cost data willalways be current.
Ordered PM Listings
To be successful, the PM lists must be generated and applied according to locally determined valuesand constraints. When local PM management appraises the PM workload, they can make adjustments forthe many influences and factors specific to the installation.
Ordered PM Category List
The basic list in the Value Assessment Method is the Ordered PM Category List, which groups allPM categories into four priority classes:
1. Mission and safety (M/S) PM categories are MUST,2. Non-M/S categories that are functionally essential to base operations are REQUIRED,3. Non-M/S categories that are not essential but contribute to functional and efficient base operations
are NEEDED, and4. Other PM categories are MARGINAL.
General PM List
The General PM List potentially includes systems/units from all PM categories, and by implication,all of the associated PM tasks. This list is grouped in the order of Table 1, and is built up as follows:
1. The associated systems/equipment supported under each category or unit are identified and listed,2. All PM tasks associated with each unit (belonging to a parent system in a specific PM category)
are then included, and3. Priority and cost-effectiveness are then included as attributes of each PM task.
Preferred PM Task List
One spinoff from the General PM List is a Preferred PM Task List, showing an absolute priorityladder for every PM task performed at the installation. The Preferred PM Task List is generated byreordering tasks on the General PM List. For tasks at the same level, use their cost benefit balance andthen the level of the parent category to determine their order. In the unlikely event that two tasks havethe same cost-effectiveness and parent level, use decreasing assignable workhours to determine the order.
16

For a completed Preferred PM task List, every PM Task will have a unique position or sequence number
which becomes a part of its label.
Preferred PM Category and Task List
Another spinoff is a Preferred PM Category and Task List. This list is identical to the General PMList except that the PM tasks are grouped under a parent (or shop) category in order of the sequencenumber on the Preferred PM Task List. It can be generated as a modification of the General PM List ofAppendix A for the convenience of PM management planning.
Processing the General PM List
The :ontinuing development and upgrading of the General PM List is fundamental to the ValueAssessment Method. If the spinoff reports are to be accurate, the General PM List should be on line toan active PM data base.
1. For each PM task applied to a unit on the General PM List, determine the standard craft-hours, theequipment and material charges involved, and the estimated magnitude of the task's cost-effectiveness.The first two are obtained according to standard DEH practices and the last by procedures of Chapter 3.
2. Develop and record a "priority label" for each PM task as follows:a. Determine if the PM task is MUST:- it is feasible to perform.- it is essential to maintaining the unit.- the unit is essential to a MUST PM Category.
b. Determine if the PM task is REQUIRED:- it is feasible to perform.- it is cost-effective to perform.- it is essential/important to maintaining the unit.- the unit is essential/important to a REQUIRED/MUST PM Category.
c. Determine if the PM task is NEEDED:- it is as in b., but it is marginally cost-effective.
(OR)- it is feasible.- it is cost-effective.- it is important/helpful in maintaining the unit.- the unit is important/contributory/helpful to a NEEDED/REQUIRED/MUST PM Category.
d. Determine if the PM task is MARGINAL:- it is as in b., but it is difficult to perform.
(OR)- the unit is in a REQUIRED Category; PM Task is feasible, but is marginally cost effective.
(OR)- it is feasible.- it is cost effective- the unit is important/contributory to a NEEDED/REQUIRED PM Category.
Even using an automated system, it is still necessary to understand the above logic in ordt.r to haveconfidence in the labeling of the PM tasks.
17

Example
Problem
Develop a Preferred PM Task List.
Assumptions
Assume that a particular installation is supported by a DEH with a PM Shop that has an establishedexpertise in air compressors/blowers and air conditioners. All other PM is performed by other shops oris contracted. Also assume that maintenance management wishes to create an ordered list of the PM taskson the performance roster of this PM Shop. The PM tasks are taken from the General PM List previouslydeveloped for the installation. (The list is similar to that provided in Appendix A.)
Procedure
If the PM Task List is created manually, an interim list of applicable PM jobs or tasks is taken fromthe General PM List, and left in the same order. Further, if the interim list is annotated to assess each PMtask according to the evaluation system previously outlined, a MUST, REQUIRED, NEEDED, orMARGINAL rating for each job/task in the PM Shop can be developed. Table 3 provides the completeinterim list for the PM Shop.
CAUTION: Table 3 does not imply scheduling preferences. It reflects only the relative value of thePM job/tasks to the maintenance mission. The process does not judge retention of the unit, but the valueof the PM supporting the unit. Cost effectiveness is not a factor in determining a MUST label for a PMtask, but it is an important factor for all lesser labels.
By grouping tasks under their appropriate ratings in the sequence that they are processed, a PreferredPM Task List for the PM Shop will be obtained (Table 4). This process can be repeated to get the PMactivities ordered to the subtask level, if needed.
Automated Analytical Support
The Value Assessment Method can be programmed into a total PM Management System that canoutput various budgetary products. To identify the effect of budgetary reductions on PM, equivalent PMworkhours allowed by the'new budget can be determined. The workhours are then summed top-to-bottomin the PM Task List until the materials and personnel charges are exhausted. The "drop line" for theproposed budget is then drawn at that point, and the criticality of the reduction may be assessed.
An acceptable PM management software system will generate needed PM operations and taskevaluation reports. A PM Task Justification report will justify a particular PM task according to theperformance history for the task/unit. It will include PM Task labeling and a cost-effectivenesscomputation. A PM Program/Category Justification report justifies the entire PM program or a PMcategory. The sum of the cost benefits are determined for all PM categories (from each PM task makingup the category), and these category sums are then summed for the total PM Program.
18

Table 3
Interim PM Task Preference List
Category/Unit Label
A. HOSPITALS Not Available
B. COMMAND AND CONTROL FACILITIES
3. ENVIRONMENTAL CONTROL. MISSION AREASb. Humidifiers MUSTc. HVAC Systems MUST
C. G/P PLANTS
1. Steam Plant (SP)b. Forced Air Blowers (FAB)(for boiler furnace) MUST- blower unit MUST- duct/injection system MUST
3. Sewage Plantb. Blower Sys, Grit Area MARGINALc. Blowers, Sludge
and Scum Rooms NEEDEDf. Compressed AirSupply System (CAS) REQUIRED- air compressor REQUIRED- storage tank and distr REQUIRED
D. M/D CLINICS
1. Emergency/Patient Room Systemsb. Pressurized Gas Systems MUST
E. UTIITY DISTRIBUTION SYSTEMSNone
F. FIRE AND SECURITY PROTECTION
N/A
G. COMMISSARY FACIIrIES
1. Cold Storage Planta. Room/Locker Refrigeration Systems MUST
2. Equipment and Appliancesa. Kitchen Equipment- hear/smoke vents REQUIRED- ice cream makers NEEDEDb. Ice Machine NEEDEDc. Refrigerators/Freezers NEEDED- reach-in REQUIRED- walk-in REQUIREDd. Air Dryer Equipment NEEDED
19

Table 3 (Cont'd)
Category/Unit Label
H. POL/VEHICLE CENTERS
1. POL Centera. Air Compressors NEEDED
2. Vehicle Centera. Air Compressors REQUIRED
1. SERVICE BUILDINGS (SBs)
2. SB Componentsb. Roof/Ceiling Components-ventilators and ducts NEEDED
3. SB Utilitiesb. SB Appliances- AC REQUIRED- Ice Machines MARGINAL- Refrigeration Equipment REQUIRED
J. BUILDINGS, QUARTERS, AND HOUSING
3.Habitability Systemsa. Air Conditioners REQUIRED- AC. package NEEDED- AC, window NEEDED
c. Appliances- ice machines MARGINAL- refrigerators REQUIRED
Table 4
Sample Preferred PM Task List for an Example pm Shop
MUST REQUIRED NEEDED MARGINAL
B.3.c: C.3. C.3.c. C.3.b:HVAC System CAS System Blowers. Sludge Blowers, Grit Area
and scumn
C.l.b: H.2.a.' G.2.a:G2aFAB System Vehic Ctr-Air Compr Kitch Equip-Ice KEq-vents
Creamn Makers (not cost-effective)
G.1.a: Y.3.b: G.2.c: 1.3.b:Room/Locker SB Appi-Air Cond KEq-refr/frz Ice MachinesRefig Systems
Hab Syst-Air Cond POL-Air Compr Ice Machines
J.3.c: 1.2.b:Hab Syst-Refrigerawor Roof-Vents/Ducts
20

5 CONCLUSIONS AND RECOMMENDATION
Conclusions
The Value Assessment Method developed during this research can help maintenance managers atmilitary installations determine the relative value and cost-effectiveness of PM activities. To use the ValueAssessment Method, managers need maintenance and failure-rate data to define trends nceded to cstimatechanges in cost relationships. Moreover, managers need to establish ?M category and task lists, definescheduling demands, and collect a maintenance history for each maintained unit. Because the incidenceof failure relates to the level and the cost of PM, managers can need create cost benefit g:aphs that predictthe time of cost-effective unit replacement.
Recommendation
It is recommended that the automation concept proposed by this report be developed into aprototype program and, if successful, be finalized for general distributio to DEHs.
21

APPENDIX A:
A GENERAL LIST OF PM CANDIDATES FOR TYPICAL ARMY INSTALLATIONS
C - Fort McCoy S - Impacts OSHA regulationsG - Fort GillemK - Fort McClellanL - Fort Lee MIS - Impacts base missionM - Fort McPherson0 -Fort Ord
E - PM value based on cost savings
I - InspectionI&A - Inspect & Test/Adjust/ServiceI&R - Inspect & Repair/Replaced/w/r - daily/weekly/monthlyq/ba/an - quarterly/biannually/annually
For example: w, I&R (M) would mean a weekly inspection at Fort McPherson with repair orreplacement.
A. HOSPITALS
Not supplid.
B. INSTALLATION-MISSION SUPPORT
1. COMMAND & CONTROL FACILITIES
a. BUILDING UTILITIES(1) Fail-Safe Support Systems MIS
- C3 Systems support- communications center(s) power supplies- compui,.r/ADP center(s) pover supplies
(2) Electrical Ba&k-up Systems MIS- aux. lighting, m I (K)- emerg elect generators,
weekly maintenance (K)
b. BUILDING SECURITY(1) Entry Control MIS
- unauthorized-entry alarms- remote control door-lock system-combination door-locks
22

(2) Monitor System(s) MIS- video monitc- panel(s)- video cameras & az motors- power supply & cabling
c. ENVIRONMENTAL CONTROL, MISSION AREAS(1) Heating Sources MIS
- Furnace (L)-- gas fired-- oil fired-- oil/gas fired
- Central Steam Supply(2) Humidifiers (PM humidifiers (L) E(3) High Volume Air Conditioners (HVAC) MIS/S
- Startup/Shutdown and PM of AC Plants, (M) and (K)- Compressors- Air handlers S
-- 50T (M) TO > l0OT, an/q, I&R (M)-- Fan coil unit, I&R (M) S
- Evaporative Condensers, I&A (M)-- necessary chemicals, I (G) S
d. BUILDING ACCESSORIES(1) ADP/Computei Auxiliary System MIS(2) Elevators & Lifts - QA of contracted servicing (L) S(3) Water Heaters E/S(4) Habitability Systems E
e. BUILDING STRUCTURE S(1) Foundations(2) Basics
Walls/Columns- Floors, ceilings, stairs- Roof & roof-support structure
C. UTILITY GENERATING PLANTS
1. STEAM PLANTS
a. TYPES(1) Power Plant, HP Boilers (160 to 208),-PM for IP steam plants (M) S- assist in contractor's inspection (L)
(2) Heating Plant, LP Boilers- PM performed for heating plants (L)- PM performed for 185 LPB systems (K)
23

b. OPERATING COMPONENTS(1) Steam Generation Control Panel S
- flow/quality data, water to steam, I&A- funace control, adj air/fuel mix, I
(2' Automatic Control System E/S- measurements feedback, I- adaptive control unit(s), I&A- actuators, I
(3) Furnace Forced Air Systems E/S- blower controls, I&A- blower units, I
(4) Fuma.e Fuel-Oil Supply System E/S- fuel-oil pump(s), I&R (L)- fuel-oil storage
(5) Furnace Firebox E/V- PM/clean furnace(s) (K)
(6) Feed Water System E/S- hot water storage tanks, I (M)- heat exchangers, I&R (M)- oil/water separator- feed water additive system- feed water pumps- on-line deaerator
(7) Boiler Drum Unit E/S- firebox/tubes- pressure regulators- relief-valves/blow-down systems- monitoring systems
(8) Steam/Water Lines and Pits E- PM of steam mains & pits (K)- PM of high temp water lines & pits (K)
(9) Evaporative Condensers/water, I (G) E(10) Condensate/Sump Pumps, I&R (M) E
- inspections (lube levels; bearings; seals)- line valves periodic rotation- clean strainers/filters- check alignments, gear box operations- driver system checkout
(11) Cooling Towers E(12) Furnace Effluent Cc.,trols S
- particle separators, I- bags, filters, etc., I
2. WATER TREATMENT PLANT (WTP)PM PROCEDURE FOR A WTP (M) (K)
a. AUTOMATED WTP CONTROL SYSTEM E/S[maintenance of ACS (L)I
(1) control panel(2) automated system(3) actuators
24

b. DEEP WELL PUMP SYSTEM(1) Pump Housing(s) E
- check vents (0)- check gravel pack (0)- paint metal housing (if needed)
(2) Deep Well Pump (DWP) MIS- check pump gaskets/seals (if accessible)- grease the check-valve (0)- check/lube flow meters (0)
(3) DWP Engine Operation, tested under load for MIS- engine fuel levels- water drawdown levels (0)- safe pump yields (0)
(4) Motor Driven Blower E- check belt tension (0)- check pulley alignment (0)- check elec motor oil level (0)- lube motor bearings (0)- paint exposed metal parts
c. BOOSTER PUMP SYSTEM(1) Booster Pump (BP) MIS
- inspections (oil levels; bearings; seals)- lube BP bearings, couplings, check-valves- periodic rotation of manifold/line valves- clean strainers/filters
(2) BP Driv,.. MIS- check alignments, gear box operations- driver checkout, lube motor bearings
(3) BP Flow and Flow-Control Values E- clean & lube pilot and altitude valves (0)- operate gate valves (0)- lube gate valve stem- replace valve packing as needed (0)
(4) BP Instrumentation E/S- clean/service/calibrate water meters
and recorders (0)
d. WATER PROCESSING SYSTEMS(1) Water Filters, I&A (G) ' S(2) Water Chlorination System S
- check area vents (0)- clean cabinets/working parts (0)- clean strainer, inspect ejector (0)- service Cl cylinders (L)
(3) Aerators, Spray Ponds, etc. S
e. FLOW MANAGEMENT/CONTROL(1) Control Panel E(2) Pneumatic Control System E(3) Remote Valve Actuators E
25

f. INTERNAL DISTRIBUTION & STORAGE SYSTEM(1) Flow Valves E
- operate gate and butterfly valves- lube gate valve stem
(2) Special Valves E- - clean trap and strainer (auto diapm valve)
- clean and lube pilot and altitude valves- check float valves
3. ELECTRICAL POWER SUPPLY(PM for power plant equipment (L6))
a. SOURCE(1) Standby/Emergency Generators, I&A (M) MIS(2) Power Generation Control Systems S
- electric control panels, I&A (M)- electronic sensors (M)- pneumatic actuators/switches, I&A (M)
(3) Power Plant Equipment E- clean/test circuit breakers (L)
b. DISTRIBUTION SYSTEMS (DS)(1) Main Substation MIS/S
- inspection daily (K)(2) Substations, I (G) S
- overhead distribution, I (M)- transformers [inspect PCB transformers/capacitors (L) and (K)] S
(3) Overhead DS (Poles, etc), I (M) S- insulators (annual cleaning)- transformer, pole mtd, I (M)- transformer, pad mtd, semiannually
(4) Underground DS, I&R (M) S- concrete cableways- buried cables
D. EXTERNAL UTIITY-DISTRIBUTION SYSTEMS
1. WATERNSTEAM DISTRIBUTION MISPM of Water Distribution System (K)
a. WATER PRESSURIZATION SYSTEM(1) Booster/Pressurization Pumps E
(As in C2c, WTP Section).(2) Water Reservoir/Tower System (WR/WT) E/S
- check general condition & structure- operate WR/WT float and flow valves- check ladder, sway-bracing, roof hatch-locks,
and structural soundness
26

b. DISTRIBUTION LINES/VALVES(1) Hot/Cold Water Circulation System, I (M) E(2) Water Lines, I (M) & (G) E/S
- valves and faucets, I&R (L)- X-connections, I&R (L).- check flow meters
(3) Steam Lines, I (M) S
2. NATURAL GAS MIS
a. NATURAL GAS LINES/VALVES S(1) servicing of NG valves, an I&R (K)(2) check gate valves and manifold valves(3) check flow meters
b. NATURAL GAS STORAGE TANKS S(1) check P/T measurements(2) check volume indicators
3. ELECTRICAL SYSTEMS (EXTERNAL) MIS
a. INSULATORS AND TRANSFORMERS, POLE MTD, I&R (M) E/S
b. STREET AND AREA LIGHTING, I&R S
4. TELEPHONE LINKS(Contracted upkeep)
E. BASE SAFETY/PROTECTION SYSTEMS
1. FIRE PROTECTION MIS
a. FIRE HOUSES E/S(1) Compressors, m/an, I&R (M)(2) Vehicle Support(3) Habitability Systems
b. BASE FIRE SUPPORT SYSTEMS E/S(1) Fire Truck Equipment(2) Fire Alarm Systems, I (G)(3) Fire Hydrants, I
2. POLICE PROTECTION(Responsibility not reported.)
27

F. SEWAGE SYSTEM
1. SEWAGE PROCESSING PLANT MISPM OF SEWAGE SYSTEM (K)
a. "BARMINUTOR" (BM) E/S(Bar Screen and Comminutor)
(1) BM Tubes- lube tube seals (0)
(2) BM Cutter/Shear-Bar System- check mounting screws (0)
(3) Reducer Gear- check oil levels (0)- change gear-housing oil (0)
(4) Counterweight (Cw)- lube Cw shafts (0)- oil Cw chains and sprockets (O)
(5) Bar Screens- clean and insoec: screens (0)
b. GRIT CAPTURE SYSTEM E/S(1) Blower(s) S
- check belt alignment (0)- check belt tension and wear (0)
(2) Main Grit Pump (MPG) E- MGP bearings and packing gland, clean/lube- MGP pulley alignment, I&A (0)- MGP belt tension and wear, I&A (0)
(3) Grit Sump Pump (SPG) E- clean SPG pit and the SPG (0)- clean the SPG check valve (0)
(4) Grit Gate Valves (GVG) E- operate GVGs (0)- lube GVG rising stem threads- oil GVG packing- change packing (if necessary)
(5) All Metal Surfaces E- paint as needed.
c. SEWAGE PROCESS SYSTEMS [PRIMARY (PR!) & SECONDARY (SEC)](I) Clarifiers (PRI & SEC) E/S
- Drive gear reduction unit (GRU)-- verify GRU oil levels (0)-- grease GRU bearings (0)
- Scum trough (PRI ONLY)-- lube scum trough positioner (0)
- Turntable and parshall flume (SEC ONLY)-- change oil in turntable (0)-- wash down parshall flume (0)
28

- Clarifier tank (CLT)-- drain, flush, and inspect (0)-- CLT equipment, I&A (0)
- Sluice gate (SGC)adjust SGC clearance (0)
-- perform SGC operations test (0)-- lube fittings and riser stem (0)
(2) Sludge/Scum Processing System E/S- Sludge pump room - paint metal surfaces (0)- Blowers - adjust belt tension and pulley alignment (0)- Main sludge pump (MPS)
-- inspect/grease MPS packing glands (0)-- change MIPS bearing oil (0)-- lube motor bearings (0)
- Sludge dewatering pump (DPS)-- lube DPS bearings (0)
- Sludge sump pump (SPS)-- clean SPS pit, pump and control valves (0)-- rotate plug valves (0)-- change SPS bearing oil (0)
- Chain hoist - inspect and lube (0)(3) Scum Pump Room (PRI ONLY) E/S
- Scum pump (SCP)-- grease SCP packing glands (0)-- inspect SCP oil levels (0)-- change SCP oil (0)-- flush/lube motor bearings (0)
- Scum sump pump (SPSC)-- clean SPSC pit, pump and CV (0)-- rotate plug valves (0)-- flush/lube motor bearings (0)
d. FILTRATION AND SCREENING SYSTEMS(1) Biofilters E/S
- check oil level; replace oil- check amount of condensation- adjust distributor arms- paint metal surfaces
(2) Microscreen System (MS) E/S- MS control system
-- inspect all controls (0)-- inspect solenoid valves (0)-- inspect all control valves (0)
- Pilot valve strainer (PVS) and screen media (SM)-- clean PVS and SM (0)-- inspect pump screens (0)
-Header-- flush the header (0)
- Gear reducer (GR)-- check/change GR oil (0)-- repack GR bearings (0)-- replace grid gasket foam (0)
29

- MS drum (D)-- inspect D seals/bearings (0)-- lube supporting wheels (0)-- inspect wheel tracks (0)-- check chain slack (0)-- inspect operating spray nozzles (0)
- MS chambers, mixers, and holding tanks (T)-- inspect MS tanks and Cl-contact chambers
for solids, flush as needed (0)-- inspect flash mixers (0)-- drain basin; flush basin/screens (0)
- MS gate valves (GVM)-- operate GVM (0)-- lube rising stem threads (0)-- lube GVM packing (0)-- replace packing as needed (0)
e. RECIRCULATION SYSTEMS S(1) Recirculation Pump (RP) E/S
- operate RP pressure switch (0)- change RP bearing oil (0)- inspect RP check valve (0)- change motor bearing oil (0)
(2) Butterfly Valves E- operate and inspect (0)
(3) Sluice Gate- operations test (0)
f. COMPRESSED AIR SUPPLY(1) Air Compressor (AC) E/S(2) Intake System E
- check/clean air cleaner(3) Output Supply E/S
- check the pressure regulator of the AC(4) Motor Drive E
- flush/lube motor bearings (0)
2. SEWAGE COLLECTION SYSTEM MIS
a. EXTERNAL SEWAGE LINES, I&R (M) (G) S
b. SEPTIC TANK SYSTEMS, S(Not in survey installations)
G. MEDICAL/DENTAL CLINICS
1. EMERGENCYPATIENT ROOM FACILITIES E/S
a. ELECTRICAL SYSTEMS(1) Distribution/Control Panels(2) Surge Protection Systems(3) Emergency Generators
30

b. PRESSURIZED GAS SYSTEMS S(1) Medical Oxygen(2) Natural Gas (Heating)(3) Pneumatic Systems
- Control panel- - Air pressurization source
- Air pumps- Vacuum pumps
c. ENVIRONMENTAL SYSTEMS S
(1) Air Conditioning
2. LOCAL LABORATORY SUPPORT
a. MEDICAL SUPPLIES REFRIGERATION S
H. BASE SERVICES
1. COMMISSARY FACILITIES
a. COLD STORAGE PLANT S(1) Cold Storage Rooms/Lockers S-
- Refrigeration systems-- liquid chillers, I-- monitor systems, I-- startup/shutdown operations
b. COMMISSARY EQUIPMENT AND APPLIANCES(1) Kitchen Equipment, I (M) E
- electric mixers/choppers/potato peelers- steam kettles and pressure cookers- natural gas, microwave and convection ovens- electric griddles/skillets/toasters- deep fat fryers, I (L)- ice cream makers- dishwashers
(2) Ice Machines, I&R (M) E(3) Refrigerators/Freezers, I&R (M) E/S
- reach-in- walk-in
(4) Air Compressors, Dryer Equipment, I&R (M) E/S(5) Trash Compactor, I&R (G) E(6) Internal Electric Motor Starters, I&R (M) E
2. POL/VEHICLE CENTERS
a. LIQUID FUEL LOAD/UNLOAD SYSTEM S(1) control panel/flow meters, I(2) fuel pump(s), I&R (G)(3) lines/valves/nozzles, I(4) underground storage tanks, I (M)(5) vehicle scales, I
31

b. LUBE/FUEL DRUM HANDLING E(1) drum scales, I(2) hand pump(s), I(3) drum cleaning system, I
c. AIR COMPRESSORS (M) S
d. SPILL CLEANUP EQUIPMENT S
e. WASTE DISPOSAL SYSTEM S
3. SERVICE BUILDINGS
a. BUILDING STRUCTURE(1) Foundations S(2) Basics E/S
- Walls/columns- Floors, ceilings, stairs- Roof and roof-support structure
b. BUILDING COMPONENTS(1) Doors, Windows, and Walls E/S
- Entrance/interior doors (secured and unsecured)-- wood/metal framed, I (M)
- Automatic doors- Fire doors S
-- sliding, insulated-- overhead, roll-up, I&A (M)
- Walls and partitions (permanent and temporary)- Glazing
(2) Floor Covers/Finishes and Ceilings E(3) Roof/Ceiling Components E
- Roofing type-- built-up-- tiled/shingled
- Gutters and downspouts, I (M)- Ventilators and ducts
-- powered ventilators, I (M)(4) Basement Systems E
c. SERVICE BUILDING UTILITIES(I) Interior Distribution S
- Pipelinestvalves-- hot/cold water circulation system, I (M)-- water lines, I&A (M) and (G)-- sprinkler systems, I (M)-- steam lines, I&A (M)-- plumbing system, I&A (M) and (G)-- gas lines, I&A (M)
- Meters, gas/water/electric (reading), I (W)
32

(2) Service Building Appliances E/S- air conditioners
-- package units, I&R (M) and (G)-- window units, I&A (M)
- refrigeration systems-- ice machines, I&R (M)-- refrigeration equip, I&R (M)
- electric motors-- internal electric motor starters, I&R (M)
- fire alarms, i (M) S
I. DOMICILE/HOUSING SUPPORT
1. BUILDING COMPONENTS
a. STRUCTURAL
b. BUILDING ACCESSORIES(1) Elevators and Lifts S
- QA of contracted servicing (L)(2) Secure Door-Lock Systems S(3) Habitability Systems E-(4) Fire Prevention Systems S
-fire alarms, I (M)-sprinkler systems, I (M)
(5) Ventilators, Powered, I&A (M) E
2. HABITABILITY SYSTEMS
a. AIR CONDITIONERS(1) Package Units, I&R (M) and (G) S(2) Window Units, I&R (M) E
b. FURNACES/HEATERS(1) Gas-Fired Furnaces, I&A (M) S(2) Gas-Fired Heaters, I&A (G) S
- GFH startup/shutdown operations and PM (M)- heating equipment, I&R (G)
(3) Gas/Oil-Fired Heaters, I&A (M) S(4) Steam/Hot-Water Heaters
- internal steam/HW lines and radiators, I (M)
c. APPLIANCES(1) Ice Machines, I&R (M) E(2) Refrigeration EQ/Comp, I&R (M) E(3) Trash Compactor, I&R (G) E
33

APPENDIX B:
SAMPLE MAINTENANCE RESOURCE LEVELS NEEDED AT FORT TYPICAL
SIZE/QUANTITY OF PM SUPPORTED SYSTEMS OR UNITS
Water Supply System:
Water well pump stations 7 Each
Water distribution system/stations/etc. 490,082 LF- sprinkler systems 43 Bldgs
Sanitary System:
Sewer lines 309,739 LF
Exterior Electric:
Main substation I (daily)
Electric lines 37 areas or166 miles (semi-an)
PCB transf/capacitors 197 (quarterly)
Other transformers 17 areas (semi-an)
Lightning protection 17 post areas(semi-an)
Steamfitting & Plumbing:
Natural gas valves, servicing & lubricating 920 valves (yearly)
Boiler systems PM, inspect & test 185 systems/plants
Steam mains and pits 51,866 LF
High temp water lines & pits 15,300 LF
Furnace PM 248 furnaces
Bldg heating equipment PM 386 Bldgs
FH heating, start-up/shut-off PM 571 Qtrs (annual)
34

HVAC/Refrigeration:
Bldg A/C units 806 Systems (monthly)
A/C start-up & PM 571 Sys - FH (annual)184 Plants- nonFH (ann)
Refrigeration eq- water coolers 399 units (quarterly)- walk-in reefers 48 Sys (quarterly)
Interior Electric:
Emergency generators: 13 generators (weekly)
Auxiliary lighting: 15 Bldg (monthly)80 Bldg (annual)
Electrical panels/safety switches 125 Bldgs (annual)
Buildings & Structures:
Medical facilities PM 226K Sq Ft(quarterly)
FH Quarters PM 860K Sq Ft.(quarterly)
Troop housing PM 2,166K Sq Ft.(quarterly)
Other bldgs/structures PM 3,300K Sq Ft(120-day cycle)
Reserve centers PM 431K Sq Ft(semi-annual)
Kitchen & Laundry Equipment:
Dining room support 20 Facilities(monthly)
Bldg kitchen eq- refrigerators 2166 ref units- ranges/stoves 696 gas/192 elect
(quarterly)
Barracks laundries 499 washers/505 dryers(monthly)
35

APPENDIX C:
PACER PROGRAM PERFORMANCE OBJECTIVES
OBJECTIVE 1: DEVELOP AUTOMATED COST ANALYSIS/REPORTING SvSTEM.
An Economic Analysis Program is needed by the Health Care Support Division (HCSD) of the Directorateof Engineering and Housing (DEH) at Madigan Army Medical Center (MAMC) for managing maintenanceand preventive maintenance (PM) costs, and for performing cost-effectiveness studies of the developingPM Program. This program is to be installed on microcomputers with MAXIMO Mai-tenanceManagement Program; it is to work with MAXLMO and provide input/output to the general HCSD database.
An evaluation of the transition in HCSD needs from preparation, startup, shakedown and operationsmodification to the eventual steady-state of firm operations indicates an Economic Analysis Program withthe following capabilities:
1. Provides a method of determining the relative cost benefit of PM for installed equipment, andincorporates the capacity to store data for identifying improvement trends and for developing PMassignment rankings. (Cost benefit is defined here, initially, as the HCSD operations cost fo- ,oportinga unit of equipment with a complete PM package compared to the operations cost when no - portingthe unit with anything but necessary repair and overhaul, thus incurring a loss of service penalt, ior everybreakdown.)
2 Facilitates and encourages the collection of PM experience and available equipment statistics. Thesystem identifies and accepts relevant inputs that build on the PM knowledge base.
3. Allows variation in computation methods. There is wide site-flexibility in defining and/or addingterms to needed computations. For example, for greater simplicity, HCSD overhead is not used in theAllocated Maintenance Cost (AMC) discussions to follow, but it easily could be included.
4. Performs economic analyses or makes best estimates based on the information and quality of dataavailable; files these computations on request, and updates data base information from these files whenthe user considers this appropriate. From data base and user supplied information, : tot?. PM Programassessment report will be generated on request.
OBJECTIVE 2: AUTOMATE THE PREFERENTIAL ORDERING OF PM TASKS.
List (order) MAMC equipment according to relative cost benefit (CB) ratings for the ?M categories ofHCSD-provided support. (Normally, operator-performed PM is not considered a part of this support.)
As a First Approximation, assume that the PM Program by HCSD does not allow unexpected dropouts,is free of major overhauls for the duration of the study, and is costed at a constant rate. Assume also thatfailure occurs at a known rate if the PM for a unit is not applied by the HCSD User, and that a TOTALCOST to the HCSD, the MAMC, and the Department of the Army (DA) of each failure car be estimated.
I. Net Present Value (NPV) Cost of a maintenance program (as expended over the duration of theeconomic study) can be allocated for the particular unit being evaluated. This is the AllocatedMaintenance Cost of the unit or AMC (UNIT) and is defined as:
AMC(UNIT) = PM Cost + Maintenance Cost + On-line Repair Cost
36

2. The Penalty for not performing AMC(UNIT) is expressed 'as a Loss Of Service (LOS) charge each
time a failure occurs:
a. The LOS fcr a single unit failure is defined as:
LOS(UNIT-FAILURE) = L&E for Removal/Overhaul/Replacement + Use-Cost of Alt. Systems +Allocated Dropout/Disruption Cost to MAMC Mission + DEH Loss of Goodwill Cost (damage that carresult in lessened cooperation and operations constraints).
b. The NPV of the Aggregated I. oss of Service (ALOS) for all failures of the unit over the timep-iod of the study (N years) is defined as the ALOS(UNIT).
3. For the portion of equipment-unit operations cost (EUC) that varies with maintenance level, it maybe shown that EUC = AMC(UNT) + LOS(UNTT). If this equation is written for a PM-shop level ofsupport (w/PM) and an operator-only PM support (w/o PM), we have:
a. EUC(w/PM) = AMC(UMNT w/PM) + ALOS(UNIT w/PM)
b. EUC(w/o PM) = AMC(UNIT w/o PM) + ALOS(UNIT w/o PM)
4. A present value cost benefit for performing PM on this Unit is based on wh,, - will not be spentbecause of the PM or maintenance perfcrm J by the PM shop. This may be stated as.
Cost Benefit of Unit PM =[Total Operations Costs w/o PM(UNIT)] - [Total Operations Costs w/PM(UNIT)] = EUC(w/oPM) - EUC(w/PM).
It is reasonable to assume that a quality PM program will be able to better predict failures of the exampleunit and that failures will occur less frequently than under the minimal PM condition. Hence, LOS(UNITw/PM) << LOS(UNIT w/o PM" and the NPV of this LOS will become very small as the mean timebetween failure, or MTBF(UNIT w/PM) approaches N years (the study timit).
For evaluating the cost benefit for the example unit [CB(UNIT)] as a first approximation it may beassumed that the NPV of the AMC(UNIT w/o PM) and LOS(UNIT %/PM) are very small and couldcancel each other to leave:
CB(UNiT) _ [ALOS(UNIT w/o PM) + (negligible)] - [AMC(UNIT w/PM) + (negligible)].
Simiiarly, to determine the va.ue of the complete maintenance program for the unit, compare the cost ofComplete Support ,o the Cos. of Only Failure Response:
CB(JN _ At OS(UNIT) - AMC(UNIT).
RELATIVE COST BENEFITS FOR UNITS IN A GIVEN CATEGORY CAN BE DEVELOPED INTHI, MANNER FOR TREND AND RANKING PURPOSES.
37

5. PACER graphs this estimat- n as follows:
Lim EUC (w/o PM) z ALOS (w/o PM)UNIT NPV as AMC - 0
LOS (w/PM)Lim EUC (w/PM) 2AMC (w/PM',
LOS (w/o PM) as MTBF (w/PM) - N
UNIT Cost . -EUC (w/o PM)Benefit A'..---MC (w/o PM)
Appoxmat - L- OS (w/o PM)ApproxCB (UNIT) AMC (UNIT w/PM):
Allocated Maintenance Unit-Cost,
I Complete PM/Maintenance Program
AMC (UNI fw/o PM)
[ A (w/PM) Oincreasing MTBFMTBF MTBFw/o PM w/PM
Figure Bi. Correlation of the Net Present Worth of PM costs and LOS penalties.
OBJECTIVE 3: ASSIST ESTIMATION AND SCREENING OF COST DAT ,.
Provide guidance to the PACER user in keeping PM, AMC, LOS, , d. MTBF estimates or supplied v llueswithin reasonable bounds.
ASSUMPTIONS"
1. First Approximation assumptions of Objective 2 are also applicable here.
2. The MTBF of any MAMC unit of equipment will not be less than the pe-.od of the manufacturer'swarranty. The MTBF of the unit with PM support will be equal to or greater than the period of the First-Estimation Run; the MTBF of the unit without PM Support will be equal to or less than the period of thisinitial study.
3. For a given MTBF, the LOS(UNIT) less the AMC(UNIT) cannot be greater than the cst of the unit.(If the LOS charge is excessive for a constant PM cost, a standby unit could be purchas.i.)
4. The allocated cost of the PM program in this First Approximation will be evenly distributed overthe period of th- study.
5. Once the HCSD user has become involved in the PACER estimation process, two factors willencourage a steadily improving data base. First, the user will be interested in data that improves his orher estimations. Second, the PACER Program will conveniently screen and accept submitted data baseentries.
38

OBJECTIVE 4: FIRST ESTIMATES OF PM(UNIT) COST BENETIFS.
Apply computer programming techniques to assist in the estimation of a cost benefit for a particular unitusing the reasonable value estimates of Objective 3.
The PACER Program will:
1. Run "what-if" or "for-the-record" relative PM CB Studies only at the equipment unit level(aggregate or system level cost benefit estimates are not recommended).
2. Group unit PM cost benefit entries into three operations or regulation areas, and label these areas;MUST to reflect essential or OSHA/hospital/EPA mandates; REQUIRED to reflect the unit/system supportnecessary to normal operations; and DESIRED to reflect support that facilitates effective operations.
3. Generate a Preferred Equipment List Report by ordering the PM tasks under the three labels of Item2 according to the derived cost-effectiveness of each unit/system listed. This positioning in the HCSDPM Roster identifies the PM task priority by the estimated value of these tasks to the MAMC mission.
4. A selected economic evaluation report can consist of a Preferred Equipment List (Item 3)incorporating summations of the cost benefits of listed PM tasks that have been summed/developed intoa cost-effectiveness rating for the entire HCSD PM program. Also, where the program value of a PM taskis questioned, such reports/listings may be referred to for reevaluation or arguments for retention.
39

APPENDIX D:
COST BENEFIT PRESENT WORTH COMPUTATIONS
FORMULATIONS:
Present Worth, Uniform Series (PWUS) for an amount A in n years @ i interest:
PWUS = A ((l+i)"- 1) = A (PWF)i (l+i) n
Single Present Worth (SPW) for an amount A at a future date, m years hence:
SPW = A/(l +i)
ASSUMPTIONS: Interest i = 0.10
CASE 1:
Initial Cost: $25,000
PM:Years: I - 5: $300/yr PWF(n=5) = 3.791
6- 10: 375/yr11 - 15: 450/yr16 - 20: 525/yr
PW (1-5) = 300(3.791)/(1) = (1,137.0)/1 - $ 1137
PW (6-10) = 375(3.791)/(1.1) = (1421.6)/(1.61) = 882
PW (11-15) = 450(3.791)/(1.1) ° = (1705.85)/(2.59) - 658
PW (16-20) = 525(3.791)/(1.1)" 5 = (1990.0)/(4.18) - 476
PRESENT WORTH OF PM = PW(PM) $ 3153
PW(Overhaul) = 7K/(1.1)" = 7K/(4.18) - $ 1676
INITIAL COST - $25,000
CASE 1 TOTAL CHARGES = $29,828
40

CASE 2:
Initial Cost: $25,000
PM:Years: - - 20: $120/yr PWF(n=20) = 8.514
PW (1-20) = 120(8.514) = $ 1,022
Approximate Allocated Replacement Cost (ARC) @ 15 year mark:
Unit Cost in 15 years = $34,030.PW(O'haul) = 6K(1.1) 8 = 2,800.Repayment Rate (RR) = 36.8K/15 = $ 2,453/yearPWUS (RR) for 5 years = 2,453 (PWF for 5 years)
= 2453(3.791) = $ 9,299.ARC = PWUS(RR) + Removal & Installation Charges;ARC = 9,299. + 4,000 = $ 13,299.
PRESENT WORTH OF PM = PW(1-20) = $ 1022
PW(Overhaul) = 6K/(1.1)8 = 6K/2.144 = 2799
PW(Replacement) = 13.25K/(1.1)' 5
= 13.3K/4.18 = 3184
INITIAL COST = $ 25,000
CASE 2 TOTAL CHARGES = $32,005
CASE 3:
Initial Cost: $25,000
PRESENT WORTH OF PM = PW(PM) = 0
PW(Overhaul) = 7K/(1.1) 5 = 7K/1.61 - $ 4345
PW(Replacement) = 33.5K/(1.1)"'= 33.5K/2.594 = 12,916
PW(Overhaul) = 7K/(1.1)' 5 - 7K/2.39 $ 1676
INITIAL COST = $25,000
CASE 3 TOTAL CHARGES - $43,937
41

USACERL DISTRIBUTION
Chief of Engineers AMC - Dir, Inst., & Svcs. Fort Belvoir. VAATTN: CEHEC-LI-LH (2) ARRADCOM 0"7801 ATTN: CECC-R 22060ATMN: CEHEC-IM-LP (2) ATTN: DRDAR-PSEAIT'rN: CERD-L . Harry Diamond Laboratories 20783 CECRL, A'FN: Library 03755AITN: CEMI ATrN: Library ATrN: Facility EngineerATTN: CEMP-C Natick R&D Center 01760AITN: CEMP-E ATTN: STRNC-DF/DEH CEWES, A1TN: Library 39180A'TTN: CERD Pueblo Army Depot 81008ATTN: CERD-C AMlY: SDSTE-PUI-F NAVFACATTN: CERD-M Redstone Arsenal 35809 ATTN: DivisionOffices (11)ATITN: CERM ATTN: DESMI-KLF ATN: Facilitie Engr Cmd (9)
Rock Island Arsenal 61299 ATTN: Naval Civil Engr Lab 93043 (3)CEHSC ArN: SMCRI-DEH
ATTN: CEHSC-ZC 22060 White Sands Missile Range 88002 Engineering Societies LibraryATTN: CEHSC-FB-S 22060 AIN: Library New York, NY 10017ATTN: CEHSC-F 22060ATTN: CEHSC-FM 22060 DLA AlIN: DLA-WI 22304 National Guard Bureau 20310AlYN: CEHSC-TT-F 22060 Installation DivisionATTN: DET m11 79906 DNA ATTN: NADS 20305
US Government Printing Office 20401USAEA.CA FORSCOM Receiving/Depository Section (2)
FORSCOM Engr, ATTN: Spt DeLUS Army Engr Divisions 15071 Defense Technical Info. Center 22304
ATTN: Library ATTN: DTIC-FAB (2)Europe 09757. HSCHumtville 35807 Fort Ord Hospital FENorth Atlantic 10007 Madigan AMC 136North Central 60605 ATTN: DEH 08/91Pacific Ocean 96858 ATTN: HCSD (2)South Atlantic 30335 Walter Reed AMC 20307South Pacific 94111 ATTN: Facilities EngineSouthwestern 75242
INSCOM - Ch, lind. Div.US Army Europe Vint Hll Farms Station 22186
ODCS/Engineer 09403 ATTN: IAV-DEHATTN: AEAEN-FE Ft Belvoir VA 22060ATTN: AEAEN-ODCS ATMN: Engr & Hag Div
V CorpsATTN: DEH (11) USA AMCCOM 61299
V17 Corps ATTN: AMSMC-RAllN: DEH (15)
21st Support Command Military Dist of WmhiagtonATTN: DEH (12) ATTN: DEI
USASETAF Fort Lesley J. McNair 20319ATTN: AESE-EN-D 09019 Fort Myer m=1I
CamerouStatisi (3) 22314ROK/US Combined Forces Command96301 Military Traffic Mgmt Command
ATTN: EUSA-HHC-CFCdp Bayoem 07002Falls Chm 20315
USA Japan (USARJ) Sunny Point MOT 28461AT"N: DEH-Okinw 96331 Oalld Army Base 94626
ATTN: DCSEN 96343NARADCOM ATTN: DRDNA-F 01760
416th Enginee Command 60623ATTN: Facilities Enghw TARCOM. Fac., Div. 48090
US Military Academy 10996 TRADOCATTN: Facilities Enginee HQ, TRADOC. ATTN: ATEN-DEHATTN: MAEN-A 23651
This publication was reproduced on recycled paper.