the value of automation chapter 5 - blog | isa … · chapter 5 – measuring the value of...
TRANSCRIPT


The Value of Automation:The Best Investment an
Industrial Company Can Make
by Peter G. Martin, Ph.D.

xi
Contents
About the Author ix
Chapter 1 – Expected Value from Automation 1
Chapter 2 – What Is Value across Industrial Organizations? 15Project Engineering, 20Plant Engineering, 21Process Operators, 22Plant Maintenance, 23Management, 24Summary, 25
Chapter 3 – Automation and the Capital Budget Process 27General Capital Projects, 29Automation Projects, 32Modern Accounting Systems, 36Automation Supplier Perspective, 38Conclusion, 42
Chapter 4 – Under-Delivering on the Promise of Automation 43Replacement Automation, 44Inability to Utilize Dormant Capability in Installed Automation Assets, 49Lack of Measures of Automation Performance, 52Market Slowdowns, 54
Chapter 5 – Measuring the Value of Automation 57Cost Accounting and Automation Benefits, 58Project Team Performance Measurements, 62Key Performance Indicators, 63Dynamic Performance Measures, 69Benefits of Comprehensive Real-Time Performance Measurement Systems, 78

xii The Value of Automation – Peter G. Martin, Ph.D.
Chapter 6 – Changing Key Processes 81Project Engineering, 82Replacement Automation, 86Continuous Improvement Programs, 90
Chapter 7 – Continuous Value Improvement through Control 97Automation or Control?, 97Value in Control, 101Talent Is the Key, 102Controlling Efficiency and More, 104Safety Control, 108Environmental Control, 110Asset Control, 110Quality Control, 113Profitability Control, 114
Chapter 8 – Value Improvement through Optimization and Constraint Management 123
Optimization Concepts, 123Optimization Concerns and Limitations, 132Performance Measures and Constraint Analysis, 134
Chapter 9 – Driving Operational Excellence 137Operational Excellence, 137Human Performance Excellence, 142Control Performance Excellence, 146Asset Performance Excellence, 150Safety & Environmental Performance Excellence, 156
Chapter 10 – Expanding the Scope and Value of Automation 165Control Scope Expansion, 166Decision Support Scope Expansion, 180Geographic Scope Expansion, 185Summary, 191
Chapter 11 – Automation: No Better Investment 193Cash Flow Analysis, 194Developing a Value Creation Plan, 201Proving the Value of Engineering, 204No Better Investment, 205
Bibliography 207
Index 217

57
5Measuring the Value of
Automation
As has been discussed, there are multiple reasons that the potential value delivered to
industrial companies from automation solutions has been perceived to be much lower
than it could and should be. Each of these reasons presents a critical barrier to success.
To truly get the value from automation, each of these barriers must be effectively
addressed. The remainder of this book will be dedicated to addressing and resolving
each one.
The first critical barrier is that the business value of automation solutions is not
easily measurable or discernible. The three traditional approaches that attempt to
measure the value of automation fall short of the objective for different reasons. These
traditional approaches are: 1) using the cost accounting system; 2) project teams mea-
suring the incremental performance provided by the system before and after the solu-
tion is installed; and 3) using the incremental change in key performance indicators
(KPIs) to measure what the improvement in performance might be. Interestingly, each
of these traditional approaches has considerable merit but none of them has proven to
be completely effective. Taking another look at the characteristics of each may help
provide the basis for a more effective performance measurement system for industrial
operations that will be able to easily convey the value of every solution deployed.

58 The Value of Automation – Peter G. Martin, Ph.D.
Cost Accounting and Automation Benefits
Many of the project engineers I have talked with seem to believe that their company’s
cost accounting systems contain the information necessary to measure the value their
projects provide but that the accounting team is just not extracting that information, or
perhaps is just not communicating it. Project engineers seem to believe that manage-
ment must know the value delivered but the engineering team is just not in the loop. It
is important to dispel this myth. Most cost accounting systems just do not have the nec-
essary data for calculating the benefit of automation solutions. The reason this is so
important is that if the engineering team believes the solution to this problem is already
in place, they will not try to develop a solution and the problem will persist.
Although the shortcomings of modern cost accounting systems with respect to
the measurement of the value provided by automation solutions has been overviewed,
a quick review and summary may be appropriate at this point in order to establish the
basis for a good solution. I will make no attempt to describe all of the details and
nuances of cost accounting in industrial companies, since this topic is well beyond the
scope of this book; instead I will attempt to discuss cost accounting that is strictly
focused on the measurement of automation solution performance.
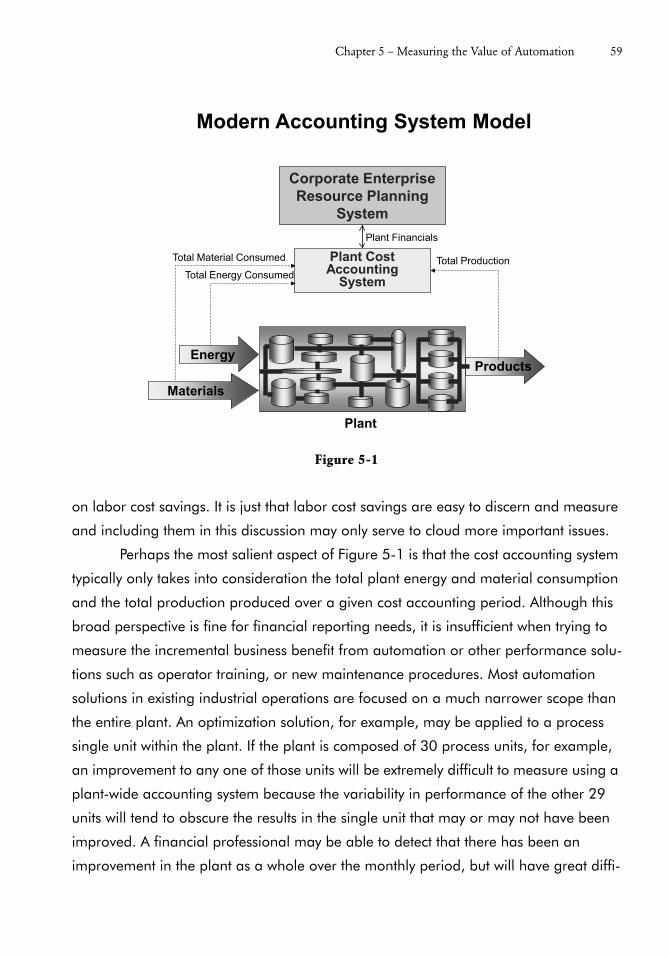
Figure 5-1 provides a simplified diagram of a typical cost accounting system in
an industrial plant. The cost accounting models are based on measuring the cost of the
operation relative to the production value the operation is producing. Most automation
solutions impact the business of the operation in four areas: labor costs, energy costs,
material costs, and production value. The objective of the plant operating team is to
minimize costs while meeting the production targets in a safe and environmentally
sound manner. The cost accounting system is focused on cost and production value
and does not cover safety and environmental integrity. This simplified discussion will
focus on those cost and production values as well as deal with safety and environmen-
tal considerations.
Since most industrial organizations have been aggressively downsized over the
past few decades, and many industrial executives that I have interviewed do not believe
they can downsize much further, the savings due to labor cost reductions will not be
specifically addressed. This is not to say that there cannot be savings in labor; there
could, and any savings in that area should be credited to the automation solution. In
fact, most automation solutions installed over the past few decades have been justified
Chapter 5 – Measuring the Value of Automation 59
on labor cost savings. It is just that labor cost savings are easy to discern and measure
and including them in this discussion may only serve to cloud more important issues.
Perhaps the most salient aspect of Figure 5-1 is that the cost accounting system
typically only takes into consideration the total plant energy and material consumption
and the total production produced over a given cost accounting period. Although this
broad perspective is fine for financial reporting needs, it is insufficient when trying to
measure the incremental business benefit from automation or other performance solu-
tions such as operator training, or new maintenance procedures. Most automation
solutions in existing industrial operations are focused on a much narrower scope than
the entire plant. An optimization solution, for example, may be applied to a process
single unit within the plant. If the plant is composed of 30 process units, for example,
an improvement to any one of those units will be extremely difficult to measure using a
plant-wide accounting system because the variability in performance of the other 29
units will tend to obscure the results in the single unit that may or may not have been
improved. A financial professional may be able to detect that there has been an
improvement in the plant as a whole over the monthly period, but will have great diffi-
Figure 5-1
Corporate Enterprise Resource Planning
System
Plant Cost Accounting
System
Modern Accounting System Model
EnergyProducts
Materials
Plant
Total ProductionTotal Material Consumed
Total Energy Consumed
Plant Financials

60 The Value of Automation – Peter G. Martin, Ph.D.
culty determining whether the improvement was due to the automation solution or to
some other activities, such as the utilization of chemicals from a different supplier or
the addition of a new operator to the staff or any number of other differences that may
have occurred. Certainly the accounting professional will not be able to provide a
value for any single improvement with any degree of confidence. Even if the automa-
tion solution worked well and provided significant business benefit, that benefit will not
be discernible via the accounting system. This is referred to as the “scope issue” associ-
ated with traditional cost accounting systems.
A second characteristic of a traditional cost accounting system that is extremely
problematic when trying to measure the benefit from an automation solution is the time
frame of the information in the system. Most cost accounting systems were designed to
provide a monthly financial picture of an operation and a company. The data in the
accounting database typically has much better than monthly resolution. In fact, many
of today’s cost accounting systems have databases with a fairly good financial profile
for the operation on a weekly or even a daily basis. On first review, this time frame may
appear to be adequate for measuring the benefits realized from automation solutions,
but it is not. Most automation solutions provide real-time impact on the performance of
the operation. This real-time impact can cause changes to the operation in a much
shorter time frame than daily. If an automation solution is started up in an industrial
operation at some point during a day, it may represent only one of hundreds of events
that may take place that day that drive the business value of the operation either up or
down. At the end of the day, when the daily financials are developed it will be almost
impossible for an accounting professional to determine whether any benefit in the
operation was attributable to the automation solution or if some other events that
occurred in the operation that day may be responsible. This is referred to as the “time
issue” associated with traditional cost accounting. In the final analysis, therefore, the
value delivered by an automation solution is at best unclear due to the lack of timeli-
ness of the information in a standard accounting system.
The combined issues of the scope and timeliness of the accounting data in a
standard accounting system have been well understood by financial professionals for
many years. In fact, a number of advancements in the area of accounting have been
proposed to try to address these shortcomings. One approach that has probably
gained the most attention over the past twenty years has been Activity Based Account-

Chapter 5 – Measuring the Value of Automation 61
ing (Figure 5-2). With the risk of oversimplifying an interesting approach, Activity Based
Accounting systems try to provide higher resolution accounting data by accounting for
each activity within the industrial operation as compared with the operation as a whole.
This provides a clearer perspective on where cost is consumed and value is produced
across the operation. Most attempts at deploying Activity Based Accounting in industry
have taken place in discrete manufacturing operations, such as automotive or aero-
space factories, due to the fairly straightforward accounting models required for these
operations. In the process industries the activities involved in the operation are associ-
ated with the functions performed by each process unit; however, the models for these
activities are technically challenging, requiring engineering talent for proper develop-
ment. If Activity Based Accounting models could be developed that were associated
with each process unit of the operation, they would certainly address the traditional
“scope issue” associated with traditional cost accounting systems.
Figure 5-2
Activity Based Accounting Model
EnergyProducts
Materials
Plant
PlantArea
PlantArea
PlantArea
Unit Unit Unit
UnitUnit
Unit Unit
UnitUnit
Sensor-basedReal-TimeActivity-Based AccountingModels(DPMs)In Process Plants
Process UnitsDefine the Activities
Plant Level Cost Accounting System
62 The Value of Automation – Peter G. Martin, Ph.D.
Although Activity Based Accounting provides a positive step forward for cost
accounting systems, with respect to providing data that is helpful in determining the
incremental business value obtained from automation, it still does not address the
“time issue” presented above. Understanding the intent of Activity Based Accounting
provides the basis for an effective performance measurement approach. If the basis
behind traditional Activity Based Accounting were moved from daily to real-time
frames, the output of these systems would match the performance monitory and
improvement requirements of industrial operations.
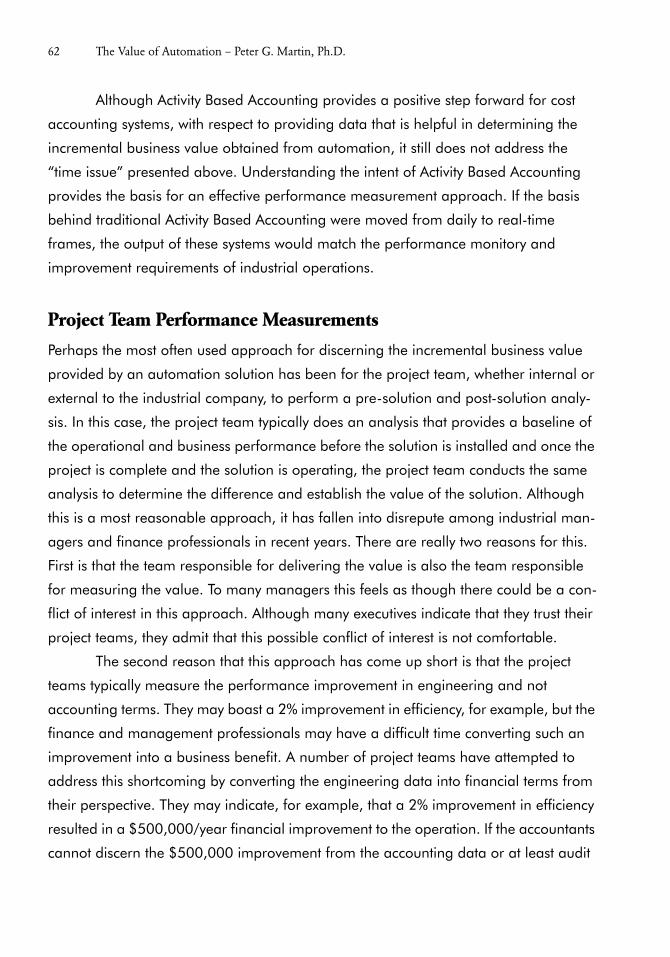
Project Team Performance Measurements
Perhaps the most often used approach for discerning the incremental business value
provided by an automation solution has been for the project team, whether internal or
external to the industrial company, to perform a pre-solution and post-solution analy-
sis. In this case, the project team typically does an analysis that provides a baseline of
the operational and business performance before the solution is installed and once the
project is complete and the solution is operating, the project team conducts the same
analysis to determine the difference and establish the value of the solution. Although
this is a most reasonable approach, it has fallen into disrepute among industrial man-
agers and finance professionals in recent years. There are really two reasons for this.
First is that the team responsible for delivering the value is also the team responsible
for measuring the value. To many managers this feels as though there could be a con-
flict of interest in this approach. Although many executives indicate that they trust their
project teams, they admit that this possible conflict of interest is not comfortable.
The second reason that this approach has come up short is that the project
teams typically measure the performance improvement in engineering and not
accounting terms. They may boast a 2% improvement in efficiency, for example, but the
finance and management professionals may have a difficult time converting such an
improvement into a business benefit. A number of project teams have attempted to
address this shortcoming by converting the engineering data into financial terms from
their perspective. They may indicate, for example, that a 2% improvement in efficiency
resulted in a $500,000/year financial improvement to the operation. If the accountants
cannot discern the $500,000 improvement from the accounting data or at least audit

Chapter 5 – Measuring the Value of Automation 63
the results of their calculations from an accounting perspective, these numbers lack
credibility and are easily dismissed. This type of dismissal can frustrate engineers who
worked on developing the analysis. The truth is that it is Accounting’s job to produce
the financial information of the operation – not Engineering’s job. Even if the data
appears to be presented in financial form, unless it aligns with the accounting system, it
is not considered to be valid.
It is important to gain the Accounting department’s support and buy-in on the
economic improvement provided by any solution. Merely putting information in finan-
cial format does not accomplish this objective. Therefore, one important characteristic
of the correct performance measurement system is that the information aligns with the
accounting system and is auditable by the accounting professionals within the
operation.
Key Performance Indicators
The third commonly used approach for measuring the value of automation solutions
has been to use the key performance indicators (KPI) of the operation. KPIs have tradi-
tionally been thought of as the measures associated with the operational management
of an industrial operation or site. KPIs are often partitioned into specific areas of the
operation or site, such as maintenance KPIs, operations KPIs, and engineering KPIs. In
most industrial operations, the KPIs in place are either daily or weekly measures of dif-
ferent aspects of the operation. Although most KPIs are not measured in real time,
there is no reason that would prevent them from being measured in real time. The
table in Figure 5-3 displays a list of common KPIs as summarized from work done by
the ISA95 standards committee of the International Society of Automation. The ISA95
committee recognized that KPIs can be extremely valuable in helping to direct employ-
ees in industrial operations to perform their functions in an appropriate manner by
providing measures that line up with operational goals. As most good people tend to
perform to their measures, having KPIs aligned with the goals of the operation should
encourage performance improvements in the areas being measured.
Although KPIs can be an important aspect of an operational improvement strat-
egy, they have traditionally come up short when they are used to measure the business
value provided by automation solutions for a few reasons. The first is that KPIs are typ-

64 The Value of Automation – Peter G. Martin, Ph.D.
ically not measured in real time but are measured daily or weekly. This shortcoming is
identical to that of the accounting measures previously discussed. Real-time measures
of performance are required to obtain an accurate business value of automation solu-
tions or any other solutions that have an immediate impact on the operation.
The second reason is that KPIs are seldom aligned with plant accounting sys-
tems. This shortcoming is similar to that of the project team pre-project baseline analy-
sis and post-project improvement analysis approach discussed in the last section. Even
if the KPIs were measured in real-time, they would still fall short due to this problem. It
is difficult to convert many of the KPIs in the table above into specific business value or
profitability measures.
As with the pre- and post-project analysis approach, engineers have tried to
address this shortcoming by creating KPIs expressed in financial terms. The problem is
that if the financial terms expressed in the KPIs do not align with the accounting system
of the plant, the information provided by the KPIs have no credibility with the plant
Figure 5-3
Sample KPIsProduction rate as a percentage maximum Actual vs planned volumeAverage machine availability rateAverage machine uptimeFirst product, first pass qualityHours lost due to equipment downtimeFirst-pass yieldManufacturing cycle timeNumber of process changes due to errorsPercentage error in yield projectionsPercentage increase in Output per employeePercentage of assembly steps automatedPercentage of lots or jobs expedited Percentage of operators with expired certificationsPercentage tools that fail certificationPercentage reduction in component lot sizesPercentage reduction in manufacturing cycle timePercentage unplanned overtimeSet-up timeProduction schedules met (percentage)Productivity: units per labor hourReject rate reductionActual inventory turnsCustomer order cycle time in daysOrder fill rateStock turns per yearinventory as a percentage of sales dollars
Rework hours compared to manufacturing hoursScrap and rework as percentage of salesScrap and rework percentage reductionStandard order-to-shipment lead timeTime line is down due to sub-assembly shortageTime required to incorporate engineering changesUnits produced per unit of manufacturing spaceWarranty effort reductionWarranty repair costs as a percentage of salesYield improvementPercentage error in reliability projectionsPercentage of lots going directly to stockPercentage of product that meets customer expectationsPercentage of supplier orders delivered on timeQuality assurance personnel to total personnelReceiving inspection cycle timeTime required to process a request for corrective actionTime to answer customer complaintsTime to correct a problemVariations between inspectors doing the same jobRaw material inventory turnsLabor hours spent on preventive maintenanceMaintenance cost as a percentage of equipment costMaintenance cost per output unitNumber of unscheduled maintenance callsPercentage of equipment maintained on scheduleUnplanned machine downtime as a percentage of run timeUnits processed per employee/hourure 5-3
Chapter 5 – Measuring the Value of Automation 65
accounting team and therefore with plant management. In fact, during a focus group
of a number of industrial executives that I conducted a few years ago, I remember
hearing one CFO remark that, “If one more engineer comes to me with one more KPI
to tell me how much value an automation solution provided to the company, I will fire
his …”. Clearly there is a measurement disconnect between operations and finance.
The following example of the interaction between industrial executives that took
place during that same focus group may help illustrate this point. For this focus group a
number of industry executives convened to discuss the challenge of developing the
most effective performance measurement system for industrial operations. I started the
discussion by showing a diagram that was one industry consultant’s view on how auto-
mation and information systems combined to help enhance industrial businesses. This
diagram had over 40 boxes on it, each with a three-letter acronym in the box, and
lines connecting the different boxes. This was intended to show how all the different
hardware and software components required to manage an industrial operation would
work together. Upon seeing this diagram, one of the CEOs in the room stood up and
walked to the front of the room. He took the diagram out of my hand and threw it into
a wastebasket. He stated that if that was the way the automation and IT teams think the
business is run, it is little wonder he could not get what he needs from them. Believe it
or not, this was exactly the response that the leaders of the focus group were hoping to
illicit.
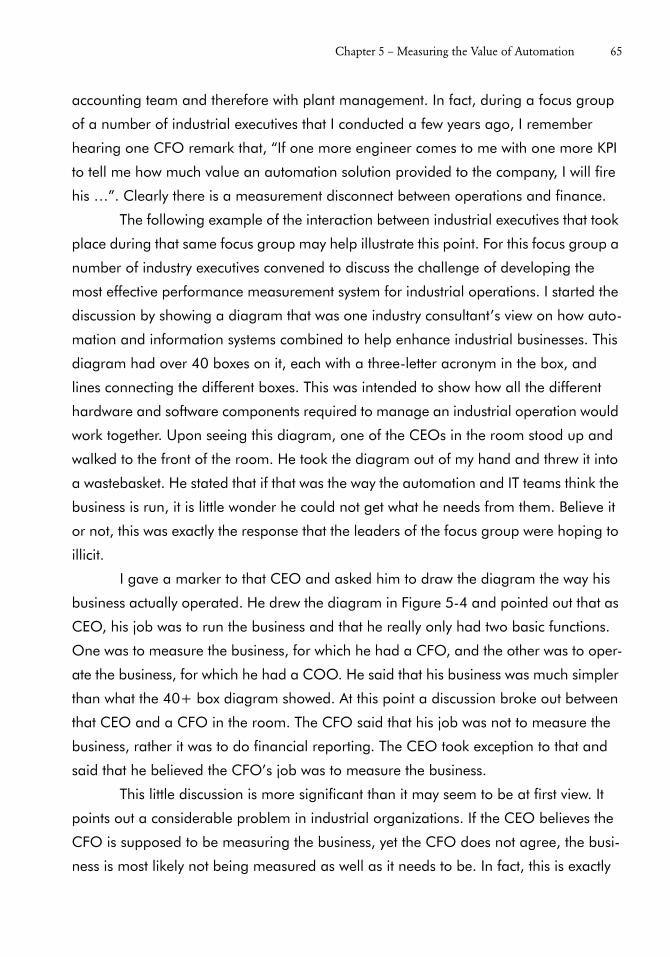
I gave a marker to that CEO and asked him to draw the diagram the way his
business actually operated. He drew the diagram in Figure 5-4 and pointed out that as
CEO, his job was to run the business and that he really only had two basic functions.
One was to measure the business, for which he had a CFO, and the other was to oper-
ate the business, for which he had a COO. He said that his business was much simpler
than what the 40+ box diagram showed. At this point a discussion broke out between
that CEO and a CFO in the room. The CFO said that his job was not to measure the
business, rather it was to do financial reporting. The CEO took exception to that and
said that he believed the CFO’s job was to measure the business.
This little discussion is more significant than it may seem to be at first view. It
points out a considerable problem in industrial organizations. If the CEO believes the
CFO is supposed to be measuring the business, yet the CFO does not agree, the busi-
ness is most likely not being measured as well as it needs to be. In fact, this is exactly

66 The Value of Automation – Peter G. Martin, Ph.D.
what we find in most industrial companies and is a key reason why the value of auto-
mation is difficult to discern.
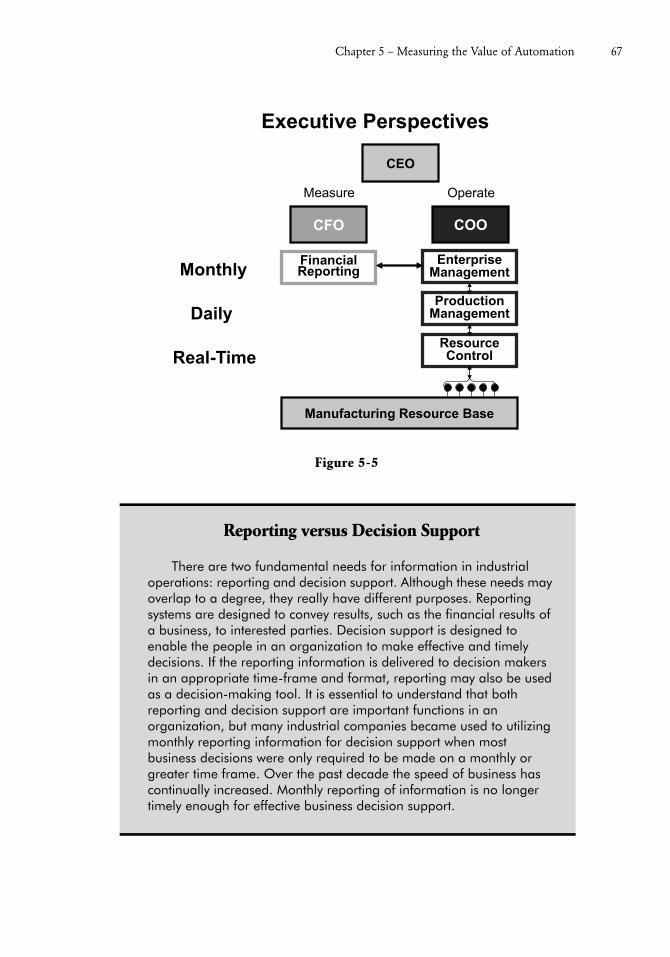
After the disagreement between the CEO and CFO was talked through, we
asked the executives in the room to draw a picture of how they believed automation
and IT functionality aligned under the two basic functions of measuring the business
and operating the business. In about 45 minutes they developed the diagram in Figure
5-5. Although I may not agree with all aspects of the model they developed, it is useful
in pointing out a shortcoming in many industrial organizations: that no-one is respon-
sible for measuring the business.
Figure 5-4
CEO
CFO COO
Measure Operate
Executive Perspectives
Chapter 5 – Measuring the Value of Automation 67
Figure 5-5
Reporting versus Decision Support
There are two fundamental needs for information in industrial operations: reporting and decision support. Although these needs may overlap to a degree, they really have different purposes. Reporting systems are designed to convey results, such as the financial results of a business, to interested parties. Decision support is designed to enable the people in an organization to make effective and timely decisions. If the reporting information is delivered to decision makers in an appropriate time-frame and format, reporting may also be used as a decision-making tool. It is essential to understand that both reporting and decision support are important functions in an organization, but many industrial companies became used to utilizing monthly reporting information for decision support when most business decisions were only required to be made on a monthly or greater time frame. Over the past decade the speed of business has continually increased. Monthly reporting of information is no longer timely enough for effective business decision support.
CEO
CFO COO
Measure Operate
Executive Perspectives
EnterpriseManagement
ProductionManagement
ResourceControl
Manufacturing Resource Base
Real-Time
Daily
Monthly FinancialReporting

68 The Value of Automation – Peter G. Martin, Ph.D.
Reporting versus Decision Support continued…
Real-time business decision support consists of providing the right information to the right people in the right format and at the right time so they can make good decisions for the organization. For many decades, the business of industry experienced minimal variations over long periods of time. Monthly reporting information often provided the information that business managers required for making good business decisions for their operations, because these decisions were typically required on an infrequent basis.
Decisions at the operational level, however, required much faster, real-time information to be effective. Decisions at this level were typically directed toward improving efficiency in the operations. Making effective decisions required providing operational information such as flows, levels, temperatures, pressures, speeds, and production schedules to the appropriate operational personnel in the plant in real time. This was so they could make the decisions they need to make within a timeframe that would bring about the desired results.
In recent years the speed of industrial business has continually increased. This was originally triggered by the deregulation of the electric power industry which caused the price of electricity, which had been stable for months at a time to change more frequently. Today the price of electricity on the open power grid changes every 15 minutes in the U. S. The near real-time variability in the price of electricity had a domino effect that has impacted a number of other variables required to manage the profitability of industry, such as natural gas and raw materials. No longer does monthly reporting information suffice for effective industrial business decision support. Managing the profitability, safety and environmental integrity of industrial operations has transitioned toward real-time measurement and control, much like managing the efficiency of the operations has been since the inception of industrialization.
Optimizing the performance of today’s industrial businesses requires a clear separation of reporting and decision support information in order to ensure that both reporting and decision support are underpinned with the information necessary for each. In many cases, the reporting information has been effectively established. More focus must be directed to the real-time decision support information required to drive the business toward improved profitability, safety, and environmental integrity.
Chapter 5 – Measuring the Value of Automation 69
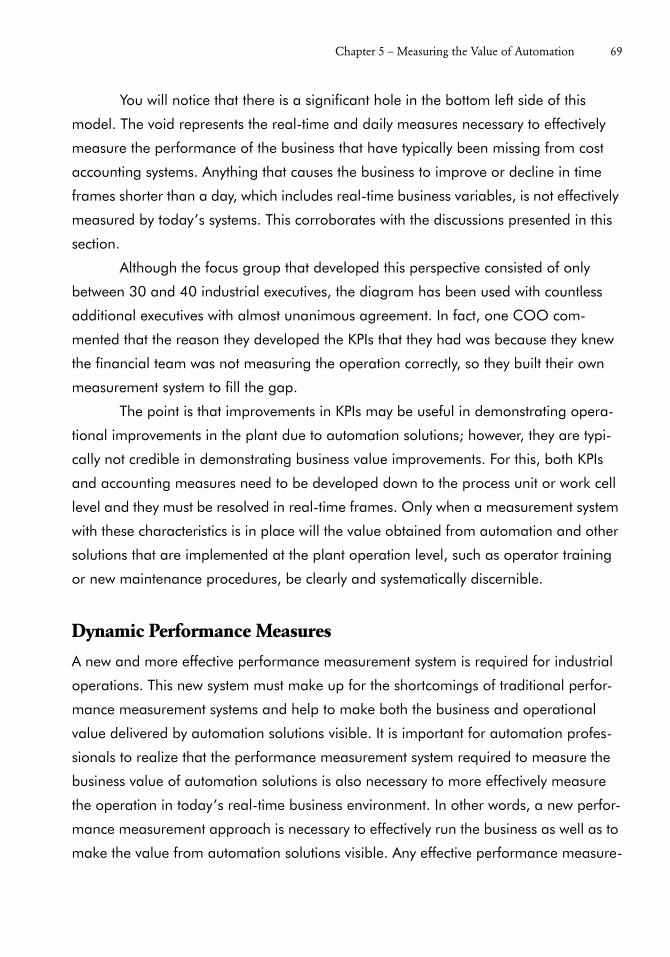
You will notice that there is a significant hole in the bottom left side of this
model. The void represents the real-time and daily measures necessary to effectively
measure the performance of the business that have typically been missing from cost
accounting systems. Anything that causes the business to improve or decline in time
frames shorter than a day, which includes real-time business variables, is not effectively
measured by today’s systems. This corroborates with the discussions presented in this
section.
Although the focus group that developed this perspective consisted of only
between 30 and 40 industrial executives, the diagram has been used with countless
additional executives with almost unanimous agreement. In fact, one COO com-
mented that the reason they developed the KPIs that they had was because they knew
the financial team was not measuring the operation correctly, so they built their own
measurement system to fill the gap.
The point is that improvements in KPIs may be useful in demonstrating opera-
tional improvements in the plant due to automation solutions; however, they are typi-
cally not credible in demonstrating business value improvements. For this, both KPIs
and accounting measures need to be developed down to the process unit or work cell
level and they must be resolved in real-time frames. Only when a measurement system
with these characteristics is in place will the value obtained from automation and other
solutions that are implemented at the plant operation level, such as operator training
or new maintenance procedures, be clearly and systematically discernible.
Dynamic Performance Measures
A new and more effective performance measurement system is required for industrial
operations. This new system must make up for the shortcomings of traditional perfor-
mance measurement systems and help to make both the business and operational
value delivered by automation solutions visible. It is important for automation profes-
sionals to realize that the performance measurement system required to measure the
business value of automation solutions is also necessary to more effectively measure
the operation in today’s real-time business environment. In other words, a new perfor-
mance measurement approach is necessary to effectively run the business as well as to
make the value from automation solutions visible. Any effective performance measure-
70 The Value of Automation – Peter G. Martin, Ph.D.
ment system should certainly solve the automation value problem, nevertheless, a per-
formance measurement system that adheres to the characteristics previously presented
(real-time calculation of accounting variables at the process unit level) is also necessary
for measuring the business and operation effectively as more variables associated with
the business of industry. This is particularly important as the business of industry transi-
tions toward real-time variability, as have electricity and raw material prices, as well as
production value in many industrial companies over the last decade.
A number of characteristics of an effective performance measurement system
have been identified. In review, the performance measurement system must:
• Provide real-time measures
• Provide performance measures aligned with the company’s accounting
system
• Provide measures down to the process unit or work cell levels of the
operation
• Be auditable by accounting
• Align with the operational measures (KPIs)
Developing a performance measurement system for industrial operations that
incorporates all of these characteristics is truly challenging, yet it is necessary for the
health of the business as well as for being able to discern the value of automation
solutions.
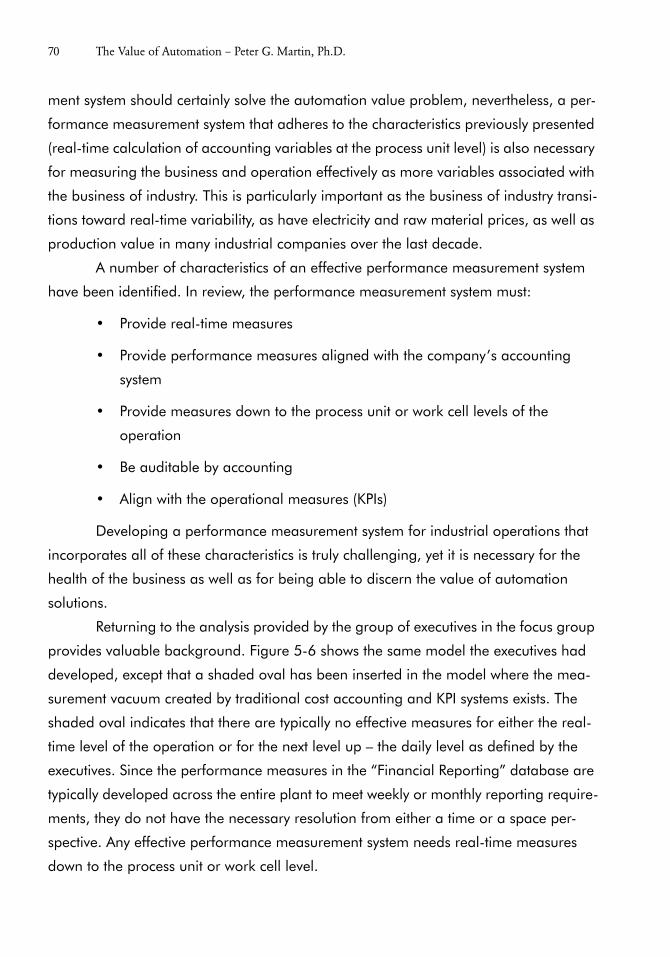
Returning to the analysis provided by the group of executives in the focus group
provides valuable background. Figure 5-6 shows the same model the executives had
developed, except that a shaded oval has been inserted in the model where the mea-
surement vacuum created by traditional cost accounting and KPI systems exists. The
shaded oval indicates that there are typically no effective measures for either the real-
time level of the operation or for the next level up – the daily level as defined by the
executives. Since the performance measures in the “Financial Reporting” database are
typically developed across the entire plant to meet weekly or monthly reporting require-
ments, they do not have the necessary resolution from either a time or a space per-
spective. Any effective performance measurement system needs real-time measures
down to the process unit or work cell level.
Chapter 5 – Measuring the Value of Automation 71
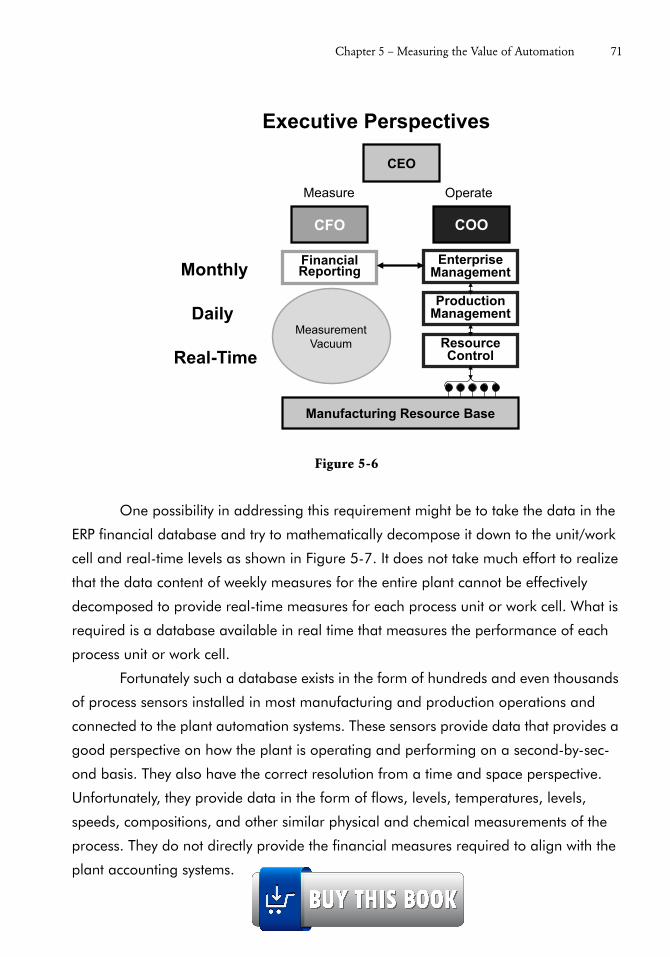
One possibility in addressing this requirement might be to take the data in the
ERP financial database and try to mathematically decompose it down to the unit/work
cell and real-time levels as shown in Figure 5-7. It does not take much effort to realize
that the data content of weekly measures for the entire plant cannot be effectively
decomposed to provide real-time measures for each process unit or work cell. What is
required is a database available in real time that measures the performance of each
process unit or work cell.
Fortunately such a database exists in the form of hundreds and even thousands
of process sensors installed in most manufacturing and production operations and
connected to the plant automation systems. These sensors provide data that provides a
good perspective on how the plant is operating and performing on a second-by-sec-
ond basis. They also have the correct resolution from a time and space perspective.
Unfortunately, they provide data in the form of flows, levels, temperatures, levels,
speeds, compositions, and other similar physical and chemical measurements of the
process. They do not directly provide the financial measures required to align with the
plant accounting systems.
Figure 5-6
CEO
CFO COO
Measure Operate
Executive Perspectives
EnterpriseManagement
ProductionManagement
ResourceControl
Manufacturing Resource Base
Real-Time
Daily
Monthly FinancialReporting
MeasurementVacuum

72 The Value of Automation – Peter G. Martin, Ph.D.
The challenge is in converting these physical and chemical measures into finan-
cial measures of the operation. The good news is that, unlike physics, chemistry, and
biology, which are all natural sciences and sometimes require high levels of mathemat-
ics to model, accounting is a man-made science and as a result is algorithmic in form.
Plant accountants understand the equations necessary to report the financial results of
the business in a legally acceptable manner in accordance with the Generally Accepted
Accounting Practices (GAAP) employed in the locale in which the plant operates. For
each of the plant level accounting equations, the contribution equation for each plant
area can be determined in a manner in which each of the plant area measures can be
combined to determine the plant level measures. Likewise, for each process unit
assigned to a plant area, the unit level contribution equations can be determined in a
manner in which the appropriate combination of the unit level measures will result in
the area level measures. By performing this accounting equation decomposition analy-
sis right down to each process unit, a set of accounting contribution equations may be
identified for each unit. In industrial plants the units or work cells represent the primary
activities that take place in the manufacture of the products. Therefore the real-time
accounting equations at the unit level represent most of the real-time activity-based
accounting models for the operations.
Developing the equations for each process unit or work cell is only the first step
in the development of a real-time activity-based accounting system for the plant. The
second step is to evaluate the sensor-based information associated with the operation
of each unit to determine how that information can be used to develop real-time algo-
rithms that will calculate the real-time accounting data in a repetitive manner. Since
these algorithms must align with the accounting system it is typically necessary to down-
load some financial data, such as energy cost data, from an external source such as
the ERP system of the utility in order to resolve the algorithms correctly.
Once the algorithms are established and the source data connections neces-
sary to resolve the algorithms are identified, the algorithms must be programmed into
the real-time automation system. This is because the automation system is directly con-
nected to the sensors and unlike the ERP systems, the automation systems operate in
real time. Fortunately an ideal real-time algorithm environment exists in almost all
automation systems in the form of the controllers used to do process control. Process
controllers are really real-time algorithm executors, but the algorithms they normally
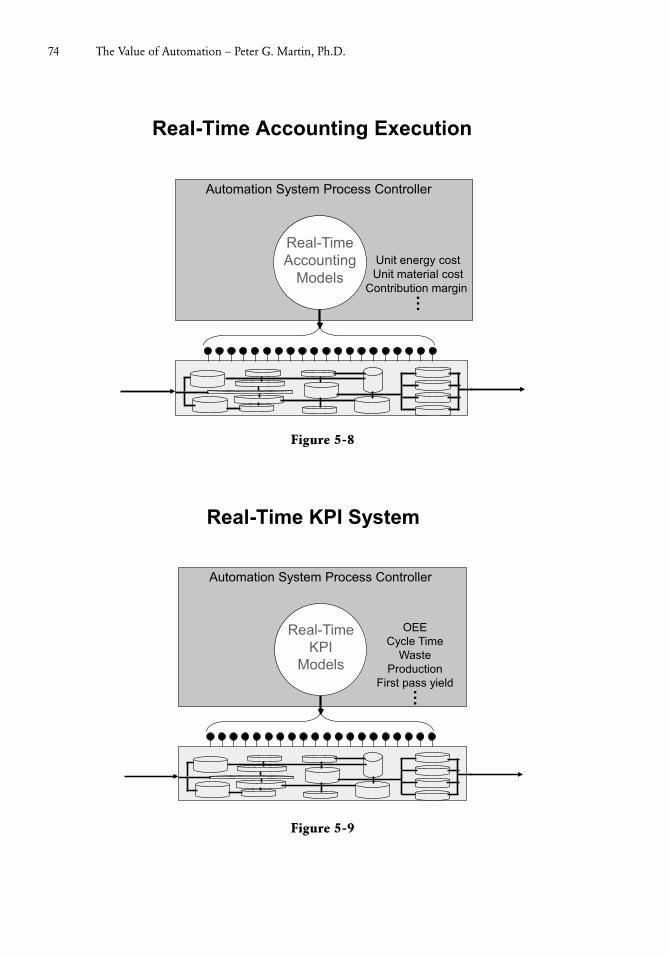
Chapter 5 – Measuring the Value of Automation 73
operate are control algorithms such as PID (Proportional-Integral-Derivative) and Ratio.
Most process control software can also be configured to support general-purpose algo-
rithms and thereby provides the ideal environment for modeling real-time activity-
based accounting for manufacturing and production operations (Figure 5-8).
A similar analysis can be undertaken to develop the area and unit level contri-
bution algorithms for the operational KPIs of the plant (Figure 5-9). Following both the
accounting and operational decomposition processes results in real-time accounting
models and real-time KPI models running within the process control domain of the
installed automation system. This combination provides an effective basis for a com-
prehensive industrial performance measurement system.
Once the basic real-time activity-based accounting and real-time KPI models
are loaded and operating within the controllers, they can be combined into a compre-
hensive performance measurement system using standard automation system software
commonly available, as shown in Figure 5-10. Each of the measures can be collected
by a standard process historian and historized according to the performance measure-
ment requirements of the plant. For example, the performance measures may be total-
Figure 5-7
Plant to Unit Accounting Decomposition
Area Contribution Accounting Algorithms
UnitAccountingAlgorithms
Plant Accounting Algorithms
UnitAccountingAlgorithms
UnitAccountingAlgorithms
UnitAccountingAlgorithms
UnitAccountingAlgorithms
UnitAccountingAlgorithms
UnitAccountingAlgorithms
UnitAccountingAlgorithms
UnitAccountingAlgorithms
Area Contribution Accounting Algorithms
Area Contribution Accounting Algorithms
74 The Value of Automation – Peter G. Martin, Ph.D.
Figure 5-8
Figure 5-9
Real-Time Accounting Execution
Unit energy costUnit material cost
Contribution margin ...
Real-TimeAccounting
Models
Automation System Process Controller
Real-Time KPI System
OEECycle Time
WasteProduction
First pass yield...
Real-TimeKPI
Models
Automation System Process Controller

Chapter 5 – Measuring the Value of Automation 75
ized or averaged for each hour, shift, day, week, and month to provide a time-based
analysis of the performance of the operation. They can also be combined into area
measures and plant-wide measures using the historian software. This provides a bot-
tom-up financial and operational performance measurement system which is auditable
by the plant accounting team. Notice that with daily, weekly, and monthly totals, the
bottom-up accounting measures can converge into the ERP system financials. The
resulting multi-level performance measurement system provides a totally aligned, real-
time perspective of the plant financials from each unit up to the plant level and from
real-time to monthly timeframes. This bottom-up system meets all of the criteria set out
in the previous analysis and typically does not require any additional system software.
The software provided with most standard automation systems is sufficient.
For completeness it may be useful to relate this system back to the initial model
developed by the executives during the executive focus group. Figure 5-11 shows the
same model filled in with the performance measurement system described above. The
Figure 5-10
Real-Time Accounting System Structure
ProcessMeasurement
ProcessControl
ProcessSupervision
Real-TimeAccounting
& KPI Algorithms
Real-TimeAccounting
& KPI Algorithms
ProcessHistorian
PlantAccounting
SystemAccountingDatabase
HistoricalDatabase
Plant Business

76 The Value of Automation – Peter G. Martin, Ph.D.
combined real-time activity-based accounting and real-time KPIs are typically referred
to as dynamic performance measures (DPMs). As mentioned above, these measures
result from the algorithms executed in the process controllers. When these measures
are collected and transformed in the process historian they provide hourly, shift, daily,
weekly, and monthly measures that can be used for further analysis and for conver-
gence with the plant ERP database.
Figure 5-11
No Measurement – No Result
An expert on batting was hired by a baseball team in order to improve the offensive performance of the team, which had a team batting average of .200. The expert requested the individual batting averages and recent trends for each player on the team. Management informed the batting expert that the team does not keep individual batting averages, only team averages, and that those averages are only calculated monthly. In other words, the performance measures the batting expert needed to do his job well and know he was succeeding just didn’t exist. This presented a problem to the batting expert because he could obtain no real knowledge of which players were doing well
CEO
CFO COO
Measure Operate
Performance Management
EnterpriseManagement
ProductionManagement
ResourceManagement
Manufacturing Resource Base
Real-Time
Production Cycle
Reporting Cycle
Historized Measures
DPMs
FinancialReporting

Chapter 5 – Measuring the Value of Automation 77
No Measurement – No Result continued…
and which weren’t so he could direct his efforts to the players needing the most help.
After briefly watching each of the players take some batting practice the expert formed some initial opinions on which players looked good and which could use his help. He soon discovered that knowing what simply looks good or bad does not ensure good results. After studying the players a while longer he learned that the players he was focusing on actually had the top batting averages on the team, even though they didn’t look as though they would. All the while the batting expert should have been working with other players who looked great, but couldn’t hit.
I have used this illustration because it is so ludicrous that it would never happen in professional baseball. Any reasonable professional batting coach would not have put up with this situation for very long. Yet what seems obviously ludicrous for a professional baseball team very closely represents what is actually taking place in industrial companies.
Trying to use plant-wide monthly reports to improve the operation of a plant that is changing every minute is futile. Everything may look just fine; however, a competitor who is measuring his operations and business appropriately is producing more products at higher quality and lower cost. Making good decisions and getting results requires an effective performance measurement system. For the most part, industrial companies today are trying to use the monthly data from the ERP system to measure the performance of their operations.
This data has two problems. First, it is determined too infrequently. With the performance of the plant changing minute-by-minute, monthly data is just too late. This is similar to developing monthly batting averages for a baseball team playing 25 games each month. By the time you realize what the problem is, if you ever do, weeks of under-performance have gone by.
Second, it is usually too broad in scope. The performance data provided by ERP reports is typically for an entire plant. Engineers in the plant try to improve the performance of each unit and sub-unit in the plant, but plant-wide data can obscure any problems. This is analogous to using team batting averages instead of individual batting averages. The data may be accurate, but it is not very useful when trying to identify and solve problems.
Measurements are critical to the success of any organization or operation. Just look at all of the measurements a competent professional sports organization develops and tracks to manage the performance of their team. Without timely and focused performance measures, it is difficult to impossible to improve. Without these measures, the results industrial companies are striving for will be elusive – at best.

78 The Value of Automation – Peter G. Martin, Ph.D.
Benefits of Comprehensive Real-Time Performance Measurement Systems
There are many benefits that result from a comprehensive, bottom-up, real-time per-
formance measurement system such as the one described above. First, the value of
automation can be easily measured and understood by using this system. Even if the
automation solution only impacts a single process unit, the value improvement can be
easily discerned by reviewing the historized performance measures for the unit prior to
solution deployment and comparing those measures with the same measures after
deployment. Finally, both the ROI and cash flow of any automation solution are now
visible and auditable.
Second, the business and operational impact of any performance-enhancing
initiative should likewise be easily measurable through this system. The business and
operational impact of initiatives such as operator training, maintenance schedules,
continuous improvement initiatives and business process redesign should become eas-
ily identifiable. This will enable plant management to focus on those activities that drive
the greatest business improvement and avoid the activities that do not.
Third, a comprehensive real-time performance measurement system is a fun-
damental support structure for effective continuous improvement (CI) programs such as
Total Quality Management, Six Sigma, and Lean Production. Measuring for continuous
improvement is one of the most difficult and costly aspects of every CI program. If the
real-time performance measurement system is correctly deployed it will readily provide
the correct measures needed for effective CI teams.
Fourth, the financial measures calculated bottom-up through a real-time activ-
ity-based accounting system of this type are more accurate than the financials deter-
mined at day’s end. Many ERP systems calculate the daily energy or material costs of
the plant by multiplying the average cost over the day by the quantity of energy or
materials consumed. If the energy or materials are not consumed in a uniform manner
across the day, these calculations will not be accurate. If, on the other hand, these costs
are calculated in a continuous manner across the day incorporating energy and mate-
rial cost changes as they occur, the costs will be very accurate.
Finally, the DPMs provide the ideal measures for empowerment and real-time
decision support. Today many decisions are made throughout industrial operations
with no effective way of determining if those decisions improved the operation or busi-

Chapter 5 – Measuring the Value of Automation 79
ness. There is little or no effective real-time feedback to the plant personnel making
these decisions. Without feedback they make the decisions to the best of their ability,
but are never quite sure whether the results are positive. Using DPMs as the basis for
real-time decision support provides the empowerment necessary to support better,
more valuable decisions across the operation.
Since there are often a fairly large number of DPMs in any operation, the real-
time decision support feedback must be determined by prioritizing the DPMs according
to the manufacturing or production strategy and providing only the most important
three or four measures to each person in the operation (Figure 5-12). There are proven
processes for prioritizing the measures, but they are beyond the scope of this book. The
book Bottom-Line Automation, which I authored and published through ISA, overviews
a strategic prioritization process.
Figure 5-12
Real-Time AccountingMeasures
KeyPerformance
Indicators
DynamicPerformance
Measures
Strategic Prioritization
Manufacturing Resource Base
Strategic Empowerment

80 The Value of Automation – Peter G. Martin, Ph.D.
The first step in ensuring that industrial operations realize the business value
potential from their automation investments is the installation of a real-time perfor-
mance measurement system. This system will make the business and operational
impact of any automation solution measurable and visible. Once the value of each
automation solution becomes visible, management can start to focus on those solutions
that provide the most value. But making the value measurable and visible is only the
first step. A number of other changes to traditional industrial processes are required to
truly realize the promise of automation.