the value of housing design and layout - the national...
TRANSCRIPT

By 2016 an additional three million homes will be required in the UK. Yet last
year an estimated 160,000 new homes were built, far short of the
Government’s target of 225,000.
This report, produced by FPDSavills Research for CABE and ODPM in
association with Design for Homes, seeks to demonstrate a way of measuring
the economic dividends of investing in high quality housing design and layout. It
pilots a methodology that developers, funders, planners and housebuilders can
apply to compare housing sites and schemes.
The report is especially timely given pressure from the Government who rightly
insist that new housing development, especially in the south east of England,
should be aiming for densities of over 30 units per hectare. Investing in the
design of these new homes is imperative if we are to deliver quality
neighbourhoods of tomorrow.
ThomasTelford
the value of housing design and layout
the value of housing design and layout
the value of housing design and layout

a research project commissioned by CABE and ODPM in association with Design for Homes
produced by FPDSavills Research with Davis Langdon & Everest
ThomasTelford
the value of housing design and layout

CABE, the Commission for Architecture and the Built Environment, is the nation’s champion for better places, places which
• work better
• feel better
• are better
We believe that decent homes, work places, shops, schools and hospitals are everyone’s basic right, a right worth fighting for. CABE uses its skills and resources to
campaign for a better quality of life for people and communities across England. We do this through a rich mix of campaigning, researching, instigating and assisting
with technical expertise and opinion.
CABE
Tower Building
11 York Street
London SE1 7NX
Telephone 020 7960 2400
www.cabe.org.uk
ODPM
Eland House
Bressenden Place
London SW1E 5DU
www.odpm.gov.uk
Design for Homes
79 Parkway
London NW1 7PP
www.designforhomes.org
Copies of this report are available on CABE’s website at www.cabe.org.uk
or from:
The Customer Services Department
Thomas Telford Limited, Units I/K
Paddock Wood Distribution Centre
Paddock Wood, Tonbridge
Kent TN12 6UU
Tel: 020 7665 2464
Fax: 020 7665 2245
www.thomastelford.com
ISBN 07277 3208 0
© Commission for Architecture and the Built Environment, 2003
Although every care has been taken in preparing this report with information obtained from sources considered to be reliable, it has not been independently verified
by CABE, its officers, employers, agents and advisers. No representation, warranty or undertaking, express or implied, is made and no responsibility or liability will be
accepted by CABE or its employees, agents and advisers as to the accuracy or completeness of this report or any other written or oral information made available.
Whilst every effort has been made to ensure that the data contained in this report is correct, no responsibility can be taken by the authors or publisher for omissions
or erroneous data provided by a third party or due to information being unavailable or inaccessible during the research period.
The statements and opinions presented here are those of the researchers and not necessarily those of CABE, ODPM or the publisher.
All rights, including translation, reserved. Except as permitted by the Copyright, Designs and Patents Act 1988, no part of this publication may be reproduced, stored
in a retrieval system or transmitted in any form or by any means, electronic, mechanical, photocopying or otherwise, without the prior written permission of the
Publishing Director, Thomas Telford Publishing, Thomas Telford Ltd, 1 Heron Quay, London E14 4JD.
Design by Kneath Associates
Printed in Great Britain by Latimer Trend
ThomasTelford

T H E V A L U E O F H O U S I N G D E S I G N A N D L A Y O U T 3
England will need at least another three million homes by 2016. Yet last year an
estimated 160,000 were built, far short of the Government’s target of 225,000.
National opinion surveys consistently show that a significant section of the house
buying public would never consider purchasing a new house, preferring more
established neighbourhoods and building stock.
We have to accept that to date we have not provided a product that enough people
are willing to buy into. Where demand so grossly outstrips supply, there is little
commercial incentive for housebuilders to offer more innovative and attractive
designs. So consumers are left without a choice.
But we need to take account of the fact that people see value in good design and
that this will attract them to modern housing. Innovative thinking, integration with
existing communities and investment in quality are the things which will persuade
people that they want to live in modern housing.
Well designed housing improves quality of life for residents and the wider
community, helps reduce crime, fosters community cohesion and significantly
reduces whole life costs.
This CABE/ODPM commissioned report seeks to demonstrate a way of measuring
the economic dividends of investing in high quality housing design and layout. It
provides a methodology that developers, funders, planners and housebuilders can
use for comparing different housing sites and schemes.
It is especially timely given pressure from the Government who rightly insist that new
housing development, especially in the south-east of England, should be aiming for
densities of over 30 units per hectare.
We do not want to repeat recent mistakes – soulless estates, cramped housing and
inefficient neighbourhood layouts. We want to see houses where people aspire to
live and stay. Investing in the design of these new buildings and, just as importantly,
in the quality of the public space between them is imperative if we are to deliver the
neighbourhoods of tomorrow.
Sir Stuart Lipton
Chairman
CABE
Sir Stuart Lipton
Chairman
CABE
Foreword
F O R E W O R D

T H E V A L U E O F H O U S I N G D E S I G N A N D L A Y O U T
C O N T E N T S
5
Executive summary 7
1.0 Introduction 11
1.1 Context 12
2.0 Addressing the gaps 15
2.1 Introduction 16
2.2 Housebuilding and design: institutional context 16
2.3 Brownfield land development and housing 19
2.4 Housing design quality and ‘value’ 21
2.5 Summary 23
3.0 Methodology 25
3.1 Overview 26
3.2 Selection of case studies 27
3.3 Dealing with externalities 29
3.4 Measuring and quantifying the sites 30
3.5 Measuring costs 31
3.6 Measuring value 31
3.7 Assessing commercial value 33
4.0 Research results and discussion 35
4.1 Commercial value 36
4.2 Scheme characteristics 36
4.3 Costs 41
4.4 Values 42
5.0 Conclusions 45
Appendix 1 Literature review references 49
Appendix 2 Cost analysis by Davis Langdon & Everest 53
A2.1 Introduction 54
A2.2 Objective 54
A2.3 Data collection 54
A2.4 Scope and structure of project cost data 55
A2.5 Analysis of the data 56
A2.6 Results 57
Appendix 3 Characteristics of each site 65
Appendix 4 Step-by-step methodology 83
Appendix 5 Illustrative example of the residual land calculation 85
Acknowledgements 87
Contents

6
E X E C U T I V E S U M M A R Y
Executive Summary
E X E C U T I V E S U M M A R Y
8
This report attempts to assess the extent to which design changes the value of
residential development. It sets out a methodology whereby different types of design
in housing and housing layout are examined to see how their differences affect the
commercial value of new developments for developers.
This research pilots a methodology that can be used to compare housing on any
site in any location. Developers, funders, planners and other interested parties will
be able to use this methodology on any site to make a like-for-like comparison
between different developments.
The methodology and the results from the small sample are intended to act as a
framework for further, ongoing investigation into the role of good design in housing
(or what is deemed to be good design) and its effects on value.
The focus of this study is to demonstrate what, if any, enhanced value there is for the
developer in building well designed schemes, broadly upholding the urban design
principles in PPG3, compared to building more recent standard examples of housing
layout and design. It is not concerned with whether the capital values of individual
properties may or may not be higher than a comparably sized, standard new home.
Neither does it examine the amount of capital appreciation that individual homes within
the more innovative schemes may enjoy compared to more standard properties.
The research selected eight examples of completed developments and compared
them in four matched pairs. It was intended that four schemes with certain
‘innovative’ design elements would be compared against four of a more ‘standard’
design in the same location. Practical difficulties in obtaining confidential commercial
information from certain developers necessitated creating two hypothetical
comparator schemes sharing the same locations as two of the schemes with
innovative design elements. The remaining two matched pairs both comprised real
schemes. The eight sites were studied in four different locations around the South
East. This had the effect of eliminating the impact of regional economies and the
differences between regional housing markets when making comparisons.
The developments were costed and a market valuation made. A residual value was
then calculated on each scheme and expressed on a per hectare of land basis
(using the same overall measure of land for each example) so that all sites could be
compared to each other on a like-for-like basis. The residual value does not
represent land value; it represents the commercial value to the developer of the site.
With such a small sample and the pilot nature of this project, the headline results
were inevitably inconclusive, inasmuch as they neither proved that innovative design
and layout improves developer value nor did they disprove it. A number of themes
emerge which, while not necessarily statistically significant, are of importance,
especially as a basis for further research validation.
Of the four locations studied, three of the four ‘exemplar’ (innovative design)
schemes yielded higher residual values than the ‘conventional’ schemes (standard
design) and one yielded poorer residual values to the developer.
The widespread market perception that good design costs more was borne out by
Executive summary
T H E V A L U E O F H O U S I N G D E S I G N A N D L A Y O U T

the study, but not completely. All of the exemplar schemes cost more to build per
square foot of gross internal area than the standard comparators.
The notion that higher density decreases value per square footwas not supported by this study. In two of the four cases, thevalue of the units in the higher density scheme was greater on aper square foot basis than the comparable lower-density schemes(in one case, substantially so).
Only in one scheme (Surbiton) was there a clear and definitively enhanced added
value in the "exemplar" scheme where residual value was enhanced by more than
15% over and above the standard scheme. In the case of two other exemplar
schemes (Bishop’s Stortford and Chelmsford), values appeared to be enhanced by
the nature of their design (by 7.5% and 10.3% respectively).
There appears to be no clear-cut relationship between how big a site is and whether
innovative, PPG3-led design is more profitable or not based on this small sample.
However, the clearest example of added development value was found on the
largest scheme. This may be because a large scheme has the greatest opportunity
to create its own sense of place, while smaller schemes are more vulnerable to the
influence of externalities and even other developments on adjacent sites.
Sites with relatively high residual values, in relation to their matched pairs, appeared to
have high proportions of public open space in relation to the overall size of the site.
In addition to establishing the methodology, one of the most important aspects of
the research is the identification of some possible trends in managing higher density,
better designed schemes to maximise net development value. There is a critical
E X E C U T I V E S U M M A R Y
9T H E V A L U E O F H O U S I N G D E S I G N A N D L A Y O U T
Residual value per area of land
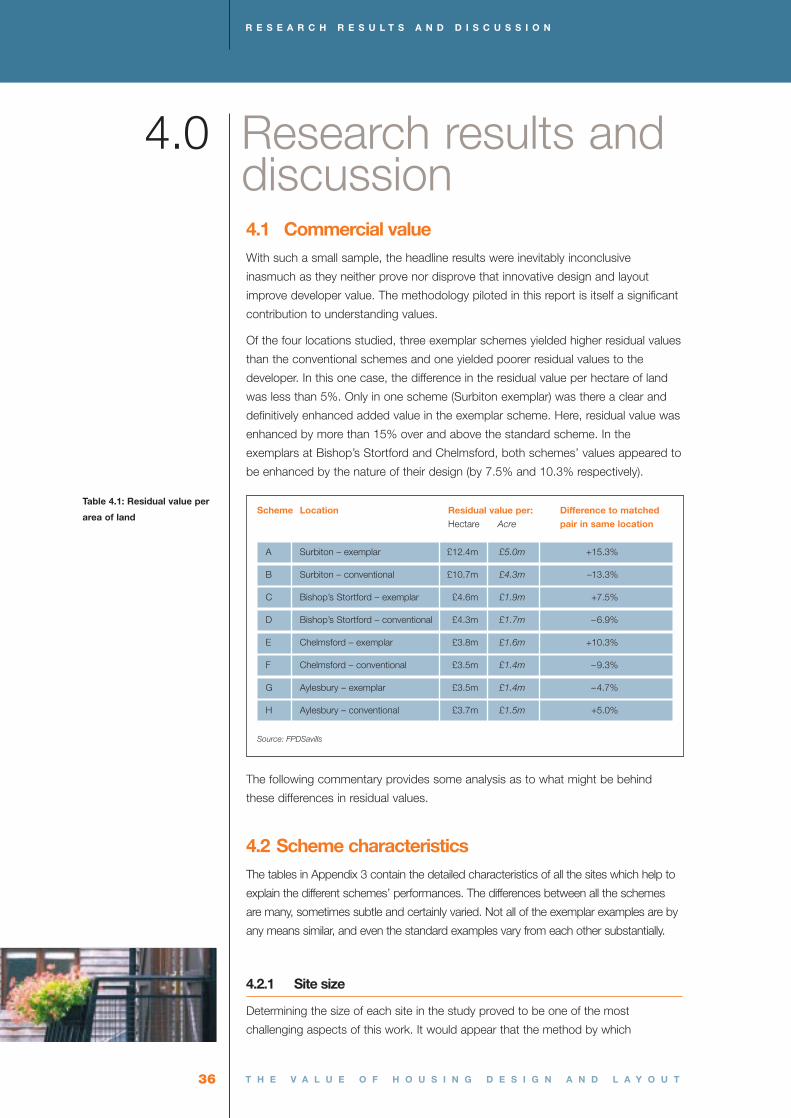
Scheme Location Residual value per: Difference to matched Hectare Acre pair in same location
A Surbiton – exemplar £12.4m £5.0m +15.3%
B Surbiton – conventional £10.7m £4.3m –13.3%
C Bishop’s Stortford – exemplar £4.6m £1.9m +7.5%
D Bishop’s Stortford – conventional £4.3m £1.7m –6.9%
E Chelmsford – exemplar £3.8m £1.6m +10.3%
F Chelmsford – conventional £3.5m £1.4m –9.3%
G Aylesbury – exemplar £3.5m £1.4m –4.7%
H Aylesbury – conventional £3.7m £1.5m +5.0%
Source: FPDSavills

E X E C U T I V E S U M M A R Y
10
balance to be struck by the developer in maintaining unit values while increasing
density. In the schemes studied, some developers have achieved this while others
have not. Striking this balance is possibly the single most important issue in
determining the commercial value of PPG3-compliant schemes for the developer.
This alone is reason enough to advocate design practices that achieve increased
value environments, while at the same time increasing density. In these situations,
the increased value achieved is far in excess of the extra build cost incurred.
The study also raised the question of the extent to which the design and layout of a
large development scheme can affect local externalities, that is how it can actually
change the nature of a place and how it is perceived. One developer’s innovative
designs on one part of a larger development area could be a positive influence on
the value of more conventionally designed housing on another part of a site.
This research begins to illuminate the question: ‘what makes a desirable location?’
Estate agents emphasise ‘location’ as the most important element of housing value.
Leaving aside macroeconomics, there is a series of factors, including the built form,
which creates a sense of place. Some of the developers in this study have helped
to show that it is possible to create a sense of place, and therefore a new type of
location on a piece of land, by employing certain design principles. These new
places may be more desirable, and therefore more valuable, than their neighbours.
They may also be more desirable and valuable than they would otherwise have
been had standard development house types and layouts been employed. Further
research using the methodology developed in this study is urged to confirm this.
When it comes to value for a developer, as opposed to an owner-occupier, it may be more appropriate to talk about ‘density’, ratherthan ‘location’. The issues involved are complex but the rules of thegame now seem to be to maximise unit values while increasing thenumber of units on the site to meet planners’ requirements. This isnot a new game, but changing planning rules have increased thestakes. Whereas before a developer might have aimed for densitiesof between 25 and 30 per hectare (10 and 12 per acre), newplanning and design technologies have raised the target to 30 to 40per hectare (12 to 16 per acre) in suburban locations. In urbansituations, these densities would be very much higher again.
There is a strong argument that values will only be maintained at these densities if
design techniques become very much more sophisticated to maintain their
attractiveness to occupiers.
This study begins to show that good design becomes more and more critical as
densities are increased over and above PPG3’s benchmark of 30 units per hectare.
Standard design and standard layouts will not work on high-density developments.
Increases in density must accompany increased attention to design quality: there
are clear commercial rewards when this course is followed.
T H E V A L U E O F H O U S I N G D E S I G N A N D L A Y O U T

I N T R O D U C T I O N
1.0
Introduction
I N T R O D U C T I O N
12
The Commission for Architecture and the Built Environment (CABE), with support from the
Office of the Deputy Prime Minister (ODPM) and Design for Homes, commissioned a
research study to:
1 create a methodology which could determine the relationship between housing
value and perceived housing quality and
2 show how this impacts on the developer
FPDSavills Research addressed these questions primarily in relation to betterment to the
developer. The report shows the impact of the value of different types of design to
developers by examining the influence that design has on the residual value, left after all site
development and marketing costs have been taken into account. This residual sum
potentially impacts on developer margins. It provides an approach to answering the
question of whether different types of design in housing and housing layout affect the
commercial value of new developments for a developer.
The research programme has been both experimental and practical. It provides a
methodology that can be used on any site in any location or situation to compare sites of
different types in other locations. Developers, funders, planners and other interested parties
will be able to use this approach on any site to make a like-for-like comparison between
different developments.
This report is designed to ask the question and give an indication of whether what is
deemed to be good housing design adds value to property or not. As such, it is intended to
act as a framework for further, ongoing investigation.
1.1 ContextThe issue of good design in housing has come to the fore recently in a variety of
ways. The Urban Task Force report Towards an Urban Renaissance, in 1999,
advocated the improved design quality of the urban fabric in regeneration schemes
large and small. The document concentrated on design principles in the context of
planning and policy rather than in the context of the commercial world and
development businesses.
In 2000, the DETR followed hot on the heels of the Urban Task Force report with
the, now familiar, Planning Policy Guidance Note 3: Housing, commonly referred to
as PPG3. This document broke new ground in requiring higher density new
development and setting out some of the design principles to ensure its higher
quality. Underlying this move is a shift in the planning paradigm that new
developments should be about building places rather than just predicting need and
providing the basic accommodation to fulfil that need. It was significant in
introducing detailed design principles into the planning system.
Other initiatives and movements have brought the issue of urban design, housing
design and layout to the forefront of development, architecture and planning.
Arguably, in other countries design issues have been more widely accepted and
1.0
T H E V A L U E O F H O U S I N G D E S I G N A N D L A Y O U T
Introduction

T H E V A L U E O F H O U S I N G D E S I G N A N D L A Y O U T 13
were taken on board earlier by mainstream, commercial developers. In the USA, for
example, the New Urbanist movement has rapidly gained acceptance and
credibility. The design, community, sustainability and urban form principles have
been adopted and endorsed in the commercial real estate world on that side of the
Atlantic for some years now. August bodies such as the Urban Land Institute
publicise and promulgate such principles. In the UK, it could be argued that these
principles have been taken up on a smaller scale and have not yet found such
widespread acceptance in the commercial world of housing development. While the
Urban Villages Forum, CABE and other bodies have subscribed to some, but not
all, of the New Urbanist design principles, these principles have been taken up by
relatively few developers. Many of the developers who have employed new design
principles have tended to be in the social housing or non-commercial sector, rather
than mainstream housebuilders.
New Urbanism is not synonymous with the best practice, innovative design now
advocated by CABE and other interested British bodies. Specifically, planned
communities do not really fit the UK context, nor does the insistence on traditional
architecture. The reference here to New Urbanism is made to highlight the contrast
with the US experience, where commercial organisations have adopted new and
different design methods on a wider scale than has hitherto been the case in the UK.
However, the situation is changing. During the period of this research project, the
authors have noted a shift in the number of development schemes where
developers have adopted at least some of the design principles of higher density,
mixed tenure, contemporary architecture and layout. An increasing number of
schemes appear to have adopted higher densities, mixed tenure and permeable,
walkable road layouts and connections.
Much of this shift is largely attributable to the increasing adoption of PPG3 at the
local planning level, forcing developers to build designs and layouts that, in most
cases, they would not otherwise have considered. One area where this new
approach is particularly noticeable is in Essex where the authors found widespread
conformity to the progressive Essex Design Guide in many new developments.
Another county where the authors noted a widespread adoption of new design
principles was in Dorset, home of the now famous New Urbanist village scheme of
Poundbury.
The increase in PPG3-compliant schemes around the country means that it is
becoming difficult in certain areas to find the more familiar, homogenous housing
estates that most people associate with modern housebuilding. It was noticeable
that in areas where ‘best practice schemes’ are to be found, planning requirements
have created a spate of similar examples and a corresponding reduction in the
development of lower density, ‘feeder road and cul-de-sac’ type layouts. However,
this was found to be a localised phenomenon. Across the country as a whole, the
authors could still identify a plethora of housing development schemes built as
single tenure, similar sized, standard housing types, arranged in cul-de-sacs, off
feeder roads adjacent to bypasses on the edge of town, built at densities of less
than 25 units per hectare.
I N T R O D U C T I O N

I N T R O D U C T I O N
14
It appears likely that the trend towards the more sophisticated design principles of
innovative high density has been led by some, but by no means all, local planning
department requirements rather than developers themselves, at least initially. Having
said this, it would appear that some developers have seen a commercial advantage
in developing sites according to at least some of the PPG3 principles. Discussions
with developers revealed that some increasingly believe that they can enhance
property values and, more importantly, their margins by designing and building in
these new ways. Other developers remain to be convinced.
It is exactly the proposition that certain types of design can add value that we set
out to test in this study. In order to do this, we have devised a method by which the
value of a development scheme to the developer can be measured. We are not
interested in how the capital values of individual properties may or may not be
higher than a comparably sized, standard new home. Neither are we concerned
with the amount of capital appreciation that individual homes may enjoy compared
to more standard comparisons. The concern of this study is to demonstrate what, if
any, enhanced value there is for the developer in building schemes following the
urban design principles of PPG3 compared to building more standard examples of
housing layout and design.
T H E V A L U E O F H O U S I N G D E S I G N A N D L A Y O U T
A D D R E S S I N G T H E G A P S
2.0
Addressing the gaps
A D D R E S S I N G T H E G A P S
16
2.1 IntroductionA review of the existing literature highlights a number of significant gaps, not least a
lack of empirical evidence examining the commercial value to the developer of
investing in high quality housing design in urban locations. Throughout the 1990s, a
developing body of literature highlighted a growing awareness of the issue of the
quality of urban design in the built environment, and residential design began to
attract academic attention. The publication of the report of the Urban Task Force,
Towards an Urban Renaissance (1999), gave a major policy impetus to issues of
urban design, including the design of residential development. The Urban Task
Force argued that, ‘the challenge of reducing construction costs and increasing
quality in housing is central to achieving an urban renaissance’. However, beyond
the issue of promoting good design to encourage higher residential densities and
more sustainable forms of development, the report did not examine the issue of
good design as a component of enhanced development value.
In a review of literature and case studies of commercial workspace by Bartlett in
2001, a key finding was that,
‘the research suggested that good urban design
adds value by increasing the economic viability
of development and by delivering social and
environmental benefits’.
It also stated that the existence of these benefits was increasingly acknowledged
across stakeholder groups. It was noted that good urban design can confer two
distinct forms of benefit: direct economic benefits to those investing in development,
and indirect social and environmental benefits to others and to society at large. The
researchers note that the relationship between design and value is unlikely to be a
straightforward correlation between better design and increased value, since the issue
of cost has to be taken into account. Noting the different perspectives of the public
and private sectors towards development, the research suggests that for good urban
design to be valued by all stakeholders, it needs to offer distinct dividends in the short
as well as the long term. The additional ‘value’ added by good urban design beyond
that relating to the development scheme itself is now widely acknowledged.
In arriving at any assessment of the costs and benefits of improved urban design, it
is evident, therefore, that the institutional context in which development takes place
is critical for an understanding of the relative perspectives of the different actors and
agencies involved in particular development sectors.
2.2 Housebuilding and design: institutional contextThe institutional context plays a significant role in identifying the conditions under
which the most profitable approach for housebuilders is to adopt standard designs.
Addressing the gaps2.0
T H E V A L U E O F H O U S I N G D E S I G N A N D L A Y O U T
The value of urban design, 2001
However, the external effects created by good design are not sufficiently well
researched, evaluated or understood by key players.
A pioneering attempt to undertake an analysis of private sector attitudes to design
and the value of it was made by Ball in 1983 in a study entitled Housing policy and
economic power: the political economy of owner-occupation. It indicated that, in
relation to the private housebuilding industry,
‘design is an important component of the
development process because, if used
appropriately, it can enhance the revenue from a
site considerably’.
Ball argues that marketability and cost minimisation tend to pull in different
directions in relation to housing design for the speculative housebuilder — although
individuality in design and non-estate site layouts may improve marketability, it tends
to raise construction costs and may lower site densities with corresponding
increases in land costs. Housebuilders minimise this potential conflict through
particular design solutions: a limited use of standard house types, with individuality
achieved by cosmetic variation of the external elevations.
Ball also notes that the market preference for detached dwellings results in a design
form which imposes cost considerations in excess of other design forms (by some
10–15%), but that this is more than offset by higher selling prices. He also indicates
that there is no acceptable definition of housing quality in the private sector, ‘so
while design has become increasingly linked with the growing market orientation of
speculative builders, associated with this trend has been a continuing fall in new
housing standards’. Ball argues that this is not primarily due to the pressure of rising
land costs, but derives from the precise institutional structure in which private
housing production in the UK takes place.
Subsequent research has confirmed that the use of standard house types has
become prevalent among large and medium-sized housebuilding companies, and
that this is driven by the institutional context and the pressures of market
competition associated with private sector housebuilding. Moreover, it has been
concluded by Hooper and Nicol that,
‘what is most striking about the overall residential
design process in speculative housebuilding is the
divorce, in design terms, between house design
and the design of housing layouts’.
Ball argues that the layout of an estate and the mix of houses implied by it are a key
aspect of private housing development, with design a central component of
A D D R E S S I N G T H E G A P S
17T H E V A L U E O F H O U S I N G D E S I G N A N D L A Y O U T
Housing policy and economic power, 1983
Environment and Planning B, 2000
A D D R E S S I N G T H E G A P S
18
marketability rather than an aesthetic adjunct to it. Others have confirmed this
finding.
Ball’s research highlighted the fact that the competition between landowners and
housebuilders for the development gain following the grant of planning permission
had focused attention on the operation of the planning system in the post-war
period. A more recent attempt by Verhage and Needham in 1997 to specify the
particular institutional configuration which applies in the case of speculative
housebuilding in the UK, also highlighted the role of competition. It looked at the
competition between the various actors in the development process to capture
development gain and also looked at the mediating role of the land use planning
system in this process.
Verhage and Needham state that the design outcome of a development will be
dependent on a negotiation process, in which institutional arrangements regulate
the supply side of the market (i.e. housing land supply). In a similar fashion to Ball,
the authors note that, in this negotiating process, the possible gains on housing
construction do not play as important a role as the possible gains on land
development.
They argue that the land development process itself is a major influence on the
physical characteristics of residential areas. In cases where a private developer is
responsible for land development, it is a private agency that receives the
development gains, possibly sharing them with the landowner. If the costs of
secondary services are charged to the private developer by means of planning gain
agreements or other developer contributions, the remaining development gains are
reduced. In the case of private developers securing development gain, they say that
the main objective will be to maximise profit subject to realising continuity. The
authors observe, ‘the developer might try to achieve this through the quality of the
residential environment. If the products — the houses and their residential
environment — are of good quality, the developer can set its prices higher’. The limit
to this increase will be the point at which the extra expenditure equals the increase
in income resulting from the higher prices.
Verhage and Needham argue (as does Ball) that the British planning system
imposes an ‘extra price’ on housing, leading to high development gains for private
developers. In the absence of a betterment tax or levy, development obligations
have been structured to oblige private developers to spend part of the development
gain on the residential environment, and developers view these not as fixed, but
negotiable, costs.
Verhage and Needham follow through with conclusions on the implication of their
analysis. They say that, if development obligations impose additional costs, this
could lead to a decrease in production. Local authorities are therefore faced with a
dilemma in that promoting a larger supply of housing could result in a lower quality
of residential environment. Similarly, promoting a higher quality residential
environment could result in a reduced supply of housing.
Leopold and Bishop, in their 1983 report Design philosophy and practice in
T H E V A L U E O F H O U S I N G D E S I G N A N D L A Y O U T
speculative housebuilding, examined the consequences of this institutional context
for the process of housing design. They argued that the speculative element in land
development gain in private sector housebuilding requires a type of housing which
minimises the special high risks associated with this form of housing provision.
The existence of a portfolio of such designs enables developers to make a
reasonable estimate of costs of production at short notice, and to make a rapid
estimate of the potential ‘yield’ of any site. The authors observe that, ‘not
surprisingly, housing design, in this context, plays an inherently conservative role,
one that inhibits any radical approach to housebuilding that might operate through
the design process’. Booth, among others, has noted this conservatism in design to
be a long-term feature of the housebuilding industry. Moreover, Leopold and Bishop
assert that, ‘the combination of standardised, fairly stable individual house plans
with very flexible, market-sensitive elevations and trim is the physical expression of
the compromise between the long-term stability of the production process and the
more volatile demands of the market’.
The most recent review of housing design quality, Housing design quality: through
policy, guidance and review by Carmona, supports these general conclusions. It
argues that, ‘without some public sector intervention, the unique market
circumstances in which housebuilding occurs will continue to ensure the widely
accepted (even among many housebuilders) devaluing of design in the residential
sector’. Despite this, some commentators have noted that planning intervention in
the form of design guidance may have a positive impact, creating a product with
enhanced sales values and achieving development at higher densities.
In some instances, the increased certainty afforded by coherent residential design
guidance is argued to be of potential assistance to housebuilders. However, it is
also noted by Carmona that pressure from landowners for a share of development
gain results in a situation in which
‘expectations are conceived in a design vacuum, with
— usually — no consideration given to the cost of
delivering higher quality development’.
As a consequence of this pressure, housebuilders often have to strategically ignore
local authority design aspirations in order to make their bid. In order to avoid this,
some commentators have argued that the only means of increasing residential
design quality is to access the development value for investment in design.
2.3 Brownfield land development and housingThe literature on design and housebuilding is limited in that, either explicitly or
implicitly, it reflects a predominantly greenfield context for housing development. As
the scope for such development has become constrained by major Government
policy initiatives (most notably PPG3), and particularly the sequential approach to
A D D R E S S I N G T H E G A P S
19T H E V A L U E O F H O U S I N G D E S I G N A N D L A Y O U T
Housing design quality, 2001
A D D R E S S I N G T H E G A P S
20
urban land release, the potential of previously developed land for housing has
received increased attention.
Research into the costs of residential development on greenfield sites appears not
to have been undertaken for brownfield development. A study by Conran Roche
and Davis Langdon & Everest in 1989 broke down residential development costs
but did not deal explicitly with design issues.
Literature on brownfield development land by authors such as Syms presents the
argument that the development of brownfield sites may be characterised by high
levels of financial uncertainty. This is particularly evident in the context of the loss of
English Partnership’s ‘gap-funding’ regime. Financial uncertainty is exacerbated in
the context of previously developed sites that are affected by land contamination
which requires remediation. Such uncertainty may significantly affect the context of
negotiation between housebuilding companies and local planning authorities, in
which improved design may be only one issue among many competing, material
planning considerations. In a review of progress relating to the identification of
brownfield housing land, research by the Civic Trust in 1999 found a poor fit
between the original identification of sites for housing and the actual achievement of
successful housing development on them. Again, there was no specific reference to
design issues in this research (although adverse market conditions and the
unwillingness of landowners to sell feature prominently in it).
Successive studies by Llewelyn-Davies have investigated the possibilities of
increasing the housing capacity of urban land. A major conclusion has been that,
‘there is potential to significantly increase residential densities and at the same time
improve the environmental quality of new residential development. This can be
achieved through a creative design-led approach which responds to the particular
characteristics of a site, its surroundings and the needs of future residents’. The
essence of this approach is that the objective of quality is addressed through design
rather than by applying general planning standards.
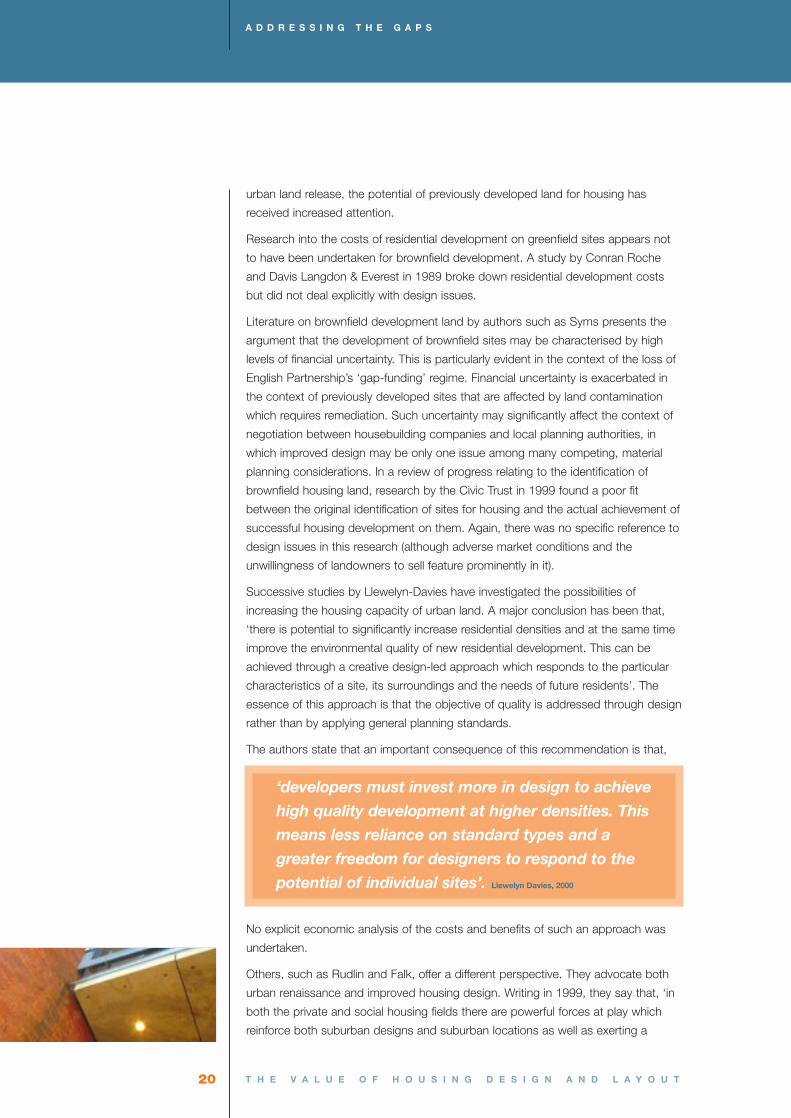
The authors state that an important consequence of this recommendation is that,
‘developers must invest more in design to achieve
high quality development at higher densities. This
means less reliance on standard types and a
greater freedom for designers to respond to the
potential of individual sites’.
No explicit economic analysis of the costs and benefits of such an approach was
undertaken.
Others, such as Rudlin and Falk, offer a different perspective. They advocate both
urban renaissance and improved housing design. Writing in 1999, they say that, ‘in
both the private and social housing fields there are powerful forces at play which
reinforce both suburban designs and suburban locations as well as exerting a
T H E V A L U E O F H O U S I N G D E S I G N A N D L A Y O U T
Llewelyn Davies, 2000
corrosive effect on quality and resisting innovation’. They go on to indicate that,
‘while there are signs that things may be changing, these forces must currently be
seen as a major constraint on the promotion of more urban housing’.
A cautionary note is sounded in other research regarding the operation of the land
and housing market under conditions of supply constraint in the UK. Cheshire and
Sheppard in 1997 indicated that, under conditions of sustained housing demand and
land supply constraints, it is generally ‘planning amenities’ or space that increase
disproportionately in price in comparison with ‘reproducible’ attributes of housing.
These ‘goods’ which the planning system delivers are valued, the authors argue, but
in ignorance of the price that is paid for those planning amenities. ‘Their values are
not just incorporated in the price paid for a house. There are also extra costs. These
are the higher price paid for all housing land, shortage of space and the more
cramped conditions in which we all have to live. Planning amenities are not paid for
directly so they appear to be free. But because they are only produced by restricting
the supply of building land, they cause the price of land, and thus of housing, to rise.’
This analysis would seem to confirm and extend that of Verhage and Needham in
identifying the source of the ‘extra price’ attributable to the ‘residential environment’
outside the dwelling unit in the operation of a restrictive planning system. Design is
not, however, one of the explicit housing attributes considered in the analysis
(although access to schools and to public open space is modelled). Others also
make a similar argument concerning such ‘neighbourhood externality’ effects of
planning-induced improvements in the quality of residential development.
2.4 Housing design quality and ‘value’The publication in 1973 of A design guide for residential areas by Essex County
Council introduced a radically new framework for residential design guidance.
Subsequent research into the impact of such design guidance for private residential
development by the DOE/HRF in 1976 indicated a concern with the cost
implications of design guidance and control. It asserted that, ‘a requirement for a
more expensive design solution for the houses must be offset by a saving in cost
elsewhere, such as in road construction, or by allowing a higher density of
development to reduce the land costs for each dwelling’.
In a discussion paper on good design in housing by Davison in 1990, it is argued
that many aspects of good design add little or no extra costs to residential
schemes, but that some elements of good design do increase costs. It is argued
that, ‘developers who have persisted with high design standards have found that
their product does have an added, premium value, but only on the subsequent
resale when the environment is more settled and established. This benefits
discerning purchasers but does not recoup the developer’s costs’.
Davison estimates that the cost of achieving a broad spectrum of design
improvements might be in the order of 5–10% of the land value. He argues, ‘this
seems to suggest that there should be some scope for planning intervention to
redirect some of the betterment from the landowners’ profits to the benefit of the
A D D R E S S I N G T H E G A P S
21T H E V A L U E O F H O U S I N G D E S I G N A N D L A Y O U T

A D D R E S S I N G T H E G A P S
22
local community with better design, materials and open space’. It is, nevertheless,
claimed that intervention of this type, using planning agreements, is difficult to
achieve, except on sites not already allocated in a local plan.
In a review of the role of housing standards in promoting housing quality in 1992,
Karn argued that ‘not only are there no financial inducements to provide high
standard new housing, there are no national targets for housing quality’. He added
that, ‘certainly there is now a groundswell of unease about trends in standards and
quality of design’. Subsequent research by Karn and Sheridan in 1994 indicated the
very different parameters that influence housing standards and design quality in the
private and housing association sectors. They indicated that, ‘to improve quality of
design in the private sector, we, therefore, conclude that the best mechanism is to
strengthen consumer pressure’.
The Government discussion document Quality in town and country in 1994 argued
in its preface that,
‘Quality pays. Good quality is good economics’.
However, no argument or research was cited to demonstrate this assertion. In
1998, a DETR report examining ways to improve the quality of new housing layouts
argued that many of the obstacles to enhancing quality are symptoms of land
valuation that ignores the cost of quality and the lack of cooperation in the design
process. The report argued, ‘bad design can increase land values. Over-
development with uniform house types laid out on minimum plots, in schemes that
ignore site characteristics and local identity, will maximise the land value. Good
design does not necessarily increase costs, but it is rarely able to match the land
value achieved by bad design. It is therefore essential that quality targets are
established before land values become fixed’.
The report also noted the role of standard house types in maximising the
development value, and therefore the land value, which is considered an essential
aspect of layout design in a competitive market. The limitations of these standard
house types on urban redevelopment sites are recognised and the perspective of
the developer is regarded as crucial. ‘Developers look within the site to assess the
value of the land and the commercial viability of their investment. The importance of
this aspect of development cannot be overstated; it is largely through the
investment of development companies that plans are realised. But commercial
considerations, which should run in parallel with quality and sustainability objectives,
are allowed to dominate the developer’s thinking, often to the exclusion of other
matters. The developer’s appraisal of the setting of the site is concerned with the
housing market rather than design opportunities for the development. Developers
must be encouraged to take a broader view of their activities’.
Research into the external appearance and site layout of new houses,
T H E V A L U E O F H O U S I N G D E S I G N A N D L A Y O U T
Quality in town and country, 1994
commissioned by the Popular Housing Forum in 1998 indicated that, for owners of
new-build housing, ‘issues of site layout were considered more important than the
appearance of an individual property, especially the area in which a house was built.
The appearance of the neighbourhood was seen as more important than the
appearance of the individual house’.
Carmona argued, in 1999, that the issue of the dominance of roads in the
determination of housing layouts is arguably the most difficult component of the
residential landscape to integrate successfully. Not surprisingly, then, the current
period of residential design guidance was ushered in with the publication by the
DETR in 1998 of the report Places, streets & movement, a companion guide to
Design Bulletin 32 — Residential roads and footpaths. In the same year, the
publication of Planning and development briefs: a guide to better practice endorsed
the need to consider design issues at the earliest stage of the planning and
development process (a point which was made strongly in the 1998
POS/HBF/DETR report).
The publication by the DETR of Planning Policy Guidance Note 3: Housing in 2000
consolidated the transformation in national planning policy guidance relating to
design which Carmona dates from the original guidance issued in 1992. The
publication of By design — urban design in the planning system: towards better
practice by DETR/CABE in 2000 began the process of providing national guidance
relating to urban design objectives and aspects of development form. English
Partnerships and The Housing Corporation published the Urban design
compendium by Llewelyn-Davies in 2000 as a complement to By design to
contribute to the improvement of the quality of housing-led regeneration projects
and the promotion of sustainable new development. A companion guide to PPG3,
By design: better places to live, published by DTLR/CABE in 2001 sought to apply
the principles of good quality urban design (set out in Places, streets and movement
and By design) to the residential environment. None of these official publications
considers in detail the issue of costs and added value from improved design quality
in residential environments.
2.5 SummaryThe most striking finding in a review of the literature relating to the quality of
residential design is the almost complete absence of any empirical attempts to
measure the implications of high quality on costs, prices or values.
Few commentators have gone beyond making a distinction between the direct
benefits for built environment stakeholders and those indirect benefits that accrue in
the form of ‘public goods’ or externality effects. Initial attempts to formulate models
of the residential development process which emphasise the institutional and
negotiating context in which residential design solutions are formulated have tended
to be based in a greenfield development context, with few applications in brownfield
contexts. To the extent that brownfield developments involve complex pricing effects
deriving from public goods and externality effects deriving, in part at least, from the
A D D R E S S I N G T H E G A P S
23T H E V A L U E O F H O U S I N G D E S I G N A N D L A Y O U T

A D D R E S S I N G T H E G A P S
24
operation of the land use planning system, the attribution of relative costs and
benefits deriving from design per se have been difficult to isolate and measure. In
particular, it becomes difficult to isolate ‘value’ attributes of residential design
deriving from the dwelling from those deriving from its locational context.
Those who have focused on the process of residential design (at least in the private
sector) have emphasised the crucial importance of the institutional framework in
determining the parameters within which different actors and agencies carry out
housing development. In this process, the establishment and apportionment of
‘added value’ deriving from design is seen to be partially contingent on the place in
the development process at which crucial decisions on design are made (which are,
in turn, reflected in residual land values). The apportionment of that part of the
‘added value’ deriving from design in the development process is dependent on the
complex operation of housing and land markets, so that part of this ‘added value’
may appear upstream or downstream of the residential development process itself.
Very little research has addressed the issue of the commercial value of housing
design to the developer. Most literature relating to architecture, planning, housing
and economics only touches on the issue of the development value that results
from design in the most marginal fashion. Not surprisingly, therefore, methodological
discussions are virtually non-existent. Where they do occur, they usually relate to
greenfield development. In the very considerable literature dealing with urban design
in general, and residential design in particular, there is very little reference at all even
to cost implications, let alone ‘value’.
The references cited in this literature review are contained in Appendix 1.
T H E V A L U E O F H O U S I N G D E S I G N A N D L A Y O U T
3.0
Methodology
M E T H O D O L O G Y

M E T H O D O L O G Y
26
3.1 OverviewThe aim of this study was to define how different types of housing layout and design may
affect the costs of development and the value of the end-product and, hence, how
developer profitability might be affected. The following questions were addressed:
■ What constitutes good design?
■ How can economic value be determined?
■ How can externalities be dealt with?
The research programme comprised three parts.
1 Investigate the background to the project, conduct necessary literature reviews and
justify the chosen empirical methodology involving the selection and comparison of the
matched examples
2 Select appropriate examples of completed developments in matched pairs to
compare developments with certain innovative design elements to those of standard
design. Put a cost and a market value on the developments to determine whether
there is any difference in a standard measure of residual value and therefore potential
developer margins
3 Examine the findings on the selected projects and discuss what forces and factors
may be behind the results. Compare these to other research findings, if appropriate,
and recommend any further research work that might be needed
In overview, a method was devised to compare developments on a like-for-like
basis to facilitate the comparison of different schemes. This was done by comparing
a series of eight examples of different types of housing in four suburban locations
within the South-East. Of these developments, four (one in each location) could be
described as largely PPG3-compliant, in that they employ some degree of
innovative design, and were selected by the commissioners of the report to
represent best practice examples (these have been termed ‘exemplar’ in the report).
The remainder were good developments but following a more standard design
(these have been termed ‘conventional’ in the report). Two of the ‘conventional’
developments in this study are hypothetical as no cooperative developers on a real
development could be found to act as comparators to the exemplar schemes.
The issue of determining commercial value was done on the basis of a residual (i.e.
the sum left after deducting all onsite development, construction and marketing
costs from the house sales revenue). It must be emphasised here that, despite
being expressed as a residual sum per area of land, this residual does not represent
land value. The residual covers land costs, corporate overheads and developer
margin. It also, importantly, represents the sum available to the developer to carry
out any section 106 or other agreements to build community facilities and any
affordable housing element of the development, for example. While the cost of
these agreements is often critical in determining developer margin, we have not
measured them. This is because they are negotiated on a site-by-site basis and
Methodology
T H E V A L U E O F H O U S I N G D E S I G N A N D L A Y O U T
3.0

therefore vary greatly from scheme to scheme. Their inclusion in cost measurement
would not therefore facilitate a like-for-like comparison to be made between
schemes. The residual sum measured in this research is intended to represent both
the commercial value to the developer of the site and also some of the social value
since, without it, the developer could not afford to provide any loss-making social
amenity buildings.
It must be noted here that, given the way the development market works, some of
the residual value measured in this report would be shared with the landowner.
Exactly how much depends not only on what proportion of the residual sum is used
to provide social housing and other section 106 buildings and works, what is
needed in the form of central company overheads, but also on the developer’s
negotiating position. This will be determined by factors such as the degree of
competition for the site from other developers and the form of contract that the
developer enters into with the landowner. No attempt was made to assess how
much of the residual would end up in the pockets of the landowner rather than the
developer.
The methodology was designed to compare each site on a like-for-like basis so all
valuations were made at a single point in time (March 2002) and as if all units were
being sold on the same (exemplar) site in each location. The measurement of land
area was also standardised.
A simple, step-by-step guide to the methodology used is contained in Appendix 4.
Further details of this methodology are given below.
3.2 Selection of case studiesThis research used case studies of real development schemes wherever possible to avoid
being unduly theoretical. The case studies in this research were selected on the basis that
they represented a range of design and layout principles. Four different locations were
selected, all of which contained examples of schemes that followed the urban design
principles in PPG3 or innovative housing developments.
Although initially a variety of locations across the country was identified for study, it was
decided that it would be difficult to identify any differences in value that were due to
regional externalities and regional market differences rather than the issue of design. It
was therefore decided that all locations should be in the South-East to eliminate any
differences attributable to variations in regional house markets and regional economic
considerations.
The sites selected were all on the edge of towns or district centres and all the sites were
suburban in nature. They were Surbiton in outer south-west London, Bishop’s Stortford in
East Hertfordshire, Chelmsford in Essex and Aylesbury in Buckinghamshire.
All of the development schemes selected were examples of mainstream, mass house
building of a good build standard. In each location, two schemes with different types of
design and layout were selected. One was selected on the basis that it was largely
PPG3-compliant and an example of good design practice. (Subsequently, on careful
M E T H O D O L O G Y
27T H E V A L U E O F H O U S I N G D E S I G N A N D L A Y O U T
M E T H O D O L O G Y
28
measurement, some of these schemes turned out not to be PPG3-compliant on the
strict measure of minimum density.) The best practice sites were termed the ‘exemplar’
site in each case. The other site in each location was selected on the basis that it was a
typical example of a standard design and layout type in that location. These sites were
termed the ‘conventional’ site in each case.
The following criteria, established in By design, the DTLR/CABE companion guide
to PPG1, were used to select the exemplary schemes.
■ Character — a place with its own identity
■ Continuity and enclosure — a place where private and public spaces are
easily distinguished
■ Quality of the public realm — a place with attractive and successful outdoor areas
■ Ease of movement — a place that is easy to get to and move through
■ Legibility — a place that has a clear image and is easy to understand
■ Adaptability — a place that can change easily
■ Diversity — a place with variety and choice
Schemes that broadly conformed to these characteristics were selected as the
‘exemplar’ schemes.
The conventional schemes were selected on the basis of their proximity to the
exemplar site and that they represented a good example of what could otherwise
have feasibly been built on the exemplar site. The sites were chosen on the basis of
no other characteristics than that they represented nearby conventional residential
schemes of a decent quality, likely to appeal to broadly the same market sector (in
terms of price) as the exemplar scheme.
A major problem in finding suitable case studies was the reluctance of developers to
participate in the study. To form comparators for the four exemplar schemes,
suitable ‘conventional’ schemes were identified in each case but two of their
developers later refused to participate in the study. Two hypothetical, standard
development schemes were created and costed in the two locations that were left
without ‘conventional’ sites.
There were several reasons for developers’ unwillingness to participate, the main
one being confidentiality. There was also a fear of being held up as an example of
bad design. The ‘conventional’ sites are put forward as reasonable examples of
conventional development with standardised layout practices. Their only shared
characteristic is that, broadly, they are either not PPG3-compliant to the same
extent as the exemplars or that they do not exhibit the innovative or best practice
design principles, set out in the methodology above, to the same extent as the
exemplar examples.
It is also worth noting that in the areas studied there was an increasing scarcity of
non-PPG3 compliant, standard sites to act as conventional examples.
Development, in the South-East and other southern parts of the country at least, is
increasingly characterised by PPG3-type design principles.
T H E V A L U E O F H O U S I N G D E S I G N A N D L A Y O U T

3.3 Dealing with externalitiesOne reason put forward for the lack of comparable studies of value between good design
and standard design quality is the fact that it is difficult to separate the differences in value
that are due to design and those that are due to other factors. These other factors may
include, among other things, access to schools, access to transport, access to other
amenities, etc. Some research studies have attempted to account for these externalities
through sophisticated statistical techniques such as hedonic mix adjusting methods and
the validity of this methodology is addressed in the literature review section of this study.
For the purposes of this study, we originally proposed to identify matched pairs of
‘exemplar’ sites and ‘conventional’ sites with as near identical external characteristics as
possible. The impact of externalities would then be removed in two ways:
1 through eliminating as many of the differences between sites’ locations as possible
2 by measuring the impact of development on a homogenous product, namely land,
rather than trying to assess the difference in value between exogenous units
An initial attempt was made to eliminate site differences through the utilisation of
geographical information systems. However, it was found that there are simply not
enough new build schemes of sufficient size in comparable locations to yield comparators
on this basis.
A revised alternative method of excluding the impact of external influences on value was
required. Instead, conventional developments in the same area but sometimes in slightly
different types of location were chosen. By using a valuation approach to assess the
gross development value of all schemes, the influence of different external factors on each
scheme was then eliminated. This was done by asking experienced valuers, active in the
local market-place, to assess each scheme as if it were on the same site as each of the
exemplar schemes. In this way, like-for-like comparisons were obtained. The only variable
that differed between each matched pair was the design and layout.
During the course of the research, two of the developers of conventional, comparator
schemes decided to withdraw from the study. These schemes (at Chelmsford and
Aylesbury) were replaced by the creation of a hypothetical scheme in each area. These
hypothetical sites contained similar characteristics to the sites already selected (to provide
a grounding in reality). A cost model of these sites was then created by Davis Langdon &
Everest (DL&E) to emulate a typical, conventional local scheme.
The focus of this study on residual value per area of land, as opposed to unit value or
value per square foot of unit, provided a common basis of measurement for all the sites. It
was also a method by which they could all validly be compared. This negated the need to
make adjustments or account for variations in the charateristics of the units on which
value was measured. Instead, the residual value could be specified on a homogenous,
uniform product (land) which differed only by the location of each matched pair. Even this
broader, regional difference between the matched pairs could be eliminated by indexation
using an appropriate index of regional building land values, if required.
M E T H O D O L O G Y
29T H E V A L U E O F H O U S I N G D E S I G N A N D L A Y O U T

M E T H O D O L O G Y
30
3.4 Measuring and quantifying the sites3.4.1 Site area
It became apparent during the course of this study that different developers
measure site area in different ways. It was therefore necessary to standardise the
measurement of sites in order to determine costs and values by land area on a like-
for-like basis.
It was decided that the standard measure should be the total land area that would
have to be bought by the developer in order to complete the development but
excluding:
■ any areas of major infrastructure such as bypasses and any associated
landscaping, major distributor roads, etc
■ land for section 106 development such as social housing, schools, pavilions, etc
■ public open space including verges, footpaths not adjacent to roads (not
pavements), cycle paths, village greens, recreation grounds, parks and other
open space
Each scheme was measured using online Ordnance Survey (OS) maps or by
digitising detailed OS site plans where the OS map was not available online. Where
site boundaries were divided by roads, measurement was made up to the centre of
the carriageway unless there was no current or future development on the other
side of the road, in which case the whole carriageway was included.
While these measures may not always accord with what was done in practice on a
site, it ensured that every scheme has been measured in the same way.
3.4.2 Layout type
The layout characteristics of each scheme were observed and described. Empirical
measurement of the proportion of site land area utilised for different uses was also
made. These uses included:
■ public open space
■ peripheral and feeder roads
■ access roads and cul-de-sacs
■ public driveways, parking courtyards and community space
■ private driveways
■ garages
■ private gardens
■ houses and flats
The proportion of land used for each of the above was intended to give a clearly
quantified picture of the different nature of each scheme.
T H E V A L U E O F H O U S I N G D E S I G N A N D L A Y O U T

3.4.3 Appearance
Visits were made to each site and records made of the appearance of buildings and
the site in general. Marketing material was also gathered to give a picture of internal
layouts, appearance and finishes. In the case of the hypothetical schemes, detailed
specifications, appearance and layout were devised.
3.5 Measuring costsThe building and marketing costs of each scheme were measured and assessed by
Davis Langdon & Everest (DL&E) in extensive site visits and interviews with developers.
In the case of the hypothetical sites, detailed development cost models were utilised in
order to determine the cost to the developer of building and marketing a site.
The methodologies employed are detailed in Appendix 2, which contains the DL&E
report.
The principle used in all the costings was that they should include all external works
required to develop the plots, professional fees, sales and marketing expenses. The
costs were deliberately compiled to exclude the costs of strategic site infrastructure
such as remedial works and major roads, bypasses, road screening, etc. It also
excluded the costs of any section 106 and 278 works as well as funding costs and
central, company overhead contributions.
Costs were stated at March 2002 price levels, having been adjusted using cost
indicators, where appropriate. The costs reflect the locality of each pair of projects
and were not adjusted on a regional or local basis. The cost levels all assume the
completion of the scheme as a single phase for sale in March 2003.
3.6 Measuring valueLittle research has been conducted to ascertain the relative economic value of good
design for the developer. This was specifically addressed by looking at the value of
the whole scheme, rather than individual units (and by looking at the total
development costs that might be involved) in order to determine economic value to
the developer. The reasoning behind this approach was that it eliminated some of
the effects of externalities and looked at commercial value rather than value to the
end-user, the owner-occupier.
Approaches that have been used in other studies (for example, Eppli and Tu,
Valuing the new urbanism, Urban Land Institute, 2001) have looked at value from
the point of view of the open-market value:
■ of individual units
■ traded by, and to, owner-occupiers
■ over time
The disadvantage of this approach was that it does not illustrate the value (or
M E T H O D O L O G Y
31T H E V A L U E O F H O U S I N G D E S I G N A N D L A Y O U T

M E T H O D O L O G Y
32
otherwise) of design to the developer (either an organisation or individual) who will
actually be responsible for building the units (to any given design standard). It is
developers, not owner-occupiers, who will determine whether certain design
practices are put in place or not.
The examination of individual unit values also created problems of comparison
between units, which varied greatly when ownership patterns and other factors
differed. Attempts to adjust for these factors through hedonic mix adjusting were
seen as inadequate because they could never account for every possible influence
on value. Similarly, the choice of factors for which adjustment was made was, at
best, subjective and often arbitrary. Details of the calculations made in this study are
contained in Appendix 5.
A further problem was that other studies have used real transaction data to
determine value differences. This was dangerous because the type and nature of
properties in these transaction samples alter over time so it has not been possible
to compare like with like at every stage. It was considered that there was no
advantage in knowing that house type A sold for x and house type B sold for x + y
if the two could not be validly compared and/or they were sold at different times.
Likewise the examination of price growth failed to account for externalities that may
have been due to factors such as differential economic performance between
localities, the presence of nearby blight, changes in infrastructure and other external
causes which may have been difficult either to account for or eliminate.
Another possible method of approaching this research would have been to use a
contingent valuation method. This would have involved appraising an ‘exemplar’ site
on which best practice housing had been built but then assuming that it had been
built to a ‘standard’ specification, layout and design. The resulting hypothetical value
could then have been compared with the actual values achieved on the best
practice site and conclusions could have been drawn. This approach would have
been valid to an extent (and indeed would have been very similar to the approach
that was actually used where the conventional sites were hypothetical) but it was felt
that such a completely hypothetical approach would not have been entirely credible
to all observers.
The total development value of all the residential units in the schemes under study
was assessed. In order to do this, a variety of local estate agents, valuers and
development sales experts were contacted and asked to value each unit in every
scheme. This method was imperative in the case of the hypothetical examples in
any case but also had the advantage of eliminating any need to adjust revenues
over time as all valuations were made for March 2002.
This valuation method relied on the skill and judgement of valuers who were making
a subjective and hypothetical assessment. Care was taken to ensure that the
valuers used were highly experienced in the field and in the local area with
experience of either selling on the scheme or valuing similar schemes. In addition, at
least two, and often three, opinions of value were sought from different valuers in
T H E V A L U E O F H O U S I N G D E S I G N A N D L A Y O U T

each case. The results were checked for anomalies and the average of all valuations
for each unit was used.
In the case of the hypothetical examples, the schemes were carefully put together
to reflect real, newly built properties that actually exist in the location in question.
Consequently, the valuers were valuing unit types for which they had real
comparables and real-life experience.
3.7 Assessing commercial valueThe assessment of the commercial value to a developer of the scheme was made by:
1 taking the total gross value of the residential units only, as described above
2 subtracting the costs of developing the plots on which the units stand, building
the units, finishing and marketing them according to the criteria set out above
3 analysing this on a per hectare of standardised land measurement
It is important to note that the resulting residual sums in each case never would
have been representative of land value. They would be representative of sums
available to the developer to cover both land costs and central corporate overheads
as well as to be available as developer margin and profit (or loss) on the site.
M E T H O D O L O G Y
33T H E V A L U E O F H O U S I N G D E S I G N A N D L A Y O U T


4.0
Research results and discussion
R E S E A R C H R E S U L T S A N D D I S C U S S I O N
R E S E A R C H R E S U L T S A N D D I S C U S S I O N
36
4.1 Commercial valueWith such a small sample, the headline results were inevitably inconclusive
inasmuch as they neither prove nor disprove that innovative design and layout
improve developer value. The methodology piloted in this report is itself a significant
contribution to understanding values.
Of the four locations studied, three exemplar schemes yielded higher residual values
than the conventional schemes and one yielded poorer residual values to the
developer. In this one case, the difference in the residual value per hectare of land
was less than 5%. Only in one scheme (Surbiton exemplar) was there a clear and
definitively enhanced added value in the exemplar scheme. Here, residual value was
enhanced by more than 15% over and above the standard scheme. In the
exemplars at Bishop’s Stortford and Chelmsford, both schemes’ values appeared to
be enhanced by the nature of their design (by 7.5% and 10.3% respectively).
The following commentary provides some analysis as to what might be behind
these differences in residual values.
4.2 Scheme characteristics The tables in Appendix 3 contain the detailed characteristics of all the sites which help to
explain the different schemes’ performances. The differences between all the schemes
are many, sometimes subtle and certainly varied. Not all of the exemplar examples are by
any means similar, and even the standard examples vary from each other substantially.
4.2.1 Site size
Determining the size of each site in the study proved to be one of the most
challenging aspects of this work. It would appear that the method by which
Research results anddiscussion
T H E V A L U E O F H O U S I N G D E S I G N A N D L A Y O U T
4.0
Scheme Location Residual value per: Difference to matched Hectare Acre pair in same location
A Surbiton – exemplar £12.4m £5.0m +15.3%
B Surbiton – conventional £10.7m £4.3m –13.3%
C Bishop’s Stortford – exemplar £4.6m £1.9m +7.5%
D Bishop’s Stortford – conventional £4.3m £1.7m –6.9%
E Chelmsford – exemplar £3.8m £1.6m +10.3%
F Chelmsford – conventional £3.5m £1.4m –9.3%
G Aylesbury – exemplar £3.5m £1.4m –4.7%
H Aylesbury – conventional £3.7m £1.5m +5.0%
Source: FPDSavills
Table 4.1: Residual value per
area of land

developers measure their sites is by no means standard and varies quite
substantially. Some appear to be very conservative in their measurements (perhaps
to raise the apparent density on the site) while others include every piece of land
bought in order to facilitate the development.
It became apparent that the method by which each and every site was to be
measured needed to be standardised. The standardised measurement is similar to
that outlined in PPG3 but without distinguishing between children’s playgrounds and
other public open space. When measured this way, the schemes studied vary in size
from under 1.5 hectares (under 4 acres) to over 7 hectares (over 18 acres).
The sample contains a wide variety of site sizes ranging from small stand-alone
schemes through small phases on large schemes, big phases on larger schemes
through to large standalone sites.
There appears to be no clear-cut relationship between how big a site is and whether
innovative design is profitable or not. The sample size is insufficient to determine
whether the size of the site itself is an important factor in determining the commercial
performance of different types of design on the site studied. It is notable, however,
that the clearest cut example of added development value was found on the biggest
scheme. This may be because a large scheme has the biggest opportunity to really
create its own sense of place while smaller schemes are more prone to the influence
of other externalities and even other developments on adjacent sites.
It could be that the crucial factor is not size, per se, but the extent to which a
scheme is self-contained. It is notable, for example, that the conventional scheme at
Bishop’s Stortford is small but it is self-contained and distinctive. Due to the
characteristics of the location at Chelmsford, on the other hand, there are fewer
differences between the hypothetical, conventional scheme and the exemplar
scheme. They are not separated or distinct but both conform to very similar layouts
and both are Essex Design Guide compliant.
It is possible that the image of place that has been created by the exemplar schemes
in each case has influenced the value of adjacent conventional schemes. This
R E S E A R C H R E S U L T S A N D D I S C U S S I O N
37T H E V A L U E O F H O U S I N G D E S I G N A N D L A Y O U T
Scheme Location Total area Standardised area Developer’s figure
Hectares Acres Hectares Acres Hectares Acres
A Surbiton – exemplar 9.1 22.6 7.3 18.0 8.3 20.5
B Surbiton – conventional 4.4 10.9 3.9 9.7 4.9 12.2
C Bishop’s Stortford – exemplar 2.7 6.7 2.6 6.4 3.1 7.5
D Bishop’s Stortford – conventional 1.5 3.8 1.5 3.7 1.5 3.7
E Chelmsford – exemplar 4.1 10.1 3.5 8.6 3.5 8.7
F Chelmsford – conventional 4.2 10.4 3.8 9.4 N/A N/A
G Aylesbury – exemplar 1.8 4.6 1.8 4.4 1.9 4.6
H Aylesbury – conventional 2.9 7.3 2.3 5.8 N/A N/A
Source: FPDSavills
Table 4.2: Site size, by
location
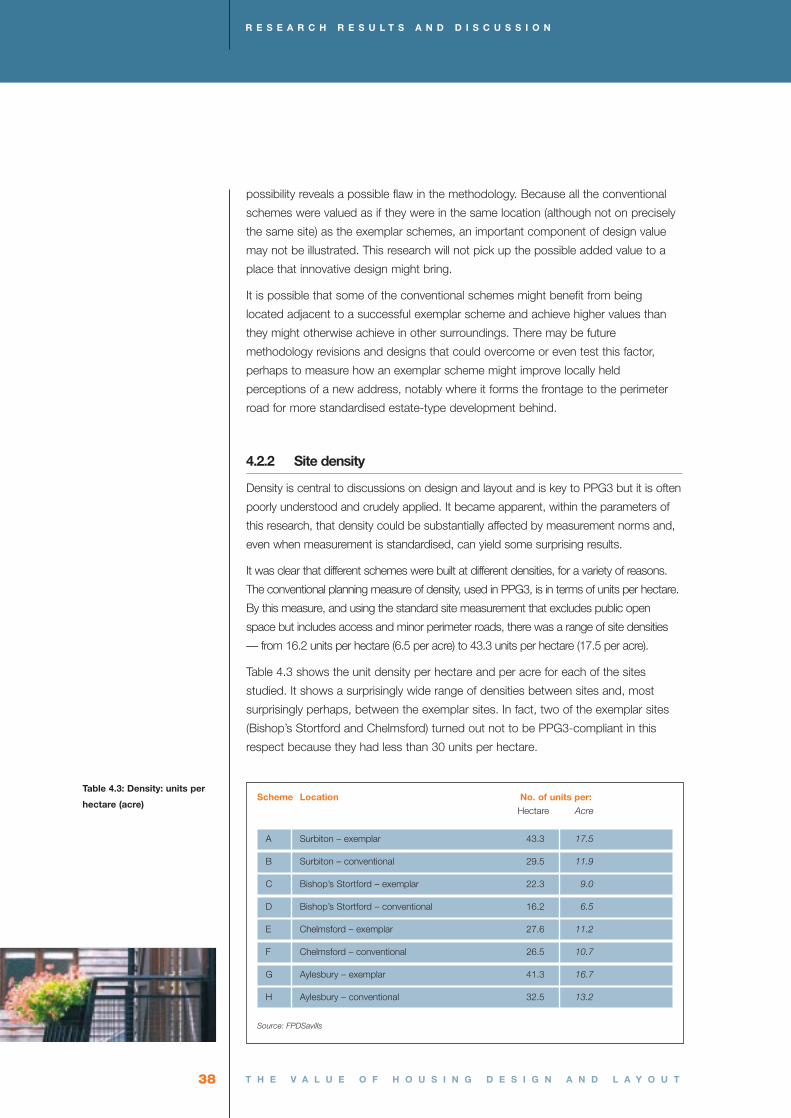
R E S E A R C H R E S U L T S A N D D I S C U S S I O N
38
possibility reveals a possible flaw in the methodology. Because all the conventional
schemes were valued as if they were in the same location (although not on precisely
the same site) as the exemplar schemes, an important component of design value
may not be illustrated. This research will not pick up the possible added value to a
place that innovative design might bring.
It is possible that some of the conventional schemes might benefit from being
located adjacent to a successful exemplar scheme and achieve higher values than
they might otherwise achieve in other surroundings. There may be future
methodology revisions and designs that could overcome or even test this factor,
perhaps to measure how an exemplar scheme might improve locally held
perceptions of a new address, notably where it forms the frontage to the perimeter
road for more standardised estate-type development behind.
4.2.2 Site density
Density is central to discussions on design and layout and is key to PPG3 but it is often
poorly understood and crudely applied. It became apparent, within the parameters of
this research, that density could be substantially affected by measurement norms and,
even when measurement is standardised, can yield some surprising results.
It was clear that different schemes were built at different densities, for a variety of reasons.
The conventional planning measure of density, used in PPG3, is in terms of units per hectare.
By this measure, and using the standard site measurement that excludes public open
space but includes access and minor perimeter roads, there was a range of site densities
— from 16.2 units per hectare (6.5 per acre) to 43.3 units per hectare (17.5 per acre).
Table 4.3 shows the unit density per hectare and per acre for each of the sites
studied. It shows a surprisingly wide range of densities between sites and, most
surprisingly perhaps, between the exemplar sites. In fact, two of the exemplar sites
(Bishop’s Stortford and Chelmsford) turned out not to be PPG3-compliant in this
respect because they had less than 30 units per hectare.
T H E V A L U E O F H O U S I N G D E S I G N A N D L A Y O U T
Scheme Location No. of units per:Hectare Acre
A Surbiton – exemplar 43.3 17.5
B Surbiton – conventional 29.5 11.9
C Bishop’s Stortford – exemplar 22.3 9.0
D Bishop’s Stortford – conventional 16.2 6.5
E Chelmsford – exemplar 27.6 11.2
F Chelmsford – conventional 26.5 10.7
G Aylesbury – exemplar 41.3 16.7
H Aylesbury – conventional 32.5 13.2
Source: FPDSavills
Table 4.3: Density: units per
hectare (acre)

It is interesting to note that, although all the conventional schemes are of lower
density than their matched pairs, some are of higher density than other exemplar
schemes elsewhere. It is noticeable that the density of units per hectare is over twice
as high for the Surbiton exemplar (scheme A) than for its matched pair. This unit
density was achieved by building apartments on the site and it reflects the fact that
this location is among the most urban of all the examples. Achieving similar densities
by building apartments on the scale of scheme A would simply not be an appropriate
option in most of the other locations. It seems certain that it is this very high density
that has contributed to the high residual values seen at the scheme A site.
In this respect, PPG3 can be the developer’s ally by allowing a higher number of
units to be built on a site than might otherwise have been the case in the past. This
will enable unit production to rise on individual sites. Whether this would lead to
higher overall production of units is subject to other factors such as land availability
and is a potential subject for further research.
There is also a balance to be sought between density and the perceived quality of a
place. The Surbiton exemplar (scheme A) arguably achieved this balance by
combining dense and efficient terraced housing and apartments with large areas of
open space. This made for an attractive location coupled with very efficient land use.
It is worth noting the urban nature of such a solution compared to what might be
possible on edge of town sites. Also, the size of the scheme, with its availability of
large open spaces, may be critical in successfully achieving these densities without
overly damaging market value. In this instance, the units in scheme A were worth
slightly less per square metre than its matched conventional scheme, B. It was the
higher number of square metres of built space accommodated in each hectare that
made the big difference in residual land value.
4.2.3 Development density
Development density differs from site density in that it describes something about the
volume of houses built as well as the numbers built for each area of land.
Development density is expressed as a ratio. The ratio is a product of the number of
R E S E A R C H R E S U L T S A N D D I S C U S S I O N
39T H E V A L U E O F H O U S I N G D E S I G N A N D L A Y O U T
Scheme Location Total area of Coverage of housing
development: ft2 units: ft2
A Surbiton – exemplar 785,393 442,786
B Surbiton – conventional 424,172 188,266
C Bishop’s Stortford – exemplar 280,747 93,947
D Bishop’s Stortford – conventional 159,991 68,243
E Chelmsford – exemplar 374,038 121,166
F Chelmsford – conventional 409,916 121,916
G Aylesbury – exemplar 192,991 59,690
H Aylesbury – conventional 251,538 73,364
Source: FPDSavills
Table 4.4: Site coverage, by
location
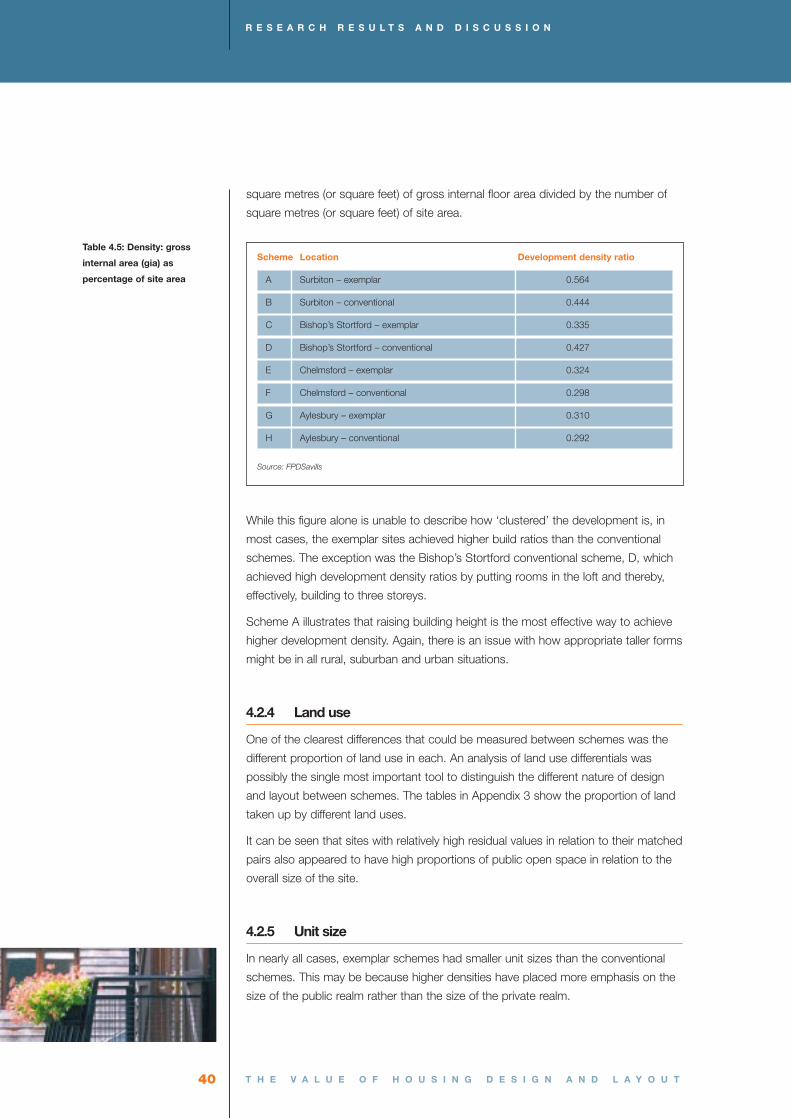
R E S E A R C H R E S U L T S A N D D I S C U S S I O N
40
square metres (or square feet) of gross internal floor area divided by the number of
square metres (or square feet) of site area.
While this figure alone is unable to describe how ‘clustered’ the development is, in
most cases, the exemplar sites achieved higher build ratios than the conventional
schemes. The exception was the Bishop’s Stortford conventional scheme, D, which
achieved high development density ratios by putting rooms in the loft and thereby,
effectively, building to three storeys.
Scheme A illustrates that raising building height is the most effective way to achieve
higher development density. Again, there is an issue with how appropriate taller forms
might be in all rural, suburban and urban situations.
4.2.4 Land use
One of the clearest differences that could be measured between schemes was the
different proportion of land use in each. An analysis of land use differentials was
possibly the single most important tool to distinguish the different nature of design
and layout between schemes. The tables in Appendix 3 show the proportion of land
taken up by different land uses.
It can be seen that sites with relatively high residual values in relation to their matched
pairs also appeared to have high proportions of public open space in relation to the
overall size of the site.
4.2.5 Unit size
In nearly all cases, exemplar schemes had smaller unit sizes than the conventional
schemes. This may be because higher densities have placed more emphasis on the
size of the public realm rather than the size of the private realm.
T H E V A L U E O F H O U S I N G D E S I G N A N D L A Y O U T
Scheme Location Development density ratio
A Surbiton – exemplar 0.564
B Surbiton – conventional 0.444
C Bishop’s Stortford – exemplar 0.335
D Bishop’s Stortford – conventional 0.427
E Chelmsford – exemplar 0.324
F Chelmsford – conventional 0.298
G Aylesbury – exemplar 0.310
H Aylesbury – conventional 0.292
Source: FPDSavills
Table 4.5: Density: gross
internal area (gia) as
percentage of site area

Generally speaking, a bigger unit will sell for more than its smaller counterpart in the other
matched pair. However, the residual value calculations in this report show that this increased
value does not always make up for the more land-hungry nature of a larger building.
4.3 CostsBuild costs are generally considered by housebuilders to be a very important
component of the house building process. There are few developers whose interest
is not closely focused on this element and some devote considerable time, effort and
research to finding ways of reducing it.
This is perhaps misplaced in view of the fact that this study found that enhancing unit
values has a far bigger impact on developer profit than reducing costs. Table 4.7
shows the effect of
■ reducing costs by 10% and
■ increasing revenue (GDV) by 10% on each of the case study sites.
Cost reductions had the effect of increasing the residual value per hectare by
between 4 and 8%. Increasing the value of units had a far bigger impact on potential
margins, increasing the residual value per acre by between 14 and 18%.
While this study’s sample is too small to prove that good design necessarily adds value
to residential units, the GDV per hectare on all but one of the exemplar sites was higher
than the conventional comparator. This indicates the possible value of further research
and development to find ways of increasing the gross development value per hectare
rather than concentrating solely on costs. We believe this merits further investigation.
R E S E A R C H R E S U L T S A N D D I S C U S S I O N
41T H E V A L U E I M P A C T O F H O U S I N G D E S I G N A N D L A Y O U T
Scheme Location Average unit value Unit sizeAverage m2 Average ft2
A Surbiton – exemplar £430,193 130 1,401
B Surbiton – conventional £516,293 151 1,623
C Bishop’s Stortford – exemplar £348,103 150 1,620
D Bishop’s Stortford – conventional £479,646 264 2,843
E Chelmsford – exemplar £238,434 117 1,262
F Chelmsford – conventional £222,024 112 1,207
G Aylesbury – exemplar £155,993 75 807
H Aylesbury – conventional £189,796 90 965
Source: DLE, FPDSavills
Table 4.6: Size of units
A B C D E F G H
Effect of reducing costs -10% 5.05 4.16 6.83 8.09 7.21 6.96 8.40 6.81
Effect of increasing revenue +10% 15.05 14.16 16.83 18.09 17.21 16.96 18.40 16.81
Source: DLE, FPDSavills
Table 4.7: Percentage
increase in residual value on
each site

R E S E A R C H R E S U L T S A N D D I S C U S S I O N
42
Perhaps of significance here is the way in which developers look at their finances. Few
nowadays look at the absolute profit made on a single site but most would look instead
at return on capital employed in the form of an internal rate of return (IRR). This has an
important impact on the ability of developers to discern how they are making their
money, whether it is the act of building houses or whether it is developing land that is
creating value on a site. The form of analysis used here has begun to suggest that it
may be the latter. Further robust investigation needs to be undertaken on more sites in
order to ascertain this.
Full details and analysis of build, site and marketing costs are contained in Appendix 2
but Table 4.8 summarises them.
When measured on a per standardised hectare basis, the building costs of the
exemplar schemes are usually, but not always, higher than the conventional schemes.
The Surbiton exemplar scheme, A, cost nearly twice as much per hectare as its
matched pair, reflecting the fact that it was built at approximately double the density.
The exemplar cases at Chelmsford, E, and Aylesbury, G, both cost 18% more than the
conventional match. It is interesting to note, however, that the exemplar scheme at
Bishop’s Stortford cost less to build per hectare than the conventional example there,
despite the unit density being higher. This possibly reflects the high development
density (or mass) of the conventional scheme.
4.4 Values4.4.1 Unit values
The notion that higher density decreases value was not supported by this study. In two
of the four cases, the value of the units in the higher density scheme was higher on a
per square metre basis than the comparable lower-density schemes (in one case,
substantially so). Clearly, there is a critical balance to be struck by the developer in
maintaining unit values while increasing density. Some developers managed to achieve
T H E V A L U E O F H O U S I N G D E S I G N A N D L A Y O U T
Table 4.8: Total build costsScheme Location Build costs: £000
Per hectare (acre) Per m2 (ft 2)
A Surbiton – exemplar 6,260 (2,533) 1,110 (103)
B Surbiton – conventional 4,467 (1,808) 1,006 (93)
C Bishop’s Stortford – exemplar 3,143 (1,272) 939 (87)
D Bishop’s Stortford – conventional 3,466 (1,403) 812 (75)
E Chelmsford – exemplar 2,761 (1,117) 852 (79)
F Chelmsford – conventional 2,418 (979) 812 (75)
G Aylesbury – exemplar 2,941 (1,190) 950 (88)
H Aylesbury – conventional 2,501 (1,012) 857 (80)
Source: FPDSavills

this while others did not. Striking this balance is the single most important issue in
determining the commercial value of PPG3-compliant schemes for the developer. There
is compelling evidence to advocate that quality design can achieve high value
environments while at the same time increasing density. Build costs are relatively
unimportant in achieving this if value can be maintained.
The value of an individual unit is not a good indication of the value of a scheme to a
developer. Both conventional schemes B and D at Surbiton and Bishop’s Stortford
have average unit values that are considerably higher than the exemplars but the
residual value to the developer per hectare of land is still higher because the unit
densities are higher. Some developers on higher density schemes have achieved a
higher price per square metre than the lower density comparator.
R E S E A R C H R E S U L T S A N D D I S C U S S I O N
43T H E V A L U E O F H O U S I N G D E S I G N A N D L A Y O U T
Scheme Location Unit valueAverage Per m2 (ft 2)
A Surbiton – exemplar £430,193 £3,305 (£307)
B Surbiton – conventional £516,293 £3,424 (£318)
C Bishop’s Stortford – exemplar £348,103 £2,313 (£215)
D Bishop’s Stortford – conventional £479,646 £1,816 (£169)
E Chelmsford – exemplar £238,434 £2,033 (£189)
F Chelmsford – conventional £222,024 £1,980 (£184)
G Aylesbury – exemplar £155,993 £2,082 (£193)
H Aylesbury – conventional £189,796 £2,116 (£197)
Source: DL&E, FPDSavills
Table 4.9: Value of units


5.0
Conclusions
C O N C L U S I O N S

C O N C L U S I O N S
46
This work provides an important first step in beginning to assess the value of design
in the commercial world of housing development. It has not provided any clear-cut
results and could never be deemed to have selected and tested a representative
sample. Nevertheless, it has raised important issues about how design is valued
and has indicated how it may make a difference to developers’ profitability.
The first of the broad issues raised by the research is what creates value in the first
place. A model of housing value, developed by FPDSavills’ Research Department
illustrates that there are numerous components of housing value ranging from basic
shelter qualities, through amenity value and luxury value to investment and even
speculative value. Design can clearly impact on the quality of the shelter and the
amenities that a house has, and certainly the extent to which it is deemed to be
luxurious or desirable.
The study highlighted the extent to which one development, particularly those larger
schemes studied, can affect local externalities. There can be a knock-on effect on
the surrounding area affecting not only value but also the sense of place and how a
locality is perceived. It was noticeable that the innovative design elements of one
developer on some parts of a larger development area could influence the value of
the more conventionally designed housing on another part of a site, even though
that housing did not follow the same design principles.
Does this research begin to address the question of how a desirable location may
be created? The endlessly quoted and much loved estate agents’ and TV
presenters’ phrase, ‘location, location, location’ is usually put forward as
emphasising the most important element of housing value. Leaving aside the
macroeconomics, there is a series of factors, including the built form, which creates
a sense of place in a given location. Some of the developers in this study have
helped to show that it is possible to create a sense of place, and hence a new type
of location, on a piece of land by employing certain design principles. These new
places may be more desirable, and therefore more valuable, than their neighbours
and may also be made more desirable and valuable than would otherwise have
been possible had standard development house types and layouts been employed.
There is a strong compulsion to undertake further research using the method
developed in this study to confirm that which is presently only indicative.
Developers and researchers in other locations and other situations have also
noticed that the creation of a distinct place can enhance value. This value
enhancement can spread further than just the site in question. Neighbouring
developers and landowners also benefit. Commercial developments of high quality
on a large scale have pushed up neighbouring land values for both commercial and
residential development; examples include Brindley Place in Birmingham and Canary
Wharf in London. Within this study, the exemplar schemes at Surbiton and
Chelmsford may have achieved this. Other developers on nearby sites may well be
benefiting from the sense of place that these schemes have provided for the
location.
When it comes to value for a developer as opposed to an owner-occupier, it may be
Conclusions
T H E V A L U E O F H O U S I N G D E S I G N A N D L A Y O U T
5.0

more appropriate to talk about ‘density, density, density’. The issues involved are
complex but the rules of the game now seem to be to maximise unit values while
increasing the number of units on the site to meet planners’ requirements. It may be
said that this has always been the developers’ game plan but new design
techniques, and indeed changing planning rules, have upped the stakes. Whereas
previously a developer might have aimed for densities of between 25 and 30 per
hectare (10 and 12 per acre), new planning and design technologies have changed
the target to something more like 30–40 per hectare (12–16 per acre). In urban
situations, these densities would be very much higher again. Values will only be
maintained at these densities if design techniques become very much more
sophisticated to maintain the attractiveness to occupiers.
Another question that this research raises is whether design can ever make a really
big value difference in a supply-constrained market. The sites under study were all
in high demand regions of south-eastern England. This region is particularly
characterised by very low levels of new build in relation to increasing demand for
housing. The number of new developments makes a very small impact on overall
supply in those housing markets. In a supply-constrained scenario, it may be that
design has less of an impact than where purchasers’ choices are freer. The question
perhaps is, where the supply of new homes meets demand, whether conventional
designs would sell at a discount or whether enhanced design would sell at a
premium.
The final, and perhaps most important, question is whether this research is really
measuring value to the developer. The margin that the developer makes out of any
scheme is still highly dependent on the price the developer paid for the land. Even
huge residuals would mean nothing if the developer has to pay exceptionally high
prices to secure the land. In cases where competition for land is high (as it is in
much of the South-East), it is likely that any developer with a competitive advantage
(whether it be through design or for any other reason) will have to pass much of that
value on to the landowner. This is because they would need to use enhanced value
as their bidding advantage in order to secure the site against competition in the first
place. Only where developers are part of the longer term land acquisition, ownership
and land development process are they more likely to benefit from any enhanced
value of their design efforts. This is likely to favour more adventurous developers
who can add value at the start of the development process through design and
detailed master-planning and who are prepared to separate their building activity
from this specialised, but potentially lucrative, task.
Ultimately, therefore, it is very likely that if, for any reason, there were to be a
revolution in development values it would only prove advantageous to a developer
while the developer’s competition were unwilling or unable to make use of the
advantage themselves. FPDSavills has already predicted that land values will be
driven up during the next 5–10 years, primarily through development gains of
increased density. If certain other design principles were also discovered to increase
development value, no doubt these would find their way into land values as well.
Not all of the exemplar schemes selected are as dense as PPG3 recommends.
C O N C L U S I O N S
47T H E V A L U E O F H O U S I N G D E S I G N A N D L A Y O U T

T H E V A L U E O F H O U S I N G D E S I G N A N D L A Y O U T
C O N C L U S I O N S
48
While it would appear that good design may have enhanced the schemes’
commercial value, what this study begins to show is that good design becomes
more and more essential to achieve the maximum value as schemes increase in
density, over 30 units per hectare. Standard design and standard layouts will not
work on high density developments. Increases in density must accompany
increased attention to design quality: there are clear commercial rewards when this
course is followed.
There are clearly many questions to be answered and new avenues for this research
to go down. A geographically broader and increased sample would enable more
vigorous testing of hypotheses. It is to be hoped that this study will show how sites,
costs and values can be analysed and that more developers will be willing to offer
their schemes for scrutiny.
Literature review references
Appendix 1.0
A P P E N D I X 1
A P P E N D I X 1
50
Adams, D. (1994) Urban planning and the development process, London, UCL Press
Ball, M. (1983) Housing policy and economic power: the political economy of owner-occupation, London,
Methuen
Bartlett School of Planning, CABE (2001) The value of urban design, London, Thomas Telford
Booth, P. (1982) ‘Housing as a product: design guidance and residential satisfaction in the private sector’, Built
Environment, 8, No. 1, 20–24
Bramley, G., Bartlett, W. and Lambert, C. (1995) Planning, the market and private housebuilding, London, UCL
Press
Carmona, M. (1999) ‘Controlling the design of private sector residential development: an agenda for improving
practice’, Environment and Planning B: Planning and Design, 26, 807–833
Carmona, M. (2001) Housing design quality: through policy, guidance and review, London, E & FN Spon
Cheshire, P. & Sheppard, S. (1997) ‘The welfare economics of land use regulation’, research papers in spatial
and environmental analysis No. 42, Department of Geography, London School of Economics
Cheshire, P. and Sheppard, S. (2000) ‘Building on brown fields: the long term price we pay’, Planning in
London, 33, April/June, 34–36
Civic Trust (1999) Brownfield housing – 12 years on, London, Civic Trust
Colquhoun, I. and Fauset, P.G. (1991) Housing design in practice, Harlow, Longman Scientific and Technical
Conran Roche/Davis Langdon & Everest (1989) Costs of residential development, London, Conran Roche
Davison, I. (1991) Land values: part of the design equation, Housebuilder, March, 38–44
Davison, I. (1990) Good design in housing, London, House Builders Federation/Royal Institute of British
Architects
Department of the Environment/Housing Research Foundation (1976) Design guidance survey: report on a
survey of local authority design guidance for private residential development, London, Department of the
Environment
Department of the Environment (Northern Ireland)/Department for Regional Development (2000) Creating
places: achieving quality in residential environments, Department of the Environment, Northern Ireland
Department of the Environment, Transport and the Regions (1998a) Places, streets and movement: a
companion guide to Design Bulletin 32 — Residential roads and footpaths, London, DETR
Department of the Environment, Transport and the Regions (1998b) Planning and development briefs: a guide
to better practice, London, DETR
Department of the Environment, Transport and the Regions (2000) Planning Policy Guidance Note 3: Housing,
Norwich, The Stationery Office
Department of the Environment, Transport and the Regions/Commission for Architecture and the Built
Environment (2000) By design, Urban design in the planning system: towards better practice, London,
Thomas Telford
Department of Transport, Local Government and the Regions/Commission for Architecture and the Built
Environment (2001) By design: better places to live, London, Thomas Telford
Essex County Council (1973) A design guide for residential areas, Colchester, County Council of Essex
Essex Planning Officers Association (1997) A design guide for residential and mixed use areas, Essex, Essex
Planning Officers Association
Goodchild, G. (1994) ‘Housing design, urban form and sustainable development’, Town Planning Review,
65 (2) 143–158
Goodchild, B. (1997) Housing and the urban environment: a guide to house design, renewal and urban
planning, Oxford, Blackwell Science
a1.0
T H E V A L U E O F H O U S I N G D E S I G N A N D L A Y O U T
Literature reviewreferences
T H E V A L U E O F H O U S I N G D E S I G N A N D L A Y O U T 51
Hall, A. (1990) Generation of objectives for design control, Chelmsford, Anglia College Enterprises Ltd
Hanson, J. (1999) Decoding homes and houses, Cambridge, Cambridge University Press
Hooper, A. & Nicol, C. (1999) ‘The design and planning of residential development: standard house types in
the speculative housebuilding industry’, Environment and Planning B: Planning and Design, 26, 793–805
Hooper, A. & Nicol, C. (2000) ‘Design practice and volume production in speculative housebuilding’,
Construction Management and Economics, 18, 295–310
Karn, V. (1992) ‘British housing standards: time for a new approach?’ in Housing design — time for a new
approach, London, Housing Centre Trust
Karn, V. and Sheridan, L. (1994) New homes in the 1990s: a study of design, space and amenity in housing
association and private sector production, University of Manchester/Joseph Rowntree Foundation
Leopold, E. and Bishop, D. (1983a) ‘Design philosophy and practice in speculative housebuilding: Part 1’,
Construction Management and Economics, 1, 119–144
Leopold, E. and Bishop, D. (1983b) ‘Design philosophy and practice in speculative housebuilding: Part 2’,
Construction Management and Economics, 1, 233–268
Llewelyn-Davies (1994) Providing more homes in urban areas, University of Bristol, SAUS Publications
Llewelyn-Davies (1998) Sustainable residential quality: new approaches to urban living, London, London
Advisory Planning Committee
Llewelyn-Davies (1999) Sustainable residential quality II: approach and method statement, London, London
Advisory Planning Committee
Llewelyn-Davies (2000a) Sustainable residential quality: exploring the housing potential of large sites, London,
London Advisory Planning Committee
Llewelyn-Davies (2000b) Urban design compendium, London, English Partnerships/The Housing Corporation
Nicol, C. & Hooper, A. (1999) ‘Contemporary change and the housebuilding industry: concentration and
standardisation in production’, Housing Studies, 14, No. 1, 57–76
Parfect, M. and Power, G. (1997) Planning for urban quality: urban design in towns and cities, London,
Routledge
Planning Officers Society, Housebuilders Federation and DETR (1998) Housing layouts — lifting the quality,
London, HBF
Popular Housing Forum (now Popular Housing Group) (1998) Kerb appeal: the external appearance and site
layout of new houses, Winchester, Popular Housing Group
Punter, J. and Carmona, M. (1997) The design dimension of planning: theory, content and best practice for
design policies, London, E & FN Spon
RICS (1996) Quality of urban design: a study of the involvement of private property decision-makers in urban
design, London, Royal Institution of Chartered Surveyors
Rudlin, D. & Falk, N. (1995) 21st century homes: building to last, York, Joseph Rowntree Foundation
Rudlin, D. & Falk, N. (1999) Building the 21st century home: the sustainable urban neighbourhood, Oxford,
Architectural Press
Sim, D. (1993) British housing design, Harlow, Longman
Syms, P. (2001) Releasing brownfields, London, RICS Foundation
Syms, P. and Knight, P. (2000) Building homes on used land, London, RICS Books
Urban Task Force (1999) Towards an urban renaissance, London, E & FN Spon
Verhage, R. and Needham, B. (1997) ‘Negotiating about the residential environment: it is not only money that
matters’, Urban Studies, 34, No. 12, 2053–2068
Worpole, K. (1999) The value of architecture — design, economy and the architectural imagination, RIBA
Future Studies Series, London, RIBA
L I T E R A T U R E R E V I E W R E F E R E N C E S

Cost analysis by Davis Langdon & Everest
Appendix 2.0
A P P E N D I X 2
A P P E N D I X 2
54
A2.1 Introduction This section of the report discusses the objectives and scope of the analysis of
housing development costs. The methodologies adopted for data collection,
analysis and presentation are outlined. Issues associated with the analysis of the
data and the results, which could have an influence on the overall outcome of the
study, are also identified.
A2.2 Objective The objective of this cost assessment is to establish benchmark development costs
for each scheme using formats that facilitate direct comparison. The adjustment and
analysis of the development cost data provides the basis on which an assessment
of net development value and overall land value can be calculated. Issues that need
to be addressed in preparing this analysis include:
■ the establishment of a common data structure
■ ensuring that the full scope of relevant development costs are captured for
each project
■ adjusting costs for time and location to enable direct comparisons to be made
between matched pairs of developments
A2.3 Data collection Construction and development cost data has been collected directly from a group
of contributing housebuilding companies. Interviews were held with commercial
managers, during which detailed cost and project information was collected. These
meetings gave Davis Langdon & Everest’s (DL&E’s) researchers the opportunity to
collect additional information related to market conditions and other variables that
could potentially affect the overall development cost assessment.
No standard cost breakdown structure is available for use on private housing
projects. The information collected for this project has, as a result, been provided in
a number of formats, often related to the costs of individual trades or tranches of
building materials. The researchers have re-categorised this information to permit
direct comparison between projects.
The information provided by the developers is potentially very commercially
sensitive. The team’s awareness of this consideration has influenced the extent to
which detailed analysis of the development costs information can be undertaken as
follows:
■ costs are reported on a scheme-wide basis; specific costs for individual
dwelling types are not published
■ costs are reported using indirect units of comparison (cost per square foot of
gross internal floor area or cost per acre)
T H E V A L U E O F H O U S I N G D E S I G N A N D L A Y O U T
a2.0 Assessment ofdevelopment costs

In two locations, it has not been possible to obtain detailed project and cost
information for a pair of comparable projects. In these circumstances, models have
been developed based on design information available in the public domain and
comparable cost information derived from the rest of the sample. The issues
associated with the preparation of the models are discussed further in section A2.5
below.
A2.4 Scope and structure of project cost data In the preparatory analysis, cost data collected from each developer has been
adjusted to include only cost centres that relate to the development cost of specific
phases of development. For example, in order to facilitate comparison between
schemes, costs of primary infrastructure and site development costs have been
excluded. The following cost centres are included in the analysis:
■ construction cost — building only
■ construction costs — external works and services constructed as part of the
development
■ phase featured in the sample
■ construction costs — preliminaries (contractor’s on-site management
resources)
■ internal development costs including:
— designers’ fees, fees associated with planning and NHBC inspections, etc
— internal marketing costs including show homes, sales staff costs and
advertising, etc
Items excluded from the analysis include:
■ remediation works
■ site development costs beyond the boundary of the site/phase — this
includes all section 106 and section 278 works associated with the
development
■ for larger schemes, where the sample comprises one or more phases of a
larger development, this means that the costs of site preparation and strategic
infrastructure works required to prepare the site for development are also
excluded, as are communal facilities such as parks and shelter belts which
benefit other phases of the scheme
■ for smaller, or self-contained schemes, all infrastructure within the site
boundary is included, on the basis that the extent of works required will be
equivalent to that of a single phase on a larger housing development
■ finance costs
■ costs of head office overheads and profit
The exclusion of these items from the scope of the analysis does not affect the
validity of the outcome. By removing site- and contractor-specific variables, such as
C O S T A N A L Y S I S B Y D A V I S L A N G D O N & E V E R E S T
55T H E V A L U E O F H O U S I N G D E S I G N A N D L A Y O U T

A P P E N D I X 2
56
those related to site conditions, infrastructure and planning requirements, and costs
of development, capital costs based on common criteria can be directly compared.
While this represents a simplification of the total cost equation, use of this
assumption ensures that the analysis identifies relationships between scheme
design, density building cost and development value. In particular, the exclusion of
planning gain costs, etc removes a significant source of site-specific variation from
the data set.
A2.5 Analysis of the dataA2.5.1 Normalisation
The primary objective of the analysis is to provide consistent, comparable
development cost information for input into the overall assessment of development
value. The data is also presented in a range of formats to facilitate the comparison
of schemes in the sample.
Adjustments required to ensure that the cost information is comparable are as
follows:
■ Inflation — development costs have been brought to a common datum
(March 2002) using DL&E’s published tender price index. The adjustments
used were verified using information provided by feedback from the
developers’ commercial managers
■ Location — cost differentials between locations have been updated to levels
current in March 2002 using location factors published by the Building Cost
Information Service of the RICS
■ Common units of comparison — gross internal floor area and overall site
area have been used as the units of comparison
A2.5.2 Development of cost models
It has not been possible to obtain cost information for two schemes in the sample.
As an alternative, cost models have been prepared to provide the basis for the
comparison. The key features of the cost models are:
■ the size, layout and mix of dwellings is based on a specific, directly
comparable scheme
■ costs are derived from appropriate schemes elsewhere in the sample
■ cost models reflect differences in quantities related to key cost drivers for each
house type
■ models were developed for each house type in a scheme
The models were developed from drawn information and other marketing material
available in the public domain. While the research team acknowledges that the
models are generic and cannot account for all minor variations in detailed design,
these variations only have a limited cost impact. Given the circumstances of the
T H E V A L U E O F H O U S I N G D E S I G N A N D L A Y O U T

study, the models represent the most effective method of obtaining cost information
with an acceptable level of accuracy.
In compiling the models, DL&E have also taken into account differences in external
works content — particularly road and sewer layouts. The assessment of other
development costs (fees, marketing costs, etc) is based on a review of the
proportion of costs recorded on the other projects in the sample.
A2.5.3 Presentation of the data
The results of the analysis are published in three formats.
■ Total cost per square foot of gross internal floor area. This analysis
provides a direct comparison of development cost based on the average
building cost for each scheme. A number of variables will affect these costs,
including some which are site-specific rather than related to the design of the
house type such as:
— extent of substructure works related to local ground conditions
— extent of external works, which are affected by both the extent and
quality of works in the public domain, and by the development density
of the scheme
The inclusion of these costs makes it difficult to identify differences in the
construction costs related to specification. These can be identified more
clearly in an analysis of superstructure costs
■ Superstructure only costs per square foot of gross internal floor area.
This analysis eliminates the variables of substructure and external works and
enables a direct comparison to be made between the costs associated with
the build quality of the particular dwelling mix
This comparison excludes the key element of the external works, which clearly
contribute to value through the provision of a high quality public realm.
External works need to be assessed using a different unit of comparison —
site area — to provide meaningful results
■ Total costs per acre. This analysis enables the effect of the key variable of
development density to be accounted for. External works costs can be
compared directly on the basis of the site area rather than gross internal floor
area (gifa)
A2.6 ResultsTable A2.1 sets out the total development costs for the eight schemes in the
sample. The projects are organised as matched pairs in accordance with the study
methodology outlined elsewhere in this report. The costs of each matched pair of
schemes have been brought to a common datum related to their location. Table
A2.2 uses a similar format to present superstructure-only costs.
C O S T A N A L Y S I S B Y D A V I S L A N G D O N & E V E R E S T
57T H E V A L U E O F H O U S I N G D E S I G N A N D L A Y O U T
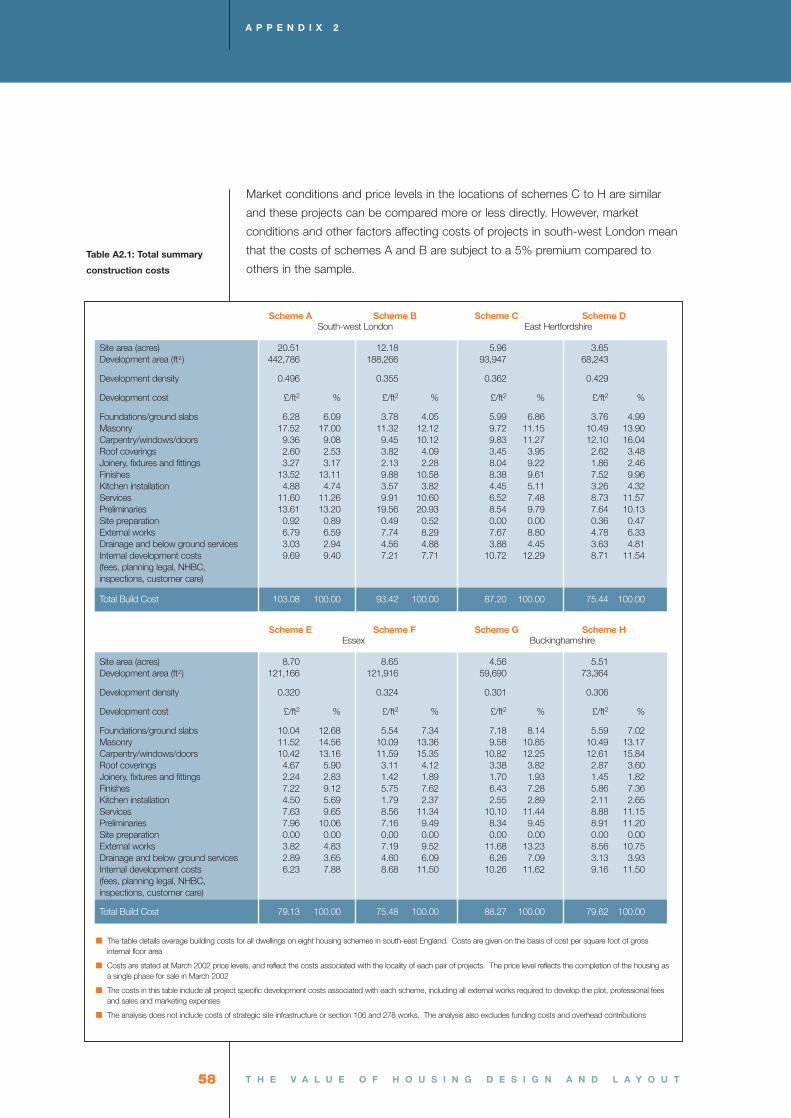
A P P E N D I X 2
58
Market conditions and price levels in the locations of schemes C to H are similar
and these projects can be compared more or less directly. However, market
conditions and other factors affecting costs of projects in south-west London mean
that the costs of schemes A and B are subject to a 5% premium compared to
others in the sample.
T H E V A L U E O F H O U S I N G D E S I G N A N D L A Y O U T
Table A2.1: Total summary
construction costs
Scheme A Scheme B Scheme C Scheme DSouth-west London East Hertfordshire
Site area (acres) 20.51 12.18 5.96 3.65Development area (ft2) 442,786 188,266 93,947 68,243
Development density 0.496 0.355 0.362 0.429
Development cost £/ft2 % £/ft2 % £/ft2 % £/ft2 %
Foundations/ground slabs 6.28 6.09 3.78 4.05 5.99 6.86 3.76 4.99Masonry 17.52 17.00 11.32 12.12 9.72 11.15 10.49 13.90Carpentry/windows/doors 9.36 9.08 9.45 10.12 9.83 11.27 12.10 16.04Roof coverings 2.60 2.53 3.82 4.09 3.45 3.95 2.62 3.48Joinery, fixtures and fittings 3.27 3.17 2.13 2.28 8.04 9.22 1.86 2.46Finishes 13.52 13.11 9.88 10.58 8.38 9.61 7.52 9.96Kitchen installation 4.88 4.74 3.57 3.82 4.45 5.11 3.26 4.32Services 11.60 11.26 9.91 10.60 6.52 7.48 8.73 11.57Preliminaries 13.61 13.20 19.56 20.93 8.54 9.79 7.64 10.13Site preparation 0.92 0.89 0.49 0.52 0.00 0.00 0.36 0.47External works 6.79 6.59 7.74 8.29 7.67 8.80 4.78 6.33Drainage and below ground services 3.03 2.94 4.56 4.88 3.88 4.45 3.63 4.81Internal development costs 9.69 9.40 7.21 7.71 10.72 12.29 8.71 11.54(fees, planning legal, NHBC, inspections, customer care)
Total Build Cost 103.08 100.00 93.42 100.00 87.20 100.00 75.44 100.00
Scheme E Scheme F Scheme G Scheme HEssex Buckinghamshire
Site area (acres) 8.70 8.65 4.56 5.51Development area (ft2) 121,166 121,916 59,690 73,364
Development density 0.320 0.324 0.301 0.306
Development cost £/ft2 % £/ft2 % £/ft2 % £/ft2 %
Foundations/ground slabs 10.04 12.68 5.54 7.34 7.18 8.14 5.59 7.02Masonry 11.52 14.56 10.09 13.36 9.58 10.85 10.49 13.17Carpentry/windows/doors 10.42 13.16 11.59 15.35 10.82 12.25 12.61 15.84Roof coverings 4.67 5.90 3.11 4.12 3.38 3.82 2.87 3.60Joinery, fixtures and fittings 2.24 2.83 1.42 1.89 1.70 1.93 1.45 1.82Finishes 7.22 9.12 5.75 7.62 6.43 7.28 5.86 7.36Kitchen installation 4.50 5.69 1.79 2.37 2.55 2.89 2.11 2.65Services 7.63 9.65 8.56 11.34 10.10 11.44 8.88 11.15Preliminaries 7.96 10.06 7.16 9.49 8.34 9.45 8.91 11.20Site preparation 0.00 0.00 0.00 0.00 0.00 0.00 0.00 0.00External works 3.82 4.83 7.19 9.52 11.68 13.23 8.56 10.75Drainage and below ground services 2.89 3.65 4.60 6.09 6.26 7.09 3.13 3.93Internal development costs 6.23 7.88 8.68 11.50 10.26 11.62 9.16 11.50(fees, planning legal, NHBC, inspections, customer care)
Total Build Cost 79.13 100.00 75.48 100.00 88.27 100.00 79.62 100.00
■ The table details average building costs for all dwellings on eight housing schemes in south-east England. Costs are given on the basis of cost per square foot of grossinternal floor area
■ Costs are stated at March 2002 price levels, and reflect the costs associated with the locality of each pair of projects. The price level reflects the completion of the housing asa single phase for sale in March 2002
■ The costs in this table include all project specific development costs associated with each scheme, including all external works required to develop the plot, professional feesand sales and marketing expenses
■ The analysis does not include costs of strategic site infrastructure or section 106 and 278 works. The analysis also excludes funding costs and overhead contributions

The results of the analysis summarised in Tables A2.1 and A2.2 show that the four
urban design exemplar schemes are consistently more expensive to construct than
their conventional equivalents. The only exceptions are the superstructure building
only costs associated with schemes G and H in Essex. The overall cost differential
is set out in Tables A2.3 and A2.4.
C O S T A N A L Y S I S B Y D A V I S L A N G D O N & E V E R E S T
59T H E V A L U E O F H O U S I N G D E S I G N A N D L A Y O U T
Table A2.2: Summary
superstructure construction
costs
Scheme A Scheme B Scheme C Scheme DSouth-west London East Hertfordshire
Site area (acres) 20.51 12.18 5.96 3.65Development area (ft2) 442,786 188,266 93,947 68,243
Development density 0.496 0.355 0.362 0.429
Development cost £/ft2 % £/ft2 % £/ft2 % £/ft2 %
Masonry 17.52 27.92 11.32 22.61 9.72 19.30 10.49 22.52Carpentry/windows/doors 9.36 14.92 9.45 18.87 9.83 19.50 12.10 25.99Roof coverings 2.60 4.15 3.82 7.62 3.45 6.84 2.62 5.63Joinery, fixtures and fittings 3.27 5.21 2.13 4.26 8.04 15.96 1.86 3.98Finishes 13.52 21.54 9.88 19.74 8.38 16.63 7.52 16.14Kitchen installation 4.88 7.78 3.57 7.13 4.45 8.83 3.26 7.00Services 11.60 18.49 9.91 19.78 6.52 12.94 8.73 18.74
Superstructure, fittings and finishes costs 62.76 100.00 50.09 100.00 50.40 100.00 46.57 100.00
Scheme E Scheme F Scheme G Scheme HEssex Buckinghamshire
Site area (acres) 8.70 8.65 4.56 5.51Development area (ft2) 121,166 121,916 56,690 73,364
Development density 0.320 0.324 0.301 0.306
Development cost £/ft2 % £/ft2 % £/ft2 % £/ft2 %
Masonry 11.52 23.90 10.09 23.84 9.58 21.50 10.49 23.69Carpentry/windows/doors 10.42 21.61 11.59 27.39 10.82 24.28 12.61 28.49Roof coverings 4.67 9.69 3.11 7.35 3.38 7.58 2.87 6.47Joinery, fixtures and fittings 2.24 4.65 1.42 3.37 1.70 3.82 1.45 3.28Finishes 7.22 14.98 5.75 13.60 6.43 14.43 5.86 13.24Kitchen installation 4.50 9.34 1.79 4.22 2.55 5.73 2.11 4.77Services 7.63 15.84 8.56 20.24 10.10 22.67 8.88 20.06
Superstructure, fittings and finishes costs 48.19 100.00 42.31 100.00 44.56 100.00 44.27 100.00
■ The table details average building costs for all dwellings on eight housing schemes in south-east England. Costs are given on the basis of cost per square foot of grossinternal floor area
■ Costs are stated at March 2002 price levels, and reflect the costs associated with the locality of each pair of projects. The price level reflects the completion of the housing asa single phase for sale in March 2002
■ The costs in this table include costs associated with the superstructure, finishes and services of the houses in each scheme only. All below ground works, preliminaries andexternal works required to develop the plot, professional fees and sales and marketing expenses are excluded. This analysis makes it easier to identify differences inspecification between each scheme. (Refer to Table 1 for the total costs)
■ The analysis does not include costs of strategic site infrastructure or section 106 and 278 works. The analysis also excludes funding costs and overhead contributions
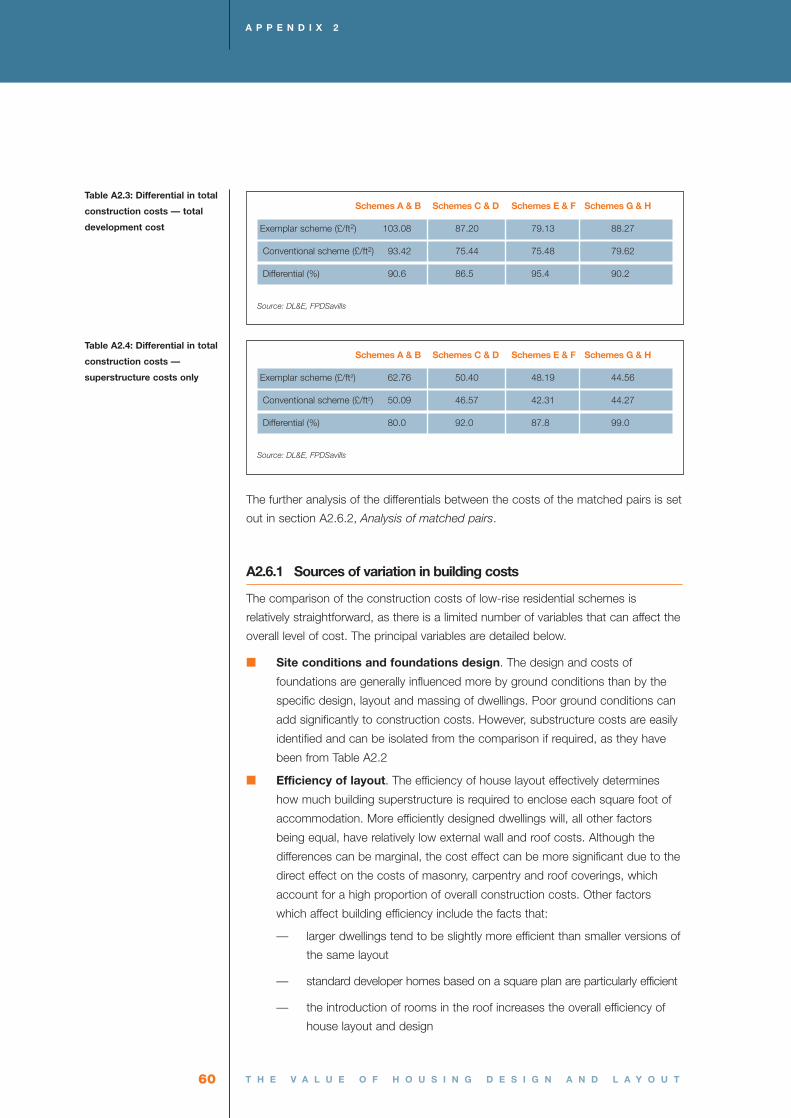
A P P E N D I X 2
60
The further analysis of the differentials between the costs of the matched pairs is set
out in section A2.6.2, Analysis of matched pairs.
A2.6.1 Sources of variation in building costs
The comparison of the construction costs of low-rise residential schemes is
relatively straightforward, as there is a limited number of variables that can affect the
overall level of cost. The principal variables are detailed below.
■ Site conditions and foundations design. The design and costs of
foundations are generally influenced more by ground conditions than by the
specific design, layout and massing of dwellings. Poor ground conditions can
add significantly to construction costs. However, substructure costs are easily
identified and can be isolated from the comparison if required, as they have
been from Table A2.2
■ Efficiency of layout. The efficiency of house layout effectively determines
how much building superstructure is required to enclose each square foot of
accommodation. More efficiently designed dwellings will, all other factors
being equal, have relatively low external wall and roof costs. Although the
differences can be marginal, the cost effect can be more significant due to the
direct effect on the costs of masonry, carpentry and roof coverings, which
account for a high proportion of overall construction costs. Other factors
which affect building efficiency include the facts that:
— larger dwellings tend to be slightly more efficient than smaller versions of
the same layout
— standard developer homes based on a square plan are particularly efficient
— the introduction of rooms in the roof increases the overall efficiency of
house layout and design
T H E V A L U E O F H O U S I N G D E S I G N A N D L A Y O U T
Schemes A & B Schemes C & D Schemes E & F Schemes G & H
Exemplar scheme (£/ft2) 62.76 50.40 48.19 44.56
Conventional scheme (£/ft2) 50.09 46.57 42.31 44.27
Differential (%) 80.0 92.0 87.8 99.0
Source: DL&E, FPDSavills
Table A2.4: Differential in total
construction costs —
superstructure costs only
Table A2.3: Differential in total
construction costs — total
development cost
Schemes A & B Schemes C & D Schemes E & F Schemes G & H
Exemplar scheme (£/ft2) 103.08 87.20 79.13 88.27
Conventional scheme (£/ft2) 93.42 75.44 75.48 79.62
Differential (%) 90.6 86.5 95.4 90.2
Source: DL&E, FPDSavills

■ Specification of materials, fixtures and fittings. The cost breakdown
designed for this study enables significant variations in the cost of elements to
be identified. Some of these differences will be due to specification variations,
which may also affect development value. For the purposes of this study, it is
not necessary to quantify differences between the detailed design of matched
pairs, however, this analysis provides the opportunity to identify where
developers of high cost/higher value properties are spending in response to
consumer demand
■ Kitchens. The square foot cost of kitchens and white goods is generally
higher in smaller dwellings
■ External works. The extent and mix of external treatments, and potential
range of materials and specifications mean that external works also need to
be clearly identified and isolated to enable direct comparison of house
construction costs. External work costs, analysed on the basis of cost per
square foot, are also affected by the density of development, with two factors
in particular combining to affect the overall rate:
— an increasing proportion of hard landscaping as schemes increase in
density, resulting in higher costs
— the reduction in square foot costs of external works generally on
schemes with a high proportion of gross floor area to overall site area
These factors are illustrated in Table A2.5 which sets out the densities and costs
(per square foot and per acre) for external works on each scheme.
Table A2.5 illustrates the range of costs recorded for external works, and the changing
relationships between these costs related to the unit of comparison adopted.
A2.6.2 Analysis of matched pairs
This section of the report sets out a more detailed discussion of the costs of the
projects, based on the data sets detailed in Tables A2.1 and A2.2.
1. Surbiton, south-west London
Schemes A & B are the only developments located in an urban setting. Situated in
south-west London, these are the two most costly schemes in the sample, even
C O S T A N A L Y S I S B Y D A V I S L A N G D O N & E V E R E S T
61T H E V A L U E O F H O U S I N G D E S I G N A N D L A Y O U T
A B C D E F G H
Density 0.496 0.355 0.362 0.429 0.320 0.324 0.301 0.306
Rate (£/ft2) 6.79 7.74 7.67 4.78 3.82 7.19 11.68 8.56
Rate (£/acre) 146,614 119,662 120,956 89,308 53,224 101,288 152,858 113,948
Source: DL&E, FPDSavills
Table A2.5: Summary costs of
external works

A P P E N D I X 2
62
when relative cost levels are taken into account. Schemes A & B are the only
projects that feature apartments as part of the project. Scheme A is also the
densest in the sample. The impact of density can be seen in the relatively low
proportion of expenditure on external works, for a scheme that has the most
extensive landscaping investment. (Cost of landscaping per acre is £146,614
compared to a normalised sample average of £108,916 per acre.)
Relatively high levels of capital expenditure on scheme A are focused on
substructure (associated with undercroft car parking), masonry, joinery and finishes,
reflecting a high level of specification throughout the scheme, which is likely to drive
up overall development value. Scheme B costs are fairly similar to those of projects
outside London. A very high proportion of the costs of this scheme is associated
with preliminaries — which potentially could include items of unstated direct labour
or the sourcing of materials. Table A2.2 sets out superstructure building works only
costs for the sample of eight projects. Adjusted for location (£47.60 per ft2 ), the
costs of scheme B are very similar to those found on projects C to H. Notably, high
levels of expenditure on this scheme are directed at internal finishes.
2. Bishop’s Stortford, East Hertfordshire
Schemes C & D are both high quality developments located on estates on a
rural/urban fringe. Both incorporate elements of PPG3, with dwellings in scheme C
being built up to the street-line, and scheme D featuring houses with rooms in the
roof. Both schemes are designed to a relatively high level of density when measured
on the basis of the ratio of floor area to site area. However, the dwellings on both
schemes are large and neither scheme meets the density targets set in PPG3.
Scheme C features houses strongly influenced by the vernacular design and also
incorporates extensive hard landscaping. The cost breakdown in Table A2.1 shows
that the costs of scheme C are relatively high — demonstrating that the
construction of non-standard housing does involve a cost premium. From the
analysis in Table A2.2, there is evidence of an across-the-board approach to
investment in quality, with higher than average expenditure on joinery, fixtures and
fittings, and finishes.
Scheme D features large four- and five-bed houses. Overall costs are relatively low,
partly due to the large size of the dwellings and also due to the influence of rooms
in the roof on the efficiency of the design and its use of building materials. Table
A2.2 shows that there are particularly low levels of expenditure on roof coverings,
joinery and kitchens. The low cost of roofing and kitchen fittings is often a result of
these costs being amortised over an especially large floor area. The low cost of
joinery and fittings may be as a result of some items being included in the carpentry
section. Overall, the breakdown shows slightly higher expenditure on masonry and
services — areas that directly affect building quality and occupant comfort
respectively. Low external works costs can be associated with the simplicity of the
cul-de-sac design concept and the high density (in terms of relative area, not
number of dwellings) of the scheme.
T H E V A L U E O F H O U S I N G D E S I G N A N D L A Y O U T

3. Chelmsford, Essex
Schemes E & F are phases of development of a large site on a rural/urban fringe.
The design of the layout of both developments is strongly influenced by principles
laid out in the Essex Design Guide. The developments feature a mix of three- and
four-bed dwellings. Only limited information has been provided for scheme E by the
developer. The scheme features a wide variety of units in complex configurations.
While overall scheme development costs, at £79/ft2, are relatively low, the
superstructure building costs, at £48/ft2, are among the highest in the sample. High
levels of expenditure are recorded on substructures, masonry,
carpentry/windows/doors and the kitchen installation. Table A2.2 highlights this
pattern of expenditure.
The construction costs for scheme F are based on the output of a generic model. It
should be noted that the costs of substructure are also based on a generic solution
as no site details or site-specific costs are available. If the substructure costs of
schemes E & F were identical, then the overall construction cost of scheme F would
be just over £80/ft2, i.e. slightly higher than scheme E. This addition to total
construction cost would have a significant impact on development value and funds
available for land purchase. The external works costs for scheme F are the higher of
the pair, related to costs of hard paving to shared driveways and some shared open
space. In both schemes, extensive provision of shared open space, either in
parks/greens, or in heavily landscaped pedestrian avenues, are excluded from the
analysis, as these facilities are provided as part of the overall site infrastructure
rather than as a site-specific amenity.
In the model, while absolute costs for scheme F, detailed in Table A2.2, are lower
than for scheme E, the allocation between cost centres is consistent, with the
exception of expenditure on the kitchen and services.
4. Aylesbury, Buckinghamshire
The costs of scheme H are based on the output of a model, with costs based on
schemes within the sample. Table A2.2 shows that there is little difference between
the costs of superstructure components of the model scheme and scheme G. The
primary source of differential is in the external works and below ground services,
where costs on scheme G are the highest in the sample, featuring substantial levels
of investment in hard landscape, boundary walls, etc. The houses in scheme G are
standard dwelling types with enhancements to masonry and roof specification.
C O S T A N A L Y S I S B Y D A V I S L A N G D O N & E V E R E S T
63T H E V A L U E O F H O U S I N G D E S I G N A N D L A Y O U T


Appendix 3.0
A P P E N D I X 3
Characteristics of each site
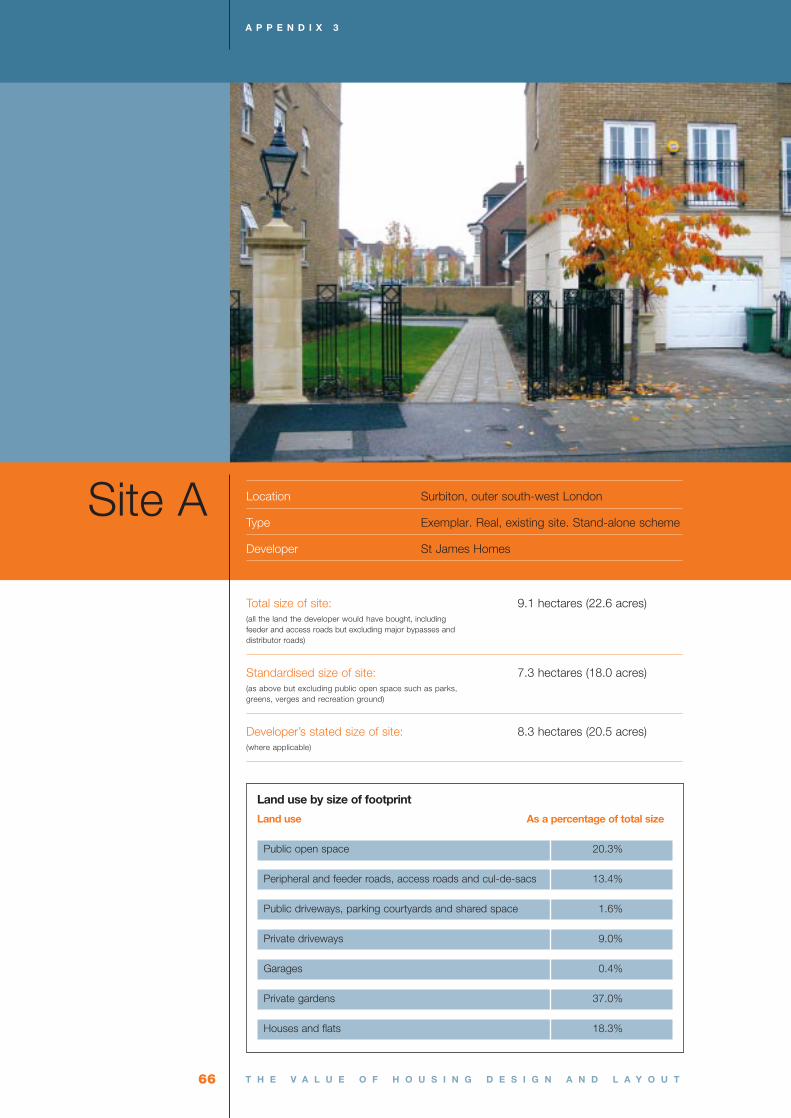
T H E V A L U E O F H O U S I N G D E S I G N A N D L A Y O U T
A P P E N D I X 3
66
Site A
Land use by size of footprint
Land use As a percentage of total size
Public open space 20.3%
Peripheral and feeder roads, access roads and cul-de-sacs 13.4%
Public driveways, parking courtyards and shared space 1.6%
Private driveways 9.0%
Garages 0.4%
Private gardens 37.0%
Houses and flats 18.3%
Location Surbiton, outer south-west London
Type Exemplar. Real, existing site. Stand-alone scheme
Developer St James Homes
Total size of site: 9.1 hectares (22.6 acres)(all the land the developer would have bought, including feeder and access roads but excluding major bypasses and distributor roads)
Standardised size of site: 7.3 hectares (18.0 acres)(as above but excluding public open space such as parks, greens, verges and recreation ground)
Developer’s stated size of site: 8.3 hectares (20.5 acres)(where applicable)

T H E V A L U E O F H O U S I N G D E S I G N A N D L A Y O U T
C H A R A C T E R I S T I C S O F E A C H S I T E
67
Number of units
Type All: 5+ beds 4 beds 3 beds 2 beds 1 bed
Detached 63 38 25 — — —
Semi-detached — — — — — —
Terraced 175 — 175 — — —
Apartments 78 — — — 36 42
TOTAL 316 38 200 — 36 42
Densities On the basis of
Whole site area Standardised site area
Dwellings (units) per hectare (acre) 35 (14) 43 (18)
Habitable rooms per hectare (acre) 203 (82) 255 (103)
Bed spaces per hectare (acre) 190 (77) 239 (97)
Plot ratio (coverage) 0.564
(Gross internal area built as proportion of site area)
Number of habitable rooms 1,859
Number of bed spaces 1,740
Area of all residential buildings (gross internal area) 41,136 m2 (442,786 ft2)

Site B
Land use by size of footprint
Land use As a percentage of total size
Public open space 10.7%
Peripheral and feeder roads 15.1%
Access roads and cul-de-sacs 1.3%
Public driveways, parking courtyards and shared space 0.0%
Private driveways 9.7%
Garages 1.8%
Private gardens 42.3%
Houses and flats 19.3%
Location Surbiton, outer south-west London
Type Conventional. Real, existing site. Large phase
on larger scheme
Developer Fairview
Total size of site: 4.4 hectares (10.9 acres)
(all the land the developer would have bought, including
feeder and access roads but excluding major bypasses and
distributor roads)
Standardised size of site: 3.9 hectares (9.7 acres)
(as above but excluding public open space such as parks,
greens, verges and recreation ground)
Developer’s stated size of site: 4.9 hectares (12.2 acres)
(where applicable)
A P P E N D I X 3
68 T H E V A L U E O F H O U S I N G D E S I G N A N D L A Y O U T

Number of units
Type All: 5+ beds 4 beds 3 beds 2 beds 1 bed
Detached 44 26 18 — — —
Semi-detached 18 6 12 — — —
Terraced 42 2 40 — — —
Apartments 12 — — — 6 6
TOTAL 116 34 70 — 6 6
Densities On the basis of
Whole site area Standardised site area
Dwellings (units) per hectare (acre) 26 (11) 30 (12)
Habitable rooms per hectare (acre) 183 (74) 205 (83)
Bed spaces per hectare (acre) 170 (69) 191 (77)
Plot ratio (coverage) 0.444
(Gross internal area built as proportion of site area)
Number of habitable rooms 806
Number of bed spaces 751
Area of all residential buildings (gross internal area) 17,490 m2 (188,266 ft2)
C H A R A C T E R I S T I C S O F E A C H S I T E
69T H E V A L U E O F H O U S I N G D E S I G N A N D L A Y O U T
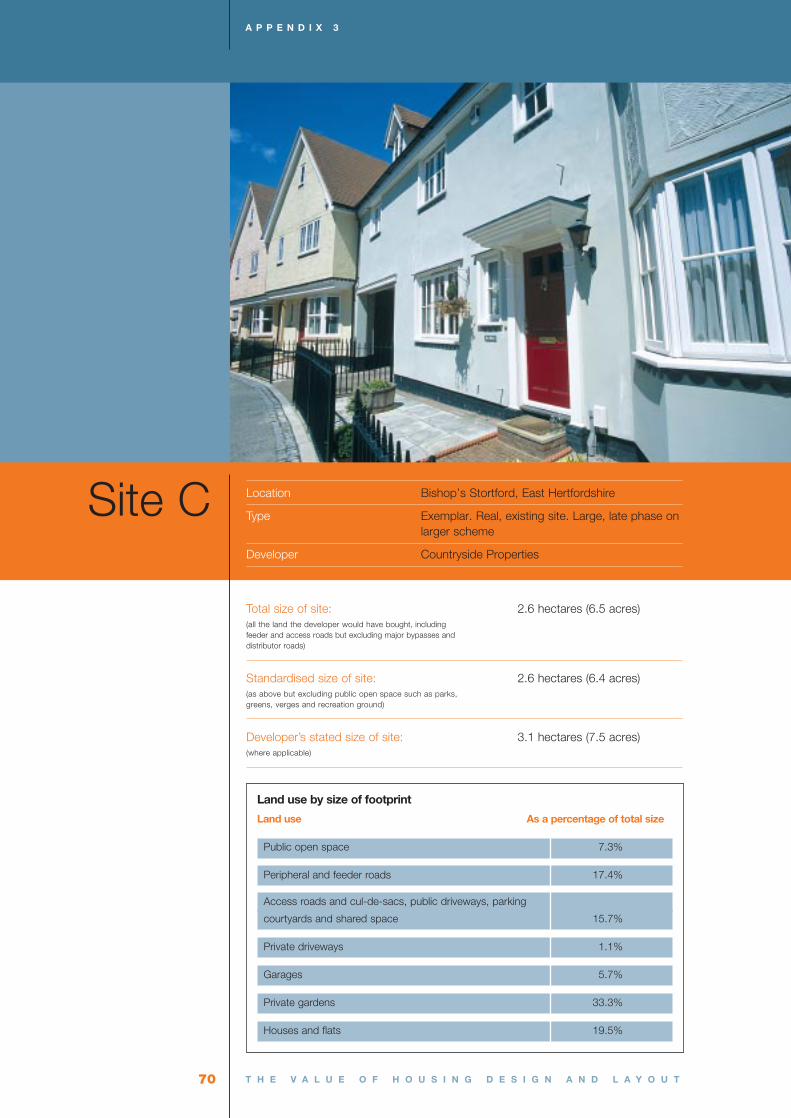
70 T H E V A L U E O F H O U S I N G D E S I G N A N D L A Y O U T
A P P E N D I X 3
Site C
Land use by size of footprint
Land use As a percentage of total size
Public open space 7.3%
Peripheral and feeder roads 17.4%
Access roads and cul-de-sacs, public driveways, parking
courtyards and shared space 15.7%
Private driveways 1.1%
Garages 5.7%
Private gardens 33.3%
Houses and flats 19.5%
Location Bishop’s Stortford, East Hertfordshire
Type Exemplar. Real, existing site. Large, late phase onlarger scheme
Developer Countryside Properties
Total size of site: 2.6 hectares (6.5 acres)(all the land the developer would have bought, including feeder and access roads but excluding major bypasses and distributor roads)
Standardised size of site: 2.6 hectares (6.4 acres)(as above but excluding public open space such as parks, greens, verges and recreation ground)
Developer’s stated size of site: 3.1 hectares (7.5 acres)(where applicable)

71T H E V A L U E O F H O U S I N G D E S I G N A N D L A Y O U T
C H A R A C T E R I S T I C S O F E A C H S I T E
Number of units
Type All: 5+ beds 4 beds 3 beds 2 beds 1 bed
Detached 18 4 13 1 — —
Semi-detached 31 — 14 15 2 —
Terraced 9 — — 9 — —
Apartments 0 — — — — —
TOTAL 58 4 27 25 2 —
Densities On the basis of
Whole site area Standardised site area
Dwellings (units) per hectare (acre) 22 (9) 22 (9)
Habitable rooms per hectare (acre) 134 (54) 136 (55)
Bed spaces per hectare (acre) 127 (51) 129 (52)
Plot ratio (coverage) 0.335
(Gross internal area built as proportion of site area)
Number of habitable rooms 354
Number of bed spaces 333
Area of all residential buildings (gross internal area) 32,049 m2 (334,979 ft2)
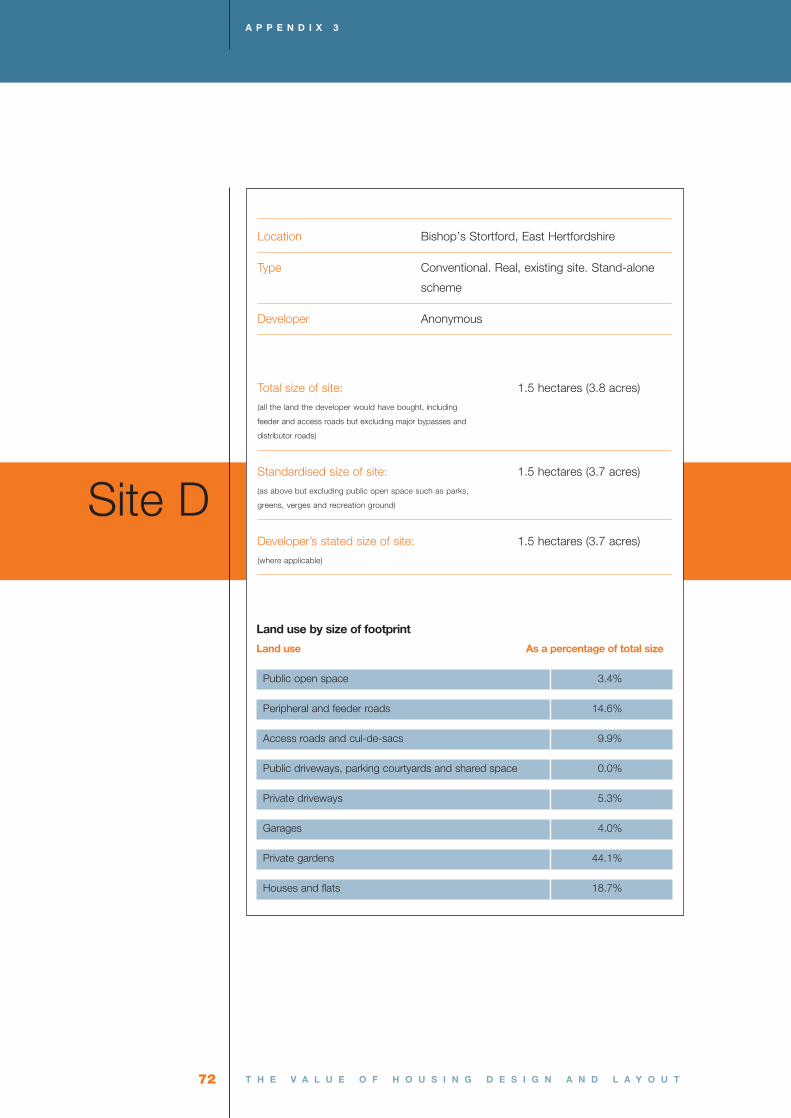
72 T H E V A L U E O F H O U S I N G D E S I G N A N D L A Y O U T
Site D
Land use by size of footprint
Land use As a percentage of total size
Public open space 3.4%
Peripheral and feeder roads 14.6%
Access roads and cul-de-sacs 9.9%
Public driveways, parking courtyards and shared space 0.0%
Private driveways 5.3%
Garages 4.0%
Private gardens 44.1%
Houses and flats 18.7%
Location Bishop’s Stortford, East Hertfordshire
Type Conventional. Real, existing site. Stand-alone
scheme
Developer Anonymous
Total size of site: 1.5 hectares (3.8 acres)
(all the land the developer would have bought, including
feeder and access roads but excluding major bypasses and
distributor roads)
Standardised size of site: 1.5 hectares (3.7 acres)
(as above but excluding public open space such as parks,
greens, verges and recreation ground)
Developer’s stated size of site: 1.5 hectares (3.7 acres)
(where applicable)
A P P E N D I X 3

73T H E V A L U E O F H O U S I N G D E S I G N A N D L A Y O U T
Number of units
Type All: 5+ beds 4 beds 3 beds 2 beds 1 bed
Detached 24 24 — — — —
Semi-detached — — — — — —
Terraced — — — — — —
Apartments — — — — — —
TOTAL 24 24 — — — —
Densities On the basis of
Whole site area Standardised site area
Dwellings (units) per hectare (acre) 16 (6) 16 (6)
Habitable rooms per hectare (acre) 140 (57) 144 (58)
Bed spaces per hectare (acre) 133 (54) 136 (55)
Plot ratio (coverage) 0.427
(Gross internal area built as proportion of site area)
Number of habitable rooms 216
Number of bed spaces 204
Area of all residential buildings (gross internal area) 6,340 m2 (68,243 ft2)
C H A R A C T E R I S T I C S O F E A C H S I T E
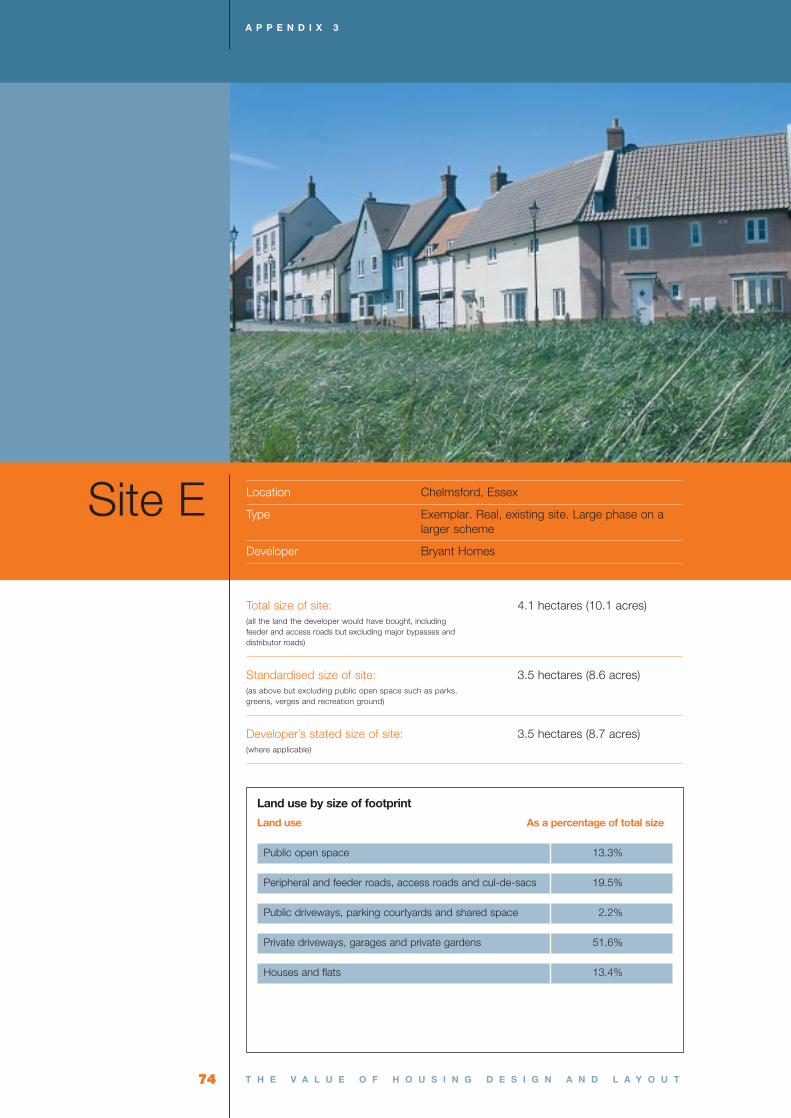
74 T H E V A L U E O F H O U S I N G D E S I G N A N D L A Y O U T
A P P E N D I X 3
74
Site E
Land use by size of footprint
Land use As a percentage of total size
Public open space 13.3%
Peripheral and feeder roads, access roads and cul-de-sacs 19.5%
Public driveways, parking courtyards and shared space 2.2%
Private driveways, garages and private gardens 51.6%
Houses and flats 13.4%
Location Chelmsford, Essex
Type Exemplar. Real, existing site. Large phase on a larger scheme
Developer Bryant Homes
Total size of site: 4.1 hectares (10.1 acres)(all the land the developer would have bought, including feeder and access roads but excluding major bypasses and distributor roads)
Standardised size of site: 3.5 hectares (8.6 acres)(as above but excluding public open space such as parks, greens, verges and recreation ground)
Developer’s stated size of site: 3.5 hectares (8.7 acres)(where applicable)
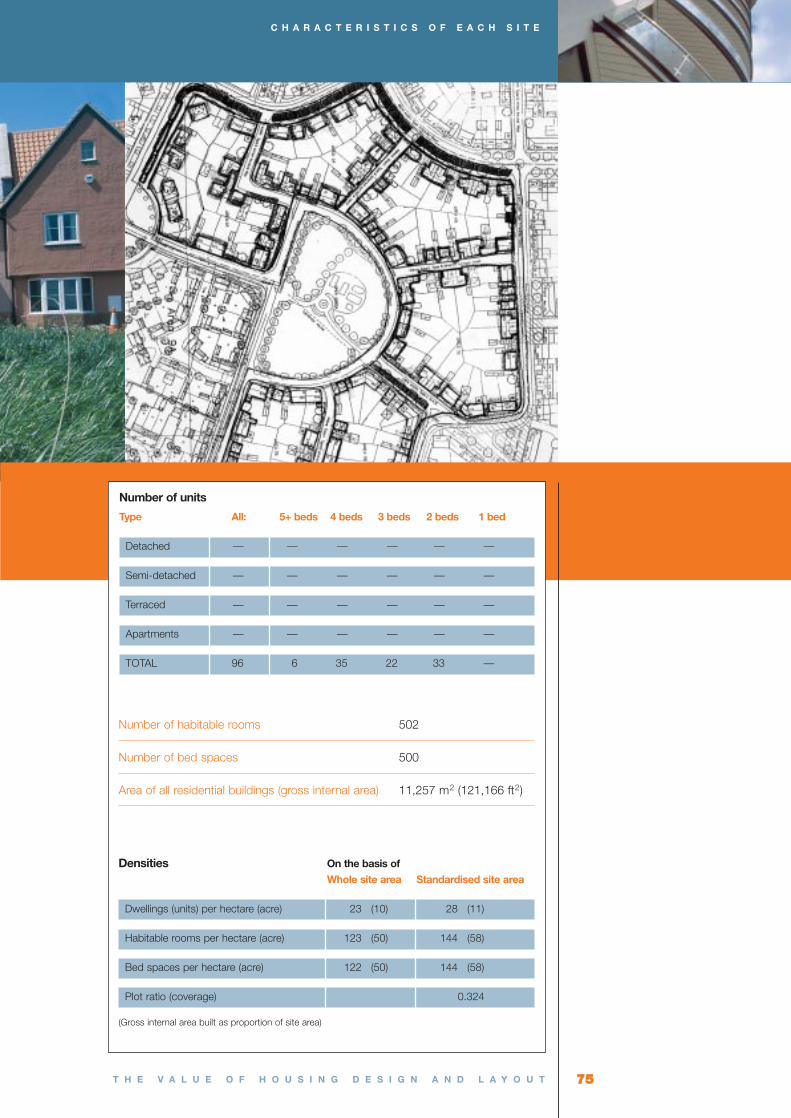
75T H E V A L U E O F H O U S I N G D E S I G N A N D L A Y O U T
C H A R A C T E R I S T I C S O F E A C H S I T E
75
Number of units
Type All: 5+ beds 4 beds 3 beds 2 beds 1 bed
Detached — — — — — —
Semi-detached — — — — — —
Terraced — — — — — —
Apartments — — — — — —
TOTAL 96 6 35 22 33 —
Densities On the basis of
Whole site area Standardised site area
Dwellings (units) per hectare (acre) 23 (10) 28 (11)
Habitable rooms per hectare (acre) 123 (50) 144 (58)
Bed spaces per hectare (acre) 122 (50) 144 (58)
Plot ratio (coverage) 0.324
(Gross internal area built as proportion of site area)
Number of habitable rooms 502
Number of bed spaces 500
Area of all residential buildings (gross internal area) 11,257 m2 (121,166 ft2)
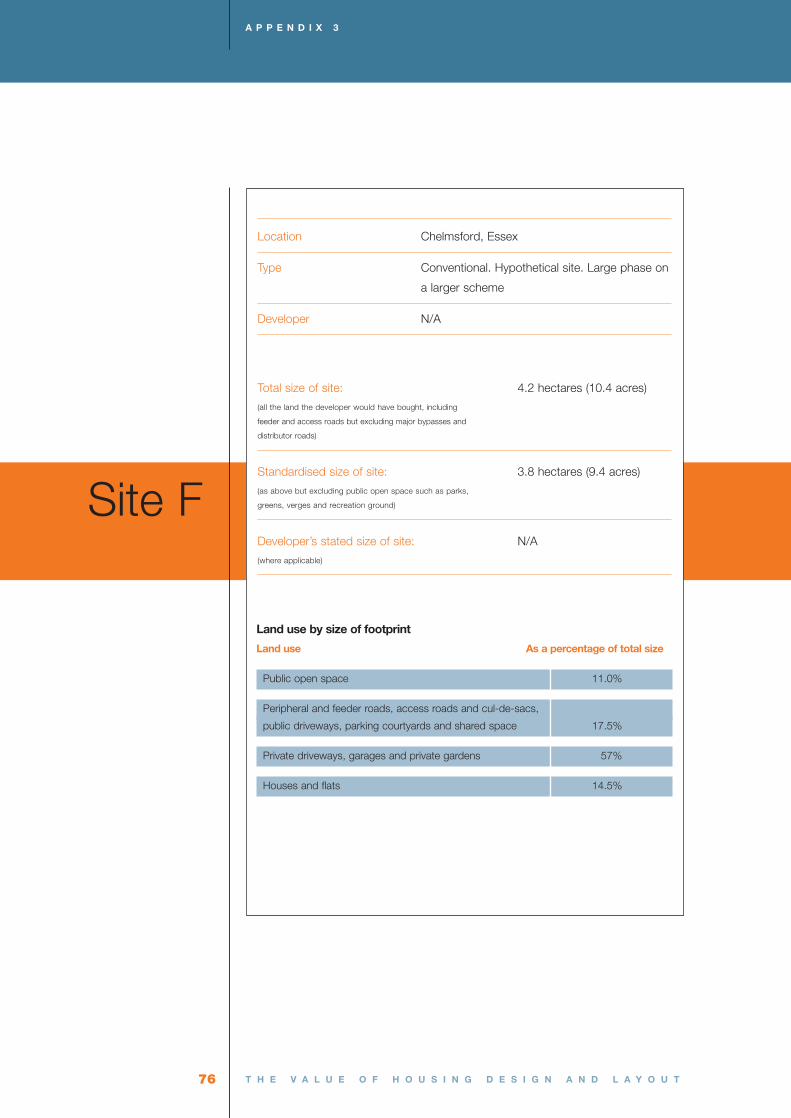
76 T H E V A L U E O F H O U S I N G D E S I G N A N D L A Y O U T
Site F
Land use by size of footprint
Land use As a percentage of total size
Public open space 11.0%
Peripheral and feeder roads, access roads and cul-de-sacs,
public driveways, parking courtyards and shared space 17.5%
Private driveways, garages and private gardens 57%
Houses and flats 14.5%
Location Chelmsford, Essex
Type Conventional. Hypothetical site. Large phase on
a larger scheme
Developer N/A
Total size of site: 4.2 hectares (10.4 acres)
(all the land the developer would have bought, including
feeder and access roads but excluding major bypasses and
distributor roads)
Standardised size of site: 3.8 hectares (9.4 acres)
(as above but excluding public open space such as parks,
greens, verges and recreation ground)
Developer’s stated size of site: N/A
(where applicable)
A P P E N D I X 3
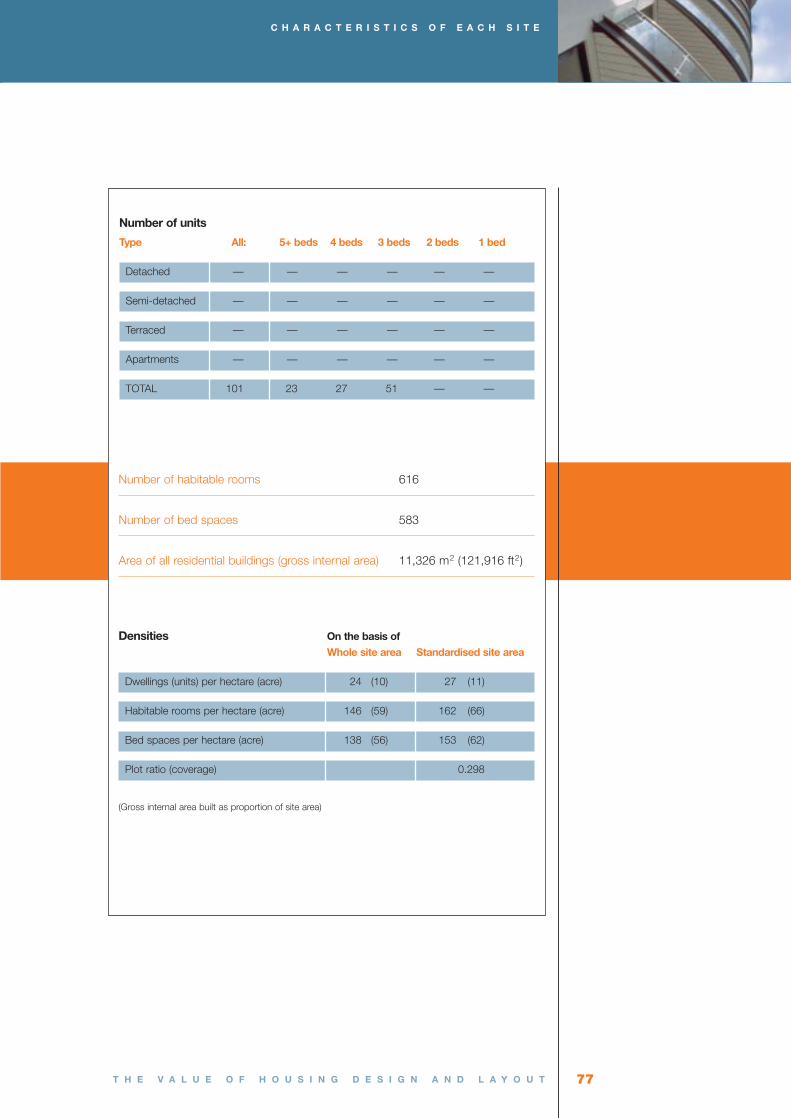
77T H E V A L U E O F H O U S I N G D E S I G N A N D L A Y O U T
Number of units
Type All: 5+ beds 4 beds 3 beds 2 beds 1 bed
Detached — — — — — —
Semi-detached — — — — — —
Terraced — — — — — —
Apartments — — — — — —
TOTAL 101 23 27 51 — —
Densities On the basis of
Whole site area Standardised site area
Dwellings (units) per hectare (acre) 24 (10) 27 (11)
Habitable rooms per hectare (acre) 146 (59) 162 (66)
Bed spaces per hectare (acre) 138 (56) 153 (62)
Plot ratio (coverage) 0.298
(Gross internal area built as proportion of site area)
Number of habitable rooms 616
Number of bed spaces 583
Area of all residential buildings (gross internal area) 11,326 m2 (121,916 ft2)
C H A R A C T E R I S T I C S O F E A C H S I T E

78 T H E V A L U E O F H O U S I N G D E S I G N A N D L A Y O U T
A P P E N D I X 3
Site G
Land use by size of footprint
Land use As a percentage of total size
Public open space 2.9%
Peripheral and feeder roads, access roads and cul-de-sacs 19.1%
Public driveways, parking courtyards and shared space 17.2%
Private driveways 4.9%
Garages 4.4%
Private gardens 32.8%
Houses and flats 18.7%
Location Aylesbury, Buckinghamshire
Type Exemplar. Real, existing site. Small, late phase on a larger scheme
Developer Bryant Homes
Total size of site: 1.8 hectares (4.6 acres)(all the land the developer would have bought, including feeder and access roads but excluding major bypasses and distributor roads)
Standardised size of site: 1.8 hectares (4.4 acres)(as above but excluding public open space such as parks, greens, verges and recreation ground)
Developer’s stated size of site: 1.8 hectares (4.6 acres)(where applicable)
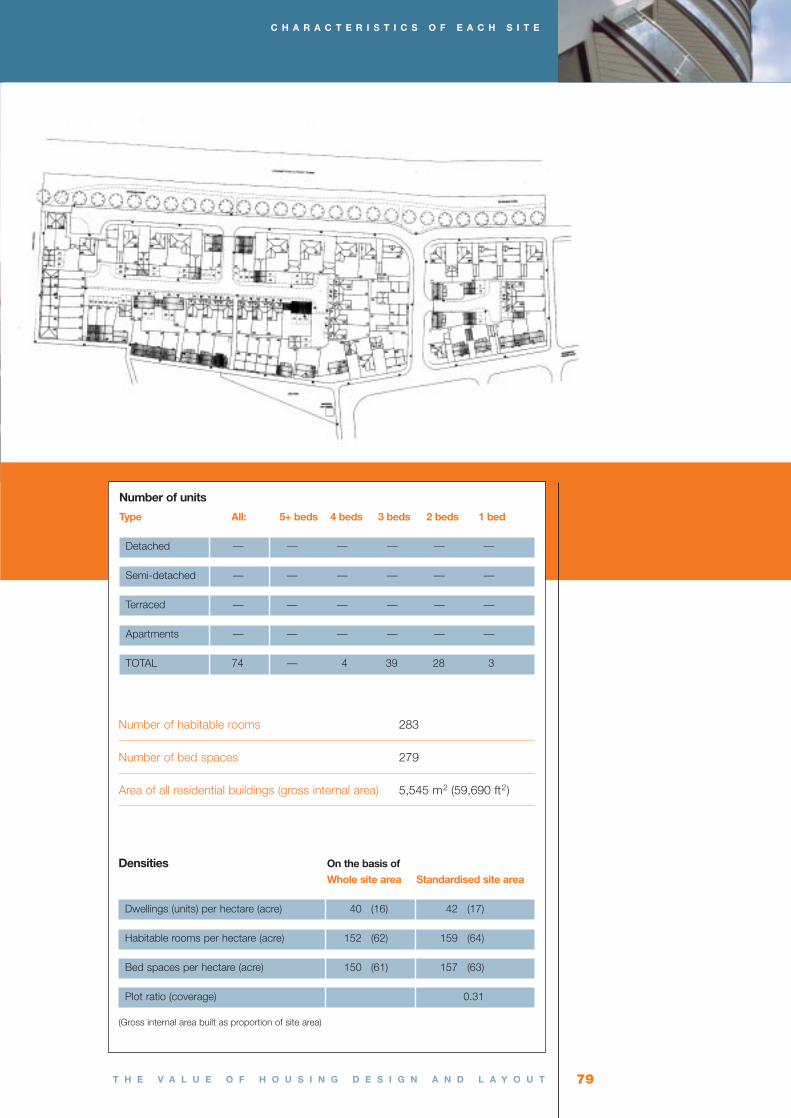
79T H E V A L U E O F H O U S I N G D E S I G N A N D L A Y O U T
C H A R A C T E R I S T I C S O F E A C H S I T E
Number of units
Type All: 5+ beds 4 beds 3 beds 2 beds 1 bed
Detached — — — — — —
Semi-detached — — — — — —
Terraced — — — — — —
Apartments — — — — — —
TOTAL 74 — 4 39 28 3
Densities On the basis of
Whole site area Standardised site area
Dwellings (units) per hectare (acre) 40 (16) 42 (17)
Habitable rooms per hectare (acre) 152 (62) 159 (64)
Bed spaces per hectare (acre) 150 (61) 157 (63)
Plot ratio (coverage) 0.31
(Gross internal area built as proportion of site area)
Number of habitable rooms 283
Number of bed spaces 279
Area of all residential buildings (gross internal area) 5,545 m2 (59,690 ft2)

80 T H E V A L U E O F H O U S I N G D E S I G N A N D L A Y O U T
Site H
Land use by size of footprint
Land use As a percentage of total size
Public open space 25.3%
Peripheral and feeder roads, 14.7%
Access roads and cul-de-sacs 0.9%
Public driveways, parking courtyards and shared space 0.02%
Private driveways 6.6%
Garages 4.0%
Private gardens 35.78%
Houses and flats 12.7%
Location Aylesbury, Buckinghamshire
Type Conventional. Hypothetical. Stand-alone scheme
Developer N/A
Total size of site: 2.9 hectares (7.3 acres)
(all the land the developer would have bought, including
feeder and access roads but excluding major bypasses and
distributor roads)
Standardised size of site: 2.3 hectares (5.8 acres)
(as above but excluding public open space such as parks,
greens, verges and recreation ground)
Developer’s stated size of site: 3.0 hectares (7.4 acres)
(where applicable)
A P P E N D I X 3

81T H E V A L U E O F H O U S I N G D E S I G N A N D L A Y O U T
Number of units
Type All: 5+ beds 4 beds 3 beds 2 beds 1 bed
Detached 39 — 31 8 — —
Semi-detached 24 — — 17 7 —
Terraced 13 — — — 13 —
Apartments — — — — — —
TOTAL 76 — 31 25 20 —
Densities On the basis of
Whole site area Standardised site area
Dwellings (units) per hectare (acre) 26 (10) 32 (13)
Habitable rooms per hectare (acre) 141 (57) 178 (72)
Bed spaces per hectare (acre) 138 (56) 174 (71)
Plot ratio (coverage) 0.292
(Gross internal area built as proportion of site area)
Number of habitable rooms 418
Number of bed spaces 409
Area of all residential buildings (gross internal area) 6,816 m2 (73,364 ft2)
C H A R A C T E R I S T I C S O F E A C H S I T E


Appendix 4.0
A P P E N D I X 4
Step-by-step methodology

A P P E N D I X 4
84
1 Four locations in the south-east of England were selected.
2 An exemplar scheme in each area was then selected on the basis that eachrepresented best practice and/or innovative design and layout and largely followed theurban design principles of PPG3.
3 A conventional housing scheme was then selected near to each of the exemplarschemes.
4 The build costs for both schemes in each area were measured. These costs excludedmajor remedial and infrastructure works and the costs of any section 106 agreements,including social housing (as these differ between sites). They did include landscapingcosts and the costs of site roads, where they were provided by the developer. (A smallflaw in this methodology is that it does not include the cost of site roads and layoutswhere they were provided by another developer. Ideally, they should be taken intoaccount.)
5 Where costs were not available for the standard schemes, Davis Langdon & Everestconstructed a hypothetical model of the scheme and its costs.
6 In each location, three local agents gave an open-market value for all the units on bothof the schemes as at March 2002 as if they were both built on the exemplar land.
7 Where possible, actual values that were achieved on the schemes during March 2002were obtained.
8 These real revenues were checked against the values given by the three local agents. Ifany valuer gave values which differed from the actual revenues by more than 20%, allthe values given by that valuer were removed and not used. (In practice, this happenedin just one case.)
9 The remaining values for each unit were averaged and then all unit average valueswere added together to give the total, gross development value (GDV).
10 The total build costs were subtracted from the total revenue to create a residual. (Thisresidual represented the land value, central overheads and developer profit/margin —not just land value.)
11 The measurement of land was standardised on each site to:
— exclude major roads, bypasses, etc
— include all site roads, including minor peripheral roads
— measure roads on the periphery of the site which were shared with adjacentdevelopments to the centre only
— exclude public open land regardless of whether the developer developed andlandscaped it or not
— exclude land used for any section 106 agreements (such as land used forschools, community facilities and social housing, for example)
12 The residual value arrived at in 10 above was then divided by the number ofhectares measured on the standardised basis derived in stage 11 above.
13 The resulting measure of the residual per hectare (or acre) then provided a measureof landowner/developer value that could be directly compared with other schemes inthe same area and in other areas.
14 The exemplar schemes were compared with the conventional schemes in eachlocation.
15 The differences between each scheme were analysed.
16 The possible impact of these differences on the residual value was examined.
T H E V A L U E O F H O U S I N G D E S I G N A N D L A Y O U T
a4.0 Step-by-stepmethodology

Appendix 5.0
A P P E N D I X 5
Illustrative example of the residual land calculation

A P P E N D I X 5
86
Site X would appear to have a greater commercial value, developed in this way,
than site Y.
The commercial value to the developer could be compared between sites in
different locations by subtracting a standard land value figure for each location from
the residual. The remaining figure would represent the profit and/or extra land
buying power (which might enable the developer to secure the site against
competition from other developers at the purchase stage) that is available to the
developer.
T H E V A L U E O F H O U S I N G D E S I G N A N D L A Y O U T
a5.0 Illustrative example ofthe residual landcalculation
Site X Site Y
A Gross development value (GDV) £70,000,000 £30,000,000
B Land area (HSSM) 3.5 2
C Total build costs £25,000,000 £9,000,000
D Residual value (A - C) £45,000,000 £21,000,000
E SDV per HSSM (D/B) £12,857,000 £10,500,000
F Percentage difference compared to other site + 22.4% – 18.3%
Terms used:
GDV (gross development value) Total of all average units values given by agents/valuers as ifthey were all built on the same site
Land area Area of land using the standardised measure of site area(outlined in Appendix 4)
HSSM Hectares of standardised site measurement
Total build costs Total cost of developing the private housing units as defined inAppendix 2
Residual value Sum available to the developer to cover land costs, centraloverheads and profit
Standardised development Residual value as defined abovevalue (SDV)

Acknowledgements
A C K N O W L E D G E M E N T S

A C K N O W L E D G E M E N T S
88
AcknowledgementsThanks are due to Davis Langdon & Everest for their contribution to the cost analysis in
this study. Also, to Professor Alan Hooper at Cardiff University for the Literature Review
and the helpful comments and encouragement he gave at the outset of the study.
This research would not have been possible without the help and cooperation of the
developers of both the exemplar and conventional schemes in the case studies. Our
particular thanks are due to Bryant Homes, Countryside Homes, Fairview, St James
Homes and another developer, who prefers to remain anonymous, for their time,
effort and input into this study.
Thanks are also due to the valuers at various offices of estate agents: Bradford and
Bingley, Brown and Merry, FPDSavills, Nicholas Pallet, Peter Anstee & Co and Your
Move.
Finally, the authors would like to thank CABE for their considerable time and effort in
steering this project over the past year or so and to thank them, ODPM, Design for
Homes and the House Builders Federation for sponsoring the study.
Steering GroupDavid Birkbeck Design for Homes
John Miles Ove Arup Partnership
John Weir Haute Future
Christina Golton ODPM
Stephen Mullin ODPM
Simon Pinnegar ODPM
Kate Anderton CABE
Ben Castell CABE
Jon Rouse CABE
Photography creditsPhotographs on front cover and pages 7, 11, 15, 25, 35, 45, 49, 53, 65, 83, 85 and
87 courtesy of Mark Ellis
Photograph of Site A, page 66, courtesy of PRP + Daniel Thistlethwaite
T H E V A L U E O F H O U S I N G D E S I G N A N D L A Y O U T

By 2016 an additional three million homes will be required in the UK. Yet last
year an estimated 160,000 new homes were built, far short of the
Government’s target of 225,000.
This report, produced by FPDSavills Research for CABE and ODPM in
association with Design for Homes, seeks to demonstrate a way of measuring
the economic dividends of investing in high quality housing design and layout. It
pilots a methodology that developers, funders, planners and housebuilders can
apply to compare housing sites and schemes.
The report is especially timely given pressure from the Government who rightly
insist that new housing development, especially in the south east of England,
should be aiming for densities of over 30 units per hectare. Investing in the
design of these new homes is imperative if we are to deliver quality
neighbourhoods of tomorrow.
ThomasTelford
the value of housing design and layout
the value of housing design and layout
the value of housing design and layout