the value of oncology therapies and emerging … value of oncology therapies and emerging access...
TRANSCRIPT

The Value of Oncology Therapies and Emerging Access Hurdles: Canada and the United States
Won Chan Lee, PhD
EFPSI/BBS Basel, 23 June 2015

Agenda
Background – Global Trends in Healthcare
Current and future access challenges – US
Current and future access challenges – Canada
Part 1
Part 2
Part 3
Strategic Initiatives & Summary Part 5
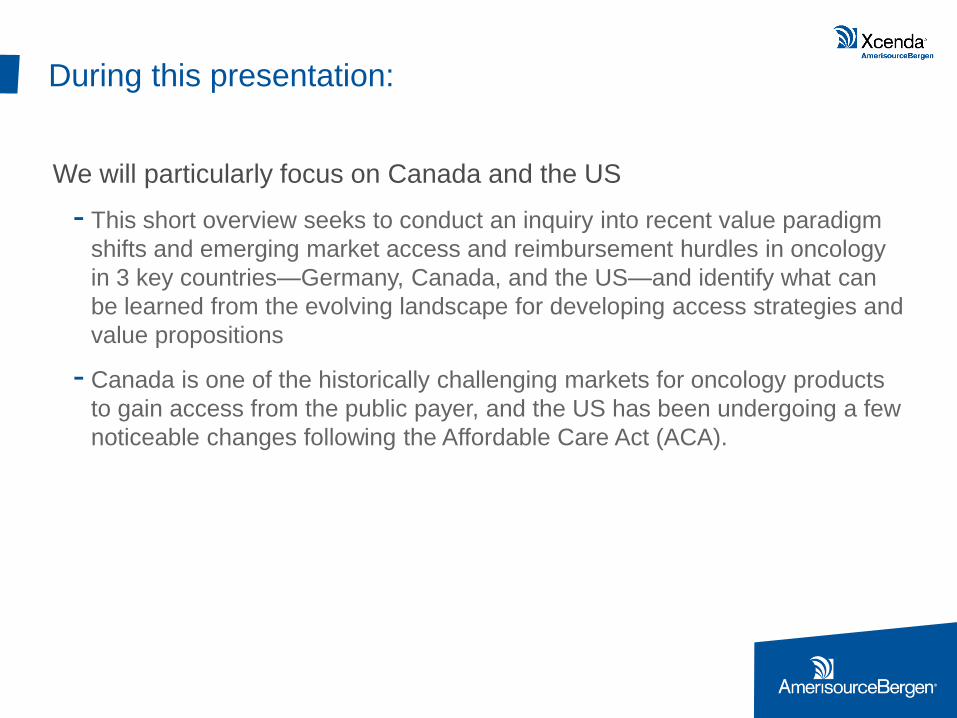
During this presentation:
We will particularly focus on Canada and the US
- This short overview seeks to conduct an inquiry into recent value paradigm
shifts and emerging market access and reimbursement hurdles in oncology
in 3 key countries—Germany, Canada, and the US—and identify what can
be learned from the evolving landscape for developing access strategies and
value propositions
- Canada is one of the historically challenging markets for oncology products
to gain access from the public payer, and the US has been undergoing a few
noticeable changes following the Affordable Care Act (ACA).
Global Trends in Healthcare

5

The word “value” is a ubiquitous term, yet it is often not
operationalized in the same way by the manufacturer, the payer
and patient, and the society.
6
𝑽𝒂𝒍𝒖𝒆 =𝑸𝒖𝒂𝒍𝒊𝒕𝒚 (𝒐𝒓 𝑯𝒆𝒂𝒍𝒕𝒉 𝑶𝒖𝒕𝒄𝒐𝒎𝒆𝒔)
𝑷𝒓𝒊𝒄𝒆
“Nowadays people know the price of everything and the value of nothing.”
-Oscar Wilde
Current and Future Access Challenges
Canada
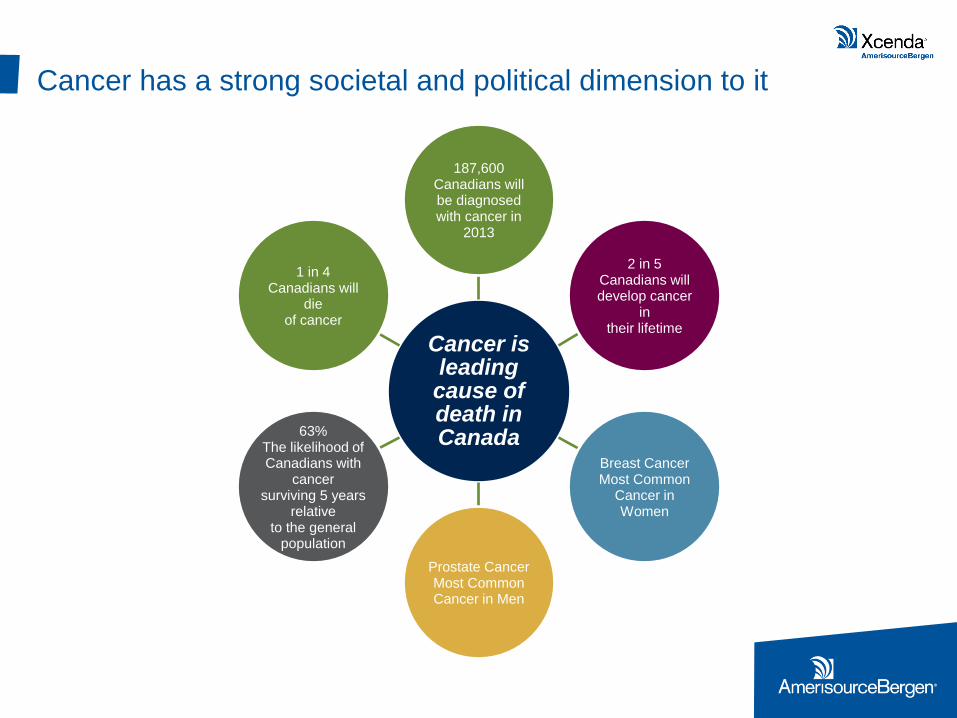
Cancer has a strong societal and political dimension to it
Cancer is leading cause of death in Canada
187,600 Canadians will be diagnosed with cancer in
2013
2 in 5 Canadians will develop cancer
in their lifetime
Breast Cancer Most Common
Cancer in Women
Prostate Cancer Most Common Cancer in Men
63% The likelihood of Canadians with
cancer surviving 5 years
relative to the general
population
1 in 4 Canadians will
die of cancer
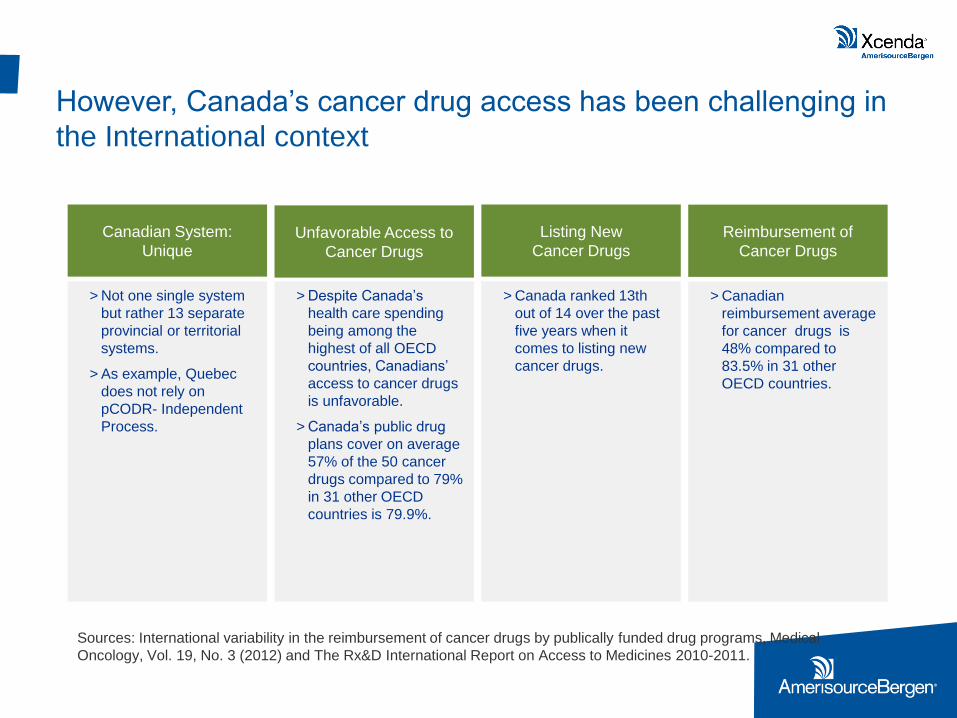
> Not one single system
but rather 13 separate
provincial or territorial
systems.
> As example, Quebec
does not rely on
pCODR- Independent
Process.
> Despite Canada’s
health care spending
being among the
highest of all OECD
countries, Canadians’
access to cancer drugs
is unfavorable.
> Canada’s public drug
plans cover on average
57% of the 50 cancer
drugs compared to 79%
in 31 other OECD
countries is 79.9%.
> Canada ranked 13th
out of 14 over the past
five years when it
comes to listing new
cancer drugs.
Canadian System:
Unique
Listing New
Cancer Drugs
> Canadian
reimbursement average
for cancer drugs is
48% compared to
83.5% in 31 other
OECD countries.
Reimbursement of
Cancer Drugs
Sources: International variability in the reimbursement of cancer drugs by publically funded drug programs, Medical
Oncology, Vol. 19, No. 3 (2012) and The Rx&D International Report on Access to Medicines 2010-2011.
Unfavorable Access to
Cancer Drugs
However, Canada’s cancer drug access has been challenging in
the International context

The pan-Canadian Oncology Drug Review (pCODR), created in
2011, has reviewed oncology products for their effectiveness and
costs
Cancer Drug
Reimbursement in
Canada
Step 1:
Health
Canada
Approval
Step 2:
pCODR
Step 3:
Provincial/
Territorial
Deliberation
> Three (3) steps for
cancer drugs to get
public coverage in
Canada.
> Obtain Health
Canada approval in
order to
commercialize drug.
> pan-Canadian
Oncology Drug
Review (pCODR)
reviews drug’s
clinical & cost
effectiveness.
> Quebec: Does not
rely on pCODR -
Independent system
> Each
province/territory
makes its own
funding decisions -
based primarily on
affordability.
April 2014, pCODR was transferred to CADTH to consolidate policy direction across Canada's drug review programs & to strengthen the pCODR governance
structure

pCODR partners with the provincial Canadian Cancer
HTA Agencies
pCODR
Cancer Care NS
Cancer Care MB
BC Cancer Agency SK
Cancer Agency
AB Cancer
Services Cancer Care ON
Exception
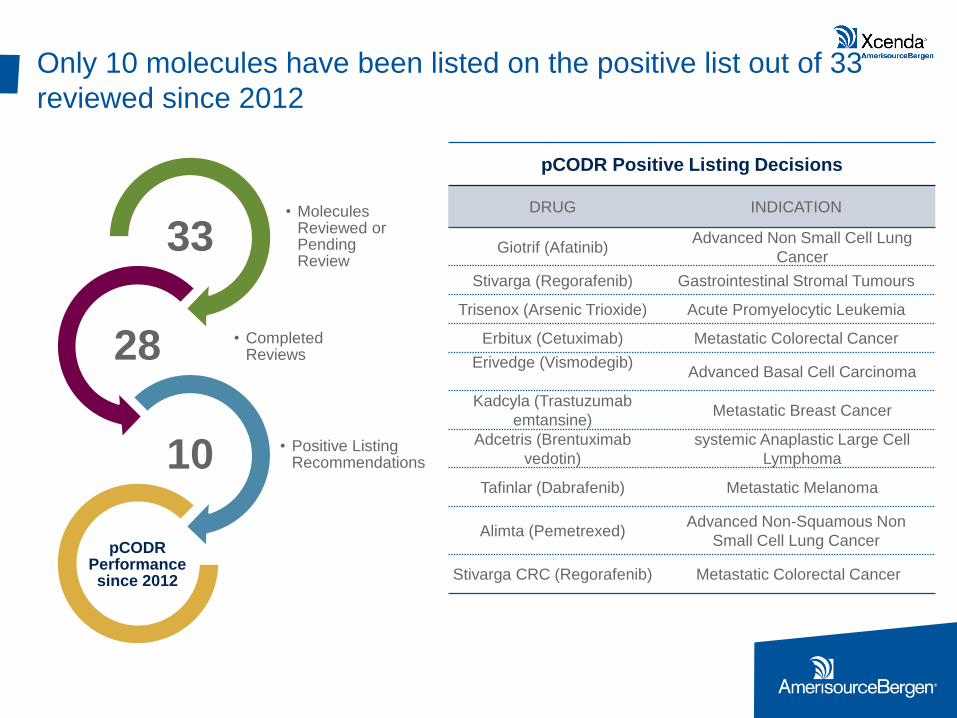
Only 10 molecules have been listed on the positive list out of 33
reviewed since 2012
• Molecules Reviewed or Pending Review
33
• Completed Reviews 28
• Positive Listing Recommendations 10
pCODR Performance since 2012
pCODR Positive Listing Decisions
DRUG INDICATION
Giotrif (Afatinib) Advanced Non Small Cell Lung
Cancer
Stivarga (Regorafenib) Gastrointestinal Stromal Tumours
Trisenox (Arsenic Trioxide) Acute Promyelocytic Leukemia
Erbitux (Cetuximab) Metastatic Colorectal Cancer
Erivedge (Vismodegib)
Advanced Basal Cell Carcinoma
Kadcyla (Trastuzumab
emtansine) Metastatic Breast Cancer
Adcetris (Brentuximab
vedotin)
systemic Anaplastic Large Cell
Lymphoma
Tafinlar (Dabrafenib) Metastatic Melanoma
Alimta (Pemetrexed) Advanced Non-Squamous Non
Small Cell Lung Cancer
Stivarga CRC (Regorafenib) Metastatic Colorectal Cancer
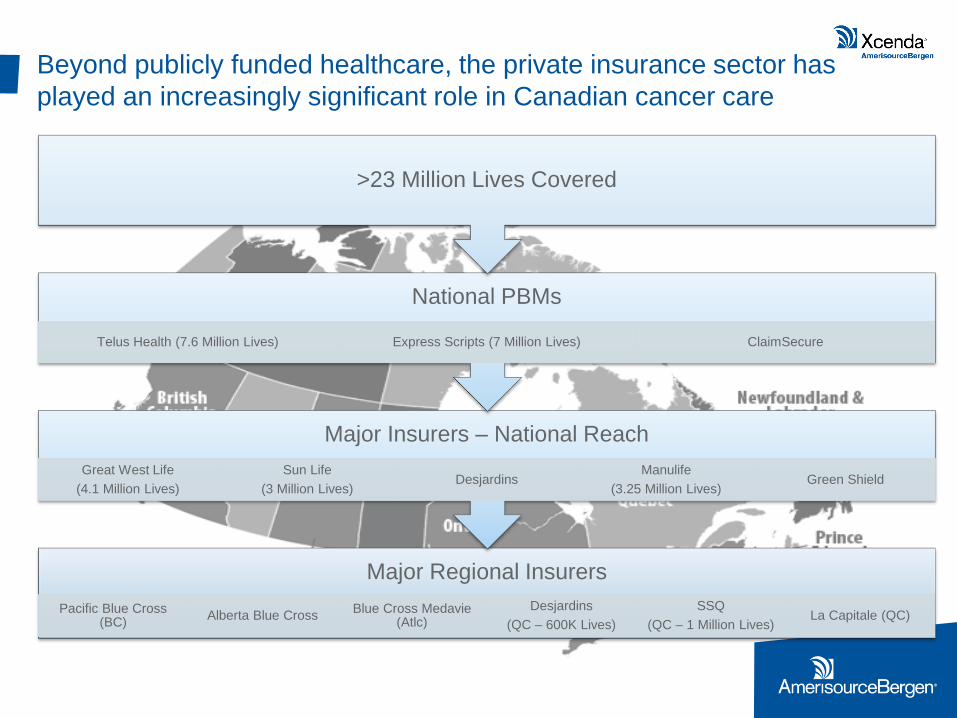
Beyond publicly funded healthcare, the private insurance sector has
played an increasingly significant role in Canadian cancer care
Major Regional Insurers
Pacific Blue Cross (BC)
Alberta Blue Cross Blue Cross Medavie
(Atlc)
Desjardins
(QC – 600K Lives)
SSQ
(QC – 1 Million Lives) La Capitale (QC)
Major Insurers – National Reach
Great West Life
(4.1 Million Lives)
Sun Life
(3 Million Lives) Desjardins
Manulife
(3.25 Million Lives) Green Shield
National PBMs
Telus Health (7.6 Million Lives) Express Scripts (7 Million Lives) ClaimSecure
>23 Million Lives Covered

Top 10 Group Health Providers (as of Dec. 31, 2012)
Rank Company 2012
(Insured
Premiums
(Millions))
2011
(Insured
Premiums
(Millions))
% Variance
1 Manulife Financial $3,852.6 $3,222.5 19.6%
2 Great-West Life $3,845.8 $3,612.2 6.5%
3 Sun Life Financial $2,912.2 $2,766.9 5.3%
4 Desjardins Financial
Security
$1,799.8 $1,663.8 8.2%
5 SSQ Financial Group $1,300.4 $1,162.2 11.9%
6 Industrial Alliance $807.3 $794.0 1.7%
7 Standard Life $528.6 $501.4 5.4%
8 La Capitale Assurance
& Gestion du
Patrimoine
$420.8 $366.8 14.7%
9 Green Shield Canada $370.5 $357.2 3.7%
10 Medavie Blue Cross $322.9 $304.4 6.1%
Source: Benefits Canada/CIIN 2013 Group Insurance Survey

Canada’s Oncology HTA Environment is Evolving
Value AND Customization will be KEY
Increasing requirement to prove value through patient outcomes
Adherence strategies demonstrating positive outcomes a must for optimal
therapy
Be aware that drug review process is not consistent and building timely
submission based on value and price supported by positive outcomes will
be essential customize to public and private needs
Increased Management of Drug Programs
Increasingly focused on plan sustainability and concerned with increase in
private claims in Oncology
Looking to HTA to show therapeutic value/incremental benefit
Interested in indicators that prove reduced absenteeism/presenteeism
COST CONTAINMENT ENVIRONMENT- PRICE DRIVEN
Pricing will be increasingly based on evidence
Increased focus on value and health outcomes in real world
Prioritize HTA for specific provincial needs as requirements and review
process is different
Some General Trends:
- Customization with provinces
required
- Private becoming more of an
opportunity for out of hospital
therapies
Private Payer
Manufacturer
Public Payer
Public Payer

Current and Future Access Challenges
United States

Innovation has resulted in significant improvement in
patient outcomes
31%
89%
0%
10%
20%
30%
40%
50%
60%
70%
80%
90%
100%
Pre-Imatinib Post-Imatinib
5 Year Survival Rates in CML
6/21/2015 CONFIDENTIAL 17
3M
9.8M
13.7M
0
2
4
6
8
10
12
14
16
1971 2001 2011
US Cancer Survivors, Millions

Dramatic changes in oncology will continue and
escalate
Shift towards Personalized Medicine
- Increased focused on biomarker-defined
sub-populations
- Companion Diagnostics
Financial Impacts of Continued
Innovation on Healthcare System
are Significant
– Potential for additional oncolytics with
>$1B annual sales
– Sales of current products expected to
grow >50%
Simultaneous shift to Oral Therapy
- ~25% of pipeline oncolytics are oral
- Number of orals on market to double by 2020
Rising costs result in increased
patient burden and may
compromise care2
– Patients with higher copayments
were 70% more likely to discontinue
their cancer therapy and 42% more
likely to skip doses
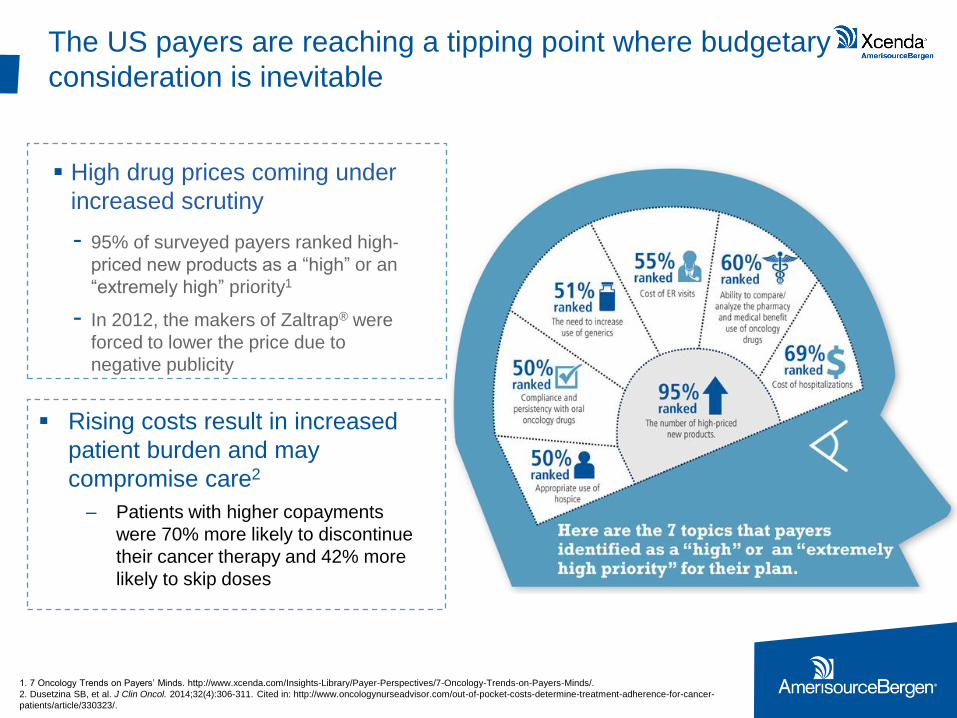
The US payers are reaching a tipping point where budgetary
consideration is inevitable
High drug prices coming under
increased scrutiny
- 95% of surveyed payers ranked high-
priced new products as a “high” or an
“extremely high” priority1
- In 2012, the makers of Zaltrap® were
forced to lower the price due to
negative publicity
1. 7 Oncology Trends on Payers’ Minds. http://www.xcenda.com/Insights-Library/Payer-Perspectives/7-Oncology-Trends-on-Payers-Minds/.
2. Dusetzina SB, et al. J Clin Oncol. 2014;32(4):306-311. Cited in: http://www.oncologynurseadvisor.com/out-of-pocket-costs-determine-treatment-adherence-for-cancer-
patients/article/330323/.

New payment models transfer financial risk to providers
and patients
This shift will likely put increased emphasis on providing additional evidence of
value to providers as well as payers

Accountable care models are changing the landscape of
oncology care
Accountable care organizations (ACOs) aim to coordinate care and provide financial incentives for efficient patient management1
Several innovators are adapting the ACO model to oncology care
- Miami-Dade Accountable Oncology Program (Florida Blue)
- Moffitt Cancer Center in Tampa (Florida Blue)
- Texas Oncology (Aetna)
Potential savings are derived from2:
- Chemo pathway adherence (1%–3%)
- Avoidance of hospital and ER visits (4%–7%)
- Diagnostics (0.2%–0.5%)
- End-of-life planning (0.9%–1.9%)
• Built in May 2012 via a collaboration
among Florida Blue, Baptist Health
South Florida, and Advanced
Medical Specialists
• Providers are paid fee-for-service
along with a shared savings
agreement
• The ACO is on target to meet and
exceed its goals of decreasing
readmissions, reducing ER visits,
increasing medication adherence,
and improving quality of care
1. Mehr SR. Applying Accountable Care to Oncology: Developing an Oncology ACO. AJMC.com. May 2013. http://www.ajmc.com.
2. Barkley R. The Forum for Re-engineering the Cancer Care Delivery Process and for Harnessing the Cancer Spend. October 2013. http://www.ccbdgroup.com/aco1013.pdf.
3. Edlin M. Oncology ACOs offer innovation for high-cost populations. Managed Healthcare Executive. http://managedhealthcareexecutive.modernmedicine.com/managed-healthcare-executive/news/oncology-acos-offer-innovation-high-
cost-populations?contextCategoryId=21.
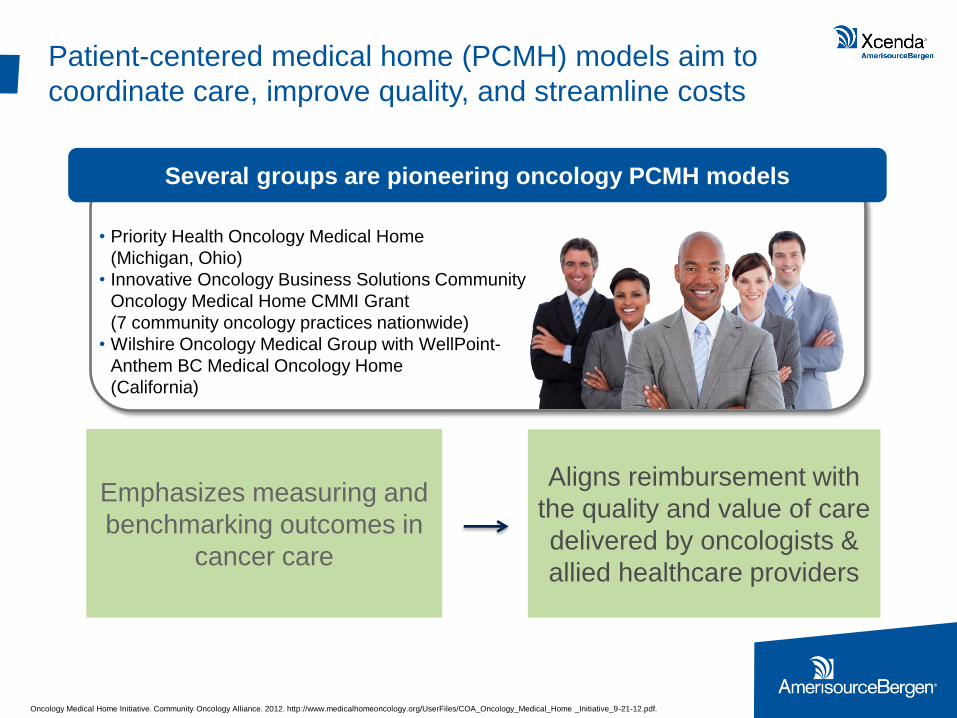
Patient-centered medical home (PCMH) models aim to
coordinate care, improve quality, and streamline costs
Aligns reimbursement with
the quality and value of care
delivered by oncologists &
allied healthcare providers
Emphasizes measuring and
benchmarking outcomes in
cancer care
Oncology Medical Home Initiative. Community Oncology Alliance. 2012. http://www.medicalhomeoncology.org/UserFiles/COA_Oncology_Medical_Home _Initiative_9-21-12.pdf.
Several groups are pioneering oncology PCMH models
• Priority Health Oncology Medical Home
(Michigan, Ohio)
• Innovative Oncology Business Solutions Community
Oncology Medical Home CMMI Grant
(7 community oncology practices nationwide)
• Wilshire Oncology Medical Group with WellPoint-
Anthem BC Medical Oncology Home
(California)

The ACA has accelerated the drive toward evidence-based
treatment through a number of avenues
• The Center for Medicare and Medicaid Innovation (CMMI)
• Medicare Shared Savings Program (MSSP)
• Federally Qualified Health Center (FQHC) Advanced Primary Care Practice Demonstration
• Bundled Payments for Care Improvement Initiative
Key CMS Programs
• CMS will become even more of a bellwether payer due to the ACA’s strengthening of its quality programs
• Health exchange plans may restrict formularies to high-value drugs
• ACOs will likely approve/reject drugs based on evidence of value
New Audiences for Evidence of Value
• The Patient Centered Outcomes Research Institute (PCORI) was created to foster patient-centric comparative effectiveness research
• Comparative effectiveness research will drive interest, attention on comparisons of innovative therapies to existing treatment options
New Types of Required Evidence
“Today’s Medicare policies fail to adequately reimburse cancer care provided in the community setting
while incentivizing care provided in settings that are more expensive.”
– Dr. Thompson, Community Oncology Alliance (COA) President
Community Cancer Care Leaders Implore Congressional Leadership to Address Growing Crisis. http://www.prnewswire.com/news-releases/community-cancer-care-
leaders-implore-congressional-leadership-to-address-growing-crisis-251897061.html.
24 AmerisourceBergen Consulting Services – Confidential
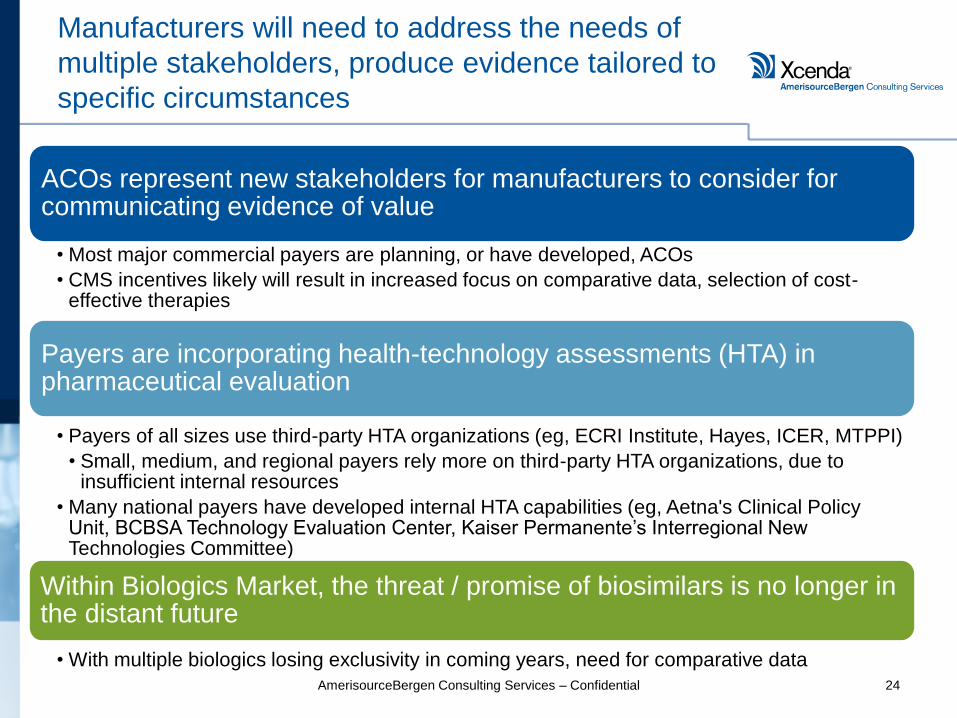
Manufacturers will need to address the needs of
multiple stakeholders, produce evidence tailored to
specific circumstances
ACOs represent new stakeholders for manufacturers to consider for communicating evidence of value
• Most major commercial payers are planning, or have developed, ACOs
• CMS incentives likely will result in increased focus on comparative data, selection of cost-effective therapies
Payers are incorporating health-technology assessments (HTA) in pharmaceutical evaluation
• Payers of all sizes use third-party HTA organizations (eg, ECRI Institute, Hayes, ICER, MTPPI)
• Small, medium, and regional payers rely more on third-party HTA organizations, due to insufficient internal resources
• Many national payers have developed internal HTA capabilities (eg, Aetna's Clinical Policy Unit, BCBSA Technology Evaluation Center, Kaiser Permanente’s Interregional New Technologies Committee)
Within Biologics Market, the threat / promise of biosimilars is no longer in the distant future
• With multiple biologics losing exclusivity in coming years, need for comparative data

Strategic Imperatives & Summary

Questions?
