the visual acuity of the honey bee. 26, 1929.) · the visual acuity of the honey bee. ... in dark...
TRANSCRIPT

THE VISUAL ACUITY OF THE HONEY BEE.
BY SELIG HECHT AND ERNST WOLF.*
(From the Zaboratory of Biophysics, Columbia Uni~t~ity, New York.)
(Accepted for publication, March 26, 1929.)
L
Nature of Work.
1. The visual acuity of the human eye varies in a specific way with the illumination. At low intensities visual acuity is low; as the in- tensity increases, visual acuity increases with it, at first slowly, then more rapidly; and finally at very high illuminations further increase in intensity f~roduces no augmentation of acuity (Uhthoff, 1890; Koenig, 1897).
This extraordinary dependence of visual acuity on illumination has been known for many years. However, it has remained without expIanation until we recently suggested a theory to account for it (Hecht, 1927-28). The idea underlying this explanation is as follows. Visual acuity measures the resolving power of the retina. The resolv- ing power of a surface composed of discrete receiving elements varies inversely with the distance between the centers of the elements; or more generally, it varies with the number of elements present in a unit area. The retina is such a surface since it is made up of discrete rods and cones. The variations in visual acuity with illumination would therefore suppose that the number of visual elements per unit area of retina varies with the intensity. But since the number of rods and cones in the retina is fixed anatomically one must suppose it to vary functionally. To accomplish this, it has been assumed that the thresholds of the retinal elements are not the same, but are dis- tributed in relation to the illumination in the usual manner of popula- tions. Consequently the number of elements functional in a given area varies with the illumination; and when expressed quantitatively,
* Fellow, International Education Board.
727
The Journal of General Physiology

728 VISUAL ACUITY OF TIRE HONEY BEE
this relation describes in detail the dependence of visual acuity on the intensity of illumination.
This work on visual acuity is confined to the eye of man. Its theoretical implications are many (Hecht, 1927-28) and involve con- sideration of the problems of intensity perception and intensity dis- crimination; it may even concern the matter of color reception and hue discrimination. The ideas underlying it should therefore b e tested in a variety of ways. If the explanation of the dependence of visual acuity on illumination which we have proposed is generally valid; in other words if the number of receptor elements functional in a sense organ does vary with the intensity of the stimulating agent, then visual acuity should vary with the illumination in other animals in a manner resembling that in man.
There exist, however, no measurements of this nature with any other organisms. We have therefore studied the visual acuity of the arthropod eye, a sense organ which is built and is functional on a wholly different principle from the vertebrate eye (Exner, 1891).
2. The problem of studying the vision of animals other than man is made difficult by the impossibility of verbal communication be- tween the animal and the experimenter. The best method of solving this difficulty up to the present has been by means of the conditioned reflex, used originally by Pavlov (1927) with mammals, and in a modified form by v. Frisch (1915) with bees. Though we have nothing but praise for this method and for many of the results achieved by it, we nevertheless tried to find a more direct one, which would involve no training of animals.
We started with the common observation that most animals with eyes respond to a sudden movement in their visual field, and in terms of the following considerations converted it into a method of measur- ing visual acuity quantitatively. If the visual field of a sensitive animal is made up of a pattern of dark and illuminated bars of equal size, the animal will respond to a displacement of this field only when it can distinguish the components of the pattern. In case the animal cannot resolve the black and white bars, the field will appear uniformly illuminated and displacement of the pattern will elicit no response. If visual acuity varies with illumination, then the capacity to respond to these movements in the visual field will depend on the illumination

SELIG HECHT AND ERNST WOLF 729
and on the size of the pat tern . One could in this way determine the relation between the size of the bars in the pa t t e rn and the min imum illumination at which it causes a response in the animal.
3. Our experiments were made with the honey bee because of its abundance and its genetic uniformity. I t is sensitive to changes in its visual field, and responds by a reflex, sidewise movement of the head and thorax. I f the bee is crawling, the response becomes evident by a sudden change in the direction of its progression, which is opposite in sign to the movement in its environment .
We prepared a series of plates composed of equally wide opaque and translucent bars, each plate having a clifferent size of bar. Our experiments then consisted in determining for each size of pa t t e rn the minimum illumination at which a bee will just respond to a movement of tha t pa t tern . The reciprocal of the visual angle subtended by each size of bar is then the visual acui ty of the eye at the correspond- ing illumination. The results show tha t the visual acui ty in the honey bee varies with the il lumination in a way which is similar to the human eye.
II.
"Apparatus and Procedure.
1. The details of the apparatus which we used in these experiments can be made out with the help of Fig. 1. A source of light (1000 watt, concentrated-filament, mazda lamp) in dark room B illuminates a plate of opal glass in the wall of an adjacent dark room A, in which the experiments are performed. The opal plate is immediately behind an accurately controlled diaphragm (Fig. 1) the opening of which determines the area of the plate which radiates light into dark room A. This light is reflected upward by a mirror, and impinges on a piece of opal glass 25 x 15 era. in size. Immediately upon this opal glass plate rests a piece of trans- parent glass of the same size, with the experimental opaque and transparent bars on it. These two pieces of glass,--the opal plate and the pattern plate,--fit into the opening in a frame which is moved by an attached knob, and which slides freely in a pair of grooves in a larger frame. The movement of the frame with the two plates constitutes the moving visual pattern.
The bee is confined in a glass compartment 10 x 10 cm. and 3 era. high, held about a centimeter above the pattern. The bottom of the compartment is the plate on which the bee crawls. It is an ordinary photographic plate with the halide completely removed but the gelatine left so as to serve as a foothold for the crawling bee. These plates are used because they are uniform; they may be re- moved very frequently and washed and dried.

730 VISUAL ACUITY OF THE HONEY B E E
The bee's creeping compartment and the movable black and white stripes of the visual field are tilted at an angle of about 30 ° . Because of the bee's negative geotropism this tends to make the animal crawl upward in a straight line, so that
~'dc v/e~
= o,
k,nob--~'~ plo,e
dio]~rogr~
d ~ r k t -oom
/omp In /on~ house
dot,¼ room B
Top vie~, of
bee5 compa,-'lmen~ mow;'~ p/o~e, ~ frome
\ /
OIophrogm
212L Fro. 1. Diagrammatic representation of apparatus for measuring the visual
acuity of bees.
deviations from its linear progression due to the movement of the visual field are easily observable. A mirror placed above the bee's creeping compartment gives the observer a top view of the bee and of the visual field.
We used thirteen sizes of stripes. The larger ones we made by putting opaque

SELIG HECHT AND ERNST WOLF 731
black paper between two pieces of glass. The finer ones were engraved on glass by Max Levy and Company of Philadelphia, and have the opaque areas filled with black printer's ink. The visual acuities furnished by these plates depend on their distance from the eye of the bee. On several occasions we measured this distance. I t varies slightly from plate to plate and :from bee to bee. The average is 17.3 ram, representing the distance from the center of the creeping bee's eye to the plate which has the pattern on it. In Table I is given the dimensions of the lines and spaces, the resulting visual angle, and the reciprocal of the visual angle representing the visual acuity. As in the case of ophthalmological practice a visual angle of 1 minute corresponds to a visual acuity of unity.
TABLE I.
Designations and Properties of Pattern Plates Used in the Experiments. Distance of pattern from center of bee's eye is 17.3 mm.
Visual angle subtended Designation Width of bar by bar Visual acuity X lOt
A B C D E F G H I J K L M
19.0 12.4 9.4 6.3 4.7 3.2 1.27 0.847 0.635 0.508 0.423 0.363 0.318
2862.0 2136.0 1710.0 1200.0 912.0 630.0 252.0 168.0 126.0 100.8 84.0 72.0 63.0
3.50 4.68 5.85 8.33
10.96 15.87 39.68 59.52 79.37 99.21
119.0 138.9 158.7
The illumination of the striped pattern is varied in two ways. The 1000 watt lamp in dark room B may be placed in one of three fixed positions. Position I is 15 era. from the opal plate in the wall between the two dark rooms; Position I I is 50 can.; Position H I is 170 cm. from the opal plate. We made six separate cali- brations of ten measurements each of the relative intensities emitted by the opal plate when illuminated by the lamp in each of the three positions. The relative intensities, putting Position I equal to 1 are.---Position I I , 0.0862; Position I I I , 0.0140. The diaphragm controlling the area of the radiating opal plate gives a span of over 1 : 10. The smallest opening used is 2 cm. square; the largest, 8 cm. square. The diaphragm when used with the lamp in the three positions enables one to provide accurately and continuously an illumination covering a range of over 1 : 1000.

732 VISUAL ACUITY 01~ THE I:IONEY BEE
The size of the opening in the diaphragm can be read to 0.1 mm. by an en- graved metal scale attached to one leaf in the diaphragm and a pointer wire at- tached to the other. We did not rely on the fact that the illumination on the striped pattern is proportional to the size of the radiating area in the diaphragm, but measured the actual brightness of the striped pattern when illuminated by eleven different areas of the diaphragm. The measured points, plotted as scale reading on the diaphragm against the logarithm of the resulting brightness, fall on a smooth curve. This we drew on a sufficiently large scale to use as a cali- bration curve.
2. The procedure in making the experiments is as follows. Active worker bees from our own colony are taken from in front of the hive. They are lightly anes- thetised and the wings dipped. After recovery they, are kept in wire cages, several to a cage, where they have access to plenty of honey. A number are then tested individually in the apparatus and from them are selected vigorous bees whose responses to the moving visual field are sharp. These are marked by differently colored spots of paint placed on the thorax or abdomen. They are kept warm, dry, and in the dark.
To make a measurement, a visual acuity plate is put into the movable frame, the light is turned on for a given illumination, and a bee is placed in the creeping compartment. The animal at once begins to creep and continues actively all the time it is in the compartment. First it creeps upward on the floor of the cell. Then it tries to crawl up the sides. This usually results in its dropping to the bottom, where it again crawls upward. If it can successfully creep up the side i t may continue upside down on the top; in which case it arrives at the bottom and crawls up again on the floor of the compartment. Very often it drops from the roof, and starts its journey on the floor again. The fact that the floor is the only illuminated face of the compartment also helps to keep the bee creeping there. The result is that at very frequent intervals the animal creeps across the visual field. After it has moved about 2 cm. and its direction of progression is clear, the pattern plate is moved with a sharp but not too rapid motion. Depending on whether the bee responds or not, the intensity of the field is lowered or raised and the bee tested again. This is continued until the illumination is found at which the bee just responds to the movement.
I t is an extraordinary sight to watch the precision with which a bee changes its direction of creeping under these conditions. If the pattern is moved, say, to the left, the creeping bee swings sharply to the right through an angle which is easily 45 ° and may be much more, and continues creeping in the new direction. During a single crawl of perhaps 10 cm. we have frequently made a bee alter its direction, right and left by moving the plate left and right, as many as four or five times in rapid succession.
In this connection we have made on observation often enough to be quite certain of its reality. When the plate is moved slowly, and the animal has established its new direction, if the plate is suddenly stopped the bee swings into a new direc-

SELIG tt-ECHT AND ERNST W O L F 733
tion as if the plate had suddenly been moved in the opposite direction. The ap- pearance is reminiscent'of the common nystagmus of vertebrates.
Mter the reading has been checked the bee is removed, placed in the cage in the dark, and another bee is tested in the same way. This is usually done with about ten bees. After all of them have been run through with one size of stripes, an- other plate is placed in the movable frame and the same bees tested on a different size of stripes. This procedure is continued at regular intervals during the day, in the course of which six or seven different sets of stripes are tested. By choosing the proper plates one can in this way cover very' nearly the whole range of visual acuity with each bee. The next day, with a fresh batch of bees one can then investigate the whole range again, but with visual acuities in between those al- ready tested. We have found this better than to test each bee to all the plates in one day, because the animals seem to respond more vigorously and survive better if they are tested at intervals of about an hour.
Ill.
Experimental Results.
1. The prel iminary work for the experiments occupied over six months of almost daily effort before any of the measurements to be repor ted here were made. Beginning with the fact tha t bees respond to a movement in their immediate environment , we tr ied to elicit this response under controlled conditions which would make measure- ments possible. For near ly three months all kinds of devices for producing a controllable movement to which the animal would give a fixed response were tr ied wi thout success, unti l the t i l ted compart - ment with the moving stripes below it solved the problem. Th e angle of ti l t is quite impor tan t and is a compromise between a steep angle which causes a pronounced geotropic creeping and a gentle slope which keeps the bees from rolling down the incline. The gela- tine covered creeping plate helps to increase the angle of tilt. The rest of the prel iminary experiments were concerned with designing and testing different types of appara tus and different means of producing the visual pa t tern , with the results a l ready indicated.
After all the conditions had been proper ly set, we began the final measurements early in June 1928. We made measurements with 91 normal animals in 9 days. The da ta are given in Table I I where every measurement with every animal is recorded. The logari thms of the intensities are given instead of the intensifies themselves for reasons which will become evident in a moment .

734 VISUAL ACUITY OF THE HONEY :BEE
]
0 0 0 0 0
' ~ 0 0 ~ 0
f,--~ ~ C~ 1"-'4 C~ ~ , I,"~
I,,-~ t,-~ I','~ I ' ,~ I','-~ I,,"~ I',-~
oo ¢
~ ~ ~ o . . . . . .
~ . ~ .
oo oO oO
,,,-4

SELIG HECHT AND ERNST WOLI~ 735
I ~ I ~ I ~ 1 ~ 1 ~ I ~ 1 ~
I , ' * I, '- ' I,,-~
• • o
I'~'-I I~"* I',"'~
• . . ~ . ~ , ~ . ~ . ~ . ~ . ~ . I '"~ I ~''t I~"* I~'-~ I~'~ I'~"l |e'4 levi |~,-,~ |,~,,,'~ i~"~ le~l 1('4
le,4 1("4
le4 le',a te4
I ~ l led I f , !
. ~
M ~
ff
cO
I--~ I - - I

736
1.
VISUAL ACUIT~ OF THE I-IONEY BEE
~ 0 0 0 0 0 0 0 0 0 0 0
0 ~ 0 , 0 O I .~ -~ 0 , ~ 0 0 0 0
I',"'( I,-"~ I , " ; I','-~ I."~ I."'~ I."-~ 1':'4 I""~ h'-~ t"."-~
oO 0 o 0 .r--. " ~ u'~ oO cq 0 .,:-.,. oo
I',-~ I, '~ I,-~ I'~'~ I,-'~ I',"~ I'-"~ I','~ I,-~ I ~-~ h'-~
I~'~ I ' ~ I~"~ I "~ 1,-~ I ~ I ' ~ I~-~ I~"~ 1~"~ I "~ I,-~
h"~ I~'~ IT.,.~ [,"~ I~'~ I~"~ I',"~ I,-~
oo oo oo

SELIG HECHT AND ERNST WOL]~
~ ~ .
. . ~
I,"~ I- -i Irl I,'~ l.-i
I ' , "~ I . . - I I',,.,.I I~",-I ,..,,,I I,,,,,-I I.,.,.,.I
oo
v-4
I I
737

738 VISUAL ACUITY OF THE HONEY BEE
!
°°
r3
o~
"~
o
a~

SELIG HECI:IT AND ERNST WOLF 739
2. The way in which in Table I I the different individuals vary in the minimum intensity for a given visual acuity is significant. The range of variation is greatest at low visual acuities; it decreases as the visual acuity increases; and at the highest visual acuities, it again becomes larger. In Fig. 2 the same data are presented graphically. At once the reason for the curious distribution of the variation becomes clear.
The relation between visual acuity and the logarithm of the illumi- nation is sigmoid, much as for the human eye. I t follows that at low visual acuities a very small difference in visual acuity corresponds to a large difference in intensity; at the middle range, visual acuity is almost directly proportional to log I, the curve being quite steep; finally at high visual acuities a condition prevails similar ~ to that at low acuities. At the two ends a very slight individual difference in the animal shows itself in a large difference in minimum illumination, whereas the reverse is true in the middle ranges. This is shown by the closeness with which the individual points at the lower end adhere to the curve drawn through the average values of the data.
3. The shape of the curve in Fig. 2 indicates that the experiments cover the whole range of visual acuity of which the bee is capable. The maximum value lies between 0.016 and 0.017. This is below the visual acuity of the human eye at the lowest perceptible illuminations. Our maximum visual acuity is about 1.5; our m~nimum is about 0.03 (Koenig, 1897; Hecht, 1927-28). Incredible as it may seem, the bee's greatest capacity for the optical resolution of its environment is never better than ours is at our worst.
The disparity in the visual acuity of our eyes and those of the bee is even greater than this and is brought out by considering the visual acuities at the same illuminations. The maximum visual acuity in both cases occurs at very nearly the same intensities of illumination and corresponds to a brightness of between 50 and 100 millilamberts. Our maximum here is about 1.5; the bee's maximum is 0.017. In other words we can resolve the environment about 100 times better than a bee can. That this low value is no laboratory product is borne out by the experiments of Baumg~rtner (1928) in which bees on the wing in the field were shown to have a similar, almost negligible, form discrimination. Baumg~rtner, using v. Frisch's conditioned-reflex

740 VISUAL ACUITY OF TttE HONEY BEE
method, found that in broad daylight a bee can just recognize a 2 cm. square at a distance of about 40 cm. This corresponds to a visual angle of a little less than 3 °, and a visual acuity of about 0.006. This is even lower than our values, but still of the same order of magnitude.
4. The intensity range over which the bee and the human eye func- tion in relation to visual acuity is such that for each the maximum visual acuity is about 50 times the minimum. In both cases the maximum occurs at about the same intensity of illumination, 100 ml. The lowest visual acuity for the bee is 0.00035 and occurs at 0.020 ml. At intensities below this the animals wander all over the creep- ing compartment and do not respond to the movements of even larger patterns than here recorded. This is an intensity range of about 3.5 logarithmic units. The same span of visual acuity is spread by our eye over a range of over 7 logarithmic units of which 2.5 are controlled by the rods and 4.5 by the cones. Our eyes thus function over intensities 3.5 log units lower than those of the bee.
IV.
Anatomical Basis of Visual Acuity.
1. In spite of these differences in magnitude and range between the visual acuity of the human eye and that of the bee's eye, the relation between visual acuity and illumination is essentially the same in the two. The resolving power of the bee's eye is low at low illuminations and increases with the logarithm of the illumination up to a maximum, in the same S-shaped way as the human eye. The same kind of theoretical treatment is therefore indicated.
Differences in resolving power such as are found here mean differ- ences in the distances which separate the centers of the receiving ele- ments. The data, then, if interpreted naively would require that the ommatidia vary in their distance apart, assuming different positions depending on the intensity. This obviously cannot be true because the eye of the bee is a fixed organ and does not change either its shape or its size under illumination. The data must therefore be inter- preted in some other way, the requirement being to secure a functional sel)aration of ommatidia which are structurally fixed.

SELIG HECHT AND ERNST WOLF 741
To solve this problem it is supposed that the receptor elements in the ocular mosaic do not all possess the same threshold, but that the threshold varies among the ommatidia as does any other characteristic in a population. This then works out so that at low illuminations only a few ommatidia are functional. Since these are distributed at random, they will be far apart and will give the same result function- ally as if there were no receiving structures between them. As the illumination increases, more and more ommatidia become functional; the distance between functional elements becomes smaller; and the resolving power becomes greater. This continues until an illumina- tion is reached which is above the threshold of the most insensitive ommatidium. All the elements will then be functional, and no further increase in visual acuity can take place.
I t is apparent that such an explanation is in general agreement with the data, and could be formulated in strictly quantitative terms for comparison with the data. However, before this can be done in a significant manner it is necessary to examine more closely the nature of the data in their relation to the structure of the eye.
2. In the experimertts the animals were measured as they crawled . in directions nearly parallel to the length of the stripes. The visual pattern is therefore registered across the long axis of the eye. Let us neglect for a moment the fact that since the plane of the pattern is roughly perpendicular to the long axis of the eye, the successive bars in the pattern will occupy a decreasingly smaller visual angle. At an illumination when all the elements are functional, the maximum visual acuity will then occur when a horizontal row of elements receives light, and an adjacent row receives no light, and so on. The size of the smallest perceptible pattern will correspond to the visual angle which separates the centers of two adjacent elements.
If the elements were all the same angular size and were evenly dis- tributed on the surface of the eye, the maximum visual acuity would be perceptible all over the eye. But the elements in the bee's eye are not uniform in angular dimension. Then the maximum visual acuity can obviously be perceptible only at that point on the eye where the population density of visual elements is at a maximum, and the result- ing angular separation a minimum. In the very nature of our meas- urements the visual acuity corresponding to any illumination is
742 VISIYAL ACUITY OF THE HONEY BEE
always the maximum visual acui ty at tha t intensity. Therefore at any illumination, no mat te r how many functional elements it repre- sents, the visual acuity, as given, is determined at tha t area on the eye where the population density of functional elements is greatest. This is a fundamental concept in understanding the data. For tunate ly it m a y be tested experimentally.
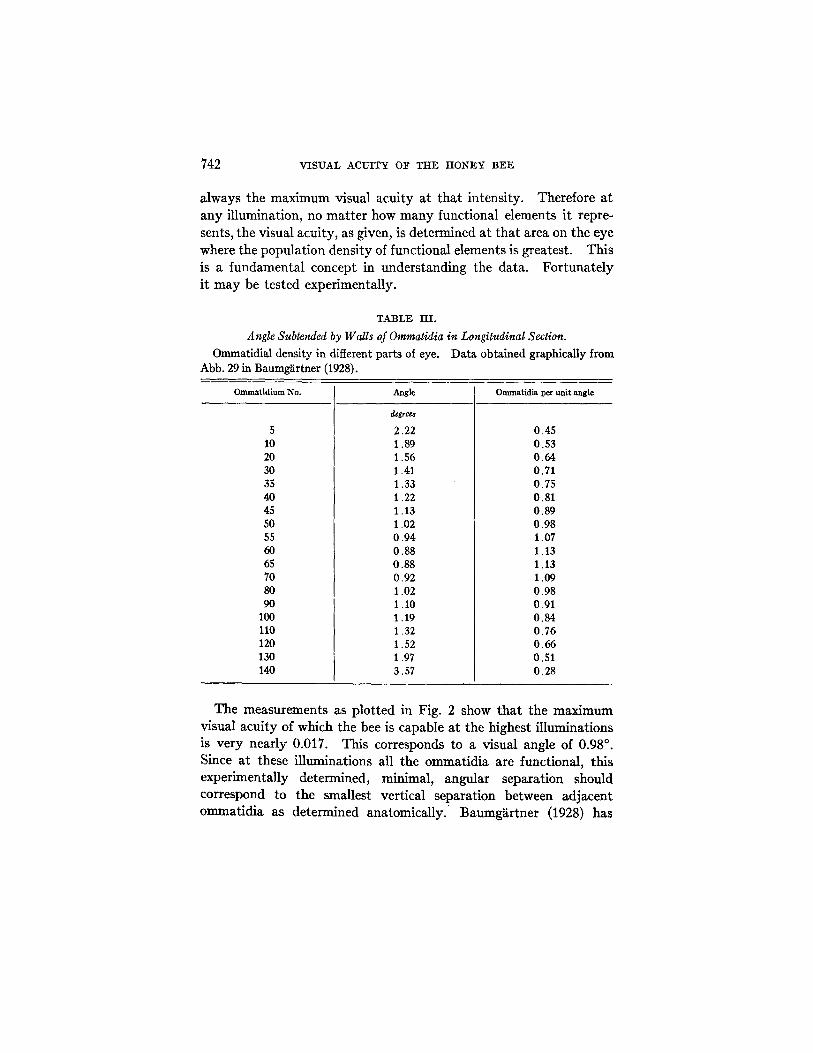
TABLE III. Angle Subtended by Walls of Ommatidia in Longitudinal Section.
Ommatidial density in different parts of eye. Data obtained graphically from Abb. 29 in Baumg~trtner (1928).
Ommatidiura No. Angle Ommatidia 1~er unit angle
5 10 20 30 35 40 45 50 55 60 65 70 80 90
100 110 120 130 140
2.22 1.89 1.56 1.41 1.33 1.22 1.13 1.02 0.94 0.88 0.88 0.92 1.02 1.10 1.19 1.32 1.52 1.97 3.57
0.45 0.53 0.64 0.71 0.75 0.81 0.89 0.98 1.07 1.13 1.13 1.09 0.98 0.91 0.84 0.76 0.66 0.51 0.28
The measurements as plotted in Fig. 2 show tha t the maximum visual acui ty of which the bee is capable at the highest illuminations is very nearly 0.017. This corresponds to a visual angle of 0.98 °. Since at these illuminations all the ommatidia are functional, this experimentally determined, minimal, angular separation should correspond to the smallest vertical separation between adjacent ommatidia as determined anatomically. ' Baumgiirtner (1928) has

SELIO H~CHT AND ERNST WOLF 743
zecently made a histological study of the bee's eye, and has measured the angular separation of adjacent ommatidia in different sections of the eye. In vertical section the angular separation increases about four times from center to periphery. The smallest separation is near the middle, in the lower half of the eye and includes between 20 and 25 dements in vertical section. Its value lies between 0.9 ° and
/.2
/.o
I Oa$ / \
0 ,$'0 /oo INO
.Nequence oj r Ornrno/'idlo
FIG. 3. Morphological distribution of visual acuity in a longitudinal section of the bee's eye. Data taken from Abb. 29 in Baumg~rtner's (1928) paper. The abscissas are the ommatidia in sequence beginning with the ventral ommatidium and going dorsally. The ordinates are the reciprocals of the angle made by the walls of the corresponding ommstidia. The ordinates are eqivalent to the relative number of ommatidia in a unit angle in different parts of the eye.
1.0". This agreement between experimental and morphological find- ings indicates that visual acuity is determined by the region of maxi- mum population density.
3. The evidence for this conclusion becomes even better when the morphological findings are examined in detail. Baumgtirtner meas- ured the angular separation of the two walls of each ommatidium in the longitudinal section of the eye. Table I I I contains the data,

744 VISUAL ACUITY O~' THE HONEY BEE
taken graphically from Fig. 29 of Baumg'~rtner 's paper, which describe
his findings with 8 such sections. The data are plot ted in Fig. 3.
Here the abscissas are the ommatidia numbered in serial order b e -
ginning at the bo t tom of the eye; the ordinates are the reciprocals of
• TABLE IV.
Relation Between Visual Acuity and Illumination in Bees With the Central Area of the Eye Painted Out.
Non-functional area is one-quarter of normal. Illumination in millilarnberts; visual acuifies as in Table I.
Date Animal
June 28, 1928 1 2 3 4 5 6 7 8 9
10 11 12
June 29, 1928 13 14 15 16 17 18 19 20 21
Averages . . . . . . . . . . . . . .
No. F LogarithmG of illuminationit fori visual] acuityj
7. 493 ]'.948 O. 092 7.666 i .942 0.016
.558 1.919 i .960 7.817 7.988
.613 7.673 7.983 7.502 i .9oo o .028 7.593 i .984 0.058 7.423 1.774 i.959 7.240 1 . 7 9 3 0,060 7.704 0.006 0.105 7.602 i.890 0.040
.550 7 . 8 7 7 0.024 .801 0.010 .946 0.038
1.867 0.030 T .990 0.111
.921 0,072 7,928 0.090 7.817 7.959 i .885 0 .OO4 7.863 7,988
.540 1-.883 0.029
0.165 0.610 0.127 0.406 0.254 0.345 0.195 0.202 0.693 0.242 0.6O3 0.213 0.534 0.120 0.438 0.240 0.364 0.192 0.479 0.170 0.450 0.146 0.201 0.172 0.359 0.195 0.550 0.152.1 0.503 0.215 I 0.610 0.159 0.163 0.195 0.133 I 0.367 0.150 0.463 0.127 0.118
0.179 0.435
1. 222 1.283
1.128 1.065 1.088
1.339 1 .,185 1.300 1.153 1.205
1.121 1,236
1.321 1.191
1.203
the angular separation of adjacent ommatidia, and therefore represent the density of ommatidia distribution in vertical section. At tent ion is called part icularly to the region of great ommatidia density in the lower half of the eye where occur the elements of smallest angular
separation already referred to. The arrangement is not unlike the

SELIG HECHT AND E R N S T WOLF 745
concentration of the smallest retinal elements which form the fovea of mammals.
What should happen if this region of high ommatidial density were rendered functionless? Clearly, the maximum visual acuity should be decreased, since it would have to be mediated by the region of the eye with a lower concentration of visual elements. Moreover the whole relation between visual acuity and illumination should become depressed, in that the visual acuity at any illumination should be lower than normal and dependent on the extent of the Iovea which has been rendered nonfunctional.
TABLE V.
Comparison Between Visual Acuity of Normal Bees and of Be*s With Central Part of Eye Painted Out.
Losaritbm of illumination
i .540 i .883 0.029 O. 179 0.435 1.203
~sua lacu i~X i ~
Normal
20.6 58.3 87.2
110.4 133.9 159.0
Painted
15.9 39.7 59.5 ?9.4 99.2
119.0
Painted Normal
0.77 0.68 0.68 0.72 0.74 0.75
We made experiments in which a spot of black paint was placed in the center of each eye. It is, of course, difficult to place such a patch of paint with very great accuracy, and to do it uniformly from eye to eye. We tried to cover about a quarter of the area of the eye. In vertical section such a patch extends over about half the ommatidia and eliminates those elements falling between ommatidium No. 35 and No. 100. With the fovea removed down to about ommatidium No. 35, the maximum density of elements is between 0.75 and 0.80, which corresponds to an angular separation of 1.3 ° . Since the mini- mum angular separation for the normal bee is very nearly 0.9 ° , the maximum visual acuity of the bees with the fovea painted out should be between three-quarters and two-thlrds of normal at the highest illuminations. Moreover, since, as is apparent from Fig. 3, the omma- tidial density decreases in a roughly uniform manner from the center

746 VISUAL ACUITY OF THE HONEY BEE
to the periphery, the visual acuities at any other illuminations should be correspondingly lower.
We made two series of measurements in the usual way in which the relation was determined between visual acuity and illumination for
150
I 0 0
s o
o
-I.o
/ /
/ /
/ /
I
I j F . . . .
I I I /
/ . ~ . .
/
,7...
I
I f .
/ . /
/
f D
0 . o / .o z .o
FIG. 4. Relation between visual acuity and illumination for bees with the central part of the eye painted out as shown in the figure. The points are in- dividual measurements. The broken curve is the normal relation taken from Fig. 2. The full curve is made from the normal curve by multiplying its ordinates by 0.75.
bees with a central spot of paint on each eye. One series contained 12 animals; the other 9 animals. The results are given in Table IV in which the individual measurements are recorded as before. Table V

S E L I G H E C H T A N D E R N S T W O L ! ~' 747
gives the average values of the intensities, the corresponding visual acuities for the painted bees, and for normal bees as taken from Fig. 2. The last column gives the ratios of the visual acuity of the painted eye to that of the normal eye at the same intensity. The ratio is obviously constant.
The data are also presented in Fig. 4, in which the two series are not treated separately. The broken curve in Fig. 4 is the normal curve taken from Fig. 2. The solid curve through the points is this same normal curve with its ordinates multiplied by 0.75. This agree- ment with expectation is surprisingly good, and shows that visual acuity determination in the bee's eye is a regional function, and de- pends on the utilization of the part of the eye containing the densest population of active elements.
It is significant that the region of densest ornmatidia population is in the lower half of the eye, because the lower half of the eye is con- cerned with our measurements. This is apparent from the relative positions of the eye and the pattern. However, we tested it experi- mentally as well by painting out the upper half of the eye. Such a procedure seems to have no effect on the general behavior of the bee nor on its visual acuity.
4. Our measurements of visual acuity were so conducted that the pattern was registered on the long dimension of the eye. Consider an illumination when only a fraction, say one-ninth, of the visual elements are functional. Since the thresholds are distributed at random, any two functional elements are separated by two non-func- tional ones. Assuming for the moment that the mosaic is uniform, the angular distance between the functional elements will now be three times as great as in the fully functional eye. If the visual pattern varied in many directions, the resulting visual acuity would then be a third of its maximum -value. But the present pattern is a uni-directional one, and can be resolved only along the vertical axis of the eye. The visual acuity corresponding to the present situation will then be determined by the projection on the long axis of the visual angle between any two functional elements. Moreover the ocular mosaic is not uniform. The visual acuity will then be determined by the apparent vertical separation of functional ommatidia in the region of greatest density.

748 VISUAL ACUITY OF THE HONEY BEE
This region of m a x i m u m ,density is a lways small, as Fig. 3 shows,
and will contain only a few functional elements for which this vert ical separat ion corresponds to the m a x i m u m visual acui ty a t t h a t illumi-
nation. Undoub ted ly a certain min ima l number of such elements are required for the reception of the stimulus. Since the eye is ve ry
TABLE VI,
Relation Between Visual Acuity and Illumination for Animals With One-half the Eye Painted Out.
Illumination in millilamberts; visual acuity as in Table I.
Date An~
June 23, 1928
1 1
June 25, 1928 1 1 1 1 1 1 1 1
Averages . . . . . . . . . . . . . . .
tNo. E
--I ~.3~
i T.578 i ~.563
.614 ' i . 3 1 4
1.519 i 1.477 i 1.463
1.661 i ! .608
1.402 1.419
~.470 1.343 1.545 1.533 1.402
Logarithm of illumination for visual acuity
F G
.~.384 1.734 1.716 0.071 ~.710 0.032 1.675 0.050 1-.434 [.778 1.660 0.076 1.549 0.028 1.675 1.930 T.777 0.001 ~.675 1.965
~1.648 1.939 ~.608 0.050 1.614 1.817 1.777 1.863 1.552 1.969 i.638 1.828 ~.722 0.O04
T.963 T .384 T .648 1.912
1.482 1.637 i.948
I I H I I J
0.170 0.444 0.184 0.679 0.225 0.518 0.213 0.695 0.061 0,574 0.206 0.580 0.282 0.518 0.231] 0.667 1 0.170 0.664 0.050 0.464
0.208 0.325 1.970 0.438 0.138 0.500 0.120 0.708 0.220 0.345 0.246 0.514
0.565 0.110 0.530
0,165 I 0.540
1.018 1.034 1.178 1.310 0.863 1.072
1.193 1.201
1.018 1.218 1.172 1.026
1.153
I. 112
near ly symmetr ica l in i ts two halves, there will be a symmet r ica l dis t r ibut ion of these few critical elements on either side of the central vert ical axis. I f now one side of the eye were rendered funcfionless, this should a t once reduce the number of densely grouped elements b y half. To get the same number of functional elements as before in order to resolve the pa t t e rn , elements which are more widely separa ted

SELIG tt-ECttT AND ERNST WOLF 749
would have to be drawn on, and at once the visual acuity should be decreased.
We made two series of experiments which test this; one with 11 bees and the other with 8 bees. In these we painted out approximately half of each eye, the dividing line being along the vertical axis. The results are given in Tables VI and VII, the latter containing the ratios of the visual acuities here obtained with those found for the normal bee at the same illumination. The ratios are seen to be nearly the same. This is brought out by Fig. 3 where the data are presented graphically. Through the experimental points there is drawn a con-
TABLE VII.
Comparison Between Visual Acuity of Normal Bees and of Bees With Anterior Half of Eyes Painted Out.
Logarithm of illumination
1.482 1.637 1.948 0.165 0.540 1.112
Visual acuity X 104
Normal
17.8 26.4 70.9
108.6 140.1 157.9
Painted
11.0 15.9 39.7 59.5 79.4 99.2
Painted Normal
0.62 0.60 0.56 0.55 0.57 0.63
tinuous curve whose brdinates are 0.62 of the values for the normal, unpainted eye.
I t is therefore apparent that the reduction of visual acuity as the result of painting out half the eye is of the kind which should occur if the resolution of the visual pattern is determined by the vertical separation of the functional ommatidia in the region of maximum density.
We made several series of experiments in which the functional p a r t of the eye was further reduced. As is to be expected, the resulting visual acuity function becomes more and more depressed. The data are not given, because they are of no quantitative significance, since the actual part of the eye which remains unpainted is not definable in any quantitative terms as it decreases in size.
5. The conclusion to which we have just arrived, as well as the

750 VISUAL ACUITY OF THE HONEY BEE
facts which have led to it result in a minor paradox. In computing in Table I the visual angle corresponding to each of the pattern plates we considered the angle subtended by the two edges of a bar, one side
/J /
! ,E
/ /
!
/
/ I . I
i 3 / . /F -
t /
f J
J
- / .0 0 .0 /.0 Z.O
I-o~ Z ~ rnillilornberfs
FIo. 5. Relation between visual acuity and illumination for bees with the an- terior half of the eyes painted out. The points are individual measurements. The broken curve is the normal curve of Fig. 2. The full curve is constructed from the normal by multiplying its ordinates by 0.62.
of the angle being the perpendicular from the center of the eye to the plate. The tangent of the visual angle is the width of the bar divided by the perpendicular distance of the eye from the plate.
If the plane of the plate were parallel to the long axis of the eye this treatment would correctly give the visual angle subtended at any part

SELIG HECHT AND ERNST WOLF 751
of the eye. But since the plate is practically perpendicular to the long axis of the eye the visual angle subtended by a bar varies with the part of the eye which is concerned with the resolution of the pat- tern. The paradox then is that we have been comparing a visual angle measured on the plate at the perpendicular from the eye with an angular separation of ommatidia situated one-third of the way up the eye.
The paradox largely disappears when it is remembered that the head of the bee as it creeps is not rigid. Even at rest the head is not kept perpendicular to the creeping plane; and when the animal creeps the position and angle of tilt of its head vary considerably. For a good part of the time during creeping the visual angles as given in Table I probably represent the real angles. This is borne out by the coincidence between the anatomical visual angle and the experimental visual angle at the highest illuminations. This can hardly be con- sidered fortuitous, especially when it is reinforced by the agreement of the experimental findings with those calculated on the basis of painting out portions of the eye. We have therefore retained the visual angles for the plates as given in Table I on the supposition that they are an appropriate designation of the resolving power of the eye at the intensifies to which they apply
V.
Visual Acuity and Number of Elements.
1. Having considered the anatomical and structural basis of visual acuity in the bee's eye, we may now apply this information to a closer analysis of the relation between visual acuity and illumination as it concerns the number of elements functional,--an analysis postponed from the previous section. Off hand it would seem that, since visual acuity is determined by the vertical distance between elements in the region of maximum ommatidial density, the curve in Fig. 2 represents the number of functional elements in the vertical axis of the fovea corresponding to any illumination. This would be true if the ocular mosaic were uniform. Since however, the angular separation between adjacent ommafidia is not constant, the precise way in which this

752 VISUAL ACUITY OF THE HONEY B E E
varies must be considered in the conversion of visual acuity into num- ber of ommatidia functional.
In Fig. 6 we have plotted part of the lower half of the bee's eye, ommatidium for ommatidium, beginning with ommatidium No. 25 and ending with No. 70 which is just in the center of the eye. The linear distance is in terms of ommatidial angle as taken from Baum- g~rtner's average curve given in Table I I I and in Fig. 3. This region covers a total angle of about 50 ° and therefore includes the whole range of visual angle encountered in the measurements.
The ommatidia lying in the center of the foveal region, that is Nos. 56 to 70, have practically the same visual angle, No. 56 has an angle of 0.92°; those in between gradually decrease to No. 63 whose angle is
Omn~tidivm //umber 2,5" JO ~ 4 0 45 5:0 55" 60 65 70 I 1 I I I I I , I I i , I I 1 , ! i i ! l , l i i l l l l , l, l l, lll l , l l l i / ! l , l l l , l , i l ! l ~o 4~ ~o a s ~o z5 zo i s to ~ o
VI'Svol A n ~ l e - D e p r e e 5
Fro. 6. Graphic representation of the method of finding the number of omma- tidia included in a given visual angle. The lower scale is a linear scale of visual angles. The upper scale gives the angle subtended by the individual ommatidia, beginning with No. 70 at zero angle.
0.88 ° and then increase again to No. 70 which also has an angle of 0.92 ° . This variation of about 5 per cent ~ may be neglected in view of the almost 100 per cent increase in visual angle shown by ommatidium No. 25. The significance of this middle region is that since it is the area of maximum population density the chance is greatest of its being the location of the most sensitive ommafidium. Therefore even at the lowest illumination, one functional element is most likely to be found here, and will continue to be here at all intensities. I t may therefore be taken as the reference point from which to measure the vertical angular separation on the eye corresponding to any visual angle.
Which of the dozen or so elements in this practically uniform region of maximum density is the most sensitive one it is not possible to say. We have selected ommatidium No. 70, because the distance from it to any point on the lower half of the eye will always include the greatest

SELIG HECHT AND ERNST WOLF 753
number of elements. I t may be added that for the present purposes it matters only slightly whether we choose ommatidium No. 63 which is in Che exact center of the fovea, or No. 70. The numerical results which we are after differ only insignificantly in the two circumstances, and the principle is the same.
Below the diagram of the ommatidia in Fig. 6, we have drawn a simple linear scale of visual angle, beginning with zero at the upper edge of ommatidium No. 70. Using these two scales, one can read off how many ommatidia in the vertical projection on the upper scale
TABLE VIII.
Relation Between Visual Angle, the Number of Ommatidia Included in the Angle, and the Number of Ommatidia Functional per Unit Angle;
Visual angle
degrees
47.7 35.6 28.5 20.0 15.2 10.5 4.20 2.80 2.10 1.68 1.40 1.20 1.05
Number of ommatidla included
43.55 34.83 29.24 21.67 16.84 11.78 4.65 3.08 2.30 1.84 1.53 i .31 1.14
Number of ommatidia functional in unit angle
1.00 1.25 1.49 2.01 2.59 3.70 9.37
14.14 18.93 23.67 28.46 33.24 38.20
are included in a given visual angle on the lower scale. At the greatest visual angle of 47.7 ° there are included 43.55 ommatidia. This means that the angle formed at the center of the eye by the lines from the two functional ommatidia nearest together includes 43.55 ommatidia in its projection on the longitudinal meridian of the eye. I t there- fore follows that only 1 out of 43.55 ommatidia is functional. This of course is only in projection on the vertical meridian, and does not mean the number of ommatidia which actually separate the two func- tional ornrnatidia in a direct line connecting them on the surface of the eye. This real value is naturally a whole number, and not a

754 V I S U A L A C U I T Y O F T H E H O N E Y B E E
'1
\ \
,.~ ÷,~
o ~ ~

$ELIG HECHT AND ERNST WOLF 755
fractional one. The same procedure may be continued in order to determine the projected separation of the two functional ommatidia corresponding to any other visual angle.
The use of Fig. 6 in determining ommatidial density along the eye is a graphic method. Actually we determined these values arithmeti- cally using exactly the same principle as described graphically. The values so secured are given in the second column of Table VIII. At a visual angle of 47.7 °, there is functional 1 out of every 43.55 om- matidia. At a visual angle of 35.6 ° this will be 1 out of every 34.83
i i
O J -
zO ~ o
Thr~zhold~Lo~7 Z - Millilornberl~
Fro. 8. Distribution of thresholds of the ommatidla in the bee's eye. The curve is the first differential of the number curve in Fig. 7, and is a differential probability or distribution curve.
ommatidia; or 1.25 out of" every 43.55 ommatidia,, if one considers the largest visual angle as the unit inside of which all the other angles must fall. In the same way all the other angles are computed with the results given in Column 3 of Table VIII.
We have thus made, in terms of the structure of the eye, a transfor- mation from visual acuity data to the corresponding number of ele- ments functional in a given distance on the vertical meridian of the eye. I t is true that we do not have the real numbers but only the numbers in vertical projection. This is not without significance, as will be apparent presently. However, since the surface of the eye

756 VISUAL ACUITY OF THE HONEY BEE
is a hexagonal mos~/ic the real numbers are a simple geometric function of the numbers projected on the vertical meridian. The ratio of real distance to projected distance in such a mosaic is as ~/3 is to 1 ; so that any conclusions drawn for one holds for the other.
2. In order to show how these values of the number of functional elements are related to the visual acuity data from which they are derived, we have plotted both in Fig. 7. The upper curve is the visual acuity relation, the points being the averages from Table II. The lower curve is the number curve. So that the two might more readily be compared we have multiplied the ordinates of the number curve by 3.5; the ordinate units are thus the same in the two cases, and the lowest points are identical in the two. I t is apparent that the number curve is lower, and more symmetrical than the visual acuity curve.
The number curve in Fig. 7 resembles the usual integral distribu- tion curves of the statisticians, even as its first differential, the thresh- old curve, in Fig. 8 resembles the more commonly encountered differ- ential distribution curves. These are indeed what they should be according to our idea of the relation between illumination, number of elements functional, and the resulting visual acuity. Therefore we may make our hypothesis quantitatively specific by stating it as follows. Taking the structural relations of the ocular mosaic as given by Baumgiirtn.er (Table III) , the data relating visual acuity and illumination (Table II) may be described with complete fidelity by assuming a distribution of the thresholds of the various ommatidia corresponding to the population curve of Fig. 8.
3. This distribution curve may be interpreted in two ways. So far we have tacitly assumed for the human eye and for the bee's eye that a given threshold is a permanent characteristic of a given element. The curve in Fig. 8 then represents the distribution of this character- istic in the population of ocular elements. For the human eye we even suggested a possible photochemical basis for this distribution (Hecht, 1927-28). However, one may conceive this situation purely in terms of probability. Assume that the threshold of a given ele- ment is not fixed, but can vary over the whole range included in Fig. 8. Then at any moment the probable distribution of elements over the entire threshold range is given by the curve in Fig. 8. This may therefore be used as the basis for visual acuity in precisely the same way as before.

SELIG HECHT AND ERNST WOLF 757
We frankly incline toward the fixed threshold interpretation largely because it seems unlikely to us that a given cell can vary in its threshold from moment to moment over such a very large range of illuminations. However the matter may be tested experimentally by studying the dark adaptation of very small retinal areas in the human eye. If the increase in sensibility during dark adaptation for minute areas is as smooth and regular as for large areas then the threshold of a given element is most likely a permanent property.
It is apparent that the computations, ex, periments, and reasoning in Section IV and in a good part of the present section cSuld have been avoided if we had merely assumed that the ocular mosaic is uniform, or had been ignorant of its being otherwise. Then the direct visual acuity curve in Fig. 2 could have been assumed as the integral dis- tribution curve. Its first differential would have been considered as the frequency distribution of the thresholds which have to be assumed to account for the data. It is only because we wished to correlate structure and function that we performed the experiments in which various portions of the eye were painted out. The more extended analysis here presented then became necessary.
4. There remain some minor aspects of the data to be considered. Studies on other arthropods have shown that the pigment in and between the ommafidia migrates, and that this migration is controlled by the illumination. The position of the pigment between the omma- fidia may affect the degree to which these are isolated from one another, and may thus influence visual acuity. It is difficult to esti- mate the magnitude of this factor because we know of no data for the bee's eye. Bennitt's (1924) work, however, would indicate that it may be comparatively negligible because, in the arthropods which he studied, the migration begins at quite low illuminations, and is com- plete over a very restricted increase in intensity. If the bee's eye behaves in a similar manner, pigment migration would hardly enter to distort the relationship shown in Fig. 7.
Another matter concerns the shape of the bee's eye. Our measure- ments relate only to a uni-dimensional resolution on the eye. The frequency curves in Figs. 7 and 8 therefore concern the distribution of functional elements in one dimension only. It might then seem that, though useful as description, such curves cannot represent any-

758 VISUAL ACUITY 01~ THE HONEY BEE
thing basic in the constitution of the ocular mosaic. Since the ele- ments in the eye end in a surface, it might appear that a frequency distribution per unit area would be more fundamental than a distribu- tion per unit distance. The simplest method of converting a linear distribution into a surface distribution would be, in the case of a uniform mosaic, to consider the square of the linear distribution.
There are however several reasons which render it probable that a linear frequency distribution is nearer reality than a surface one. The eye is about four times as long as it is wide. Furthermore the angular separation between adjacent ommafidia is more than three times as great in the horizontal meridian as in the vertical meridian. Both these facts would tend to make the bee's eye an organ which functions essentially as a linear receptor.
This is indeed true experimentally. Baumg'Artner found that bees in the field are very astigmatic, and resolve their environment verti- cally with much greater accuracy than horizontally. Our own ex- periments showed this independently. Our first tests were made with a long creeping compartment in which the bee crawled from one end to the other, and we tried to make it slow up or turn around by moving a set of stripes under it either in the direction in which the bee was creeping or in the opposite direction. We got no reliable results this way. I t was only when the apparatus was changed so that the bee crawled in a direction perpendicular to the movement that we secured significant results. The bee's eye thus seems to be functionally and structurally an organ concerned with the resolution of the environ- ment mainly in one dimension. The data, and the statistical curves in Figs. 7 and 8, therefore very likely represent the real rather than an apparent distribution of elements in the ocular mosaic.
SUMMARY.
1. Bees respond by a characteristic reflex to a movement in their visual field. By confining the field to a series of parallel dark and luminous bars it is possible to determine the size of bar to which the bees respond under different conditions and in this way to measure the resolving power or visual acuity of the eye. The maximum visual acuity of the bee is lower than the lowest human visual acuity. Un-
SELIG HECHT AND ERNST WOL~ 759
der similar, maximal conditions the fineness of resolution of the human eye is about 100 times that of the bee.
2. The eye of the bee is a mosaic composed of hexagonal pyramids of variable apical angle. The size of this angle determines the angular separation between adjacent ommatidia and therefore sets the struc- tural limits to the resolving power of the eye. I t is found that the visual angle corresponding to the maximum visual acuity as found experimentally is identical with the structural angular separation of adjacent ommatidia in the region of maximum density of ommatidia population. When this region of maximum ommatidia population is rendered non-functional by being covered with an opaque paint, the maximum visual acuity then corresponds to the angular separation of those remaining ommatidia which now constitute the maximum density of population.
3. The angular separation of adjacent ommatidia is much smaller in the vertical (dorso-ventral) axis than in the horizontal (anterio- posterior) axis. The experimentally found visual acuity varies correspondingly. From this and other experiments as well as from the shape of the eye itself, it is shown that the bee's eye is essentially an instrument for uni-directional visual resolution, functional along the dorso-ventral axis. The resolution of the visual pattern is there- fore determined by the vertical angular separation of those ocular elements situated in the region of maximum density of ommatidia population.
4. The visual acuity of the bee varies with the illumination in much the same way that it does for the human eye. I t is low at low illuminations; as the intensity of illumination increases it increases at first slowly and then rapidly; and finally at high intensities it becomes constant. The resolving power of a structure like the bee's eye depends on the distance which separates the discrete receiving elements. The data then mean that at low illuminations the distance between receiving elements is large and that this distance decreases as the illumination increases. Since such a moving system cannot be true anatomically it must be interpreted functionally. I t is therefore proposed that the threshold of the various ommatidia are not the same but that they vary as any other characteristic of a population. The visual acuity will then depend on the distance apart of those elements

760 VISUAL ACUITY OF THE HONEY BEE
whose thresholds are such tha t they are functional a t the par t icu lar i l lumination under investigation. Taking due consideration of the angular separation of ommat idia it is possible to derive a dis tr ibut ion curve for the thresholds of the ommatidia which resembles the usual probabi l i ty curves, and which describes the da ta with complete fidelity.
BIBLIOGRAPHY.
Baumggrtner, H., Der Formensinn und die Sehschiiffe der Bienen, Z. vergl. Physiol., 1928, vii, 56.
Bennitt, R., The migration of the retinal pigment in crustaceans, J. Exp. Zool., 1924, xxiv, 381.
Exner, S., Die Physiologie der facettirten Augen yon Krebsen und Insekten, Leipsic, 1891.
v. Frisch, K., Der Farbensilm und Formensinn der Biene, Zool. Jahrb., physiol. Abt., 1915, xxxv, 1.
Hecht, S., The relation between visual acuity and illumination, Y. Gen. Physiol., 1927-28, xi, 255.
Koenig, A., Die Abh~ngigkeit der Sehschitrfe von der Beleuchtungsintensit~t, Sitzungsber. k. Akad. Wissensch., 1897, 559.
Pavlov, I. P., Conditioned reflexes; an investigation of the physiological activity of the cerebral cortex. Trans. and ed. by C. V. Anrep, Oxford, 1927.
Uhthoff, W., Weitere Untersuchungen fiber die Abh/ingigkeit der Sehsch~irfe yon der Intensit~t sowie yon der Wellenl~nge im Spektrum, Arch. Ophth., Leipsic, 1890, xxx¢-i, 1 Abt., 33.