the wealth of cities - smu
TRANSCRIPT
O’Neil Center 2014-15 Annual Report 1
2014-15 Annual Report • William J. O’Neil Center for Global Markets and Freedom • SMU Cox School of Business
THE WEALTH
OF CITIESPursuing Economic Freedom
Closer to Home

TABLE OF CONTENTS
A Message from the Dean..............................1
The Wealth of Cities.....................................2
Measuring Economic Freedom for Metropolitan Areas.................................6
The Paradox of Amenities...........................12
Free the World............................................15
2014-15: Year in Review..............................17
The William J. O’Neil Center for Global Markets
and Freedom was founded in 2008 with an initial
grant from William J. O’Neil, a 1955 SMU business
school graduate, and his wife Fay C. O’Neil. Its
broad mission is the study of why some economies
prosper and others do poorly, focusing on two critical
issues for the 21st Century economic environment—
globalization and economic freedom. The center’s
programs promote understanding of how capitalism
works among the general public, policy makers,
business managers and the next generation of
business leaders. To these ends, the O’Neil Center
teaches SMU Cox students, conducts economic
research, publishes economic reports, sponsors
conferences and educates the public through the
media and speeches.
SMU will not discriminate in any program or activity on the basis of race, color, religion, national origin, sex, age, disability, genetic information, veteran status, sexual orientation, or gender identity and expression. The Executive Director for Access and Equity/Title IX Coordinator is designated to handle inquiries regarding nondiscrimination policies and may be reached at the Perkins Administration Building, Room 204, 6425 Boaz Lane, Dallas, TX 75205, 214-768-3601, [email protected].
Design by WiswallMcLainDesign

O’Neil Center 2014-15 Annual Report 1
The dean’s office at SMU Cox provides great vantage to observe The Wealth of Cities. The Dallas-Fort Worth area has been booming during my 18 years here.
The local economy has created 806,000 jobs since 1997. Fed by migrants from other states, the DFW population increased by nearly 2.4 million, or 137,000 a year. We’ve been building at a frantic pace—houses, apartments, office buildings, warehouses, retail stores. SMU Cox’s Dallas 100, an annual salute to the area’s fastest-growing new companies, testifies to the energy of the region’s entrepreneurs.
DFW’s economy benefits SMU Cox. We’re enrolling the most gifted students in our history. They choose SMU Cox over some of the best business schools in the country, often because they see the opportunities that await them in this thriving metropolis.
The DFW boom isn’t happenstance—that’s one of the takeaways from the essay that starts on the next page, written by O’Neil Center founding director W. Michael Cox and his co-author Richard Alm. They identify the
links between economic freedom and the success of America’s metropolitan-area economies.
Cox and Alm show that our metropolitan economies are the nation’s best hope for growth and jobs at a time when businesses face the challenges of global competition. It’s an important contribution to our understanding of the world we live in.
Keep reading after finishing the essay. The annual report chronicles the O’Neil Center’s activities since the start of 2014. I’m sure you’ll agree that the center has been diligent in pursuing its mission of studying why some economies thrive while others struggle.
The new academic year brings a change in leadership at the O’Neil Center. Bob Lawson takes over as director, and Cox, the director since 2008, returns to his research and teaching. The O’Neil Center’s mission will not change, and we can look forward to continued great work in the years to come.
Albert W. Niemi, Jr.Dean, Cox School of Business
A Message f rom the Dean
Dean Niemi addressing the O’Neil Center conference in October 2014

O’Neil Center 2014-15 Annual Report2
standards—a progression that has been speeding up in recent decades.
Today’s cities share a lineage that goes back to ancient times, when our ancestors massed and intermingled in such places as Babylon in the Mideast, Athens and Rome in the Mediterranean, Teotihuacán in Mexico, Delhi in India, Xian in China. London, Amsterdam and Venice arose as key centers of commerce in medieval Europe.
These cities were the glory of their times, but urbanization didn’t really pick up steam until the Industrial
Asked to name mankind’s greatest invention, some might point to early innovations like the wheel or the plow. Others might make the case for more modern technologies, such as electricity, the internal combustion engine or computers and the Internet. An intriguing answer comes from Edward Glaeser—the city.
Hear him out. Cities are our greatest invention, the Harvard professor says, because proximity, density and closeness produce an environment where human creativity and cooperation flourish. New ideas
emerge, percolate, mutate and spread. Old ideas fall into the dustbin of history. Most of humanity’s progress has sprung from the perpetual churning of ideas and enterprises that takes place in the urban milieu.
On a day-to-day basis, city life at street level can be noisy, crowded, frustrating and at times downright intimidating. It makes Glaeser’s celebration of cities seem idealistic. Yet, the grand sweep of history reveals an inexorable migration to cities, accompanied by advancements in technology, culture and living
By W. Michael Cox and Richard Alm
THEWEALTH
OF CITIES Pursuing Economic Freedom Closer to Home
Tampa, Florida Houston, Texas Dallas, Texas

O’Neil Center 2014-15 Annual Report 3
Revolution provided greater rewards for leaving farms to take jobs in factories. As wave after wave of people arrived, cities and the nations that surrounded them became wealthier.
The United States industrialized ahead of the rest of the world, giving Americans an early start on the march from the countryside to cities. The sun set on the U.S. industrial era decades ago, but urbanization has continued apace as the economy shifted toward knowledge-based industries and services. Now, nearly 80 percent of Americans live in cities, and they’re increasingly concentrated in the biggest metropolitan areas (see Exhibit 1 , page 4 ).
Taken together, the country’s city-dwellers are very productive. The 25 largest U.S. metropolitan areas, home to 40 percent of the population, account for more than half of U.S. economic activity. Urban areas’ contribution rises to nearly 65 percent for the top 50 cities and almost 75 percent for the top 100. On a per-person basis, city workers churn out significantly more goods and services than rural residents (see Exhibit 2, page 5). The implication is clear: cities are the engine of America’s
economy, and the nation’s prosperity will depend on cities as dynamic centers of economic growth.
Looking around the country, we see huge gaps in major metropolitan areas’ economic fortunes—every booming Dallas-Fort Worth is offset by a sclerotic Detroit. In The Wealth of Nations, published in 1776, Scottish economist Adam Smith sought to explain why some places adapt and thrive while others stagnate and decline. Smith attributed wealth to a political economy of freedom, built upon private property, market incentives, free trade, specialization and a culture of commerce.
Transported forward in time to today’s more urbanized world, Smith would surely feel compelled to make his inquiry about the nature and causes of the wealth of cities. He’d no doubt find economic freedom still
goes a long way toward explaining the march of economic progress.
Measuring Up
In the past three decades, economists have made great strides in using hard data to measure economic freedom—first for nations (1995), then for states (2002). The next logical step was focusing on the metropolitan areas that account for the lion’s share of the nation’s economic activity.
A few years ago, economist Dean Stansel adapted the well-tested methodology for measuring state-level economic freedom to U.S. metropolitan areas. Using a range of data, he focused on three broad areas—size of government, takings and discriminatory taxation, and labor-market freedom. The result is a single number that locates each
Orlando, Florida
“Transported forward in time to today’s more
urbanized world, Adam Smith would surely feel
compelled to make his inquiry about the nature
and causes of the wealth of cities.”
Miami, Florida

O’Neil Center 2014-15 Annual Report4
Metropolitan Statistical Area (MSA) on a spectrum between 0 for lowest economic freedom and 10 for highest economic freedom (see Box 1, page 6 ).
MSAs that score highly on the index will tend to have relatively low taxes, smaller government spending and public employment, less dependence on government transfers, pay rates largely driven by market forces, and below-average union membership. In short, these cities give markets more breathing space, letting businesses and individuals make the decisions that shape local economic activity. MSAs with low economic freedom scores will generally have higher taxes and greater government meddling in local economic affairs.
Stansel’s scores reveal the large gaps in economic freedom among U.S. metropolitan areas—from a high of 8.52 in Naples, Fla., to a low of 3.32 in El Centro, Calif. Wide disparities exist even within states—proof that local policies do matter. For example, Tyler in northeast Texas ranks as the nation’s 13th most economically free city, while Laredo in South Texas comes in at No. 299.
Seventeen of the 20 most free MSAs are in states with no income tax—Florida, New Hampshire, South Dakota, Tennessee and Texas. Fifteen of the least-free MSAs are in California and New York, two high-tax states.
MSAs are a hodge-podge. They include mammoth urban clusters with populations topping 20 million and places with as few as 55,000 people—by today’s standards, cities with small economic footprints. The big MSAs’ outsized contribution to the nation’s output and productivity makes it appropriate to look more closely at how they rate in economic freedom.
Moving to the CitiesNearly all Americans once lived on farms. Decade by decade, they left rural areas to seek better lives in cities (top ). As one generation after another joined the exodus, U.S. cities became larger, with nearly two-thirds of the population now living in the Top 100 metropolitan areas (bottom ).
EXH IB I T1
10%
0%
30%
20%
40%
60%
50%
70%
80%
100%
90%
1800 1830 1860 1890 1980 20101920 1950
Urban
Rural
81%
10%
0%
30%
20%
40%
60%
50%
70%
34.8%
41.1%42.7%
53.8%51.3%
65.3%
1950 2010 1950 2010 1950 2010
Largest 25 Largest 50 Largest 100
Percent of Population
Percent of Population

O’Neil Center 2014-15 Annual Report 5
Among the 30 largest MSAs, the top five places for economic freedom are in Texas and Florida, two states celebrated for keeping taxes low (see Exhibit 3 , page 7). The Tampa-St. Petersburg area on Florida’s Gulf Coast ranks first in economic freedom, joined by Miami at No. 4 and Orlando at No. 5.
The two other Top 5 MSAs are in Texas, with Houston ranking second and the Dallas-Fort Worth area following right behind at No. 3. San Antonio comes in just a few notches later at No. 8. The strong showing isn’t all that surprising because Texas leads in state-level economic freedom in the latest Economic Freedom of North America report.
New York, a city infamous for high taxes and heavy-handed bureaucrats, ranked as the nation’s least-free major MSA. Three of the bottom five cities are in California—Riverside, Los Angles and Sacramento. The poor showing for both Cleveland and Cincinnati suggests that Ohio may have a weak culture of economic freedom.
Economists measure economic freedom with a firm purpose in mind—to explore how much it matters for our well-being. The MSA economic freedom scores allow us to take this inquiry down to the city level.
Freedom’s Value
Decades of scholarship have linked high scores on national and state economic freedom to faster growth, higher incomes, lower poverty rates and improved overall economic performance. Greater economic freedom is also associated with lower infant mortality, higher literacy rates and, overall, more happiness and satisfaction.
Does economic freedom produce
Big ShouldersCities make workers more productive. Output per person is 53 percent higher in metropolitan areas than in the rural areas. The urban edge rises with population. For the largest 25 metropolitan areas, the productivity gap rises above 80 percent, a powerful testament to the gains from urbanization.
EXH IB I T2
1.45
1.40
1.55
1.50
1.60
1.70
1.65
1.80
1.53
All 381 MSAs
1.75
Output per Person:Urban Relative to Rural
Largest 100 MSAs Largest 50 MSAs Largest 25 MSAs
1.67
1.74
1.81
“Decades of scholarship have linked high scores
on national and state economic freedom to faster
growth, higher incomes, lower poverty rates and
improved overall economic performance.”
similar benefits for America’s MSAs? In his original study, Stansel looked at all MSAs and found greater economic freedom associated with higher per capita personal incomes and lower unemployment rates.
To focus on the bigger cities that are the primary engines of the U.S. economy, we limited our inquiry to the 100 largest MSAs—those with populations above 542,000. We divide these MSAs into five groups of 20,
arrayed from highest to lowest in economic freedom.
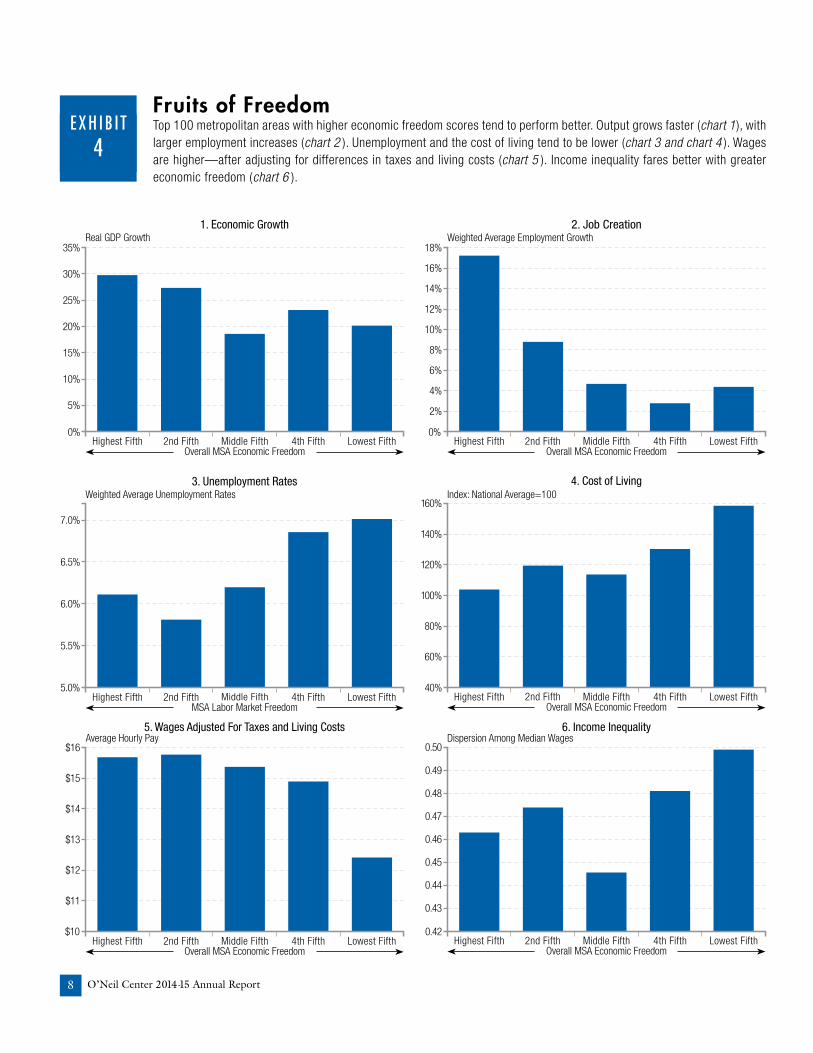
The freest MSAs saw their economies grow by an average of 30 percent from 2001 to 2013, after taking inflation into account (see Exhibit 4, chart 1, page 8). The next group expanded by nearly as much—27.5 percent. After that, average growth declines substantially as economic freedom wanes.
Turning to job creation, the variance among MSAs is stark. The freest 20

O’Neil Center 2014-15 Annual Report6
percent recorded average employment gains of 17 percent from 2001 to 2014 (chart 2). The rate of job creation fell by half for the second group, then nearly halved again for the MSAs with lower economic freedom scores.
What’s behind these numbers? Most likely, low tax burdens improve incentives for activities that contribute to growth and job creation—working, investing, building job skills, starting businesses. Relying on markets rather than regulation gives businesses ample room to expand and add to payrolls. Freer MSAs are also likely to be attractive to companies looking to relocate operations and jobs to more business-friendly environments.
Unemployment rates are lower in MSAs with greater labor-market freedom, averaging 6.1 percent for the most-free group and 5.8 percent for the second fifth (chart 3). Unemployment then rises steadily as economic freedom scores decline, reaching 7 percent for the least-free MSAs.
Faster job growth helps to lower unemployment, of course, but MSAs with freer labor markets shun high minimum wages, strong unions and other interventions that raise the cost of adding workers. State-level right-to-work laws are particularly important in restraining union power.
Despite its correlation with faster growth and more competition in the labor market, economic freedom doesn’t seem to drive up housing prices and everyday expenses. Quite the contrary, the average cost of living is nearly 35 percent lower in the most-free MSAs than in the least-free group, suggesting a link between economic freedom and higher living standards (chart 4 ).
Housing prices contribute heavily
Measuring city-level economic freedom presents some serious obstacles—for example, the availability of up-to-date data and the wide disparity from one place to another in government functions and structures. Dean Stansel began to take on these challenges in 2009. Three years later, the first economic-freedom index for America’s 380-plus metropolitan areas (MSAs) was ready for publication.
Stansel, a George Mason University PhD teaching atFlorida Gulf Coast University, created the MSA index by adapting the methodology of the Economic Freedom of North America report, a data-driven assessment of the balance between markets and government control in the continent’s states and provinces. In 2013, the Fraser Institute chose Stansel to be the primary author of the state-level report.
Like its state-level counterpart, the MSA index consists of three components that capture separate aspects of economic freedom:
Size of government: Public spending provides a rough approximation of a local economy’s division between government and the private sector. The component uses government consumption expenditures, transfers and subsidies, and spending on public pensions and unemployment compensation—all as a share of local personal income.
Takings and discriminatory taxation: The size of the local government’s bite tells how much taxes burden economic activity. The component’s four data points are total and indirect tax revenue and receipts from levies on income and sales—again, as a share of personal income.
Labor market freedom: To what extent do MSAs allow private sector employers and workers to negotiate the terms of employment, including pay rates? The component gets at this issue with the minimum wage as a share of local per capita income, government jobs as percent of total employment and the union membership rate.
Giving the three components equal weight, Stansel calculated a score for each MSA—from 0 for the least free to 10 for the most free.
The MSA rankings use data for 2002. That may seem dated; however, there’s no reason to believe that the biggest cities undergo regular reversals of their basic economic philosophies—i.e., New York won’t suddenly become like Houston or Dallas, and those two Texas cities won’t start taking their policy cues from Los Angeles.
Measuring Economic Freedom for Metropolitan Areas
BOX 1
Dean Stansel

O’Neil Center 2014-15 Annual Report 7
EXH IB I T3
5
6
7
8
4
Tampa
, FL
Housto
n, TX
Dallas, T
X
Miami, F
L
Orland
o, FL
Denver
, CO
Atlanta,
GA
St. Lo
uis, M
O
Phoen
ix, AZ
Las Ve
gas, N
V
Baltimore
, MD
Boston
, MA
Washing
ton, D
C
Kansa
s City,
MO
Pittsb
urgh,
PA
Philad
elphia
, PA
Chicag
o, IL
San F
rancis
co, CA
San D
iego, C
A
Minneap
olis, M
N
Portla
nd, O
R
Detroit,
MI
Seatt
le, WA
Cincinn
ati, OH
Sacra
mento,
CA
Los Ang
eles, C
A
Clevela
nd, O
H
Riversid
e, CA
New Yo
rk, NY
San A
ntonio
, TX
MSA Economic Freedom Score
Let Freedom RingMeasured on a scale of 1 to 10, economic freedom scores vary considerably among the 30 largest U.S. metropolitan areas. Many of the places with high economic freedom scores are in the Southeast, Texas and the Mountain West states. Cities in the Midwest and on the East and West Coasts, particularly in California, tend to have lower economic freedom scores.
MSAs in the Top 30
1. New York-Northern New Jersey-Long Island, NY-NJ-PA 20,092,883
2. Los Angeles-Long Beach-Anaheim-Santa Ana, CA 13,262,220
3. Chicago-Naperville-Joliet-Elgin, IL-IN-WI 9,554,598
4. Dallas-Fort Worth-Arlington, TX 6,954,330
5. Philadelphia-Camden-Wilmington, PA-NJ-DE-MD 6,490,180
6. Houston-The Woodlands-Sugar Land-Baytown, TX 6,051,170
7. Washington-Arlington-Alexandria, DC-VA-MD-WV 6,033,737
8. Miami-Fort Lauderdale-West Palm Beach-Pompano Beach, FL 5,929,819
9. Atlanta-Sandy Springs-Roswell-Marietta, GA 5,614,323
10. Boston-Cambridge-Quincy-Newton, MA-NH 4,732,161
11. San Francisco-Oakland-Fremont-Hayward, CA 4,594,060
12. Detroit-Warren-Livonia-Dearborn, MI 4,489,109
13. Riverside-San Bernardino-Ontario, CA 4,441,890
14. Phoenix-Mesa-Scottsdale, AZ 4,296,611
15. Seattle-Tacoma-Bellevue, WA 3,671,478
2014Population
16. Minneapolis-St. Paul-Bloomington, MN-WI 3,495,176
17. San Diego-Carlsbad-San Marcos, CA 3,263,431
18. St. Louis, MO-IL 2,915,582
19. Tampa-St. Petersburg-Clearwater, FL 2,806,207
20. Baltimore-Columbia-Towson, MD 2,785,874
21. Denver-Aurora-Broomfield-Lakewood, CO 2,754,258
22. Pittsburgh, PA 2,355,968
23. Portland-Vancouver-Beaverton-Hillsboro, OR-WA 2,348,247
24. San Antonio-New Braunfels, TX 2,328,652
25. Orlando-Kissimmee-Sanford, FL 2,321,418
26. Sacramento-Arden-Arcade-Roseville, CA 2,244,397
27. Cincinnati-Middleton, OH-KY-IN 2,149,449
28. Kansas City, MO-KS 2,071,133
29. Las Vegas-Henderson-Paradise, NV 2,069,681
30. Cleveland-Elyria-Mentor, OH 2,063,598
2014PopulationMetropolitan Statistical Area Metropolitan Statistical Area
O’Neil Center 2014-15 Annual Report8
Fruits of FreedomTop 100 metropolitan areas with higher economic freedom scores tend to perform better. Output grows faster (chart 1 ), with larger employment increases (chart 2 ). Unemployment and the cost of living tend to be lower (chart 3 and chart 4 ). Wages are higher—after adjusting for differences in taxes and living costs (chart 5 ). Income inequality fares better with greater economic freedom (chart 6 ).
5%
0%
15%
10%
20%
30%
25%
Highest Fifth
35%Real GDP Growth
2nd Fifth Middle Fifth 4th Fifth Lowest FifthOverall MSA Economic Freedom
1. Economic Growth
5.5%
5.0%
6.5%
6.0%
7.0%
Weighted Average Unemployment Rates
Highest Fifth 2nd Fifth Middle Fifth 4th Fifth Lowest FifthMSA Labor Market Freedom
3. Unemployment Rates
6%
0%
10%
8%
12%
16%
14%
Highest Fifth
18%Weighted Average Employment Growth
4%
2%
Middle Fifth 4th Fifth Lowest FifthOverall MSA Economic Freedom
2. Job Creation
2nd Fifth
140%
100%
40%
120%
Highest Fifth
160%Index: National Average=100
80%
60%
Middle Fifth 4th Fifth Lowest FifthOverall MSA Economic Freedom
4. Cost of Living
2nd Fifth
$10
$16
Highest Fifth 2nd Fifth Middle Fifth 4th Fifth Lowest FifthOverall MSA Economic Freedom
$15
$14
$13
$12
$11
5. Wages Adjusted For Taxes and Living Costs
0.42Highest Fifth
0.50Dispersion Among Median Wages
Middle Fifth 4th Fifth Lowest FifthOverall MSA Economic Freedom
0.48
0.46
0.49
0.47
0.45
0.43
0.44
6. Income Inequality
2nd Fifth
EXH IB I T4
Average Hourly Pay

O’Neil Center 2014-15 Annual Report 9
to variances of living costs. MSAs with greater economic freedom impose fewer impediments to new housing, so supply increases blunt upward pressure on prices. The same applies to other markets—less government meddling and greater competition help keep prices low.
The combination of low taxes and living costs makes paychecks go further. Wage rates are often quite high in places with low economic freedom, such as New York and Los Angeles. After adjusting for differences in taxes and living costs, however, average hourly wages are nearly $16 in the 40 percent of MSAs with the highest economic freedom (chart 5 ). Adjusted pay in the least-free group falls to $12.40.
The less-constrained capitalism of the freest cities doesn’t widen the gap between rich and poor. Income inequality, measured by wage dispersion, is lowest for the middle 20 percent, but the most-free group exhibits significantly less inequality than the least-free one (chart 6 ).
What’s going on? Equality may increase as lower living costs attract middle-class families to MSAs with high
economic freedom. In the least-free MSAs, inequality may increase as the middle class leaves, poor households stay put because of generous public assistance, and wealthy families hang on because they think the good life in their city is worth the high taxes and other burdens.
Packing Up and Moving
Pursuing economic freedom closer to home, Americans stand to gain faster economic growth, rapid job creation, lower unemployment, higher living standards and greater equality. Hoping New York or Los Angeles will change policies seems quixotic, but migrating from less-free to more-free MSAs could allow many more Americans to reap the benefits of economic freedom.
The idea that it’s sometimes better to move than fight City Hall has a respectable intellectual pedigree. In the 1950s, economist Charles Tiebout
observed that people frustrated by high taxes and big government have the option of packing up and heading to another place with policies more to their liking—in effect, voting with their feet. History tells us that Americans are a highly mobile people, more than willing to pull up stakes to make themselves better off.
Border controls constrain the Tiebout effect for nations, but free movement within the United States makes migration particularly effective in redressing grievances in our states and cities. The MSA economic freedom scores indicate that millions of Americans live in places with relatively low economic freedom, suggesting plenty of potential options for migrating toward the light of economic freedom.
Using tax returns, the Internal Revenue Service compiles annual data that track the migration of people around the United States. From 1992
“Migrating from less-free to more-free MSAs could
allow many more Americans to reap the benefits
of economic freedom.”
Naples, Florida Atlanta, Georgia

O’Neil Center 2014-15 Annual Report10
to 2011, we find that Atlanta, one of the Top 10 freest MSAs, led all major metropolitan areas with cumulative net in-migration totaling nearly 1.7 million—a gain equivalent to hauling the entire Nashville metropolitan area down into North Georgia over two decades (see Exhibit 5).
Other big MSAs with Top 10 economic freedom scores had high levels of net in-migration. Phoenix added 1.4 million newcomers. The Dallas-Fort Worth area welcomed more than 1.1 million. Tampa, Houston and Orlando had healthy gains. Relatively unfree Riverside
confounds as the only anomaly, but many of its newcomers probably arrived from nearby Los Angeles.
Turning to out-migration, two economic freedom-challenged MSAs stand out—Los Angeles and New York. Between 1992 and 2011, both endured cumulative net losses of around 4.1 million residents—more than enough people to fill the Seattle metropolitan area. Chicago had net out-migration of nearly 1.3 million.
The correlation between economic freedom and net migration becomes clearer when we broaden the inquiry to the 100 largest MSAs. The most-free
20 percent attracted nearly 9 million new residents, while the loss for the least-free group totaled more than 7.1 million (see Exhibit 6). If we calculate net migration as a percent of population, the freest group posts a gain of almost 24 percent, compared with a loss of 14 percent for the least-free quintile.
Interestingly, net migration shows an unexpected negative correlation with the cultural and recreational attractions that many believe make city life more interesting and attractive. People obviously like urban amenities, so this result presents a paradox that will take some ingenuity to resolve (see
Comings and GoingsFrom 1992 to 2011, Atlanta, Phoenix, Riverside, Dallas and Las Vegas led America’s 50 largest metropolitan areas in net in-migration, each with a gain of more than 1 million transplants. New York and Los Angeles saw the greatest out-migration, both losing more than 4 million residents. Most of the gainers rank high in economic freedom; the losers’ scores are generally lower.
EXH IB I T5
200,000
0
600,000
400,000
800,000
1,200,000
1,000,000
1,400,000
1,600,000
1,800,000
Atlan
ta
Phoe
nix
Rivers
ideDalla
s
Las V
egas
Tampa
Hous
ton
Charl
otte
Austin
Orland
o
-4,000,000
-3,000,000
-3,500,000
-2,500,000
-1,500,000
-2,000,000
-1,000,000
-500,000
0New
Orlean
s
Clevel
and
San D
iego
Bosto
nSa
n Jose
Detroit
San F
rancis
co
Chica
go
New Yo
rk
Los A
ngele
s
-4,500,000
Population Losers
Population Gainers

O’Neil Center 2014-15 Annual Report 11
Box 2, pages 12-13 ). The most logical answer—the toll of high taxes and other interventions—has important implications for economic freedom in America’s MSAs.
The migration data suggest that Americans are moving toward economic freedom and its benefits—the direct ones like lower taxes and the indirect ones like faster job growth. These findings should alert us to the folly of traditional dogmas that have saddled so many cities with high taxes and kept their citizens under the thumb of City Halls that think they know best.
City Hall’s Heavy Hand
Stansel developed the MSA index only a few years ago, and it doesn’t have enough data to assess whether economic freedom has been gaining or losing ground in America’s cities. A look at policies around the country, however, suggests that local governments routinely use their powers to abrogate their citizens’ economic freedom.
Taxes are probably the most common way cities erode economic freedom. Local authorities tax property, retail sales, utility payments and, in some jurisdictions, income. According to the Tax Foundation, local tax burdens have been rising—from 4 percent in the 1950s to nearly 7 percent today. Taxes beget spending—as sure as night follows day. The Tax Foundation reports that local governments’ per capita spending rose from 6 percent of GDP in the 1950s to more than 10 percent in this decade.
Higher government spending means that more resources will be allocated by political rather than market processes. Taxes pay for city services and public
Voting with Our FeetDividing the 100 largest U.S. metropolitan areas into five groups shows that the economically freest had the largest net in-migration from 1992 to 2011. Migrants left the least-free 40 percent. The pattern holds for both total migration (top ) and migration as a percentage of population (bottom ).
-5%
15%
20%
30%
0%
10%
5%
-10%
-15%
-20%
Most Free Second Freest Middle
Fourth Freest Least Free
Net Migration, 1992-2011 as a Percent of the 2002 Population
Overall MSA Economic FreedomOverall MSA Economic Freedom
25%
-2,000,000
6,000,000
8,000,000
10,000,000
0
4,000,000
2,000,000
-4,000,000
-6,000,000
-8,000,000
Most Free Second Freest Middle
Fourth Freest Least Free
Net Migration, 1992-2011
Overall MSA Economic FreedomOverall MSA Economic Freedom
EXH IB I T6
Continued on page 14
goods, such as roads and sewers, but they may also fund ever-larger redistribution schemes, cronyism or pet public projects that may not be justified on purely economic grounds.
Land-use regulations have become a staple of city government. Zoning
codes and boards place restrictions on how owners use their property. Rules specify the height and density of buildings, their exterior appearance, the number of parking spaces and much more. Owners run a gauntlet of

O’Neil Center 2014-15 Annual Report12
2 4 6 8 10
New York, NY
Los Angeles, CA
Chicago, IL
Boston, MA
Miami, FL
San Francisco, CA
Philadelphia, PA
Dallas, TX
Seattle, WA
Washington, DC
Pittsburgh, PA
Houston, TX
Minneapolis, MN
Tampa, FL
San Diego, CA
Atlanta, GA
St. Louis, MO
Phoenix, AZ
Denver, CO
Baltimore, MD
Detroit, MI
Portland, OR
Riverside, CA
San Antonio, TX
Sacramento, CA
0
Amenities Index
As populations grow and incomes rise, urban areas can support a greater variety of attractions and entertainments to offset the concrete, congestion and crowding that makes city life a daily grind. Amenities make cities more interesting places to live, so metropolitan areas with a lot of them would seem to have an advantage in attracting new residents.
Because they’re so diverse, amenities are hard to measure with any precision, but we took a stab
at it by compiling a data base of 18 types of amenities—from museums and bars and restaurants to big-league sports teams, nearby mountains and beaches (see list, below). There’s room for nitpicking about any of the 18 categories; taken together, however, they fairly represent what most people mean when talking about the drawing power of urban amenities.
To facilitate comparisons, we scored each metropolitan area’s amenities on a scale of 1 (least) to 10 (most) and
combined them into a single number, weighted 75 percent for total amenities and 25 percent on a per capita basis.
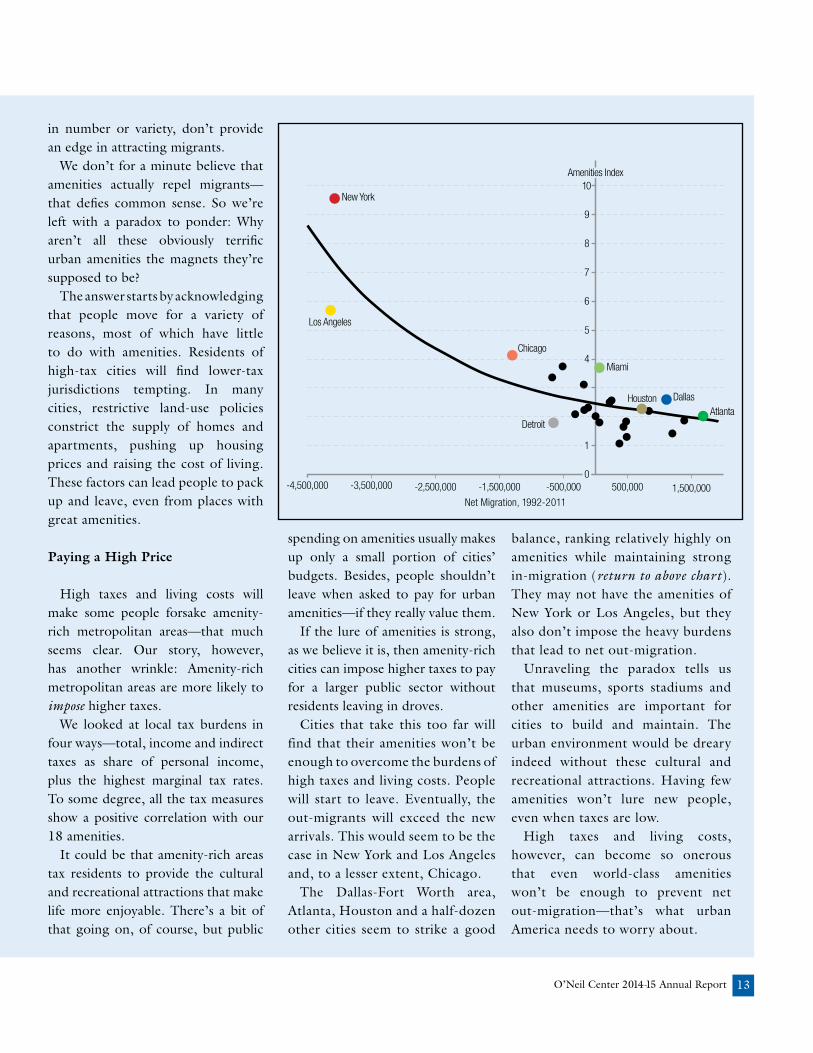
Among the 100 largest metropolitan areas, New York ranked highest in amenities—by no means a surprise. When it comes to fun and games, the Big Apple has a substantial edge over the cities that follow—Los Angeles, Chicago, Boston, Miami and San Francisco. The Dallas-Fort Worth area came in a respectable eighth—the highest of any city without convenient access to beaches (see chart, left).
Many Reasons to Move
Are Americans beating a path to the amenity-rich metros? To find out, we used annual Internal Revenue Service data that track the movement of taxpayers from one year to the next. The numbers allowed us to calculate annual net migration for each of today’s Top 100 metropolitan areas from 1992 to 2011.
The results surprised us by showing a negative relationship between amenities and net migration (downward sloping line, right chart). New York and Los Angeles, the nation’s two most amenity-rich metros, have each seen net out-migration of around 4.1 million residents. Looking at the 18 amenities one at a time, all except access to nearby mountains showed a negative correlation to net migration.
People enjoy the amenities that cities offer. Yet, more amenities, either
The Paradox of Amenities
BOX 1BOX 2
Selected Urban Amenities
Access to beaches
Access to mountains
Amusement and theme parks
Dance companies
Drinking places (bars)
Fitness and recreation centers
Full-service restaurants
Golf courses and country clubs
Historical sites
Hotels and motels
Marinas
Museums
Musical groups and artists (venues)
Professional sports teams
Racetracks, horse and car
Sports teams and clubs
Theater companies and dinner theaters
Zoos and botanical gardens
O’Neil Center 2014-15 Annual Report 13
1
5
7
6
9
10
4
8
0
New York
Amenities Index
Los Angeles
Chicago
Miami
Houston Dallas
DetroitAtlanta
-4,500,000 -3,500,000 -2,500,000 -1,500,000 -500,000 500,000 1,500,000Net Migration, 1992-2011
in number or variety, don’t provide an edge in attracting migrants.
We don’t for a minute believe that amenities actually repel migrants—that defies common sense. So we’re left with a paradox to ponder: Why aren’t all these obviously terrific urban amenities the magnets they’re supposed to be?
The answer starts by acknowledging that people move for a variety of reasons, most of which have little to do with amenities. Residents of high-tax cities will find lower-tax jurisdictions tempting. In many cities, restrictive land-use policies constrict the supply of homes and apartments, pushing up housing prices and raising the cost of living. These factors can lead people to pack up and leave, even from places with great amenities.
Paying a High Price
High taxes and living costs will make some people forsake amenity-rich metropolitan areas—that much seems clear. Our story, however, has another wrinkle: Amenity-rich metropolitan areas are more likely to impose higher taxes.
We looked at local tax burdens in four ways—total, income and indirect taxes as share of personal income, plus the highest marginal tax rates. To some degree, all the tax measures show a positive correlation with our 18 amenities.
It could be that amenity-rich areas tax residents to provide the cultural and recreational attractions that make life more enjoyable. There’s a bit of that going on, of course, but public
spending on amenities usually makes up only a small portion of cities’ budgets. Besides, people shouldn’t leave when asked to pay for urban amenities—if they really value them.
If the lure of amenities is strong, as we believe it is, then amenity-rich cities can impose higher taxes to pay for a larger public sector without residents leaving in droves.
Cities that take this too far will find that their amenities won’t be enough to overcome the burdens of high taxes and living costs. People will start to leave. Eventually, the out-migrants will exceed the new arrivals. This would seem to be the case in New York and Los Angeles and, to a lesser extent, Chicago.
The Dallas-Fort Worth area, Atlanta, Houston and a half-dozen other cities seem to strike a good
balance, ranking relatively highly on amenities while maintaining strong in-migration (return to above chart). They may not have the amenities of New York or Los Angeles, but they also don’t impose the heavy burdens that lead to net out-migration.
Unraveling the paradox tells us that museums, sports stadiums and other amenities are important for cities to build and maintain. The urban environment would be dreary indeed without these cultural and recreational attractions. Having few amenities won’t lure new people, even when taxes are low.
High taxes and living costs, however, can become so onerous that even world-class amenities won’t be enough to prevent net out-migration—that’s what urban America needs to worry about.

O’Neil Center 2014-15 Annual Report14
permits and inspections. At its worst, this regulatory activism raises costs, subverts real estate values and stifles development.
Local governments trifle with property rights, invoking the power of eminent domain to seize private property, sometimes for legitimate public purposes and sometimes for the benefit of real-estate developers and the owners of professional sports teams.
Economic freedom rests on businesses and their customers deciding the prices, products and service quality that suits them. In many parts of the country, cities haven’t been shy about replacing the diversity of the marketplace with the conformity of government control. Rent controls prescribe how much landlords can charge their tenants for apartments. In recent years, hundreds of cities decided shoppers shouldn’t be able to carry their groceries home in free plastic bags. New York City tells its restaurants how to prepare their
food—no trans fats! Most cities dictate who can drive
a cab or operate a hotel. These restrictions are common, and few people paid much attention to them until new technologies upset the status quo. Uber, which turns private cars into taxis, and Airbnb, which turns private homes into hotels, used the Internet to create new markets where buyers and sellers could find each other and set prices outside the existing regulatory structure. Some cities welcomed the new businesses; others responded by trying to regulate or even outlaw them.
A growing number of city governments refuse to let market forces determine pay scales for low-skilled workers, moving the forefront of efforts to raise minimum wages above the federally mandated $7.25 an hour. Over the next few years, minimums will rise to $15 an hour in San Francisco, Los Angeles and Seattle,
$13 in Chicago and Kansas City, and $12.25 in Los Angeles and Oakland.
This drift toward ever-larger local government has been thwarted only occasionally. New York failed to impose portion controls on sugary sodas. Dallas revoked its fee on plastic grocery bags. A few miles north of Dallas, Denton’s attempt to ban oil companies from hydraulic fracturing, or “fracking,” within the city limits ran afoul of state authorities.
Local interventions are often necessary for health and safety or other reasons. Many of them, however, merely serve to subsidize vested interests or block competition. These policies often raise costs, discourage new enterprises and reduce businesses’ ability to compete. Attempts to control economic activity often command broad support, but popularity doesn’t keep these policies from compromising economic freedom or preventing cities from reaching their full potential as engines of prosperity.
High Time for Freedom
America’s freest MSAs, especially the Texas twosome of Dallas-Fort Worth
Denver, Colorado San Antonio, Texas
“Local economic freedom will be key to reviving
a U.S. economy that’s been underperforming for
most of the past two decades.”

O’Neil Center 2014-15 Annual Report 15
Many Americans fuss about government’s burden on the economy, but many other parts of the world suffer far worse afflictions from taxes, regulation, corruption, insecurity and poor governance. For some countries in Asia, the Middle East, Latin America and Africa, the biggest obstacle to freer cities turns out to be the inept national government itself.
Ineffective legal institutions, for example, are a big reason poor countries remain poor. It takes a lot of time and money to enforce contracts in many Third World legal systems—four years or more in places like India, Bangladesh, Guatemala and Afghanistan.
The non-profit Free Cities Institute sees a way out. The idea starts with giving up the hope of reforming a broken-down political economy that stifles economic progress. Instead, citizens charter new self-governing enclaves that operate under world-class law, governance and security, most of it modeled on the experience of successful countries.
The idea might not be all that far-fetched. Free-trade zones get around local laws that impede imports and exports, letting goods enter and exit a defined area without tariffs or other restraints.
Look what mandating free trade did for a swath of farmland just north of Hong Kong. In 35 years, fueled by foreign investment and exports, Shenzhen grew into a city of 10.6 million, with its own stock exchange, towering skyscrapers and thousands of factories selling their output to the world.
Over on the Persian Gulf, Dubai has emerged as the Middle East’s most important business city. To overcome the shortcomings of local governance, Dubai imported British law and barristers, giving global businesses the confidence to invest and relocate to this ultramodern city of 2.1 million.
The way to get freer and more prosperous cities in many parts of the world may be to start from scratch, using ideas that have worked in different times and places.
BOX 1BOX 3
Free The World
and Houston, have emerged as the nation’s most vibrant local economies. Other U.S. cities should emulate them because the 21st Century will belong to the freest cities.
Local economic freedom will be key to reviving a U.S. economy that’s been underperforming for most of the past two decades. Detroit and other cities that have fallen on hard times can turn to economic freedom to resuscitate their fortunes. Freer metropolitan area economies will stride into today’s rapidly globalizing economy with greater creativity and confidence, forging productive connections with the world’s freest and most open cities.
In contemplating the wealth of cities, we’ve focused on the United States.
But the rest of the world is taking the same path we did, transitioning from agriculture to industry and services, migrating from the countryside to the cities. Global urbanization has been particularly rapid in the past five or six decades. Within the past 10 years, the world as a whole reached the point where half its population lives in cities, a milestone the United States achieved in the 1920s.
Economic freedom brought rapid development and globalization to Dubai and Shenzhen in China (see Box 3). Like their counterparts in the United States, foreign cities that embrace economic freedom are doing better than those that rely on government control. Unfortunately, economists have yet to devise a worldwide city-level economic
freedom index to prove it.We do have the American experience,
which demonstrates the link between economic freedom and prosperity. The wealth of cities isn’t merely a matter of office buildings, factories, transportation networks, shopping centers and physical infrastructure. The most successful cities arise from strong, free economic systems that let markets work their magic, allowing us to get the most out of the natural human capacity for creativity and cooperation.
W. Michael Cox is founding director of the William J. O’Neil Center for Global Markets and Freedom ([email protected]). Richard Alm is writer in residence at the center ([email protected]).

O’Neil Center 2014-15 Annual Report16
Notes and Data Sources
Page 2:Edward Glaeser, Triumph of the City: How Our Greatest Invention Makes Us Richer, Smarter, Greener, Healthier and Happier, The Penguin Press, 2011.
Exhibit 1:Moving to the CitiesU.S. Census Bureau. Available at census.gov.
Exhibit 2:Cities’ Big ShouldersU.S. Department of Commerce, Bureau of Economic Analysis. Available at bea.gov. See also source for Exhibit 1, Moving to the Cities. Data are for 2013.
Exhibit 3:Let Freedom RingStansel, Dean. “An Economic Freedom Index for U.S. Metropolitan Areas,” Journal of Regional Analysis and Policy, 43, 1 (2013), 3-20. Stansel, Dean, Torra, Jose, and McMahon, Fred. Economic Freedom of North America 2014, Vancouver: Fraser Institute, December 2014.
Exhibit 4:Fruits of FreedomThe six graphs in this exhibit use Stansel’s economic freedom index for U.S. metropolitan areas. See sources for Exhibit 3, Let Freedom Ring. For the sources below, data limitations led to the use of slightly different time periods in the six charts in Exhibit 4.
Economic Growth:U.S. Department of Commerce, Bureau of Economic Analysis. Available at bea.gov. Data are for 2001-13. Job Creation:U.S. Department of Labor, Bureau of Labor Statistics. Data are for 2001-14.
Unemployment Rates;U.S. Department of Labor, Bureau of Labor Statistics. Data are averages for 2005-15.
Cost of Living: C2ER, The Council for Community and Economic Research. Available at coli.org. Infoplease. Cost of Living Index for Selected U.S. Cities. Available at infoplease.com. City-Data. Available at city-data.com. Data are for 2010.
Wages Adjusted for Taxes and Living Costs:U.S. Department of Labor, Bureau of Labor Statistics. Available at bls.gov. Tax Foundation. Available at taxfoundation.org. “City Income Taxes: U.S. Cities that Levy Income Taxes,” About.com. Available at taxes.about.com. “Local Income Tax Rates by Jurisdiction,” Scribd. Available at scribd.com. See also sources for Exhibit 4, Cost of Living. Data are averages for 2005-15.
Income Inequality: U.S. Department of Labor, Bureau of Labor Statistics. Note: Inequality is calculated as a population-weighted average of the percent gap between median hourly wages and wages at the 10th, 25th, 75th and 90th percentiles. Data are for 2014.
Exhibit 5:Comings and GoingsInternal Revenue Service, SOI Tax Stats—County-to-County Migration database files. See also sources for Exhibit 3, Let Freedom Ring.
Exhibit 6:Economic Freedom and MigrationInternal Revenue Service, SOI Tax Stats—County-to-County Migration database files. See also sources for Exhibit 3, Let Freedom Ring.
Box 1:Measuring Economic Freedom for Metropolitan AreasSee sources for Exhibit 3, Let Freedom Ring.
Box 2:The Paradox of AmenitiesCounty Business Patterns, U.S. Census Bureau. Available at census.gov. American FactFinder. Available at factfinder.census.gov.city. City-Data. Available at city-data.com.
Note: The charts in Exhibit 4 and Exhibit 6 illustrate strong correlation but do not prove causality.

O’Neil Center 2014-15 Annual Report 17
Editor’s note: The O’Neil Center is switching its annual report from a calendar year to the SMU academic year, which runs from June 1 through May 31. To avoid a gap, this report also reviews events from January to May of 2014.
As the 2014-15 academic year came to a close, SMU Cox Dean Al Niemi announced that Robert Lawson would become the new director of the William J. O’Neil Center for Global Markets and Freedom. Lawson, who joined the O’Neil Center in 2012, replaced founding director W. Michael Cox, who will continue as an integral part of the O’Neil Center as he returns to his research and teaching.
“The O’Neil Center’s mission will not change,” Lawson said. “Our programs will evolve, and we’ll be doing some new things, but our focus will remain on research and teaching, looking at why some economies prosper and others don’t.” (For more, see the conversation on Page 18.)
The 18 months covered in this review saw several highlights—an annual report essay looking at economic freedom as a form of capital, a conference focused on migration as a path to a better life, an update on the Economic Freedom of the World (EFW) report and a PBS documentary built of the EFW work of Lawson and his colleagues (For more on the movie, see inside back cover).
The center received a vote of confidence in the form of significant new financial support from a number of donors—the O’Neil family, the Charles G. Koch Charitable Foundation, the Dallas-based William E. Armentrout
Foundation and Fort Worth business-man W. Grady Rosier.
In January 2014, the center added research associate Ryan Murphy, who earned his doctorate in economics at Boston’s Suffolk University in 2013. Murphy will work with Lawson on measuring economic freedom. In addition to Lawson, Cox and Murphy, the O’Neil Center staff at the end of the 2014-15 academic year included Dean Niemi, professor Michael Davis and writer in residence Richard Alm.
After four decades as a leading free-market scholar, Dwight R. Lee retired in May 2014. In another departure, Youth Initiative manager Kathryn Shelton gave birth to her first child, a girl, in July 2014 and left the center.
Lee was the center’s first hire in 2008. In retirement, he will continue his affiliation with the O’Neil Center as scholar in residence. He will use his O’Neil Center affiliation in his writings and other professional activities.
About three dozen colleagues and collaborators from across the country gathered at SMU to honor Lee’s contributions to the profession. Richard McKenzie, a long-time collaborator, compiled a booklet of Dwightisms—Lee’s oddly logical and self-deprecating pronouncements. One example: “Speaking of opportunity cost, mine is so low that my economic rent from my job is greater than my salary.”
In early 2014, the O’Neil Center published its fifth annual report,
2014-15: Year in Reviewhighlighted by the essay “Living Above Our Means,” written by Cox and Alm. It
takes an innovative look at economic freedom, seeing it as a form of capital stock that takes a long time to build and depreciates if not properly maintained.
The essay finds economic freedom essential to building each nation’s capital stock, which in turn
becomes a key factor in the gap between rich and poor countries. About 90 countries are living below their means and can look forward to rising consumption in the future. With its recent declines in economic freedom, the United States is one of just four countries living above their means. They can expect to face difficulties in maintaining current levels of consumption.
In September 2014, Lawson and his co-authors released the latest EFW report. First published in 1995, the EFW provides an empirical measure of economic freedom in 152 countries, based on the size of government, legal system and property rights, sound money, freedom to trade internationally, and the regulatory burden.
According to the latest EFW, the most economically free places are Hong Kong, Singapore, New Zealand, Switzerland and Mauritius. For the United States, the report pointed to a slight improvement in its economic freedom reading—from 14th to 12th in the world. The country’s EFW ranking had been falling since 2000, when the country ranked second in the world.
Continued on page 19

O’Neil Center 2014-15 Annual Report18
The two economists had forged a partnership of sorts from afar. Bob Lawson admired the series of free-market annual report essays Mike Cox produced while serving as the Federal Reserve Bank of Dallas’ first and only chief economist. Cox found Lawson’s work on measuring economic freedom a powerful research tool, using it in several of those annual reports.
When Cox left the Dallas Fed to take on the job of the O’Neil Center’s founding director in 2008, he set his sights on bringing Lawson’s expertise on economic freedom to SMU. Three years later, Lawson joined the O’Neil Center as the Jerome M. Fullinwider Endowed Centennial Chair in Economic Freedom. In the past year or so, Cox often referred to Lawson as his heir apparent as director.
The time has come. At the start of the 2015-16 academic year, Lawson replaced Cox as the O’Neil Center’s director. Both say that the O’Neil Center’s mission will stay the same—to study why some economies prosper and others fail.
In the following conversation, Cox and Lawson share their thoughts about the transition:
Q: Dr. Cox, what will you be doing now?A: I’m not going anywhere. I’m just going back to what I
love to do—teaching and research, and I will remain an active and engaged member of the O’Neil Center, working with Bob to make this an effective organization. I’ll continue to co-author the center’s annual report essays and direct such projects as our annual conference. And I will take on an exciting new job—leading a research project focused on the economies of Texas and its major cities.
Q: Dr. Lawson, what’s your vision for the O’Neil Center?A: I see our core strengths as being in two areas. First, we do
fundamental academic research related to the Economic Freedom of the World and Economic Freedom of North America indexes. This takes the form of journal articles, book chapters, books, reports—that sort of thing. Second, we are economic educators. We teach economic principles to our students in classrooms, to the entire campus through invited speakers and debates, and to the wider community through our annual conference, annual report essays and media efforts.
Q: And, Dr. Lawson, what about existing O’Neil Center programs and—if it’s not too early to ask—new ones?
A: My favorite existing program is our McLane Scholars Reading Group, which brings 12 undergraduates together once
a week to discuss classic and contemporary texts in political economy. This program is being run in conjunction with parallel groups at Texas Tech, Baylor and Central Arkansas. I want to find funding to expand this program so that we are running two or three or even four concurrent reading groups each semester.
We’re also excited about a new program to teach basic economic principles to high school teachers, who in turn will teach the lessons to their students. This program will meet the state’s mandates for teaching economics with emphasis on the free enterprise system and its benefits. We’re running pilotprograms in Dallas and Houston in February and, if all goes well, we hope to expand the program all over the state.
Q: Dr. Cox, any final thoughts as you look back on your years as director?
A: We started from scratch in 2008 and accomplished great things in six years. The time is right for new leadership. We have never been stronger, with a highly dedicated staff, a clear mission and a large and growing circle of supporters, both at SMU and in the business community. We’ve just received several large donations. This transition will provide a jolt of new energy that will propel us toward our goal of building a first-rate research organization in America’s most free-market state.
A Conversation with Bob Lawson and Mike Cox
Under New Director, Mission Will Stay the Same
Lawson (left) and Cox

O’Neil Center 2014-15 Annual Report 19
With a grant from Capital One, the O’Neil Center started a reading group in the spring semester of 2014, introducing some of the brightest SMU undergraduate students to the literature of free markets and economic liberty.
The dozen participants didn’t get course credit; instead, they received a $1,000 stipend. Each week, they met with O’Neil Center faculty and guest discussion leaders for an hour-long session focused on the weekly readings, many of them collected in David Boaz’s The Libertarian Reader.
The student reading group had no funding for the fall semester of 2014. With the gift from Rosier, president of food-distributor McLane Co., the O’Neil Center was able to revive the reading group in the spring semester of 2015, with a dozen McLane Scholars. The readings included works by Adam Smith, Malthus, Hayek, Marx, Schumpeter, Mises, Hayek, and Keynes—plus such contemporary authors as Hernando De Soto and Peter Boettke.
“The reading group opened my mind,” said Michael O’Gara, a sophomore from Phoenix. “My fellow students talked freely, giving some interesting insights. We ended up on topics not covered in any of my classes.”
Parallel reading groups at Texas Tech and Baylor, also funded by Rosier, read the same materials, and all three groups gathered on the Tech campus in Lubbock for a weekend of in-depth discussion and activities in March. Rosier’s commitment allowed the reading group to continue in the fall semester of 2015, with the multi-school gathering scheduled to take place at SMU.
The Armentrout gift allowed the
O’Neil Center to pay a stipend for students to work on meaningful research projects. Armentrout Fellows, created through SMU Cox’s Albert W. Niemi Center for American Capitalism, worked on two O’Neil Center research projects.
Alm had an MBA student dedicated to his “Evolution of the Texas Economy” project, an analysis of the historical developments that made Texas the nation’s top-ranked state in economic freedom. Another MBA student assisted Cox in creating an extensive database that will help measure the role airports play in metropolitan areas’ prosperity.
Speakers on Campus
In September 2014, the O’Neil Center hosted its sixth annual conference. More than 200 business leaders and students gathered at SMU’s James M. Collins Executive Education Center to explore “The Road to Freedom: Migration and the Search for a Better Life.” Speakers offered a cool-headed look at a hot-button issue, examining how people exercise their freedom to move about and the policies that constrain their mobility.
In the opening presentation, titled “Travel Visa Restrictions and Tourism,” Lawson presented his research on the cost of the most common restriction on international travel, reporting that bilateral visa requirements reduce inbound traffic by 70 percent.
“The sad reality is that it’s easier for a crate of bananas to cross the border into the United States than a human being,” Lawson said.
Eliminating these burdens would produce large economic gains—for just the United States, at least 45 million
more visitors, spending an estimated $90 billion or more. “We’re losing out on these opportunities,” Lawson said.
Other speakers and their presentations included:
Alex Nowrasteh, Cato Institute: Complex and cumbersome, the current immigration system begs for reform that tackles three main issues—the undocumented immigrants already here, the porous U.S. borders and laws that make legal immigration so difficult.
“Unlawful immigration is caused primarily by the large economic gains from migrating but no legal way of doing so,” Nowrasteh said. “Addressing those problems is the No. 1 priority.”
According to Nowrasteh, immigration reform has been stalled for at least a decade—true for comprehensive proposals that deal with the three issues at the same time, true for piecemeal proposals that address them sequentially. The great hope was a comprehensive bill proposed
Alex Nowrasteh

O’Neil Center 2014-15 Annual Report20
in 2013, which died in the House of Representatives under the intense heat of populist pressures.
Nowrasteh urged positive messages that support greater immigration—inspiring stories of newcomers’ achievements, appeals to traditional American values. “When immigration is in the news, it’s almost always for bad reasons. It’s always when it’s a crisis, when it’s a problem,” he said. “It’s almost never in the news when it’s a good thing.”
Richard Vedder, professor at Ohio University: Immigration brings great benefits to the economy, Vedder said, but current policies keep hundreds of thousands, maybe even millions, of potential newcomers out of the country. As an alternative to the status quo, he proposed using market forces to determine which foreigners get a legal right to live in this country.
The centerpiece of the proposal would be a daily on-line auction of 5,000 visas for work in the United States, with a hefty price that would
skew immigration toward highly productive workers. The visa price would vary with economic conditions, rising in good times when a lot of foreigners see opportunity and falling in hard times. Add in a humanitarian and refugee allotment, and the system would admit 1.5 million immigrants a year, considerably higher than existing limits.
“The U.S. Treasury would receive $20 billion in new revenue,” Vedder said. “An idea that would make expanding immigration more popular with the American people would be to dedicate these revenues to reducing individual income taxes.”
Nathan Ashby, professor at the University of Texas El Paso: Within the United States, Ashby’s research identified several key aspects of economic freedom that attract migrants—lower top marginal tax rates, less restrictive minimum wages, relatively low government employment and less union power.
For migration among countries, Ashby found a 1 percent gain in economic freedom associated with a 0.41 to 0.53 percent increase in in- migration rates. “Economic freedom matters, and it matters considerably, even when I controlled for income,” Ashby said. “People cared about economic freedom.”
SMU anthropology professor Caroline Brettell: Immigrants once clustered in large cities in New York, California, Florida, Texas and a handful of other states. Today, they’re venturing farther from the border and into suburban and rural communities, creating new flashpoints in the immigration wars.
With federal immigration reform stymied, states and communities have
been acting on their own. Farmers Branch, a Dallas suburb several decades past its prime, enacted a series of anti-immigrant ordinances in 2007—for example, requiring landlords to verify tenants’ proof of citizenship. “Suburban decline became framed as a problem of illegal immigration,” Brettell said.
After years of legal wrangling, the Supreme Court rejected Farmers Branch’s ordinance. However, Brettell said the episode illustrated how immigration touched on cultural and economic issues at the local level.
Jim Prewitt, CEO of Landmark Nurseries: “The Immigration Conundrum: A Businessman’s Perspective” presented a first-hand look at the trials and tribulations of doing business under current immigration laws.
Prewitt’s company operates five distribution centers in Texas, serving 25,000 customers. Offering a starting pay of $10.75 an hour, one of his biggest headaches is filling 180
Nathan Ashby
Richard Vedder

O’Neil Center 2014-15 Annual Report 21
low-skill jobs that entail manual labor on days with temperatures as high as 110 degrees.
Landmark Nurseries draws mostly from a pool of workers from Mexico and El Salvador, and complying with the immigration laws is a burden. “I go to great extremes to make sure we have legal employees, and I have to look at all kinds of documents,” Prewitt said.
Sponsors contributed nearly $50,000 to the conference, led by AdvoCare, the presenting sponsor, and Richard Weekley, Cary Maguire and Harriet and Warren Stephens. To allow continued access to the conference presentations, the O’Neil Center posted videos of all the speakers on its website.
In addition to the conference, the O’Neil Center enhanced intellectual diversity on the SMU campus by sponsoring speakers with iconoclastic points of view.
In February 2014, the O’Neil Center hosted Ladar Levison (SMU ’03) founder of Lavabit LLC, the encrypted
email service company that Edward Snowden used after his disclosure of classified National Security Agency documents. Once Snowden’s identity became public, a federal search warrant demanded that Lavabit disclose the private keys for all its users. Levison shut down operations shortly afterward to avoid compromising its users’ privacy. Levison’s talk directly confronted government overreach and privacy in the digital age.
In November, about 150 students and guests attended an O’Neil Center-sponsored debate on sweatshops. Benjamin Powell, director of Texas Tech’s Free Market Institute, contended that low-wage textile factories help countries climb the ladder toward greater economic development. Keri Day, a Texas Christian University divinity professor, cautioned about the
moral implications of rich countries exploiting the labor in poor countries.
In February, the center joined the Texas Public Policy Foundation (TPPF) and the Texas Association of Business to host economist Arthur Laffer, who discussed his study of the economic benefits of school choice in Texas. The O’Neil Center also co-sponsored with the TPPF a panel on the SMU campus to review key policy outcomes of the recently concluded Texas legislative session.
April 2015 was a busy month for O’Neil Center speakers. First came Jeffrey Tucker, chief liberty officer and distinguished fellow at the Foundation for Economic Education, who discussed the individual empowerment coming from the explosion of the Internet’s peer-to-peer transactions.
A week later, Duke University professor Michael Munger gave two Caroline Brettell
Jim Prewitt

O’Neil Center 2014-15 Annual Report22
Michael Davis, Senior Lecturer, SMU Cox School of Business
W. Michael Cox, Founding Director, William J. O’Neil Center for Global Markets and Freedom
Albert W. Niemi, Jr., Dean, SMU Cox School of Business
Robert Lawson, Director and Fullinwider Endowed Centennial Chair in Economic Freedom
SMU presentations—one on how the Internet squeezes traditional middlemen by reducing transaction costs, and the other, titled “The Thing Itself: Riding the Unicorn Over a Cliff,” an analysis of the follies of leftist intellectuals and the government policies they advocate.
David Boaz, executive vice president at the Cato Institute, gave an invitation-only lunch speech for O’Neil Center supporters on libertarian principles, based on his book The Libertarian Mind, and a public talk about the failures and foibles of America’s long-running war on drugs.
O’Neil Center in Print
As in years past, O’Neil Center scholars put their ideas on paper, charging into academic and public debates on a range of topics of import to economic freedom.
In early 2014, Cox and Alm were invited to join five other commentators to form Investor’s Business Daily’s Brain Trust. Each will write about six articles a year, which will receive premium front-page display in O’Neil Center founder Bill O’Neil’s newspaper.
The first Cox and Alm venture was “Money Won’t Revive Flat-Lining
Schools,” published in March. They followed up with a two-part op-ed that took on the nation’s income inequality by discussing what the rich do to benefit all Americans and the importance of incentives and education in lifting up the bottom of the income distribution. In September, Cox and Alm laid out the case for cutting U.S. corporate tax rates.
In 2014, Dallas-based D CEO magazine published four Cox and Alm chart-and-text articles focusing on the Texas economy. One showed that Dallas-Fort Worth and Houston had the strongest job growth among the 15 largest U.S. metropolitan areas. The others highlighted the low volatility in the Dallas housing market, the relatively high buying power of Texas wages and the Dallas area’s surprisingly low income inequality.
Cox and Alm started out 2015 with a one-pager in D CEO looking at Texas’ economic freedom as capital stock—a localized version of the annual report essay.
The magazine then gave Cox and Alm a battlefield promotion of sorts, increasing their column to two pages. Their first expanded essay was titled “The Energy Enigma,” which debunked the idea that Texas’ prosperity requires
high oil prices. The state grew most rapidly in the 1990s, when oil prices were at a low ebb. Their second two-pager focused on the secret of Dallas-Fort Worth’s rapid job creation—labor market freedom.
In addition to co-authoring the 2014 edition of the EFW report, Lawson published two academic-journal articles: “Can Two Observations Confirm a Theory? A Comment on Max U versus Humanomics” in the Journal of Institutional Economics and “Does Immigration Impact Institutions?” in Public Choice (with J.R. Clark, Ryan Murphy, Alex Nowrasteh and Benjamin Powell).
Early 2014 saw release of Lawson’s book (with Larisa Burakova) on the triumph of economic freedom in a former Soviet republic—Georgia’s Rose Revolution: How One Country Beat the Odds, Transformed Its Economy, and Provided a Model for Reformers Everywhere.
Lawson also wrote two book chapters: “Economic Freedom in the United States and Other Countries” in What America’s Decline in Economic Freedom Means for Entrepreneurship and Prosperity and “Measuring Institutions and Policies Across Countries” in Economic Behavior, Economic Freedom,

O’Neil Center 2014-15 Annual Report 23
Dwight R. Lee, Scholar in Residence, William J. O’Neil Center for Global Markets and Freedom
Richard Alm, Writer in Residence,William J. O’Neil Center for Global Markets and Freedom
Ryan Murphy, Research Associate, William J. O’Neil Center for Global Markets and Freedom
and Entrepreneurship.In the 2014-15 academic year,
Murphy wrote eight articles for scholarly publications. In addition to joining Lawson et. al. on “Does Immigration Impact Institutions?,” Murphy had “The Plucking Model, the Great Recession, and Austrian Business Cycle Theory” in the Quarterly Journal of Austrian Economics and “Nutritional Efficiency Wages and Unemployment: Where’s the Beef?” (with Benjamin Powell) in the American Journal of Agricultural Economics.
The rest of Murphy’s output: “Heterogeneous Moral Views in the Stateless Society” in Libertarian Papers, “The Impact of Economic Inequality on Economic Freedom” in the Cato Journal, “What Do Recent Trends in Economic Freedom of the World Really Tell Us?” in Economic Affairs, “Unconventional Confidence Bands in the Literature on the Government Spending Multiplier” in Econ Journal Watch, and “The Unconstrained Vision of Nassim Taleb” in The Independent Review.
Murphy’s non-academic publications included “Benefits to the Poor of Texas Franchise Tax Repeal,” published as a National Center for Policy Analysis Policy Report in June 2014, and “A
Rent-Seekers Tax?” in the summer 2014 issue of Regulation magazine. Murphy also had an op-ed in the July 15, 2014, issue of the Austin American-Statesman, titled “Repealing Texas’ Franchise Tax.”
Lee wrote “The Two Moralities of Price Gouging” for Regulation magazine in spring 2014. Transitioning to scholar in residence, Lee remained productive. He published “Buchanan and Tullock Ignore their Own Contributions to Expressive Voting” in Public Choice (with J.R. Clark), “Making the Case Against “Price Gouging” Laws: A Challenge and an Opportunity” in The Independent Review, “In Remembrance of Gordon Tullock” in Public Choice (with J.R. Clark), and “The Beast is Not Easily Starved” in Public Choice. Lee also wrote a book chapter on “Freedom as a Public Good.”
Speeches and Presentations
Cox remained an in-demand speaker, not only in the North Texas area but also in other parts of the country. In the 2014-15 academic year, he delivered about 40 speeches on such subjects as economic freedom and growth, oil prices and the Texas economy,
interest rates, Fed policy, and America’s transition to the Imagination Age. His webinar and speech on “What Drives the Texas Economy: Oil or Economic Freedom?” was a huge hit.
Among the groups Cox addressed were EY, MoneyGram, Hillwood Properties, the Texas Real Estate Council, Jackson National Life, Hantz Financial, Quest Capital Management and the petroleum coke industry. The speeches raised the O’Neil Center’s profile among audiences of influential business people around the country.
In the 2014-15 academic year, Lawson gave 15 speeches on the EFW report, traveling as far as Iceland and Spain. Lawson also represented the O’Neil Center at several professional meetings: the Texas Public Policy Foundation (Austin), Mont Pelerin Society (Lima, Peru), Economic Freedom Network (Brussels), Public Choice Society (San Antonio), and a Liberty Fund Symposium on the Financial Crisis (Jekyll Island, Ga).
In April 2014, Alm addressed the Texas Public Policy Foundation conference on “Texas at a Turning Point,” discussing the O’Neil Center research that shows spending more state money on schools won’t improve students’ educational outcomes.

O’Neil Center 2014-15 Annual Report24
Mike Davis
Four members of the O’Neil Center attended the April 2014 meeting of the Association of Private Enterprise Education (APEE), the country’s largest gathering of free-market academics. Lawson contributed to the panel “Richard Vedder as Teacher and Mentor,” and he led a session on “Economic Freedom and Human Rights.” Lee presented two papers—“The Literature and Economics of Good and Evil” and “Buchanan and Tullock Ignore their Own Contributions to Expressive Voting.” He also chaired a session on “Morality and Economics.”
Murphy presented two papers, “Economic Freedom and Obesity” and “The Insignificance of SVAR as Applied to Fiscal Multipliers.” Shelton presided over an APEE session on “Communicating the Ideas of Liberty to Young People.”
Lawson, Murphy, Alm and Lee made presentations at the APEE conclave in April 2015. “Good Cop, Bad Cop, What You Gonna Do?” reviewed Lawson’s conclusions about police practices, gleaned from an analysis of reality TV’s cop shows.
In “Guesstimating Is Superior to Omitting: A Better Way of Addressing Sparse Data in EFW,” Murphy laid out a proposed improvement for dealing with missing data in the EFW report. Alm discussed the methodology and findings of the O’Neil Center’s annual report essay, “Living Above Our Means.”
In 2014, Lee spoke on the subject of markets and morality at three universities. Later in the year at the Southern Economics Association meeting, he discussed “Freedom: Low Cost Reduces Its Political Appeal.”
At October’s Texas Taxpayers and
Research Association annual meeting, Murphy’s topic was “Franchise Tax: Buyer’s Remorse?” At West Virginia University’s Center for Free Enterprise in April, he presented a paper titled “A Simple Empirical Investigation into the Optimal Size of the NGDP Target and Level Targeting.”
Teaching and Media
The O’Neil Center’s primary business is education. All told, its faculty taught about 900 students—both undergraduates and all three SMU Cox MBA programs.
Davis taught classes on macroeconomics, international finance, decision-making under uncertainty and, to BBA Scholars, principles of microeconomics. Lawson taught a total of six MBA-level classes in managerial economics. In addition to his summer class on markets and freedom, Cox taught money and capital markets to more than 160 students.
Niemi taught his course on the evolution of American capitalism at both the undergraduate and MBA levels and introduced a sold-out certificate program on the subject.
Davis took his teaching duties
on the road as an instructor for the Global Leadership Program, SMU Cox’s international program for MBA students. His classes went to Shanghai and Seoul, Rio de Janeiro and Santiago, and London and Madrid. In addition, Davis accompanied his class on Asian economics to Hong Kong and Shenzhen.
The media regularly sought the expertise of faculty members. Nearly every month, Fox Business called on Cox to join other commentators for its national coverage of the Federal Reserve’s policy-making meetings and the subsequent press conferences. At the end of the 2014-15 academic year, Niemi, Davis and Cox were honored for being among the business school’s Top 10 in media interviews and citations.
The O’Neil Center sponsors the SMU Students for Liberty, an affiliate of an international youth organization. Three SMU SFL students attended the International Students for Liberty Conference in Washington, D.C., in February. The SMU group also co-sponsored talks by Jeffrey Tucker, Michael Munger and David Boaz. SFL events also included watching the movies Citizen Four and 2112.

The Economic Freedom of the World report, co-authored by the O’Neil Center’s Robert Lawson, provided the intellectual basis for a PBS documentary that shows the benefits of economic freedom in human terms.
Produced by the Free to Choose Network, Economic Freedom in Action: Changing Lives tells the stories of entrepreneurs who are prospering in countries that made significant gains in economic freedom. The film, which aired on public television stations across the country in 2014-15, included on-camera interviews at the Fraser Institute in Canada with Lawson and Economic Freedom of the World co-authors James Gwartney and Josh Hall.
The O’Neil Center hosted showings of Economic Freedom in Action at SMU. In addition, we sponsored watch parties at more than 80 universities around the country, using a grant from the Charles G. Koch Charitable Foundation to provide copies of the film, posters, flyers, and food and beverage stipends.
Complete information on the documentary can be found at http://www.changinglivesfilm.com.
Economic Freedom in Action: Changing Lives
South Korea: Daesung Kim, refugee to venture capitalist
Slovakia: Katarina Rybarikova, Paul Frank-brand retailer
Zambia: Sylvia Banda, food services company founder
Chile: John Hernandez, building a bee-keeping business
Will iam J. O’Nei l Center
for Global Markets and Freedom
PO Box 750333
Dallas , TX 75275-0333
onei lcenter.org
214.768.4210