the welfare and productivity of dry sows in different
TRANSCRIPT

Copyright is owned by the Author of the thesis. Permission is given for a copy to be downloaded by an individual for the purpose of research and private study only. The thesis may not be reproduced elsewhere without the permission of the Author.

The Welfare and Productivity of Dry Sows in Different Group Housing
Systems in New Zealand
A thesis presented in partial fulfilment of the requirements for the degree of
Master of Science
in
Animal Science
At Massey University, Palmerston North
New Zealand
Kirsty Laura Chidgey
2011

i
Abstract
This research aimed to take a holistic approach to assessing dry sow welfare in relation to
gestation accommodation. Multiple factors that affect the welfare of a sow were considered. In
addition, the multitude of systems in New Zealand that are used to accommodate dry sows in
groups were captured. Commercial pig farms (n=20 farms, 7,912 sows total) were chosen to
represent the spectrum of different layouts and management practices in order to obtain data
from a wide range of different systems. During each on-farm visit, data concerning housing,
management, sow behaviour, welfare and productivity were collected. A number of criteria
were used to describe the farms (group size, stall duration, presence of bedding, feeding method,
feeding frequency). Sows kept in stalls for more than 5 weeks (n = 3 farms) had significantly
higher injury scores than sows that were in stalls for a shorter length of time or sows that were
not kept in stalls for any period during mating or pregnancy. Sows fed twice daily had
significantly higher stereotypies (P<0.05) than those fed at a different frequency. A welfare
index (WI) was calculated for each farm. This index incorporated each farm’s total scores for
injuries, stereotypies, coat condition, soiling and lameness. A low WI represented a lower
presence of indicators that were associated with compromises to welfare. Hence, a low WI
represented good welfare. For each farm, the minimum possible WI was 0.33, whilst the
maximum possible WI was 5.0. The mean WI was 0.65 (±0.14 SD). Overall, there was not a
high prevalence of indicators of compromised welfare. Out of the 20 farms, with an average
herd size of 395.60 sows per farm; only 10 sows in total were lame. Only three farms had sows
with a coat condition score above 0 (normal). There was no difference between mean piglets
born alive per litter (BA) for stalls (12.65±0.36) vs. group housed sows for the entire gestation
(12.27 ± 0.43) , or for the number of piglets weaned per sow per year (stalls: 23.70±0.59
W/S/Y, groups: 24.92±1.23 W/S/Y). As a result of this study, it is clear that there is no perfect
or ideal system for keeping dry sows, because a sow’s needs change throughout different stages
of the production cycle. Therefore the implication is that in any housing system, both the
advantages and disadvantages relating to a sow’s welfare will also change over time. In light of
this, operators need to understand the variation both between and within systems and how best
to manage them.

ii
Acknowledgements
This project was a long time coming. I was lucky to both get to know and work
alongside some very enthusiastic and helpful people. Firstly, a big thanks to my
supervisor Patrick Morel. Thank you for all of your guidance and constructive support,
especially throughout the back-and-forth editing process, and for ensuring that those of
us interested in pig-related studies at Massey still have someone to help us out. A huge
thanks also to Ian Barugh (without whom I would have been a random stranger cold-
calling pig farmers asking for access to their farms). Thanks Ian for all of your help,
advice and support throughout this project. Thanks also for the laughs and the many
road trips around the country. On that note, I must also mention the farmers
themselves, who were, after all, the major part of this project. It was a pleasure to meet
you all and visit your sows. I learned so much more in a year from those farm visits and
informal chats than I ever could have from a textbook, and I really appreciate it.
I would like to acknowledge the MAF Sustainable Farming Fund for financial support. I
would also like to thank New Zealand Pork for funding, in addition to their support and
encouragement in my involvement in this project.
Finally, a big thank you to my family (Mum, Dad, and Rory), and to Nick (and his
family). Thank you for encouraging and supporting me all the way through my
academic endeavours, and putting up with my pig-related stories.

iii
Contents
Abstract .......................................................................................................................................... i
Acknowledgements ....................................................................................................................... ii
Contents ....................................................................................................................................... iii
List of Figures .............................................................................................................................. iv
List of Tables ................................................................................................................................ v
INTRODUCTION ........................................................................................................................ 1
1. LITERATURE REVIEW ..................................................................................................... 4
1. The New Zealand Pig Industry ............................................................................................. 5
2. Animal Welfare ..................................................................................................................... 5
2.1. Using Animal Behaviour to Assess Welfare Status ........................................................... 7
3. Sow Aggression and Social Behaviour ............................................................................... 10
3.1. Aggression and Feeding .................................................................................................. 15
4. Stress and Early Pregnancy ................................................................................................. 17
4.1. Timing of Mixing Relative to Stage of Gestation ........................................................... 19
5. Sow Housing Options ......................................................................................................... 22
5.1. Indoor Group Housing ..................................................................................................... 27
5.1.1. Productivity of Indoor Group Housed Sows ............................................................. 30
5.2. Outdoor Systems .............................................................................................................. 31
5.2.1. Productivity of Outdoor Housed Sows ..................................................................... 34
5.3. Gestation Stalls ................................................................................................................ 37
5.3.1. Productivity of Sows in Gestation Stalls ................................................................... 40
6. Stockmanship ...................................................................................................................... 42
7. Summary ............................................................................................................................. 44
2. MATERIALS AND METHODS ............................................................................................ 48
3. RESULTS ............................................................................................................................... 52
4. DISCUSSION ......................................................................................................................... 69
5. CONCLUSIONS ..................................................................................................................... 78
REFERENCES ........................................................................................................................... 80
Appendix 1 (On-farm assessment tool) ...................................................................................... 92
Appendix 2 (Farm description survey) ....................................................................................... 98
Appendix 3 (Behavioural ethogram)......................................................................................... 103

iv
List of Figures
Figure 1: The five domains of potential animal welfare compromise (from Mellor and Stafford 2009) ............................................................................................................................................. 7
Figure 2: Factors involved with the design and management of housing sows and gilts in groups (from Levis 2007) ....................................................................................................................... 25
Figure 3: Total scores for behavioural stereotypies for each farm (minimum score = 50, maximum possible score = 150). A low score represents fewer observed stereotypies. ............ 60
Figure 4: Total scores for general behaviours for each farm (minimum score = 65, maximum score = 260). As total score approaches the minimum possible score per farm (65), this indicates that the frequency of these behaviours (and sow activity in general) was low. .......................... 62
Figure 5: Mean (±SD) stereotypies scores for each farm category (minimum score = 50, maximum score = 150). Low score represents fewer observed stereotypies. ............................. 63
Figure 6: Mean (±SD) injuries in each farm category (minimum possible score = 0, maximum possible score = 495 per farm) . Low score represents fewer observed injuries......................... 65
Figure 7: Welfare index (±SD) vs. farm category (minimum possible WI= 0.33, maximum possible WI = 5.0 per farm). Low WI represents a low prevalence of indicators of potential welfare compromise. ................................................................................................................... 66
Figure 8: Sow productivity W/S/Y (piglets weaned/sow/year) vs. welfare index (minimum = 0.33, maximum = 5.0). Low WI represents a low prevalence of indicators of welfare compromise. ................................................................................................................................ 67

v
List of Tables
Table 1: Lesion scores and aggression scores during feeding (from Arey 1999) ....................... 14
Table 2: Effect of gestational age at grouping on the fertility of group-housed sows (from Kirkwood and Zanella 2005) ...................................................................................................... 20
Table 3: Percentages of sows housed in different systems in New Zealand (from: Sow Housing Survey October 2009, NZPIB).................................................................................................... 22
Table 4: Weighting factors for 20 welfare-relevant attributes ranked according to the weighting factors calculated by the SOWEL model (scale of 1-10) and compared to expert opinion (from Bracke et al. 2002). ..................................................................................................................... 27
Table 5: Reasons for culling and percentages of sows culled in outdoor and indoor farms (From Akos and Bilkei 2004). ............................................................................................................... 34
Table 6: Lifetime performance of indoor kept sows (mean ± SD) (from Akos and Bilkei 2004) .................................................................................................................................................... 35
Table 7: Production data from indoor and outdoor sow herds in New Zealand mid 2009 (from PVS, Canterbury Outdoor Pork Production Seminar proceedings 2010). .................................. 37
Table 8: Litter-related traits for sows kept in pens at various floor space allowances or individual stalls throughout gestation (LSM± SE) (adapted from Salak-Johnson et al. 2007) ... 41
Table 9: Effect of gestation housing system (stalls vs. groups) on reproductive performance in sows ............................................................................................................................................ 42
Table 10: Overview of the integrated factors present within the pregnant sow accommodation on-farm ........................................................................................................................................ 53
Table 11: Summary of sow productivity for all farms (n = 13 farms) ........................................ 54
Table 16: Summary of behavioural stereotypy scores (all farms) showing the % of sows that scored a 1, 2, or 3 for each stereotypy observed ......................................................................... 61
Table 17: Summary of general behaviour scores (all farms) showing the % of sows that scored a 1, 2, 3, or 4 for each general behaviour observed ....................................................................... 61

1
INTRODUCTION
The housing of gestating sows is currently one of the most controversial issues in terms
of animal welfare within the pork industry. A call for alternative housing options has
received increasing attention as concerns over the confinement of sows in stalls and the
restricted environment in which they are accommodated are raised by the public. Public
submissions that were received during the 2010 review of the Animal Welfare (Pigs)
Code of Welfare voiced unease over the intensive farming of pigs, and revealed a deep
concern for the perceived welfare of pigs. As such, a large number of submissions
called for the phasing out of sow stalls. A public perception of poor welfare and an
increasing demand for ethically-produced animal products are drivers for change;
however, there needs to be a balance between identifying and accommodating the actual
needs of farmed animals and educating the public as to why certain practices are
retained in the production system.
This is the current situation in New Zealand, where the continued use of gestation stalls
for sows has been questioned. Stalls were introduced to make individualised
management of breeding sows possible. Sow stalls enable sows to satisfy needs relating
to access to food and water, avoidance of injury, and protection from aggression. Stalls
also provide a safe environment for the stockperson to carry out routine husbandry tasks
(i.e. mating and pregnancy detection), individual observation of sows, and enable
efficient use of building space. Whilst there are behavioural and physical restrictions
placed on sows in stalls, their overall productivity is comparable to or better than sows
kept in groups throughout gestation (Nielsen 1995; Anil 2005). There is no definitive
evidence to suggest that sows in stalls experience greater stress than those in groups
(Curtis et al. 2009; Rhodes et al. 2005). Nevertheless, the 2010 Animal Welfare (Pigs)
Code of Welfare has resulted in the phasing out of the use of stalls in New Zealand,
with a complete ban enforced from December 2015 (NAWAC 2010). This is in
recognition that there are now viable non-confinement alternatives to sow stalls that
offer greater freedom of movement and socialisation. When managed correctly, the
productivity of sows in these alternative systems can equal that of sows in stalls
(NAWAC 2010). It was acknowledged that confinement in stalls does not meet all of

2
the requirements of the Animal Welfare Act 1999, in that the behavioural needs of a
closely-confined sow (regarding freedom of behavioural expression and freedom of
movement) were not being accommodated adequately in close confinement.
There are a number of advantages to group housing. These include providing sows with
more space, allowing social interaction between group members, and enabling sows to
choose between available microenvironments within the accommodation area. Despite
the numerous advantages sows in groups are subjected to compromised welfare with
regard to the level of aggression experienced in a group situation, given that sows are
hierarchical in nature and seek to attain dominance through fighting. However, sows
kept in groups outdoors experience greater environmental enrichment, with the
opportunity to escape agonistic behaviour due to a greater provision of space relative to
indoor group-housed sows. Outdoor production systems are often perceived by the
public as being better for the sows in terms of their wellbeing, yet within an outdoor
system greater opportunity exists for compromised sow welfare. Such compromises are
often described with regard to the lack of control over the sow’s environment; the
suitability of the genotype for outdoor production, challenges with achieving adequate
thermoregulation, and parasitic burden. A failure to meet the unique requirements of an
outdoor pig herd can result in high pig morbidity and mortality in addition to poor
productivity and financial losses (Akos and Bilkei 2004).
It must be recognised that the net welfare outcome is important, as opposed to focusing
on singular facets of what is considered to be essential to achieving a high standard of
wellbeing for farmed animals. As such, there is no perfect system for keeping breeding
sows. One of the reasons for this is that the physiological needs of a sow changes over
time as gestation progresses, therefore the suitability of a particular housing system may
be altered. This is demonstrated well in early pregnancy, when sow aggression and
fighting is detrimental to embryonic development and subsequent litter size and sow
productivity. As such the gestation stall has its place in protecting the sow prior to
implantation. Whereas, in later in gestation, there is a different concern arising due to a
mismatch between the sow’s increasing size relative to the dimensions of the stall as
pregnancy progresses.

3
There is confusion arising from conflicting reports as to the relative welfare and
productivity of sows housed indoors (either in stalls, followed by groups or in a group
situation for the entire gestation) or outdoors throughout gestation. This highlights the
need for an analysis that is relevant to the unique New Zealand pig industry. The
analysis needs to identify whether current concerns are warranted and what the
implications may be for producers faced with legislative changes regarding the future of
sow housing.
The purpose of this thesis is to capture the welfare status and productivity of group
housed sows in New Zealand, through assessing multiple factors that affect the welfare
of a sow. The overall aim was to highlight salient aspects of housing systems and sow
management that New Zealand producers may utilise in the upcoming transition
towards group housing for the entire gestation. The specific aims were to evaluate sow
welfare and identify trends associated with potential welfare compromise in specific
housing systems; and to demonstrate the relationship between net welfare outcome on-
farm and sow productivity. Additionally, based on the conflicting literature that has
reported differences in sow productivity between varying housing systems, this research
aims to investigate the relationship between net welfare outcome on-farm, and sow
productivity.

4
1. LITERATURE REVIEW
This review of the housing options for dry sows focuses on the welfare and productivity
of sows in three main systems that are used in New Zealand: stall housing, indoor group
housing and outdoor housing systems. This update is required by the New Zealand pork
industry, as it faces future legislative changes in light of a recent renewal of the Animal
Welfare (Pigs) Code of Welfare in December 2010 that will affect the current operation
of many New Zealand piggeries. As such, the industry requires an update on the
literature concerning the potential implications of converting to a different system.
The objective of this review is to characterise and compare the options available for
accommodating pregnant sows in terms of their welfare and potential for production.
This also includes a review of the literature on animal welfare; how an animal’s welfare
may be described and what is important to consider in an animal welfare assessment
that addresses a comparison of available housing options for dry sows. The aim is to
examine whether there are significant differences in the welfare and productivity of
sows housed in varying systems, what the primary issues are within each system, and
whether the current housing options available are capable of addressing these issues
without any compromise to productivity or profitability within the industry.

5
1. The New Zealand Pig Industry
During the first half of the 20th century, pig production in New Zealand was aligned
with the dairy industry, and served as a convenient means of utilising separated milk
and whey surpluses (Gregory and Devine 1999). As such, the rapid expansion of the
dairy industry in the North Island between 1900 and 1930 saw a simultaneous increase
in pig production. After the pig population peaked in 1930, numbers declined. Whole
milk collection from dairy farms was later introduced, and the late 1960s and early
1970s saw a sharp reduction in the routine feeding of pigs with separated milk and whey
products (Gregory and Devine 1999). A shift towards cereal and grain diets followed,
with a corresponding change in the location of pig farms whereby the majority of herds
are located in the South Island.
Currently, there are approximately 200 commercial piggeries in New Zealand. The
majority of sows in the North Island are housed indoors as outdoor production is
generally unsuitable due to the soil type and topography. Conversely, approximately
60% of sows in the South Island are kept outdoors at some stage (Edge et al. 2007).
Approximately 60% of production originates from the South Island, as this region
produces the majority of grain and cereal crops used in the industry. The New Zealand
pig industry is in the position to address current welfare concerns that are primarily
centred on sow confinement. There is a wide diversity of non-confinement systems
used in New Zealand, which also possesses a unique production system by virtue of
geographical location and internationally comparable low disease status (Gregory and
Devine 1999, Edge et al. 2007).
2. Animal Welfare
The characterisation of an animal’s welfare status has been the source of much debate
within the scientific community. Animal welfare is recognised as a subjective state
within an animal, and as such, cannot be measured directly. It follows that the animal

6
must be both sentient and conscious, as animal welfare encompasses experienced
sensations that may be negative, neutral or positive (Mellor and Stafford 2009). These
experiences are the culmination of integrated outcomes of sensory and other neural
inputs from within the animal itself, in addition to its environment. The animal’s
welfare status will change as the balance of these inputs change. Indirect indices that
represent the animal’s experiences are available and relate to physiological,
pathophysiological, and behavioural responses that may be observed to reflect the
overall welfare status in the face of these changing inputs. Thus, the primary assumption
is that these indices relate to positive or negative experiences within an animal.
Additionally, the five domains (see Figure 1) describe areas of potential welfare
compromise that encompass nutritional, environmental, health and behavioural risks to
welfare that result in subjective experiences in the mental domain (Mellor and Stafford
2009). The five domains of potential animal welfare compromise were adapted from
the original “five freedoms” listed in the Brambell Report (1965), and later expanded by
the Farm Animal Welfare Council (1993).
At present, there are three main welfare orientations. The first is a biological function
view, where welfare is good when the animal is healthy, growing and reproducing well,
and good productivity is evident (Mellor and Stafford 2009). The second is the affective
state, emphasising the potential for an animal to suffer or have positive experiences.
Good welfare is present when animals are capable of adapting or coping without
suffering whilst interacting with other animals, humans, and the environment. The final
view is one of a natural state, and proposes that welfare may be compromised as a
function of how far the conditions in which an animal is kept deviates from the
presumed original wild state of the species, and the extent to which the animal is able to
express their range of natural behaviours (Mellor and Stafford 2009). It follows that
there is debate over the relevance of each orientation to an applied animal welfare
assessment. Furthermore, different interpretations that result from an assessment of an
animal’s welfare status are due to value-based presuppositions about what is good or
bad for animals (Fraser et al. 1997).

7
The concept that animal welfare is related to stress has grown since the 1960s (Volpato
et al. 2009), and it was recognised that stressed animals would experience poor welfare
conditions, as opposed to non-stressed animals experiencing good welfare conditions . It
has also been put forward that animal “feelings” are an important welfare issue. As
such, the affective state may also be considered in an animal welfare assessment. What
the animal itself experiences, and how that will impact on the biological and
behavioural features of the animal will continue to form the ever-evolving notion of
what animal welfare is, and how those indices of welfare status may be integrated to
form an overall assessment of animal welfare.
2.1. Using Animal Behaviour to Assess Welfare Status
Despite the controversy surrounding the various potential measures of welfare, animal
behaviour remains a widely accepted indicator that is valued as an important component
of an animal welfare assessment. It may be that behaviour is considered valuable due to
Figure 1: The five domains of potential animal welfare compromise (from Mellor and Stafford 2009).

8
it being a relatively obvious factor to observe, and that an animal displays changes in
behaviour in a way that allows a rapid appraisal of whether the welfare of an animal
may have changed. Behaviour is a valuable adjunct to physical health, and serves as a
clinical symptom in its own right (Dawkins 2003). In addition, behavioural observations
are generally non-intrusive and non-invasive. However, behavioural characteristics are
subject to interpretation by humans, who associate certain behavioural characteristics
with particular meanings. The recognition of some behavioural patterns and what they
mean may be clear for some behaviours, whilst other behaviours may need to be
interpreted with caution.
It may be useful to rule out the possibility of potentially compromised welfare status by
focussing on the presence or performance of behaviours that indicate positive wellbeing.
For example, signs of contentment may include play, social
vocalisation/communication, foraging and exploration, and social grooming (Anil et al.
2002). The presence of positive experiences inferred from such behaviour may therefore
be a valuable consideration, especially when there may be little expression of any
obvious behavioural patterns that may indicate otherwise. It may be that an animal’s
behavioural repertoire is made up of behavioural needs and wants. This infers that some
behavioural patterns may be necessary, whilst others are ‘luxuries’. It may be surmised
that the prevention of behavioural needs is deleterious to an animal’s welfare. When
considering behavioural needs, the motivation to perform those needs is an important
concern (Gonyou 1994; Volpato 2009). It may be that the drive to perform certain
behaviours builds up within the animal if it is deprived of releasing stimuli (Jensen and
Toates 1993). In this context, a behavioural need may be considered a state that causes
suffering in an animal if it is not attained, and may be expressed through abnormal
behaviour, increased risk of pathology, or abnormal levels of hormone secretion (Jensen
and Toates 1993). It is widely believed that thwarting a species-specific behaviour may
lead to reduced welfare, in proportion to the strength of motivation of the behaviour and
the effect of preventing the outcome of the thwarted behaviour (Gonyou 1994).
However, it is equally important to recognise that behavioural needs change with
context.

9
In terms of assessing an animal’s welfare, the issue of accommodating an animal’s
natural behaviour is often raised. However, this assumes that animals that live in a
natural or wild state are all in good condition and experience good welfare, which may
not be the case (Volpato et al. 2009). It may be that the goal in animal welfare is to
accommodate as much behaviour as possible, without considering any as being essential
for animal wellbeing. In this approach, there is no ranking that denotes one particular
behaviour as being more important than another. However, therein lies the problem of
identifying which behaviours are normal, and what is required for those to be satisfied.
This idea also assumes that animals that achieve normal or natural behaviour are in a
good state of welfare. However, it may be argued that certain behaviours are essential,
and as such, more important to the animal in terms of its welfare.
Stereotypical behaviour in particular can be a valuable indicator of whether an animal is
in a poor state of welfare. Stereotypical behaviour is considered abnormal behaviour
typically associated with boredom or frustration, and is associated with a type of
restraint or confinement (Barnett and Hemsworth 1990). Stereotypies are generally
environment specific and may involve thwarted behavioural patterns. It is generally
agreed that the presence of behavioural stereotypes represent poor welfare, and there
may be a relationship between stereotypies and stress that could substantiate this. It may
be that there is some evidence of changes to physiological parameters that are
associated with stereotypical behaviours. In Sharman (1983), snout rubbing was
induced in pigs by drugs that stimulate or inhibit brain receptors. It has also been
proposed that the performance of these behaviours may serve to help animals cope with
a conflict, or environmental stressors. Conversely, it was put forward that the concept of
stereotypical behaviour can be difficult to interpret in welfare terms (Dawkins 2003).
This arises through focussing on the consequences of these behaviours. Where injury
results, it is clear that behaviour is a sign of poor welfare. However, where no overt
injury is apparent, interpretation is more difficult.
Oral-nasal-facial (ONF) behaviour is a normal and frequent pattern of behaviour in pigs,
in that the pig investigates its environment primarily with its head (the face, nose,
mouth and the associated senses of vision, taste, and smell) (Curtis et al. 2009). Some of

10
these behaviours, such as bar biting and sham chewing, are presumed to be ‘affect
displays’ , particularly when they are classified as stereotypic in nature. Oral-nasal-
facial stereotypies manifest as apparent misdirected or repetitive non-functional
behaviours whereas highly functional ONF behaviours include eating, drinking and
rooting (Curtis et al. 2009). Evaluations of the adaptation of sows to different types of
accommodation often measure the duration and frequency of non-eating ONF activities.
However, ONF stereotypies seem to be more related to the individual characteristics of
sows as opposed to the accommodation environment, as the tendency to develop
stereotypic ONF behaviours is related to age and parity of the sow (von Borell and
Hurnik 1991; Vieuille-Thomas et al. 1995), and sows exhibiting stereotypic ONF
behaviours have been observed both in group and individual sow housing systems. A
comparison of sow housing systems that is based on the frequency and/or intensity of
ONF behaviours alone is therefore inadequate. This arises as environmental features
(e.g. bars, soil) will influence the expression of such behaviours, without it being
obvious as to whether there is any significance with regard to an animal’s welfare
status. It was concluded that ONF behaviours such as bar-biting are not useful measures
for differentiating sow welfare across different housing systems (McGlone et al. 2004).
3. Sow Aggression and Social Behaviour
Grouped pigs establish a hierarchical social ranking that is ultimately achieved through
aggressive interactions. In established groups, these confrontations are relatively
regulated, and of a lower intensity than would be observed between unfamiliar animals.
Fighting behaviour is essentially a tool that settles disputes between pigs; and it follows
that an initial encounter between unfamiliar pigs results in a demonstration of
aggression that is not far removed from that of their wild conspecifics. The retention of
these fighting tactics by domestic sows is broadly similar for all age groups (Petherick
and Blackshaw 1987), and is based on offensive moves whereby an animal attempts to
bite its opponent, and defensive moves in which an animal attempts to avoid being
bitten (Rushen and Pajor 1987).

11
In a natural environment, pigs are social animals, preferring to exist in small herds that
consist of a few related sows and several generations of related female offspring (Stolba
and Wood-Gush 1989). This formation is socially stable, with a strict dominance
hierarchy in place that is based primarily on age and physical size. Aggression in the
wild is infrequent, rarely results in injury, and this is primarily limited to assembly at a
food source, disputes over favoured lying spaces, or invasion of unknown pigs into a
territory that is already occupied and defended by a sow group (Stolba and Wood-Gush
1989). To reduce the opportunity for aggressive encounters, pigs will observe an
avoidance order and maintain a certain distance from each other (Turner et al. 2006).
Pigs use threats and other nonaggressive behaviours to maintain a dominance
configuration within a group, which is aided by their natural habitat providing areas of
refuge from other pigs. It follows that the social behaviour of sows has withstood
generations of genetic selection pressure that has focussed upon economically
significant traits within the commercial industry, and that this warrants consideration in
the design and management of sow housing systems.
The establishment of sow groups in modern production systems may be necessarily
arbitrary, and as such, not always conducive to the normal social organisation process
that would be adopted naturally amongst sows. Relative to natural or semi-natural
conditions, this may be seen as a form of artificial grouping in some circumstances,
which creates an environment where aggressive flare-ups occur (Curtis et al. 2009).
Such interactions are physically injurious as well as physiologically and psychologically
stressful, and may indicate a failure to adapt to the forced proximity to unfamiliar sows.
Thus, the challenge in modern pig production is to manage this aggression whilst
providing pigs the opportunity to engage in a greater range of behaviours than is
afforded in individual housing systems.
The level of stress and the injuries inflicted by mixing unfamiliar sows remains a
significant welfare concern. In newly-formed groups of sows, almost all individuals are
involved in agonistic interactions, which contribute to the rapid establishment of a
dominance order between unacquainted pigs (Arey and Edwards 1998). The
composition of the group may influence the frequency of aggressive interactions

12
between sows. In general, larger group members initiate and win most fights, and there
appears to be a positive correlation between social rank of sows and their weight, age,
and parity (Arey and Edwards 1998). In the wild, the maintenance of the dominance
hierarchy is facilitated by the extensive setting, whereby a sow can readily escape an
aggressive encounter by moving away. However, when sows in a social group are
gradually provided less space it follows that there are higher incidences of fighting and
injury within a group. Thus, the ability of subordinate sows to perform avoidance
behaviour in the face of a threat of aggression is thought to be the most important factor
regulating social stability within a group (Weng et al. 1998). As such, the composition
of the group, in terms of the proportion of sows that act as aggressors versus the
proportion that exhibit consistent avoidance activities, is likely to influence the overall
dynamic of the group.
There is no defined maximum for group size. Where sows have been kept in large
groups of 300 or more, there have been no obvious detrimental effects associated with
the social dynamic and aggression levels within the group (Spoolder et al. 2009). It is
likely that, at such large group sizes, pigs fail to individually identify and remember all
group members. As a result sows are less likely to engage in aggressive interactions;
instead they express avoidance behaviour (Turner and Edwards 2000). Large groups are
often operated as dynamic groups, and research has suggested that aggression towards
newly-introduced sows may be influenced by the replacement rate, as replacing 10% or
less of a dynamic group with new sows compromises the welfare of those sows
(O’Connell et al. 2004).
Whilst fighting, pigs attempt to target the head, neck and ears of their opponent,
resulting in superficial skin lesions that are predominantly concentrated around the front
third of the body, or flanks when delivered in the reverse parallel posture (McGlone
1985; Fraser and Rushen 1987). In a commercial situation, pigs may be regularly
confronted with sudden mixing episodes with the introduction of unfamiliar animals
into an environment that has limitations in regard to the effective dispersal and display
of appropriate avoidance behaviour (Turner et al. 2006). The presence and severity of
skin lesions are used as an indication of the degree of aggression within a group of pigs,

13
as well as reflecting the quality of an animal’s physical and social environment (Leeb et
al. 2001). The use of lesion scores has been identified as a means of rapidly assessing
the level of aggression within a group of pigs mixed under a commercial situation and
can be an indicator of welfare status (Barnett et al. 1996; Leeb et al. 2001).
The formation of social hierarchy in sows is a complex process. An important aspect of
any system that requires sow groups to be formed is the length of time it takes for
aggression to subside and for a relatively stable social structure to form. This may
influence the degree of distress that is experienced by sows. The literature reports
significant variation in the time taken for aggression to subside, which may be more
reflective of the general skill level of stockpersons and husbandry practices on different
farms. However, it is agreed that social stress is related to several detrimental
consequences for sow productivity including delayed oestrus, abortion, increased
farrowing time and agalactia (Arey 1999). The length of time it takes for aggression to
subside and for groups of sows to become relatively stable has been reported to occur
anywhere from 3 to 10 days post-mixing (Van Putten and Van de Burgwal 1990; Oldigs
et al. 1992). Other studies have reported much longer periods before sows are fully
integrated into new social hierarchies. An investigation of the time course for the
formation of socially stable groups was carried out, and found that upon mixing sows
into groups that were comprised of both familiar and unfamiliar sows, the number of
fights that were observed over a 24 hour period ranged from 2-8 per group of 6 sows,
with an average fight duration of 70 seconds (Arey 1999). Over 93% of fights were
between sows that were previously unfamiliar with one another, and the group with the
most unfamiliar sows had the highest frequency of fights in that period (Arey 1999).
However, levels of fighting can be highly variable, and may be caused by group
composition in that only a small proportion of pigs may be engaging in aggressive
behaviour whilst the majority mainly receive aggression. In Arey (1999), 24 sows were
weaned (day 1) and randomly mixed into service pens in groups of six, mated on day
five and then transferred into gestation pens at day 28. On days 28, 56 and 84, the sows
were transferred into a large straw-bedded test pen (5.75 x 13m) for 3 days, where
aggression scores were recorded. Aggression was observed to decline rapidly after
14
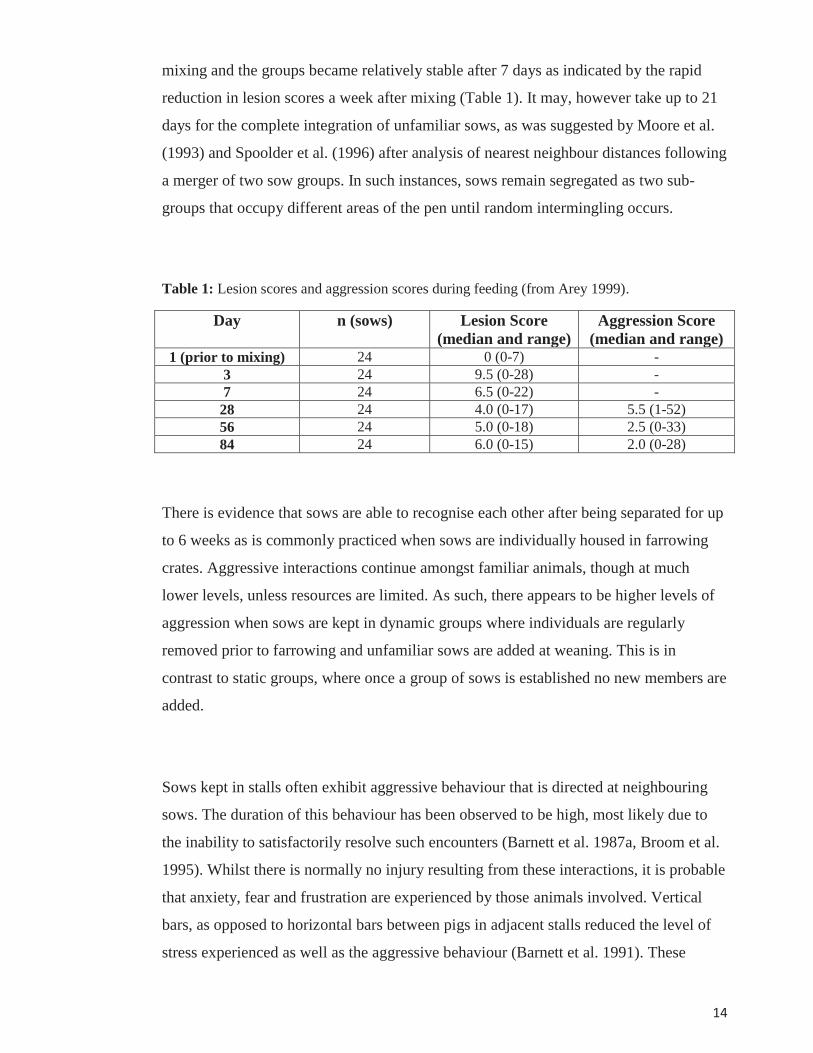
mixing and the groups became relatively stable after 7 days as indicated by the rapid
reduction in lesion scores a week after mixing (Table 1). It may, however take up to 21
days for the complete integration of unfamiliar sows, as was suggested by Moore et al.
(1993) and Spoolder et al. (1996) after analysis of nearest neighbour distances following
a merger of two sow groups. In such instances, sows remain segregated as two sub-
groups that occupy different areas of the pen until random intermingling occurs.
Table 1: Lesion scores and aggression scores during feeding (from Arey 1999).
Day n (sows) Lesion Score (median and range)
Aggression Score (median and range)
1 (prior to mixing) 24 0 (0-7) - 3 24 9.5 (0-28) - 7 24 6.5 (0-22) - 28 24 4.0 (0-17) 5.5 (1-52) 56 24 5.0 (0-18) 2.5 (0-33) 84 24 6.0 (0-15) 2.0 (0-28)
There is evidence that sows are able to recognise each other after being separated for up
to 6 weeks as is commonly practiced when sows are individually housed in farrowing
crates. Aggressive interactions continue amongst familiar animals, though at much
lower levels, unless resources are limited. As such, there appears to be higher levels of
aggression when sows are kept in dynamic groups where individuals are regularly
removed prior to farrowing and unfamiliar sows are added at weaning. This is in
contrast to static groups, where once a group of sows is established no new members are
added.
Sows kept in stalls often exhibit aggressive behaviour that is directed at neighbouring
sows. The duration of this behaviour has been observed to be high, most likely due to
the inability to satisfactorily resolve such encounters (Barnett et al. 1987a, Broom et al.
1995). Whilst there is normally no injury resulting from these interactions, it is probable
that anxiety, fear and frustration are experienced by those animals involved. Vertical
bars, as opposed to horizontal bars between pigs in adjacent stalls reduced the level of
stress experienced as well as the aggressive behaviour (Barnett et al. 1991). These

15
modifications are clear examples of how the design and management of the housing
system, can exhibit a direct effect on animal welfare.
3.1. Aggression and Feeding
It follows that there are several management and design features of group housing
systems that may be implemented in order to reduce the level of aggression within a
group of sows. As mentioned previously, fighting generally occurs at mixing. After the
social stabilisation of the group, agonistic behaviour is generally associated with
feeding competition. Therefore, the feed delivery system can influence the degree of
aggression at feeding.
Under natural conditions sows synchronise feeding behaviour, engaging in multiple
peaks of feeding activity throughout the day. Conversely under the majority of
commercial systems, sows are fed a restricted amount that is generally delivered and
consumed in a single meal that is eaten in 15-20 minutes (Marchant-Forde 2009). The
objective of this is to prevent excessive body weight gain and fat deposition, in addition
to potential dystocia complications at farrowing. Floor feeding can lead to highly
competitive behaviour, giving rise to aggression at feeding time as sows fight for access
(Arey, 1999). Dominant sows may monopolise the feed if its distribution is not wide
enough. The aggression can be better managed by ensuring that the feeding area is
widespread, that the group is relatively uniformly sized and group members have
similar rates of feeding (Gonyou 2005). Similar issues are seen with trough feeding
where a trough that is free from partitions can allow high levels of aggression and
overfeeding of more aggressive sows, at the expense of lower ranked individuals.
However, this may be improved by introducing a wet feed, or using dividers that create
individual feeding places (Marchant-Forde 2009).
Trickle feeding allows each sow in the group an individual cubicle or short stall, into
which feed is slowly delivered. Feed is distributed at the same rate that the sows

16
consume it, preventing accumulation of feed at the location of the slower eaters which
discourages others from moving from space to space in an attempt to steal feed from
other sows (Gonyou 2005). Electronic sow feeders (ESF) however, provide one feeder
per group of sows, and can be accessed by each sow in turn. The advantage of this
system is that each sow is fed in isolation and sows are fed as per their individual
requirements. This enables those that are in poor condition to be fed a higher allowance.
However, a group of sows prefer to feed at the same time, and as such the design and
location of the feeder influences the opportunity for bouts of aggression whilst queuing
at the feeder. The consequence of sequential feeding that is that the entrance to the
feeder can become a focus for activity for much of the day. Coupled with access to a
limited feed source, agonistic behaviour may result. There is also the likelihood of
dominant sows making several non-feeding visits after receiving their daily ration, thus
restricting access by lower ranked sows. A major concern in ESF systems is the
incidence of vulva biting (Levis 2007). This is associated with frustration as sows queue
behind each other waiting for access to the feeder. It has been suggested that providing a
forage material such as straw in the lying area as well as beginning the feeding cycle
overnight (Jensen et al. 2000) can reduce the incidence of aggression in ESF systems.
The level of aggression and activity in herds with ESF was compared over four different
farms by researchers in Denmark using behavioural observations (Jensen et al. 2000).
Behavioural data was collected via 24-hour video recordings that were made over a
period of eight months. Six 24-hour recordings were selected per herd for analysis.
Analyses indicated that the majority of agonistic behaviour that was displayed coincided
with the initiation of feeding, and continued thereafter. In the feeding area and in the
total pen area, the frequency of aggression was significantly higher than in the non-
feeding period (Jensen et al. 2000). Both the intensity and frequency of aggression was
higher in herds that did not have straw bedding. As such, it appears that it was a
difference between the management of individual herds that accounted for the variation
in the frequency and intensity of aggression among herds using electronic sow feeders.
The individual feeding stalls allow sows to be shut in whilst feeding, offering a
relatively high degree of protection. A primary advantage of this system is that it

17
enables sows to be fed simultaneously, in contrast to the electronic sow feeder, whilst
controlling each individual’s correct dietary ration. Where group sizes are small and
socially stable and sows are uniformly sized, confinement whilst feeding may not be
necessary. In this situation feeding stalls are used as individual feeding stations rather
than lockable stalls. However, they may serve a dual purpose for those that seek
protection from overly aggressive sows within the group.
4. Stress and Early Pregnancy
Stress may be described as the inability of an animal to adapt to or cope with its
environment. Moberg (1993) described stress as the biological response to an event (a
stressor) that an individual perceives as a threat to its homeostasis. In response to a
stressful stimulus, endogenous adrenocorticotropic hormone (ACTH) is released by the
anterior pituitary gland. The target organ of ACTH is the adrenal cortex, which is
stimulated to produce and release cortisol (Brandt et al. 2009). Stress also leads to the
activation of the sympathetic nervous system and the adrenal medulla, which results in
the release of catecholamines (noradrenaline and adrenaline). The elevation of
circulating concentrations of adrenaline, noradrenaline and cortisol induced by stress
results in increased heart rate, blood pressure, dilation of pupils, decreased gut motility,
pupil dilation, glucose mobilisation, increased rates of lipolysis and immune
suppression (Edge et al. 2007; Brandt et al. 2009; Razdan 2004). Stress also results in
behavioural stereotypies and behaviour associated with anxiety and fear.
In pigs, the peripheral concentration of cortisol is an accepted indicator of stress.
However, it should be noted that this association is somewhat simplistic as cortisol is
also released in response to events or activities that would not be considered stressful,
such as feeding or mating (Turner and Tilbrook 2005). Adrenocorticotropic hormone
(either directly or through cortisol) has an effect on many organ system functions,
including the reproductive system, in addition to influencing many hormonal pathways.
Repeated injections of sows with synthetic ACTH on a 4 hourly basis mimic the effects
of chronic environmental stress. Such experiments have shown a response in the
patterns of hormonal secretions, such as an increase in the concentration of

18
progesterone, luteinising hormone (LH) and inhibin α, and possibly a reduction in the
concentration of oestradiol (Brandt et al. 2007b). The observed peak in plasma
progesterone following ACTH administration was concomitant with the peak in plasma
cortisol immediately after ovulation in another experiment (Razdan 2004). This is
believed to originate from a release of progesterone from the adrenal glands.
The evaluation of stress is difficult, especially in a long-term situation where it may be a
chronic condition. The two key hypotheses regarding the impact of stress on the
reproduction of females (Turner and Tilbrook 2006) are that: A) prolonged stress
impairs reproductive functionality; and B) reproduction in females is particularly
vulnerable to the impact of acute stress during the specifically-timed series of endocrine
events in the lead-up to oestrus and ovulation. Turner et al. (2005) showed that
ovulation is only disturbed in sows that exhibited a chronic elevation of cortisol, and
that repeated injections of cortisol did not disrupt ovulation. This may also be the case
in early pregnancy, where no negative effects are observed on embryo survival in the
event that present stressors do not lead to chronic elevation of cortisol. Alternatively,
the reason for this may be that in experimental conditions, where typically only one
stressor is evaluated at one time, whereas a combination of stressors may influence
embryo mortality on-farm (Spoolder et al. 2009).
Administration of exogenous ACTH to sows has been shown to delay the onset of
oestrus, suppress oestrus activity and also result in the development of cystic ovarian
follicles (Liptrap 1970). Previous studies have shown that elevated concentrations of
progesterone will have a strong inhibitory effect on LH release (Harris et al. 1999), with
consequences on the functions of the oviduct, uterus and ovary (Brandt et al. 2009). The
most vulnerable stages of reproduction are likely to be ovulation, the expression of
oestrus behaviour, and embryonic implantation, as these events are controlled by the
neuroendocrine system. It is crucial that oestrous behaviour and ovulation occur
concurrently and with suitable timing, to allow the sow to be mated at a time that
coincides with the period of optimal fertility. As such, disruption of any of the events of
the oestrous cycle, or the timing of these events, has the potential to disrupt
reproductive function.

19
4.1. Timing of Mixing Relative to Stage of Gestation
The housing system of gestating sows must be considered as a potential stressor in
itself, given that aggressive interactions amongst sows are inevitable. This clearly
applies to group housing systems, where it has been suggested that the timing of mixing
relative to the stage of pregnancy can be instrumental in whether a pregnancy will be
detrimentally affected. The timing of mixing is critical due to its influence upon many
factors. Submissive sows within a group are likely to be the most vulnerable, as it is not
uncommon for low ranked individuals to be subjected to a period of food restriction or
deprivation. Depending on the severity of nutrient deprivation and the associated stress
that it induces, this may lead to adrenal activation. Subsequently, a corresponding
elevation of cortisol and progesterone concentrations may result, which has been
implicated in embryonic losses (Edge et al. 2007). Low-ranked sows have been shown
to have higher basal plasma cortisol levels and a lower total weight of live-born piglets
compared to more dominant sows. Thus the effect of group housing on adrenal
activation and stress in an individual female may be a consequence of the rank of that
individual. Other factors such as the composition and size of the group may also be
important.
There are contradictory results from examining the effect of mixing mated sows prior to
and during embryonic implantation. It is apparent that environmental, social and
nutritional disturbances that are experienced during early pregnancy can have
detrimental consequences for embryo development and survival. These were the
primary reasons for the introduction of individual gestation accommodation for sows. A
large study of the performance of sows housed in dynamic groups has been carried out.
It was observed that when sows were introduced to the group at 1-8 days post mating
the return rate was 20%, whereas grouping the sows during the fourth week of
pregnancy reduced the return rate significantly to 10% (Bokma 1990). Another
investigation of the timing of grouping sows found that regrouping on the second day
after mating gave the highest farrowing rate whereas regrouping on day 14 gave the
lowest farrowing rate (Table 2). However, litter size was not significantly affected by
the time of regrouping (Kirkwood and Zanella 2005). Conversely, it has been disputed

20
as to whether the individual housing of sows during pregnancy has a beneficial
influence on pregnancy rates and litter sizes (van Wettere et al. 2008). It may be that the
aggression that is experienced at mixing acts as a short-term stressor. Thus, provided
that it does not coincide with a critical stage of the reproductive cycle, detrimental
effects may be avoided.
Table 2: Effect of gestational age at grouping on the fertility of group-housed sows (from Kirkwood and Zanella 2005).
Grouping day Farrowing rate Litter size (total) 2 86.0% (43/50)a 11.1±0.6 7 81.6% (40/49) 11.2±0.6
14 69.8% (37/53)b 11.9±0.6 21 75.5% (40/53) 11.8±0.6 28 76.0% (38/50) 11.3±0.6
Values with superscripts a and b differ significantly P<0.05.
The effect of stress during oestrus on the fertilisation rate and early development of
embryos has been investigated. This has been carried out by stimulating stress through
administering ACTH at oestrus. Sows were inseminated and anaesthetised at 48 or 60
hours post-ovulation, and results indicated that significantly fewer oocytes/ embryos
were recovered from the ACTH-treated group than from the control group (51% vs.
81% p<0.05) (Brandt et al. 2007a).
During ovulation and early pregnancy, the patterns of hormonal secretions are altered.
After fertilisation, the developing embryos synthesise and secrete oestrogens (Pusateri
et al. 1996). This is critical as during the maternal recognition of pregnancy, the
maintenance of pregnancy is entirely dependent on the secretion of conceptus-origin
oestrogen. The maternal recognition of pregnancy in the pig is completed by day 18 of
gestation. After this time, circulating oestrogen concentrations rapidly decline and
remain at low levels throughout pregnancy.
Progesterone levels are relatively low prior to the onset of oestrus and during ovulation,
but rapidly increase at conception. The circulating progesterone concentration peaks at

21
approximately the 4th week of gestation in conjunction with the completion of placental
development. Therefore, progesterone remains at a relatively high but constant
concentration until immediately prior to parturition. Metabolites of progesterone are
known to have a calming anxiolytic (anti-anxiety) effect on behaviour, and analogues of
progesterone are used as anaesthetics and sedatives (Bitran et al. 1995; NAWAC 2003).
The calming effect of progesterone may explain the behaviour of the sow in relation to
the reproductive cycle. Sows are more aggressive during the period following weaning
including at mating and soon after, when circulating progesterone levels are low. An
increase in aggressive behaviour is also observed immediately prior to farrowing.
Thus, the justification for using a form of individual accommodation such as a sow stall
post-weaning can be clearly related to the endocrinology of the sow at this time, with
particular emphasis on the concentration of progesterone. Isolating sows at this time
prevents injuries and stress associated with aggression and fighting, and enables the
completion of the mechanism by which the maternal recognition of pregnancy occurs.
Once implantation and placentation is complete, progesterone levels are high and have
reached a plateau. This is likely to correspond to a behavioural alteration that reduces
the aggressiveness of sows. As a result, a more favourable time to begin the formation
of sow groups is after the 4th week of pregnancy; although, it is worth noting that there
is no apparent literature that has investigated the effect of mixing sows after 28 days
post-mating. Furthermore, it has been suggested that repeated periods of acute stress
and elevation of cortisol in the period preceding oestrus and ovulation may not directly
impact sow fertility. Nonetheless, fertility may be compromised if the stress is relatively
prolonged or severe. In some cases, with group housing in particular, there would be a
high probability of prolonged stress due to aggression at mixing, followed by aggressive
behaviour at feeding time/s (Kirkwood and Zanella 2005). As such, this has reinforced
the recommendation that sows should not be mixed prior to the completion of
embryonic implantation at the 28th day of gestation.

22
5. Sow Housing Options
Approximately 40% of pigs in New Zealand are outdoors or stall-free whilst the
remainder are housed indoors. Indoor systems encompass a multitude of possible
configurations that may involve the use of stalls for a varying duration at some point in
the production system. However, less than 10% of breeding sows in New Zealand spend
more than 6 weeks in sow stalls. This percentage is continuing to fall as producers
transition towards group housing.
Table 3: Percentages of sows housed in different systems in New Zealand (from: Sow Housing Survey October 2009, NZPIB).
% farms % sows
In stalls for > 4 weeks per gestation 28% 25% In stalls for < 4 weeks pre gestation 21% 16% Indoor group housed 35% 18% Outdoor housed sows 44% 41% Multiple systems (transitioning) 25% -
Despite these statistics, a negative public perception of the use of individual stalls to
house gestating sows remains a source of concern for the New Zealand pig industry. In
New Zealand, the welfare of sows in gestation housing systems has gained national
attention. As such there was a call to regulate the amount of time that a sow spends in
an individual sow stall, with the ultimate objective being the complete phasing out of
individual confinement. The 2010 review of the Animal Welfare (Pigs) Code of
Welfare states that after December 31st 2012 a sow will be limited to a maximum period
of 4 weeks in an individual stall following mating. The National Animal Welfare
Advisory Committee (NAWAC) states that the use of individual sow stalls should
eventually be phased out entirely in New Zealand, but only when key criteria can be met
(NAWAC 2010). These criteria include the availability of alternative technology, in
addition to management systems which deliver better welfare outcomes overall, at a
practical and economic cost that enables New Zealand producers to remain competitive
in the international market (NAWAC 2010). Consequently, after December 2015, sows
and gilts must not be confined in a stall after mating. It follows that the advantages of

23
current systems should be retained while solutions should be sought to overcome the
problems that have been identified.
Public concern about how sows are housed most often relates to restrictions on a sow’s
freedom of movement. Individual housing in stalls does not conform to what may be
observed in a semi-natural environment. However, there is little evidence to suggest that
being housed in a stall is, by itself, aversive to sows provided that there is visual and
other contact with other animals (Rhodes et al. 2005). Research indicates that generally
accepted measures of physiologic stress are similar for sows housed in individual stalls
and in group pens (Barnett et al. 1987a; Barnett et al. 1989; Tsuma et al. 1996), and that
no differences in serum cortisol concentrations were evident between sows housed in
stalls and those housed in group pens.
Dry sow stalls manage the negative aspects of hierarchical aggression including the
potentially detrimental effects on the welfare of individuals and on embryonic and fetal
survival as a result. In addition, stalls enable the individual management of nutrition,
health, hygiene and social stress in the first critical weeks of pregnancy. These benefits
need to be balanced against any costs associated with restriction of movement and
behavioural limitations. Alternatives to sow stalls exist; however, it must be recognised
that in terms of welfare and productivity there is no perfect system. Regardless of the
production system that is in place, there will be inherent problems and specific risks to
the welfare status of the animals involved. The degrees to which these problems
manifest are primarily determined by the extent that stockhandlers properly manage any
such problems. A thorough understanding of the nature of dry sows when grouped
together must precede any such system being adopted. A transition into group housing
systems in the absence of adequate knowledge and skills may unintentionally negatively
influence sow performance, health, and welfare.
The perception that housing systems can be classified as either stalls or group pens is
overly simplistic. In considering different sow housing options, there may be in excess
of 72 different permutations regarding group housing systems (Gonyou 2005). These

24
permutations include varying group sizes, stocking densities, feeding systems and
feeding methods, bedding type and flooring types, manure handling facilities, group
management, behavioural and disease management, in addition to several other features
(see Figure 2). The lack of a ‘standard system’ of housing within the industry accounts
for the variation regarding the inherent positive and negative features that are evident
across different farms within the country. This makes a direct comparison of alternative
systems difficult, however the salient features that make a production system succeed or
fail can be identified.
As experimental results accumulate, it is clear that each feature of a housing system will
have both advantages and disadvantages in terms of animal welfare as well as
productivity and profitability. The other mitigating factor concerning housing design is
that, once combined, not all combinations of different features included in a housing
system will result in a successful outcome. Approximately 37 characteristics of housing
systems that relate to sow welfare have been identified (Gonyou 2005). It has been
proposed that weighting factors be attached to these characteristics in an effort to rank
and compare different systems. These weighting factors would, however, be dependent
on value judgements made by those setting them, and would invite considerable
criticism.
Furthermore, selecting a housing system for gestating sows based on a single welfare
issue (such as freedom of movement) has the potential to lead to other compromises to
animal welfare as new issues arise or other issues are exacerbated. It is clear that no
single ‘optimal’ or ‘ideal’ housing system has been developed. Possible reasons for this
are that the majority of studies have not used a holistic approach in evaluating the
relative suitability of differing systems. Such studies may compare systems without
considering all of the features within those systems that can influence how a sow
responds to and interacts with the environment (Salak-Johnson and Curtis 2007).

25
Figure 2: Factors involved with the design and management of housing sows and gilts in groups (from Levis 2007).
Number of animals per pen
Size of animals per pen
Floor space per animal
Type of flooring: Total slats Partial slats Solid concrete Bedding
Thermal comfort: Heating system Ventilation/Cooling system Use of mould-free bedding
Height of pen partitions : Vertical bars Horizontal bars
Composition of group: Stable Dynamic (frequently changing)
Reproductive performance
Capital and operating cost
Establishing of “hospital” area: Lame and injured sows Sick sows Non competitive sow
Aggression:
Time and method of mixing Time and method of feeding During daily activity of animal
Method of watering animals: Animals per drinker Type of drinker
Time and method of mixing: At weaning Immediately after breeding At 35 to 42 days of gestation Rate of morbidity & mortality
Method of feeding: Mechanical Non-mechanical Floor feeding Dump feed in a pile Dump with spinner to spread
feed Individual feed drops Interval feeding Trickle feeding Locked feeding stall Unlocked feeding stall Self-locking feeding stall Electronic sow feeder
Urination & defecation area
Eating area
Boar housing area
Skill and attitude of staff
Geographic location
Genetic composition of sows Temperament of sows
Complexity of accomplishing work
tasks: Oestrous detection Artificial insemination of sows
& gilts Natural mating of animals Moving animals Feeding animals Treating sick animals Use of pregnancy detection
device Daily observation of animals Locating a specific animal
Ease of overall management

26
A computer model has been designed to evaluate the welfare of pregnant sows in a
variety of housing and management systems. The SOWEL model (Bracke et al. 2002)
identifies and assigns a weighting factor to welfare-relevant attributes of housing
systems in relation to a sow’s needs (categorised as feed intake, thermoregulation,
elimination, exploration, rest and locomotion). This model encompasses 15 different
housing systems and weighting factors for 20 attributes (see Table 4). This model was
validated by comparing the model calculations with expert opinions that were attained
through a questionnaire distributed to 29 pig welfare experts. Both the welfare scores
and weighting factors that were assigned by the model correlated significantly (P<0.05)
with expert opinion.
Using the SOWEL model, welfare is assessed based on the biological needs of the
sows. Each need is assessed using welfare-relevant attributes (measurable properties) of
the housing system. These attributes may be animal-based, environment-based, or
management-related. Other studies have collected data from different farms, and
compared the productivity and welfare of sows housed in different systems. Kongstead
(2006) chose 14 herds that represented different layouts and management practices
when investigating the relationship between reproductive performance, feed intake, fear,
and stress in group housed pregnant sows. This was to ensure that correlations found
could be linked to different systems. Data was collected on each experimental sow (553
sows in total), which were randomly chosen in the lactation unit on the day of weaning.
Data included the weaning date, the dates of first service and re-mating for sows that
returned to heat after first service, the farrowing date, the number of piglets born and the
date and reasons for culling.

27
Table 4: Weighting factors for 20 welfare-relevant attributes ranked according to the weighting factors calculated by the SOWEL model (scale of 1-10) and compared to expert opinion (from Bracke et al. 2002).
aThe median weighting factor given by the experts (n=22). bFriedman mean ranks and significant differences from the Friedman multiple comparisons test (Model vs. Experts) using data from all experts who did not have missing values (n=19). cAttributes that do not share a single letter differ significantly (P <0.05)
It was found that the percentage of re-mated sows varied from 0% to 45% and the
percentage of culled sows from 0 to 12% across farms. The percentage of gilts varied
from 3-50% between herds, and this may be responsible for the large range in the
percentage of re-mated sows after first post-weaning service.
5.1. Indoor Group Housing
Several advantages have been reported in terms of animal welfare when sows are
housed in group accommodation. These include:
Attribute Model Expertsa Friedman mean rankb
Friedman multiple
comparisonbc
Space per pen 10.0 8.00 13.42 wxy Health and hygiene status 9.06 8.57 13.68 wx Exposure to cold 8.21 5.00 8.32 xyz Foraging and bulk 8.11 7.89 15..29 w Social stability 7.45 7.14 13.66 wx Social contact 6.60 8.94 15.82 w Food agonism 6.23 7.89 14.58 wx Rooting substrate 5.09 7.57 13.37 wxy Synchronisation 3.96 5.00 9.00 wxyz Water availability 3.77 8.54 15.79 w Separate rest and elimination areas 3.40 5.00 8.95 wxyz
Scratching 2.74 2.36 5.32 z Resting comfort 2.26 5.00 9.32 wxyz Air quality 2.26 5.63 10.05 wxyz Food palatability 1.23 3.17 6.21 z Movement and comfort 1.13 7.14 13.21 wxy Nest building (resting) 1.13 2.68 6.55 yz Visually isolated areas 0.28 3.75 6.55 yz Light 0.19 3.88 5.66 z Wallowing 0.00 1.38 5.26 z

28
Greater freedom of movement;
Individual choice among available microenvironments (Salak-Johnson and
Curtis 2007);
More opportunity for social interactions;
Improved cardiovascular fitness (Marchant et al. 1997);
Improved muscle weight and bone strength (Marchant and Broom 1996);
Decreased morbidity (Tillon and Madec 1984);
Less abnormal behaviour (Broom 1983).
The benefits of group housing systems largely depend on group structure. The use of
large dynamic groups has been reported to be more cost-effective when combined with
electronic sow feeders to ensure accurate feed rationing. This configuration allows
greater space per sow. However, the regular changes to the composition of large
dynamic groups is associated with high levels of aggression. The successful functioning
of large dynamic groups may be attributed to the utilisation of subgroup behaviour
(Edwards et al. 1993), thus establishing spatially separate territories and socially stable
relationships between subgroup members (Durrell et al. 2003). This may be achieved by
pre-mixing small groups of sows in order to establish stable social relationships with
each other prior to their introduction into the larger dynamic group. Clearly the
emphasis upon which skills of the operators and stockmen are most important will vary
across different systems. In group housing operations, the three key skills for
maintaining sow performance in a group system are as follows:
The ability to identify sows in the group that are unable to compete with others
or have been injured, in order to provide extra care;
Taking appropriate actions to look after the sows that are unable to fully
compete or adapt in these systems;
Undertake suitable handling techniques for sorting individual animals from a
group, to eliminate animal stress and the potential for human injury.
Space allowance also influences the success of a group system. There is a need for a
balance between the efficient use of space and the provision of enough space to enable

29
escape behaviour and segregation of the pen into microenvironments that allow separate
eating, dunging and sleeping areas. A study investigating the effect of differing space
allowances in group housed gestating sows observed differences in litter traits, sow
body condition, and lesion scores with varying treatments (Salak-Johnson et al. 2007).
These traits were analysed at different stages; the first two weeks after mixing (phase 1)
and weekly throughout the duration of the study (phase 2) measured over two
consecutive farrowings. Sow body condition score (BCS) was affected by floor space,
with sows in pens at either 2.3 or 3.3 m2 floor space per sow having greater BCS than
sows at 1.4 m2 (Salak-Johnson et al. 2007). Sows in pens with 1.4 m2 floor space
consistently had higher body lesion scores than sows with greater space allowances.
Body lesion scores increased substantially during the first 10 to 13 days of the
observations (phase 1), although once the scores had plateaued they remained relatively
stable throughout the experiment.
Sows that are familiar with each other upon introduction to a larger dynamic group tend
to remain as a subgroup after addition, staying in close association away from other
sows in the larger group (Durrell et al. 2003). However, it was observed that sows
which were previously unfamiliar to each other but introduced to an established group
at the same time tend to form a separate subgroup and spend more time engaging in
social and lying behaviour together (Durrell et al. 2003). Furthermore, sows remained in
these subgroups for several weeks or months following their introduction into the larger,
pre-existing group (Moore et al. 1993; Spoolder 1998; Stolba and Wood-Gush 1984).
Regardless of whether the sows were pre-mixed or previously unfamiliar with one
another, the findings suggest that sows that are introduced simultaneously to an
established dynamic group of sows will form a separate subgroup.
However, behavioural differences were apparent regarding the frequency of agonistic
behaviours within the subgroups of newly-introduced sows. Aggressive interactions
only occurred in the pre-mixed subgroup during the second week of introduction to the
dynamic group. Conversely, more attacks took place between the previously unfamiliar
subgroup members in weeks 1, 3 and 5. This suggests the sows that were unknown to

30
one another when introduced simultaneously were less socially stable as a subgroup
(Durrell et al. 2003).
5.1.1. Productivity of Indoor Group Housed Sows
The reproductive performance of a sow is often one of the primary indices used to
determine whether a system is productive. Some studies have shown greater
reproductive performance of sows in groups compared to those in stalls (Lammers et al.
2007), whereas others have found that reproductive performance is similar for sows
either in groups or in stalls (Salak-Johnson et al. 2007). Yet more observations have
found greater reproductive performance in sows that gestated in stalls as opposed to
those that gestated in groups (Bates et al. 2003). Gonyou (2005) found that grouping
sows prior to implantation reduced farrowing rates by 5% compared with farrowing
rates of sows that were grouped after implantation. The same study found that overall
productivity (farrowing rate and litter size) was reduced among sows that were grouped
prior to implantation, whereas productivity did not differ between sows housed in stalls
and those grouped after implantation.
Barnett and Hemsworth (1991) found that in 15 studies that were reviewed, 8 showed
better reproductive performance in group-housed sows, whilst only 4 showed better
reproductive performance with individual housing. The conflicting results that are
apparent in the literature may be demonstrative of the observation that the physiological
and welfare requirements of the sow change over time. This has been recognised
through the adoption of management practices that utilise different forms of gestation
accommodation at critical stages of the reproductive cycle, particularly during mating
and early pregnancy.
In another study, there was an apparent strong effect of space allowance per sow and
subsequent litter size (P = 0.001) (Salak-Johnson et al. 2007). A total of 152 sows were
measured at one farrowing, followed by 65 of these sows at the successive farrowing

31
(with 6 replications). Treatment groups of 5 sows per pen were assigned to 1.4m2per
sow, 2.3m2 per sow or 3.3m2 per sow. Additionally, 5 sows were housed in stalls for
the entire pregnancy, with a floor space allowance of 1.34m2. Sows in pens at 3.3m2 per
sow farrowed more piglets per litter than sows in any other treatment, although the
number of piglets weaned per sow was similar among treatments. Litter weaning weight
and piglet birth-to-weaning weight gains were affected by gestation floor space.
Weaning weight was greater in litters born to sows that gestated in stalls. Litter weaning
weight was similar for litters from sows kept in groups regardless of space allowance.
Litter size is predominantly determined by the degree of embryonic mortality in early
pregnancy (Spoolder et al. 2009). Several aspects of a sow’s housing environment may
influence embryo mortality and subsequent litter size. This may include nutrition before
and during early pregnancy, and whether the sow is subjected to stress during early
pregnancy. Clearly, in a group housing system, the techniques employed in the
management of the sows at different stages of the reproductive cycle are the key to
achieving levels of productivity that are comparable to sows kept in stalls, where
individual attention and care is possible.
5.2. Outdoor Systems
Outdoor systems offer a more diverse, enriched environment in addition to greater
behavioural freedom. Outdoor ‘free range’ systems are often perceived as having higher
standards of welfare as well as being a more ethical form of pig production. Contrary to
popular perception, these systems are not without their welfare risks. In New Zealand,
approximately 40% of breeding sows are housed outdoors. Such systems generally
comprise fenced paddocks containing communal shelters to accommodate groups of
gestating sows, in addition to individual huts or ‘arcs’ which house farrowing and
lactating sows. The location of an outdoor pig production system is critical, as
unsuitable sites may lead to poor welfare. As such, areas of low annual rainfall with flat,
low-contour, free-draining paddocks are more suited to outdoor systems. If the ground

32
conditions become poor as a result of high rainfall and unsuitable soil type, animal
welfare may be seriously compromised (Edwards 2005).
Outdoor production systems generally have lower set-up costs, higher operating costs,
and slightly lower productivity than intensive indoor systems. This is largely the result
of a greater potential for feed wastage, lower feed utilisation efficiency, and a greater
labour input. It follows that an outdoor production system is exacting in terms of the
physical requirements, site, labour and management. Lower productivity and higher
veterinary and labour costs may however be counterbalanced through a reduction in the
costs associated with housing, heating and other equipment.
Adequate management is the key to preventing the majority of identified risk factors
with a low stocking density per hectare, regular paddock rotation, shade areas and
portable housing (Edge et al. 2007). Maintenance energy requirements of outdoor pigs
are generally greater than those housed indoors, as there is less control of the climatic
environment. Increased energy requirements will also be a consequence of higher levels
of physical activity associated with a larger space allowance that enables exploratory
activities. At high ambient temperatures the voluntary feed intake of sows can be
depressed, with the consequence being live weight loss, and a potential incapability to
meet the requirements for high production (Edwards 2005). Outdoor housed sows had
higher rectal temperatures and exhibited greater temperature variation when compared
to indoor housed sows (Barnett et al. 1999), suggesting that outdoor pigs may have
challenges with achieving adequate thermoregulation.
Outdoor conditions are not suitable for every breed. The aforementioned problem of
increased energy requirements for maintenance and a lack of control over the
environment make an outdoor situation less appropriate for the commercial ‘white’
strain of pig. Physical reasons for this include relatively low subcutaneous fat (and thus
poor insulation from low temperatures), and greater susceptibility to sunburn due to a
lower amount of skin pigmentation. Selection of crossbred stock with some skin
pigmentation ensures the herd is more robust in an outdoor environment. Conversely,

33
generations of genetic selection that has focused on breeding pigs of a high lean muscle
percentage and low fat percentage makes such pigs less efficient in an outdoor
production system. The maintenance requirements of a lean genotype are higher than a
genotype that has a greater proportion of fat. Thus, pigs that have the genetic potential
to thrive in the conditions provided should be preferentially used.
Another significant issue is the higher parasite burden of outdoor pigs, which leads to
poorer nutrient utilisation and reduced feed utilisation efficiency (Edge et al. 2007).
This may be controlled to a certain degree through grazing management and leaving
paddocks unoccupied for several months. Biosecurity is also an issue, given that there is
limited control over the environment in which the sows live, and there is a risk of
contact with other species that may act as disease vectors. Maintaining large populations
of pigs outdoors has been associated with increased biosecurity risks in regard to the
spread of disease epidemics (Edge et al. 2007). This was illustrated by a suspected
outbreak of Post Weaning Multisystemic Wasting Syndrome (PMWS) in Canterbury
where wild birds were implicated in the rapid spread of the disease throughout the
outdoor pig population (Edge et al. 2007).
Behavioural observations of outdoor-housed sows have highlighted specific patterns of
behaviour that have been described as redirected foraging behaviour which manifests as
stone chewing. This activity is thought to be a stereotypical behaviour, and is observed
in pigs that are kept in paddocks without plant cover. Stone chewing is likely to be a
coping mechanism in the event that foraging behaviour is thwarted in barren or bare
earth paddocks. As such, it is thought to be induced by boredom, and it may indicate
that stone chewing is a possible sign of reduced welfare which may arise as a result of
limited access to resources or stimuli (Studnitz et al. 2003). Furthermore, Braund et al.
(1998) suggested that just as bar biting behaviour appears more often in hungry sows,
stone chewing may be an analogous behaviour as it is often observed more in hungry as
opposed to satisfied sows.

34
An additional welfare issue that concerns outdoor sows is the practice of nose ringing.
This is a husbandry procedure that is carried out to reduce the extent of pasture damage
caused by rooting. Normal exploratory behaviour cannot be expressed by nose-ringed
sows, as the location of the ring is specifically intended to cause pain and discomfort
when the sow attempts to dig and root. Furthermore, nose-ringing may lead to thwarted
behaviour and compromised welfare as the sow is surrounded by stimuli that would
elicit normal oral-nasal-facial (ONF) exploratory behaviour whilst being prevented from
performing this behavioural repertoire. Ringing itself can be a source of considerable
pain and distress, particularly if wire rings are regularly lost and replaced (FAWC
1996). The provision of bedding, in addition to faster paddock rotation and improved
pasture management may be an alternative to nose-ringing.
5.2.1. Productivity of Outdoor Housed Sows
Given the highly variable environment that outdoor sows are subjected to, it is not
surprising that the productivity of outdoor housed sows is equally inconsistent. The
climatic and environmental circumstances, in addition to the suitability of the farm
location, pathogenic pressure, hut design and profitability are all closely interrelated.
Thus, failure to meet the unique requirements of an outdoor pig herd can result in high
pig morbidity and mortality, in addition to poor productivity and financial losses (Akos
and Bilkei 2004).
Table 5: Reasons for culling and percentages of sows culled in outdoor and indoor farms (From Akos and Bilkei 2004).
Reason for Culling Indoor Outdoor P Anoestrus 16% 29% <0.05 Locomotor Problems 25% 39% <0.05 Swine Urogenital Disease 26% 14% <0.05 Periparturient Diseases 26% 12% <0.01 Heart Failure 22% 6% <0.01 Miscellaneous 11% 12% NS

35
Outdoor sows have been shown to have a shorter longevity in the herd (3.01 ± 0.27
parities) when compared to indoor sows (4.52 ± 0.54 parities) (P<0.01). Table 5 shows
the principal reasons for culling in both indoor and outdoor farms. However, it appears
that some sows may have been culled on the basis of more than one of the reasons
mentioned in Table 5, given that the values in both the indoor and outdoor columns add
to more than 100%. In another study, the annual culling rate was 39% in indoor and
45.2% in outdoor units (Karg and Bilkei 2002). The same study also found greater
longevity in indoor sows, where the average parity at death was 3.6 compared to 2.5 in
outdoor herds. In comparing the lifetime performance of indoor and outdoor sows,
there were significant differences in the number of non-productive days and the lifetime
cumulative counts of pigs weaned (Table 6).
A study conducted by Akos and Bilkei (2004) was based on large Croatian pig
production units (averaging 69 ± 17 SD sows per unit in the outdoor herds and 401 ± 39
SD sows per unit in the indoor herds). As can be seen in Table 6, there is a significant
difference between the mortality rates of piglets between the outdoor (12 herds) and
indoor (21 herds) units.
Table 6: Lifetime performance of indoor kept sows (mean ± SD) (from Akos and Bilkei 2004).
Outdoor Indoor P Parity at removal 3.01 ± 0.27 4.52 ± 0.54 <0.01 Non-productive sow days (%) 34.9 ± 5.0 12.9 ±1.4 <0.001 Average annual sow mortality rate 5.8 ±1 .1 8.9 ± 2.1 <0.05 Lifetime cumulative counts of total pigs born 36.1 ± 2.0 54.1 ± 4.2 <0.01
Lifetime cumulative counts of pigs born alive 33.2 ± 1.1 49.3 ± 3.3 <0.01
Lifetime cumulative counts of pigs weaned 19.4 ± 1.2 41.2 ± 3.1 <0.001
Herd days 561 ± 13 659 ± 21 <0.01
Outdoor units experienced an average preweaning piglet mortality of 41.6%, compared
to indoor units at 16.4%. During this study it was observed that the majority of pre-
weaning deaths occurred in the perinatal period, as during hot summers (ambient
temperatures > 30° C) the sow’s lactational performance was impaired. At these

36
temperatures, there is also a low conception and farrowing rate and increased embryonic
mortality (Bilkei 1995). These effects on reproductive function and piglet mortality are
also seen during winter, where high piglet losses were registered when the average
weekly minimum temperature dropped below freezing (Akos and Bilkei 2004).
A recent sample of New Zealand outdoor herds in 2009 were used to illustrate the
differences in performance data between outdoor (12 herds) and indoor (36 herds)
housed sows (see Table 7). This data highlights a difference between the two systems,
as well as a difference when compared to overseas production records shown in Table 6.
Preweaning piglet mortality was higher in the outdoor sows at 20.1% compared to
14.1% in indoor housed sows. However, the sow replacement rate and death rate was
higher in the indoor sows. The outdoor sows had a greater number of non-productive
days, which was seen in overseas data shown in Table 6.

37
Table 7: Production data from indoor and outdoor sow herds in New Zealand mid 2009 (from PVS, Canterbury Outdoor Pork Production Seminar proceedings 2010).
Average Indoor Average Outdoor
Number of Herds 36 12 Repeat services (%) 11.6% 12.8% Avg. Weaning to first service interval 6.20 5.23 Sows bred by 7 days (%) 91.8% 96.5% Average gilt age at first service 228 213 Average total born per litter 12.88 12.76 Average born alive per litter 11.73 11.68 Average born dead per litter 0.95 0.99 Born dead as % of total born 7.3% 7.8% Born mummified as % of total born 1.75% 0.78% Average parity for sows farrowed 3.59 4.24 Average gestation length 114.9 115.7 Farrowing interval 152.5 152.2 Litters farrowed / mated female / year 2.27 2.24 Total born / mated female / year 29.27 28.58 Average pigs weaned / sow weaned 10.08 9.33 Average weaning age 26.0 25.9 Pre-weaning mortality (excl. Fosters) 14.1% 20.1% Pigs weaned / mated female / year 22.90 20.94 Female replacement rate 48.8 43.4 Female death rate 8.3 5.1 Average parity of females culled or sold 4.61 4.93
Average parity of female inventory 2.59 3.45 Avg. Non-productive days /mated female/year 46 51
5.3. Gestation Stalls
Historically, as the average pig herd increased in size, it became apparent that the work
of managing all aspects of pig production was physically challenging and inefficient.
Managing a large number of pigs at different stages of gestation and lactation outdoors
or in unsuitable areas was a contributing factor that led to the move indoors (Curtis et al.

38
2009). Once sows were moved inside, there was a logical progression to develop
systems that increased the utilisation of available building space by defining the
minimum space that could accommodate one sow. Thus it was the desire to avoid
climatic extremes, followed by a need for parasite and disease control, manure
management and an increase in the efficiency of production that led to the introduction
of individual indoor accommodation of dry sows. The efficacy of this system was
illustrated by the exponential increase in its use, and reflected a newfound ability to
effectively overcome numerous production issues in an economical way (Curtis et al.
2009).
As discussed in the first section, an overall animal welfare assessment generally
encompasses several measures of welfare that originate from various scientific disciples
including animal behaviour, physiology, animal health and productivity. Thus, it is
difficult to compare different housing systems with one another and identify which
system is better or worse. Individual stalls are designed to accommodate a sow’s static
space requirements (as opposed to the dynamic space requirements)-that is, the amount
of space used by the sow when she is standing or lying stationary. As such, salient
aspects of a sow’s natural behaviour repertoire are prevented in this system.
Nevertheless, there are several advantages to the use of dry sow stalls, as individual
housing of gestating sows in stalls allows the caretakers to effectively observe and
access the individual sows. The treatment, vaccination and routine husbandry practices
that directly influence the sow’s health and welfare are much more effectively managed
without risking injury to the caretaker.
The primary purposes of gestation sow stalls include (Barnett et al. 2001):
Control over individual feed intake;
Preventing the sow from turning around and defecating and urinating in the
feeding area;
Preventing fighting and aggression;

39
Containing manure;
Providing better control of the sow whilst protecting the caretaker during
examination;
Facilitating insemination or treatment;
Optimising efficiency of building space.
Furthermore, most research to date has indicated that generally-accepted physiologic
measures of stress are similar when comparing sows housed in individual stalls
throughout gestation with those in group pens. It has been concluded that stall housing
is no more physiologically stressful to sows than group housing (Curtis et al. 2009;
Rhodes et al. 2005).
Whilst it would appear that there is little or no difference in the level of stress
experienced by sows in stalls relative to those in groups, there are physical injuries and
lesions that occur more frequently in sows kept in gestation stalls. Overgrown hooves
are associated with inadequate walking on sufficiently abrasive floor surfaces. Impaired
mobility can lead to lameness, arthritis and joint problems. Decreased leg muscle
weight and bone strength were observed in sows kept in stalls for the entire duration of
gestation relative to those kept in groups (Marchant and Broom 1996). Sows culled for
foot and leg problems make up a large proportion of all culled sows, however such
injuries are related more to the design of the stall, particularly the flooring, as opposed
to the management of the sows. A greater incidence of decubitus ulcers has been
reported in stall-housed sows, particularly at the shoulders and legs where regular
contact is made with the floor and sides of the stall. Several risk factors have been
identified relating to the development of shoulder ulcers in sows, which were noted
whilst observing sows in farrowing crates (Zurbrigg 2006). Sows with a body condition
score (BCS) of less than 3 at weaning were 3.7 times more likely to develop a shoulder
lesion than those with a BCS of 3 or higher, and low flank measurement (97 to 104
centimetres) increased the risk of developing a shoulder lesion by 2.8 times (Zurbrigg
2006).

40
5.3.1. Productivity of Sows in Gestation Stalls
Sow performance has previously been reported as being greater in sows that gestated in
stalls than in groups (Peltoniemi et al. 1999; Kongsted 2005; Karlen et al. 2007). There
have been observed differences in the reproductive parameters of sows housed in stalls
throughout gestation when compared to those kept in groups. However, much of the
data suggests that there is no significant housing effect on litter size or litter weight at
birth (Karlen et al. 2007), or the total number of pigs weaned per litter (Salak-Johnson
et al. 2007). The farrowing rate has been observed to be higher in stalled sows in some
studies, with the higher rate of reproductive failure in group housed sows, primarily due
to a greater incidence of regular and irregular returns to oestrus (Karlen et al. 2007).
Salak-Johnson et al. (2007) found that there was no treatment effect for the litter size,
number born alive per litter, number weaned per litter and total weight of the litter at
birth when comparing sows in stalls and groups of varying space allowances throughout
gestation (Table 8). These findings were also similar to those reported in Harris et al.
(2006). Piglets from sows that gestated in stalls had heavier weights at weaning, and
tended to gain more weight from birth to weaning. This is in agreement with another
study where piglets from sows that gestated in stalls were heavier at weaning (Bates
2003).
The results in Table 8 are based on 152 sows measured at one farrowing and 65 sows
measured at the successive farrowing; giving a total of 217 farrowing records over four
gestation treatment groups. The average number of total piglets born in the 3.3m2
treatment (14.2 ±0.56) is significantly higher than all other treatments, however the
number of pigs born alive and the number weaned was similar among treatments.

41
Table 8: Litter-related traits for sows kept in pens at various floor space allowances or individual stalls throughout gestation (LSM± SE) (adapted from Salak-Johnson et al. 2007).
Measure Gestation Treatment P-value
1.4m2
(n=55) 2.3m2
(n=55) 3.3m2
(n=56) Stall
(n=51) Floor space
Total born (No.) 12.4 ± 0.57b 12.0 ± 0.60b 14.2 ± 0.56a 11.1 ± 0.52b 0.001
Born alive (No./ litter) 10.0 ± 0.44 9.5 ±0.49 10.5 ±0.42 9.4 ± 0.57 0.25
Weaned (N.o/ litter) 8.6 ± 0.26 8.1 ± 0.26 8.8 ± 0.34 8.7 ± 0.35 0.17
Litter BW (kg) 15.7 ± 0.71 15.2 ±0.70 16.6 ± 0.64 15.0 ± 1.1 0.40 Litter wean
BW (kg) 50.2 ± 1.8a,b 45.5 ± 1.6b 49.5 ± 1.8a,b 52.4 ± 1.4a 0.02 a,bWithin a row, values without a common superscript letter differ (P<0.05)
Given that all sows were mated in stalls and moved to their respective treatment groups
after being confirmed pregnant at 25 days post-breeding, there was no difference
between groups in terms of the housing system used for mating. There is no explanation
offered by the authors as to why higher litter sizes were observed in the sows that were
kept at a space allowance of 3.3m2. It is also worth noting that whilst the number of
pigs weaned does not differ between treatment groups, these values are low by New
Zealand standards where the minimum target for the average pigs weaned per litter
weaned is 9.5 (EliteHerd 2007).
The performance of stall housed dry sows was found to be no different to that of sows
housed either in free-access stalls, in groups with electronic sow feeders, or in groups
with trickle feeding systems (Backus et al. 1997). There were no significant differences
between treatments for the percentage of non-returns, the number of live born piglets
per litter or the number of piglets weaned per sow per year.
Table 9 summarises the findings of five papers that looked at the difference in
reproductive parameters when sows were housed in either stalls or groups during
gestation. It can be seen that in each study, the farrowing rate of stalled sows was higher
than grouped sows. Total piglets born and pigs born alive did not differ significantly
between studies or within each study for different treatments.

42
Table 9: Effect of gestation housing system (stalls vs. groups) on reproductive performance in sows.
McGlone et al. 2004* Nielsen 1995 Anil et al.
2005 Karlen et al.
2007
Hulbert and McGlone
2006 Stall Group Stall Group Stall Group Stall Group Stall Group
Number of sows - - 1450 984 176 206 320 320 80 80
Farrowing rate (%) 83.3 75.9 92 86.8 81.8 74.8 76.8 66 68.8 66.2
Total born 10.5 10.8 12.6 12.2 10.9 10.8 11.2 11.1 11.1 10.9 Born alive 9.9 9.9 11.6 11.3 9.4 9.1 10.1 10.2 10.0 10.2 Weaned - - - - - - 8.3 9.0 8.5 8.4 Stillborn
(%) 0.58 0.73 - - 0.94 0.92 0.7 0.6 - -
*Sow number not available as this publication is a summary of results from a meta-analysis of 35 papers
6. Stockmanship
Sound stockmanship calls for the recognition of behavioural signs of fear, anxiety, pain
and distress in addition to other negative emotions or “affects”. As well as identifying
negative aspects of animal behaviour and productivity that may indicate reduced
welfare, it is important to also focus on those that infer that welfare is good. These may
include positive social interactions such as grooming, and overall animal contentedness.
The role of a stockperson, regardless of the housing system used, is to ensure high
standards of animal welfare that is demonstrated through a sound knowledge of the
principles and practices of animal husbandry. As such, the knowledge, skills, abilities
and attitude of the stockperson are integral to the standard of welfare that is experienced
by the animals under their care.
The Farm Animal Welfare Council (FAWC) proposes that there are three key attributes
of a good stockperson that should be considered the essentials of good stockmanship
(FAWC 2007):
Knowledge of animal husbandry: sound knowledge of animal biology, welfare
requirements and physiological requirements of animals;

43
Skills in animal husbandry: demonstrable skills in observation, handling, care
and treatment of animals, in addition to problem identification and resolution;
Personal qualities: affinity and empathy with animals, dedication, patience, and
motivation to expand on current skills.
There are often regular periods of intense contact between pigs and stockpersons,
particularly in regard to breeding sows. Clearly, the attitudinal and behavioural
characteristics of stockpersons will influence the success of any system. Likewise, the
extent to which the stockperson anticipates and manages identified risk factors that are
inherent to a specific system will determine the overall outcome. This applies not only
to profitability, but also in regard to animal welfare and productivity. Stockperson
behaviour has been shown to be strongly related to fear and reproductive performance
in pigs (Hemsworth et al. 1989), and negative handling has been demonstrated to reduce
the pregnancy rate in gilts (Hemsworth et al. 1986). Fear of humans in oestrous sows
reduced their attraction to boars whilst in the presence of humans (Pedersen et al. 2003),
and has been positively correlated to the percentage of stillborn piglets (Hemsworth et
al. 1999), though this was not in agreement with other research (Andersen et al. 2006).
Handling studies in pigs have consistently demonstrated that handling treatments that
elicit high levels of fear will adversely influence animal productivity.
Thus, it may be important to identify specific characteristics that are desirable or
suitable for pig handlers to possess. There appears to be a sequential relationship
between stockperson attitude and behaviour and the level of animal fear, welfare and
productivity. As such, there lies the opportunity to improve animal welfare and
productivity through proper training and selection of suitable stockpersons.
44
7. Summary
There is controversy over the assessment of animal welfare status, as it cannot be
objectively measured. Furthermore, there are three main orientations that address
different aspects of what animal welfare is (Mellor and Stafford 2009). These are:
1. The ‘biological function’ view (i.e. welfare is good when the animal is healthy,
growing, and reproducing well, and good productivity is evident);
2. The ‘affective state’ view (i.e. animals have potential to suffer and have positive
experiences, and that good welfare is present when animals are capable of
adapting or coping without suffering whilst interacting with other animals,
humans, and the environment);
3. The ‘natural state’ view (i.e. welfare may be compromised depending on how far
the conditions in which the animal is kept deviates from the presumed original
wild state of the species, and the extent to which the animal is able to express a
range of natural behaviours).
It follows that there is debate over the relevance of each orientation to an applied animal
welfare assessment. Different interpretations result from an assessment of an animal’s
welfare status because of value-based presuppositions about what is good or bad for
animals. Animal behaviour is an important tool as it is obvious to observe, changes are
rapid, and behaviour in itself is a clinical symptom of disease or injury. It is generally
agreed that the presence of behavioural stereotypies and abnormal behavioural patterns
represent poor welfare. Conversely, it may be that behavioural activities such as
grooming and exploration suggest good welfare. However, an animal’s behaviour is
subject to interpretation and is not an accurate indicator of welfare status on its own.
Sows are aggressive in nature, with a hierarchical social structure. This characteristic is
important to consider in the design and management of dry sows, as the level of
aggression that a sow is subjected to will ultimately influence performance and welfare.
Mixing aggression is particularly significant in group housing operations, and as such,

45
sows should be managed in a way that minimises the potential for injury. Keeping sows
in static groups at group sizes that encourage the formation of subgroups is
recommended above the use of dynamic groups. Another important consideration is the
timing of mixing of unfamiliar sows relative to the stage of gestation. This is critical to
ensure the completion of the maternal recognition of pregnancy and embryonic
implantation before the sow engages in aggressive interactions with other sows.
The chosen housing system can influence the level of stress that a sow will experience,
which may have detrimental effects on the animal’s welfare and productivity. Limited
access to resources and the inability to perform behaviour that has a strong motivational
drive can alter the sow’s physiology. This may lead to activation of the HPA axis and
elevation of corticosteroids. Stress can result in behavioural abnormalities and anxiety,
and has been shown to interfere with normal reproductive function in female pigs.
The productivity and welfare of pigs varies in each production system, be it stalls,
groups, or outdoors. There are approximately 72 permutations when considering the
design of a housing system for dry sows. Assessing the suitability of a housing system
for gestating sows by basing it on a single welfare issue has the potential to lead to other
compromises to animal welfare as new issues arise or other issues are exacerbated.
Adequate management that addresses the weak points in a particular system, in addition
to skilled stockmanship, are the key. The New Zealand codes of welfare reflect this
through their format, in that these codes are based on a system’s outputs rather than
inputs. Thus, those responsible for the welfare of the animals concerned are aware of
what the result should be, regardless of the action that is taken to achieve the required
result.

46
The main points are summarised as follows:
There are three main orientations used to describe an animal’s welfare status
(biological function, affective state, natural state) and this is a source of debate
over defining ‘animal welfare’.
Animal behaviour is an important component of a welfare assessment as it is
obvious to observe, changes in behaviour are rapid, and behaviour is a clinical
symptom in its own right.
Grouped pigs have a hierarchical social ranking that is determined through
aggression and fighting. This warrants consideration in the design and
management of dry sow housing.
Physiological stress has been shown to delay the onset of oestrus, suppress
oestrus activity and disrupt reproductive function in female pigs.
Environmental, social and nutritional disturbances during early pregnancy can
have detrimental consequences for embryo development and survival. Hence the
timing of grouping sows after mating is an important consideration.
Progesterone has a demonstrable calming effect that influences sow behaviour.
Sows are more aggressive in the period after weaning and immediately prior to
farrowing when progesterone concentrations are low. Progesterone is elevated
and remains at a constant level after the fourth week of pregnancy. This has
previously supported the use of individual gestation accommodation until this
stage of pregnancy to minimise the effect of aggression.
There is a multiplicity of combinations and factors involved in dry sow housing.
The benefits of group housing largely depend on the group structure, the space
allowance, feed delivery system, and the management of aggression.
Outdoor systems are perceived by the public as offering the best welfare.
However, there are specific risk factors associated with an outdoor operation,
therefore adequate management is critical. Outdoor climatic conditions cannot
be controlled and are more of a challenge in terms of achieving an optimal
environment.

47
Gestation stalls offer superior control over the sow’s environment and individual
management. Nonetheless, the lack of mobility and the inability to express
strongly motivated behaviours is a related concern.
Ultimately the success of any system is dependent on the stockpersons involved,
through ensuring high standards of animal welfare, and demonstrating the
knowledge, skills attitude and behaviour that befits the chosen housing system.
A host of systems currently used to accommodate sows are converted facilities
that originally had different uses, and therefore often have pre-existing weak
points.
There is no perfect or ideal system for keeping dry sows, as throughout different
stages of the production cycle, a sow’s needs change. Therefore the implication
is that in any housing system, both the advantages and disadvantages relating to
a sow’s welfare will also change over time. In light of this, operators need to
understand the system and how best to manage them.

48
2. MATERIALS AND METHODS
Commercial pig farms were chosen to represent the spectrum of different layouts and
management practices to obtain data from a range of different systems. Twenty
commercial herds (farrow-finish) were selected from those registered with the New
Zealand Pork Industry Board. Herd sizes varied form 120-1100 sows. Data concerning
housing, management, sow behaviour, welfare and productivity was collected during
one on-site visit per herd, and related to the breeding sow population of each farm.
Observations were limited to the dry sows and their accommodation from post-weaning
to pre-farrowing.
Housing and management characteristics were collected during the farm visit.
Photographs were taken of the dry sows in their environment to provide a visual record
of each of the systems visited. Production data summarising the last 12 months was
collected from 13 farms. Observations of the sows (20 farms) were recorded during the
visits. These observations fell into categories that related to the behavioural displays of
the sows during the visit, lesion scoring, lameness scoring, and recording the general
appearance of the sows (coat condition and extent of soiling). The on-farm assessment
tool and the farm description survey are presented in Appendix 1 and 2.
Injuries
Sows were observed for signs of injury. At each farm, 15 sows were randomly assessed;
lesion scoring was performed after feeding and before the start of the next feeding cycle
if applicable. Designated anatomical areas of the sow were assessed as illustrated by the
following diagram (Salak-Johnson et al. 2007):

49
Each anatomical region was assigned a score ranging from 0 to 3 (0- no lesions; 1-
dehairing, redness, swelling; 2- abscess, moderate wound, scabbed-over laceration; 3-
marked wound, fresh scratch, severe wound, open wound with discharge).
Appearance
The condition of the coat was evaluated using a random sample of sows (n=5) from five
groups within the dry sow accommodation. These groups were either in separate pens
within one building, or sows that were housed in defined accommodation areas on one
property (e.g. deep litter eco barns, indoors on concrete). Coat condition was evaluated
as a score (where 0- normal; 1-dull, coarse; 2-Poor condition, bald patches, uneven
distribution) that represented the average for each group.
The extent of soiling of the sow with dung was assessed as above, in terms of using a
sample of sows from five groups within the dry sow area. This was evaluated as a score
(where 0- no soiling, 1- minor soiling e.g. tail only, 2- moderate e.g. tail and rear legs,
3- excessive soiling) that represented the average for each group, and was indicative of
the general level of hygiene in the dry sow area.
Lameness
Lameness was evaluated from the sow’s movement and standing posture. In total, 15
sows per farm were randomly evaluated for lameness. This was scored from 0-2 (0- no
lameness, bears weight evenly on all legs 1- mildly lame, abnormal gait or does not bear
weight on all legs, 2- clearly lame, hesitant to walk, uneven weight bearing, limping or
will not stand unaided).

50
Behavioural observations
Behavioural displays were observed at each visit, and are described in Appendix 3.
Behavioural observations were recorded in random sows from five groups within the
dry sow accommodation. These groups were either in separate pens within one building
(where one pen = one group of sows), or sows that were housed in defined
accommodation areas on one property (e.g. deep litter eco barns, indoors on concrete).
Specific behavioural displays included: sham chewing, bar-biting, tongue-rolling,
champing, dog-sitting, head weaving, drinker pressing, feeder/trough interaction,
apathy, and stone chewing. These behaviours are typically described as indicators of
poor welfare. These behaviours were described using a score of 1, 2, or 3 (1: absent, 2:
present in some animals, 3: excessive display/ frequency). Furthermore, other general
behavioural displays were observed that aided in recording the general activity level of
the sows on the day of the visit. These were: vocalising, foraging, rooting, floor/bedding
manipulation, eating, drinking, wallowing, non-aggressive social interaction, resting
(lying with physical contact), grooming, resting (lying without physical contact),
agonistic (attack), and escape/ retreat behaviour. These were described using a score of
1, 2, 3, or 4 representing none, minimal, moderate frequency of display, and very
frequent display respectively.
Behavioural observations were performed whilst the observer moved through the dry
sow areas. These observations were completed over a two hour period on each farm,
after sows had been fed (or between feeding times, in the event that sows were fed more
than once daily). This length of observation allowed for sows to become accustomed to
the observer, given that, at the start of observation, visible presence of the observer may
affect the expression of behaviour. Observations were not performed during feeding
time in order to capture a wider range of behaviours that more accurately represent
typical pig behaviour within each housing system.
Farm scores and Welfare index (WI)
The total farm score was calculated as the combined total scores achieved for each
parameter that was assessed on-farm (injuries, coat condition, soiling, lameness, and

51
behaviour). On each farm, 135 observations were performed, giving a total of 2700
observations across all 20 farms. The minimum possible total farm score was 115 and
the maximum possible score was 970. The total score includes the scores achieved for
‘general behaviour’. As these behavioural patterns are not necessarily indicative of an
animal’s welfare, the on-farm welfare outcome is better reflected in the welfare index
(WI).
A welfare index (WI) was calculated for each farm. The WI incorporated each farm’s
score for lameness, coat condition, injuries, stereotypies, and soiling, thus representing
the net welfare outcome of each farm. General behaviours were not included in the WI
as these were not related to the assessment of welfare, only to the activity levels of the
sows and their interaction within their housing environment. Each parameter included
within the WI was treated as having the same weighting based on their significance for
welfare outcome in terms of the intensity of the experience; thus there is no ranking of
welfare parameters. A low WI corresponded to good welfare, as this signified that there
was a low prevalence of indicators of potential welfare compromise on-farm. Hence, a
high WI signified a greater frequency of indicators of potential welfare compromise.

52
3. RESULTS
The welfare implications of sow housing during gestation are complex. Each housing
system has a different set of contributing factors, and it is not always possible to
identify all contributing factors that are inherent and specific to each system. The data
obtained during this particular study was difficult to analyse. In some cases there are
clear trends between inputs (housing system characteristics) and outputs (sow
productivity, sow welfare). However, as each farm had a quasi-unique set of
contributing factors (Table 10), the data are confounded. As such, data analysis has been
limited to descriptive statistics, through identifying key trends relating to productivity
and welfare in differing housing systems.
In addition to the animal-based observations, each of the 20 farms were described using
five primary categories (group sizes, duration in stalls, bedding, feeding method and
feeding frequency), so differences between housing, management, welfare outcome and
productivity of sows could be evaluated. This is outlined in Table 10, where the
characteristics (relating to gestating sow accommodation) are illustrated for each farm.
From this, it can be seen that there is a large degree of variation between the farms in
terms of the group sizes, whether bedding was used, whether stalls were used (and for
what duration), how sows were fed, and the frequency of feeding.
Performance data
Average productivity was calculated for all farms and is presented in Table 11. This
included average parity (2.75), average parity at removal (5.11), culling rate (41.68%),
sow mortality rate (7.60%), farrowing rate (87.45%), piglets born alive/litter/sow (BA)
(12.56), weaning-mating interval (5.59 days), piglets weaned/sow/year (W/S/Y)
(23.98), and litters/sow/year (L/S/Y) (2.31). The average number of sows per herd was
395.60, whereas the total number of sows observed across the 20 farms was 7,912.

53
Tab
le 1
0: O
verv
iew
of t
he in
tegr
ated
fact
ors p
rese
nt w
ithin
the
preg
nant
sow
acc
omm
odat
ion
on-fa
rm.
Gro
up si
ze (s
ows/
grou
p)
Bed
ding
D
urat
ion
in st
alls
(w
eeks
) Fe
edin
g m
etho
d Fe
edin
g fr
eque
ncy
(24h
r)
Farm
H
erd
size
Spac
e al
low
ance
(m
2 / sow
)
Smal
l (≤6)
M
ed
(≤15)
Lar
ge
(≥16)
Yes
N
o N
o st
alls
1
4 5
5 +
Dry
fe
d flo
or
Liq
uid
fed
auto
Dry
fe
d au
to
Dry
m
anua
l tr
ough
1x
2x
≥3x
n
7 9
4 7
13
7 1
7 2
3 5
10
2 3
8 8
4
1 38
0 3.
78
X
X
X
X
X
2 25
0 2.
61
X
X
X
X
X
3 43
7 2.
33
X
X
X
X
X
4 44
0 2.
50
X
X
X
X
X
5 30
0 2.
61
X
X
X
X
X
6 24
8 2.
50
X
X
X
X
X
7 20
0 2.
40
X
X
X
X
X
8 12
0 2.
38
X
X
X
X
X
9 30
0 2.
38
X
X
X
X
X
10
720
3.41
X
X
X
X
X
11
11
00
2.40
X
X
X
X
X
12
30
0 4.
91
X
X
X
X
X
13
300
4.93
X
X
X
X
X
14
19
2 2.
50
X
X
X
X
X
15
550
2.40
X
X
X
X
X
16
13
0 3
X
X
X
X
X
17
450
outd
oor
X
X
X
X
X
18
950
outd
oor
X
X
X
X
X
19
145
5.40
X
X
X
X
X
20
40
0 5.
40
X
X
X
X
X

54
Tab
le 1
1: S
umm
ary
of so
w p
rodu
ctiv
ity fo
r all
farm
s (n
= 13
farm
s).
W/S
/Y=
wea
ned
per s
ow p
er y
ear,
L/S/
Y=
Litte
rs p
er so
w p
er y
ear,
W/S
/L=
Wea
ned
per s
ow p
er li
tter.
*Mea
n so
ws/
herd
is b
ased
on
20 fa
rms
Farm
N
o So
ws/
herd
M
ean
pari
ty
Mea
n pa
rity
(c
ulls
) C
ull
Rat
e %
M
orta
lity
Rat
e%
Farr
owin
g R
ate
%
Bor
n A
live
Wea
n-m
atin
g in
terv
al
W/S
/Y
L/S
/Y
W/S
/L
Pigl
et
Surv
ival
(%)
1 38
0.00
3.
60
5.99
50
.70
4.30
84
.80
11.2
0 6.
90
21.4
4 2.
19
9.79
87
.41
3 43
7.00
3.
12
6.63
37
.00
17.0
0 77
.70
12.1
0 5.
70
21.7
0 2.
18
9.96
82
.34
4 44
0.00
2.
26
5.00
45
.80
3.80
92
.30
12.0
0 5.
50
24.2
0 2.
47
9.80
81
.65
5 30
0.00
2.
11
3.83
56
.30
6.60
86
.10
13.3
0 5.
20
26.2
6 2.
31
11.3
7 85
.47
6 24
8.00
2.
65
4.84
50
.60
6.50
88
.60
12.3
0 4.
60
20.8
7 2.
16
9.66
78
.55
7 20
0.00
2.
96
5.95
36
.70
5.00
87
.00
12.6
0 5.
90
23.4
0 2.
33
10.0
4 79
.71
8 12
0.00
2.
71
4.79
39
.60
2.40
91
.90
12.8
0 4.
90
25.6
6 2.
28
11.2
5 87
.92
9 30
0.00
2.
30
4.35
23
.00
14.1
0 83
.20
11.7
0 7.
60
22.5
0 2.
27
9.91
84
.72
10
720.
00
2.50
3.
90
38.0
0 10
.00
89.6
0 11
.30
5.40
24
.00
2.30
10
.43
92.3
4 11
11
00.0
0 2.
86
4.56
35
.70
5.90
92
.10
13.1
0 5.
50
25.3
5 2.
39
10.6
1 80
.97
13
300.
00
3.33
5.
12
55.9
0 2.
90
91.0
0 12
.00
5.10
26
.90
2.49
10
.80
90.0
3 14
19
2.00
2.
57
5.44
40
.00
11.5
0 88
.80
14.4
0 5.
10
24.0
0 2.
30
10.4
3 72
.46
15
550.
00
2.74
6.
00
32.6
0 8.
80
83.7
0 14
.50
5.30
25
.50
2.32
10
.99
75.8
0 M
ean
395.
60*
2.75
5.
11
41.6
8 7.
60
87.4
5 12
.56
5.59
23
.98
2.31
10
.39
83.0
3 SD
26
2.39
0.
43
0.86
9.
70
4.47
4.
30
1.05
0.
82
1.93
0.
10
0.58
5.
70

55
Tab
le 1
2: S
umm
ary
of so
w p
rodu
ctiv
ity fo
r eac
h fa
rm c
ateg
ory.
N
(f
arm
s)
Sow
her
d si
ze
Mea
n pa
rity
M
ean
pari
ty c
ulls
C
ull
Rat
e %
M
ort.
Rat
e%
Farr
owin
g R
ate
%
Bor
n al
ive/
lit
ter
Wea
n-m
atin
g in
terv
al
W/S
/Y
L/S
/Y
W/S
/L
Pigl
et
surv
ival
%
Mea
n (a
ll fa
rms)
-
395.
60
2.75
5.
11
41.6
8 7.
60
87.4
5 12
.56
5.59
23
.98
2.31
10
.39
83.0
3 SD
-
262.
39
0.43
0.
86
9.70
4.
47
4.30
1.
05
0.82
1.
93
0.10
0.
58
5.70
Smal
l gro
ups
7 28
5.00
2.
64
5.17
44
.33
6.88
87
.27
12.5
7 5.
30
23.6
8 2.
29
10.3
5 82
.61
Med
ium
gro
ups
9 37
9.60
2.
76
5.09
37
.44
8.64
87
.76
13.1
4 5.
72
24.8
5 2.
35
10.5
5 80
.80
Lar
ge g
roup
s 4
625.
00
3.05
4.
95
44.3
5 7.
15
87.2
0 10
.90
6.15
24
.65
2.35
10
.11
89.8
8
Bed
ding
7
377.
57
2.96
5.
17
45.5
6 6.
50
87.5
4 12
.12
5.46
24
.51
2.33
10
.34
84.8
3 N
o be
ddin
g 13
40
5.30
2.
61
5.07
39
.26
8.29
87
.39
12.7
5 5.
68
24.1
3 2.
32
10.4
2 81
.90
No
stal
ls
7 48
2.14
2.
83
4.68
38
.20
7.63
88
.77
12.2
7 6.
07
24.9
2 2.
38
10.4
4 85
.24
1 w
eek
in st
alls
1 72
0.00
2.
50
3.90
38
.00
10.0
0 89
.60
11.3
0 5.
40
24.0
0 2.
30
10.4
3 92
.34
4 w
eeks
in st
alls
7
331.
43
2.89
5.
57
43.4
8 7.
78
86.4
8 12
.93
5.48
23
.92
2.30
10
.22
78.5
6 5
wee
ks in
stal
ls
2 16
0.00
2.
84
5.37
38
.15
3.70
89
.45
12.7
0 5.
40
24.5
3 2.
31
10.6
5 83
.82
>5 w
eeks
in st
alls
3
392.
30
2.50
5.
15
46.3
7 9.
13
85.3
7 12
.47
5.47
24
.05
2.32
10
.38
83.1
5
Dry
fed
floor
5
549.
60
2.92
4.
91
46.4
3 6.
93
87.6
7 11
.37
5.63
23
.39
2.29
9.
96
86.1
0 L
iqui
d fe
d au
to
10
383.
41
2.65
5.
25
36.2
4 9.
07
87.1
0 12
.94
5.65
24
.13
2.32
10
.42
80.8
4 D
ry fe
d au
to
2 30
0.00
2.
72
4.48
56
.10
4.75
88
.55
12.6
5 5.
15
26.5
8 2.
40
11.0
9 87
.75
Dry
man
ual t
roug
h 3
457.
50
2.91
5.
26
36.2
0 5.
45
89.5
5 12
.85
5.70
24
.38
2.36
1.
11
79.7
1
Fed
daily
8
422.
25
2.93
5.
17
44.0
0 6.
50
87.5
0 11
.68
5.70
23
.39
2.30
9.
98
84.5
0 Fe
d tw
ice
daily
8
305.
88
2.52
5.
12
36.2
0 8.
12
87.9
8 13
.08
5.68
24
.69
2.33
10
.63
81.3
4 ≥3x/day
4 44
7.84
3.
16
5.36
46
.13
20.2
3 87
.95
12.3
0 5.
35
25.2
2 2.
39
10.4
6 84
.44
W/S
/Y=
wea
ned
per s
ow p
er y
ear,
L/S/
Y=
Litte
rs p
er so
w p
er y
ear,
W/S
/L=
Wea
ned
per s
ow p
er li
tter

56
Regarding the duration of time that sows are kept in a stall; farms that used gestation
stalls for 4 weeks (n=7 farms) had the highest average piglets born alive per litter
(12.93, Table 12). Sow productivity was compared between sows that were group
housed throughout the entire gestation, and sows that were kept in a stall for some
period during pregnancy. The number of piglets born alive and the number of pigs
weaned per sow per year was compared. There was no difference between means for
piglets born alive in stalls (12.65±0.36) vs. group housed sows (12.27±0.43), or for the
number of piglets WSY (stalls WSY=23.70±0.59, group WSY=24.92±1.23).
The highest number of piglets WSY (26.58 piglets) was seen in the sows that were fed
dry meal through an automatic feeding system (Table 12, n=2 farms). Aside from the
feeding system, there were no other common features between these farms. The farm
category with the highest number of piglets born alive was the medium size groups
category (n=9 farms, mean=13.14 piglets born alive per litter).
Out of the farms in the ‘medium groups’ category, five of the nine did not use bedding
in the gestating sow accommodation. Five farms did not use stalls, whilst four farms
used stalls for 4 weeks. Six of the nine farms floor-fed the sows a dry meal, and five
farms fed sows twice daily. The ‘medium groups’ category had significantly more pigs
born alive than those kept in large groups (P<0.05). Sows in large groups had the least
piglets born alive out of all categories at 10.90 pigs per litter. Sows kept in stalls for one
week (n=1 farm) had the highest piglet survival to weaning (92.34%).

57
On-farm observations of welfare
The total scores per farm for each welfare parameter that was evaluated on-farm as part
of the overall welfare assessment are presented in Table 13. On each farm, 135
observations were performed, giving a total of 2700 observations across all 20 farms.
There were very few observations of lameness, with only 10 sows in total from 8 farms
scoring a 1 or 2 for lameness (where a score of 0 represents no lameness, 2 represents
mildly lame or abnormal gait, and a score of 3 was recorded for sows that were hesitant
to walk or could not stand unaided). Only three farms had sows with a coat condition
score above 0 (where a score of 0 represented normal coat condition, a score of 1 was
given to sows with a dull, coarse coat, and a score of 2 was recorded for poor coat
condition which may have included bald patches and uneven distribution). The highest
total farm score achieved for all welfare parameters was 190; however, given that the
highest possible score was 970, this does not reflect a large number of indicators of
potential welfare compromise.
The mean scores for each on-farm observation of sow welfare, mean space allowance
per sow, and the mean welfare index for each farm category are shown in Table 14. The
sows with the highest mean score for general behaviours were those kept in a stall for
one week (n= 1 farm). These sows had higher scores for vocalising, resting with
contact, foraging, and rooting relative to sows in other groups (where a greater score
indicates a greater welfare compromise).

58
Table 13: Total farm scores for each parameter assessed on-farm (injuries, stereotypies, general behaviours, coat condition, soiling and lameness). Low total score represents good welfare status.
There was no lameness in sows that were in stalls for either one or five weeks (n= 2
farms), and lameness was also absent in sows that were fed a dry meal in a trough (n= 3
farms). Sows with bedding (n=7 farms) had the greatest amount of space at an average
of 3.90m2 per sow. Sows kept in stalls for up to 5 weeks (n=2 farms) had the least
amount of space at 2.39m2 per sow (Table 14).
Farm Injuries
Stereo- General Coat Soiling Lameness
Total
(n=20) typies behaviours condition Number of
observations per farm 15 25 25 20 25 25 135
Minimum score 0 50 65 0 0 0 115
Maximum score 495 150 260 10 15 40 970
1 16 52 74 0 3 0 145
2 5 52 84 0 6 0 147
3 15 53 89 0 10 0 167
4 28 63 93 0 5 1 190
5 34 56 84 0 2 0 176
6 8 50 91 0 0 3 152
7 7 53 87 0 10 0 157
8 9 52 78 0 1 0 140
9 7 53 88 1 5 1 155
10 14 56 104 2 6 0 182
11 7 54 87 0 0 3 151
12 2 55 89 0 0 0 146
13 10 53 87 0 0 1 151
14 6 57 82 0 4 0 149
15 10 55 87 0 5 1 158
16 18 54 95 8 0 0 175
17 0 52 78 0 0 1 131
18 1 50 81 0 2 0 134
19 13 56 78 0 0 2 149
20 8 54 79 0 0 0 141
AVERAGE: 10.9 54 85.75 0.55 2.95 0.65 154.40

59
Tab
le 1
4: M
ean
scor
es fo
r on-
farm
obs
erva
tions
inc
ludi
ng :
inju
ries,
ster
eoty
pies
, lam
enes
s, so
iling
, coa
t con
ditio
n; (
whe
re a
low
scor
e fo
r the
se
para
met
ers r
epre
sent
s few
er in
dica
tors
of c
ompr
omis
ed w
elfa
re) a
nd g
ener
al b
ehav
iour
s, m
ean
spac
e al
low
ance
per
sow
, and
mea
n w
elfa
re in
dex
(WI,
low
WI r
epre
sent
s goo
d w
elfa
re st
atus
) for
eac
h fa
rm c
ateg
ory.
G
roup
size
(s
ows/
grou
p)
Bed
ding
D
urat
ion
in st
alls
(wee
ks)
Feed
ing
met
hod
Feed
ing
freq
uenc
y (2
4hr)
Mea
n al
l fa
rms
S.D
M
ean
Smal
l (≤6)
M
ed
(≤15)
Lar
ge
(≥16)
Yes
N
o N
o st
alls
1
4 5
5 +
Dry
fe
d flo
or
Liq
uid
fed
auto
Dry
fe
d au
to
Dry
m
anua
l tr
ough
1x
2x
≥3x
n (f
arm
s)
20
- 7
9 4
7 13
7
1 7
2 3
5 10
2
3 8
8 4
Inju
ries
10
.90
8.45
15
.10
9.00
7.
75
10.4
3 11
.15
8.00
14
.00
7.86
8.
00
25.7
0 7.
80
10.2
0 22
.00
11.0
0 8.
25
14.3
8 9.
25St
ereo
typi
es
54.0
0 2.
87
54.1
4 54
.56
52.5
0 53
.86
54.0
8 53
.14
56.0
0 53
.57
52.5
0 57
.33
52.0
0 55
.00
54.5
0 53
.67
52.8
0 55
.75
53.0
0G
ener
al
beha
viou
rs
85.7
5 7.
03
86.5
7 85
.78
84.2
5 87
.14
85.0
0 84
.86
104.
00
83.7
1 82
.50
88.6
7 85
.60
85.5
0 85
.50
87.0
0 87
.38
83.6
3 86
.75
Lam
enes
s 0.
65
0.99
0.
50
0.89
0.
25
0.71
0.
46
1.14
0.
00
0.57
0.
00
0.33
0.
80
0.80
0.
50
0.00
0.
50
0.63
1.
00C
oat
cond
ition
0.
15
1.82
0.
00
0.11
0.
50
0.29
0.
08
0.14
2.
00
0.00
0.
00
0.00
0.
40
0.10
0.
00
0.00
0.
25
0.13
0.
00
Soili
ng
2.95
3.
30
4.86
1.
56
2.75
2.
00
3.46
1.
00
6.00
2.
57
5.50
5.
67
2.20
3.
60
1.00
3.
33
2.63
2.
75
4.00
Spac
e pe
r so
w (m
2 ) 3.
12
1.10
2.
48
3.22
3.
60
3.90
2.
46
3.62
3.
41
3.44
2.
39
2.48
2.
48
2.79
3.
77
3.77
3.
33
2.88
3.
07
Wel
fare
In
dex
0.65
0.
14
0.73
0.
61
0.61
0.
57
0.69
0.
59
1.00
0.
56
0.73
0.
82
0.57
0.
66
0.49
0.
87
0.68
0.
61
0.67

60
Sow behaviour
Behavioural stereotypies were scored from 1-3 (where a score of 1 = absent, and 3 =
excessive display/frequency). Overall, there were few observations of behavioural
stereotypies. The minimum and maximum possible total farm scores were 50 and 150
respectively, as shown in Figure 3. There were no observations of head weaving or
apathy (Table 15). ‘Trough interaction’ was the only behaviour that was performed at a
frequency that was described as excessive, with 2.2% of sows displaying this behaviour
excessively. ‘Dog-sitting’ was the second-most commonly observed behaviour (17.78%
of sows), followed by ‘sham chewing’ (13.33% of sows).
Figure 3: Total scores for behavioural stereotypies for each farm (minimum score = 50, maximum possible score = 150). A low score represents fewer observed stereotypies.

61
Tab
le 1
2: S
umm
ary
of b
ehav
iour
al st
ereo
typy
scor
es (a
ll fa
rms)
show
ing
the
% o
f sow
s tha
t sco
red
a 1,
2, o
r 3 fo
r eac
h st
ereo
typy
obs
erve
d.
Tab
le 1
3: S
umm
ary
of g
ener
al b
ehav
iour
scor
es (a
ll fa
rms)
show
ing
the
% o
f sow
s tha
t sco
red
a 1,
2, 3
, or 4
for e
ach
gene
ral b
ehav
iour
obs
erve
d.
Scor
e Sh
am
chew
ing
Bar
bi
ting
Ton
gue
ro
lling
C
ham
ping
D
og-
sitt
ing
Hea
d w
eavi
ng
Dri
nker
pr
essi
ng
Tro
ugh
inte
ract
ion
Apa
thy
Ston
e ch
ewin
g
%
%
%
%
%
%
%
%
%
%
1 86
.67
95.5
6 93
.33
93.3
3 82
.22
100.
00
94.4
4 81
.11
100.
00
97.7
8 2
13.3
3 4.
44
6.67
6.
67
17.7
8 0.
00
5.56
16
.67
0.00
2.
22
3 0.
00
0.00
0.
00
0.00
0.
00
0.00
0.
00
2.22
0.
00
0.00
Sc
ore
Voc
alisi
ng
Fora
ging
R
ootin
g Fl
oor/
be
ddin
g m
anip
ulat
ion
Eat
ing
Dri
nkin
g W
allo
win
g So
cial
in
tera
ctio
n
Res
ting
with
co
ntac
t G
room
ing
Res
ting
no
cont
act
Ago
nist
ic
Esc
ape/
re
trea
t
%
%
%
%
%
%
%
%
%
%
%
%
%
1
44.4
4 73
.33
62.2
2 68
.89
89.7
7 83
.33
73.3
3 52
.22
38.8
9 97
.78
41.1
1 98
.89
97.7
8 2
46.6
7 24
.44
35.5
6 31
.11
6.82
15
.56
26.6
7 42
.22
27.7
8 2.
22
28.8
9 1.
11
2.22
3
7.78
2.
22
2.22
0.
00
3.41
1.
11
0.00
5.
56
23.3
3 0.
00
24.4
4 0.
00
0.00
4
1.11
0.
00
0.00
0.
00
0.00
0.
00
0.00
0.
00
10.0
0 0.
00
5.56
0.
00
0.00
Key:
1- N
one
2- M
inim
al
3- M
oder
ate
freq
uenc
y of
dis
play
4- V
ery
freq
uent
dis
play
Key:
1 - A
bsen
t
2-Pr
esen
t in
som
e an
imal
s
3-Ex
cess
ive
disp
lay/
freq
uenc
y

62
General behaviours indicated the general activity level of sows during each visit, and
characterised the social and environmental interactions of the dry sows in their various
types of accommodation. Table 16 summarises the frequency of general behaviours
observed on-farm. The minimum possible total score was 65, and the maximum
possible score was 260 for each farm, as shown in Figure 4. Resting with contact was
the most frequently observed behaviour (with 10% of sows exhibiting a very frequent
display) followed by resting with no contact (5.56% of sows exhibiting a very frequent
display). Some behavioural patterns were specific to particular systems such as
wallowing (outdoors) and rooting and foraging (outdoor sows and those with access to
bedding/substrate). Agonistic behaviour was observed the least, with only 1.11% of
sows engaging in this behaviour during the observation period.
Figure 4: Total scores for general behaviours for each farm (minimum score = 65, maximum score = 260). As total score approaches the minimum possible score per farm (65), this indicates that the frequency of these behaviours (and sow activity in general) was low.

63
As is shown in Table 14, the mean general behaviour score for the stalls (1 week)
category was the highest of all categories (P<0.05). There were no other significant
differences observed between farm categories for general behaviours.
Figure 5: Mean (±SD) stereotypies scores for each farm category (minimum score = 50, maximum score = 150). Low score represents fewer observed stereotypies.
The average scores for stereotypical behaviours in each farm category are shown in
Figure 5. Stereotypies were most frequently observed in sows that were kept in stalls for
more than 5 weeks (mean score =57.33, n= 3 farms). Sows fed twice daily had
significantly higher stereotypies (P<0.05) than those fed at a different frequency. Sows
that were floor-fed a dry meal (n= 5 farms) had the lowest stereotypies score (52.00) of
all categories of farm systems, which was significantly lower than ‘dry manual trough’,
‘liquid fed auto’ and ‘medium groups’ (P<0.05).
Feeding frequency
Feeding method
Duration in stalls
Bedding
Group sizes
All farms

64
Out of these five farms, four were using large groups, three had bedding, two had no
stalls, two used stalls for the first 4 weeks of pregnancy, one used stalls in the first week
of pregnancy, and all farms fed sows once daily.
Sow appearance
Sow appearance was evaluated from the coat condition and extent of soiling. Overall,
only three farms were given a coat condition score of more than 0. One farm (farm 16)
had a score of 8 out of a maximum possible score of 10 for coat condition. A significant
number of sows in this herd had mange. This resulted in the majority of sows on this
farm scoring a 2 (dull, coarse coat) for coat condition. Two farms shared the highest
scores for soiling (Table 13); the only common features between these farms were the
use of small groups and no bedding.
Sows kept in stalls for up to one week (n= 1 farm) had the highest soiling score of all
farm categories, followed by sows kept in small groups (n=7 farms). Liquid feeding
systems (n=10) had significantly higher average soiling scores than the ‘dry fed auto’
systems (n=2 farms) (3.60 vs. 1.00 respectively, P<0.05).
Injuries
The maximum possible total injury score per farm was 495. Injury scores ranged from 0
to 34. The single farm that had no recorded injuries was an outdoor-based operation.
Injury scores were significantly higher in sows kept in stalls for more than 5 weeks (n=3
farms) (mean score= 25.67, P<0.05) compared to those that were in stalls for a lesser
amount of time or were not kept in stalls for any period during pregnancy (Figure 6).
The average injury score for farms that kept sows in small groups (≤ 6 sows per group)
(n=7 farms) was significantly higher (mean score= 15.40, P<0.05) than farms with sows
in medium sized groups (≤15 sows) (n=9 farms) (mean score= 9.00). Sows fed twice a
day (n=8 farms) had higher average injury scores than those fed once daily (n=8 farms)
and those fed three times daily or more (n= 4 farms, P<0.05).

65
Figure 6: Mean (±SD) injuries in each farm category (minimum possible score = 0, maximum possible score = 495 per farm) . Low score represents fewer observed injuries.
Welfare Index
A welfare index (WI) was calculated for each farm. This incorporated the following
parameters that were assessed on-farm: stereotypical behaviour score, coat condition
score, soiling score, lameness score, and injury score. These indices were chosen as they
related to areas of potential welfare compromise. Thus the final WI value represented
the overall welfare outcome on-farm. This index had a minimum value of 0.33 and a
maximum of 5.0. In this instance a low WI was desirable in that it represented a low on-
farm presence of indices relating to poor welfare.
Feeding frequency
Feeding method
Duration in stalls
Bedding
Group sizes
All farms

66
Figure 7: Welfare index (±SD) vs. farm category (minimum possible WI= 0.33, maximum possible WI = 5.0 per farm). Low WI represents a low prevalence of indicators of potential welfare compromise.
As can be seen in Figure 7, the prevalence of indicators of compromised welfare
observed on-farm was very low. The highest welfare index was seen in sows kept in
stalls for up to 1 week (WI=1.00, n=1 farm, 700 sows). These sows had a particularly
high score for ‘general behaviours’, however this parameter was not included in the
welfare index. Sows fed dry meal through an automatic feeding system had the lowest
welfare index (WI= 0.49, n=2 farms). Sows fed once daily had the highest WI of the
‘feeding frequency’ category (NS), and those fed dry meal manually in a trough had the
highest WI of the ‘feeding method’ category (NS). There were no significant
differences between the means for injuries, stereotypies or the WI in the stalls (4 weeks)
and stalls (5 weeks) in the stall duration category. Farms that kept sows in stalls for up
to one week and for more than 5 weeks, farms without bedding, and those keeping sows
in small groups all had a significantly higher average WI than farms with automatic
feeding systems that fed a dry meal (dry fed auto) (P<0.05).
Feeding frequency
Feeding method
Duration in stalls
Bedding
Group sizes
All farms

67
Sows with bedding had a lower WI than those without access to bedding, although there
was no significant difference between these groups. Sows kept in small groups (≤6 sows
per group) had a higher average WI than those in medium (≤15 sows per group) or large
groups (≥16 sows per group).
The farm with the highest (‘worst’) WI had a score of 1.20. This farm kept sows in
medium groups without bedding, did not use sow stalls, and fed sows a dry meal in a
trough once daily. Two farms shared the lowest (‘best’) WI of 0.37. The only common
feature between these farms was once daily feeding. One of these farms kept sows in
large groups without bedding, did not use sow stalls, and these sows were floor-fed a
dry meal. The other farm had medium sized groups, bedding, used stalls for 4 weeks,
and sows were fed through an automatic liquid feeding system.
Figure 8: Sow productivity W/S/Y (piglets weaned/sow/year) vs. welfare index (minimum = 0.33, maximum = 5.0). Low WI represents a low prevalence of indicators of welfare compromise.

68
Figure 8 illustrates the relationship between welfare outcome (measured as the WI) and
overall sow productivity (W/S/Y). The Pearson correlation of welfare index and W/S/Y
r = -0.445 (P = 0.127). However, an outlier is present within this data set, representing
a farm with a low number of litters per sow per year (L/S/Y) at 2.16, subsequently
resulting in a much lower W/S/Y (20.87) relative to the other farms. Removal of this
outlier results in a Pearson correlation of -0.822, R-sq= 0.675 (P = 0.001). Hence this
model accounts for 67.5% of the variance, suggesting that, independent of farming
system, there is a moderate relationship between good productivity and a low WI (a low
prevalence of indicators of poor welfare on-farm).
As the WI increased (i.e. as the number of indicators of welfare compromise increased),
there were a number of clear trends associated with sow productivity. The farrowing
rate decreased (r = -0.507, P = 0.077), sow mortality rate increased (r = 0.575, P =
0.040) and the culling rate decreased (r = -0.505, P=0.078). The average parity of sows
culled per farm increased with increasing welfare index .There was no relationship
between WI and piglet survival to weaning (r = 0.056, P = 0.857). However, this was
expected given that there are confounding variables associated with piglet survival that
relate to both farrowing and lactation characteristics, which were beyond the scope of
this research.
The number of piglets weaned per sow per year (W/S/Y) is a function of the farrowing
rate (FR), the number of piglets born alive per litter (BA), the number of piglets weaned
per litter and the number of litters per sow per year (L/S/Y). There is a correlation
between the WI and the W/S/Y, however there are no strong relationships between the
WI and L/S/Y (r = -0.213, P=0.484), between the WI and the number of piglets weaned
per sow per litter (r = -0.373, P=0.209) or between the WI and the weaning-mating
interval (r = 0.359, P = 0.228). There was no correlation between the WI and the
number of piglets born alive per litter (r = -0.194, P=0.525).

69
4. DISCUSSION
Overall, the welfare status of group-housed gestating sows in New Zealand is high. This
is illustrated by the low prevalence of indicators that are associated with reduced or
compromised welfare. In addition to good overall welfare status, only 10 sows (out of
2700 that were assessed) showed signs of lameness, and two ‘abnormal’ behaviours
(head weaving and apathy) were completely absent. Early studies on group housing
have shown reduced reproductive performance relative to stalls in both conception rates
and litter size (Nielsen 1995). The results from this investigation indicated that, of the
sows kept in stalls for a period of time following mating; those confined for 4 weeks
had the greatest number of pigs born alive. Avoiding social competition and mixing of
unfamiliar sows around the timing of mating and embryo implantation may be the key
to reproductive success. Social stress experienced during these critical early phases of
the reproductive cycle can result in suppressed oestrus behaviour, reduced ovulation
rate, and increased embryo mortality (Edwards 2008). Studies have shown that, early in
gestation, sows in deep litter systems may experience greater challenges in relation to
adapting to housing treatment, when compared to sows in conventional gestation stalls
(Karlen et al 2007). Sows in a deep litter treatment during pregnancy had higher
salivary cortisol concentrations in week 1 of gestation, and had poorer farrowing rates
(66% vs. 77% in deep litter and stalls respectively). However, late in gestation, sows in
gestation stalls had greater difficulty adapting to the housing treatment compared to
those in a deep litter system, based on changes in the major cells of the immune system.
In this study, the farm category with the highest number of piglets born alive was the
‘medium groups’ category (13.14 piglets born alive per litter). This group had
significantly more pigs born alive than those kept in large groups (P<0.05). Sows kept
in large groups had the least piglets born alive out of every category, at 10.90 pigs per
litter. Sows housed in stalls in early pregnancy had a slightly higher number of piglets
born alive, but a lower number of pigs weaned per sow per year compared to sows
accommodated in groups for the entire gestation. However, the differences between the
productivity (either BA or W/S/Y) of sows kept in stalls and sows that gestated in a
group situation were not statistically different. This is in agreement with other results

70
where the influence of stage of gestation at grouping on farrowing rate and litter
characteristics of group-housed sows was investigated (Cassar et al. 2007). In this study,
there were no differences in the farrowing rate, litter sizes, or number of piglets born
alive per litter between sows that were in stalls for either 2,7,14,21 or 28 days post-
mating.
Higher average scores for injuries (NS) and behavioural stereotypies (P<0.05) in sows
fed twice a day (vs. sows fed once or ≥3 times daily) may be attributed to increased
agonistic behaviours due to competition at feeding. However, given this explanation, it
would be expected that sows fed three times or more daily would therefore exhibit
greater agonistic behaviour and more injuries than those fed twice daily. In this study,
three out of the four farms that were feeding sows ≥3 times daily were operating liquid
feeding systems. Liquid feeding is likely to contribute to greater gut fill and higher
satiety compared to feeding a dry meal. Coupled with a shorter interval between feeding
times as a result of feeding more frequently in a 24 hour period, this may explain why
sows fed ≥3 times daily had lower injuries and stereotypies than sows fed twice a day.
Once a day feeding has, however, been suggested as preferable to a higher feeding
frequency. This is thought to reduce restlessness and aggression associated with sows in
a group situation that fight to gain access to feed, which is perceived as a limited
resource. Given this, it may be inferred that feeding more than one meal over 24 hours
could result in a lack of satiety (especially in the absence of a foraging substrate and
where feed is low in dietary bulk) (Edwards 2008).
However, this is in contrast to the results of this study, where the ‘best’ welfare outcome
(as measured by the WI) in the ‘feeding frequency’ category was seen in sows that were
fed twice daily (NS). This is a good example of the difficulty that is met with
performing a subjective assessment of an animal’s welfare. It may be that specific
parameters (e.g. injuries) that are incorporated within the welfare index have a greater
impact on an animal’s welfare status than others (e.g. coat condition). In calculating an
overall index of animal welfare, it removes the elements that contribute to the index.
Hence, it is not apparent which factors were most often contributing to welfare
compromise. Sows fed twice daily had significantly greater stereotypies and greater

71
injuries than those fed once or ≥3x daily, yet those fed twice daily had the ‘best’ WI of
the ‘feeding frequency’ category. Although this WI was the lowest, it was comprised
mainly of a greater proportion of injuries and stereotypies. Thus, it may be more
valuable to adjust for ‘severity’ of welfare compromise (i.e. is a low injury score ‘equal’
to a high coat condition score) to better reflect the composition of the WI.
The welfare index ranged from a minimum possible score of 0.33, to a maximum
possible score of 5.0 per farm. The highest (‘worst’) individual farm index was 1.20,
whilst the lowest WI (0.37) was shared by two farms. The two farms with the lowest WI
shared only a single common factor: once daily feeding. One of these farms was
outdoor-based with sows in large groups, whilst the other kept sows in medium groups
on sawdust within an eco-shelter. Thus, it is clear from this example that there is no
specific housing model that could ensure a specified standard of acceptable welfare,
given that two dissimilar accommodation layouts achieved an identical welfare outcome
(in terms of the welfare index) that was also the ‘best’. This also highlights the
importance of a holistic approach, (Salak-Johnson and Curtis 2007), not only with
regard to assessing multiple indices that relate to an animal’s welfare; but also with
reference to the features of different housing systems that can influence how a sow
interacts within that environment. Given that there are several permutations of design
features, and many combinations of these different features within a housing system, it
must be recognised that not all of these combinations will result in a successful outcome
in terms of sow welfare and productivity.
This evaluation of sow welfare can be described as an integrated approach that assessed
behaviour, physical function, and biological function. The WI for dry sows kept in a
stall for 4 weeks was the lowest within the ‘stall duration’ category, which may relate to
the low prevalence of injuries in this group. This may, in turn, be related to the
anxiolytic effects of progesterone metabolites (NAWAC 2003), which have been
attributed to calmer behaviour in pregnant sows after placentation is complete at ~28
days post-mating. Literature on rodents has shown that progesterone in combination
with oestrogens (as occurs in gestation from ~16 days post-mating in the sow) markedly
reduces aggression through the majority of pregnancy (de Jong et al. 1986; Kohlert and

72
Meisel 2001; Davis and Marler 2003). The concentrations of these hormones are
maintained throughout gestation, and may explain why placing sows into groups later in
pregnancy could reduce the level of aggression between sows at the timing of mixing.
The significantly higher injury scores of sows kept in stalls for more than 5 weeks may
be the result of increasing body condition during early pregnancy. Sows that lost
condition during lactation will be gaining liveweight at this time, and with increasing
duration in a stall, space will become more restricted. This agrees with other findings
(Karlen et al. 2007), where sows in stalls exhibited an increase in feet and leg injuries
over time, which was linked to increasing liveweight and restriction of movement.
The low incidence of lameness observed in this study may have been due to the ability
of stockpersons to easily observe the movement, posture and gait of sows in groups. It is
likely that this enabled early identification and treatment of lameness, given that each
farm in this study used group housing at some stage in the production system. There
was no significant difference between the mean lameness scores for sows with or
without bedding. Although, Anderson et al. (1999) found that in group housed sows, the
presence of a bedding substrate reduced the frequency of abnormal gait compared to
sows on a slatted floor. Bedding did allow for the observation of behaviours that may
not be otherwise exhibited in non-bedded systems such as rooting, digging and
foraging. It was also evident that sows close to farrowing were easier to identify in
bedded systems. These sows often withdrew and isolated themselves from the rest of
the group and formed a nest-like depression in the bedding substrate. Farmers
commented that sows became territorial over these ‘nests’ and that there was the
potential for a later than usual shift to the farrowing crates. This was owing to the ability
of the stockperson to use inherent maternal behavioural displays to better align the
movement of late gestation sows with the expected date of farrowing; in addition to
preventing any accidental farrowings in the group situation.
There was no significant difference between the mean WI for sows with or without
bedding. Bedding management is a vital component of deep litter housing systems. Poor

73
quality or insufficient bedding can lead to a wet, unsanitary environment that can have
negative consequences for sow health. Bedding increases the amount of solid manure,
and requires a different type of effluent management compared to liquid effluent
systems (Harmon et al. 2004). A consistent supply of good quality bedding throughout
the year is critical for the maintenance of a successful bedded system. This has, in
practice, limited the practicality of such systems to specific areas of the country.
It is well known that pigs are social animals, and that their social setting is based on a
hierarchy that is instilled from birth. The establishment of a ‘teat order’ soon after birth
serves as a noteworthy example of this. Members of a group of sows can recognise each
other and identify an outsider (Scipioni et al. 2009); however it has been suggested that
pigs in larger groups may fail to recognise all individuals. As a consequence, sows in
large groups are less likely to engage in agonistic behaviours (e.g. pressing, levering,
and attacks with or without bites), but do express more avoidance behaviours compared
to those kept in smaller groups (Turner and Edwards 2000). In the current study,
escape/retreat behaviour was observed at four farms, one of which kept sows in large
groups (n= 35 sows/ group) (the remaining three farms had medium sized groups n= 12,
12 and 10 sows per group). Agonistic behaviour was only observed on two farms, one
with large groups (n=17 sows per group), and the other with medium sized groups
(n=12 sows per group). The largest group sizes observed in this study were up to 40
sows in one pen. The literature suggests that there appears to be more aggression
problems in dynamic groups (Bokma and Kersjes, 1988; O’Connell et al 2002). None of
the 20 farms in this study were operating dynamic systems in gestating sows.
Each farm had specific management practices in place at mixing that served to prevent
stress and aggression between unfamiliar sows. Mixing protocols included mixing sows
after feeding when they are more settled, and moving sows to a new pen with feed
spread on the floor to distract sows from engaging in agonistic behaviours. In some
cases, specially designed pens for the purpose of mixing were used (often featuring
more space, sawdust on the floor for added grip, and visual barriers). On some farms,
sows were left in these pens overnight. It was emphasised that once a group of sows was
socially stable, those established groups must not be disturbed by adding or removing

74
sows. Group composition was based on matching sows according to similar size, and
no mixing of gilts with older, larger sows.
Farms that kept sows in small groups (≤6 sows per group) had higher mean injury
scores than those with sows in medium (≤15 sows); (P<0.05) or large groups (≥16 sows
per group); (NS). Allowing adequate space in a group situation facilitates greater
freedom for behavioural expression, and in particular, social signalling of submission
(Edwards 2008). The results from this study suggest that sows in larger groups (≥16
sows per group) fight less, which is supported by lower injury scores in these sows
compared to those kept in medium or small groups. This appears to be the case even
though all sows observed in group situations were above minimum space requirements
of 2.0m2 set out in the Animal Welfare (Pigs) Code of Welfare (NAWAC 2010). Space
per sow in this study ranged from 2.39-3.90m2 per sow, with an average of 3.12m2 per
sow.
There are limited studies that give conclusive results as to the recommended space
allowance for sows in groups. Nonetheless, it has been clearly shown that there are
negative consequences in terms of sow welfare and reproductive performance when
space is reduced. Experiments have shown that sow aggression and incidence of injuries
is reduced as pen space increased from 2.4 to 3.6m2 (Weng et al. 1998). However, the
authors emphasise the fact that these results do not necessarily reflect the outcome of
other group housing systems when other factors (such as group sizes, feeding system,
provision of bedding and stockmanship) are taken into account. It may also be
important to consider the effect of the layout of the pen and how this influences
aggression between sows. In particular, (and in light of the recent changes to the Animal
Welfare (Pigs) Code of Welfare that will require modifications to existing layouts) this
may relate to buildings that have been retrofitted or converted into sow housing. The
initial format of these buildings may not have been ideal for the purpose of
accommodating sows.

75
Feeding systems in a group housing system should be designed to minimise competition
between sows for feed, in addition to avoiding aggression at feeding times. Floor
feeding has a number of advantages: it is relatively simple and inexpensive to set up and
maintain (low capital), and is well suited to smaller herds. However there are a number
of disadvantages also, such as feed wastage, lack of individual feeding, and uneven feed
distribution. Unequal feed intake between sows within the group has detrimental effects
on body condition, especially for the low-ranking, submissive group members (Levis
2007). Conversely, in this study, sows in the ‘dry fed floor’ category had a relatively
low prevalence of injuries (mean injury score = 7.80) compared to the mean injury score
for all farms (10.90), indicating that the fundamental disadvantages of floor feeding
were being managed effectively in the systems that were using this method. This may
be due to the use of smaller, static groups of sows that are matched for size and have
similar nutritional requirements.
In this study, sows that were floor fed exhibited fewer behavioural stereotypy patterns
than those fed by an alternative method. The reason may be that these sows are
engaging in a form of feeding behaviour that satisfies a strongly-motivated behavioural
need associated with foraging and exploration in order to meet nutritional requirements.
The concept of an internal trigger of stereotypical behaviours suggests that some
particular behavioural repertoires may not be exclusive to a sow’s environment (Salak-
Johnson and Curtis 2007). Unless it is clear that the continued expression of a specific
behaviour is concurrent with reduced welfare, it may be possible to accommodate some
of these behavioural patterns. Although sow behaviour can differ among housing
systems, components of the design feature may be responsible for the presence of
specific behaviours (Dailey and McGlone 1997, McGlone et al. 2004). In light of this,
behavioural stereotypies may be partly driven by external stimuli and the opportunities
within a sow’s environment, and could, therefore, be designed out of the system.
There was a relationship between the WI and productivity whereby fewer indicators of
welfare compromise (low WI) were associated with high productivity (W/S/Y). This
arises through a higher farrowing rate and lower sow mortality in farms with a low WI;
the end result being a greater number of piglets weaned per sow per year on these farms.

76
There was also a moderate relationship between the WI and the culling rate (r = -0.505).
As the WI increased, the culling rate decreased and the average parity of culls increased.
It may be that in these farms, productivity was lower than farms with better welfare
outcomes due to a culling program that was not removing older sows and those with
compromised functionality that may have reduced productivity. Furthermore, it would
be expected that sows with better welfare may have greater longevity (defined as ‘sow
productive lifetime’ by Stalder et al. 2007) within the herd. Subsequently, the retention
of more sows that live longer and have a good welfare status could explain the higher
productivity of farms with better welfare outcomes compared to those with a higher
(poorer) WI.
It would appear that when good welfare status is achieved during pregnancy, high levels
of sow productivity result. Accordingly, it may be that the management of sows that led
to the experience of good welfare is consistent throughout the rest of the farm, and that
other classes of stock on the same farm experience similar levels of good welfare, hence
reflecting the quality of stockmanship across all areas of the farm.
There was however no relationship between the WI of gestating sows, and piglet
survival to weaning. The number of piglets that survive to weaning depends on two key
factors: farrowing and lactation. It is generally accepted that when a decrease in
performance is observed, it suggests that there is a subsequent underlying explanation or
cause that may be attributed to a reduction in welfare. Conversely, a high level of
productivity is not necessarily indicative of a high level of welfare (Scipioni et al.
2009).
Different sow housing systems offer different capacities to observe each sow on a daily
basis. Yet, the management practices and quality of stockmanship on-farm has a direct
impact on factors that contribute to culling and mortality of sows in the breeding herd.
Automated systems in particular have allowed fewer people to manage more sows
(Stalder et al. 2007), reducing the amount of time that a stockperson spends observing

77
individual sows. This is especially so when herd sizes are large and sows are in group
accommodation. Management is responsible for the social structure of the herd (e.g. the
timing and frequency of mixing, in addition to the group composition) which causes
social disruption, hence influencing sow welfare.

78
5. CONCLUSIONS
With regard to the fundamental aspects of group housing accommodation for sows, the
following salient points summarise what may be included in a group housing system in
order to achieve high levels of welfare and sow productivity:
Indoor-based sow accommodation;
Using purpose-built facilities as opposed to retro-fitted or converted buildings;
Well defined sleeping, dunging and eating areas;
Medium to large group sizes providing plenty of space for social signalling and
expression of a wide range of behaviours;
Visual and/or physical barriers for protection from aggression in a group
situation;
Individual feeding;
Feed once daily but sequentially, (e.g. three times in 30 minutes to allow
dominant sows to feed first, and submissive sows to consume enough nutrients);
A mixing protocol that minimises aggression at mixing, which may include the
use of a specially designed mixing pen;
Either mix sows soon after mating (~2-3 days) or wait until ~ 28 days post-
mating.
Group housing has already been incorporated on the majority of pig farms in New
Zealand. Overall, there was a low incidence of on-farm observations (based on
behavioural, physical, and biological parameters) that were used to indicate welfare
compromise. This demonstrated that existing group housing systems are being managed
effectively to achieve good standards of animal welfare. High welfare outcomes were
closely associated with high levels of sow productivity. This bodes well for the
upcoming move to group housing of sows for the entirety of gestation from 2015.
Management strategies to reduce aggression amongst grouped sows are a key
component of ensuring optimal welfare status in addition to a high level of reproductive
performance in sows. This aspect of sow management is largely dependent on skilled
stockmanship. Furthermore, different types of management appear to be necessary

79
depending on the phase of the reproductive cycle, in order to minimise stressors that
may disrupt normal reproductive function.
This study has demonstrated that every system has advantages and disadvantages in
regard to a sow’s welfare. Because of this, there is no single system that is clearly better
than others, when all conditions and each criterion that is pursuant to animal welfare are
considered. Even though the layout of two systems may be very similar, this was not
necessarily the case with regards to sow welfare status. This is partly attributable to the
shift in the importance of accommodating specific needs of a sow, given that those
needs change throughout the reproductive cycle. The challenge is ensuring that the net
welfare outcome is positive, and this is likely to be dependent on high quality
stockmanship.
Few studies have made direct comparisons between housing systems. There is difficulty
in finding systems that use the same management practices. There is also the problem of
accounting for the multitude of other factors present on-farm. Consequently,
standardising the variables in order to achieve a true comparison, where the only
variable is housing, is a challenge to obtaining an accurate evaluation of welfare and
productivity between differing systems. The New Zealand pig industry has progressed
towards the greater use of non-confinement systems, with a commitment to end the use
of sow stalls by 2015. Addressing sow welfare in the long term is reliant on retaining
the advantages that current non-confinement systems possess, whilst making
improvements to mitigate identified problems. Finally, these improvements should be
implemented once the feasibility, practicality, and economic effects of any change make
such modifications viable; supporting ongoing research in this area.

80
REFERENCES
Akos, K. and Bilkei, G. 2004.Comparison of the Reproductive Performance of Sows
Kept Outdoors in Croatia with that of Sows Kept Indoors. Livestock Production Science
85: 293-298.
Andersen, I. L., Bøe, K. E. and Kristiansen, A. L. 1999. The Influence of Different Feeding Arrangements and Food Competition at Feeding in Pregnant Sows. Applied Animal Behaviour Science 65: 91-104.
Andersen, I. L., Berg, S., Bøe, K. E. and Edwards, S. 2006. Positive Handling in Late Pregnancy and the Consequences for Maternal Behaviour and Production in Sows. Applied Animal Behaviour Science 99, 64-76.
Anil, S. S., Anil, L. and Deen, J. 2002. Challenges of Pain Assessment in Domestic
Animals. JAVMA, Vol. 220, No. 3, February 1.
Anil, L., Anil, S. S., Deen, J., Baidoo, S. K. and Wheaton, J.E. 2005. Evaluation of
Well-being, Productivity, and Longevity of Pregnant Sows Housed in Groups in Pens
with Electronic Sow Feeder or Separately in Gestation Stalls. AVJR, Vol. 66 No. 9:
1630-1638.
Arey, D. S.1999. Time Course for Formation and Disruption of Social Organisation in
Group-Housed Sows. Applied Animal Behaviour Science62: 199-207.
Arey, D. S. and Edwards, S. A. 1998. Factors Influencing Aggression between Sows
After Mixing and the Consequences for Welfare and Production. Livestock Production
Science 56: 62-70.
Backus, G. B. C., Vermeer, H. M., Roelofs, P. F. M. M., Vesseur, P. C., Adams, J. H.
A. N, Binnendijk, G. P., Smeets, J. J. J., van der Peet-Schwering, C. M. C. and van der
Wilt, F. J. 1997. Comparison of Four Housing Systems for Non-lactating Sows. In
Report P5.1: p4. Research Institute of Pig Husbandry, Rosmalen, Netherlands.
Barnett, J. L., Hemsworth, P. H., Newman, E. A., McCallum, T.H. and Winfield, C. G.
1989. The Effect of Design of Tether Stalls and Stall Housing on the Behavioural and
Physiological Responses Related to the Welfare of Pregnant Pigs. Applied Animal
Behaviour Science 24: 1-12.

81
Barnett, J. L. and Hemsworth, P. H. 1990. The Validity of Physiological and
Behavioural Measures of Animal Welfare. Applied Animal Behaviour Science, 25 177-
187.
Barnett, J. L., Hemsworth, P. H., Cronin, G. M., Newman, E. A. and McCallum, T. H.
1991. Effects of Design of Individual Cage Stalls on the Behavioural and Physiological
Responses Related to the Welfare of Pregnant Pigs. Applied Animal Behaviour Science
332: 23-33.
Barnett, J. L., Cronin, G.M., McCallum, T. H., Newman, E. A and Hennessey, D. P.
1996. Effects of Grouping Unfamiliar Pigs After Dark, After Treatment with
Amperozide and by using Pens with Stalls, on Aggression, Skin Lesions, and Plasma
Cortisol Concentrations. Applied Animal Behaviour Science 50: 121-133.
Barnett, J. L., Hemsworth, P. H. and Winfield, C. G. 1987a.The Effects of design of
Individual Stalls on the Social Behaviour and Physiological Responses related to the
Welfare of Pregnant Pigs. Applied Animal Behaviour Science 18: 133-142.
Barnett, J. L., Chamberlain, T.S., Hemsworth, P. H. and Farran, I. 1999. Variation in
Biological Traits of Outdoor Sows. In: ‘Manipulating Pig Production VII’. P. D.
Cranwell (ed.) p. 33 Australasian Pig Science Association.
Barnett, J. L., Hemsworth, P. H., Cronin, G. M., Jongman, E. C. and Hutson, G. D.
2001. A Review of the Welfare Issues of Sows and Piglets in Relation to Housing.
Australian Journal of Agricultural Research 52: 1-28.
Barnett, J. L. 2007. Effects of Confinement and Research Needs to Underpin Welfare
Standards. Journal of Veterinary Behaviour 2: 213-218.
Bates, R. O, Edwards, D. B. and Korthals, R. L. 2003. Sow Performance when Housed
either in Groups with Electronic Sow Feeders or Stalls. Livestock Production Science
79: 29-35.
Bilkei, 1995. Herd Health Strategy for Improving the Reproductive Performance of
Pigs. Proc. 8th ‘In-between’ Symposium of the International Society for Animal
Hygiene. Hungarian Veterinary Journal 10, 766-768.

82
Bitran, D., Shiekh, M. and McLeod, M. 1995. Anxiolytic Effect of Progesterone is
Mediated by the Neurosteroid Allopregnanolone at Brain GABAA Receptors. Journal
of Neuroendocrinology N.o 7 Vol. 3: 171-177.
Bokma, S. and Kersjes, G. J. K. 1988. The Introduction of Pregnant Sows in an
Established Group. Proceedings of the International congress of Applied Ethology of
Farm Animals, Skara, Sweden pp 166-169.
Bokma, S. 1990. Housing and Management of Dry Sows in Groups in Practice: Partly
Slatted Systems. Proceedings of an International Symposium on Electronic
Identification in Pig Production, RASE, Stoneleigh, UK pp 37-45.
Bracke, M. B. M., Spruijt, B. M., Metz, J. H. M. and Schouten, W. G. P. 2002. Decision
Support System for Overall Welfare Assessment in Pregnant Sows A: Model Structure
and Weighting Procedure. Journal of Animal Science 80: 1819-1834.
Brambell, F. W. R. 1965. Report of the Technical Committee to Enquire into the
Welfare of Animals Kept under Intensive Livestock Husbandry Systems. Her
Majesty’s Stationary Office, London, UK, Cmnd 2836.
Brandt, Y., Madej, A., Rodriguez-Martinez, H. and Einarsson, S. 2007a. Effects of
Exogenous ACTH during Oestrus on Early Embryo Development and Oviductal
Transport in the Sow. Reproduction in Domestic Animals 42: 118-125.
Brandt, Y., Lundeheim, N., Madej, A., Rogriguez-Martinez, H. and Einarsson, S.
2007b. Effects of ACTH Injections during Estrus on Concentrations and Patterns of
Progesterone, Oestradiol, LH and Inhibin Alpha at Time of Ovulation in the Sow.
Domestic Animal Endocrinology 32: 122-137.
Brandt, Y., Einarsson, S., Ljung, A., Lundeheim, N., Rogriguez-Martinez, H. and
Madej, A. 2009. Effects of Continuous Elevated Cortisol Concentrations During
Oestrus on Concentrations and Patterns of Progesterone, Oestradiol and LH in the Sow.
Animal Reproduction Science 110: 172-185.
Braund, J. P., Edwards, S. A. , Riddoch, I and Buckner, L. J. 1998. Modification of
Foraging Behaviour and Pasture Damage by Dietary Manipulation in Outdoor Sows.
Applied Animal Behaviour Science Vol.56 N.o 2-4: 173-186.

83
Broom, D. M. 1983. Stereotypies as Animal Welfare Indicators. In: Indicators Relevant
to Farm Animal Welfare. D. Smidt (ed).
Broom, D. M., Mendl, M. T. and Zanella, A. J. 1995. A Comparison of the Welfare of
Sows in Different Housing Systems. Animal Science 61: 369-385.
Canterbury Outdoor Pork Production Seminar Proceedings, 21 May 2010.
Cassar, G., Kirkwood, R. N., Seguin, M. J., Widowski, T. M., Farzan, A., Zanella, A. J.
and Friendship, R. M. 2007. Influence of Stage of Gestation at Grouping and Presence
of Boars on Farrowing Rate and Litter Size of Group-Housed Sows. Journal of Swine
Health and Production vol. 16, N.o. 2, 81-85.
Curtis, S. E., Baker, R. B., Estienne, M. J., Lynch, P. B., McGlone, J. J. and Pedersen,
B. K. 2009. Scientific Assessment of the Welfare of Dry Sows Kept in Individual
Gestation Accommodations. CAST Issue Paper Number 42, March.
Dailey, J. W. and McGlone, J. J. 1997. Oral/Nasal/Facial and Other Behaviours of Sows
Kept Individually Outdoors on Pasture, Soil or Indoors in Gestation Crates. Applied
Animal Behaviour Science 52:25.
Davis, E. S. and Marler, C. A. 2003. The Progesterone Challenge: Steroid Hormone
Changes Following a Simulated Territorial Intrusion in Female Peromyscus
californicus. Hormones and Behaviour 44: 185-198.
Dawkins, M. S. 2003. Behaviour as a Tool in the Assessment of Animal Welfare.
Zoology 106 383-387.
De Jong, F. H., Eerland, E. M. and Van de Poll, N. E. 1986. Sex Specific Interactions
between Aggressive and Sexual Behaviour in the Rat: Effects of Testosterone and
Progesterone. Hormones and Behaviour: 20: 432-444.
Durrell, J. L., Beattie, V. E., Sneddon, I. A. and Kilpatrick, D. 2003. Pre-Mixing as a
Technique for Facilitating Sub-group Formation and Reducing Sow Aggression in
Large Dynamic Groups. Applied Animal Behaviour Science 84: 89-99.
Edge, M. K., Davidson, A. A. and Pearson, A. B. 2007. Sow Housing and Management
Systems: A Literature Review Update for the New Zealand Pork Industry Board. Prime
Consulting International (Australia) Pty Ltd, Australia.

84
Edwards, S. A., Mauchline, S. and Stewart, A. H. 1993. Designing Pens to Minimise
Aggression When Sows are Mixed. Farm Building Progress 113: 20-25.
Edwards, S. A. 2005. Product Quality Attributes Associated with Outdoor Pig
Production. Livestock Production Science 94: 5-14.
Edwards, S. E. 2008. Balancing Sow and Piglet Welfare with Production Efficiency.
London Swine Conference Proceedings.
EliteHerd. 2007. Genetic Solutions Ltd, Palmerston north, New Zealand.
Farm Animal Welfare Council (FAWC). 1993. Second Report on Priorities for
Research and Development in Farm Animal Welfare. MAFF Publ. Tolworth, UK, PB
1310: 3-4.
Farm Animal Welfare Council (FAWC). 1996. FAWC Report on the Welfare of Pigs
Kept Outdoors. Farm Animal Welfare Council, London, England.
Farm Animal Welfare Council (FAWC). 2007. FAWC Report on Stockmanship and
Animal Welfare. Farm Animal Welfare Council, London, England.
Fraser, D. and Rushen, J. 1987. Aggressive Behaviour. The Veterinary Clinics of North
America. Food Animal Practice. Vol. 3 N.o. 2: 285-305.
Fraser, D., Weary, D. M., Pajor, E. A. and Milligan, B. N. 1997. A Scientific
Conception of Animal Welfare that Reflects Ethical Concerns. Animal Welfare 6: 187-
205.
Gonyou, H. W. 1994. Why the Study of Animal Behaviour is Associated with the
Animal Welfare Issue. Journal of Animal Science 72: 2171-2177.
Gonyou, H. W. 2005. Experiences with Alternative Methods of Sow Housing. Animal
Welfare Forum: Sow Housing and Welfare. JAVMA Vol. 226 N.o. 8, April.
Gregory, N. G. and Devine, C. D. 1999. Survey of Sow Accommodation Systems used
in New Zealand. New Zealand Journal of Agricultural Research Vol. 42: 187-194.
Harmon , J. D., Honeyman, M. S., Kliebenstein, J. B., Richard, T. and Zulovich, J. M.
2004. Hoop Barns for Gestating Swine. MidWest Plan Service. Revised Edition. Iowa
State University, Iowa.

85
Harris, T. G., Dye, S., Robinson, J. E. and Skinner, D. C. 2000. Progesterone Can Block
Transmission of the Oestradiol Induced Signal for Luteinizing Hormone Surge
Generation During a Specific Period of Time Immediately After Activation of the
Gonadotrophin-Releasing Hormone Surge-Generating System. Endocrinology 140:
827-834.
Harris, M. J., Pajor, E. J., Sorrells, A. D., Eicher, S. D., Richert, B. T., and Marchant-
Forde, J. N. 2006. Effects of Stall or Small Group Gestation Housing on the Production,
Health and Behaviour of Gilts. Livestock Science 102: 171-179.
Hemsworth, P. H., Gonyou, H. W and Dziuk, P. J. 1986. Human Communication with
Pigs: The Behavioural Response of Pigs to Specific Human Signals. Applied Animal
Behaviour Science 15: 45-54.
Hemsworth, P. H., Barnett, J. L., Coleman, G. J and Hansen, C. 1989. A Study of the
Relationships Between the Attitudinal and Behavioural Profiles of Stockpersons and the
Level of Fear of Humans and Reproductive Performance of Commercial Pigs. Applied
Animal Behaviour Science Vol. 23 N.o. 4: 301-314.
Hemsworth, P. H., Pedersen, V., Cronin, G. M. and Coleman, G. J. 1999. A Note on the
Relationship between the Behavioural Response of Lactating Sows to Humans and the
Survival of their Piglets. Applied Animal Behaviour Science Vol. 65 Issue 1: 43-52.
Hulbert, L.E. and McGlone, J. J. 2006. Evaluation of Drop versus Trickle-Feeding
Systems for Crates or Group Penned Gestating Sows. Journal of Animal Science Vol.
84 No. 4: 1004-1014.
Jensen, P. and Toates, F. M. 1993. Who Needs ‘Behavioural Needs’? Motivational
Aspects of the Needs of Animals. Applied Animal Behaviour Science, 37, 161-181.
Jensen, K. H., Sorenson, L. S., Bertelsen, D., Pedersen, A. R., Jorgenson, E., Nielsen,
N. P. and Vestergaard, K. S. 2000. Management Factors Affecting Activity and
Aggression in Dynamic Group Housing Systems with Electronic Sow Feeding: A field
Trial. Animal Science 71: 535-545.
Karlen, G. A. M., Hemsworth, P. H., Gonyou, H. W., Fabrega, E., Stronm, A. D. and
Smits, R. J. 2007. The Welfare of Gestating Sows in Conventional Stalls and Large
Groups on Deep Litter. Applied Animal Behaviour Science 105: 87-101.

86
Karg, H. and Bilkei, G. 2002. Causes of Sow Mortality in Hungarian Indoor and
Outdoor Pig Production Units. Berliner und Munchener Tierarztliche Wochenschrift
115: 366-368.
Kirkwood, R. and Zanella, A. 2005. Influence of Gestation Housing on Sow Welfare
and Productivity. National Pork Board Final Report.
Kohlert, J. G. and Meisel, R. L. 2001. Inhibition of Aggression by Progesterone and its
Metabolites in Female Syrian Hamsters. Aggressive Behaviour Vol. 27 Issue 5, pp 372-
381.
Kongsted, A. G. 2005. A Review of the Effect of Energy Intake on Pregnancy Rate and
Litter Size-Discussed in Relation to Group-Housed Non-lactating Sows. Livestock
Production Science 97: 13-26.
Kongstead, A. G. 2006. Relation Between Reproduction Performance and Indicators of
Feed Intake, Fear and Social Stress in Commercial Herds with Group-Housed, Non-
lactating Sows. Livestock Science 101: 46-56.
Lammers, P. J., Honeyman, M. S., Mabry, J. W. and Harmon, J. D. 2007. Performance
of Gestating Sows in Bedded Hoop Barns and Confinement Stalls. Journal of Animal
Science 85: 1311-1317.
Leeb, B., Leeb, C., Troxler, J. and Schuh, M. 2001. Skin Lesions and Callosities in
Group-Housed Pregnant Sows: Animal-Related Welfare Indicators. Acta Agriculturae
Scandinavica, Section A- Animal Science 51: 1, 82-87.
Levis, D. 2007. Gestation Sow Housing Options. Sow Housing Forum Proceedings, Des
Moines, Iowa.
Liptrap, R. M. 1970. Effect of Corticotrophin and Corticosteroids on Oestrus, Ovulation
and Oestrogen Excretion in the Sow. Journal of Endocrinology 47: 197-205.
McGlone, J. J. 1985. A Quantitative Ethogram of Aggressive and Submissive
Behaviours in Recently Regrouped Pigs. Journal of Animal Science, Vol. 61, N.o.
3:559-565.
McGlone , J.J., von Borell, H., Deen, J., Johnson, K., Levis, D.G., Meunier-Salaṻn, M.,
Morrow, J.,Reeves, D., Salak-Johnson, L. and Sundberg, P. L. 2004. Review:

87
Compilation of the Scientific Literature Comparing Housing Systems for Gestating
Sows and Gilts Using Measures of Physiology, Behaviour, Performance, and Health.
The Proffessional Animal Scientist 20: 105-117.
Marchant, J. N. and Broom, D. M. 1996. Factors Affecting Posture-Changing in Loose-
Housed and Confined Gestating Sows. Animal Science 63:477-485.
Marchant, J. N., Rudd, A. R. and Broom, D. M. 1997. The Effects of Housing on Heart
Rate During Specific Behaviours. Applied Animal Behaviour Science 55: 67-78.
Marchant-Forde, J. (ed.) 2009. The Welfare of Pigs. Springer (publisher).
Mellor, D. J. and Stafford, K. J. 2009. Quality of Life: A Valuable Concept or an
Unnecessary Embellishment when Considering Animal Welfare? In: The Welfare of
Animals-It’s Everyone’s Business. Proceedings of the Australian Animal Welfare
Strategy International Conference, 31 August to 3 September 2008.
Moberg, G. P. 1993. A Review: Developing Management Strategies to Reduce Stress in
Pigs: A New Approach Utilizing the Biological Cost of Stress. In: Manipulating Pig
Production IV, Australasian Pig Science Association, pp 116-126.
Moore, A. S., Gonyou, H. W. and Ghent, A. W. 1993. Integration of Newly Introduced
and Resident Sows Following Grouping. Applied Animal Behaviour Science 38: 257-
267.
National Animal Welfare Advisory Committee (NAWAC). 2003. Animal Welfare
(Pigs) Code of Welfare 2003 Report. MAF Biosecurity New Zealand.
National Animal Welfare Advisory Committee (NAWAC). 2010. Animal Welfare
(Pigs) Code of Welfare 2009. MAF Biosecurity New Zealand.
Nielsen, N. P., Fisker, B. N., Hansen, L. U. And Ruby, V. 1997. Strategies for Mixing
Sows in Small Static Groups. Danish Applied Pig Research Scheme. Danske Alagterier,
Copenhagen, Denmark.
NZPIB (New Zealand Pork Industry Board). 2009. Sow Housing Survey.
O’Connell, N. E., Beattie, V. E. and Moss, B. W. 2002. Influence of Social Status on
the Welfare of Sows in Static and Dynamic Groups. Animal Welfare 12: 239-249.

88
O’Connell, N. E., Beattie, V. E. and Watt, D. 2004. Investigations into Optimum
Regrouping Strategies for Pigs. Agricultural Research Institute of Northern Ireland.
Advances in Pig Research: Occasional Publication No. 33.
Oldigs, B. Schlichting, M. C. and Ernst, E. 1992. Trials on the Grouping of Sows.
Proceedings of the 23rd International Conference on Applied Ethology in Livestock,
Germany. N.o. 351 pp 109-120.
Pedersen, L.J., Damm, B. I. and Kongstead, A. G. 2003. The Influence of Adverse or
Gentle Handling Procedures on Sexual Behaviour in Fearful and Confident Sows.
Applied Animal Behaviour Science 83, 277- 290.
Peltoniemi, O. A. T., Love, R. J., Heionen, M., Tuovinen, V. and Saloiemi, H. 1999.
Seasonal and Management Effects on Fertility of the Sow: A Descriptive Study. Animal
Reproduction Science 55: 47-61.
Petherick, J. C. and Blackshaw, J. K. 1987. A Review of the Factors Influencing the
Aggressive and Agonistic Behaviour of the Domestic Pig. Australian Journal of
Experimental Agriculture 27: 605-611.
Pusateri, Anthony E., Smith, Janet M., Smith, James W., Thomford, Peter J. and
Diekman, Mark A. 1996. Maternal Recognition of Pregnancy in Swine I. Minimal
Requirement for Exogenous Estradiol- 17β to Induce Either Short or Long
Pseudopregnancy in Cycling Gilts. Biology of Reproduction 55, 582-589.
Razdan, P., Tummaruk. P., Kindhal, H., Rodriguez-Martinez, H., Hulten, F. And
Einarsson, S. 2004. Hormonal Profiles and Embryo Survival of Sows Subjected to
Induced stress During Days 13 and 14 of Pregnancy. Animal Reproduction Science 81:
295-312.
Rhodes, R. T., Appleby, M., C., Chinn, K., Douglas, L., Firkins, L. D., Houpt, K. A.,
Irwin, C., McGlone, J. J., Sundberg, P., Tokach, L. and Wills, R. W. 2005. A
Comprehensive Review of Housing for Pregnant Sows. JAVMA Vol. 227, N.o. 10:
1580-1590.
Rushen, J. and Pajor, E. 1987. Offence and defence in Fights between Young Pigs (Sus
scrofa). Aggressive Behaviour Vol. 13 N.o. 6: 329-346.

89
Salak-Johnson, J. L. and Curtis, S. E. 2007. Managing Grouped Sows. Swine Nutrition
Conference Proceedings pp 6-12.
Salak-Johnson, J. L., Niekamp, S. R., Rodriguez-Zas, S. L., Ellis, M. and Curtis, S. E.
2007. Space Allowance for Dry Sows in Pens: Body Condition, Skin Lesions, and
Performance. Journal of Animal Science 85: 1758-1769.
Scipioni, R., Marteiil, G. and Volpelli, L. A. 2009. Assessment of Welfare in Pigs.
Italian Journal of Animal Science 8 (suppl.1) pp117-137.
Sharman, D.F.1983. Neurochemistry of abnormal behaviour in farm animals. In:
Indicators Relevant to Farm Animal Welfare. D. Smidt (Editor), Martinus Nijhoff, pp.
61-65.
Spoolder, H. A. M., Burbidge, J. A., Edwards, S. A., Lawrence, A. B. and Simmins, P.
H. 1996. Social Recognition in Gilts Mixed into a Dynamic Group of 30 Sows. Animal
Science 62.
Spoolder, H. 1998. Effect of Food Motivation on Stereotypies and Aggression in Group
Housed Sows. Doctoral Thesis, Wageningen Agricultural University.
Spoolder, H. A. M., Geudeke, M. J., Van der Peet-Schwering, C. M. C. and Soede, N.
M. 2009. Group Housing of Sows in Early Pregnancy: A Review of Success and Risk
Factors. Livestock Science 125: 1-14.
Stalder, K. J., Karriker, L. V., Johnson, A. K. 2007. The Impact of Gestation Housing
System on Sow Longevity. Proceedings of the Sow Housing Forum, Des Moines, Iowa,
June 6.
Stolba, A. and Wood-Gush, D. G. M. 1984. The Identification of Behavioural Key
Features and their Incorporation as to a Housing Design for Pigs. Annales de
Récherches Vétérinaires 15: 287–298.
Stolba, A. and Wood-Gush, D. G. M. 1989. The Behaviour of Pigs in Semi-Natural
Environment. Animal Production 48: 419-425.

90
Studnitz, M., Jensen, K. H. and Jorgensen, E. 2003. The Effect of Nose Rings on the
Exploratory Behaviour of Outdoor Gilts exposed to Different Tests. Applied Animal
Behaviour Science Vol. 84 N.o. 1: 41-57.
Tillon, J. P. and Madec, F. 1984. Diseases Affecting Confined Sows. Data from
Epidemiological Observations. Annales Recherche. Veterinaire 15: 195-299.
Tsuma, V. T., Einarsson, E., Madej, A., Kindhal, H., Lundeheim, N. and Rojkittikhun,
T. 1996. Endocrine Changes during Group Housing of Primarous Sows in Early
Pregnancy. Acta Veterinaria Scandinavica 37: 481-490.
Turner, S.P. and Edwards, S. A. 2000. Housing in Large Groups Reduces
Aggressiveness of Growing Pigs. Proceedings of the 51st Annual Meeting of the
European Association for Animal Production. The Hague, The Netherlands.
Turner, S. P., Farnworth, M. J., White, I. M. S., Brotherstone, S., Mendl, M., Knap, P.,
Penny, P. And Lawrence, A. B. 2006. The Accumulation of Skin Lesions and their Use
as a Predictor of Individual Aggressiveness in Pigs. Applied Animal Behaviour Science
96: 245-259.
Turner, A. I., Hemsworth, P. H. and Tilbrook, A. J. 2005. Susceptibility of
Reproduction in Female Pigs to Impairment by Stress or Elevation of Cortisol.
Domestic Animal Endocrinology Vol. 29 N.o. 2: 398-410.
Turner, A. I. and Tilbrook, A. J. 2005. Stress, Cortisol and Reproduction in Female
Pigs. In: Control of Pig Reproduction VII, C. J. Ashworth and R. R. Kraeling (eds.)
Nottingham University Press.
Van Putten, G. and van de Burghwal, J. A. 1990. Vulva Biting in Group-Housed Sows:
A Preliminary Report. Applied Animal Behaviour Science 26: 181-186.
Van Wettere, W. H. E. J., Pain, S. J., Stott, P. G. and Hughes, P. E. 2008. Mixing Gilts
in Early Pregnancy Does Not Affect Embryo Survival. Animal Reproduction Science
104: 382-388.
Vieuille-Thomas, C., Lepate, G. and Singoret, J. P. 1995. Stereotypies in Pregnant
Sows: Indications of Influence of the Housing System on the Patterns Expressed by the
Animals. Applied Animal Behaviour Science 44: 19-27.

91
Volpato, G. L., Giaquinto, P. C., de Castilho, M. F., Barreto, R. E. and Goncalves de
Freitas, E. 2009. Animal Welfare: From Concepts to Reality, Oecol. Bras., 13(1): 05-15.
Von Borell, E. and Hurnik, J. F. 1991. Stereotypic Behaviour, Adrenocortical Function,
and Open Field Behaviour of Individually Confined Gestating Sows. Physiology and
Behaviour 49: 709-713.
Weng, R. C., Edwards, S. A. and English, P. R. 1998. Behaviour, Social Interactions
and Lesion Scores of Group-Housed Sows in Relation to Floor Space Allowance.
Applied Animal Behaviour Science 59: 307-316.
Zurbrigg, K. 2006. Sow Shoulder Lesions: Risk Factors and Treatment Effects on an
Ontario Farm. Journal of Animal Science 84: 2509-2514.

92
Appendix 1
FARM DESCRIPTION SURVEY
1. Feed Delivery System (Groups)
Feeding method:
Dry meal (manually fed into trough)
Dry meal (automatic system)
Liquid feeding (automatic)
Dry meal floor feeding
General Farm description:

93
Other (describe):
Feeding time and frequency:
Daily feed allowance (kg/day/gestating sow)-
Daily check of automatic feeding systems:
2. Water system (description):
Sufficient access and appropriate design:
Daily check of automatic watering systems/ availability:
3. Facilities for housing and treatment of sick pigs:
4. Stalls
Number of stalls:
Floor type:
Number of sows in stalls at any one time:

94
Duration of time spent in stalls:
Feeding system in stalls (if different from groups):
5. Groups
Group sizes:
Static/Dynamic:
Sows weaned per week:
Space allowance per sow:
Microenvironments available for separation of dunging, sleeping, eating areas:
Describe flooring type:
Mixing sows
Time of day mixing occurs:
Signs of persistent aggression should be minimal:
Mixing Checklist Yes/No Extra feed added to floor of pen Boar in pen Mixed at end of day/ night Partition walls and/or barriers Feed spread out (if floor fed) Environmental distraction (bedding) Separate thin/ timid sows Generous space allowance (~3m2/sow) Even sizes of group members

95
Management protocol to minimise/ control aggression:
Management protocol for abnormal behaviour:
6. Health and Disease prevention
Response protocol for injured/sick animals:
Vaccinations and regular treatments (e.g. drenched for parasites, feed supplements):
Body condition score:

96
BCS of 3.5 to 4 prior to farrowing: (Y / N)
No lower than 3 after weaning: (Y / N)
Protocol for thin sows:
7. Culling and Mortality
Annual culling rate of sows (%):
Number culled:
Annual sow mortality rate (deaths and euthanasia)(%):
Number:
Average parity at culling:
8. Age structure of herd:
Number of gilts:
Average parity of the sow herd:
Genotype:
9. Reproductive Parameters:
Farrowing rate:
Average litter size (pigs born alive):
Weaning to mating interval:
Percentage of AI and/or naturally mated sows:
Pigs weaned per sow per year:
Litters/sow/year:
Lactation length:

97
10. Outdoor sows
Nose ringed: (Y / N) Proportion of sow herd ringed:
Efficacy of nose-ringing (does it serve its purpose):
Nose ringing procedure (who carries it out and how):
Paddock description/ condition (grass cover, bare soil, free draining, wallow present, shelter areas etc):
Paddock rotation:
Area per sow/ group:
Housing type (number of sows/shelter, insulation, design features):
Bedding description and replacement rate/ management of bedding substrate:
Protocol for sick sows/ sows needing individual attention:
Provision of shade/ wallowing areas:
Pest control (if problem is/ was apparent):

98
Appendix 2
ON-FARM ASSESSMENT AND OBSERVATIONS
INJURIES
Assess sows (15 sows per herd):
Area Scores (0-3) Total score
Ears
Head
Neck
Shoulders
Front legs
Udder
Sides
Back
Hind legs
Rear
Vulva
Total/ sow
0- No lesions
1- Dehairing, bald spots, redness, swelling
2- Swelling, abscess, moderate wound, scabbed-over scratch,
3- Marked wound, fresh scratch, severe wound, open wound with discharge
Notes/ Other observations:

99
ANIMAL APPEARANCE
COAT CONDITION
Hair/ coat condition: sub-sample of sow population (assess 5 groups, 5 sows/ group)
SOILING
Extent of soiling of the sow with dung (assesses 5 groups, 5 sows/ group):
Group Scores Average
1
2
3
4
5
Group Scores Average
1
2
3
4
5
Notes/Other observations:
0-Normal (evenly distributed hairs, fine and shiny)
1-Dull, coarse
2-Poor, bald patches, uneven distribution
Notes/Other observations:
0- No soiling
1- Minor (tail only)
2- Moderate (tail and rear legs)
3- Excessive (underside and/or flanks, other

100
MOVEMENT AND POSTURE (LAMENESS)
Standing Posture (assess 20 sows per herd):
Sow Score
1
2
3
4
5
6
7
8
9
10
11
12
13
14
15
16
17
18
19
20
Key
0- No lameness: bears weight evenly on all legs
1- Mildly lame: abnormal gait or does not bear weight on all legs
2- Clearly lame: hesitant to walk, uneven weight bearing, limping or will not stand unaided
Notes/ Other observations:

101
BEHAVIOURAL OBSERVATIONS (STEREOTYPIES)
Key:
1-Absent
2-Present in some animals
3-Excessive display/ frequency
Stereotypical Behavioural
Displays:
Group
1
Group
2
Group
3
Group
4
Group
5
Sham chewing
Bar-biting
Tongue-rolling
Champing
Dog-sitting
Head weaving
Drinker pressing
Feeder/trough interaction
Apathy
Stone chewing
Notes/ Other observations:

102
BEHAVIOURAL OBSERVATIONS (GENERAL)
Key:
1-None
2-Minimal
3-Moderate frequency of display
4-Very frequent display
General Behavioural
Displays:
Group
1
Group
2
Group
3
Group
4
Group
5
Vocalising
Foraging
Rooting
Floor / bedding manipulation
Eating
Drinking
Wallowing
Social interaction (non aggressive)
Resting (lying with physical contact)
Grooming
Resting (lying without physical
contact)
Agonistic (attack)
Escape/ retreat behaviour
Notes/ Other observations:

103
Appendix 3
Behaviour ethogram: description of observed behaviours.
Behaviour Description Stereotypies:
Sham chewing Chewing actions performed without the presence of food in the oral cavity.
Bar biting Grasping the front rail in a stall with the mouth, whilst moving the head from side to side.
Tongue rolling The tongue is extruded from the mouth and moved by curling and uncurling outside or inside the oral cavity with no food present.
Champing Grinding and biting noisily without the presence of food.
Dog sitting Sitting upright on the haunches. Head weaving Repeatedly swinging the head from side to side
Drinker pressing Pressing an automatic drinker repeatedly without ingesting the water.
Feeder/trough interaction Repeated visits to an empty feeder or trough that may include chewing, biting, nudging and licking the feeder/trough.
Apathy A standing or sitting sows that does not react or engage with external stimuli (other sows, observers).
Stone chewing Repetitive chewing on and/or swallowing stones. General behaviours:
Vocalising Grunting, squealing, high or low pitch vocal sounds.
Foraging Looking or searching for food or materials.
Rooting Regular forward head movements with at least the disc of the snout beneath the substrate surface.
Floor/bedding manipulation Exploring or manipulating bedding or substrate. Eating Head in the feeder or chewing food. Drinking Use of water nipple or trough for drinking.
Wallowing Resting, rolling or wading in a pool of mud or water.
Social interaction (non aggressive) Nosing, sniffing, licking, mounting other sows.
Resting (contact) Lying on the belly or side whilst touching another group member/s.
Resting (no contact) Lying on the belly or side without physical contact with another group member/s.
Grooming Rubbing body against fixtures, scratching.
Agonistic Attack behaviour directed towards other sows that may include pushing, knocking, biting.
Escape/ retreat behaviour Change direction or move away to avoid another sow.