the wind resource: prospecting for good sites · wind characteristics at project site measure -...
TRANSCRIPT

The Wind Resource: Prospecting for Good Sites
Bruce Bailey, President AWS Truewind, LLC
255 Fuller Road
Albany, NY 12203 [email protected]

Talk Topics
Causes of Wind
Resource Impacts on Project Viability
Siting Linkages to Resource Assessment
Wind Resource Definition
Energy Production Prediction
Uncertainty Analysis
Due Diligence Objectives For Financing

What Causes Wind?
Uneven heating of the earth’s surface
Daily heating and cooling cycles
Earth’s rotation
Weather systems – track and intensity
Position of jet stream
Local influences – sea breezes, slope winds, channeling through valleys, etc.
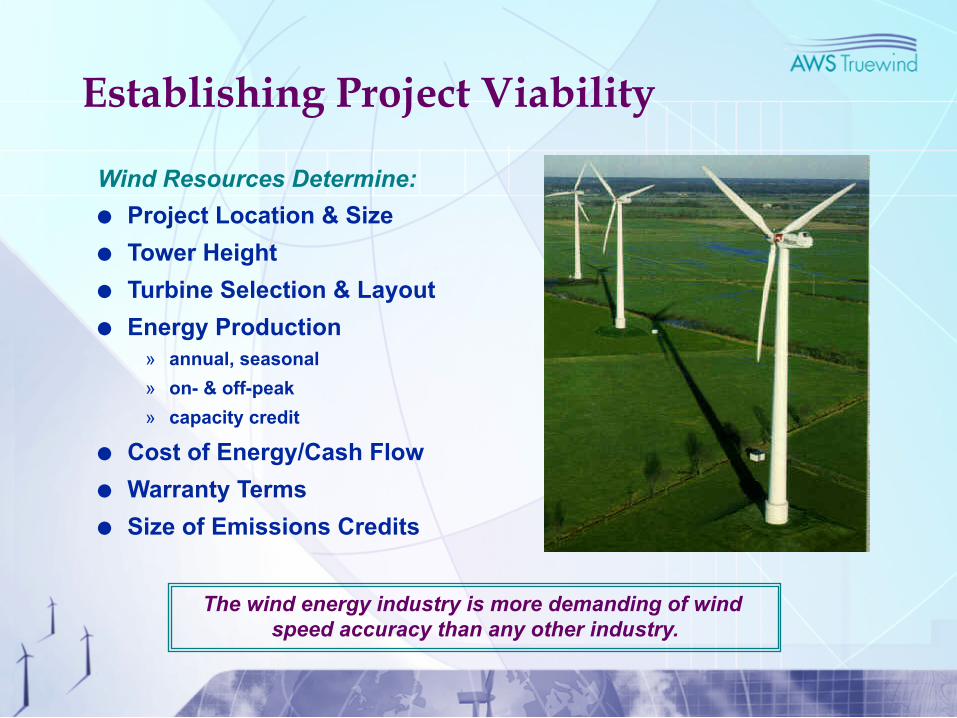
Wind Resources Determine:
Project Location & Size
Tower Height
Turbine Selection & Layout
Energy Production » annual, seasonal
» on- & off-peak
» capacity credit
Cost of Energy/Cash Flow
Warranty Terms
Size of Emissions Credits
The wind energy industry is more demanding of wind speed accuracy than any other industry.
Establishing Project Viability

Power in the Wind (W/m2)
Density = P/(RxT) P - pressure (Pa) R - specific gas constant (287 J/kgK) T - air temperature (K)
= 1/2 x air density x swept rotor area x (wind speed)3 ρ A V3
Area = π r2 Instantaneous Speed (not mean speed)
kg/m3 m2 m/s

Summary of Wind Resource Planning Steps
Identify Attractive Candidate Sites Collect >1 yr Wind Data Using Tall Towers
Adjust Data for Height and for Long-Term Climatic Conditions
Use Model to Extrapolate Measurements to All Proposed Wind Turbine Locations
Predict Energy Output From Turbines
Quantify Uncertainties

Siting
Siting
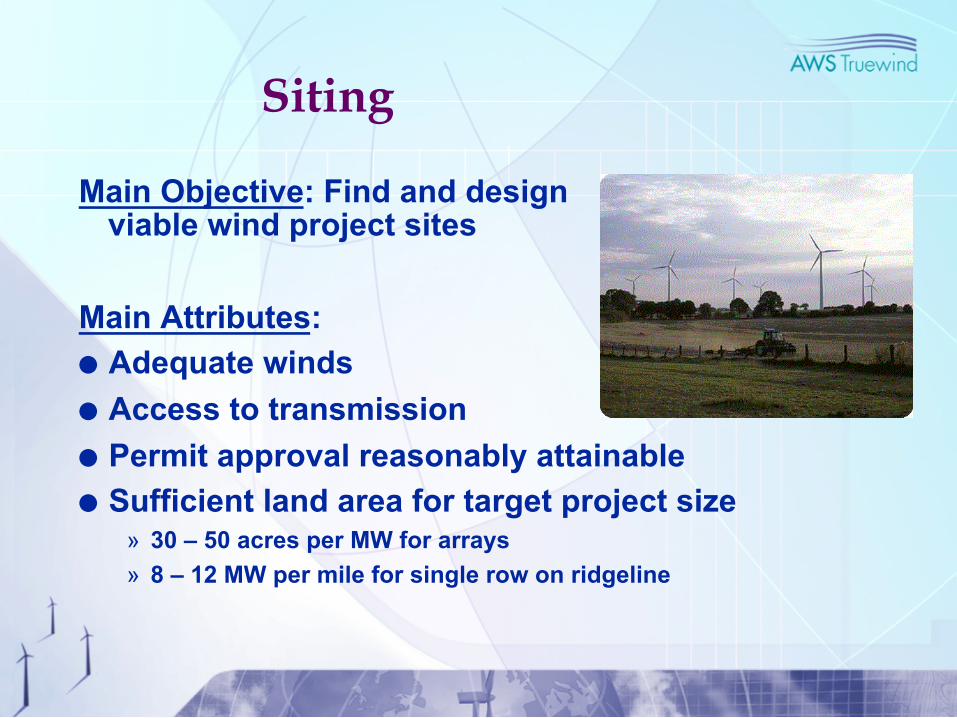
Main Objective: Find and design viable wind project sites
Main Attributes:
Adequate winds
Access to transmission
Permit approval reasonably attainable
Sufficient land area for target project size » 30 – 50 acres per MW for arrays
» 8 – 12 MW per mile for single row on ridgeline

Siting Attributes
Winds » Minimum Class 4 desired (>7 m/s @ hub height) for wind farms
Transmission » distance, voltage, excess capacity
Permit approval » land use compatibility » public acceptance » visual, noise, and bird/bat
impacts are leading issues
Land area » economies of scale with
larger project size » number of landowners
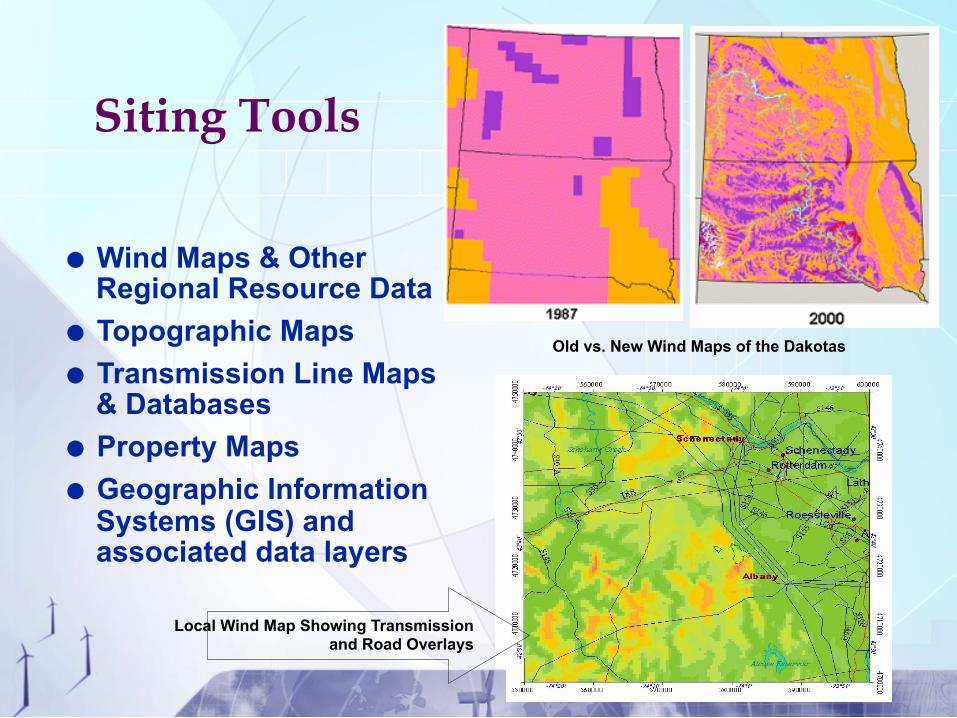
Siting Tools
Wind Maps & Other Regional Resource Data
Topographic Maps
Transmission Line Maps & Databases
Property Maps
Geographic Information Systems (GIS) and associated data layers
Old vs. New Wind Maps of the Dakotas
Local Wind Map Showing Transmission and Road Overlays
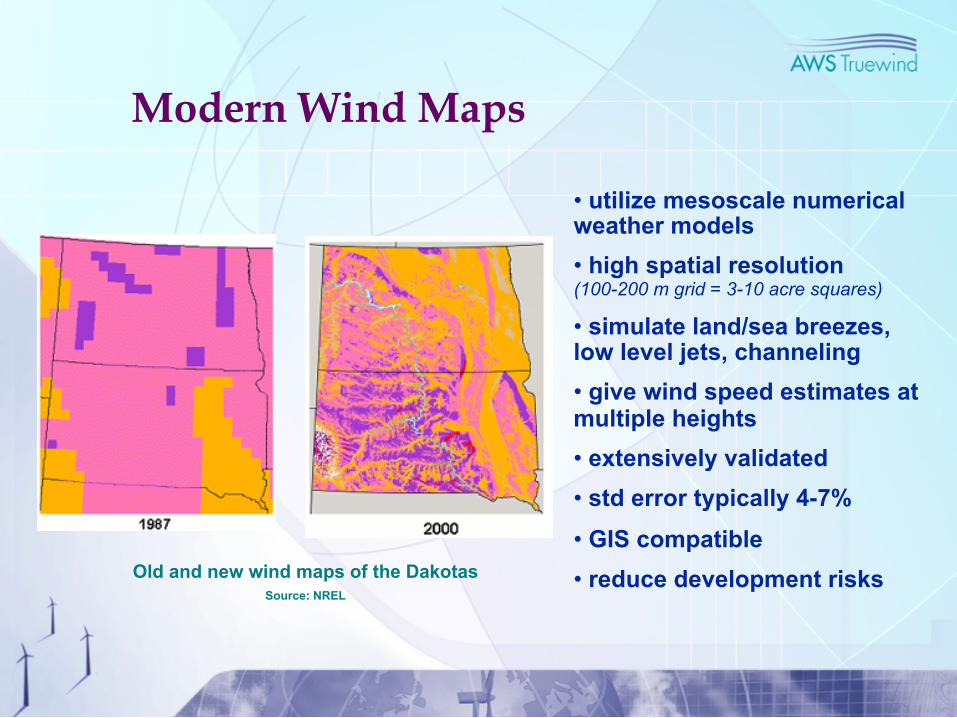
Modern Wind Maps
Old and new wind maps of the Dakotas Source: NREL
• utilize mesoscale numerical weather models
• high spatial resolution (100-200 m grid = 3-10 acre squares)
• simulate land/sea breezes, low level jets, channeling
• give wind speed estimates at multiple heights
• extensively validated
• std error typically 4-7%
• GIS compatible
• reduce development risks
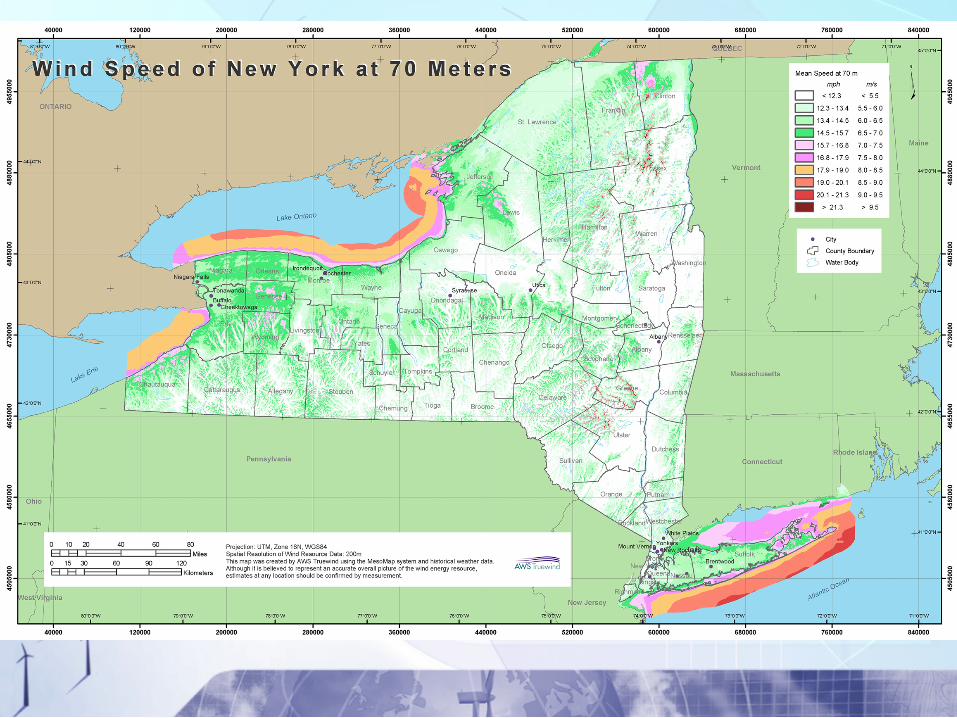

www.windexplorer.com/NewYork/NewYork.htm
Wind data projections available at a 200 m grid resolution statewide

Measurement
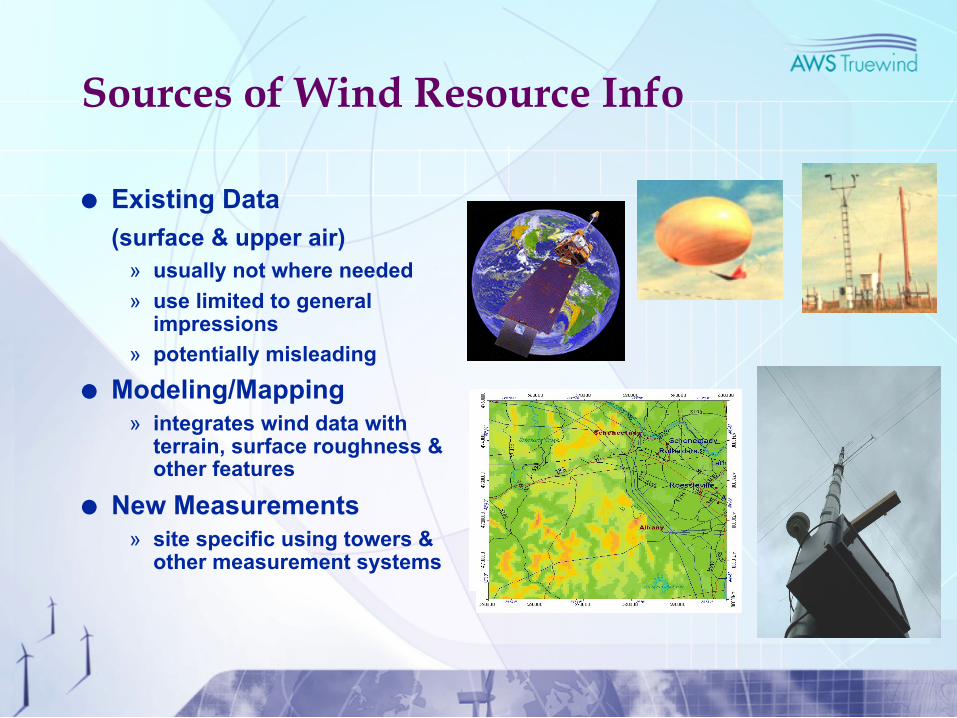
Sources of Wind Resource Info
Existing Data
(surface & upper air) » usually not where needed
» use limited to general impressions
» potentially misleading
Modeling/Mapping » integrates wind data with
terrain, surface roughness & other features
New Measurements » site specific using towers &
other measurement systems

How and What To Measure
Anemometers, Vanes, Data Loggers, Masts
Measured Parameters » wind speed, direction, temperature
» 1-3 second sampling; 10-min or hourly recording
Derived Parameters » wind shear, turbulence intensity, air density
Multiple measurement heights » best to measure at hub height
» can use shorter masts by using wind shear derived from two other heights to extrapolate speeds to hub height
Multiple tower locations, especially in complex terrain
Specialty measurements of growing importance » Sodar, vertical velocity & turbulence in complex terrain

Typical Monitoring Tower
• Heights up to 60 m
• Tubular pole supported by guy wires
• Installed in 1-2 days without concrete using 3 people
• Solar powered; cellular data communications

Raising the Tower

Final Touches / Sensor Orientation
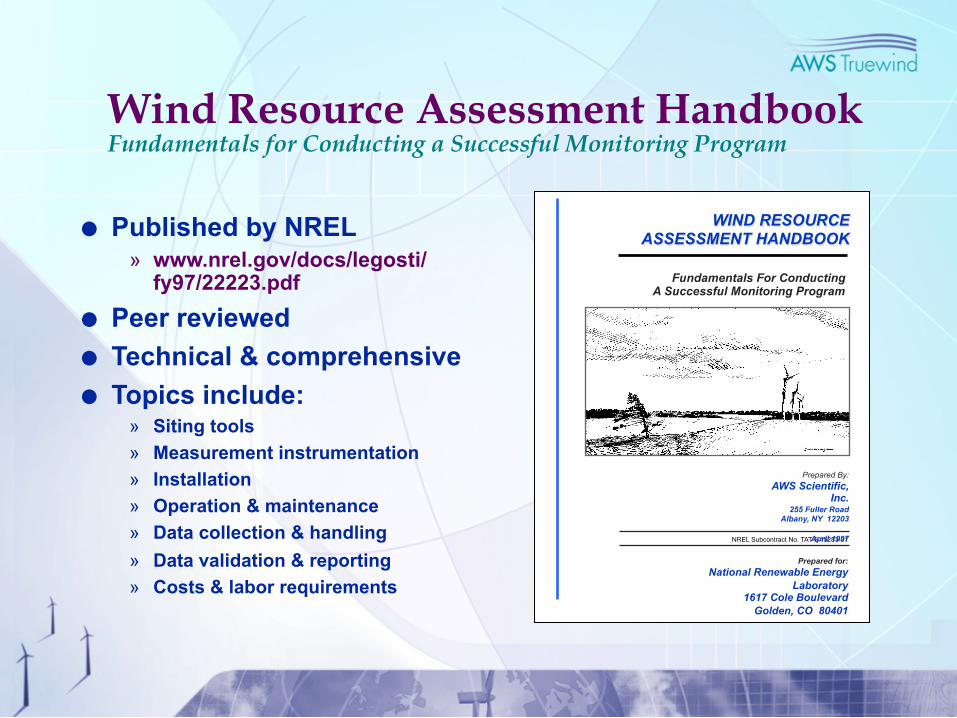
Wind Resource Assessment Handbook Fundamentals for Conducting a Successful Monitoring Program
Fundamentals For Conducting A Successful Monitoring Program
WIND RESOURCE ASSESSMENT HANDBOOK
Prepared for: National Renewable Energy
Laboratory 1617 Cole Boulevard
Golden, CO 80401
NREL Subcontract No. TAT-5-15283-01
Prepared By: AWS Scientific,
Inc. 255 Fuller Road
Albany, NY 12203
April 1997
Published by NREL » www.nrel.gov/docs/legosti/
fy97/22223.pdf
Peer reviewed
Technical & comprehensive
Topics include: » Siting tools
» Measurement instrumentation
» Installation
» Operation & maintenance
» Data collection & handling
» Data validation & reporting
» Costs & labor requirements
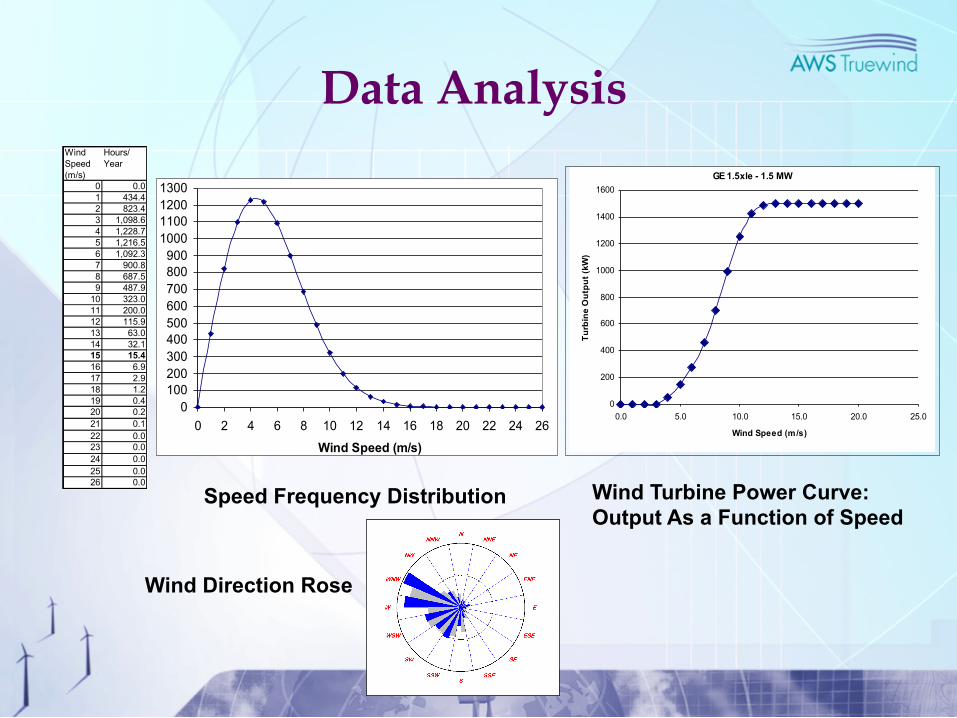
Data Analysis Wind Speed (m/s)
Hours/ Year
0 0.01 434.42 823.43 1,098.64 1,228.75 1,216.56 1,092.37 900.88 687.59 487.9
10 323.011 200.012 115.913 63.014 32.115 15.416 6.917 2.918 1.219 0.420 0.221 0.122 0.023 0.024 0.025 0.026 0.0
01002003004005006007008009001000110012001300
0 2 4 6 8 10 12 14 16 18 20 22 24 26
Wind Speed (m/s)
Pro
ba
bili
ty (
ho
urs
/ye
ar)
GE 1.5xle - 1.5 MW
0
200
400
600
800
1000
1200
1400
1600
0.0 5.0 10.0 15.0 20.0 25.0
Wind Speed (m/s)
Tu
rbin
e O
utp
ut
(kW
)
Speed Frequency Distribution Wind Turbine Power Curve: Output As a Function of Speed
Wind Direction Rose
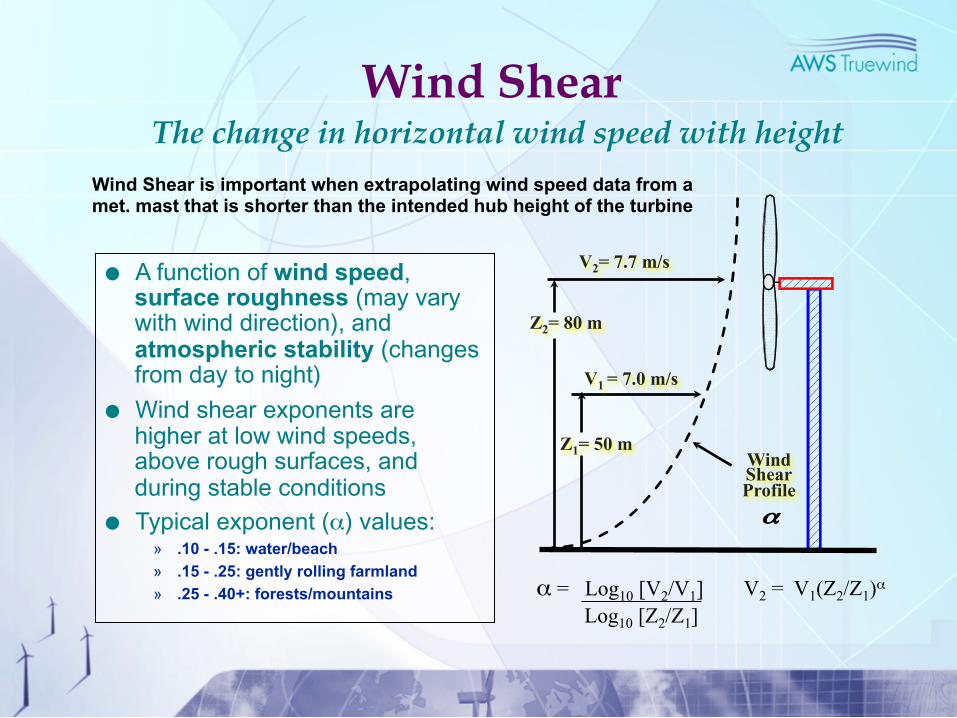
Wind Shear The change in horizontal wind speed with height
A function of wind speed, surface roughness (may vary with wind direction), and atmospheric stability (changes from day to night)
Wind shear exponents are higher at low wind speeds, above rough surfaces, and during stable conditions
Typical exponent (α) values: » .10 - .15: water/beach
» .15 - .25: gently rolling farmland
» .25 - .40+: forests/mountains α = Log10 [V2/V1] Log10 [Z2/Z1]
α
Wind Shear Profile
V2= 7.7 m/s
V1 = 7.0 m/s
Z2= 80 m
Z1= 50 m
V2 = V1(Z2/Z1)α
Wind Shear is important when extrapolating wind speed data from a met. mast that is shorter than the intended hub height of the turbine

Predicting Long-Term Wind Conditions From Short-Term Measurements
Measure one year of data on-site using a tall tower
Correlate with one or more regional climate reference stations
» Need high r2
» Reference station must have long-term stability
» Upper-air rawinsonde data may be better than other sources for correlation purposes
Predict long-term (7+ yrs) wind characteristics at project site
Measure - Correlate - Predict Technique
Airport A Regression y = 1.0501x + 0.4507
R 2 = 0.8763
Airport B Regression y = 1.4962x + 0.4504
R 2 = 0.875 Airport C Regression
y = 1.7278x + 0.7035 R 2 = 0.8801
0
5
10
15
20
25
0 5 10 15 20 Reference Station Mean Wind Speed (m/s)
Pro
ject
Sit
e 60
m W
ind
Sp
eed
(m
/s)
Airport A Airport B Airport C
This plot compares a site’s hourly data with three regional airport stations. A
multiple regression resulted in an r2 of 0.92.

Energy Prediction For Wind Farm
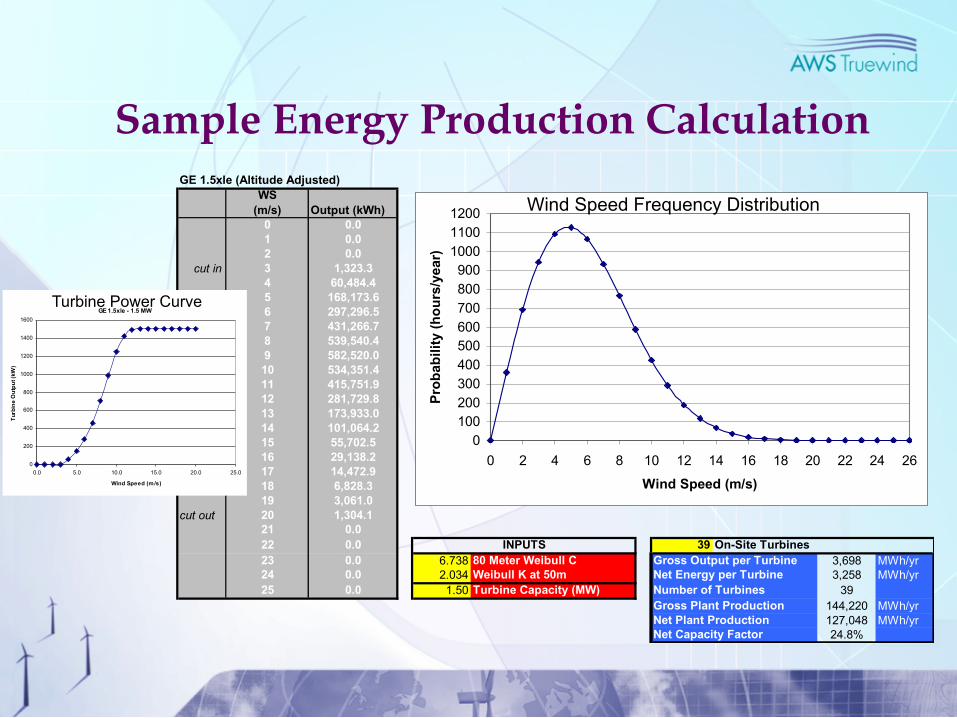
Sample Energy Production Calculation Appendix 2: Preliminary P50 Energy Production Estimate for Ayia Anna-Kochi Project Area
GE 1.5xle (Altitude Adjusted)WS
(m/s) Output (kWh)0 0.01 0.02 0.0
cut in 3 1,323.34 60,484.45 168,173.66 297,296.57 431,266.78 539,540.49 582,520.010 534,351.411 415,751.912 281,729.813 173,933.014 101,064.215 55,702.516 29,138.217 14,472.918 6,828.319 3,061.0
cut out 20 1,304.121 0.022 0.0 39 On-Site Turbines23 0.0 6.738 80 Meter Weibull C Gross Output per Turbine 3,698 MWh/yr24 0.0 2.034 Weibull K at 50m Net Energy per Turbine 3,258 MWh/yr25 0.0 1.50 Turbine Capacity (MW) Number of Turbines 39
Gross Plant Production 144,220 MWh/yrNet Plant Production 127,048 MWh/yrNet Capacity Factor 24.8%
INPUTS
0100200300400500600700800900100011001200
0 2 4 6 8 10 12 14 16 18 20 22 24 26
Wind Speed (m/s)
Pro
bab
ilit
y (h
ou
rs/y
ear)
Wind Speed Frequency Distribution
GE 1.5xle - 1.5 MW
0
200
400
600
800
1000
1200
1400
1600
0.0 5.0 10.0 15.0 20.0 25.0
Wind Speed (m/s)
Tur
bin
e O
utp
ut (
kW)
Turbine Power Curve
Energy Production Projection
Multiply wind speed frequency distribution data (annual hours per 0.5 or 1.0 m/s speed bin) by turbine power curve output values (for same speed bins)
» Power curve must be adjusted for site air density
Sum the product of all speed bins for the total gross energy production (MWh)
Determine production loss factors and their magnitude » Wakes, availability, electrical, blade soiling/icing, high wind
hysteresis, cold temperatures
» Cumulative losses are typically 10-15%
Deduct losses to calculate net energy production
Determine net production for different probability levels (P75, P90, P95, etc.) based on uncertainty analysis

Micrositing – Predicting Wind Conditions at Every Turbine, and Optimizing Turbine Locations
Software tools (WindFarmer, WindFarm, WindPro) are available to optimize the location and performance of wind turbines, once the wind resource within a project area is defined.
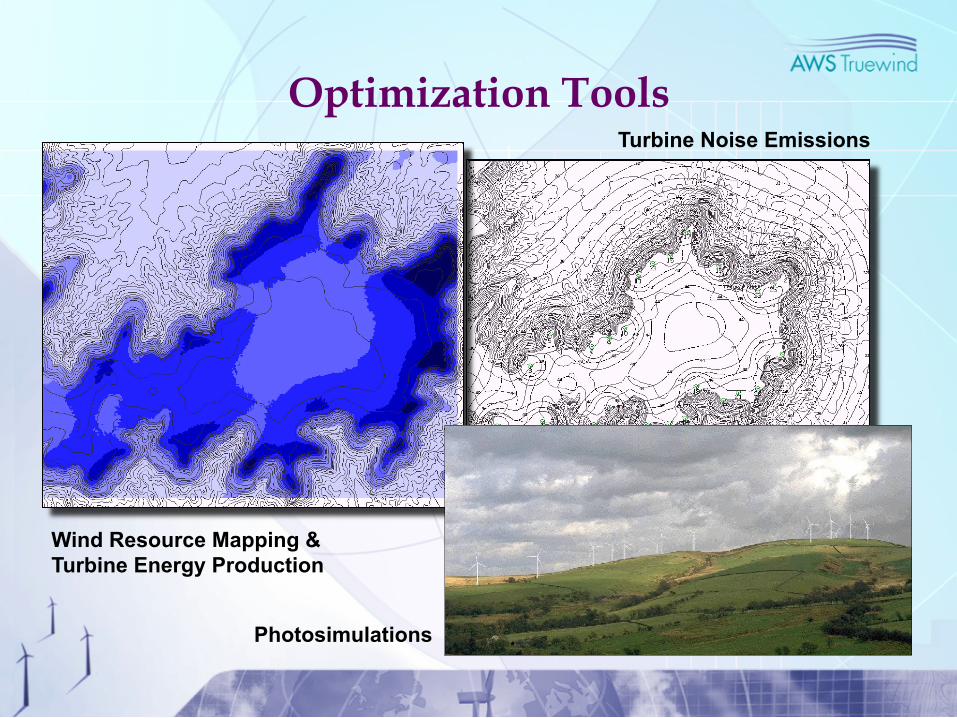
Optimization Tools
Wind Resource Mapping & Turbine Energy Production
Turbine Noise Emissions
Photosimulations
Conclusions
• The wind resource drives project viability.
• Wind conditions are site-specific and time/height variable.
• Accuracy is crucial. Wind resource assessment programs must be designed to maximize accuracy.
• Combination of measurement and modeling techniques gives the most reliable result.
• Know the uncertainties and incorporate into decision making.
• Good financing terms depend on it.