the winning and losing nations (or sunrise, sunset and serendipity – time to start dropping brics)...
TRANSCRIPT

The winning and losing nations (or Sunrise, Sunset and Serendipity – time to
start dropping BRICs)Sixth Gresham Lecture
Douglas McWilliamsMercers School Memorial Professor of Commerce at Gresham College
Centre for economics and business research ltd
Unit 1, 4 Bath Street, London EC1V 9DXt: 020 7324 2850 f: 020 7324 2855 e: [email protected] w: www.cebr.com
© Centre for economics and business research ltd, 2013 2
To examine which countries are likely to perform relatively better in the changed world and which ones are likely to perform relatively worse
Objective
© Centre for economics and business research ltd, 2013 3
The context – previous lectures in the series
Sunrise and sunset cycles
Time to start dropping BRICs
Sunrise economies
Sunset economies
Serendipity economies
Outlook to 2050
The 2013 Budget
Overview
© Centre for economics and business research ltd, 2013 4
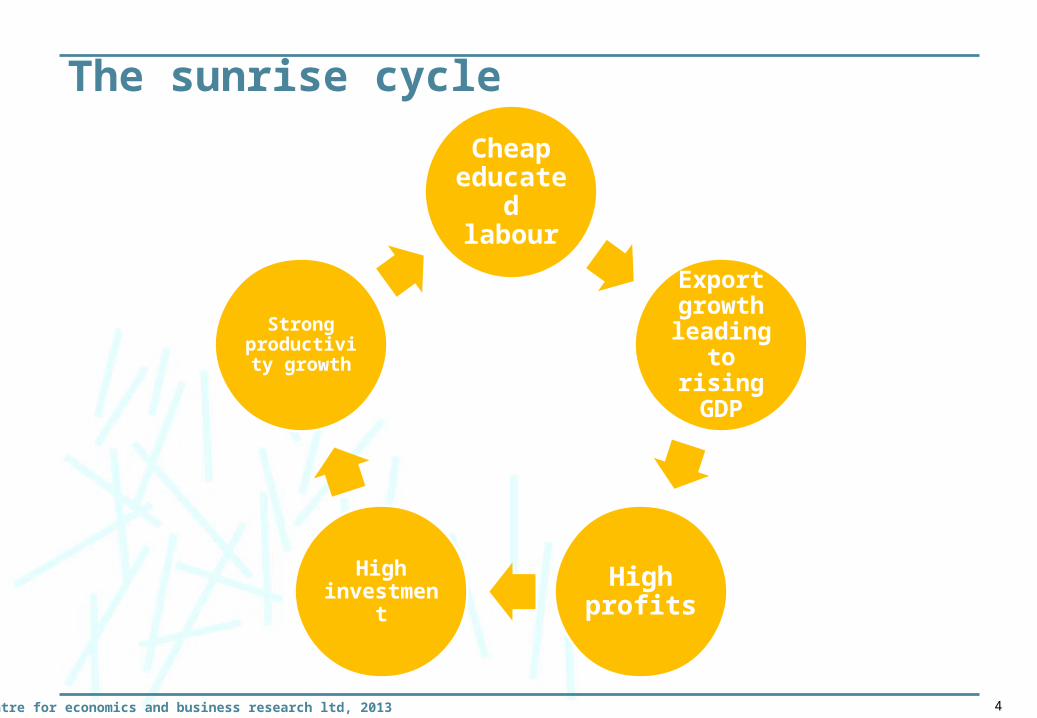
The sunrise cycle
Cheap educated
labour
Export growth
leading to rising GDP
High profits
High investment
Strong productivity
growth
© Centre for economics and business research ltd, 2013 5
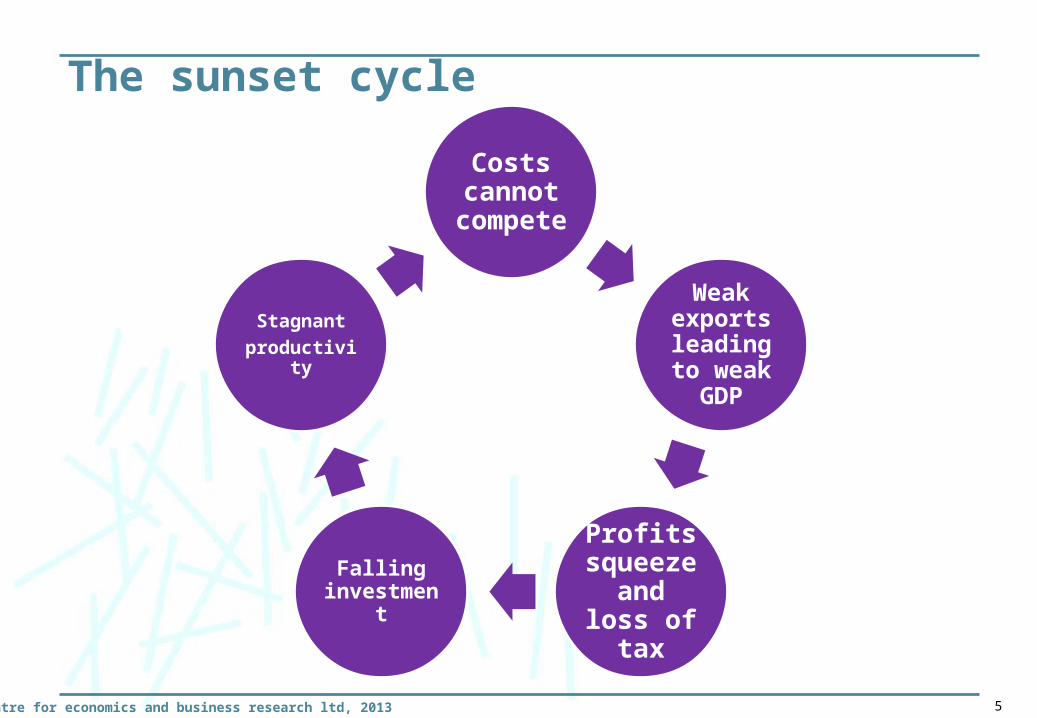
The sunset cycle
Costs cannot
compete
Weak exports
leading to weak GDP
Profits squeeze
and loss of tax
Falling investment
Stagnantproductivity
© Centre for economics and business research ltd, 2013 6
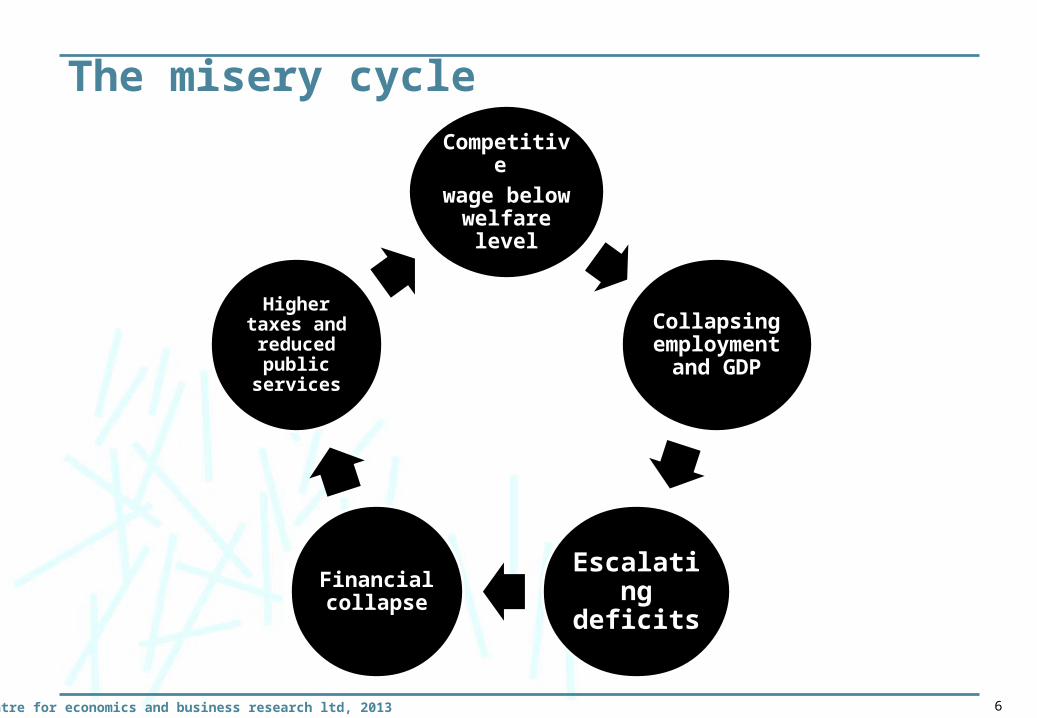
The misery cycle
Competitive wage below welfare level
Collapsing employment
and GDP
Escalating deficits
Financial collapse
Higher taxes and reduced
public services

© Centre for economics and business research ltd, 2013 7
Concept has been very helpful in boosting understanding of globalisation process
But increasingly the BRICs economies are becoming too diverse for one category
And it mixes those with internal dynamic growth with those who just got lucky with high energy or mineral prices
At the moment with energy and minerals prices high, both groups have had rapid growth in spending power
But in the future, these prices – though on average rising – will not rise further by as much and energy prices could even drop beyond 2020
Time to start dropping BRICs

© Centre for economics and business research ltd, 2013 8
The world economic league table 2012-2022
Rank, 2012
Rank, 2022 Country
2012 $ GDP
(billions)
2022 $ GDP
(billions)
Change from 2012
2013 $ GDP
(billions)Rank, 2012
Rank, 2022 Country
2012 $ GDP
(billions)
2022 $ GDP
(billions)
Change from 2012
1 1 United States 15,682 23,496 0 16,137 16 10 Indonesia 880 2,568 62 2 China 8,230 19,516 0 8,950 17 16 Turkey 783 1,748 13 3 Japan 5,958 7,375 0 5,947 18 19 Netherlands 773 948 -14 6 Germany 3,399 4,275 -2 3,354 19 18 Saudi Arabia 657 1,063 15 9 France 2,605 3,185 -4 2,540 20 25 Switzerland 632 683 -56 8 United Kingdom 2,443 4,061 -2 2,578 21 22 Sweden 525 775 -17 5 Brazil 2,257 4,389 2 2,470 22 26 Norway 501 661 -48 13 Italy 2,012 2,173 -5 1,925 23 21 Poland 490 826 29 7 Russia 1,954 4,242 2 2,094 24 33 Belgium 484 568 -9
10 4 India 1,819 4,935 6 2,111 25 23 Islamic Republic of Iran 484 771 211 11 Canada 1,818 2,511 0 1,839 26 27 Argentina 475 643 -112 14 Australia 1,541 2,014 -2 1,581 27 20 Taiwan Province of China 475 894 713 17 Spain 1,350 1,385 -4 1,296 28 36 Austria 398 514 -814 15 Mexico 1,178 2,005 -1 1,206 29 30 South Africa 384 629 -115 12 Korea 1,151 2,304 3 1,234 30 24 Thailand 366 695 6

© Centre for economics and business research ltd, 2013 9
China
India
Indonesia
Korea
Mexico
Turkey
Taiwan
Thailand
Nigeria
Sri Lanka
Sunrise economies

© Centre for economics and business research ltd, 2013 10
US
Japan
Europe
Sunset economies
© Centre for economics and business research ltd, 2013 11
Russia
Brazil
Canada
Australia
Saudi Arabia
Serendipity economies

© Centre for economics and business research ltd, 2013 12
Ethnic composition of US population forecast for 2050
2005 2050
Foreign born 12 19
White 67 47
Hispanic 14 29
Black 13 13
Asian 5 9
Source: Pew Research Centre

© Centre for economics and business research ltd, 2013 13
World outlook for GDP for large economiesBillions of US dollars, current prices at market exchange rates
© Centre for economics and business research ltd, 2013 14
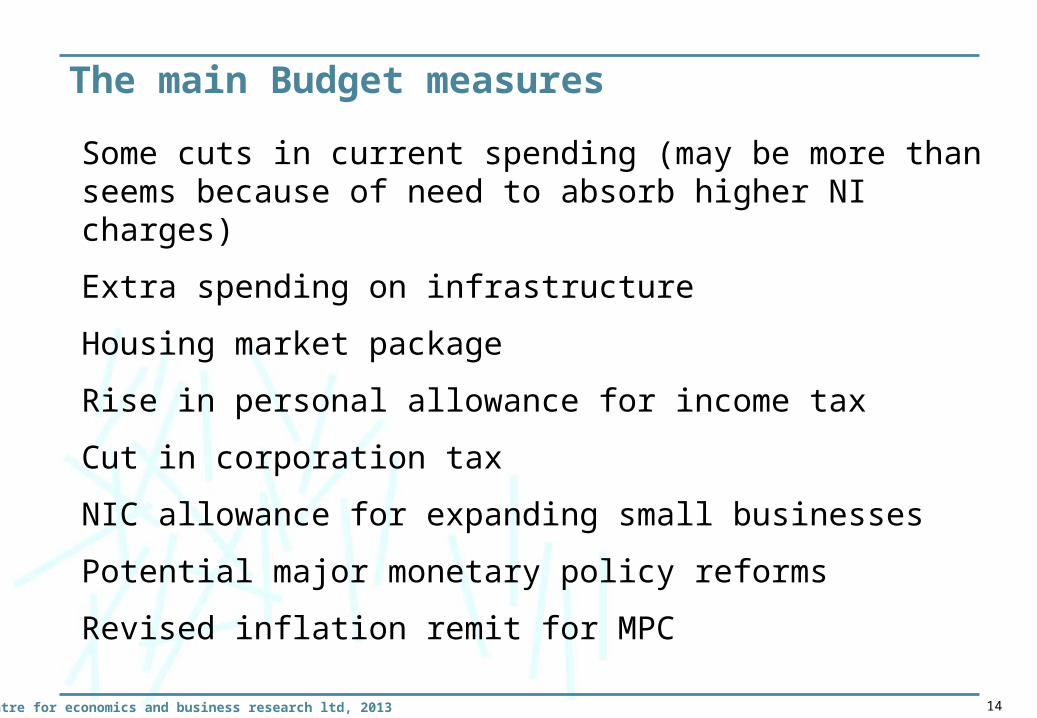
Some cuts in current spending (may be more than seems because of need to absorb higher NI charges)
Extra spending on infrastructure
Housing market package
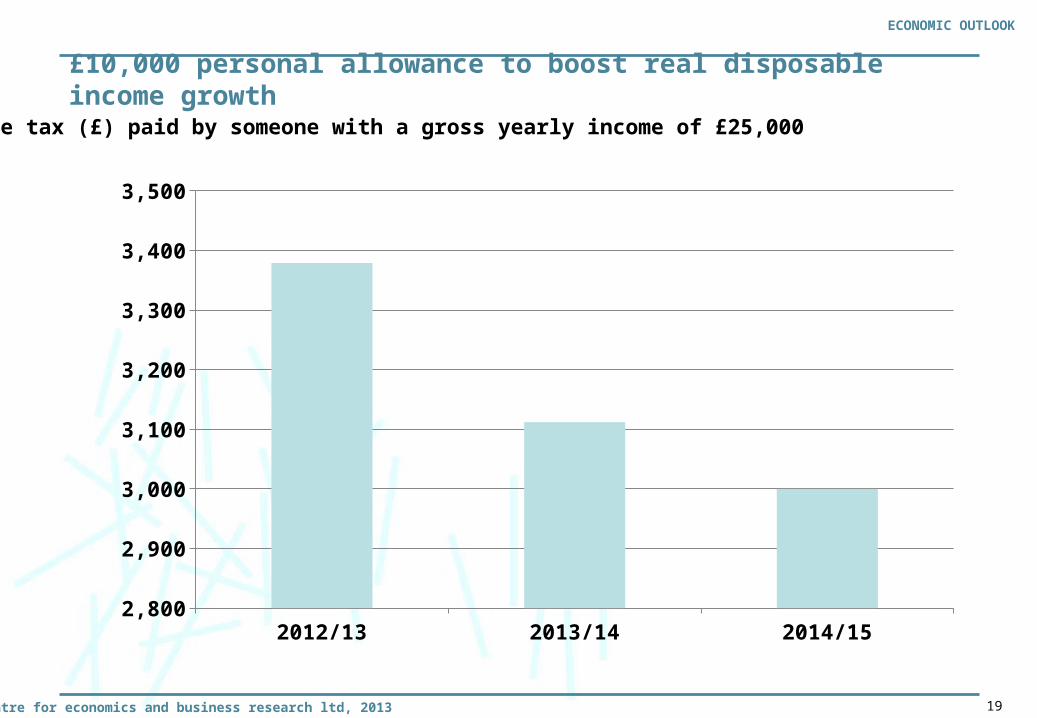
Rise in personal allowance for income tax
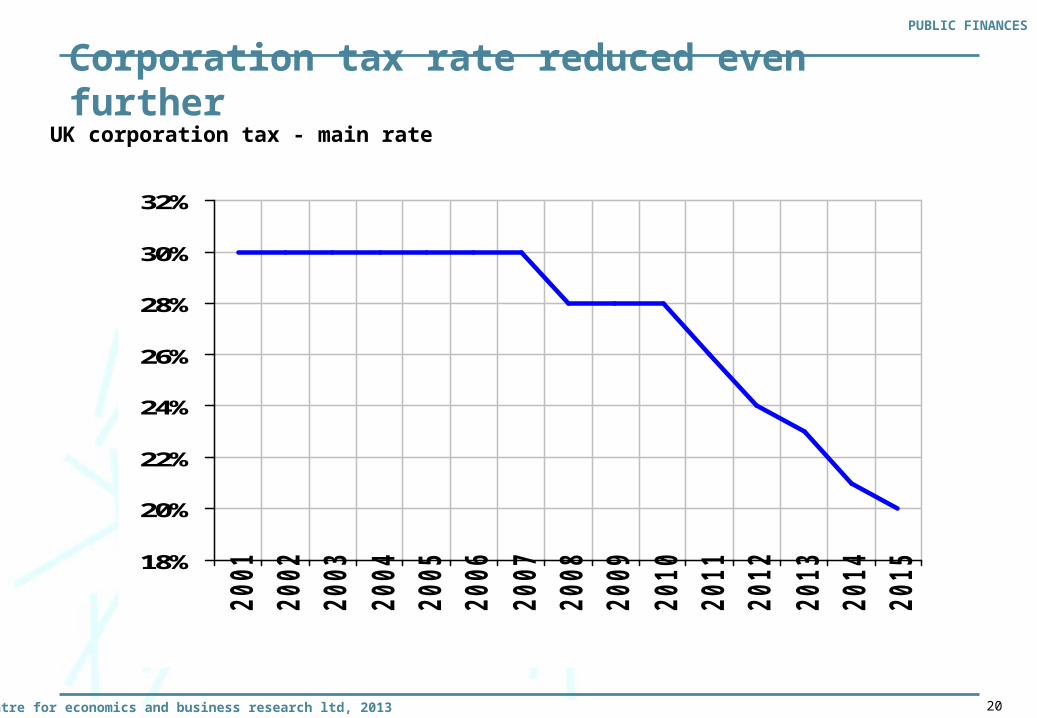
Cut in corporation tax
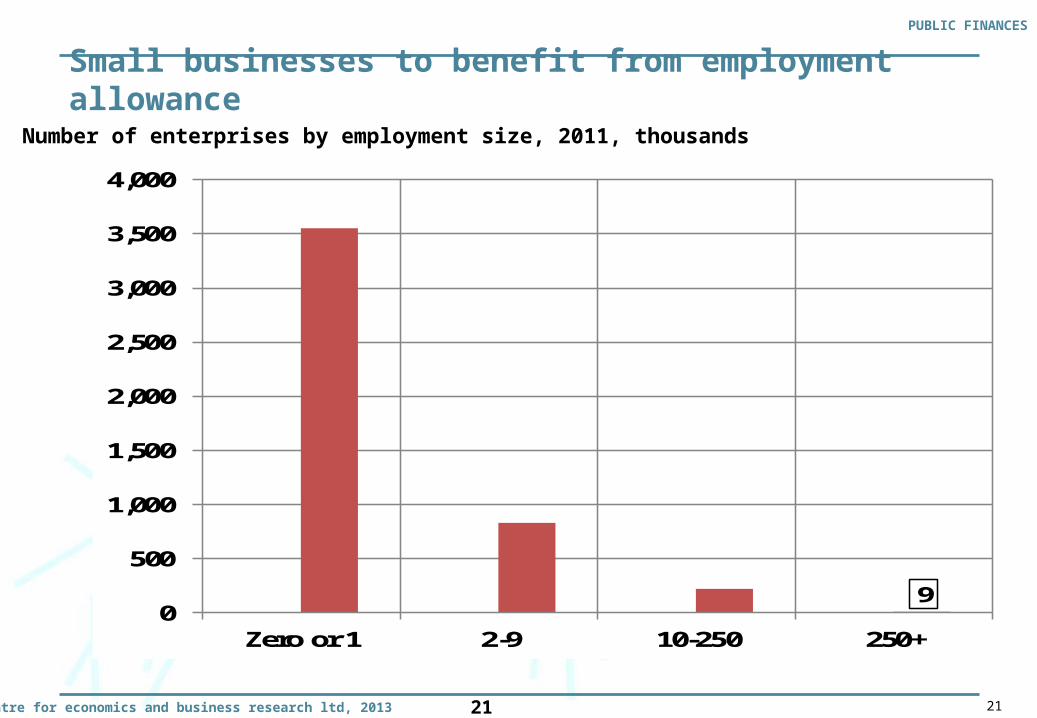
NIC allowance for expanding small businesses
Potential major monetary policy reforms
Revised inflation remit for MPC
The main Budget measures

© Centre for economics and business research ltd, 2013 15
Unrealistic hopes of a quick Eurozone recovery persist
-5%
-4%
-3%
-2%
-1%
0%
1%
2%
3%
4%2
00
2
20
03
20
04
20
05
20
06
20
07
20
08
20
09
20
10
20
11
20
12
20
13
20
14
20
15
20
16
20
17
Cebr OBR Budget 2013
Eurozone real gross domestic product, annual percentage change

© Centre for economics and business research ltd, 2013 16
OBR still looks too optimistic on growth in the medium-term
ECONOMIC OUTLOOK
-5
-4
-3
-2
-1
0
1
2
3
4
5
20
00
20
01
20
02
20
03
20
04
20
05
20
06
20
07
20
08
20
09
20
10
20
11
20
12
20
13
20
14
20
15
20
16
20
17
20
18
Cebr OBR Budget 2013
UK real gross domestic product, annual percentage change
© Centre for economics and business research ltd, 2013 17
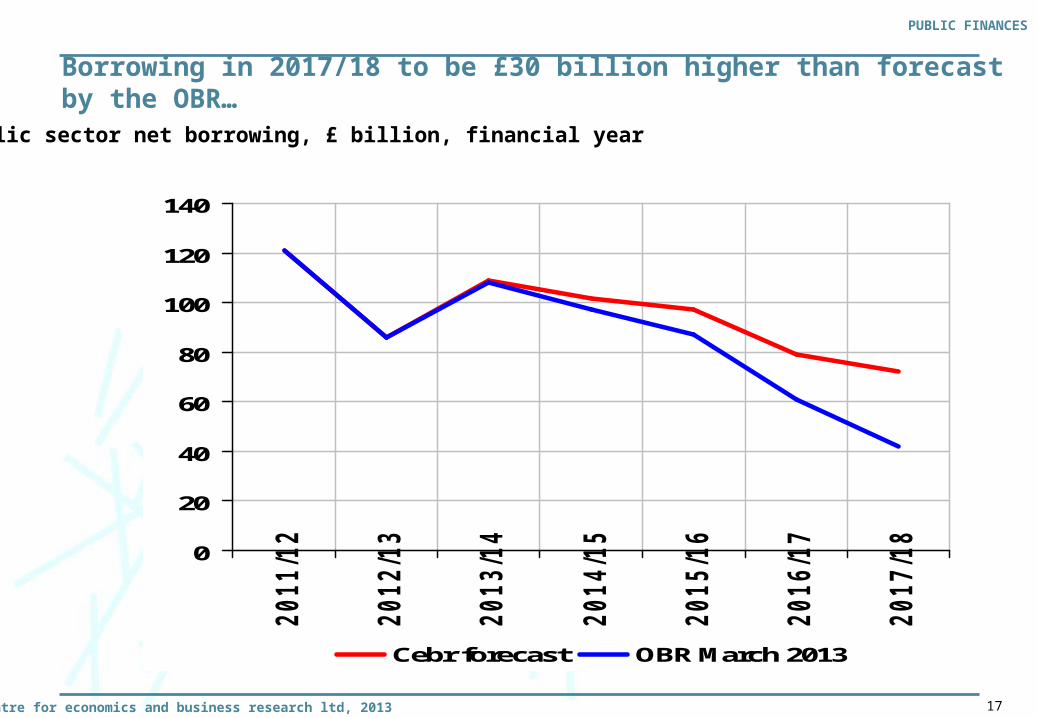
Borrowing in 2017/18 to be £30 billion higher than forecast by the OBR…
PUBLIC FINANCES
0
20
40
60
80
100
120
140
20
11
/12
20
12
/13
20
13
/14
20
14
/15
20
15
/16
20
16
/17
20
17
/18
Cebr forecast OBR March 2013
Public sector net borrowing, £ billion, financial year

© Centre for economics and business research ltd, 2013 18
… with the debt:GDP ratio rising above 90%
PUBLIC FINANCES
Net debt as a percentage of GDP, fiscal years
70
75
80
85
90
95
20
11
/12
20
12
/13
20
13
/14
20
14
/15
20
15
/16
20
16
/17
20
17
/18
OBR March 2013 Cebr
© Centre for economics and business research ltd, 2013 19
£10,000 personal allowance to boost real disposable income growth
ECONOMIC OUTLOOK
Income tax (£) paid by someone with a gross yearly income of £25,000
2012/13 2013/14 2014/152,800
2,900
3,000
3,100
3,200
3,300
3,400
3,500
© Centre for economics and business research ltd, 2013 20
Corporation tax rate reduced even furtherUK corporation tax - main rate
18%
20%
22%
24%
26%
28%
30%
32%
20
01
20
02
20
03
20
04
20
05
20
06
20
07
20
08
20
09
20
10
20
11
20
12
20
13
20
14
20
15
PUBLIC FINANCES
© Centre for economics and business research ltd, 2013 21
Small businesses to benefit from employment allowance
21
Number of enterprises by employment size, 2011, thousands
PUBLIC FINANCES
90
500
1,000
1,500
2,000
2,500
3,000
3,500
4,000
Zero or 1 2-9 10-250 250+

© Centre for economics and business research ltd, 2013 22
Help to buy scheme launched to support new and existing home purchases
Approvals of loans for home purchases, thousands
PUBLIC FINANCES

© Centre for economics and business research ltd, 2013 23
New MPC remit could pave the way for medium-term interest rate commitments
0
1
2
3
4
5
6
De
c-0
3
De
c-0
4
De
c-0
5
De
c-0
6
De
c-0
7
De
c-0
8
De
c-0
9
De
c-1
0
De
c-1
1
De
c-1
2
De
c-1
3
De
c-1
4
De
c-1
5
De
c-1
6
De
c-1
7
De
c-1
8
Bank of England Bank Rate, percentage
MONETARY POLICY

© Centre for economics and business research ltd, 2013 24
Long term borrowing rates to rise but remain extremely low
0
1
2
3
4
5
6
Q4
20
03
Q4
20
04
Q4
20
05
Q4
20
06
Q4
20
07
Q4
20
08
Q4
20
09
Q4
20
10
Q4
20
11
Q4
20
12
Q4
20
13
Q4
20
14
Q4
20
15
Q4
20
16
Q4
20
17
Q4
20
18
Yield on 10 year government bonds, percentage
MONETARY POLICY
Forecast

The winning and losing nations (or Sunrise, Sunset and Serendipity – time to start dropping BRICs)
Douglas McWilliams, Mercers’ School Memorial Professor of Commerce at Gresham College and Chief Executive of Cebr