the world freedom select investment strategy. overview founded in 1974, j.w. burns & company is...
TRANSCRIPT

The World Freedom Select Investment Strategy

OverviewFounded in 1974, J.W. Burns & Company is an SEC-registered investment advisory firm providing portfolio management to institutions and individuals.
•ExperienceAverage professional investment experience of over
25 years.•Stability
Low turnover in investment professionals.Well-established regulatory compliance program.
•IngenuityAdding value by combining contemporary empirical research with traditional asset management
methods. •Discipline
Dedicated solely to asset management.Carefully managing risk while seeking long termcapital appreciation.
•Principled Bettering the world through investment in economic
freedom.

Key PersonnelJames A. Sanderson, Senior Portfolio Manager•Began his career with Marine Midland Bank (now HSBC) in Buffalo, and later served as Vice President of Trust Investments for Marine Midland in Rochester. Chief Investment Officer of the Cornell University Endowment. Founded Sanderson Capital Management (later Sanderson & Stocker, Inc.). Holds a BA degree from Dartmouth College and an MBA in Finance from the Amos Tuck School at Dartmouth.
James C. Burns, CFA, President, Chief Investment Officer•Chartered Financial Analyst (CFA), member of the Rochester Society of Security Analysts as well as the Syracuse Bond Club. Graduated from St. John Fisher College with a Bachelor of Arts in Communications/Journalism and a concentration in Political Science.

Philosophy
Economic freedom correlates with superior equity returns
Specific differences in economic freedom at the country-level offer significant investment opportunities
International investments complement a total portfolio by:
reducing volatilitypotentially enhancing performancecurrency hedge opportunity

Economic FreedomGovernment policies affecting economic freedom account for variations in:
Equity market size as percentage of GDP (Li 2002, La Porta 1997)
Gross Domestic Product (GDP) growth rates (Gwartney 2004)
Investment and Productivity growth rates (Gwartney 2004)
Socio-economic well-being (Gwartney 2004)
Equity returns (Stocker 2005)
Economic freedom exists when:
“…citizens have secure rights to property, are free to engage in voluntary transactions
(domestically and internationally), free of government control over contractual terms, and
free from governmental expropriation (by confiscatory taxation or unanticipated
inflation).” - Rabushka 1991

Why Economic Freedom is Important
Economic Freedom & Life Expectancy
53.7
64.7 63.9
73.775.9
50
55
60
65
70
75
80
Bottom Fourth Third Second Top
EFW Index Quintiles, 2002(Source: Gwartney & Lawson 2004)
Lif
e E
xp
ecta
ncy a
t B
irth
,
tota
l (Y
ears
), 2
002
UNFREE FREE

Economic Freedom & Child Labor
21.4%
9.9% 10.3%
1.0% 0.6%
0%
5%
10%
15%
20%
25%
Bottom Fourth Third Second Top
EFW Index Quintiles, 2002(Source: Gwartney & Lawson 2004)
Ch
ildre
n (
Ag
e 10
-14)
in
Lab
or
Fo
rce,
200
2
Why Economic Freedom is Important, Cont.
UNFREE FREE

Economic Freedom & Per Capita Income
$2,828$5,285 $6,551
$14,461
$26,106
0
5,000
10,000
15,000
20,000
25,000
30,000
Bottom Fourth Third Second Top
EFW Index Quintiles, 2002(Source: Gwartney & Lawson 2004)
GD
P p
er C
apit
a, P
PP
(C
urr
ent
Int.
$)
2002
UNFREE FREE
Why Economic Freedom is Important, Cont.

Why Economic Freedom Pays Equity valuation model influenced by change in economic freedom Future capital flows affected by change in economic freedom
Changes in economic freedom are directly correlated with equity returns
Change in Economic Freedom and Annualized Equity Returns
-2.0%
0.0%
2.0%
4.0%
6.0%
8.0%
10.0%
12.0%
Ave
rag
e A
nn
ual
ized
Eq
uit
y In
dex
Ret
urn
Increasing Economic Freedom 10.1 %
Decreasing Economic Freedom
- 0.9 %
*Source: Equity Returns and Economic Freedom by Marshall Stocker, Cato Journal, Vol. 5, No.3, Fall 2005 The graphs of equity returns shown above represent a cross-country analysis of the average annualized return (in US$) of selected MSCI equity indices during a selected period and does not represent the performance of actual client accounts of Sanderson & Stocker. The performance data shown in the study does not reflect costs for trading, investment management, or other expenses that would be incurred with an actual client account. The broad market index returns included in the study will differ from returns in the World Freedom Select Strategy in which individual securities are selected. Furthermore, the World Freedom Select Strategy differs from the study in that the securities used in the WFS strategy are asset-weighted and the indices used in the study were equal-weighted. The study which Mr. Stocker conducted relating to this graph was funded by Sanderson & Stocker, Inc. Past results as shown in the study are no guarantee of future results. Performance results may be materially affected by market and economic conditions. Individual investor results will vary.
Equal Weighted Annualized Returns (US$) for Countries with Increasing or Decreasing Economic Freedom (1970 – 2000)*

Change in Economic Freedom and Annualized Equity Returns: Bear Market (2000 - 2002)
-12%
-10%
-8%
-6%
-4%
-2%
0%
Ave
rag
e A
nn
ual
ized
Eq
uit
y In
dex
Ret
urn
Increasing Economic Freedom - 3.0 %
Decreasing Economic Freedom-11.0 %
Declining (Bear) Market Equal Weighted Annualized Returns (US$) for Countries with Increasing or Decreasing Economic
Freedom (2000 - 2002)*
Why Economic Freedom Pays, Cont.
* Please see previous page

Effects on Equity Markets• How Economic Freedom May Affect Stock Prices:
• Size of Government: Shrinking government enterprises decreases financing and operating expenses to private firms, thus increasing equity values.
• Legal Structure and Security of Property Rights: Changes which make property rights more secure and give equity holders better recourse against fraudulent securities transactions lower uncertainty risk to investors, thus decreasing the discount rate, and increasing equity valuations.
• Access to Sound Money: Investments that create cash flows in a currency which experiences a decreased volatility in the rate of inflation will lower uncertainty risk to investors, thus decreasing the discount rate, and increasing equity valuations.
• Freedom to Trade Internationally: Trade liberalization, which increases a company’s ability to pursue international markets, increases expected cash flow and subsequently equity values.
• Regulation of Credit, Labor, and Business: Lower regulation costs increase cash flows and subsequently equity values.

Strategy
World Freedom Select strategy seeks to:
Blend philosophical principals with sound investment methods
Invest in countries which:
have governments committed to furthering economic freedom
have economic policies that promote socio-economic well-being
deliver attractive returns with a low correlation to U.S. indices

Investment ProcessOVERVIEW
Review client objective and guidelines
Quantitative evaluation of cross-country differences in economic freedom
Utilization of over 40 discrete variables
Qualitative study of policy environment & developments
Identification of countries with increasing economic freedom
Construct portfolio
Ongoing review

Investment Selection
NON - U.S. COUNTRIES (40+) ETF’S, ADR’S, CLOSED END FUNDS
FILTER FOR INCREASING ECONOMIC FREEDOM
(using multi-variable model)
TARGET UNIVERSE
SELECT WEIGHTINGS FOR COUNTRIES W/ INCREASING
ECONOMIC FREEDOM
PORTFOLIOS

Quantitative Analysis Establishes recent level & direction of change of
economic freedom
Provides timely measures
Requires proprietary collation of multiple discrete variables, such as:
Business Regulations Administrative Conditions for New Businesses Credit Market Regulation Freedom to Trade Internationally Inflation Impartial Courts Tariff Rates Government consumption as % of GDP
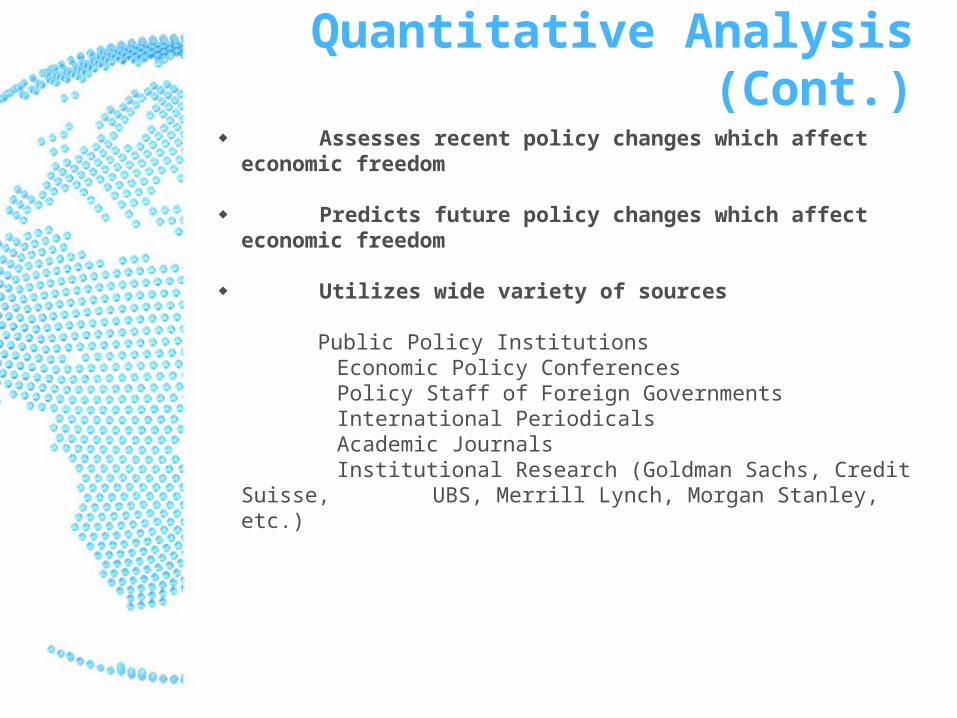
Quantitative Analysis (Cont.)
Assesses recent policy changes which affect economic freedom
Predicts future policy changes which affect economic freedom
Utilizes wide variety of sources
Public Policy Institutions Economic Policy Conferences Policy Staff of Foreign Governments International Periodicals Academic Journals Institutional Research (Goldman Sachs, Credit Suisse,
UBS, Merrill Lynch, Morgan Stanley, etc.)

Sell Discipline and Risk Mgt.
Decisions to sell triggered by: Portfolio Profile Rebalance of the portfolio’s risk-reward profile Country SpecificNegative change in economic freedom outlook
Risk Management
Diversification is accomplished by: Investing in a variety of countries and geographic regions Utilization of multi-variable model Utilization of broad equity indices where available to minimize idiosyncratic risk

WFS Fund – How it Works
Portfolio ManagementAs a registered investment advisor (and unlike a commingled mutual fund), J.W. Burns & Company manages each client’s account separately. By signing an investment management agreement, you give us a limited power of attorney to direct the investments in your account.In order to establish a client relationship with J.W. Burns & Company, you must maintain a Primary Account of at least $500,000. We charge a percentage fee based on the assets in the account. You are billed quarterly based on the account’s total market value as of the last day of the preceding quarter. The following annual percentages are charged:
1.00% of the first $5,000,000; plus0.75% of the next $5,000,000; plus
0.50% of amounts over $10,000,000Minimum Annual Fee: $10,000
CustodyJ.W. Burns & Company does not custody your assets. Assets are custodied at either Schwab Institutional1 or at a qualified bank custodian. To start your account, you may write a check and/or transfer securities to the custodian. We will help you in this process.
BrokerageFor accounts custodied at Schwab Institutional, J.W. Burns & Company executes clients’ trades through Schwab Institutional whose current commission schedule is $9.95 flat fee per tradee. For accounts custodied at a qualified bank custodian, we execute trades through various institutional brokerage firms.
1 J.W. Burns & Company is not affiliated with nor does it receive any compensation from Schwab Institutional.2For accounts with assets over $1 million.

WFS Fund – Summary
Successful track record managing institutional assets
Stable – strong compliance and backoffice
Seasoned, accessible investment team
Focused – dedicated to asset management
Progressive – combining traditional asset management with contemporary empirical research
Principled – bettering the world by investing in economic freedom

Important Disclosures
Past performance may not be indicative of future results. The above individual account performance information reflects the reinvestment of dividends, and is net of applicable transaction fees, J.W. Burns & Company’s investment management fee and any other related account expenses. Account information has been compiled solely by J.W. Burns & Company, has not been independently verified, and does not reflect the impact of taxes on non-qualified accounts. In preparing this report, J.W. Burns & Company has relied upon information provided by the account custodian. Please remember to contact J.W. Burns & Company if there are any changes in your personal/financial situation or investment objectives for the purpose of reviewing/evaluating/revising our previous recommendations and/or services. Please also advise us if you would like to impose, add, or to modify any reasonable restrictions to our investment advisory services. A copy of our current written disclosure statement discussing our advisory services and fees continues to remain available for your review upon request. Historical performance results for investment indices and/or categories have been provided for general comparison purposes only, and generally do not reflect the deduction of transaction and/or custodial charges, the deduction of an investment management fee, nor the impact of taxes, the incurrence of which would have the effect of decreasing historical performance results. It should not be assumed that your account holdings correspond directly to any comparative indices.