the world is flat. group work norms we are going to be doing some group work today. for us to be...
TRANSCRIPT

The World is Flat

Group Work Norms
• We are going to be doing some group work today.
• For us to be able to discuss but also stay on track, when your time is up on a topic, I will raise my hand. As soon as you see me or someone else raise a hand and quit talking, you raise your hand and quit talking.
• We should be able to do this in less than 5 seconds.
• You have sticky notes on your table so you can jot down important things to talk about later.

It’s time to meet people
• When I give you the topic, each SLC must line themselves up according to the topic.
• Which SLC is the fastest? We’ll see.
• The topic is:
• Go!
Your Birthdays!
Month and Day
only!

Team Interview
• Each person write 5 things you’d like to know about your teammates summer.
• One person stand and everyone interviews for 60 seconds.
• Remaining teammates are interviewed.

Norms
• Large-group Learning
• \\briana\kgarrett$\My Documents\Leadership Team\BHS Leadership Team Norms0910.docx
• What do you need from others in the room to enhance your learning?

Today’s Outcomes:
• To understand how the world has changed and how schools must keep up with the changes.
• To understand the cost of failure.
• To understand the purpose and reason for Professional Learning Communities (PLCs) and Small Learning Communities (SLCs).

The likely pathways for students who struggle in school are:• 1. Poverty
• 2. Welfare
• 3. Incarceration
• 4. Death

Poverty
• Dropouts on average earn about $12,000 per year, nearly 50 percent less than those who have a high school diploma.
• 50 percent less likely to have a job that offers a pension plan or health insurance.
• They are more likely to experience health problems.
• - Rouse/Muenning, 2005: www.centerforpubliceducation.org

Poverty
• 43 percent of people with the lowest literacy skills live below the government’s official poverty line.
• Larry Roberts, Illiteracy on the Rise in America
• http://www.lwsws.org

Welfare
• 75% of those claiming welfare are functionally illiterate.
• http://www.convinaliteracy.org/facts.htm

Incarceration
• Across the United States, 82% of prison inmates are dropouts. Ysseldyke, Algozzine, & Thurlow 1992
• 3rd grade Reading scores are the most consistent predictor for the number of future prison beds.

Incarceration
• According to the report, Literacy Behind Prison Walls, 70 percent of all prison inmates are functionally illiterate or read below a fourth-grade level. http://www.proliteracy.org
• 85% of juvenile offenders have reading problems. http://www.literacybuffalo

Incarceration
• Youth in Correctional Facilities
• Average age: 15
• Average Reading Level: 4th grade (30% below this level) www.edjj.org

Incarceration and Special Education• The incidence of learning disabilities among the
general population based on U.S. Dept. of Education and local service providers is around 5%. This is in sharp contrast with the number of LD students in the criminal justice system, estimated to be as high as 50%. Bell, 1990

Incarceration & Special Education• Only 57% of youth with disabilities graduated
from high school in the 2001-2002 school year, according to the U.S. Department of Education (2002). http://www.ncset.org

Incarceration Costs
• For every 1% we raise the national graduation rate equals 1.8 billion we save in incarceration costs.

Talking Chips (pens)
• Participants place your chip (pen) in the center before talking.
• Participants cannot talk once their pen is placed in the center.
• When all of the pens are in the center, the process repeats.
• Discuss – What surprises you the most from this data?

20th Century Educational System• Was created to sort students
Only select few went to college for advanced degrees
Many didn’t even finish school
• What happened to the drop-outs Farming was a major employer in the early
1900s Then Factory jobs employed 1/3 of the workforce

21st Century Reality
• Farming jobs are very few and require advanced skills and knowledge to be successful
• Manufacturing jobs have gone overseas
• We are now in the Information Age
• http://www.youtube.com/watch?v=cL9Wu2kWwSY

Is a high school diploma EVEN enough in the global marketplace?
• “The high school diploma has become the ticket to nowhere.” James Waller, Face to Face: The Changing
State of Racism Across America

Education and Lifelong Earning• High School Drop Out: $608,000
• High School Graduate: $802,000
• Some College: $922,890
• Associate Degree: $1,062,130
• Bachelor’s Degree: $1,420,850
• Master’s Degree: $2,142,440
• Doctorate: $3,012,300 James Waller, Face to Face: The Changing
State of Racism Across America

Our Mission is not to:
• Raise Test scores
• Win another Blue Ribbon Award

But what do we really want to do?
• 4 types of schools Charles Darwin School Pontius Pilate School Chicago Cub Fan School Henry Higgins School
• Which school do you think that we have?

The Charles Darwin School
• “We believe all kids can learn…based on their ability.”
• We believe that all students can learn, but the extent of their learning is determined by their innate ability or aptitude.

The Pontius Pilate School
• “We believe all kids can learn…if they take advantage of the opportunity we give them to learn.”
• If they elect to put forth the necessary effort.

The Chicago Cub Fan School
• “We believe all kids can learn…something, and we will help all students experience academic growth in a warm and nurturing environment.”
• All students should demonstrate some growth as a result of their experience with us.

The Henry Higgins School
• “We believe all kids can learn…and we will work to help all students achieve high standards of learning.”
• All students can and must learn at relatively high levels of achievement.

Corners
• Think about which school we are OVERALL.
• Go to that corner.
• Now go to the corner where you want to send your children.

Our Mission must be
• To assure high levels of learning for all students.

The beginning of “our fundamental mission” statement:
• “We believe all kids can learn…and we will work to help all students achieve high standards of learning.”
• All students can and must learn at relatively high levels of achievement.

If our mission is high levels of learning for all students,• The question is:
Is it possible?
• Video – Geese
• What do we take from that video? Paraphrase Passport – A responds while B
listens. B must correctly restate A’s ideas. B shares ideas while A listens. A must correctly restate B ideas. Take 10 seconds to jot ideas.

Is it possible?
• “There are simple, proven, affordable structures that exist right now and could have a dramatic, widespread impact on schools and achievement – in virtually any school. An astonishing level of agreement has emerged on this point.” Mike Schmoker, 2004

Schools DO Make a Difference• Effective Schools Research of Ron Edmonds,
Larry Lezotte, Wilbur Brookover, Michael Rutter, and others concluded that: All Children can learn. Schools control the factors to assure that
students master the core of the curriculum.• (Not demographics and not language.)

Schools DO Make a Difference• An analysis of research conducted over a 35-
year period demonstrates that schools that are highly effective produce results that almost entirely overcome the effects of student backgrounds. Robert Marzano, What Works in Schools, 2003

Schools DO Make a Difference• 90/90/90 Schools
(90% minority/90% economically disadvantaged/ 90% test scores)• Douglas Reeves

What do we do?
• “We embrace explicitly the proposition that effective practice and popular practice are very likely two different things.” Dr. Douglas Reeves
• Because most teachers were good students, we don’t see the flaw in our current system.

A New Model for our Educational System:• 1. A focus on learning not teaching
• 2. Build a collaborative culture not teach in isolation and leave remediation to chance
• 3. Focus on results instead of not knowing if what you are doing is really working

This model is the PLC model
• And we work together to answer the four basic questions? What do we want students to learn? How will we know when they learn it? (What
does it look like?) What will we do when they don’t learn it? What will we do when they already know it?

So what do we want to become?• Leadership Group said this should be our
vision:

What is our Vision?
• BHS will have a broader definition of success with more options for all students.
• BHS will utilize interventions for student success.
• BHS will make education relevant.
• BHS will strengthen SLCs.
• BHS will increase student connections with school.
• BHS will have better communication with all stakeholders.
• BHS will be safe.

And how will we make that happen?• These are our values. This is how we will act
so that our vision will take place.

What are our Values to create our Vision?• We will have respect for ALL people.
• We will maintain true transparency.
• We will trust each other and extend trust.
• We will be honest and genuine.
• We will display integrity and credibility.
• We will create a sense of belonging.
• We will be courageous.
• We will display self-assurance and loyalty.

So now it’s time for Goals
• And they need to be SMART Goals! Strategic Measureable Attainable Results- Based Timely

Let’s start at the top and work down:
• District Goals
• School Goals
• PLC Team Goals
• Individual Goals (PGP)

District Goals that apply to BHS• Sub population categories testing data will
improve.
• AP: the number of students taking the exam, the number of exams taken, and the passing scores of 3, 4, or 5 will all increase.
• ACT testing data – both general pop and “core completer” will improve
• Extra-curricular involvement will increase
• EOC data will improve
• IB will grow and increase each year.

Before we can set goals,
• Let’s look at our data:

Number of Students Taking AP Exams
03-04 04-05 05-06 06-07 07-08 08-09 09-100
100
200
300
400
500
600
700
800
900
1000
241
513 504
625 630
825919
Series 1

Percent of BHS students taking an AP Class
03-04 04-05 05-06 06-07 07-08 08-09 09-100%
5%
10%
15%
20%
25%
30%
11%
21%19%
21%20%
26%28%

Total AP Exams Taken at BHS
03-04 04-05 05-06 06-07 07-08 08-09 09-100
200
400
600
800
1000
1200
1400
1600
462
795849
10631162
13951471

AP Exams of 3 or Higher
03-04 04-05 05-06 06-07 07-08 08-090%
10%
20%
30%
40%
50%
60%
47%43%
53% 52% 53%56%
3, 4, 5
3, 4, 5

Newsweek Poll Rating
• Ratio is #of AP & IB Exams divided by # of graduates. This is top indicator
• #1 School 16.109
• #2 School 14.89
• #3 School 13.403
• #4 School 11.462
• #5 School 11.35
• #6 School 9.638
• Bentonville 1.902
• Fayetteville 2.29

AP Equity and Excellence
2005 2006 2007 2008 20090.00%
5.00%
10.00%
15.00%
20.00%
25.00%
30.00%
35.00%
40.00%
25.10%23.50%
27.70%
32.00%34.40%
E&E
E&E

Top 10 High Schools E&E Score – 2nd Newsweek Indicator#1 65% #9 94%
#2 100% #10 100%
#3 100% BHS 34.4%
#4 100%
#5 100%
#6 79%
#7 87%
#8 32%

Why Promote AP?
• Taking an AP Class is the biggest indicator of successful college graduation. (College Board) AP Exam Score of 3,4,or 5 – Hispanic is 26%
higher chance of graduating college than Hispanic not scoring. White – 33%, Low Income – 26%
Took an AP Course, not exam – Hispanic – 10% higher, White- 20%, Low Income – 12%
AP Literature has stood out as single class that is the biggest indicator for college graduation
Taking 1-3 AP classes increases your chance at graduation for each AP class up to 3 classes.

IB
Cohort 1 Cohort 2 Cohort 30
2
4
6
8
10
12
14
16
1816
11
16
13
4
101st year2nd yearDiploma

2008 ACT Composite Scores
03-04 04-05 05-06 06-07 07-0821
21.5
22
22.5
23
23.5
24
22.222.3
22.622.7
22.6
22.1
22.8
23.323.4
23.2
Avg. OverallCore Completer
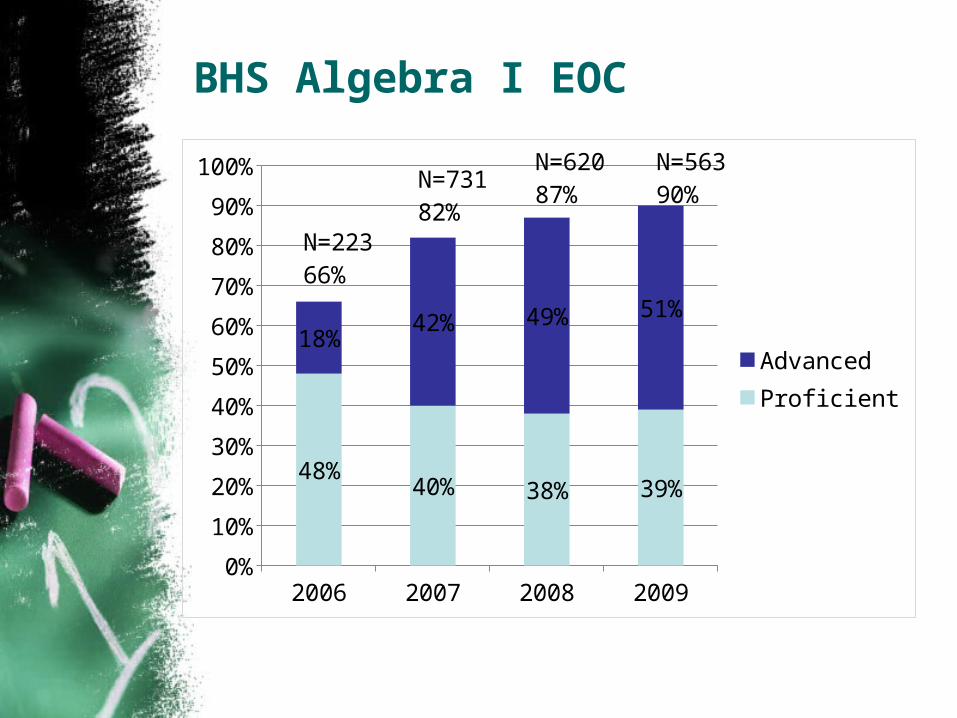
BHS Algebra I EOC
2006 2007 2008 20090%
10%
20%
30%
40%
50%
60%
70%
80%
90%
100%
48%40% 38% 39%
18%42% 49% 51%
AdvancedProficient
N=223 66%
N=731 82%
N=620 87%
N=563 90%

Algebra I EOC Sub Populations
Combin
ed P
op
Gen
eral
Pop
Specia
l Ed
Cauca
sian
Hispan
ic
F/R L
unch
LEP
0%10%20%30%40%50%60%70%80%90%
100%90% 92%
58%
90%
83% 81%
71%
200720082009

2009 Literacy EOC
2006 2007 2008 20090%
10%
20%
30%
40%
50%
60%
70%
80%
90%
68% 67% 71%80%
1% 4%3%
5%
AdvancedProficient
N = 561 69%
N = 714 71%
N = 728 74%
N = 724 85%

Literacy Sub Populations
Combin
ed P
op
Gen
eral
Pop
Specia
l Ed
LEP
F/R L
unch
Hispan
ic0%
10%20%30%40%50%60%70%80%90%
100%85%
92%
31%
18%
65% 62%
200720082009

2009 Geometry EOC
2006 2007 2008 20090%
10%
20%
30%
40%
50%
60%
70%
80%
90%
100%
53%41% 43% 49%
30%47% 45%
41%
AdvancedProficient
N= 44983%
N= 60788%
N= 83189%
N= 90690%

Geometry Subpopulations
Combin
ed P
op
Gen
eral
Pop
Specia
l Ed
LEP
F/R L
unch
Hispan
ic0%
10%20%30%40%50%60%70%80%90%
100%90% 92%
80%
47%
79%74%
200720082009

2009 Biology EOC
2008 20090%
10%
20%
30%
40%
50%
60%
70%
80%
52%
71%
P&A
P&A

Biology Subpopulations
Combin
ed P
op
Gen
eral
Pop
Specia
l Ed
LEP
F/R L
unch
Hispan
ic0%
10%20%30%40%50%60%70%80%90%
71%77%
12%
39%
55%61%
P&A
P&A

Total F’s by semester
1st S
emes
ter
2nd
Semes
ter
Year A
vg.
14%
16%
18%
15%
16%16%
Students with at least one F
Students with at least one F

Potential Graduates Lost
• Students who left to get their GED – 12
• Students who left to be “Homeschooled” – 91
• Students who were dropped for lack of attendance – 33
• 136/3140 = 4% left in one year. When we lose this much each year, it greatly affects our graduation rate.

Potential Graduates Last Grade in School at BHS
9th grade 10th grade 11th grade 12th grade0
5
10
15
20
25
30
35
40
45
50
18
31
41
46

Stephenson High School Data
• 2008 ACT Average 25.7 (99% of graduating seniors – 1,061 scores)
• 2008 National Merit Scholarship Program – 27 semifinalists plus 39 commended students
• 2008 AP – 3601 exams, 84.3% of exams were 3s, 4s, or 5s, 1510 students taking AP
• 2008 AP – 27% sophomores, 33% juniors, 56 seniors took at least one exam. 70% of the graduating class have taken at least one exam. 74% of graduating class has college level experience.

Stephenson High School
• 2008 – 1st semester F’s – 1.0%
• 2008 – 2nd semester F’s – 1.2%
• 2008 – D & F Averages – 4.6%
• 2008 - Graduation Rate – 96.7%
• 2009 – Rank 121 in Newsweek Poll – 2.967 Index, 61.6 E&E
• 2009 Enrollment – 4,399 – 1,093 seniors, 1098 juniors, 1,113 sophomores, 1095 freshmen

Mix – Pair - Share
• 1. While the music is playing, walk around the room and “mix.”
• 2. When the music stops, pair up.
• 3. Listen for the topic.
• 4. Each shares for 60 seconds.
• 5. Repeat.

So then we set our building goals
• SMART – Strategic, Measureable, Attainable, Results focused, Time Sensitive
1. Sub Pop Gap will reduce 3% in Alg. EOC, 11th Grade Lit, Bio EOC and will reduce 2% in Geo EOC.
2. AP Gains – 100 more students, 125 more exams, 5% increase in 3,4, or 5’s.
3. ACT – increase to 22.8 and core to 23.5
4. Extra-curricular – increase by 10%
5. EOC exams – Alg to 92% P&A, Lit to 87% P&A, Geo to 91% P&A, Bio to 80% P&A

More Building Goals
6. IB – 100% of our 4 will receive IB diploma, next year to 25 students and 2nd year will be 12 minimum.
7. Reduce F’s to 10% or fewer having one F or more.
8. Reduce students leave for GED, homeschool or lack of attendance to 3% or less.
9. Increase parental involvement.
10. Encourage strategies and activities that promote a healthier lifestyle and better dietary habits. (ACSIP)

So let’s take our goals to the next level…• Each PLC Group should now choose 1-2
building goals to support and create strategies and formative assessments to reach those goals.
• Each SLC Group should choose 1-2 building goals to support and create strategies and formative assessments to reach those goals.
• Use the document provided. \\briana\kgarrett$\My Documents\Leadership Team\SMART Goal Worksheet.doc

Then the next level of goals…
• PGP Goals. Your PGP should directly support one or two of
your PLC or SLC goals. You can choose from many ideas or create your
own:• Max Literacy Skill Training (Sept. 16th and 17th)• ACT Improvements• Kagan Strategies• Book Studies• Relevance ideas• Rigor Strategies• Thinking or Reading Skills

More PGP Ideas
College Awareness Career Awareness Teacher Instructional Coaching Reducing Gender or Sub-Pop Academic Gaps Increasing Attendance Increasing Parental Involvement Vertical Alignment And Many, many more
Staff Development money can be asked to be used for substitutes, books, or other supplies.

Wrap it all up!
• A copy of each team’s SMART Goal Worksheet will be posted on our website for staff info. You’ll be able to visit with your colleagues about
what they are doing and what you’re doing.
• A copy of each team’s SMART Goal Worksheet will be sent to Jack Loyd for our ACSIP plan We’ll have an ACSIP plan that when the state
visits, you won’t have to cram to know your part.

Bringing it all together
• DuFour video

So what about SLCs?
• Small Learning Communities Academic Vigor with Curriculum Integration Meaningful Instruction that has application in the
real world. (Relevance) The outcome in uncertain – no set answer; student driven projects.
Business partners to develop the integration – teachers go into the businesses; students go into the businesses in jobs and internships
Building deep connections between the purpose in the classroom and the future and between students-teachers- community

SLCs
• We’ve got them started.
• We’ve got a lot of work to do.
• But what’s keeping us from doing them?
• Start small and grow the idea as you can.
• Use our current resources: Tech-Ed classes, teachers, and partnerships Start small and build. Chamber of Commerce Partners in Education
Program PTO, Wal-mart, Vendors

Placemat Consensus
• Take one of the large butcher sheets of paper.
• Decide what area is yours.
• Write in your area as many items on the topic as you can (I’ll give you the topic)
• Go around the group announcing an item. Discuss as a team, record if everyone agrees that’s a great idea in the middle.
• Repeat until all items are discussed.
• Carousel walk

Today’s Outcomes:
• To understand how the world has changed and how schools must keep up with the changes.
• To understand the cost of failure.
• To understand the purpose and reason for Professional Learning Communities (PLCs) and Small Learning Communities (SLCs).