the world nuclear industry status report 2019
TRANSCRIPT

WNISR2019
Mycle Schneider Consulting Brussels, 19 February 20201
Mycle SchneiderIndependent International Consultant on Energy and Nuclear Policy, Paris
WNISR Convening Lead Author and Publisher
The World Nuclear Industry Status Report 2019(WNISR2019)
www.WorldNuclearReport.org
HEINRICH BÖLL FOUNDATION, GREENS-EFA GROUP IN THE EUROPEAN PARLIAMENTHOTEL LEOPOLD, BRUSSELS, 19 FEBRUARY 2020
Amory B. LovinsRocky Mountain Institute, Co-Founder and Chairman Emeritus
WNISR Contributing Author
Ben WealerResearch Associate at Berlin Institute of Technology
Contributing-Author to WNISR

WNISR2019
Mycle Schneider Consulting Brussels, 19 February 2020
GLOBAL OVERVIEW – FORECASTING VS. REALITY
67
Source: Klaus Gufler, " Short and Mid-term Trends of the Development of Nuclear Energy ", June 2013

WNISR2019
Mycle Schneider Consulting Brussels, 19 February 2020
GLOBAL OVERVIEW – FORECASTING VS. REALITY
Sources: Klaus Gufler, “Short and Mid-term Trends of the Development of Nuclear Energy”, June 2013

WNISR2019
Mycle Schneider Consulting Brussels, 19 February 2020
GLOBAL OVERVIEW – PROGRAMS STARTUP & PHASE-OUT
3

WNISR2019
Mycle Schneider Consulting Brussels, 19 February 2020
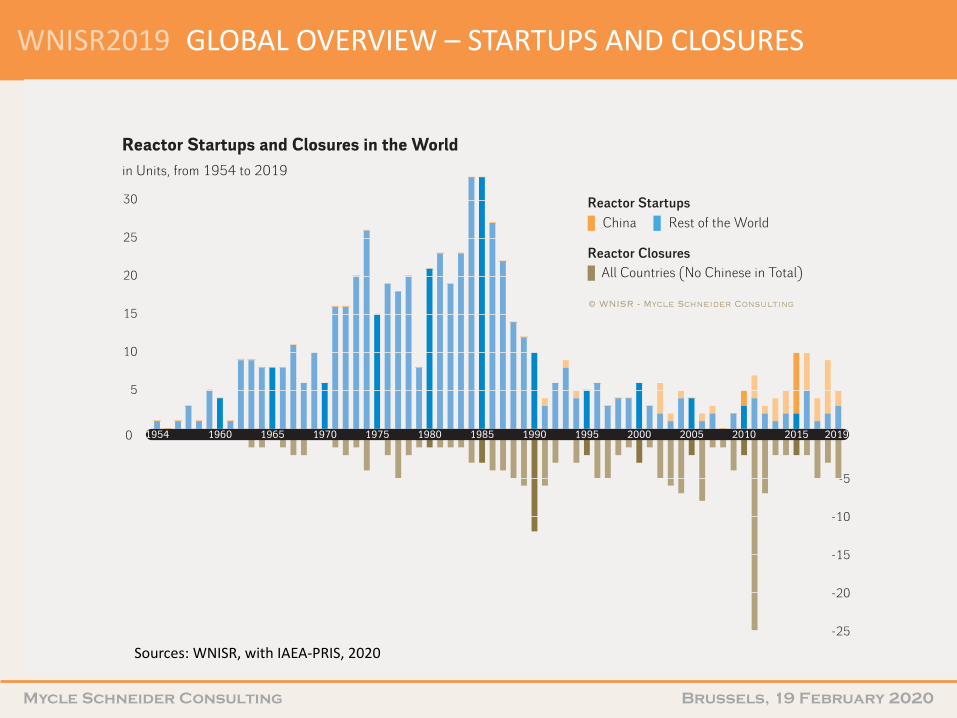
GLOBAL OVERVIEW – STARTUPS AND CLOSURES
4
5
10
15
20
25
30
-25
-20
-15
-10
-5
0 20192015201020052000199519901985198019751970196519601954
© WNISR - Mycle Schneider Consulting
Reactor Startups and Closures in the Worldin Units, from 1954 to 2019
YearlyBalance
Reactor Startups
Reactor Closures
Sources: WNISR, with IAEA-PRIS, 2020
WNISR2019
Mycle Schneider Consulting Brussels, 19 February 2020
GLOBAL OVERVIEW – STARTUPS AND CLOSURES
-25
-20
-15
-10
-5
0
5
10
15
20
25
30
20192015201020052000199519901985198019751970196519601954
© WNISR - Mycle Schneider Consulting
Reactor Startups and Closures in the Worldin Units, from 1954 to 2019
Reactor Closures
China Rest of the WorldReactor Startups
All Countries (No Chinese in Total)
Sources: WNISR, with IAEA-PRIS, 2020
WNISR2019
Mycle Schneider Consulting Brussels, 19 February 2020
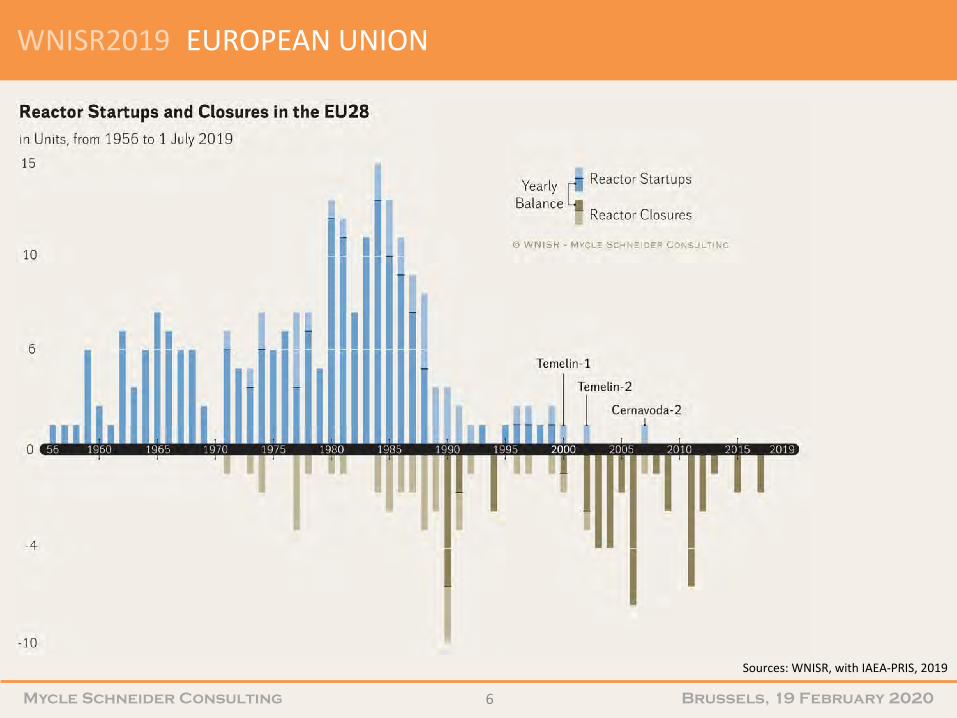
EUROPEAN UNION
6
Sources: WNISR, with IAEA-PRIS, 2019

WNISR2019
Mycle Schneider Consulting Brussels, 19 February 2020
GLOBAL OVERVIEW — WORLD FLEET
0
100
200
300
400
20192015201020052000199519901985198019751970196519601954GW
© WNISR - Mycle Schneider Consulting
2002438 Reactors
2019Operating Capacity:
366.5 GWe414 Reactors 1989
310 GWe418 Reactors
2006367 GWe
Nuclear Reactors and Net Operating Capacity in the World in Units and GWe, from 1954 to 31 December 2019
Reactors in Operation
Operating Capacity
GWe
Sources: WNISR, with IAEA-PRIS, 2020
7

WNISR2019
Mycle Schneider Consulting Brussels, 19 February 2020
EUROPEAN UNION
8
Sources: WNISR, with IAEA-PRIS, 2019

WNISR2019
Mycle Schneider Consulting Brussels, 19 February 2020
GLOBAL OVERVIEW – ROLE OF NUCLEAR POWER
Source: Klaus Gufler, " Short and Mid-term Trends of the Development of Nuclear Energy ", June 2013
Sources: IAEA-PRIS, BP, 2019

WNISR2019
Mycle Schneider Consulting Brussels, 19 February 2020
GLOBAL OVERVIEW – ROLE OF NUCLEAR POWER
Source: Klaus Gufler, " Short and Mid-term Trends of the Development of Nuclear Energy ", June 2013
Sources: IAEA-PRIS, BP, 2019

WNISR2019
Mycle Schneider Consulting Brussels, 19 February 2020
GLOBAL OVERVIEW - NUCLEAR ELECTRICITY GENERATION
11
(Top 21)
Sources: IAEA-PRIS, BP, 2019

WNISR2019
Mycle Schneider Consulting Brussels, 19 February 2020
GENERAL OVERVIEW — CONSTRUCTIONS
Sources: WNISR, with IAEA-PRIS, 2020
12

WNISR2019
Mycle Schneider Consulting Brussels, 19 February 2020
GENERAL OVERVIEW — CONSTRUCTIONS MID-2019
Sources: Compiled by WNISR, 2019
Country Units Capacity (MW net)
ConstructionStarts
GridConnection
Units Behind Schedule
China 10 8 800 2012 - 2017 2020 - 2023 2-3
India 7 4 824 2004 - 2017 2019 - 2023 5
Russia 5 3 379 2007 - 2019 2019 - 2023 3
UAE 4 5 380 2012 - 2015 2020 - 2023 4
South Korea 4 5 360 2012 - 2018 2019 - 2024 4
Belarus 2 2 218 2013 - 2014 2019 - 2020 1-2
Bangladesh 2 2 160 2017 - 2018 2023 - 2024 0
Slovakia 2 880 1985 2020 - 2021 2
USA 2 2 234 2013 2021 - 2022 2
Pakistan 2 2 028 2015 - 2016 2020 - 2021 0
Japan 1 1 325 2007 ? 1
Argentina 1 25 2014 2021 1
UK 1 1 630 2018 2025 0
Finland 1 1 600 2005 2020 1
France 1 1 600 2007 2022 1
Turkey 1 1 114 2018 2024 0
Total 46 44 557 1985 - 2019 2019 - 2025 27-29
Sources: Compiled by WNISR. 2019

WNISR2019
Mycle Schneider Consulting Brussels, 19 February 2020
GENERAL OVERVIEW — CONSTRUCTIONS
Sources: Compiled by WNISR, 2019
Construction Times of 63 Units Started-up 2009-7/2019
Country Units Construction Time (in Years)
Mean Time Minimum Maximum
China 37 6.0 4.1 11.2
Russia 8 22.2 8.1 35.0
South Korea 6 6.0 4.1 9.6
India 5 9.8 7.2 14.2
Pakistan 3 5.4 5.2 5.6
Argentina 1 33.0 33.0
Iran 1 36.3 36.3
Japan 1 5.1 5.1
USA 1 43.5 43.5
World 63 9.8 4.1 43.5

WNISR2019
Mycle Schneider Consulting Brussels, 19 February 2020
GLOBAL OVERVIEW – CONSTRUCTIONS & DELAYS
Sources: WNISR, with IAEA-PRIS, 2019

WNISR2019
Mycle Schneider Consulting Brussels, 19 February 2020
GLOBAL OVERVIEW – CONSTRUCTIONS STARTS & CHINA
Sources: WNISR, with IAEA-PRIS, 2019

WNISR2019
Mycle Schneider Consulting Brussels, 19 February 2020
GLOBAL OVERVIEW – CONSTRUCTIONS STARTS WORLD…
Sources: WNISR, with IAEA-PRIS, 2020

WNISR2019
Mycle Schneider Consulting Brussels, 19 February 2020
WORLD FLEET - OPERATING AGE
18
Sources: WNISR, with IAEA-PRIS, 2019
WNISR2019
Mycle Schneider Consulting Brussels, 19 February 2020
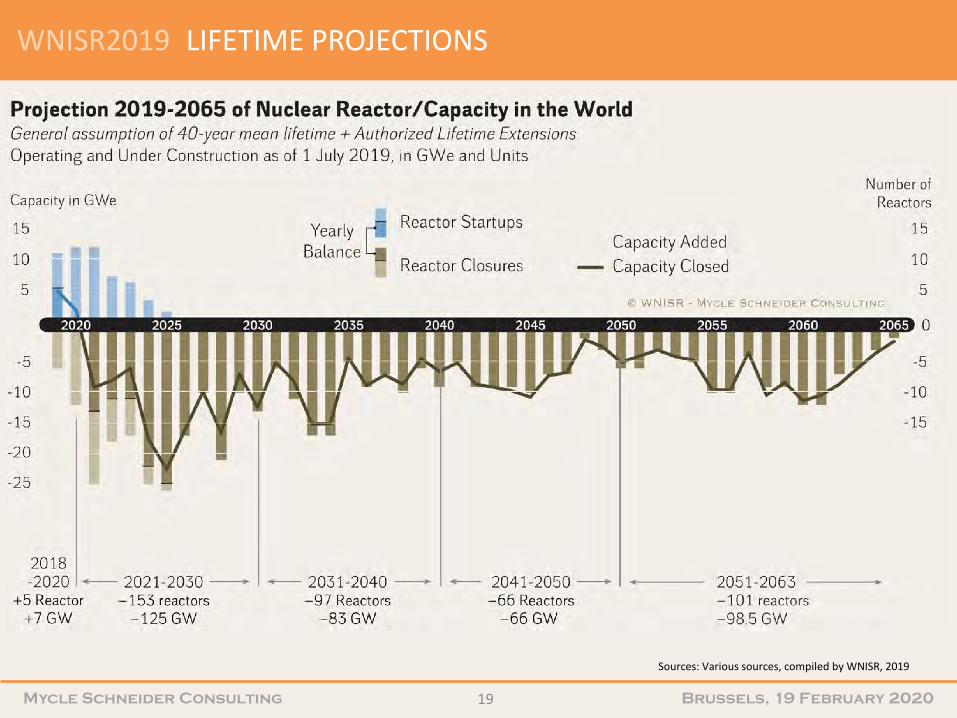
Sources: Various sources, compiled by WNISR, 2019
LIFETIME PROJECTIONS
19
WNISR2019
Mycle Schneider Consulting Brussels, 19 February 2020
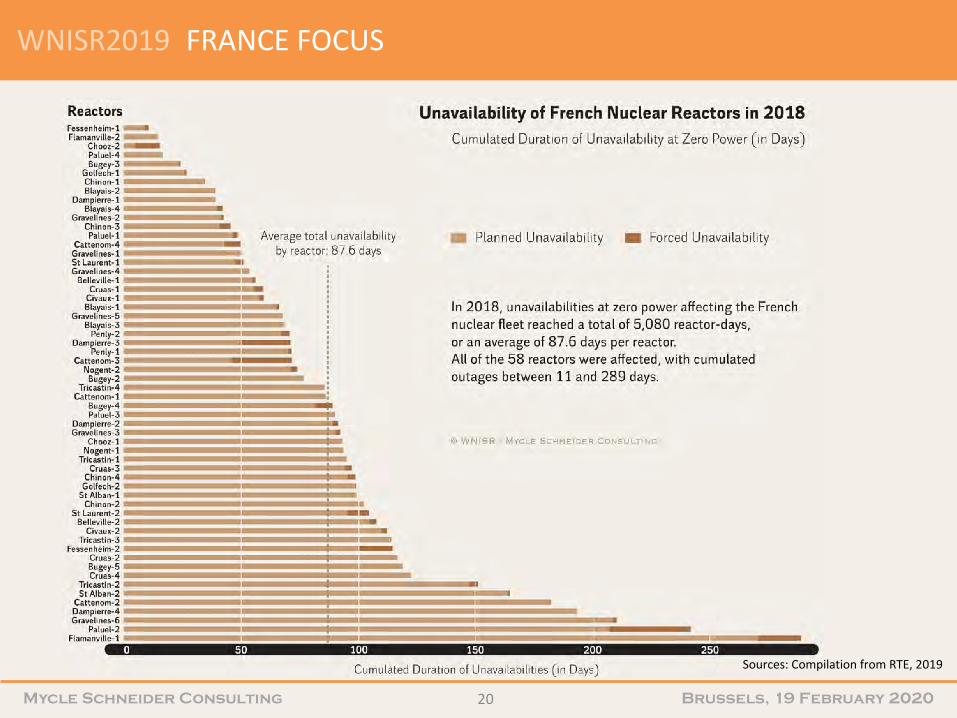
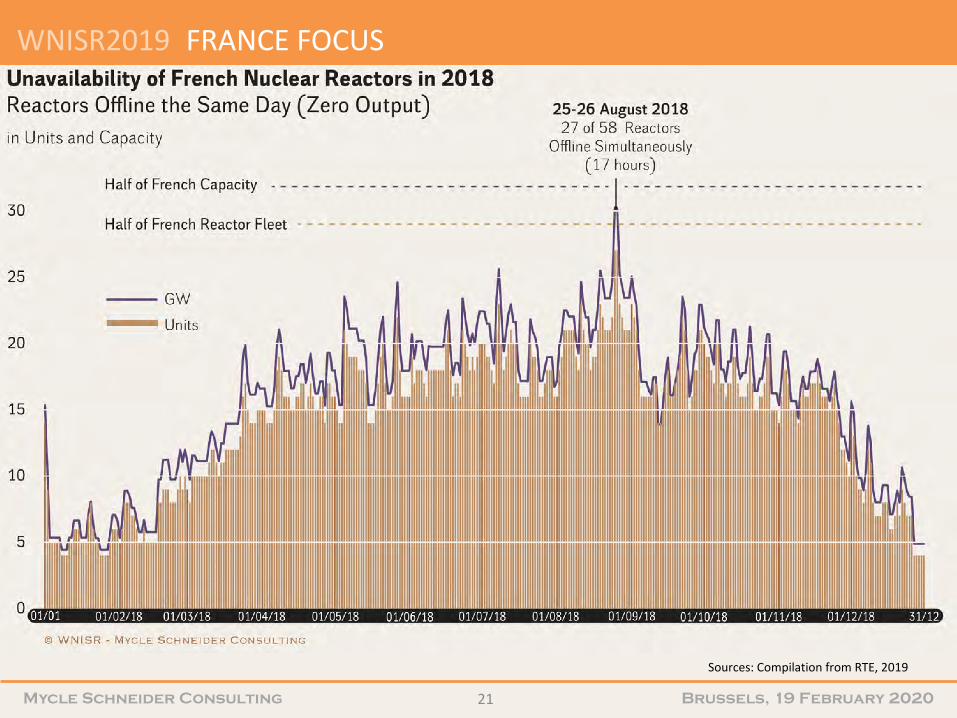
FRANCE FOCUS
20
Sources: Compilation from RTE, 2019
WNISR2019
Mycle Schneider Consulting Brussels, 19 February 2020
Sources: Compilation from RTE, 2019
FRANCE FOCUS
21
WNISR2019
Mycle Schneider Consulting Brussels, 19 February 2020
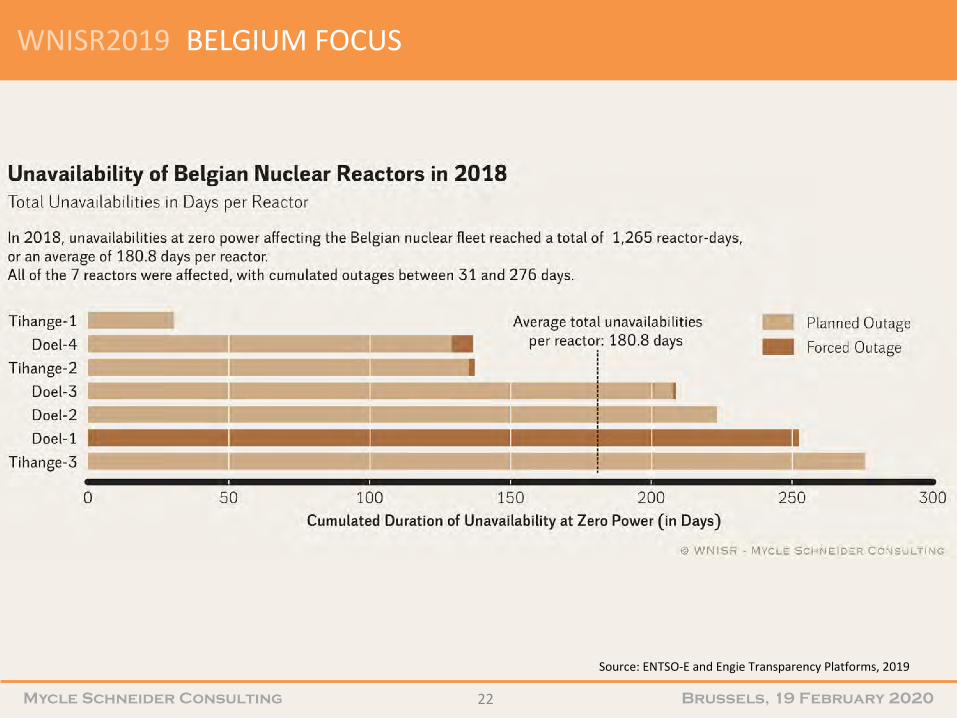
Source: ENTSO-E and Engie Transparency Platforms, 2019
BELGIUM FOCUS
22

WNISR2019
Mycle Schneider Consulting Brussels, 19 February 2020
GERMANY FOCUS
23
Sources WNISR, based on AGEB 2019
WNISR2019
Mycle Schneider Consulting Brussels, 19 February 2020
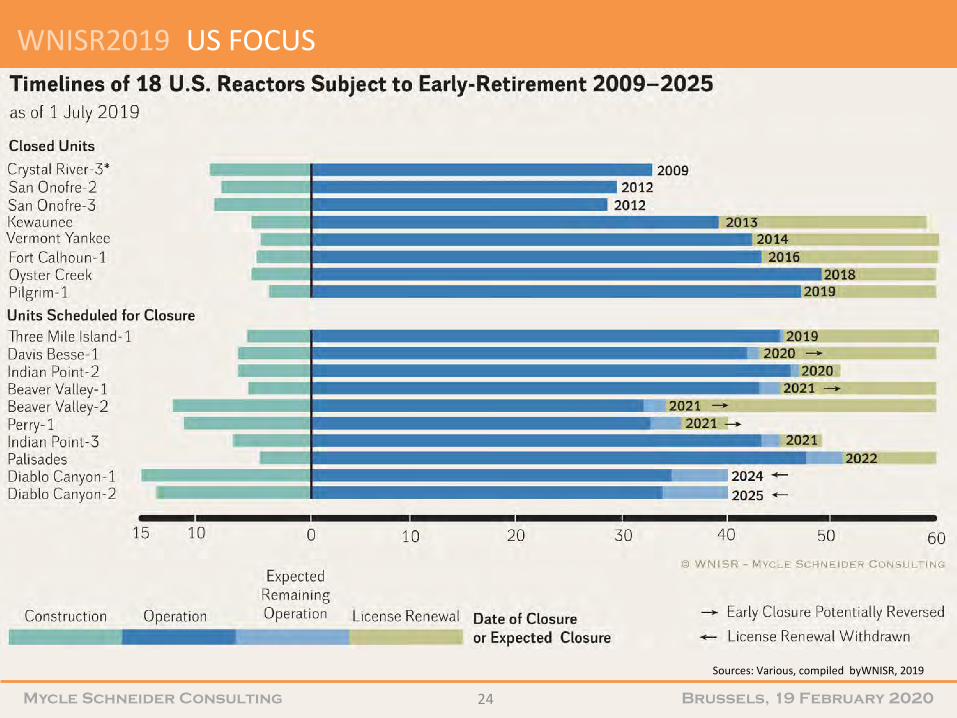
US FOCUS
24
Sources: Various, compiled byWNISR, 2019

WNISR2019
Mycle Schneider Consulting Brussels, 19 February 2020
STAGES OF THE DECOMMISSIONING PROCESS
The technological process can generally be divided into three main stages:
• The Warm-up-stage comprises the post-operational stage, the dismantling of systems that are not needed for the decommissioning process. Also, the dismantling of higher contaminated system parts begins. An indicator for the progress of this stage is the defueling of the reactor as it is crucial for further undertakings: defueling means removing the spent fuel from the reactor core and the spent fuel pools.
• The Hot-zone-stage comprises the dismantling activities in the hot zone, i.e. dismantling of highly contaminated or activated parts, e.g. the reactor pressure vessel (RPV) and its internals (RVI), and the biological shield.
• The Ease-off-stage comprises removal of operating systems as well as decontamination of the buildings. This stage ends ideally with the demolition of the buildings and the release of the reactor site as a “greenfield” for unrestricted use. The release as a “brownfield” is allowed in some countries, which means that the buildings can also be further used, for nuclear or other purposes.

WNISR2019
Mycle Schneider Consulting Brussels, 19 February 2020
DECOMMISSIONING
26
Sources: WNISR, with Reconstruction Agency, 2019
Sources: WNISR, with IAEA-PRIS, 2019

WNISR2019
Mycle Schneider Consulting Brussels, 19 February 2020
NO CHANGE SINCE WNISR2018: 19 DECOMMISSIONED
Sources: WNISR, with IAEA-PRIS, 2019
27

WNISR2019
Mycle Schneider Consulting Brussels, 19 February 2020
DECOMMISSIONING IN 11 SELECTED CASE STUDIES
Sources: WNISR 2019
28

WNISR2019
Mycle Schneider Consulting Brussels, 19 February 2020
SUMMARY ON REACTOR DECOMMISSIONING
• Only 19 reactors (6 GW) fully decommissioned in the world.
• No reactor decommissioning completed worldwide since WNISR2018.
• Duration and costs largely underestimated. The few projects that have started encounter delays as well as cost overruns.
• Not one reactor decommissioned in early nuclear countries France, Canada, UK, Russia.
• Not one graphite-moderated reactor has yet been decommissioned; also true for Light Water Cooled and Graphite Moderated Reactors such as the Chernobyl-type RBMK.
• In the US, selling decommissioning licenses to a contractor is gaining popularity. Limited-liability decommissioning companies appear to operate according to business incentives that are starting to attract regulatory and legal attention.
• Difference in decommissioning policy (e.g. removal of large components, definition of decommissioning and cost estimates) makes international comparisons difficult.
• In all cases, interim storage facilities were needed, hindering decommissioning or even rendering the regulatory release of the site impossible.
• Decommissioning is only at its very beginnings.

WNISR2019
Mycle Schneider Consulting Brussels, 19 February 2020
NUCLEAR POWER VS. RENEWABLES DEPLOYMENT
30
Sources: FS-UNEP/BNEF 2019 and WNISR Original Research

WNISR2019
Mycle Schneider Consulting Brussels, 19 February 2020
NUCLEAR POWER VS. RENEWABLES DEPLOYMENT
31
Sources: Lazard Estimates, 2018

WNISR2019
Mycle Schneider Consulting Brussels, 19 February 2020
NUCLEAR POWER VS. RENEWABLES DEPLOYMENT
32
Sources: WNISR, IAEA-PRIS, BP Statistical Review 2019

WNISR2019
Mycle Schneider Consulting Brussels, 19 February 2020
NUCLEAR POWER VS. RENEWABLES DEPLOYMENT
33
Sources: BP Statistical Review 2019

WNISR2019
Mycle Schneider Consulting Brussels, 19 February 2020
NUCLEAR POWER VS. RENEWABLES DEPLOYMENT
34
Sources: WNISR, IAEA-PRIS, BP Statistical Review 2019

WNISR2019
Mycle Schneider Consulting Brussels, 19 February 2020
NUCLEAR POWER VS. RENEWABLES DEPLOYMENT
35
Sources: WindEurope, WNISR, 2019

WNISR2019
Mycle Schneider Consulting Brussels, 19 February 2020
NUCLEAR POWER VS. RENEWABLES DEPLOYMENT
36
Sources: BP, 2019 Sources: BP, 2019Sources: BP, 2019

WNISR2019
Mycle Schneider Consulting Brussels, 19 February 2020
NUCLEAR POWER VS. RENEWABLES DEPLOYMENT
37
Sources: WNISR, IAEA-PRIS, BP Statistical Review 2019

WNISR2019
Mycle Schneider Consulting Brussels, 19 February 2020
NUCLEAR POWER VS. RENEWABLES DEPLOYMENT
38
Sources: WNISR, IAEA-PRIS, BP Statistical Review 2019
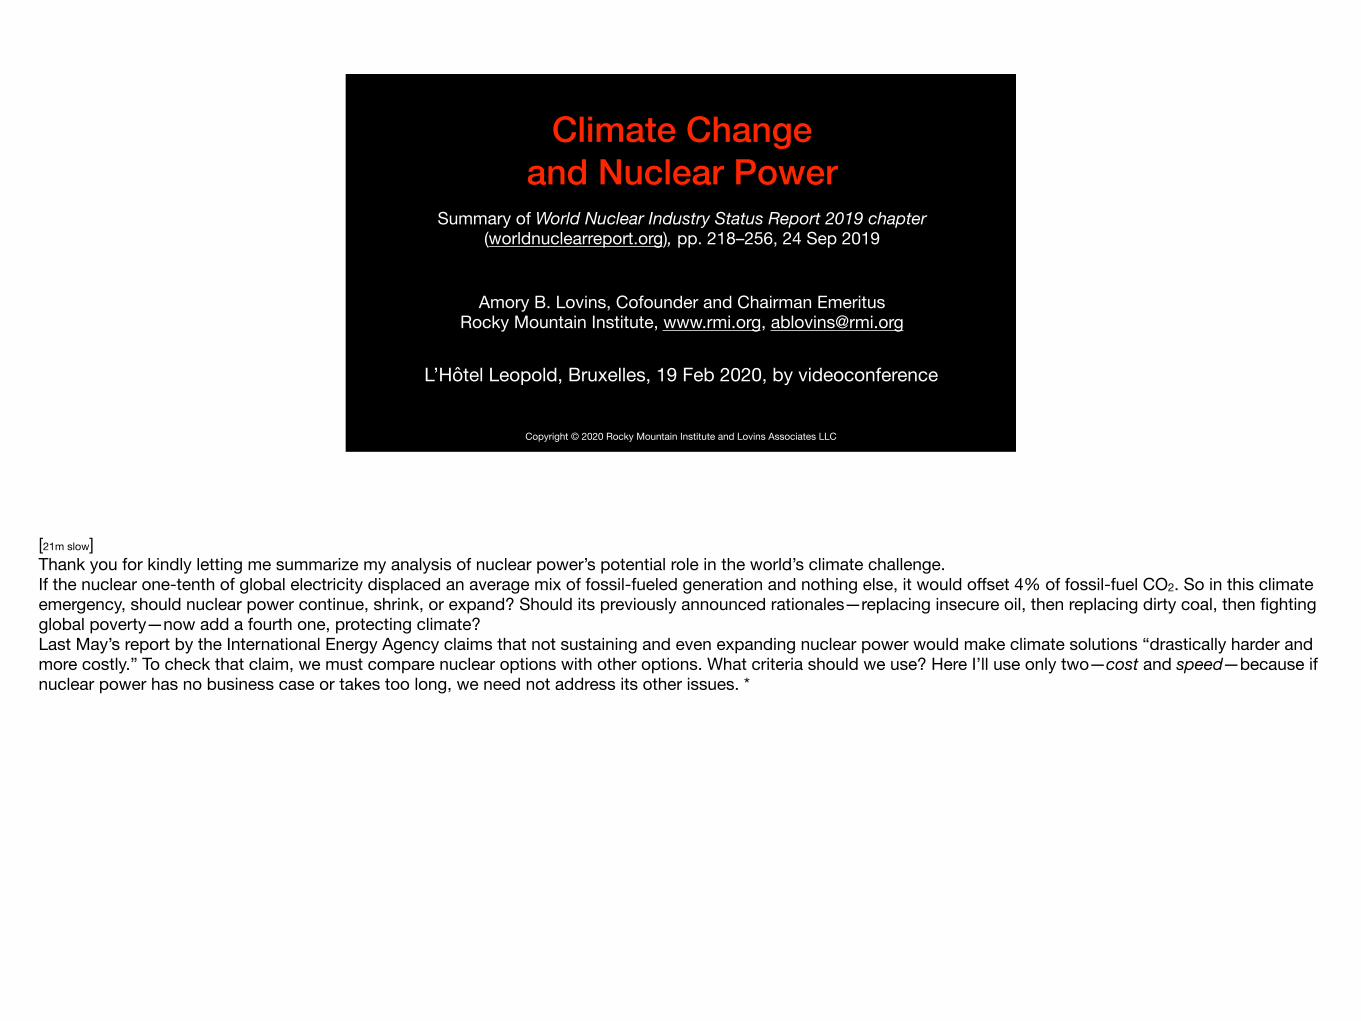
Climate Change and Nuclear Power
Summary of World Nuclear Industry Status Report 2019 chapter (worldnuclearreport.org), pp. 218–256, 24 Sep 2019
Amory B. Lovins, Cofounder and Chairman EmeritusRocky Mountain Institute, www.rmi.org, [email protected]
L’Hôtel Leopold, Bruxelles, 19 Feb 2020, by videoconference
Copyright © 2020 Rocky Mountain Institute and Lovins Associates LLC
[21m slow]Thank you for kindly letting me summarize my analysis of nuclear power’s potential role in the world’s climate challenge.If the nuclear one-tenth of global electricity displaced an average mix of fossil-fueled generation and nothing else, it would offset 4% of fossil-fuel CO2. So in this climate emergency, should nuclear power continue, shrink, or expand? Should its previously announced rationales—replacing insecure oil, then replacing dirty coal, then fighting global poverty—now add a fourth one, protecting climate?Last May’s report by the International Energy Agency claims that not sustaining and even expanding nuclear power would make climate solutions “drastically harder and more costly.” To check that claim, we must compare nuclear options with other options. What criteria should we use? Here I’ll use only two—cost and speed—because if nuclear power has no business case or takes too long, we need not address its other issues. *

• Building coal-fired power stations paid attention to cost but not carbon • Defending nuclear plants paid attention to carbon but not cost • Protecting climate requires avoiding the most carbon at the least cost in the least time, paying attention to carbon, cost, and time—not just carbon • Costly or slow options will avoid less carbon per € or per year than cheaper or faster options could have done, making climate change worse than it could have been. • A low-carbon but costly or slow choice thus reduces and retards climate protection
A simple analytic framework for comparing the climate-effectiveness of different ways to save or make electricity is at www.rmi.org/decarb. A lay summary is at https://www.forbes.com/sites/amorylovins/2019/11/18/does-nuclear-power-slow-or-speed-climate-change/.
Criteria for comparing nuclear power with other options
How should we compare different ways to provide electrical services? * We built coal-fired power plants by counting cost but not carbon. * Nuclear advocates defend their option by counting carbon but not cost. * But to protect the climate, we must save the most carbon at the least cost and in the least time, counting all three variables—carbon and cost and time. * Why? Because * costly or slow options save less carbon per € or per year than cheaper or faster options. Thus * even a low- or no-carbon option that is too costly or too slow will reduce and retard achievable climate protection. ** At rmi.org/decarb I’ve posted a simple way to compare climate-effectiveness, using up-to-date market price data and worked examples. My longer article in the business magazine Forbes can be easily found by searching the Web for “Lovins Forbes nuclear.” *

Mind the logical gap
• People are hungry• Hunger is urgent• Caviar and rice are both food• Therefore caviar and rice are both vital to reducing hunger
When solving a problem needs money and time, both finite, we must understand relative cost and speed to choose effective solutions.
Many analysts ignore common-sense comparisons of cost and speed, leading to results akin to arguing that since * people are hungry, * hunger is urgent, and * caviar and rice are both food, therefore * both are vital to reducing hunger. Since in reality money and time are both limited, ** our priorities in feeding people or in providing energy services must be informed by relative cost and speed. Lower cost saves more carbon per €. Faster deployment saves more carbon per year. We need both. *

• You can buy only one thing with the same money at the same time.
• All resources compete to serve the same finite needs.
• New nuclear subsidies shrink and distort competition.
• Nuclear subsidies and preferences displace efficiency and renewables,
slow their growth, and weaken markets.
• Does the climate emergency require all options including nuclear?
Climate opportunity cost
* The economic principle of “opportunity cost” means you cannot spend the same money on two different things at the same time. Each purchase foregoes others. * Buying nuclear power displaces buying efficiency and renewables, and vice versa, so nuclear owners strive to beat coal and natural gas while their allies often disparage or suppress renewables. * Yet most US nuclear plants are uneconomic just to run, many are closing, so their powerful owners seek and often get multi-billion-dollar bailouts from malleable state legislatures, just as European owners do from some national governments. These subsidies are misdescribed as “not forcing nuclear out of the market,” “not taking nuclear off the table,” or “keeping the nuclear option open.” In fact, they force carbon-free efficiency and renewables out of the market by making competition unfair and by walling off reserved market space where efficiency and renewables are forbidden to compete. But * replacing market choices with political negotiations distorts prices, crowds out competitors, slows innovation, reduces transparency, rewards undue influence, introduces bias, picks winners, invites corruption, and even threatens to destroy the competitive regional electricity markets where renewables and efficiency win. These are high prices for small or negative benefits. * Yet many political leaders think climate’s urgency demands every option, including preserving nuclear power at any cost. So we must ask: What is that cost, both in € and in foregoing opportunities? *
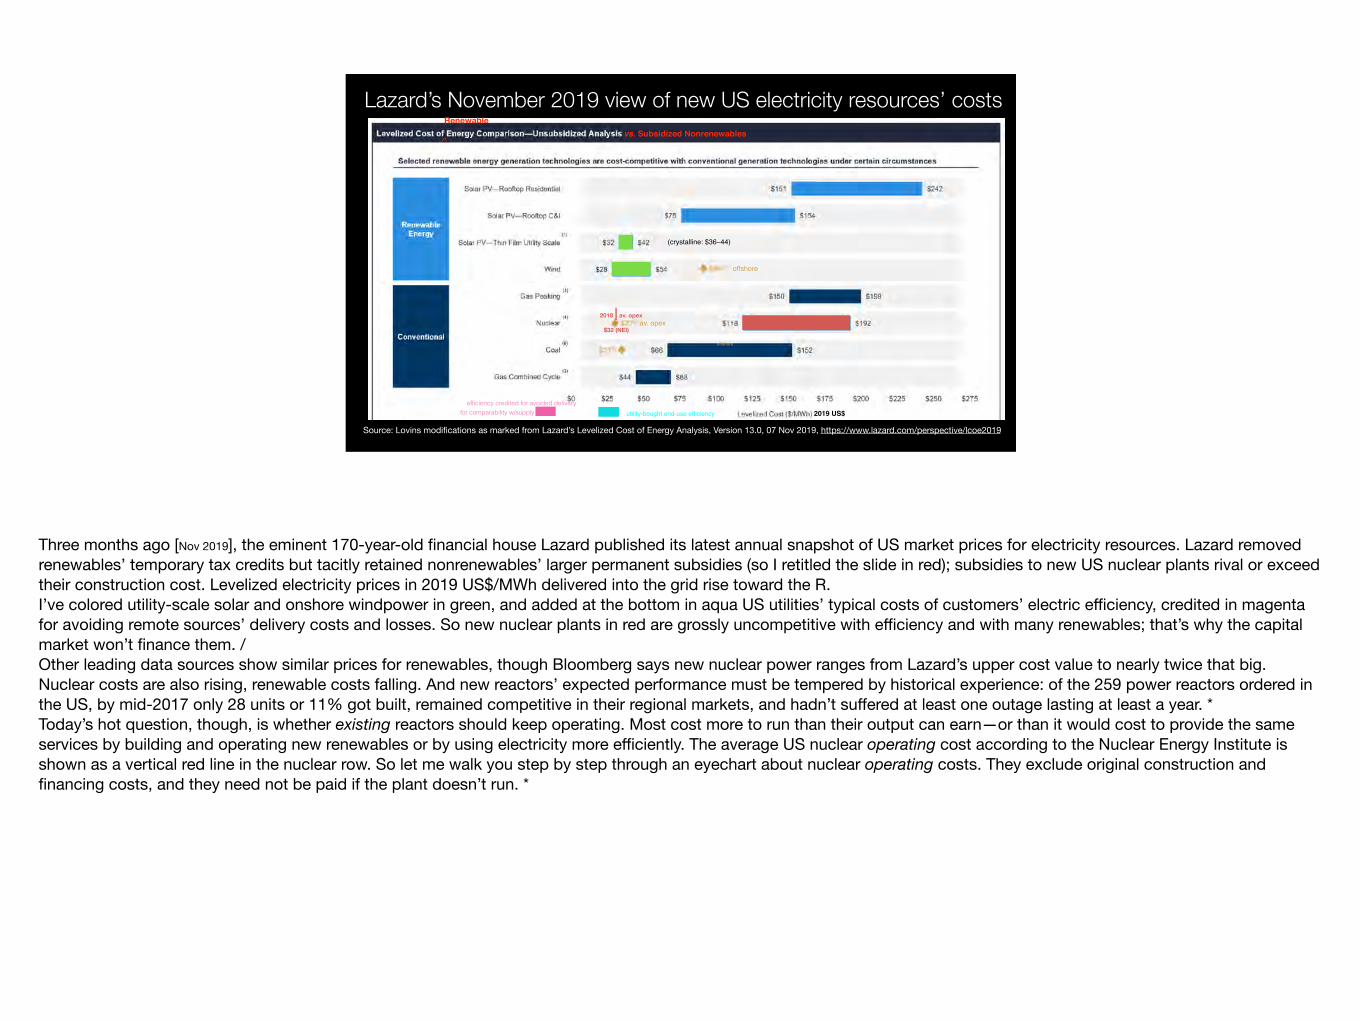
Lazard’s November 2019 view of new US electricity resources’ costs
2019 US$utility-bought end-use efficiency
Renewablevs. Subsidized Nonrenewables
^
2018 | av. opex $32 (NEI)
offshore
efficiency credited for avoided delivery for comparability w/supply
offshore
av. opex
(crystalline: $36–44)
Source: Lovins modifications as marked from Lazard’s Levelized Cost of Energy Analysis, Version 13.0, 07 Nov 2019, https://www.lazard.com/perspective/lcoe2019
Three months ago [Nov 2019], the eminent 170-year-old financial house Lazard published its latest annual snapshot of US market prices for electricity resources. Lazard removed renewables’ temporary tax credits but tacitly retained nonrenewables’ larger permanent subsidies (so I retitled the slide in red); subsidies to new US nuclear plants rival or exceed their construction cost. Levelized electricity prices in 2019 US$/MWh delivered into the grid rise toward the R.I’ve colored utility-scale solar and onshore windpower in green, and added at the bottom in aqua US utilities’ typical costs of customers’ electric efficiency, credited in magenta for avoiding remote sources’ delivery costs and losses. So new nuclear plants in red are grossly uncompetitive with efficiency and with many renewables; that’s why the capital market won’t finance them. /Other leading data sources show similar prices for renewables, though Bloomberg says new nuclear power ranges from Lazard’s upper cost value to nearly twice that big. Nuclear costs are also rising, renewable costs falling. And new reactors’ expected performance must be tempered by historical experience: of the 259 power reactors ordered in the US, by mid-2017 only 28 units or 11% got built, remained competitive in their regional markets, and hadn’t suffered at least one outage lasting at least a year. *Today’s hot question, though, is whether existing reactors should keep operating. Most cost more to run than their output can earn—or than it would cost to provide the same services by building and operating new renewables or by using electricity more efficiently. The average US nuclear operating cost according to the Nuclear Energy Institute is shown as a vertical red line in the nuclear row. So let me walk you step by step through an eyechart about nuclear operating costs. They exclude original construction and financing costs, and they need not be paid if the plant doesn’t run. *

World Nuclear Industry Status Report 2019, www.worldnuclearreport.org, Fig. 49. PPAs; LBNL. Nuclear opex: NEI.
! 2014
! 2017
" 2015 #
$ 2016
" 2018
The light-green zone shows the range of US wholesale electricity prices for 2003–18 in constant 2014 US dollars. The aqua line for windpower, and the gold line for utility-scale photovoltaics, show the average fixed prices set in long-term private-market Power Purchase Agreements or PPAs. You can see that average new wind and solar power sell at or below the lowest wholesale prices from nonrenewables, and trend downward, so windpower in 2018 was as low as $11/MWh or 1.1¢/kWh. Wind and solar power’s temporary national subsidies, now phasing out, hardly matter: the lower-right corner of the graph shows as round dots the comparable unsubsidized prices of wind and solar in Chile, Mexico, and Morocco; now such prices are around $17/MWh. The squares at the far right are bids for Colorado solar and windpower; the diamonds add electricity storage with only modest cost. / Now compare US nuclear plants’ average operating cost excluding all original construction cost. Average nuclear operations, the red line, now cost more than new modern renewables, with or without their temporary subsidies. During two recent three-year periods, the gray and brown horizontal bars show that those average nuclear operating costs by quartile fell as the worst reactors were closed—but renewable prices fell even faster. Nuclear operating costs will be hard to cut much further in reactors averaging four decades old, but renewable prices promise big further declines for decades to come. / International nuclear operating costs * tend to be even higher. Troubled fleets like France’s and Japan’s must spread operating costs over less output, and often must buy costly safety, security, and life-extending upgrades, from which the US Nuclear Regulatory Commission has just largely excused US operators. As such soaring opex challenges the restart of Japan’s idled reactors, their market dwindles: in the 8 fiscal years following Fukushima, their lost output plus energy to support Japan’s 11% GDP growth were already 97% offset by savings and renewables. *

• US nuclear opex averaged >5¢2014/kWh for the top 25 units, >4¢/kWh for the next 25• US utilities buy average efficiency for ~2–3¢/kWh—can be <1¢/kWh• So closing a distressed reactor and buying efficiency instead saves money and CO2• Thus coal plants should be closed to save CO2—and high-opex (most) nuclear plants should also be closed to save money whose reinvestment can save even more CO2
• That substitution can replace closed reactors within 1–3 years, then save even more carbon for longer• Thus the agreed orderly closure of Diablo Canyon will save money and carbon while improving grid operation; it will be replaced by zero-carbon resources acquired by competitive auction, saving the most carbon per $
• We must track not just the carbon but also the money…and the years too
A B Lovins, “Closing Diablo Canyon Nuclear Plant Will Save Money and Carbon,” Forbes, 22 Jun 2016, www.forbes.com/sites/amorylovins/2016/06/22/close-a-nuclear-plant-save-money-and-carbon-improve-the-grid-says-pge; —, “Do Coal and Nuclear Generation Deserve Above-Market Prices?,” El. J. 30(6):22–30 (Jul 2017), http://dx.doi.org/10.1016/j.tej.2017.06.002 (see also Oct & Dec El. J. issues’ exchanges with two Exelon-funded critics), preprint at https://d231jw5ce53gcq.cloudfront.net/wp-content/uploads/2017/07/ElJ6May2017_preprint.pdf
Closing distressed reactors can generally save money and carbon
These operating-cost data reveal an important climate opportunity that the nuclear industry hopes you won’t discover. * The latest data from the nuclear industry, for 2014–16, show that average US nuclear operating cost (opex) exceeded 4US¢/kWh for the costlier-to-run half of the 97 US power reactors, or 5¢ for the costliest quartile. Owners demand new multi-billion-$ subsidies to keep running these money-losing plants. Yet * customer efficiency cost US utilities only 2–3¢/kWh on average—less if they shop carefully. Therefore * closing a top-quartile-cost nuclear plant and buying efficiency instead, as owners could volunteer or regulators require, would save several times as much carbon as continuing to run the nuclear plant. Some modern renewables now rival efficiency’s cost and could compete for that opportunity. * Thus, while we close coal plants to save carbon directly, we should also close distressed nuclear plants and reinvest their large saved operating cost in cheaper options to save carbon indirectly. * US evidence shows that this replacement actually takes only 1–3 years. If owners don’t give such advance notice—a common tactic to extort subsidies by making closure more disruptive—more natural gas might temporarily be burnt, but then it’s more than offset by the carbon-free substitutes. * California’s biggest utility therefore reached a consensus with greens, unions, and regulators to replace its well-running Diablo Canyon reactors with least-cost carbon-free resources to save money and carbon and help the grid work better. To get these outcomes, we must * track not just carbon but also money and time. Investing judiciously, not indiscriminately, thus saves the most carbon per €. / Now what about per year? *

Nuclear vs. modern-renewable per-capita deployment speed ( –2015)
Source: Junji Cao et al., “China-U.S. cooperation to advance nuclear power,” Science 353:547–8, 5 Aug 2016, doi: 10.1126/science.aaf7131, from Supplementary Materials at www.sciencemag.org/content/353/6299/547/suppl/DC1; see also A. Lovins, “Nuclear power: deployment speed,” Science 354:1112–1113 (2 Dec 2016), https://doi.org/10.1126/science.aal1777, and sources on the following slide.
This misleading graph (Science, 5 Aug 2016) implies nuclear is“much faster”…
Claims that nuclear generation grows faster than renewable generation, making nuclear desirable or even essential for climate protection, use cherry-picked old data and a strange methodology based not on absolute growth but on per-capita growth. This makes the climate importance of decarbonizing generation depend on the population of the country where it occurs, so Sweden or Slovakia look far more important than China. A 2016 paper with some distinguished coauthors in the leading journal Science thus claimed in this widely republished graph that nuclear growth is generically “much faster” than renewable growth. But once I’d corrected that paper’s seven analytic flaws and distortions…
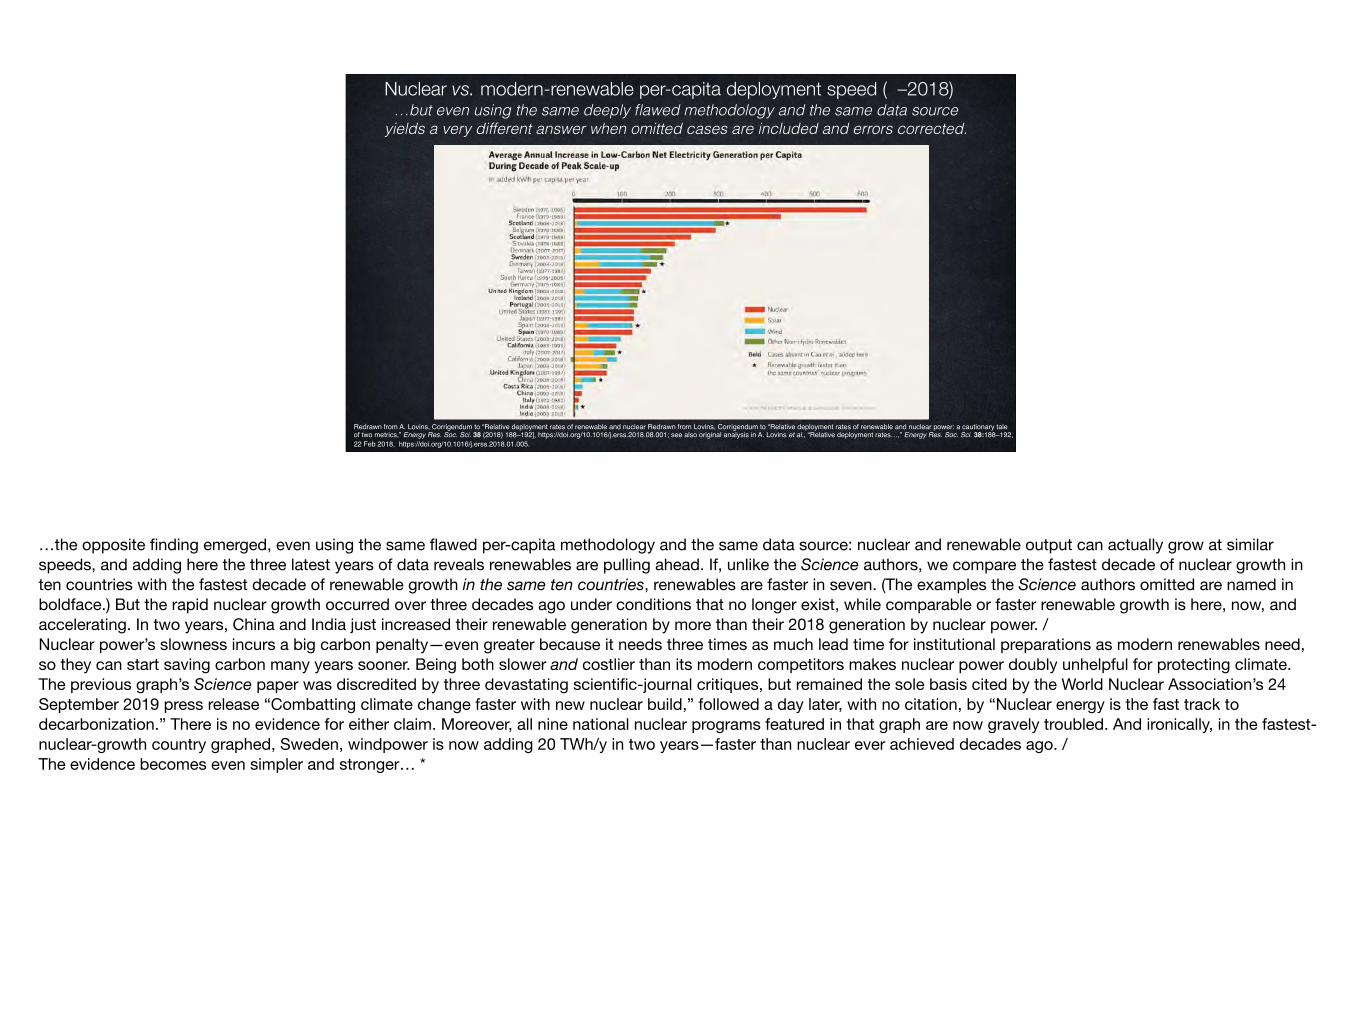
Nuclear vs. modern-renewable per-capita deployment speed ( –2018) …but even using the same deeply flawed methodology and the same data source
yields a very different answer when omitted cases are included and errors corrected.
Redrawn from A. Lovins, Corrigendum to “Relative deployment rates of renewable and nuclear Redrawn from Lovins, Corrigendum to “Relative deployment rates of renewable and nuclear power: a cautionary tale of two metrics,” Energy Res. Soc. Sci. 38 (2018) 188–192], https://doi.org/10.1016/j.erss.2018.08.001; see also original analysis in A. Lovins et al., “Relative deployment rates…,” Energy Res. Soc. Sci. 38:188–192, 22 Feb 2018, https://doi.org/10.1016/j.erss.2018.01.005.
…the opposite finding emerged, even using the same flawed per-capita methodology and the same data source: nuclear and renewable output can actually grow at similar speeds, and adding here the three latest years of data reveals renewables are pulling ahead. If, unlike the Science authors, we compare the fastest decade of nuclear growth in ten countries with the fastest decade of renewable growth in the same ten countries, renewables are faster in seven. (The examples the Science authors omitted are named in boldface.) But the rapid nuclear growth occurred over three decades ago under conditions that no longer exist, while comparable or faster renewable growth is here, now, and accelerating. In two years, China and India just increased their renewable generation by more than their 2018 generation by nuclear power. /Nuclear power’s slowness incurs a big carbon penalty—even greater because it needs three times as much lead time for institutional preparations as modern renewables need, so they can start saving carbon many years sooner. Being both slower and costlier than its modern competitors makes nuclear power doubly unhelpful for protecting climate. The previous graph’s Science paper was discredited by three devastating scientific-journal critiques, but remained the sole basis cited by the World Nuclear Association’s 24 September 2019 press release “Combatting climate change faster with new nuclear build,” followed a day later, with no citation, by “Nuclear energy is the fast track to decarbonization.” There is no evidence for either claim. Moreover, all nine national nuclear programs featured in that graph are now gravely troubled. And ironically, in the fastest-nuclear-growth country graphed, Sweden, windpower is now adding 20 TWh/y in two years—faster than nuclear ever achieved decades ago. /The evidence becomes even simpler and stronger… *

Carbon-free global final energy is 28% and acceleratingGlobal total final commercial energy consumption from non-fossil-fuel sources, 1975–2018e
Nuclear electricity
Hydroelectricity
Solar electricity
Wind electricity
Geothermal el. & biomass el.Biofuels
Renewable heat (biomass,solar, geothermal) (2018 est.)
Exaj
oule
s/y
2018eSources: BP Statistical Review of World Energy 2019 for all resources, except renewable heat (excluding traditional biomass) from IEA online database, verified within ~1% from IEA WEO 2018 Figure 6.6 by subtracting BP “biofuels” from IEA “other renewables.” (BP does not appear to show renewable heat, while IEA aggregates biofuels with biomass. BP’s biofuels data begin in 1990.) REN21 Global Status Report 2019 draws very similar renewable heat data from IEA and reports its total as 4.2% of 2017 TFEC, comprising 89% biomass, 9% solar, and 2% geothermal. We extrapolate renewable heat total from 2017 to 2018 by using its average annual growth rate during 2014–17.
0
10
20
30
40
50
60
70
80
90
100
110
1975 1980 1985 1990 1995 2000 2005 2010 2015
…if we bypass international comparisons and simply compare different power sources’ total output growth worldwide. Nuclear output’s * stagnation (magenta) was more than offset by growth in hydropower of all sizes (blue), then by faster growth in solar power (yellow), windpower (red), and other renewable generation (brown). Renewables, with or without hydropower, are clearly growing faster than nuclear power did in its heyday in the 1980s. Global carbon-free electricity is now less than one-third nuclear. Counting also non-electric carbon-free energy production—biofuels (dark blue) and modern renewable heat (orange)—nuclear power struggles to sustain less than one-fourth of the world’s carbon-free final energy. Why pay more to revive it at the expense of faster and cheaper competitors? *

Modern renewables: the new engine of carbon-free growth
Exaj
oule
s/y
-2
-1
0
1
2
3
4
5
6
1975 1980 1985 1990 1995 2000 2005 2010 2015
Nuclear Hydro Solar el. Wind Geothermal, biomass, waste el. Biofuels Renewable heat Sources: BP Statistical Review of World Energy 2019 for all resources, except renewable heat (excluding traditional biomass) from IEA online database, verified within ~1% from IEA WEO 2018 Figure 6.6 by subtracting BP “biofuels” from IEA “other renewables.” (BP does not appear to show renewable heat, while IEA aggregates biofuels with biomass. BP’s biofuels data begin in 1990.) REN21 Global Status Report 2019 draws very similar renewable heat data from IEA and reports its total as 4.2% of 2017 TFEC, comprising 89% biomass, 9% solar, and 2% geothermal. We extrapolate renewable heat total from 2017 to 2018 by using its average annual growth rate during 2014–17.
2018e
Modern renewables are conventionally all renewables less hydro >50 MW; this graph doesn’t distinguish small hydro
fastest one-year nuclear output growth }
Regraphing the same data as annual changes in energy output by technology let us directly compare growth rates year by year: total * renewable additions in 2018 were 1.8⨉ the * fastest year’s nuclear addition (in 1985).
Sustaining uneconomic reactors would not only divert public funding from more climate-effective competitors but also constrain their sales by preëmpting market space, and degrade the competitive markets where they thrive. Slowing and blocking the fastest and cheapest climate solutions harms climate protection. Why should a particular low-carbon solution, unable to compete after a half-century, now be awarded walled-garden market preferences and new subsidies unavailable to other low-carbon solutions? Shouldn’t policy, as IEA agrees, be technology-neutral? *
Clean watts are obvious; negawatts are invisible but bigger
One final thought. During 2010–16, the world economy was decarbonized three times as much by saving energy as by adding carbon-free production. Energy savings, largely from better technical efficiency, shrank 2000–17 electricity demand in 18 of the 30 IEA member nations, and across all 30, savings cut growth in electricity demand by more than four-fifths. Yet efficiency is only getting started, and new design methods can make it severalfold bigger and cheaper, often with increasing returns. So climate-effective solutions are available at least as much in efficient use as in the impressive reality of * modern renewables.
Together, these carbon-free options are now bigger, faster, cheaper, and more climate-effective than building or just operating reactors. This makes new or often even continued nuclear generation a counterproductive climate solution. If someone tells you differently, you may wish to reply, “In God we trust; all others bring data.” Thank you. *

WNISR2019
Mycle Schneider Consulting Brussels, 19 February 2020
Conclusions
• For the first time the average age of world nuclear fleet exceeds 30 years.
In 2018• Nuclear power added 9 GW to the world’s power grids to reach a record 370 GW, while renewables added a record 165 GW (wind and solar cumulate >1,000 GW total);• Nuclear power generation increased by 2.4%, wind by 29%, solar by 13%;• 10 of 31 nuclear countries generate more power with renewables than with nuclear.
In 2019• Nuclear construction down to a trickle with 2(–4) starts vs. 15 in 2010;• 5 Startups / 5 Closures
• Construction times average 10 years over the past decade.• The costs of new nuclear have increased by 26%, while solar costs decreased by 89% and wind by 70%.• Fighting the climate emergency requires to invest into effective strategies combining speed and competitive cost to drastically reduce emissions. Nuclear power turns out not only the most expensive, but the slowest option to generate “low-carbon” electricity and to provide essential energy services.

WNISR2019
Mycle Schneider Consulting Brussels, 19 February 2020
The Project Coordinator and Publisher
Mycle Schneider Consulting
About the Author
Contact: [email protected] www.WorldNuclearReport.org
Mycle Schneider works as independent international consultant on energy and nuclear policy. He is the initiator and Convening Lead Author of the World Nuclear Industry Status Reports and Founding Board Member and Spokesperson of the International Energy Advisory Council (IEAC). He is a member of the International Panel on Fissile Materials (IPFM), based at Princeton University, USA. In 2010-2011, he acted as Lead Consultant for the Asia Clean Energy Policy Exchange, implemented by IRG, funded by USAID, with the focus of developing a policy framework to boost energy efficiency and renewable energies. Between 2004 and 2009 he has been in charge of the Environment and Energy Strategies Lecture of the International Master of Science for Project Management for Environ-mental and Energy Engineering at the Ecole des Mines in Nantes, France.
From 2000 to 2010 he was an occasional advisor to the German Environment Ministry. 1998-2003 he was an advisor to the French Environment Minister’s Office and to the Belgian Minister for Energy and Sustainable Development. Mycle Schneider has given evidence or held briefings at national Parliaments in 15 countries and at the European Parliament. He has advised Members of the European Parliament from four different groups over the past 30 years. He has given lectures or had teaching appointments at over 20 universities and engineering schools in more than 10 countries.Mycle Schneider has provided information and consulting services to a large variety of clients including international institutions and organizations, think tanks and NGOs.In 1997 he was honoured with the Right Livelihood Award (“Alternative Nobel Prize”).
Photo: ©Nina Schneider

WNISR2019
Mycle Schneider Consulting Brussels, 19 February 2020
Amory B. Lovins
Physicist Amory Lovins (1947), FRSA, is Cofounder and Chairman Emeritus of Rocky Mountain Institute (RMI); energy advisor to major firms and governments in 65+ countries for 40+ years; author of 31 books and more than 600 papers; and an integrative designer of superefficient buildings, factories, and vehicles.
He is a Contributing Author of WNISR2019.
A Harvard and Oxford dropout, former Oxford don, honorary US architect, and Swedish engineering academician, he has taught at ten universities, most recently Stanford’s Engineering School and the Naval Postgraduate School. He served in 2011–18 on the National Petroleum Council. Time has named him one of the world’s 100 most influential people, and Foreign Policy, one of the 100 top global thinkers. His latest books include Natural Capitalism (1999, www.natcap.org), Small Is Profitable (2002, www.smallisprofitable.org), Winning the Oil Endgame (2004, www.oilendgame.com), The Essential Amory Lovins (2011), and Reinventing Fire (2011, www.reinventingfire.com).
His main recent efforts include supporting RMI’s collaborative synthesis, for China’s National Development and Reform Commission, of an ambitious efficiency-and-renewables trajectory that informed the 13th Five Year Plan; helping the Government of India design transformational mobility; and exploring how to make integrative design the new normal, so investments to energy efficiency can yield expanding rather than diminishing returns.
He has received numerous prestigious awards and was awarded the Officer’s Cross of the Order of Merit (Bundesverdienstkreuz 1. Klasse) by the President of Germany.

WNISR2019
Mycle Schneider Consulting Brussels, 19 February 2020
Ben Wealer
Ben Wealer is a research associate at the Workgroup for Economic and Infrastructure Policy (WIP) at Berlin Institute of Technology (TU Berlin), and guest researcher at DIW Berlin (German Institute for Economic Research) as well as a scholar of the Heinrich-Böll-Stiftung. His field of research is nuclear power economics with a focus on decommissioning, radioactive waste management, nuclear power plant new-build, and the dual-use issues of nuclear power.
He is a founding member of a research project on nuclear energy in Germany, Europe, and abroad run jointly by TU Berlin and DIW Berlin and the author—among others—of the first German independent decommissioning monitoring survey. Since 2018, Wealer is a contributing author to the World Nuclear Industry Status Report. He is also co-author of the first World Nuclear Waste Report.