the world of abc economics - wordpress.com · the world of abc economics – monthly news bulletin...
TRANSCRIPT

The World of ABC Economics
THE WORLD OF ABC ECONOMICS / APRIL 2016 / NO. 5 / abceconomics.com
THE ECONOMICS OF DPRK
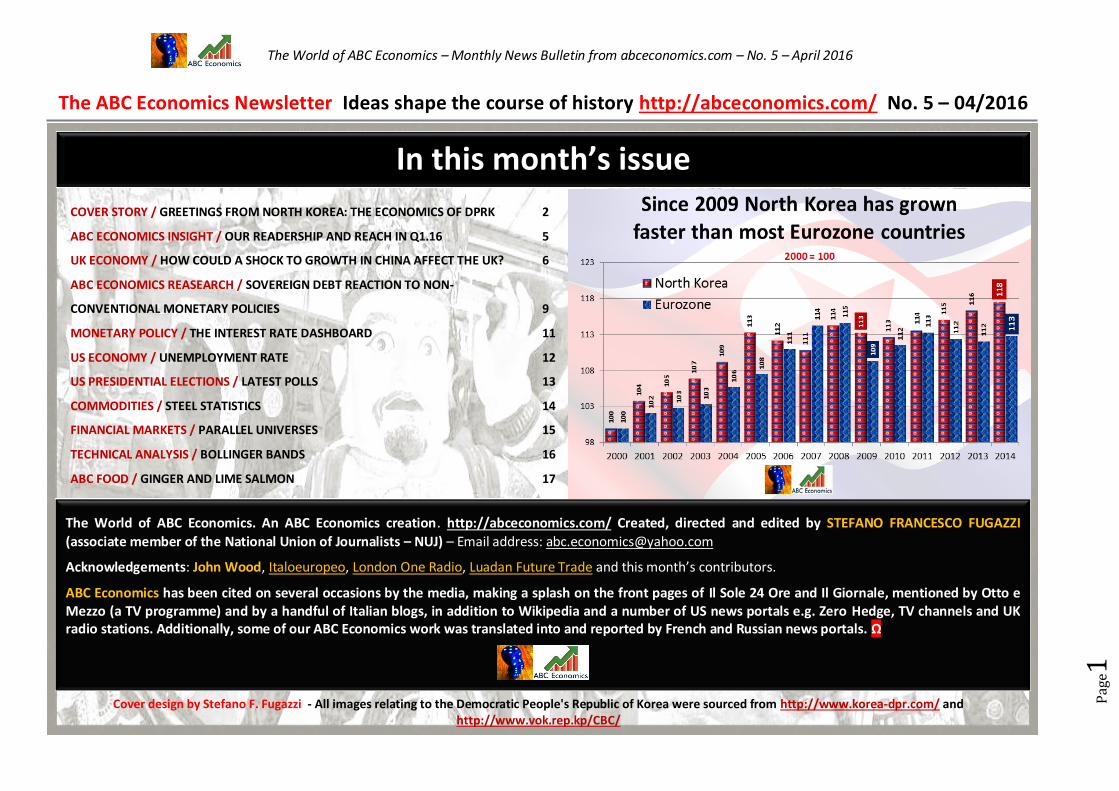
(Growing faster than most Eurozone countries)
Created, directed and edited by STEFANO FRANCESCO FUGAZZI (associate member of the National Union of Journalists – NUJ)
The World of ABC Economics – Monthly News Bulletin from abceconomics.com – No. 5 – April 2016
Pag
e1
The ABC Economics Newsletter Ideas shape the course of history http://abceconomics.com/ No. 5 – 04/2016
In this month’s issue
COVER STORY / GREETINGS FROM NORTH KOREA: THE ECONOMICS OF DPRK 2
ABC ECONOMICS INSIGHT / OUR READERSHIP AND REACH IN Q1.16 5
UK ECONOMY / HOW COULD A SHOCK TO GROWTH IN CHINA AFFECT THE UK? 6
ABC ECONOMICS REASEARCH / SOVEREIGN DEBT REACTION TO NON-
CONVENTIONAL MONETARY POLICIES 9
MONETARY POLICY / THE INTEREST RATE DASHBOARD 11
US ECONOMY / UNEMPLOYMENT RATE 12
US PRESIDENTIAL ELECTIONS / LATEST POLLS 13
COMMODITIES / STEEL STATISTICS 14
FINANCIAL MARKETS / PARALLEL UNIVERSES 15
TECHNICAL ANALYSIS / BOLLINGER BANDS 16
ABC FOOD / GINGER AND LIME SALMON 17
The World of ABC Economics. An ABC Economics creation. http://abceconomics.com/ Created, directed and edited by STEFANO FRANCESCO FUGAZZI
(associate member of the National Union of Journalists – NUJ) – Email address: [email protected]
Acknowledgements: John Wood, Italoeuropeo, London One Radio, Luadan Future Trade and this month’s contributors.
ABC Economics has been cited on several occasions by the media, making a splash on the front pages of Il Sole 24 Ore and Il Giornale, mentioned by Otto e Mezzo (a TV programme) and by a handful of Italian blogs, in addition to Wikipedia and a number of US news portals e.g. Zero Hedge, TV channels and UK radio stations. Additionally, some of our ABC Economics work was translated into and reported by French and Russian news portals. Ω
Cover design by Stefano F. Fugazzi - All images relating to the Democratic People's Republic of Korea were sourced from http://www.korea-dpr.com/ and http://www.vok.rep.kp/CBC/
The World of ABC Economics – Monthly News Bulletin from abceconomics.com – No. 5 – April 2016
Pag
e2
COVER STORY / GREETINGS FROM NORTH KOREA: THE ECONOMICS OF DPRK
Stefano Francesco Fugazzi (founder of ABC Economics) reports.
Take your typical small open economy with access to the World's largest single market and capable of attracting foreign investments and recording unprecedented levels of economic growth before 2008. Think of Ireland. Then think of the opposite. A closed, inward-looking, centralised economy. You must be thinking of North Korea, officially the Democratic People's Republic of Korea (DPRK), right?
You may have heard of North Korea's nuclear programme and their inclusion in America's Axis of Evil. However, chances are that you have never read anything about the state of health of their economy. Even the International Monetary Fund (IMF) does not hold any information on North Korea in their economic database.
Information is scarce and biased as Western media seem to be exclusively interested in reporting on the flamboyant management style of the country's supreme leader, Kim Jong-un. But never a word, or a true fact, on the economics of North Korea.
In this issue of The World of ABC Economics we attempt to shed some light on their economy.
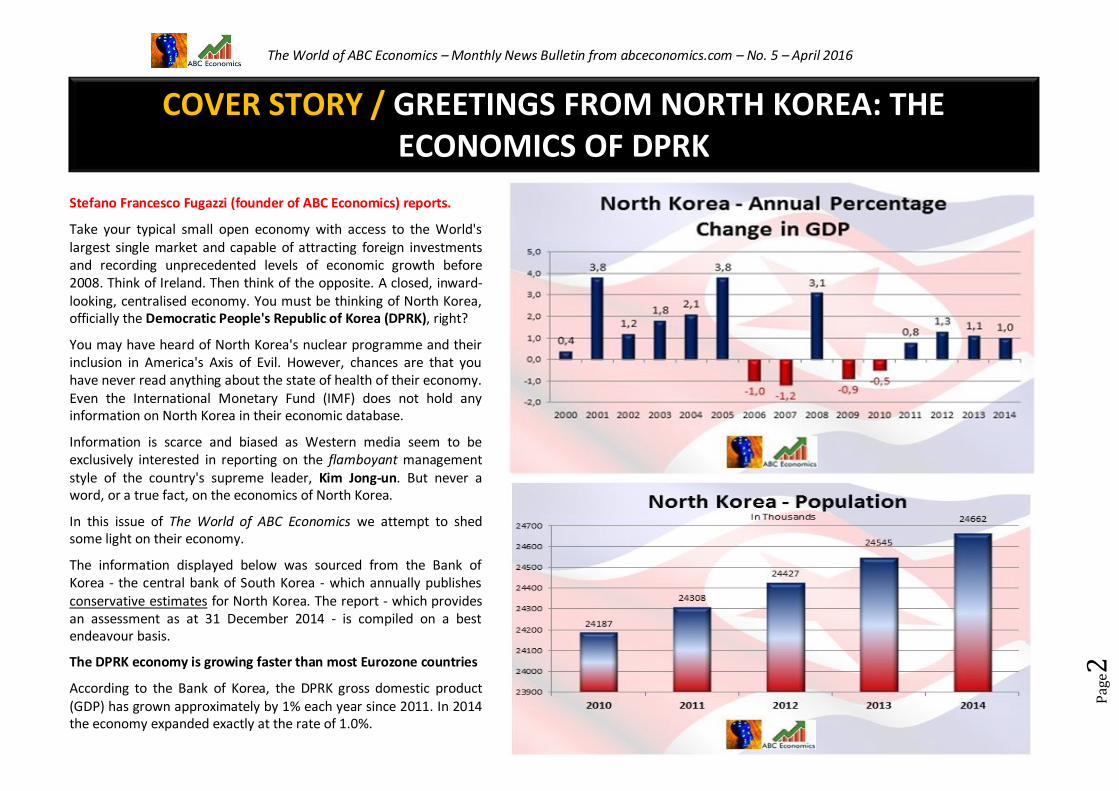
The information displayed below was sourced from the Bank of Korea - the central bank of South Korea - which annually publishes conservative estimates for North Korea. The report - which provides an assessment as at 31 December 2014 - is compiled on a best endeavour basis.
The DPRK economy is growing faster than most Eurozone countries
According to the Bank of Korea, the DPRK gross domestic product (GDP) has grown approximately by 1% each year since 2011. In 2014 the economy expanded exactly at the rate of 1.0%.

The World of ABC Economics – Monthly News Bulletin from abceconomics.com – No. 5 – April 2016
Pag
e3
Production in the agriculture, forestry & fishing sectors grew by 1.2% in 2014 (+1.9% in 2013) mainly thanks to fisheries and livestock production, partially offset by a contraction in cultivated crops.
Mining production expanded by 1.6% (+2.1% in 2013) boosted by an increase in the extraction of coal and non-metallic minerals.
Manufacturing - comprising both light and heavy industries - grew by 0.8% (+1.1% in 2013).
Electricity, gas & water production fell by 2.8%(+2.3% in 2013) mainly due to a contraction in hydroelectric power generation.
A 1.4% increase in the construction sector (-1.0% in 2013) was largely driven by growth in building construction, whilst civil engineering - such as construction of roads and electric power plants - contracted.
Overall, the services sector increased by 1.3% (+0.3% in 2013) mainly due to the public sector (+1.6%) in addition to a buoyant performance both in the transportation & communication (+1.1%) and retail & tourism (+0.8%) sectors.
Gross national income and external trade
North Korean gross national income (nominal GNI) was valued at 34.2 trillion KRW for 2014, whilst GNI per capita stood at 1.388 million KRW.
The volume of North Korea's external trade (computed as the sum of exports and imports of goods, excluding trade between North and South Korea) amounted to 7.61 billion dollars in 2014, up by 0.27 billion dollars from 2013.
In 2014 exports decreased by 1.7% mainly due to products of mineral origin (-17.1%), partially offset by textiles (+24.7% year-on-year movement).
Imports grew by 7.8% year-on-year, an increase largely driven by machinery (+27.1%) and textiles (+14.6%).

The World of ABC Economics – Monthly News Bulletin from abceconomics.com – No. 5 – April 2016
Pag
e4
Bilateral trade between North and South Korea
Bilateral trade between North and South Korea increased by 106.2% year-on-year to record 2.34 billion dollars in 2014.
North-to-South trade expanded by 96.1%, mainly due to electric & electronic goods (+112.2%), textiles (+89.0%) and daily supplies (+94.5%).
South-to-North trade grew by 118.3% year-on-year, particularly with regard to electric & electronic goods (+199.2%) and textiles (+87.9%). Ω

The World of ABC Economics – Monthly News Bulletin from abceconomics.com – No. 5 – April 2016
Pag
e5
INSIGHT / OUR READERSHIP AND REACH IN Q1.16

The World of ABC Economics – Monthly News Bulletin from abceconomics.com – No. 5 – April 2016
Pag
e6
UK ECONOMY / HOW COULD A SHOCK TO GROWTH IN CHINA AFFECT THE UK?
Excerpt from a Bank of England research paper published on 18 March 2016 Written by Ambrogio Cesa-Bianchi and Kate Stratford of the Bank’s Global Spillovers and Interconnections Division.
A 1% slowing in China is likely to reduce UK GDP by around 0.1%. This impact arises mainly from the increasingly important role of China in the global economy — that is, via the United Kingdom’s indirect links with China through its main trading partners.
Introduction
GDP growth in China has slowed significantly in recent years. Some further slowdown is expected (Chart 1) as the Chinese authorities attempt to rebalance the economy towards consumption and away from investment. There remains considerable uncertainty around how smooth that rebalancing will be, though. And there is a risk that growth could slow more sharply than expected.
Developments in China are likely to have important implications for the world economy and, in turn, for the
UK economic outlook. Moreover, given the increasingly important role of China in the global economy, the impact of developments in Chinese economic activity may have changed over time. Indeed, while in 1990 China accounted for around 4% of world GDP, China is now the largest economy in the world, accounting for more than 17% of world GDP. And Chinese imports account for around 10% of global trade.
Trade channels
A key transmission mechanism through which a shock to Chinese GDP might spill over to the United Kingdom is international trade. A slowing in Chinese GDP would reduce the demand for goods and services produced by UK firms.

The World of ABC Economics – Monthly News Bulletin from abceconomics.com – No. 5 – April 2016
Pag
e7
And as the United Kingdom is an open economy, with exports accounting for around 30% of GDP, the trade channel could be an important part of the transmission of world shocks. While the trade channel may be theoretically important, the share of UK exports that go directly to China is smaller than other trading partners — less than 4% in 2014. So, at first sight, it may seem that Chinese growth should only have a limited impact on the demand for UK exports and, therefore, GDP growth. But China is now the world’s largest goods exporter and the indirect trade links (links between China and the United Kingdom through other countries) are potentially sizable. While China only accounts for a small share of UK exports, it is a far more important source of export demand for some of our key trading partners, such as the euro area and United States: exports to China make up just under 10% of total goods exports for both the United States and euro area. Moreover, roughly 10% of the euro area’s exports go to other Asian economies, who are in turn heavily reliant on Chinese demand.
The importance of the trade channel is likely to have risen significantly over the past two decades. In the late 1990s, China only accounted for around 2% of world imports of goods and services, and 3% of world exports. But by 2014, those shares had risen to 10% and 11%, respectively, making China the world’s second largest importer and the largest exporter. At the same time, UK exports to China have risen significantly, from around 0.5% through the 1990s to 4% in 2014.
Spill-over effects
In addition to trade, financial channels can also play an important role in the transmission of international shocks.
Financial spill-overs from China could operate directly through the UK banking sector. For example, UK-owned banks have direct exposures to Chinese financial institutions, corporates and households through their foreign lending activities. As a result, UK banks could suffer losses as a result of a weakening in Chinese demand conditions if it were associated with a rise in non-performing loans. Losses abroad could, in turn, bear down on banks’ willingness and ability to lend to the UK real economy. They could also lead to an increase in banks’ funding costs, particularly if combined with a deterioration in financial market sentiment. Increased funding costs would then feed through into a higher cost of borrowing for UK businesses and households. In addition, losses suffered by Chinese financial institutions could weigh on lending to UK affiliates, or their supply of wholesale funds to UK banks.
This ‘direct’ exposure, however, is relatively small, since only 1.6% of UK-owned banks’ foreign claims is directed to Chinese banks. But, similarly to trade linkages, indirect linkages may play an important role. For example, the total exposure when including Hong Kong — which, in turn, has important linkages with China — amounts to just over US$530 billion, or around 16% of UK-owned banks’ foreign claims. For this reason, the Bank’s 2015 stress test included a severe scenario for these economies, with sharp reductions in GDP growth, and property and equity prices, to ensure that the UK banking system was sufficiently capitalised to withstand the risks on these foreign exposures. Financial spillovers to the United Kingdom could also operate through non-banking channels. For example, slowing in China could be reflected in falls in asset prices both in China and elsewhere. Such falls would in turn push up UK companies’ cost of capital and reduce households’ wealth. And indeed, despite the small share of China in global equity market capitalisation (at slightly less than 10% in 2014), financial market developments through the summer of 2015 highlighted that global asset prices can be very sensitive to developments in China.

The World of ABC Economics – Monthly News Bulletin from abceconomics.com – No. 5 – April 2016
Pag
e8
Financial linkages between China and the rest of the world have also become increasingly important. For example, since the early 1990s China’s total external liabilities have increased from less than 0.5% of world GDP to around 6%. And UK-owned banks’ exposures to China have risen roughly tenfold over the past decade, to US$169 billion in 2015 Q3. A slowing in China could also raise uncertainty about the outlook for growth there and elsewhere; this could affect UK households’ and companies’ confidence and so weigh on their spending decisions. China is now the largest economy in the world (on a purchasing power parity basis) and has contributed more to global growth than all advanced economies over the past eight years (Chart 2). So any shock to the Chinese growth outlook might be expected to have significant effects on the United Kingdom and other countries through global sentiment and risk aversion.
Commodity prices
It is likely that slower Chinese growth would weigh heavily on commodity prices. China has been, by far, the largest individual driver of demand growth for oil and industrial metals such as copper and aluminium. For example, China has accounted for around one third of the total increase in global oil demand since 1990. It now accounts for over 10% of world oil demand and roughly 50% of copper demand. During the 2009–12 period, China contributed on average 40% to global aluminium consumption.
As a result, commodity prices tend to be very sensitive to Chinese growth developments. Unlike the previously discussed channels, a decline in oil and other commodity prices should boost UK GDP growth, given that the United Kingdom is a net importer of those goods. Household real incomes should also be boosted by the decline in prices, leading to increased consumption. And UK firms will benefit from lower commodity prices overall, due to lower costs of energy and other inputs. In the other direction, though, investment spending of the United Kingdom’s extraction sector is likely to fall. Demand elsewhere in the world is also likely to benefit, supporting UK exports, although commodity producers would be likely to cut back their spending in response. Overall, the decline in commodity prices should provide some offset to the drag from trade, financial channels and confidence. Ω

The World of ABC Economics – Monthly News Bulletin from abceconomics.com – No. 5 – April 2016
Pag
e9
RESEARCH / SOVEREIGN DEBT REACTION TO THE ANNOUNCEMENT OF NON-CONVENTIONAL MONETARY
POLICIES
An ABC Economics research by Stefano F. Fugazzi.
Observed events
7 May 2009: Covered Bond Purchase Programme (CBPP)
10 May 2010: Securities Markets Programme (SMP)
6 October 2011: Long Term Refinancing Operation (LTRO)
2 August 2012: Outright Monetary Transactions (OMT)
5 June 2014: Targeted Longer Term Refinancing Operations (TLTRO)
22 January 2015: Asset Purchase Programme (APP)
10 March 2016: expansion of Asset Purchase Programme (APP)
Research methods
To derive the variations in yields we selected the 10-year sovereign papers of France and Germany in addition to the so called ‘PIIGS economies’, a derogatory term referring to the economies of Portugal, Ireland, Italy, Greece and Spain.
This research is entirely based on secondary data collected via Bloomberg and TradingEconomics and subsequently reworked by
ABC Economics.
This paper assesses the sovereign debt market’s reaction to the ECB announcement of non-conventional monetary policies. Our findings are consistent with previous studies in the literature which generally conclude that sovereign bond yields decrease subsequent to announcement of
monetary easing initiatives.

The World of ABC Economics – Monthly News Bulletin from abceconomics.com – No. 5 – April 2016
Pag
e10
Conclusions
In the cases of the announcement of the CBPP and LTRO programmes, within the 0-3 days horizon, we noticed a yield increase across the entire sample reaching a +7.73% in the case of Germany’s bunds following the Long Term Refinancing Operation. A similar pattern was also observed within the day -3 to day +3 horizon with highs of +15.47% and 12.50% for France and Germany following the announcement of the LTRO, with the exceptions of Irish, Greek and Portuguese papers whose yields declined by 2-3% in the case of the CBBP.
The announcement of SMP, TLTRO and APP operations have led to an overall decrease of yields over the day 0 to day +3 horizon, with two exceptions:
Greece – Athens’s 10-year yield increased following the initial exclusion of the Hellenic country from the Asset Purchase Programme;
Germany – the Bund reacted negatively to the extended APP operation. The reader should note that yields may have increased as a result of the outcome of the German municipal elections.
Mixed reactions for the OMT which was intended as a replacement for the SMP. Negative for France and Germany (an increase in the 10-year yields)
and positive for the PIIGS countries (a decrease in yields). Ω

The World of ABC Economics – Monthly News Bulletin from abceconomics.com – No. 5 – April 2016
Pag
e11
Country | Policy Rate Name (last variation) Latest Rate (Latest Change)
Country | Policy Rate Name (last variation) Latest Rate (Latest Change)
ARGENTINA | Reverse Repo Rate 1d (Aug 03, 2014) 13.00 % (+ 4.00) JAPAN | Call Rate (Oct 05, 2010) 0-0.10 % (- 0.10)
AUSTRALIA | Cash Rate (May 05, 2015) 2.00 % (- 0.25) MEXICO | Benchmark Rate (Feb 17, 2015) 3.75 % (+ 0.50)
BRAZIL | Selic Rate (Jul 30, 2015) 14.25 % (+ 0.50) NEW ZEALAND | Cash Rate (Mar 10, 2016) 2.25 % (- 0.25)
CANADA | Target ON Rate (Jul 15, 2015) 0.50 % (- 0.25) NORWAY | Key Policy Rate (Mar 17, 2016) 0.50 % (- 0.25)
CHILE | Monetary Policy Rate (Dec 17, 2015) 3.50 % (+ 0.25) POLAND | Reference Rate (Mar 04, 2015) 1.50 % (- 0.50)
CHINA | Lending Rate (Oct 23, 2015) 4.35 % (- 0.25) RUSSIA | Key Rate (Jul 31, 2015) 11.00 % (- 0.50)
CZECH REPUBLIC | Repo Rate (Nov 01, 2012) 0.05 % (- 0.20) SAUDI ARABIA | Repurchase Rate (Jan 19, 2009) 2.00 % (- 0.50)
DENMARK | Lending Rate (Jan 19, 2015) 0.05 % (- 0.15) SOUTH KOREA | Base Rate (Jun 11, 2015) 1.50 % (- 0.25)
EUROZONE | Key Interest Rate (Mar 10, 2016) 0.00 % (- 0.05) SOUTH AFRICA | Repurchase Rate (Mar 17, 2016) 7.00 % (+ 0.25)
HUNGARY | Base Rate (Jul 21, 2015) 1.35 % (- 0.15) SWEDEN | Repo Rate (Feb 11, 2016) -0.50 % (- 0.15)
ICELAND | 7-d Deposit Rate (Nov 04, 2015) 5.75 % (+ 0.25) SWITZERLAND | SNB-Target Range (Jan 15, 2015) -1.25% to -0.25 %
INDIA | Policy Repo Rate (Sep 29, 2015) 6.75 % (- 0.50) TURKEY | Repo Rate (Feb 24, 2015) 7.50 % (- 0.25)
INDONESIA | Benchmark Rate (Mar 17, 2016) 6.75 % (- 0.25) UNITED KINGDOM | Bank Rate (Mar 05, 2009) 0.50 % (- 0.50)
ISRAEL | Benchmark Rate (Feb, 23, 2015) 0.10 % (- 0.15) USA | Funds Rate (Dec 16, 2015) 0.25-0.50 (+0.25)
MONETARY POLICY / THE INTEREST RATE DASHBOARD
ABC Economics infographics based on cbrates.com data

The World of ABC Economics – Monthly News Bulletin from abceconomics.com – No. 5 – April 2016
Pag
e12
US ECONOMY / UNEMPLOYMENT RATE
JOHN WOOD reports.
Infographics sourced via Business Insider
According to the latest figures published by the Bureau of Labor Statistics (BLS), unemployment rate in the United States rose unexpectedly to 5.0 percent in March 2016, from 4.9 percent in February.
Unemployment decreased in 22 states between January and February, rose in 8 states, and remained unchanged in the remaining 20 states and in the District of Columbia.
The BLS observed that unemployment rates ranged from a low of 2.7% in New Hampshire and South Dakota to a high of 6.6% in Alaska. Ω

The World of ABC Economics – Monthly News Bulletin from abceconomics.com – No. 5 – April 2016
Pag
e13
Race/Topic Poll Results Spread Poll date General Election: Trump vs. Clinton PPP (D) Clinton 48, Trump 41 Clinton +7 Thursday, March 31
General Election: Cruz vs. Clinton PPP (D) Clinton 45, Cruz 42 Clinton +3 Thursday, March 31
General Election: Kasich vs. Clinton PPP (D) Kasich 45, Clinton 41 Kasich +4 Thursday, March 31
General Election: Trump vs. Sanders PPP (D) Sanders 48, Trump 40 Sanders +8 Thursday, March 31
General Election: Cruz vs. Sanders PPP (D) Sanders 48, Cruz 41 Sanders +7 Thursday, March 31
General Election: Kasich vs. Sanders PPP (D) Sanders 41, Kasich 44 Kasich +3 Thursday, March 31
General Election: Trump vs. Clinton Monmouth Clinton 48, Trump 38 Clinton +10 Thursday, March 24
General Election: Cruz vs. Clinton Monmouth Clinton 45, Cruz 40 Clinton +5 Thursday, March 24
General Election: Kasich vs. Clinton Monmouth Kasich 45, Clinton 39 Kasich +6 Thursday, March 24
General Election: Trump vs. Clinton FOX News Clinton 49, Trump 38 Clinton +11 Wednesday, March 23
General Election: Trump vs. Clinton Quinnipiac Clinton 46, Trump 40 Clinton +6 Wednesday, March 23
General Election: Trump vs. Clinton Bloomberg Clinton 54, Trump 36 Clinton +18 Wednesday, March 23
General Election: Cruz vs. Clinton FOX News Clinton 44, Cruz 47 Cruz +3 Wednesday, March 23
General Election: Cruz vs. Clinton Quinnipiac Clinton 45, Cruz 42 Clinton +3 Wednesday, March 23
General Election: Cruz vs. Clinton Bloomberg Clinton 51, Cruz 42 Clinton +9 Wednesday, March 23
ABC Economics based on RealClearPolitics data Ω
US PRESIDENTIAL ELECTIONS / LATEST POLLS

The World of ABC Economics – Monthly News Bulletin from abceconomics.com – No. 5 – April 2016
Pag
e14
COMMODITIES / STEEL STATISTICS Infographics sourced via Knoema Ω
Total Production of Crude Steel Indirect Imports of Steel
True Steel Use (finished steel equivalent) Indirect Exports of Steel

The World of ABC Economics – Monthly News Bulletin from abceconomics.com – No. 5 – April 2016
Pag
e15
FINANCIAL MARKETS / PARALLEL UNIVERSES FEDERICO IZZI reports.
The time has come for us to assess how financial markets fared in the first quarter of the year.
Three facts stand out.
Firstly, we saw a sharp decline in stock prices as never before during the past century.
Secondly, a number of indexes recovered from January’s market slump.
Finally, some significant performance discontinuities between the Old and the New World are beginning to develop, with three Latin American countries – namely Colombia, Brazil and Argentina – outperforming most markets.
Last year’s best and second best performers – the Argentina Merval and Russia’s Micex indexes – recorded a strong start of the year growing 11.3% and 6.4% respectively, whilst Italy’s FtseMib – on the lower step of the podium in 2015 – had a dismal first quarter (-15.4%).
In the US, the S&P500 ended Q1 in mid-table mediocrity (+0,7% YTD). Having bottomed out in mid-February, losing more than 11% in the first six weeks, the index managed to react energetically, recovering over 13% in just six weeks of their last seven. The S&P500 closed either above or below one percent 26 times over the first 48 trading sessions of the year.
Don’t be fooled by the recent bullish market conditions. As previously mentioned in this column, historical evidence suggests market turbulence in the coming months as the end of a presidency nears. Ω

The World of ABC Economics – Monthly News Bulletin from abceconomics.com – No. 5 – April 2016
Pag
e16
TECHNICAL ANALYSIS / BOLLINGER BANDS
A cura di GIORGIO MARCHI (autore presso Jobtrading.it).
Le Bande di Bollinger, ideate dall’omonimo analista americano agli inizi degli anni 80, sono uno tra gli strumenti di analisi tecnica più diffusamente impiegati.
Graficamente sono composte da 3 linee che formano un canale. Quella principale è la centrale: una media mobile relativa a 20 prezzi di chiusura che si consiglia di lasciare invariata. Le restanti due sono rispettivamente il valore della media aggiungendo o sottraendo 2 deviazioni standard che andranno a definire il tetto e il pavimento del canale.
La deviazione standard, che può essere modificata dall’operatore in base alla propria operatività, è calcolata usando una formula statistica che misura la volatilità di un titolo.
Principali caratteristiche
Quando le bande si restringono generalmente si riscontra una maggiore volatilità
Se il prezzo disegna un massimo fuori dalla banda e successivamente vi rientra, significa che un’inversione del trend è possibile e vicina
Le oscillazioni da una banda all’altra sono utili per individuare il target di prezzo
Utilizzo
La lettura tipica dell’indicatore vuole l’apertura di posizioni long quando il prezzo esce e rientra o direttamente rimbalza sulla banda inferiore (e viceversa nel caso di posizioni short). Il tutto tenendo in considerazione la media a 20 periodi analizzabile singolarmente (seguendo l’utilizzo tipico delle medie mobili) oppure come livello mediano del canale con funzione di supporto/resistenza.
Si ricorda, inoltre, che la distanza tra le bande può essere usata come misura della volatilità.
Le Bande di Bollinger vengono spesso abbinate a un altro indicatore: il Bollinger Percentuale (o Bollinger%). Quest’ultimo presenta le caratteristiche tipiche degli oscillatori evidenziando principalmente livelli di ipercomprato/venduto. Per la descrizione di alcuni trai più comuni oscillatori ed anche per alcuni esempi pratici si veda qui. Ω

The World of ABC Economics – Monthly News Bulletin from abceconomics.com – No. 5 – April 2016
Pag
e17
ABC FOOD / GINGER AND LIME SALMON
CLAUDIA ARMANI reports.
An Asian inspired, easy and quick to make recipe, full of healthy properties. Ginger, lime and fennel will help the digestion, whilst the carrots and red cabbage will provide a good dose of anti-oxidants. Salmon has a good ratio of Omega 3 and Omega 6 fatty acids, and it is rich in good quality proteins, great to keep you fuller for longer.
If you have the time, you can swap the white basmati rice for the wholegrain one, although the fats of the salmon and the fibres of the vegetables with slow down the absorption of the carbohydrates.
Ingredients (serves 2)
2 salmon fillet half red cabbage 2 carrots 1 fennel 1 lime 2 garlic cloves extra virgin olive oil half a table spoon of honey some mustard seeds a bit of ginger 120 grams of basmati rice
Method
Cook the salmon fillets in a non-stick pan, with a bit of olive oil, 2 lime slices and the garlic. In the meantime wash the rice, rinse it and place it to cook in a saucepan. Clean and wash the vegetables and cut them in small strips use a grater for the carrots). Prepare the vinaigrette, mixing the olive oil, half o of a lime juice, some grated ginger and mustard seeds in a little bowl.
Presentation
Place the mixed vegetables, the salmon, on top of the rice, add the vinaigrette to taste and serve! Ω