the world bankdocuments.worldbank.org/curated/en/603251468191674194/pdf/39788.… · the world bank...
TRANSCRIPT

Document o f The World Bank
FOR OFFICIAL USE ONLY
Report No: 39788-AFR
PROJECT APPRAISAL DOCUMENT
ON A
PROPOSED CREDIT
IN THE AMOUNT OF SDR 3 1.5 MILLION (US$48 MILLION EQUIVALENT)
TO THE REPUBLIC OF MALAWI
AND A PROPOSED CREDIT
IN THE AMOUNT OF SDR 29.6 MILLION (US$45 MILLION EQUIVALENT)
TO THE REPUBLIC OF MOZAMBIQUE
FOR A
MOZAMBIQUE - MALAWI TRANSMISSION INTERCONNECTION PROJECT
IN SUPPORT OF THE SECOND PHASE OF THE
SOUTHERN AFRICAN POWER MARKET PROGRAM (APL2)
June 20,2007
Energy Team Infrastructure Group Africa Region
This document has a restricted distribution and may be used by recipients only in the performance o f their official duties. I t s contents may not otherwise be disclosed without World Bank authorization.
Pub
lic D
iscl
osur
e A
utho
rized
Pub
lic D
iscl
osur
e A
utho
rized
Pub
lic D
iscl
osur
e A
utho
rized
Pub
lic D
iscl
osur
e A
utho
rized
Pub
lic D
iscl
osur
e A
utho
rized
Pub
lic D
iscl
osur
e A
utho
rized
Pub
lic D
iscl
osur
e A
utho
rized
Pub
lic D
iscl
osur
e A
utho
rized
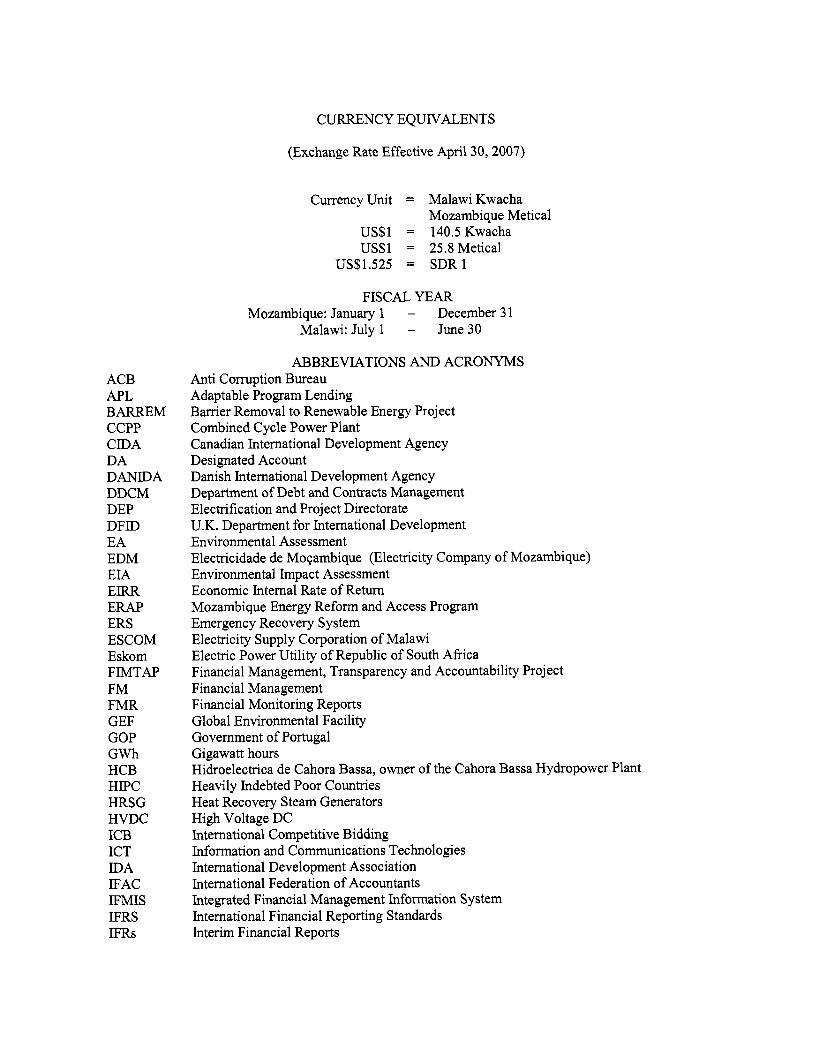
CURRENCY EQUIVALENTS
(Exchange Rate Effective April 30,2007)
ACB APL BARREM CCPP CIDA DA DANIDA DDCM DEP DFID EA EDM EIA ERR ERAP ERS ESCOM Eskom FIMTAP FM FMR GEF GOP GWh HCB HIPC HRSG HVDC ICB ICT IDA IFAC IFMIS IFRS IFRs
Currency Unit = Malawi Kwacha Mozambique Metical
US$1 = 140.5Kwacha US$1 = 25.8 Metical
US$1.525 = SDR 1
FISCAL YEAR Mozambique: January 1 - December 31
Malawi: July 1 - June 30
ABBREVIATIONS AND ACRONYMS Anti Corruption Bureau Adaptable Program Lending Barrier Removal to Renewable Energy Project Combined Cycle Power Plant Canadian International Development Agency Designated Account Danish International Development Agency Department of Debt and Contracts Management Electrification and Project Directorate U.K. Department for International Development Environmental Assessment Electricidade de Moqambique (Electricity Company o f Mozambique) Environmental Impact Assessment Economic Internal Rate o f Return Mozambique Energy Reform and Access Program Emergency Recovery System Electricity Supply Corporation o f Malawi Electric Power Utility o f Republic o f South Africa Financial Management, Transparency and Accountability Project Financial Management Financial Monitoring Reports Global Environmental Facility Government o f Portugal Gigawatt hours Hidroelectrica de Cahora Bassa, owner of the Cahora Bassa Hydropower Plant Heavily Indebted Poor Countries Heat Recovery Steam Generators High Voltage D C International Competitive Bidding Information and Communications Technologies International Development Association International Federation o f Accountants Integrated Financial Management Information System International Financial Reporting Standards Interim Financial Reports
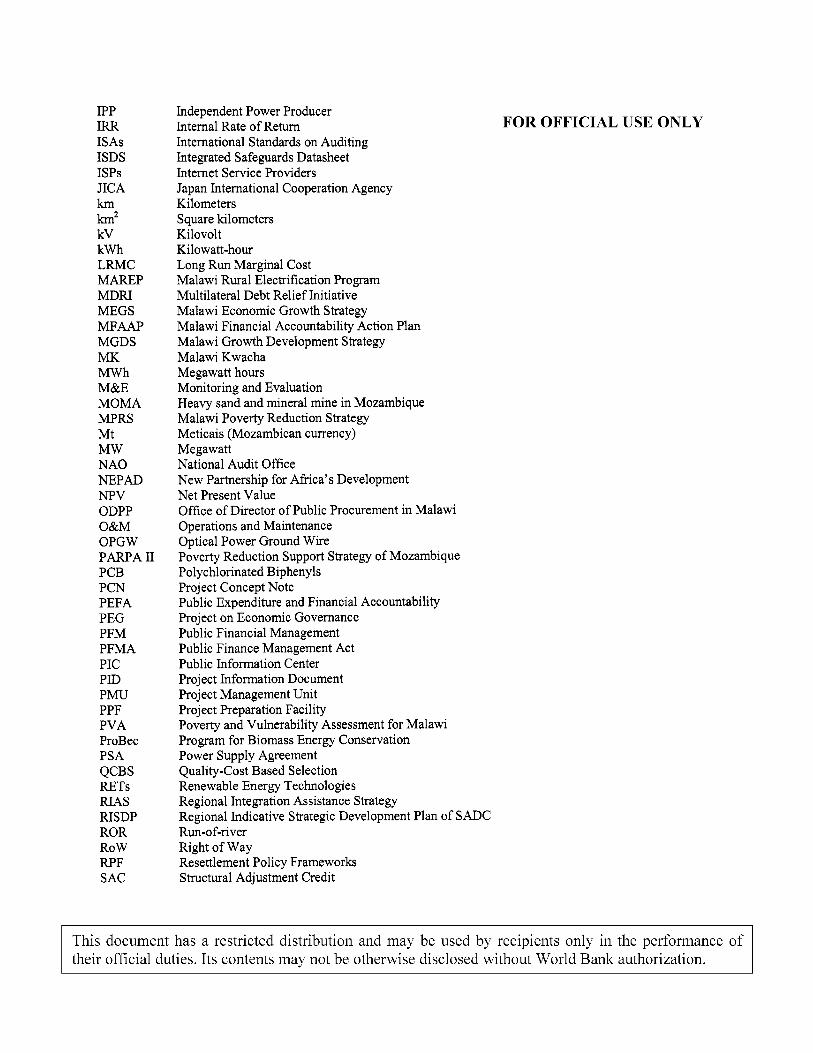
IPP IRR ISAs I S D S ISPS JICA km h2 kV kWh LRMC MAREP MDRI MEGS MFAAP MGDS MK MWh M&E M O M A MPRS Mt M W N A O NEPAD NPV ODPP O&M OPGW PARPA I1 PCB PCN PEFA PEG PFM PFMA PIC PID P M U PPF P V A ProBec PSA QCBS RETS R I A S RISDP ROR ROW RPF SAC
Independent Power Producer Internal Rate o f Return International Standards on Auditing Integrated Safeguards Datasheet Internet Service Providers Japan International Cooperation Agency Kilometers Square lulometers Kilovolt Kilowatt-hour Long Run Marginal Cost Malawi Rural Electrification Program Multilateral Debt Relief Initiative Malawi Economic Growth Strategy Malawi Financial Accountability Action Plan Malawi Growth Development Strategy Malawi Kwacha Megawatt hours Monitoring and Evaluation Heavy sand and mineral mine in Mozambique Malawi Poverty Reduction Strategy Meticais (Mozambican currency) Megawatt National Audit Office New Partnership for Africa’s Development Ne t Present Value Office o f Director o f Public Procurement in Malawi Operations and Maintenance Optical Power Ground Wire Poverty Reduction Support Strategy o f Mozambique Polychlorinated Biphenyls Project Concept Note Public Expenditure and Financial Accountability Project on Economic Governance Public Financial Management Public Finance Management Act Public Information Center Project Information Document Project Management Unit Project Preparation Facility Poverty and Vulnerability Assessment for Malawi Program for Biomass Energy Conservation Power Supply Agreement Quality-Cost Based Selection Renewable Energy Technologies Regional Integration Assistance Strategy Regional Indicative Strategic Development Plan o f SADC Run-of-river Right o f Way Resettlement Policy Frameworks Structural Adjustment Credit
FOR OFFICIAL USE ONLY
This document has a restricted distribution and may be used by recipients only in the performance o f their off icial duties. I t s contents may not be otherwise disclosed without Wor ld Bank authorization.

SADC SAPM S A P M P SAPP
SBD SCADA SIDA SFIA SMP SNAO SOE STEM T&D TOR UNDP WACC
Southern African Development Community Southern African Power Market Southern African Power Market Program Southern African Power Pool, comprised of the following Operating and Non-Operating members: Democratic Republic o f Congo (DRC), Botswana, South Africa, Namibia, Mozambique, Malawi, Lesotho, Swaziland, Angola, Zambia, Zimbabwe and Tanzania Standard Bidding Documents Supervisory Control and Data Acquisition Swedish International Development Cooperation Agency Strategic Framework for IDA'S Assistance to Africa Staff Monitored Program Swedish National Audit Office Statement of Expenses Short-Term Energy Market in SAPP Transmission and Distribution Terms o f Reference United Nations Development Programme Weighted Average Cost o f Capital
Vice President: Obiageli K. Ezekwesili Director o f Regional Integration: Mark D. Tomlinson
Country Director: Micheal Baxter Sector Manager: Subramaniam V. Iyer
Task Team Leader: Wendy E. Hughes
This document has a restricted distribution and may be used by recipients only in the performance o f their official duties, I t s contents may not otherwise be disclosed without World Bank authorization.

MOZAMBIQUE - MALAWI TRANSMISSION INTERCONNECTION PROJECT (SOUTHERN AFRICAN POWER MARKET PROGRAM, APL-2)
BORROWEWRECIPIENT Electricity Supply Corporation of Malawi (ESCOM) Electricidade de Moqambique (EDM)
International Development Association Credit to Republic o f Malawi International Development Association Credit to
PROJECT APPRAISAL DOCUMENT
11.9 0.0 11.9 4.8 0.0 4.8 4.3 43.7 48.0
7.6 37.4 45.0
AFRICA
Republic of Mozambique Total:
AFTEG
28.6 81.1 109.7
Date: June 20, 2007 Director o f Regional Integration: Mark D. Tomlinson Country Director: Michael Baxter Sector Manager: Subramaniam V. Iyer Project ID: PO84404 Lending Instrument: Adaptable Program Lending (Credits)
Team Leader: Wendy E. Hughes Sectors: Power (100%) Themes: Regional integration (P); Export development and competitiveness (S) Environmental screening category: B
Project Financing Data [ 3 Loan [XI Credit [ 3 Grant [ 3 Guarantee [ 3 Other:
For Loans/Credits/Others: Total Bank financing (US$m): US$93 million Republic of Malawi: US$48 million; Republic of Mozambique: US$45 million
Financing Plan (US$m) Source 1 Local I Foreign I Total
Retroactive Financing: In accordance with OP 6.00, ESCOM wi l l be able to charge up to $500,000 for consultant services and training for eligible expenditures occurring on or after May 1,2007, and up to the credit signing date; and EDM wil l be able to charge up to $500,000 for consultant services and training for eligible expenditures occurring on or after May 1, 2007, and up to the credit signing date. Borrowers: REPUBLIC OF MALAWI, REPUBLIC OF MOZAMBIQUE

Responsible Agencies: Electricity Supply Corporation Malawi Limited (ESCOM) 9 Haile Selassie Road, P.O.Box 2047, Blantyre, Malawi Tel: 265 01 822 000; Fax: 265 01 822 008.
Electricidade de Moqambique , EP (EDM) Av. Agostinho Net0 70, 8* Floor; Maputo, Mozambique Tel: 258 21 491 048; Fax: 258 21 490 636.
Does the project depart from the CAS in content or other significant respects? Ref: PADLC [ ]Yes [XINO
Does the project require any exceptions from Bank policies? Re$ PAD I K G [ ]Yes [XINO Have these been approved by Bank management? [ ]Yes [ IN0 I s approval for any policy exception sought from the Board? Does the project include any critical r isks rated “substantial” or “high”? Re$ PAD III.E Does the project meet the Regional criteria for readiness for implementation? Ref: PAD I K G
[ ]Yes [XINO
[XIYes [ ] N o
[XIYes [ ] N o
Project development objective Ref: PAD ILB, Technical Annex 3
The APL 2 development objective i s to implement the Mozambique-Malawi transmission interconnection (i) to increase access to diversified, reliable, and affordable supplies o f energy; and (ii) to expand Malawi and Mozambique’s opportunities to benefit from bilateral and regional power trading on the Southern African Power Pool. Project description Ref: PAD ILD, Technical Annex 4
Component A: Construction o f the transmission interconnection from the Malawi electricity grid to the Mozambique electricity grid, thereby interconnecting Malawi with the Southern Africa Power Pool network. On the Malawi side this would include construction o f approximately 75 km o f 220 kV transmission line, installation o f a new 220 kV substation, development and implementation o f a Resettlement Action Plan, as per the Resettlement Policy Framework, once the exact route i s determined, and the studies, works, engineering and project management support required to complete the interconnection. On the Mozambique side this would include construction o f approximately 135 km o f
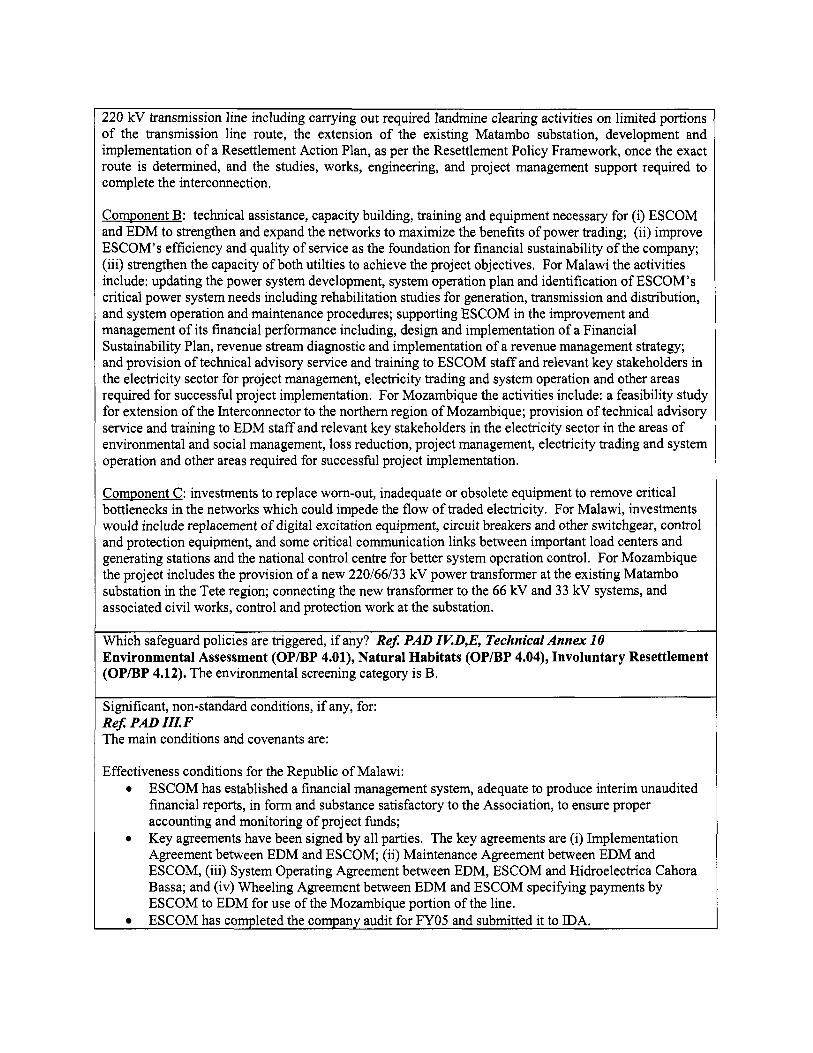
220 kV transmission line including carrying out required landmine clearing activities on limited portions o f the transmission l ine route, the extension o f the existing Matambo substation, development and implementation o f a Resettlement Action Plan, as per the Resettlement Policy Framework, once the exact route i s determined, and the studies, works, engineering, and project management support required to complete the interconnection.
Component B: technical assistance, capacity building, training and equipment necessary for (i) ESCOM and EDM to strengthen and expand the networks to maximize the benefits o f power trading; (ii) improve ESCOM’s efficiency and quality o f service as the foundation for financial sustainability o f the company; (iii) strengthen the capacity o f both utilties to achieve the project objectives. For Malawi the activities include: updating the power system development, system operation plan and identification o f ESCOM’s critical power system needs including rehabilitation studies for generation, transmission and distribution, and system operation and maintenance procedures; supporting ESCOM in the improvement and management o f i t s financial performance including, design and implementation o f a Financial Sustainability Plan, revenue stream diagnostic and implementation o f a revenue management strategy; and provision o f technical advisory service and training to ESCOM staff and relevant key stakeholders in the electricity sector for project management, electricity trading and system operation and other areas required for successful project implementation. For Mozambique the activities include: a feasibility study for extension o f the Interconnector to the northern region o f Mozambique; provision o f technical advisory service and training to EDM staff and relevant key stakeholders in the electricity sector in the areas of environmental and social management, loss reduction, project management, electricity trading and system operation and other areas required for successful project implementation.
Component C: investments to replace worn-out, inadequate or obsolete equipment to remove critical bottlenecks in the networks which could impede the flow o f traded electricity. For Malawi, investments would include replacement o f digital excitation equipment, circuit breakers and other switchgear, control and protection equipment, and some critical communication links between important load centers and generating stations and the national control centre for better system operation control. For Mozambique the project includes the provision o f a new 220/66/33 kV power transformer at the existing Matambo substation in the Tete region; connecting the new transformer to the 66 kV and 33 kV systems, and associated c iv i l works, control and protection work at the substation.
Which safeguard policies are triggered, if any? Re$ PAD IV.D,E, Technical Annex 10 Environmental Assessment (OP/BP 4.01), Natural Habitats (OP/BP 4.04), Involuntary Resettlement (OP/BP 4.12). The environmental screening category i s B.
Significant, non-standard conditions, if any, for: Re$ PAD III. F The main conditions and covenants are:
Effectiveness conditions for the Republic o f Malawi: 0 ESCOM has established a financial management system, adequate to produce interim unaudited
financial reports, in form and substance satisfactory to the Association, to ensure proper accounting and monitoring o f project funds; Key agreements have been signed by all parties. The key agreements are (i) Implementation Agreement between EDM and ESCOM; (ii) Maintenance Agreement between EDM and ESCOM, (iii) System Operating Agreement between EDM, ESCOM and Hidroelectrica Cahora Bassa; and (iv) Wheeling Agreement between EDM and ESCOM specifying payments by ESCOM to EDM for use o f the Mozambique portion o f the line. ESCOM has completed the company audit for FY05 and submitted it to IDA.
0
-_
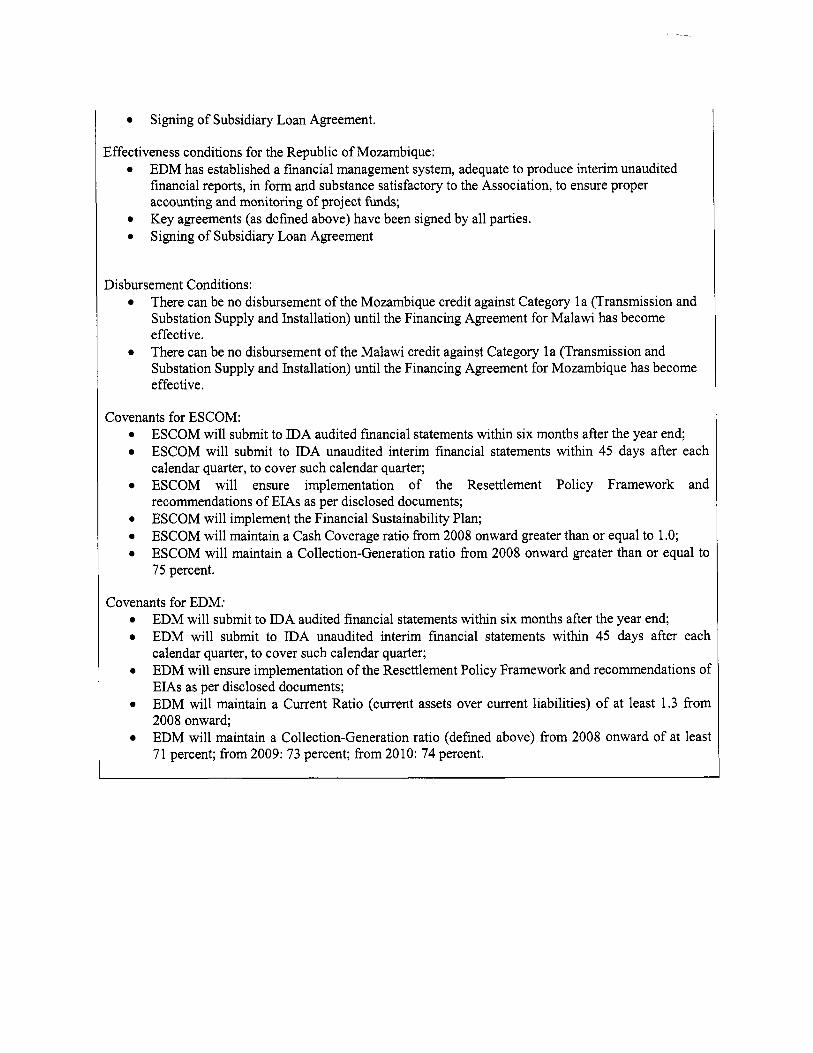
Signing o f Subsidiary Loan Agreement.
Effectiveness conditions for the Republic o f Mozambique: 0 EDM has established a financial management system, adequate to produce interim unaudited
financial reports, in form and substance satisfactory to the Association, to ensure proper accounting and monitoring of project funds; K e y agreements (as defined above) have been signed by a l l parties. Signing o f Subsidiary Loan Agreement
0
0
Disbursement Conditions: 0 There can be n o disbursement o f the Mozambique credit against Category l a (Transmission and
Substation Supply and Installation) until the Financing Agreement for Ma law i has become effective. There can be n o disbursement o f the Malawi credit against Category l a (Transmission and Substation Supply and Installation) until the Financing Agreement for Mozambique has become effective.
Covenants for ESCOM:
0
0 ESCOM will submit to IDA audited financial statements within six months after the year end; 0 ESCOM will submit to IDA unaudited interim financial statements within 45 days after each
calendar quarter, to cover such calendar quarter; 0 E S C O M will ensure implementation o f the Resettlement Policy Framework and
recommendations o f EIAs as per disclosed documents; 0 ESCOM will implement the Financial Sustainability Plan; 0 ESCOM will maintain a Cash Coverage ratio f rom 2008 onward greater than or equal to 1 .O; 0 ESCOM will maintain a Collection-Generation ratio f rom 2008 onward greater than or equal to
75 percent.
Covenants for EDM: 0
0
0
0
EDM will submit to IDA audited financial statements within six months after the year end; EDM will submit to IDA unaudited interim financial statements within 45 days after each calendar quarter, to cover such calendar quarter; EDM will ensure implementation o f the Resettlement Policy Framework and recommendations oj EIAs as per disclosed documents; EDM will maintain a Current Ratio (current assets over current liabilities) o f at least 1.3 f ro r 2008 onward; EDM will maintain a Collection-Generation ratio (defined above) f rom 2008 onward o f at leas1 7 1 percent; f rom 2009: 73 percent; f rom 20 10: 74 percent.

AFRICA MOZAMBIQUE . MALAWI TRANSMISSION INTERCONNECTION PROJECT
(SOUTHERN AFRICAN POWER MARKET PROGRAM. APL-2)
CONTENTS
Page STRATEGIC CONTEXT AND RATIONALE ................................................................................. 1 A . Regional. country and sector issues ................................................................................................. 1 B . Rationale for Bank involvement ....................................................................................................... 4 C . Higher-level objectives to which the project contributes ................................................................. 5
I1 . PROJECT DESCRIPTION ................................................................................................................. 5 A . Lending instrument .......................................................................................................................... 5 B . APL Program Overall Objective and Phases ................................................................................... 6
I .
C . Project development objective and key indicators ........................................................................... 7 D . Project components .......................................................................................................................... 8 E . Lessons learned and reflected in the project design ......................................................................... 9 F . Alternatives considered and reasons for rejection .......................................................................... 10
I11 . IMPLEMENTATION ........................................................................................................................ 11 A . Partnership arrangements ............................................................................................................... 11 B . Institutional and implementation arrangements ............................................................................. 11
............................................................................. C . Monitoring and evaluation o f outcomeshesults 12 D . Sustainability 13 E Critical r isks and possible controversial aspects 14 F Loadcredit conditions and covenants 15
.................................................................................................................................. . ............................................................................ . ............................................................................................
I V . APPRAISAL SUMMARY ................................................................................................................. 16 A . Economic and financial analyses ................................................................................................... 16 B . Technical ........................................................................................................................................ 23 C . Fiduciary ........................................................................................................................................ 23 D . Social .............................................................................................................................................. 24
. ...................................................................................................................................
. .......................................................................................................................... E Environment 24 F Safeguard policies 25 G . Policy Exceptions and Readiness 25 ...................................................................................................
Annex 1: Country And Sector Or Program Background ...................................................................... 26 Annex 2: Major Related Projects Financed By The Bank And/or Other Agencies ........................... 34 Annex 3: Results Framework And Monitoring ...................................................................................... 36 Annex 4: Detailed Project Description .................................................................................................... 41 Annex 5: Project Costs .............................................................................................................................. 46 Annex 6: Implementation Arrangements ................................................................................................ 48 Annex 7: Financial Management And Disbursement Arrangements .................................................. 52 Annex 8: Procurement Arrangements .................................................................................................... 64 Annex 9: Economic And Financial Analysis ........................................................................................... 71 Annex 10: Safeguard Policy Issues ........................................................................................................ 101 Annex 11: Project Preparation And Supervision ................................................................................. 104 Annex 12: Documents I n The Project Fi le ............................................................................................ 106 Annex 13: Statement Of Loans And Credits ........................................................................................ 107 Annex 14: Country At A Glance ............................................................................................................ 110 Annex 15: Maps (Ibrd 35355; Ibrd 35356) ........................................................................................... 115


I. STRATEGIC CONTEXT AND RATIONALE
A. Regional, country, and sector issues
Regional context
1. Southern Africa exhibits substantial variations in energy resource endowments, degrees o f industrial development, levels and patterns of power consumption, and power costs. These differences present opportunities for coordinated development o f the regional power sector to generate savings through aggregation o f loads with different load profiles; efficient use o f energy resources by exploiting large- scale power generation schemes that are viable on the basis o f large, multi-country markets; and managing the risks o f climate-related power shortages in hydro-dependent countries.
2. The Southern Africa Region as a whole i s entering a period o f generation capacity shortage. At least 1,000 MW o f additional capacity wil l be required each year to meet demand growth. Much of the new demand could be met through large, regional generation projects (see Annex 1). Regional trade in electricity i s expected to increase, highlighting the need to address transmission-related constraints.
3. In August 1995, Southern African Development Community (SADC) member countries created the Southern Africa Power Pool (SAPP) by concluding an Intergovernmental Memorandum o f Understanding (MOU) and related agreements. The utilities o f 12 Southern African countries were the original members o f the SAPP. The main grid systems o f Botswana, the Democratic Republic o f the Congo, Lesotho, Mozambique, Namibia, South Africa, Swaziland, Zambia, and Zimbabwe form the existing regional network (see Annex 15, Map No. 35356). Angola, Malawi, and Tanzania are not yet connected. In February 2006, membership in the SAPP was expanded to include private generation and transmission companies.
4. SAPP started as a cooperative pool in which members seek to maximize economic and system reliability benefits through trade, while retaining maximum autonomy for individual members. In the longer term SAPP aims to facilitate the development o f a competitive electricity market in the SADC region. Currently there are two market mechanisms used in SAPP energy exchanges: medium- to-long term, bilateral power purchase agreements; and the Short-Term Energy Market (STEM) where daily, weekly, and monthly contracts are actively traded. (See Annex 1 for further details on SAPP).
5. One o f the immediate challenges i s the need to strengthen and expand the network o f regional transmission infrastructure as demand in the region grows. Three member countries are not yet connected to the regional power grid and several existing interconnections are overloaded or in need o f rehabilitation. Connection to the regional grid o f non-connected SAPP member power systems i s a priority in terms o f SAPP planning. In the 2006 SAPP Annual Report, the Mozambique-Malawi Transmission Interconnection i s explicitly noted as a top priority for the regional pool.
Malawi context
6. Malawi i s one of sub-Saharan Africa’s most densely populated countries with about 109 persons/km2 (total population about 12.9 million). The recent Malawi Poverty and Vulnerability Assessment (PVA) shows that the percentage of the population living below the poverty line was around 52% in 2004/05. The per capita Gross National Income (GNI) was estimated at US$170 in 2006. Although the performance o f the economy was unsatisfactory between 2001 and 2004, recent efforts by the Government have led to improved macroeconomic management and placed Malawi on a path for faster economic growth. The growth in real Gross Domestic Product (GDP) which averaged 1.5% between 2001 and 2004, increased to an average o f around 5% between 2005 and 2006. As a result o f the good
macroeconomic management and improved fiscal discipline, the country reached the H P C completion point and benefited from cancellation o f most external debt, thereby releasing resources for pro-poor activities.
7. Malawi Electricitv Subsector. The Electricity Supply Corporation o f Malawi (ESCOM) i s a vertically integrated, government-owned electric utility with about 175,000 customers and an installed hydropower capacity o f 284 MW.’ About 6 percent o f the population has access to electricity. Peak demand in Malawi was about 250 MW in 2006 and demand i s expected to grow at about 5 percent annually over the next decade.
8. Currently ESCOM electricity supply cannot meet demand. Plant availability and auxiliary consumption factors mean that, o f the 284 MW installed, less than 260 MW o f capacity i s reliably available at peak times. Furthermore, ESCOM’s Tedzani I & I1 hydropower plants, with combined installed capacity o f 40MW, had to be taken out o f service in December 2001 due to damage resulting from the flooding o f the Shire River. As a result, depending on the season and plant availability, peak load-shedding o f 30 or more MW i s occurring. The situation will improve when the rehabilitation o f Tedzani I and I1 hydropower plant i s completed toward the end o f 2007, but with peak demand forecast to reach approximately 275 MW in 2008, available hydropower capacity will remain below peak demand, with no reserve margin. Some peak load-shedding i s l ikely to continue and any reduction in power output, for example due to routine maintenance, unplanned outages, or low f low rate on the Shire River, would result in an increased deficit. By 2010 new capacity wil l be needed to avoid off-peak shortages. By 2015 Malawi will need to have in place an estimated additional 140 MW o f available capacity compared to current capacity to meet demand.
9. Malawi i s vulnerable to drought-induced power crisis. O f the existing hydropower generation capacity in Malawi, 98 percent i s from run-of-river (ROR) plant on the Shire River.’ The planned expansion o f domestic generation capacity would further increase dependence on the Shire River. Of great concern for Malawi i s a situation o f below-average hydrology, since low flow on the Shire River translates directly into reduced power output. The average flow between 1994 and 2002 was less than half o f the long-run average over the last 58 years for which data are available. Seven o f the ten lowest f low years since detailed records began in 1948 have occurred in the past fifteen years. Futhermore, between 1917 and the mid-l93Os, the Shire River actually stopped flowing altogether. The implications o f this happening today are hard to overstate: Malawi would have a total operational hydropower output o f 4 M W against a demand o f 250 MW. The only immediate solution would be emergency thermal generation, which would cost over 20 times ESCOM’s current cost o f generation. Low flows are currently being experienced in other parts o f Africa such as the Ni le Basin, with severe consequences on power supply and the economy due to the high unit cost o f running emergency thermal power plants.
10. Also, there i s growing scientific consensus that climate change will lead to increased drought stress in sub-Saharan A f k i ~ a . ~ The transmission interconnector would contribute to reducing the potential r isks associated with climate change, as set out in the World Bank Group’s Clean Energy for Development Investment Framework, by providing an alternative power supply option, should climate change lead to a more volatile or reduced flow on the Shire River.
’ In addition to the hydropower stations, ESCOM owns 20 MW o f thermal generation. Due to the high cost o f operation the thermal units are primarily used for emergency situations.
“Run-of-river” means that there is l i tt le or no capacity to store and control the flow o f water upstream o f the power generation stations, so the amount o f electricity that can be produced is dependent on the daily f low o f the Shire River. Heavy siltation has reduced the already small capacity o f the reservoirs intended for daily storage (see Annex 1).
United Nations’ Intergovernmental Panel on Climate Change, April 2007.
2

11. Malawi has developed a power sector strategy that i s designed to put in place measures to mitigate the consequences of a severe drought, while at the same time ensuring that the cost o f power supply remains affordable, thereby supporting a focused effort to increase access to, reliability of, and quality o f electricity supply. Key elements of Malawi’s strategy include: (i) implementation o f the interconnector with the SAPP network by 2010 as the least-cost option for mitigating the risk o f drought-related power crisis, and to allow the option to import as needed and export any surplus electricity when available e.g. in off-peak periods; (ii) expansion o f low cost domestic generation capacity by 20 1 1 ; (iii) further addition to available capacity o f 30 to 50 MW by 2015. The least-cost option for meeting this additional capacity i s expected to be further imports via the transmission interconnection4
12. Malawi plans to increase domestic power generation capacity through expansion o f the Kapichira Hydropower Station (“Kapichira II”) on the Shire River, which would add 64MW and i s planned to be on l ine in 2011 (see Annex 1). However financing for Kapichira I1 i s not yet in place so there i s some uncertainty regarding the timing o f commissioning. If Kapichira I1 i s commissioned as planned, for a few years ESCOM would have excess, off-peak electricity to sel l to Mozambique or other SAPP members via the interconnection. However, even with Kapichira 11 in operation, peak deficits in Malawi will continue and would be met through imports via the interconnection. Having the interconnector operational as early as possible will help mitigate the risk o f further power shortages associated with any delay in the Kapichira I1 project, as well as the risk o f power shortages associated with drought.
13. The key challenge faced by Malawi’s power utility i s the current relatively weak financial situation and commercial performance in the power sector. The Government together with ESCOM i s developing a Financial Sustainability Plan that will include elements o f improved efficiency and tariff adjustments as needed. The objective o f this plan i s to ensure that ESCOM i s in a position to implement the above strategy and meet i t s resulting financial commitments. Implementation o f the ESCOM Financial Sustainability Plan wil l be a key factor in ESCOM’s ability to raise financing for the planned investments and to meet Malawi’s electric power requirements.
Mozambique context
14. Between 1996 and 2005, following the end o f the war in 1992, the Mozambique’s economy grew at an average o f 8 percent per year. The poverty headcount index fell from 69 percent in 1996/97 to 54 percent in 2002/03. GWcapita i s US$389/cap. Economic expansion has been made possible by overall macroeconomic stability, sound policy reforms, and continuing strong support from development partners.
15. Mozambique Elech-icitv Subsector. Electricidade de Moqambique (EDM) i s a vertically integrated, government-owned electric utility with an installed capacity o f 140 MW hydropower (of which 86 MW i s available) and 109 MW in thermal power stations (of which 82 MW i s available). Peak demand in Mozambique’ i s 350 MW. EDM buys most o f i t s power supply (300 MW) from Hidroelectrica Cahora Bassa (HCB), owner and operator o f the Cahora Bassa hydropower plant in Tete provincea6 Based on recent performance, Mozambique load growth i s projected at 8 percent in 2007, 7 percent annually from 2008 to 2010, and 5 percent thereafter. The Mozambique transmission grid i s currently interconnected with Zimbabwe, South Africa, and Swaziland. About 8 percent o f the population has access to electricity.
Based on the Integrated Resource Plan for the Malawi Power sector completed in 2005.
’ Excluding Mozal Aluminum Smelter, which imports power from South Africa.
MW. The bulk o f the generated electricity i s exported to South Africa with a small amount to Zimbabwe. The Governments o f Cahora Bassa on the Zambezi River, Tete Province, operates as an independent power producer. The installed capacity i s 2,075
3

16. Mozambique has adopted a power sector’s strategy that focuses on (i) rapid expansion o f access to electricity though grid intensification, grid extension, and off-grid approaches; (ii) rehabilitation o f existing hydropower plants; and (iii) development o f new power generation through private sector and public-private partnerships. Mozambique i s actively pursuing development o f three large power generation projects for export to the SAPP (see Annex 1 for details o f planned generation projects).
17. Because o f the significant potential for developing competitive generation for export, Mozambique’s strategy includes a focus on expanding opportunities for power trade. Key routes include the Mozambique-Malawi transmission interconnector, and a high-voltage, high-capacity transmission line from the Tete area to Beira and Maputo, and continuing to South Africa. In the future, the Mozambique- Malawi interconnector could be extended east across Southern Malawi into Northern Mozambique. This extension o f the interconnection would significantly improve the quality, quantity, and reliability o f supply to the North o f Mozambique, where demand for power i s growing rapidly (see Annex 1 for details). In 2004, the Governments o f Mozambique, Tanzania, Malawi, and Zambia signed a MOU on the development o f the Mtwara Corridor along Mozambique’s northern border with Tanzania. One area intended to be facilitated by this cooperation i s the trading o f electricity between Mozambique and Tanzania. Extension o f the interconnector back into Northern Mozambique i s a high priority for Mozambique from a domestic supply perspective as well as further enhancing the prospects for regional electricity trade.
18. With projections for continued robust economic growth in Mozambique, a key challenge for Mozambique i s to ensure that affordable electricity supply i s available to meet the growing demand. In the near term this could involve EDM entering into expanded or new power purchase agreements, for example with HCB in Mozambique, Eskom South Africa andor ESCOM Malawi (for off-peak). In the medium and long term, a key challenge in Mozambique’s energy sector will be realizing the potential for new power generation projects (described in Annex 1) to meet domestic demand and for export to SAPP.
B. Rationale for Bank involvement
19. The Bank has committed to lend long-term support to both SADC and the New Partnership for Africa’s Development (NEPAD) initiatives to promote electricity trade in the region, through the approval o f the Southern African Power Market Program (SAPMP) Adaptable Program Lending (APL) in November 2003. In this context the Bank has been requested by the Governments o f Malawi and Mozambique to finance the Mozambique - Malawi Transmission Interconnection through two credits to be on-lent to their respective national electric power utilities. The World Bank i s in a position to take the lead on supporting the proposed project, due to i t s strategic position with respect to country and sector engagements with both Mozambique and Malawi and a history o f support for the SAPP, together with the availability of regional IDA resources.
20. This project i s a key element in Malawi’s strategy for ensuring adequate, affordable electricity to support expanded access and economic growth. The project benefits Mozambique by providing a source o f new revenues to Mozambique’s power sector. I t i s also a key step in EDM’s medium-term plans to improve the reliability o f supply to Northern Mozambique. An additional benefit o f the interconnector i s that Malawi will be able to se l l energy that would otherwise be spilled, either into the SAPP STEM or under short-term bilateral contracts with Mozambique or other SAPP members. Malawi would generate
Mozambique and Portugal reached agreement in 2006 for transfer of the majority of the ownership of the company from Portugal to Mozambique. The Government of Mozambique has made the initial payment and will complete the payments by December 2007.
4
new revenues from such power export, and nearby countries in the SAPP would benefit from importing low-cost electricity from Malawi.
C. Higher-level objectives to which the project contributes
21. The Regional Indicative Strategic Development Plan (RISDP), approved by SADC heads o f state and government in 200 1, reaffirms the policy goal established by the SADC Protocol on Energy and identifies the following specific objectives in the electricity sector: (i) promote power pooling through the extension o f grid interconnections to cover all member states and upgradinghtrengthening existing grids; and (ii) consolidate the transformation o f SAPP from a co-operative to a competitive pool and create a regional electricity market.
22. The proposed project i s also in line with relevant broad-based regional strategies, including the revised Africa Action Plan (specifically, in relation to one o f the 8 focus areas - improving access to and reliability o f clean energy)’: Regional Integration Assistance Strategy ( U S ) for Southern Africa (2003 and 2006), the Strategic Framework for IDA’S Assistance to Africa (SFIA) (IDNSecM2003-0406) o f 2003, and the Southern Africa Sub-Regional Strategy Paper (SecM98-272), which placed regional cooperation high on the policy agenda o f the countries in Southern Africa.
23. The project complements ongoing and planned national-level support to the power sectors in Mozambique and Malawi (respectively). In Malawi, the proposed project i s anchored in the 2006-11 Malawi Growth Development Strategy (MGDS). The MGDS identifies energy generation and supply as one o f the six national priority areas to enable the country to meet the economic and social demand. In particular, the project addresses the MGDS objective o f reducing the number and duration o f blackouts in Malawi. In Mozambique, the project meets a key objective o f Pillar 3 o f the 2006-09 Poverty Reduction Support Strategy (PARPA 19, aiming to improve the integration o f Mozambique into the regional and international economy by strengthening power trading in the SAPP. In particular this project makes possible further opportunities for electricity export from Mozambique which in turn will facilitate the development o f new generation projects in Mozambique which could supply power to the SAPP.
11. PROJECT DESCRIPTION
A. Lending instrument
24. The proposed Mozambique-Malawi Transmission Interconnection (SAPMP APL-2) project i s the second phase o f the Southern African Power Market Program (SAPMP) Adaptable Program Lending (APL) series. The program consists o f a set o f inter-linked interventions that would promote and manage electricity trade in the Southern Africa region. The SAPMP subset o f interventions was adopted by NEPAD and SADC as priority areas in the energy sector. This horizontal APL instrument was selected to demonstrate long-term commitment to support this important and evolving regional initiative and because the set o f interventions to be supported under the project, taken together, will yield regional benefits of reduced costs and improved energy security for the interconnected members.
See “Accelerating development outcomes in Africa. Progress and Change in the Afr ica Action Plan” M a r c h 29, 2007.
5
25. The three-phase APL program including i t s f i rst phase covering the Power Market Project in Zambia (Cr. 3832-ZA) and the Democratic Republic o f Congo (Cr. 3831-DRC) was approved by the Board on November 11,2003, and the project became effective on May 17,2004. A new phase o f the APL, labeled Regional and Domestic Power Markets Development in Support o f the Southern African Power Market Program (Phase APL-Ib), was recently added to the SAPMP APL series because it provides important support to the success o f the APL-1 and, prospectively, the APL-3. APL-lb was approved by the Board on May 29,2007. Since the project has a regional scope, regional IDA funding has been mobilized, with the country allocation covering one third o f the project cost attributable.
B. Overall APL program objective and phases
26. The overall program objective (set out in the APLl PAD8) i s to increase the availability and reliability o f low cost, environmentally friendly electric energy in the Southern Africa region, thereby increasing competitiveness o f industry and fostering economic growth. I t will help foster conditions that would be attractive to private developers seeking to invest in generation. The Program comprises the highest priority projects identified in the Southern African Power Pool Investment Plan prepared by the SAPP.
27. APL-1 (P069258): The first phase finances investments to strengthen and increase the capacity o f DRC to export power to the SAPP countries, notably from the hydroelectric plants at the Inga site, primarily by rehabilitating and upgrading the high voltage direct current (HVDC) transmission l ine from Inga to Kolwezi in the Katanga region and the rehabilitation and upgrading o f the network that extends from there to Zambia. The f i rst phase i s currently under implementation, but has faced significant delays. These were due in part to initial delays in finalizing the technical designs and in establishing familiarity with Bank processes; as a result o f these delays, APL-1 i s well behind schedule, resulting in a current overall Implementation Status rating o f ‘Moderately Unsatisfactory’. In addition, there have been significant cost overruns as a result o f various factors, such as the increase in the price o f metals and other electrical materials, depreciation o f the U S dollar relative to the currencies in which the major contracts are expected to be denominated, and further deterioration o f the assets. The design issues have recently been resolved and the procurement for major contractors i s now well underway.
28. APL-lb (PO9720 1): SAPM APLl -b will, through rehabilitation activities, generate incremental power at the Inga hydroelectric site in DRC, a portion o f which will be exported via the H V D C line being rehabilitated under SAPM APL-1. In addition to the regionally-oriented components, domestically- oriented components are also being financed, including the rehabilitation and expansion o f the distribution network in Kinshasa, a second transmission line from Inga to Kinshasa and significant capacity building activities.
29. The proposed project: SAPM APL-2 (P084404): Mozambiaue-Malawi Transmission Interconnection would finance the transmission interconnector between Malawi and Mozambique, as well as strengthen key elements o f ESCOM and EDM systems to ensure that the power flows to, and from, Malawi via the interconnector are not interrupted due to weaknesses on the domestic grids.
30. Four triggers, listed below, for APL-2 were identified in the Project Appraisal Document (PAD) o f APL-1. Trigger (iii) will not be met:
Southem Afiica Power Market Project (Democratic Republic o f Congo and Republic o f Zambia) APL (Credits), Project Appraisal Document, IDAIR2003-0183/1, dated October 1,2003.
6
(i) “Completion and disclosure to the public o f an Environmental Assessment, resettlement action plan and any required mitigation plans, acceptable to the Bank, for both the facilities in Mozambique and those in Malawi.” T h i s trigger has been met. “Completion o f an implementation agreement between Electricidade de Moqambique (EDM) o f Mozambique and Electricity Supply Corporation o f Malawi Limited (ESCOM).” The agreement has been substantially negotiated and signing o f the agreement will be a condition o f effectiveness. “Completion o f a Power Purchase Agreement between ESCOM and the supplier o f power”. This trigger will not be met. Negotiations between ESCOM and HCB regarding an agreement for HCB to supply power to ESCOM are on-going. The justification for proceeding with the interconnection project before finalizing an agreement i s based on the recognition that even without an import agreement in place, the interconnector i s Malawi’s least cost strategy to reduce the risk o f a drought-induced power crisis. Further, in the near-term Malawi has excess energy at off-peak times which could be sold on the SAPP Short-Term Energy Market (STEM). During peak imports will be the least cost option to meet demand. Studies indicate that the least-cost option for Malawi to meet medium-term power demand will also be through imports. Thus there exists a clear economic incentive for electricity trade, which i s projected to continue in the medium term. Further discussion i s presented in Section 2.F. “Completion o f bidding documents o f major contracts.” The prequalification process has been launched and preparation o f tender documents i s underway.
(ii)
(iii)
(iv)
31. The proposed APL-2 will be financed by two IDA Credits, one to Malawi and one to Mozambique. These credits will be on-lent to the respective electric power utilities, ESCOM and EDM, which would be the implementing agencies.
32. APL-3 i s planned to fund an interconnection between Zambia and Tanzania, which will facilitate the connection o f Uganda and Kenya to the SAPP in the future, significantly expanding the breadth o f potential trading partners and bringing new trading opportunities to members.
C. Project development objective and key indicators
33. Proiect development obiective. The Mozambique-Malawi Transmission Interconnection Project (APL-2) development objective i s to implement the Mozambique -Malawi Interconnection (i) to increase access to diversified, reliable, and affordable supplies o f energy; and (ii) expand Malawi and Mozambique’s opportunities to benefit from bilateral and regional power trading on SAPP. The primary beneficiaries o f the proposed project would include businesses and citizens, who will have increased and more reliable access to electricity as a result o f electricity trade between Mozambique and Malawi and the SAPP.
34. Key outcomes and indicators. The Final Outcome Indicators would be (i) the volume o f trading via interconnector between Malawi, Mozambique and other SAPP members, (ii) for Malawi, decreased electricity deficit in case o f drought, and (iii) incremental earnings for Mozambique from power trading with Malawi, and savings through importing electricity from Malawi at a lower cost than alternative sources o f supply. The key intermediate outcome indicators are (i) Key trading agreements are signed and operational, (ii) the ESCOM Financial Sustainability plan i s adopted and implemented, (iii) the increase in number o f customers served out o f Matambo substation and (iv) reduction in number o f faults due to failure o f obsolete network equipment. Further details on project outcomes by component as well as output indicators are presented in Annex 3.
7
D. Project components
35. The project will consist o f three components: (A) Mozambique - Malawi Interconnection; (B) Capacity Building and Technical Support for Upgrade and Expansion to Support Power Trading; and (C) Improved Infrastructure to Support Power Trading.
36. Component A: (estimated total cost: US$47.1 mill ion for Malawi, US$43.5 mil l ion for Mozambique) Construction o f the transmission interconnection from the Malawi electricity grid to the Mozambique electricity grid, thereby interconnecting Malawi with the Southern Africa Power Pool network. On the Malawi side this would include construction o f approximately 75 km o f 220 kV transmission line, installation o f a new 220 kV substation, development and implementation o f a Resettlement Action Plan, as per the Resettlement Policy Framework, once the exact route i s determined, and the studies, works, engineering and project management support required to complete the interconnection. On the Mozambique side this would include construction o f approximately 135 km o f 220 kV transmission l ine including carrying out required landmine clearing activities on limited portions o f the transmission l ine route, the extension o f the existing Matambo substation, development and implementation o f a Resettlement Action Plan, as per the Resettlement Policy Framework, once the exact route i s determined, and the studies, works, engineering, and project management support required to complete the interconnection.
37. Component B: (estimated total cost: US$2.9 mill ion for Malawi, US$1.7 mil l ion for Mozambique) technical assistance, capacity building, training and equipment necessary for ESCOM and EDM to (i) to strengthen and expand the networks to maximize the benefits o f power trading; (ii) to improve ESCOM’s efficiency and quality o f service as the foundation for financial sustainability o f the company; (iii) strengthen capacity to achieve the project objectives. For Malawi the activities include: Updating the power system development, system operation plan and identification o f ESCOM’s critical power system needs including, inter alia, rehabilitation studies for generation, transmission and distribution, and system operation and maintenance procedures; supporting ESCOM in the improvement and management o f i t s financial performance including, design and implementation o f a Financial Sustainability Plan, revenue stream diagnostic and implementation o f a revenue management strategy; and provision o f technical advisory service and training to ESCOM staff and relevant key stakeholders in the electricity sector for project management, electricity trading and system operation and other areas required for successful project implementation. For Mozambique the activities include: a feasibility study for extension o f the Interconnector to the northern region o f Mozambique; provision o f technical advisory service and training to EDM staff and relevant key stakeholders in the electricity sector in the areas o f environmental and social management, loss reduction, project management, electricity trading and system operation and other areas required for successful project implementation.
38. Component C: (estimated total cost: US$9.9 mil l ion for Malawi, US$4.6 mil l ion for Mozambique) investments to replace worn-out, inadequate or obsolete equipment to remove critical bottlenecks in the networks which could impede the flow o f traded electricity. For Malawi, investments include: replacement o f digital excitation equipment, circuit breakers and other switchgear, control and protection equipment, and some critical communication links between important load centers and generating stations and the national control centre for better system operation control and assessing the flow. For Mozambique the project includes the provision o f a new 220/66/33 kV power transformer at the existing Matambo substation in the Tete region; connecting the new transformer to the 66 kV and 33 kV systems, and associated civi l works, control and protection work at the substation.
39. The following tables summarize costs and proposed sources o f financing (figures include price and physical contingencies). Further details are provided in Annex 4 and Annex 5.
8
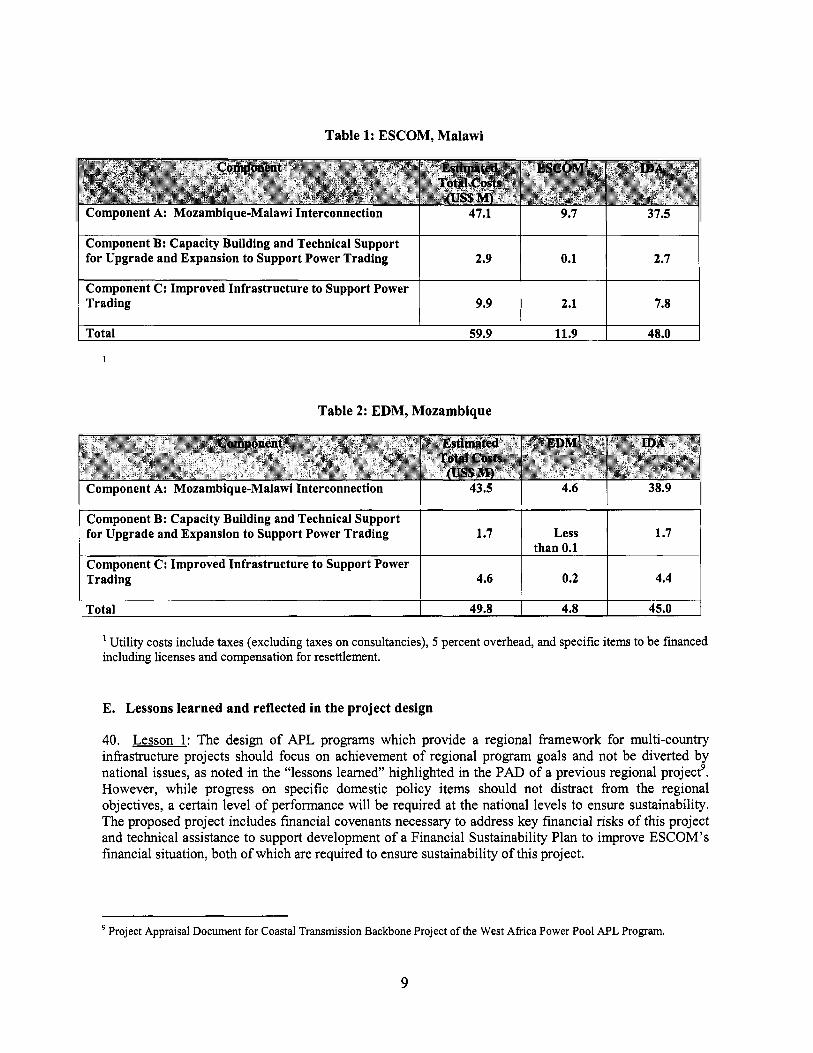
Table 1: ESCOM, Malawi
Component B: Capacity Building and Technical Support for Upgrade and Expansion to Support Power Trading 2.9 0.1 2.7
Component C: Improved Infrastructure to Support Power Trading 9.9 2.1 7.8
Table 2: EDM, Mozambique
I Total 59.9 11.9 48.0
Component B: Capacity Building and Technical Support for Upgrade and Expansion to Support Power Trading
Component C: Improved Infrastructure to Support Power Trading
Utility costs include taxes (excluding taxes on consultancies), 5 percent overhead, and specific items to be financed 1
including licenses and compensation for resettlement.
1.7 Less 1.7 than 0.1
4.6 0.2 4.4
E. Lessons learned and reflected in the project design
Total 49.8 4.8
40. Lesson 1: The design o f APL programs which provide a regional framework for multi-country infrastructure projects should focus on achievement o f regional program goals and not be diverted by national issues, as noted in the “lessons learned” highlighted in the PAD o f a previous regional projectg. However, while progress on specific domestic policy items should not distract from the regional objectives, a certain level o f performance will be required at the national levels to ensure sustainability. The proposed project includes financial covenants necessary to address key financial risks o f this project and technical assistance to support development o f a Financial Sustainability Plan to improve ESCOM’s financial situation, both o f which are required to ensure sustainability o f this project.
45.0
Project Appraisal Document for Coastal Transmission Backbone Project o f the West Africa Power Pool APL Program.
9
41. Lesson 2: Experience in APL-1 demonstrates the importance o f ensuring that technical design issues are resolved and major procurement packages have progressed to an advanced stage by the time the project i s approved, to avoid long delays between project effectiveness and disbursements. In this project, preparation o f prequalification and bidding documents for the major investment component i s well underway. There are no outstanding design issues.
42. Lesson 3: The project design should assess the full chain o f activities and investments required to achieve the project objectives, and ensure all critical constraints are addressed within the project. Components B and C would address potential bottlenecks in the Malawi and Mozambique transmission and distribution system, which might impede trade o f electricity.
43. Lesson 4: A key lesson from experience in previous Bank-financed power sector credits in Malawi i s that i f the utility i s to bear the foreign exchange risk o f an on-lent credit, then the tariff that ESCOM i s permitted to charge customers must adjust with respect to the exchange rate movements. The Government has taken actions to address this issue. An automatic tariff adjustment mechanism has now been adopted to allow for adjustments to compensate for exchange rate movements and inflation. Since 2004, this mechanism has been largely effective (albeit with some delays in implementing the required tariff adjustments). The ESCOM Financial Sustainability Plan (described in Section IV.A, paragraphs 70 - 7 1) will address the issue o f exchange rate shocks and propose a mechanism such that if any limitations are imposed on the automatic adjustment mechanism to avoid tariff shocks, ESCOM would be financially compensated by the Government until the situation stabilizes and the end-use customer tariff has been adjusted to the appropriate level.
F. Alternatives considered and reasons for rejection
44. No Interconnection or delayed interconnection, focusing only on expanding Malawi’s domestic hydropower generation capacity. This option was rejected because it does not address the major risk o f drought-induced power crisis, since the only domestic generation option that could be operational in the timeframe required would be additional capacity on the Shire River (i.e. the Kapichira I1 project). Imports via the interconnection will provide an alternative source o f supply that i s independent o f the flow on the Shire River. This “diversity o f supply” represents Malawi’s best hedge against drought- induced power crisis. Over the past 3 years ESCOM has explored the option o f a long-term import contract. ESCOM i s in the final stages o f concluding an import agreement with Hidroelectrica Cahora Bassa (HCB) in Mozambique. However, even without a firm power import agreement in place, the interconnection s t i l l represents Malawi’s least-cost mitigation measure against drought-induced power crisis. Although the availability and price o f opportunistic and/or short-term supply would be uncertain, were Malawi to experience a severe power shortage, there i s a high probability that Malawi would be able to secure electricity imports at a cost significantly lower than supplying the same electricity from emergency thermal units.
45. Including in the project scope extension o f the transmission line into northern Mozambique. Extension o f the interconnection from Phombeya in Malawi east into northern Mozambique i s viewed by EDM and the Government o f Mozambique as an important component o f the strategy for improving electricity supply to the north o f Mozambique. I t also could open the potential for interconnection and electricity trading with Tanzania in the future. Inclusion o f this extension o f the line in the proposed project was rejected because assessment and preparation for the extension i s s t i l l at an early stage. However, financing for the feasibility study for the transmission l ine extension i s included in the proposed project.
10
46. Requiring that ESCOM have a Power Supply Agreement CPSA) in place before proceeding with the transmission line investment. There are some clear advantages to having a PSA in place, and ESCOM i s in negotiations with HCB to provide up to 50MW o f capacity to ESCOM." However, there are also strong justifications for proceeding with the investment even in the absence o f a final import agreement, The transmission interconnection i s Malawi's least-cost strategy to reduce the risk o f drought-induced power crisis, as explained in paragraph 44. This i s true with or without an import agreement in place. In addition, there i s a clear economic incentive for electricity trade. Malawi currently spills power during off-peak periods which could otherwise potentially be sold on the SAPP. The opportunity for sale o f off- peak electricity, that would otherwise be spilled, will increase when Kapichira I1 i s operational planned for 201 1 (see Annex 1). At the same time, Malawi i s projecting a peak deficit in all years except 201 1. Importing electricity will be less expensive than running thermal generation to meet peak demand. In the medium term (by 2015), Malawi's low cost domestic options will be largely utilized, and increased imports i s projected to be the option with the lowest cost and greatest benefit from the point o f view o f increasing diversity o f supply, Also by 20 15, a significant amount o f new generation capacity i s expected to be on-line in SAPP, including in Mozambique near the Malawi border (see Annex 1, paragraphs 2 and 36-41). With the interconnector in place, Malawi will be in a position to secure additional capacity through future import agreements.
111. IMPLEMENTATION
A. Partnership arrangements
47. The Norwegian Embassy in Maputo on behalf o f the Norwegian Ministry o f Foreign Affairs has indicated interest in contributing to finance studies which have been identified as being important for developing power trade via the interconnector, but for which financing under this project i s not available (see Annex 4). Financing arrangements with Norway could be agreed to under the existing general Co- Financing and Technical Assistance Framework Agreement signed between the World Bank and the Government o f Norway. Arrangements are made under this agreement for Norway to co-finance a project for which a Bank loan has already been approved. In addition, opportunities for carbon financing are being explored.
B. Institutional and implementation arrangements
48. Imdementing Institutions. ESCOM and EDM will be responsible for the implementation o f the Malawi and Mozambique portions o f the project respectively. In order to manage the coordination and address any issues that arise as a result o f the regional nature o f the project, a three-level structure has been put in place and i s fully operational:
A Joint Project Steering Committee, comprised o f senior staff from the Ministry o f Energy, Mines & Natural Resources, Ministry o f Finance, Ministry o f Economic Planning, National Electricity Council (or successor entity) and ESCOM in Malawi, and the Ministry o f Energy, Ministry o f Planning and Development, Ministry o f Finance and EDM in Mozambique, provides oversight to address any issues that need to be resolved at Government level.
A Joint Project Coordination Committee, comprised o f senior management from the two utilities, reports to the Project Steering Committee. This Committee i s responsible for high level project coordination and for referring any critical issues to the Steering Committee. By October 3 1 each
lo Starting in 2003, ESCOM conducted an international competitive bidding process to identify a supply source for electricity imports via the proposed interconnector. The bid from Hidroelectrica Cahora Bassa (HCB) was ranked top in the evaluation process.
11
year, the Joint Project Coordination Committee will submit an overall project progress report to the Project Steering Committee. The report will describe the status o f implementation o f the Procurement Plans, physical progress, and financial reports for the twelve months ending in July o f the same year.
ESCOM and E D M each have a Project Management Unit (PMU). For the two utilities, the PMUs include a Project Manager, Project Engineer, Social and Environmental Specialist, Financial Management Specialist and technical specialists including transmission line and substation engineers and a staff member familiar with World Bank procurement guidelines. EDM and ESCOM have jointly hired a Design and Supervision Consultant under a single contract. ESCOM and EDM each pay fifty percent o f the Consultant costs. The ESCOM and EDM PMUs and the Consultant are in regular contact. The ESCOM and EDM Project Managers, with input from the Financial Management Specialists in the respective PMUs, will be responsible for financial reporting the ESCOM and EDM parts o f the project respectively. Training and capacity building for the ESCOM and EDM PMUs will be included in the project. The implementation arrangements are discussed further in Annex 6.
49. There are four key agreements governing implementation and operation o f the transmission interconnection. These agreements have already been substantially negotiated and signature o f these agreements i s a condition o f effectiveness. The key agreements are: (i) the Implementation Agreement between EDM and ESCOM; (ii) the Maintenance Agreement between EDM and ESCOM, (iii) the System Operating Agreement between EDM, ESCOM, and HCB; and (iv) the Wheeling Areement between EDM and ESCOM specifying payments by ESCOM to EDM for use o f the Mozambique portion o f the line. The Wheeling Agreement will specify a monthly payment rate from ESCOM to EDM which will be set to cover: (i) the full cost o f EDM debt service to the Government o f Mozambique for this investment, (ii) a guaranteed return on EDM’s investment for the interconnection and (iii) EDM’s operation and maintenance costs for the interconnection. Details are included in Annex 6.
50. Financing for the project will be provided as two separate credits: one to the Government o f Malawi and one to the Government o f Mozambique. The funds will be on-lent to ESCOM and EDM respectively on terms as shown in Section IV. A: Financial Analysis (paragraphs 73 and 77). Both utilities already operate special accounts for project preparation facilities for this project.
C. Monitoring and evaluation o f outcomes/results
51. The respective PMUs wil l be responsible for collecting and consolidating the data. The primary sources o f data will include for ESCOM - ESCOM annual reports, ESCOM annual audit reports, ESCOM P M U quarterly Financial Monitoring Reports (FMR), information provided from ESCOM’s Dispatch and Control Center, and quarterly reports from the Supervision Consultant. For EDM - EDM annual reports, EDM annual audit reports, EDM P M U quarterly FMRs, and quarterly reports from the Supervision Consultant. All information required to meet the reporting requirements for this project i s either information that ESCOM and EDM would already be collecting for internal reporting and auditing, or can be derived from this information through simple analysis. Annex 3 presents the detailed Results Framework and Arrangements for Results Monitoring.
52. Regular reporting on the implementation progress o f the interconnector component will make it possible for the PMUs to alert management promptly if problems arise. This will be a critical factor in ensuring that prompt decisions and actions can be taken to avoid delays. The proposed monitoring and reporting on ESCOM’s financial performance will allow a timely update o f the ESCOM financial projections and indication o f any adjustments required to achieve financial sustainability and meet the
12
financial covenants for this project. Monitoring and reporting o f the electricity trading following the completion o f the interconnection will provide an important input for ESCOM’s planning to reliably meet Malawi’s future electricity demand at lowest cost. For Mozambique, monitoring o f the effectiveness after the project i s completed wil l provide an indicator o f sustainability and the basis o f fbture financial assumptions with respect to planning expansion o f Mozambique’s northern grid. The information reported will also be an important input to the overall World Bank engagement in preparing for subsequent support in the energy sector as well as at the country dialog level.
D. Sustainability
53. Sustainability of this project rests on (i) the availability o f surplus energy at a lower cost than domestic alternatives; (ii) the technical capacity; (iii) correct economic and financial incentives to achieve efficient electricity trading between Malawi and Mozambique and between Malawi and other SAPP entities; (iv) opportunities for increased use o f the line in the medium term. With respect to the first point, HCB has already ear-marked up to 50MW o f capacity to supply Malawi as the basis for the current discussions on the Power Supply Agreement. Malawi currently has off-peak energy available to sel l to EDM or on the STEM. With respect to technical capacity requirements, EDM i s already one o f the largest traders on the STEM. Technical assistance will be provided under the project to assist ESCOM as the company embarks upon electricity trading. Regarding the third consideration, the energy sector policies o f both Malawi and Mozambique indicate that the respective utilities are to operate on a commercial basis, and this i s reinforced through the financial covenants o f this project. Finally, there i s significant potential for increased use o f the line in the future. New generation i s expected to be commissioned in Mozambique (and elsewhere in the SAPP) by 2015 when Malawi i s expected to again be facing an off-peak capacity deficit. EDM intends to extend the transmission interconnector east to improve electricity supply to northern Mozambique.
54. Strong evidence o f commitment and ownership o f this project at both the utility and the government level has been demonstrated through actions already taken, including:
0 A Government-to-Government Agreement between the Governments o f Malawi and Mozambique was signed in 1998. The Agreement’s main purpose was to enable Malawi to trade electricity with Mozambique or any signatory o f the SAPP through a high-voltage transmission line and associated equipment. A Joint Project Steering Committee was established between the Government o f Malawi and the Government o f Mozambique and has been effective in addressing major issues to allow the project to reach the current point where all major agreements have been substantially negotiated. Both ESCOM and EDM have already invested significant resources in the preparation o f this project including preparation o f the feasibility study, Environmental Impact Assessments (EIAs), Resettlement Policy Frameworks, preliminary aerial survey o f the route, and multiple rounds o f negotiations on the key agreements. Both countries and utilities are signatories to the respective SAPP inter-governmental and inter- utility MOUs. Countries and utilities are also members on the SAPP sub-committees.
0
0
0
55. Other factors critical to the sustainability o f the project’s objectives include the following: ESCOM and EDM should meet their commitments, both financial and operational, as laid out in the Wheeling, Implementation and Maintenance agreements. HCB, ESCOM, and EDM should reach agreement on the System Operating Agreement and fulfill their specified roles.
13
E. Critical risks and possible controversial aspects
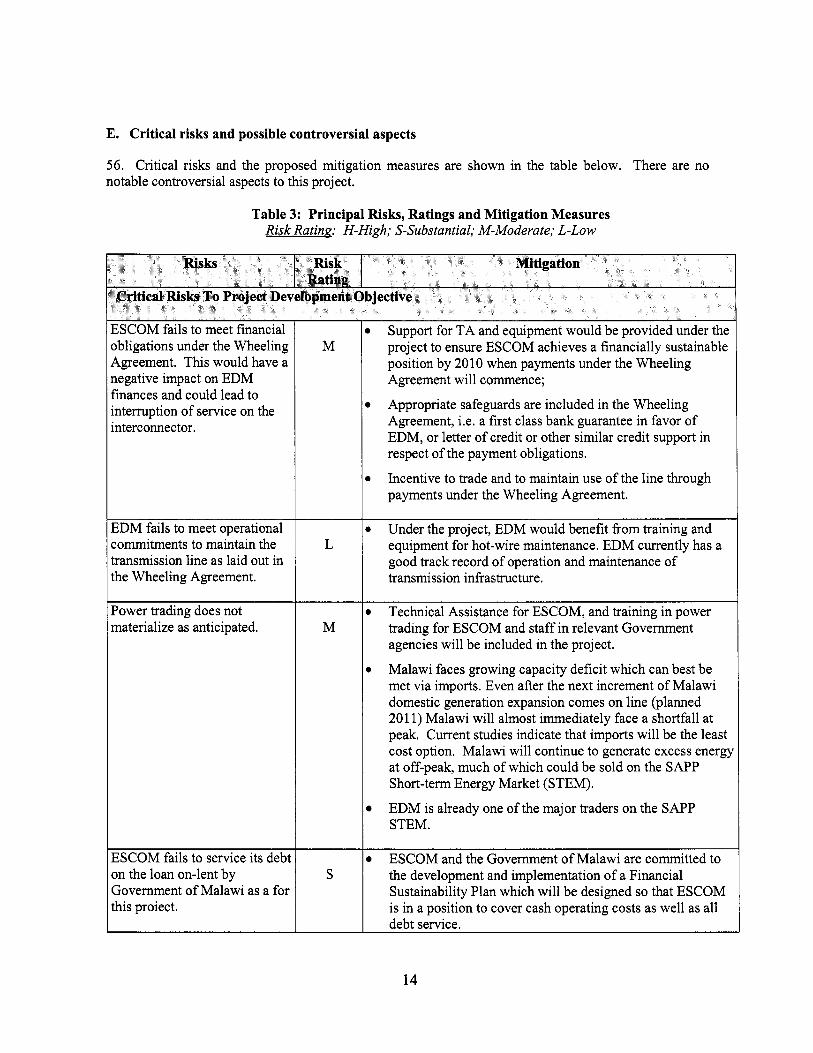
56. Critical r isks and the proposed mitigation measures are shown in the table below. There are n o notable controversial aspects to this project.
Table 3: Principal Risks, Ratings and Mitigation Measures Risk Rating: H-High; S-Substantial; M-Moderate; L-Low
)bligations under the Wheeling 9greement. This would have a iegative impact on EDM 'mances and could lead to ntermption o f service on the nterconnector .
3 D M fails to meet operational :ommitments to maintain the ransmission l ine as la id out in he Wheeling Agreement.
'ower trading does not naterialize as anticipated.
3SCOM fails to service i ts debt In the loan on-lent by Sovernment o f Ma law i as a for :his proiect.
M
L
M
S
B Support for TA and equipment would be provided under the project to ensure ESCOM achieves a financially sustainable position by 20 10 when payments under the Wheeling Agreement wil l commence;
Appropriate safeguards are included in the Wheeling Agreement, i.e. a f irst class bank guarantee in favor o f EDM, or letter o f credit or other similar credit support in respect o f the payment obligations.
Incentive to trade and to maintain use o f the l ine through payments under the Wheeling Agreement.
B
B
B Under the project, EDM would benefit f rom training and equipment for hot-wire maintenance. EDM currently has a good track record o f operation and maintenance o f transmission infrastructure.
B Technical Assistance for ESCOM, and training in power trading for E S C O M and staf f in relevant Government agencies will be included in the project.
Ma law i faces growing capacity deficit which can best be met v ia imports. Even after the next increment o f Ma law i domestic generation expansion comes o n l ine (planned 201 1) Ma law i will almost immediately face a shortfall at peak. Current studies indicate that imports will be the least cost option. Ma law i will continue to generate excess energq at off-peak, much o f which could be sold o n the SAPP Short-term Energy Market (STEM).
EDM i s already one o f the major traders o n the SAPP STEM.
D
E S C O M and the Government o f Ma law i are committed to the development and implementation o f a Financial Sustainability Plan which will be designed so that E S C O M is in a position to cover cash operating costs as wel l as a l l debt service.
14

Expected improvements in ESCOM performance fail to M materialize.
0 An ESCOM Financial Sustainability Plan will be in place in September 2007. The plan will be monitored by Ministry o f Finance at least through 20 10. If planned performance improvements do not occur (or performance deteriorates) the plan will be adjusted and appropriate action taken to
Components A and C: Delays in contractor selection and implementation o f the contracts. underway. Overall Risk Rating: Moderate
0 Consultants to assist in the bidding preparation and process are on-board and the preparation o f the bidding documents i s well-advanced. Pre-qualification for major contracts i s
L
F. Credit conditions and covenants
57. Effectiveness conditions for Malawi: ESCOM has established a FM system, adequate to produce interim unaudited financial reports, in form and substance satisfactory to IDA, to ensure proper accounting and monitoring o f project funds. Key agreements (as defined in paragraph 49) have been signed by all parties. The Subsidiary Loan agreement between the Government o f Malawi and ESCOM has been signed. ESCOM has completed the ESCOM Company audit for FY05 and submitted this to IDA.
58. Effectiveness conditions for Mozambiaue: EDM has established a FM system, adequate to produce interim unaudited financial reports, in form and substance satisfactory to IDA, to ensure proper accounting and monitoring o f project funds; Key agreements (as defined in paragraph 49) have been signed by all parties; The Subsidiary Loan agreement between the Government o f Mozambique and EDM has been signed.
a
59. Disbursement condition There can be no disbursement o f the Mozambique credit against Category l a (Transmission and Substation Supply and Installation) until the Financing Agreement for Malawi has become effective; There can be no disbursement o f the Malawi credit against Category l a (Transmission and Substation Supply and Installation) until the Financing Agreement for Mozambique has become effective.
60. Covenants for ESCOM: a ESCOM will submit to IDA audited financial statements within six months after the year end; a ESCOM will submit to IDA unaudited interim financial statements within 45 days after each
calendar quarter, to cover such calendar quarter; 0 ESCOM will ensure implementation o f the Resettlement Policy Framework and
recommendations o f EIAs as per disclosed documents; 0 ESCOM will implement the Financial Sustainability Plan;
15

0
ESCOM will maintain a Cash Coverage ratio” f rom 2008 onward greater than or equal to 1 .O; ESCOM will maintain a Collection-Generation ratio” f rom 2008 onward greater than or equal to 75 percent.
61. Covenants for EDM: EDM will submit to IDA audited financial statements within six months after the year end; EDM will submit to IDA unaudited interim financial statements within 45 days after each calendar quarter, to cover such calendar quarter; EDM will ensure implementation o f the Resettlement Policy Framework and recommendations o f EMS as per disclosed documents; EDM will maintain a Current Ratio (current assets over current liabilities) o f at least 1.3 f rom 2008 onward; EDM will maintain a Collection-Generation ratio (defined above) f rom 2008 onward o f at least 71 percent; f rom 2009: 73 percent; f rom 2010: 74 percent.
IV. APPRAISAL SUMMARY
A. Economic and financial analyses
Project economic analysis
62. The economic case for the proposed project has been analyzed for the period 2007-37. A range o f economic benefits will accrue f rom the project for both Mozambique and Malawi. The economic case for the project i s predicated o n two-way flows o f energy v ia the transmission interconnection: imports into Ma law i f rom Mozambique during peak hours and limited off-peak exports f rom Ma law i to Mozambique and the SAPP during off-peak hours. I t i s estimated that net economic benefits f rom the project will amount to approximately US$361 mi l l ion (in NPV terms), and that the economic internal rate o f return wil l be approximately 28 percent. These results are robust in a range o f scenarios. The project i s the least- cost means o f delivering these benefits. The principal assumptions underlying the base case o f the economic cost-benefit analysis o f the project are set out in Annex 9.
The cash coverage ratio i s defined as operating and other income (adjusted for net working capital and non-cash expenses) plus consumer deposits divided by the sum o f debt service liabilities, internal funds required for capital investment, and contribution required for staff retirement funds. A cash coverage ratio o f 1 .O wi l l ensure that ESCOM has sufficient cash revenues to cover its cash operating costs, debt service requirements, and internal funds required for capital investment.
captures T&D losses, billing and collection performance. The term “collection-generation ratio” means: energy collected by ESCOM divided by energy sent out by ESCOM; energy collected by ESCOM i s equal to (energy sent out to ESCOM less transmission and distribution losses in ESCOM’s system) multiplied by ESCOM’s billing collection ratio; energy sent out from ESCOM’s generation systems, and energy entering ESCOM’s systems through purchases; and ESCOM bil l ing collection ratio means energy collected divided by energy billed.
The collection-generation ratio measures how much o f energy generated was actually collected in cash from customers. I t
16

Table 4: Project Net Present Value (NPV) and Economic Internal Rate of Return (EIRR): Base Case
NPV / EIRR Total project NPV Total project EIRR Mozambique NPV Mozambique EIRR Malawi NPV Malawi EIRR
Values US$36 1 mi l l ion
28.2% US$69 mil l ion
26.1% US$292 mil l ion
29.3%
63. Principal benefits: Malawi. Malawi i s projected to face relatively large and growing capacity deficits in the forecast period which could lead to high costs o f unserved energy to businesses and consumers. Hence the principal economic benefit o f the project i s that Malawi will be able to import power from Mozambique to cover i t s deficits. It i s expected that Malawi will have a PSA in place for a net 30 MW from 201 1 to 2015, rising to a net 50 MW from 2015 to 2019 and a net 120 MW from 2019 onward. At the same time, however, Malawi i s currently spilling surplus off-peak energy generated from i t s run-of- river system. This energy could be sold via the interconnector on the SAPP Short-term Energy Market (STEM). For the base case, i t i s assumed that 40 percent o f Malawi’s excess off-peak energy wil l be sold on the STEM. The gross economic benefits for Malawi are set out below. When the investment costs are factored in, it i s estimated that net economic benefits for Malawi will amount to approximately U S 2 9 2 mil l ion (in NPV terms), and that the economic internal rate o f return wil l be approximately 29 percent.
Economic Benefit Imports from Mozambique to cover deficits Exports o f surplus off-peak energy to SAPP
Table 5: Summary of Gross Economic Benefits: Malawi Base Case
Net present value (US$ million) 359 14
64. Principal benefits: Mozambiaue. Mozambique will benefit from the project in four principal ways. First, because Malawi faces growing peak capacity deficits, Hidroelectrica de Cahora Bassa, S A M (HCB), the owner o f the 2,075MW Cahora Bassa hydropower generation plant in Tete province in Mozambique, i s expected to have the opportunity to export power to Malawi. I t i s assumed that ESCOM will buy a net 30 MW o f power from HCB. I t i s assumed that exports from Mozambique to Malawi will increase, either from HCB or from planned new generation capacity, as Malawi’s demand grows. Second, under the terms o f the wheeling agreement, EDM in Mozambique will realize a revenue stream from Malawi for the use o f the line. Third, EDM could benefit from substituting cheaper off-peak energy from ESCOM that would otherwise be spilled, for more expensive domestic alternatives during the period 20 1 1-20 15. Fourth, there are additional potential economic benefits for Mozambique from extending the interconnector across Malawi and into northern Mozambique to improve the reliability o f power supply to Mozambique’s northern region^.'^ The gross economic benefits for Malawi are set out below. When the investment costs are factored in, it i s estimated that net economic benefits for Malawi will amount to approximately US$69 mil l ion (in NPV terms), and that the economic internal rate o f return will be approximately 26 percent.
l3 Whi le this economic benefit to Mozambique could be substantial, i t i s not actually realized by the project itself, and so has not been factored into the economic analysis.
17

Table 6: Summary of Gross Economic Benefits: Mozambique Base Case
Economic Benefit Exports to Malawi
Off-peak imports from Malawi, 201 1-15 ‘Wheeling agreement’
Net present value (US$ million) 56 35 14
65. Sensitivity analysis. Three main scenarios were analyzed in order to test the robustness o f the base case analysis to changes in the values o f the main variables. The most significant exogenous variable in the economic analysis i s that o f variations in hydrological conditions in Malawi. The f i rs t sensitivity scenario i s the impact o f a drought in Malawi. The principal effect would be reducing the water f low through the turbines o f the hydro plants. The drought scenario used was that o f the worst continuous three-year drought period for which there i s data, which was in the period 1995-98. The drought scenario results in incremental economic benefits for Malawi from the import o f power via the interconnector to cover energy shortfalls. At the same time, these are somewhat offset by reduced off-peak exports to the SAPP. The balance o f benefits also changes for Mozambique, although net economic benefits remain strongly positive. Overall, the three-year drought scenario reinforces the economic case for the interconnector project, increasing net economic benefits by over US$40 million, and increasing the economic internal rate o f return (EIRR) from 28 percent to 34 percent. A longer or more severe period o f drought would increase the benefits further.
Mozambique NPV (US$ million)
Table 7: Sensitivity Analysis: Impact o f Drought
I Basecase 1 Drought I 69 64
Malawi NPV (US$ million)
Malawi IRR
Total project NPV (US$ million) Total project IRR
Mozambique IRR I 26.1% I 24.4%
292 339
29.3% 40.4%
361 404 28.2% 33.6%
66. A second scenario considered was that o f a “constrained” aggregate energy situation in the SAPP- that is, a combination o f relatively greater demand for energy and relatively lower supply in the region. In this scenario, it i s likely that Malawi would be able to export a higher percentage o f i t s surplus off-peak energy. But at the same time, the unit cost o f imports would l ikely increase, driving down overall economic benefits o f the project. The third scenario considered was one o f a “plentiful” aggregate energy situation in the SAPP-that is, a combination o f relatively high supply o f energy and relatively lower demand. In this scenario, i t i s likely that Malawi would export a lower percentage o f i t s surplus off-peak energy, but that the unit cost o f imports would l ikely decrease, hence increasing the overall economic benefits o f the project. These results are reversed for Mozambique in each scenario. However, the net economic benefits o f undertaking the project remain positive for both countries in both second and third
18
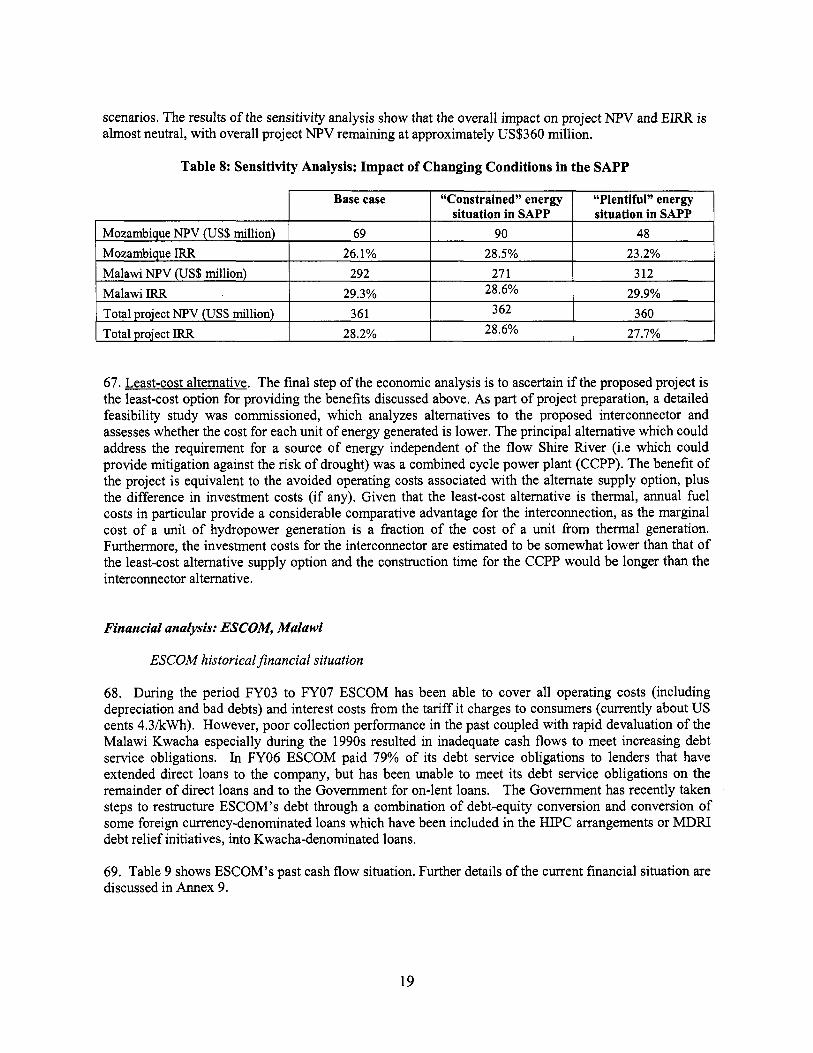
scenarios. The results o f the sensitivity analysis show that the overall impact on project NPV and ERR i s almost neutral, with overall project NPV remaining at approximately US$360 million.
Mozambique NPV (US$ million) Mozambique IRR Malawi NPV (US$ million) Malawi IRR Total project NPV (US$ million) Total project IRR
Base case “Constrained” energy “Plentiful” energy situation in SAPP situation in SAPP
69 90 48 26.1% 28.5% 23.2%
292 27 1 312 29.3% 28.6% 29.9%
361 362 3 60 28.2% 28.6% 27.7%
67. Least-cost alternative. The final step o f the economic analysis i s to ascertain if the proposed project i s the least-cost option for providing the benefits discussed above. As part o f project preparation, a detailed feasibility study was commissioned, which analyzes alternatives to the proposed interconnector and assesses whether the cost for each unit o f energy generated i s lower. The principal alternative which could address the requirement for a source o f energy independent o f the f low Shire River (i.e which could provide mitigation against the risk o f drought) was a combined cycle power plant (CCPP). The benefit o f the project i s equivalent to the avoided operating costs associated with the alternate supply option, plus the difference in investment costs (if any). Given that the least-cost alternative i s thermal, annual fuel costs in particular provide a considerable comparative advantage for the interconnection, as the marginal cost o f a unit o f hydropower generation i s a fraction o f the cost o f a unit from thermal generation. Furthermore, the investment costs for the interconnector are estimated to be somewhat lower than that o f the least-cost alternative supply option and the construction time for the CCPP would be longer than the interconnector alternative.
Financial analysis: ESCOM, Malawi
ESCOM historical financial situation
68. During the period FY03 to FY07 ESCOM has been able to cover all operating costs (including depreciation and bad debts) and interest costs from the tariff i t charges to consumers (currently about U S cents 4.3kWh). However, poor collection performance in the past coupled with rapid devaluation o f the Malawi Kwacha especially during the 1990s resulted in inadequate cash flows to meet increasing debt service obligations. In FY06 ESCOM paid 79% o f i t s debt service obligations to lenders that have extended direct loans to the company, but has been unable to meet i t s debt service obligations on the remainder o f direct loans and to the Government for on-lent loans. The Government has recently taken steps to restructure ESCOM’s debt through a combination o f debt-equity conversion and conversion o f some foreign currency-denominated loans which have been included in the HIPC arrangements or MDRI debt re l ie f initiatives, into Kwacha-denominated loans.
69. Table 9 shows ESCOM’s past cash flow situation. Further details o f the current financial situation are discussed in Annex 9.
19

ESCOMjnancial outlook
70. ESCOM Financial Sustainability Plan. E S C O M and the Government are committed to achieving ESCOM financial sustainability through a combination o f E S C O M efficiency improvements and tar i f f adjustments. ESCOM’s principal target i s to be in a position to cover a l l cash requirements, particularly once the new outflows related to payments to EDM for use o f the transmission l ine and import contracts take effect in FY 11. Thus ESCOM’s immediate goal i s to achieve a Cash Coverage ratio (defined in paragraph 60) o f 1.0 or greater in FY08 and onwards, which will ensure that ESCOM has sufficient cash revenues to cover i t s cash operating costs, debt service requirements, payments to EDM under the Wheeling Agreement (once it becomes effective), electricity import costs and internal funds required for capital investment. In M a y 2007, the Government o f Ma law i wrote to the Wor ld Bank stating i t s intention to put in place an E S C O M Financial Sustainability Plan by September 2007 with the objective of achieving this cash coverage target, and to implement and monitor the plan through 2010 through a regular monitoring and reporting system.
7 1. The plan will include (i) review o f ESCOM’s current and recent past performance, (ii) identification o f areas for performance and efficiency improvement, (iii) the setting o f realistic targets for improvement, and development o f a monitoring and reporting mechanism, (iv) analysis to determine the recoverability o f outstanding arrears and identification o f steps to recover arrears where possible, (v) if necessary, prepare a plan for rescheduling the payment o f overdue debt service o n direct loans to ESCOM, (vi) indicate the extent to which tariffs must be adjusted annually, taking into account the planned efficiency improvements and planned E S C O M investment program, (vii) analyze the issue o f exchange rate shocks and propose a mechanism such that if any limitations are imposed o n the automatic adjustment mechanism to avoid tar i f f shocks, ESCOM would be financially compensated by the Government. Implementation o f the plan will be critical in raising finance for the proposed next major power sector investment-the Kapichira I1 Hydropower station. Technical assistance i s planned under the project for support in (i) developing the Financial Sustainability Plan, (ii) implementing recovery o f the arrears to the extent possible, (iii) performing a diagnostic study o f ESCOM’s revenue stream and (iv) implementing the recommendations o f the revenue diagnostic study.
20
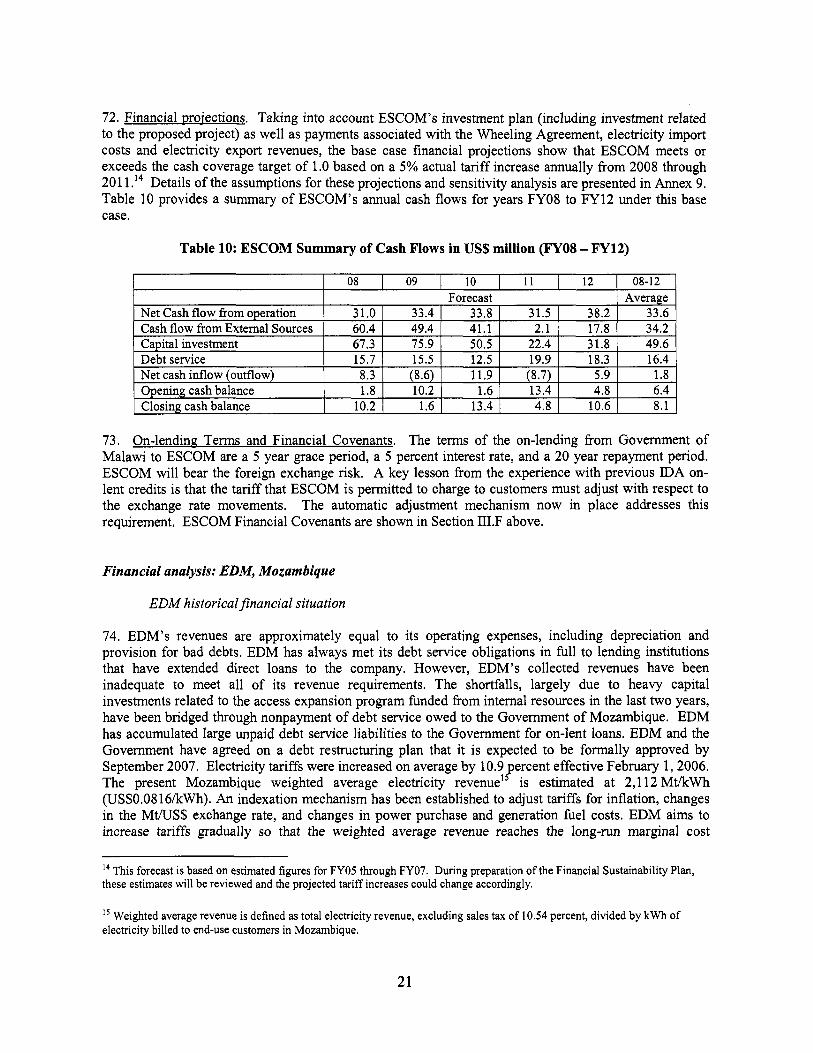
72. Financial projections. Taking into account ESCOM’s investment plan (including investment related to the proposed project) as well as payments associated with the Wheeling Agreement, electricity import costs and electricity export revenues, the base case financial projections show that ESCOM meets or exceeds the cash coverage target o f 1.0 based on a 5% actual tariff increase annually from 2008 through 201 1 .14 Details o f the assumptions for these projections and sensitivity analysis are presented in Annex 9. Table 10 provides a summary o f ESCOM’s annual cash flows for years FY08 to FY12 under this base case.
Table 10: ESCOM Summary of Cash Flows in US$ million (FYOS - FY12)
73. On-lending; Terms and Financial Covenants. The terms o f the on-lending from Government o f Malawi to ESCOM are a 5 year grace period, a 5 percent interest rate, and a 20 year repayment period. ESCOM will bear the foreign exchange risk. A key lesson from the experience with previous IDA on- lent credits i s that the tariff that ESCOM i s permitted to charge to customers must adjust with respect to the exchange rate movements. The automatic adjustment mechanism now in place addresses this requirement. ESCOM Financial Covenants are shown in Section 1II.F above.
Financial analysis: EDM, Mozambique
EDM historical financial situation
74. EDM’s revenues are approximately equal to i t s operating expenses, including depreciation and provision for bad debts. EDM has always met i t s debt service obligations in full to lending institutions that have extended direct loans to the company. However, EDM’s collected revenues have been inadequate to meet all o f i t s revenue requirements. The shortfalls, largely due to heavy capital investments related to the access expansion program funded from internal resources in the last two years, have been bridged through nonpayment o f debt service owed to the Government o f Mozambique. EDM has accumulated large unpaid debt service liabilities to the Government for on-lent loans. EDM and the Government have agreed on a debt restructuring plan that it i s expected to be formally approved by September 2007. Electricity tariffs were increased on average by 10.9 percent effective February 1,2006. The present Mozambique weighted average electricity revenue” i s estimated at 2,112 MtkWh (uS$O.OS 16kWh). An indexation mechanism has been established to adjust tariffs for inflation, changes in the M m S $ exchange rate, and changes in power purchase and generation fuel costs. EDM aims to increase tariffs gradually so that the weighted average revenue reaches the long-run marginal cost
~ ~~
l4 Th is forecast i s based on estimated figures for FY05 through FY07. During preparation of the Financial Sustainability Plan, these estimates will be reviewed and the projected tariff increases could change accordingly.
’’ Weighted average revenue i s defined as total electricity revenue, excluding sales tax of 10.54 percent, divided by kWh of electricity billed to end-use customers in Mozambique.
21

(LRMC) level o f US#9.l kWh by April 2008. Overall, the financial performance o f EDM has improved over the past three years.
75. Table 11 shows EDM’s past cash flow situation.
Table 11: EDM Summary o f Cash Flows in US$ million (FY04 - FY07)
EDMJinancial outlook
76. Interconnection with Malawi (the DroDosed Droiect). The financial impact o f the interconnection on EDM will be positive since, under the Wheeling Agreement, EDM will recover the full investment cost plus operation and maintenance costs and as well as a specified retum on the investment. The Wheeling Agreement has been substantially negotiated and will be signed as a condition o f effectiveness.
77. On-lending Terms and ring-fencing Pavments from ESCOM. EDM will receive payments from ESCOM in a separate bank account. Amounts due to the Government o f Mozambique for debt servicing associated with this project will be paid from these proceeds. The remainder o f the monthly payments will be used by EDM for operation and maintenance o f the transmission interconnection and other uses as appropriate. The terms o f the on-lending from Government o f Mozambique to EDM are a 5 year grace period, a 5 percent interest rate, and a 20 year repayment period. EDM will bear the foreign exchange risk. EDM Financial Performance Covenants are show in Section III-F above.
78. Table 12 provides a summary o f EDM’s overall annual forecast cash flows for years 2008 to 201216.
Table 12: EDM Summary of Cash Flows in US$ million (FYOS - FY12)
l6 Assuming Government or other grant financing i s available to cover a portion o f the planned new connections.
22

B. Technical
79. The proposed 220 kV interconnector was selected through a feasibility study conducted by an international consultant, which considered the design and operational aspects o f the interconnector in the SAPP grid. The study was reviewed by EDM, ESCOM, and the Bank teams. Wh i le several alternatives were studied, a double circuit 220 kV link was considered most suitable to cater to the expected power flows through the interconnector as well as the existing grid conditions o f the EDM and ESCOM. The double circuit l ine with appropriate compensation would allow easy operation and bidirectional power flow between the two systems. Operational procedures o f the SAPP grid would be followed while operating the line. EDM i s already using 220 kV voltage, but this would be the first such line for Malawi. The required training in maintenance o f the link and adequate spares and operational tools/tackles have been included under the financing.
C. Fiduciary
80. Malawi/ESCOM financial management (see Annex 7). ESCOM i s currently controlling all o f i t s projects through i ts computerized FM system, with a dedicated and well-qualified personnel complement for project FM. The project FM sta f f has received training and has experience in World Bank FM and disbursement requirements. In summary, it i s concluded that the basic capability to control and monitor the financial performance on projects i s in place. Overall FM risk rating i s Moderate. Use o f ESCOM’s existing project FM staff and FM system i s a significant strength to the project.
81. MozambiaueEDM financial management (see Annex 7). The FM issues o f the project will be handled by the Department o f Debt and Contracts Management (DDCM) under Finance Directorate. A financial manager has been appointed to handle the FM issues o f the proposed project. She i s currently the managing the Project Preparation Faciliy (PPF) funds o f this proposed project. In view o f the general country FM issues and the issues specific to the project, the overall FM risk rating for the Mozambique component o f this project i s Moderate.
82. Malawi/ESCOM procurement (see Annex 8). Procurement activities will be carried out by the P M U under the ESCOM Transmission Business Unit. The P M U i s staffed by a Project Manager supported by a Project Engineer, an Environmental and Social Specialist, and a Financial Management Specialist, and the procurement function will be under the responsibility o f the Project Manager, who i s familiar with Wor ld Bank procedures and guidelines. During the pre-appraisal mission, a procurement assessment o f ESCOM was undertaken. Overall, the assessment revealed an Average procurement risk rating.
83. MozambiaueEDM urocurement (see Annex 8). Procurement activities wil l be carried out by the P M U which comprises the Electrification and Project Directorate (DEP) o f EDM. The PMU i s staffed by a Project Manager supported by a Project Engineer, an Environmental and Social Specialist, a Transmission and Substation Engineer, and a Financial Management Specialist, and the procurement function will be under the responsibility o f the Project Manager, who i s familiar with World Bank procedures and guidelines and i s also currently managing the EDM component under the World Bank- financed Energy Reform and Access Project. An assessment has been carried out o f the capacity o f the implementing agency to implement procurement actions for the project. The assessment reviewed the organizational structure for implementing the project and the interaction between the project’s staff responsible for procurement and FM; these are found to be satisfactory. EDM i s at present implementing satisfactorily i t s component under the Energy Reform and Access Project, with contracts with similar size and complexity to those envisaged under this project. Overall, the procurement risk rating i s Average.
23

D. Social
84. Displacement and dispossession i s very limited. Based on a thorough social analysis in each country along the entire wider transmission l ine corridor and the areas o f the two substations, a corridor with limited human activities has been retained for the construction o f the transmission line, to avoid the hardship o f displacement. The data o f the social analysis have been represented in two Resettlement Policy Frameworks (RPF) - one for Mozambique, one for Malawi. It was determined that RPFs, rather than Resettlement Action Plans, would be appropriate since the exact location o f the towers and line route within the broader corridor was not known at the time o f disclosure. At an early stage o f implementation a technical study and a survey wil l be conducted to determine the exact location o f the transmission l ine and towers within the corridor, and a record o f the people and assets that will be affected will be developed. Based on the results, and if needed, a Resettlement Action Plan (RAP) or an Abbreviated RAP will be prepared, approved, disclosed in-country and in the Infoshop, and implemented before the start o f any investment and construction work. Environmental Impact Assessments and Resettlement Policy Frameworks have been completed and disclosed in Malawi, Mozambique and the World Bank Infoshop (all disclosure was completed by February 14,2007).
’
E. Environment
85. The project i s located in northwest Mozambique near Tete and southern Malawi. The selected project corridor in Mozambique and Malawi passes mostly through agricultural land or bushland o f low biodiversity value. This corridor was selected after a comparison o f two alternative corridors. In Malawi an important forest reserve was avoided by selecting another route outside the Thambani Forest Reserve, one o f the few remaining forest areas in the country. The project will not cause any major or irreversible environmental impacts in Mozambique or Malawi.
86. Some very limited spots along the transmission line route may need to be cleared o f landmines. Clearing o f landmines i s only intended in one or two spots along the transmission l ine and not along the entire route in Mozambique as was initially considered during project identification. The clearing o f landmines that will be required along a portion o f the right-of-way in Mozambique i s fully in compliance with World Bank Operational Memorandum February 7, 1997. In Malawi, a high-biodiversity forest reserve was avoided by changing the corridor. For these reasons the project environmental assessment (EA) category i s B.
87. The urgent rehabilitation and reinforcement activities under Component C were defined only after disclosure o f the above EAs. None o f these activities to be included in Component C would have any environmental or social issues implications, beyond those which can be addressed in contractor specifications (for example, low-noise equipment, material free o f polychlorinated biphenyls (PCBs), and better construction techniques). The environmental management aspects will be handled according to the same standards as described in both EA studies. In particular, the disposal o f any hazardous wastes will be handled according to international standards.
88. The two RPFs and the two EAs will be implemented by ESCOMs and EDM’s existing environmental and social units, respectively. These un i ts will be strengthened under the project through technical assistance in Component B.
24
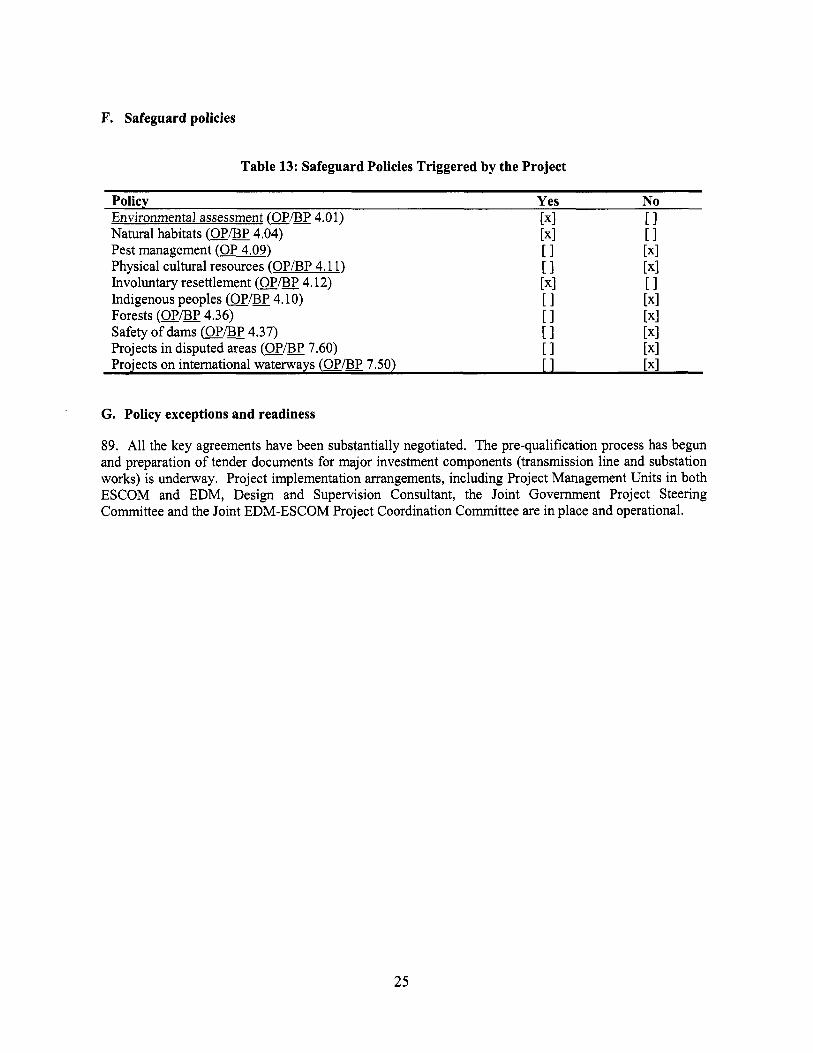
F. Safeguard policies
Table 13: Safeguard Policies Triggered by the Project
Policy Yes N o Environmental assessment (OP/BP 4.01) [XI [I Natural habitats (OPBP 4.04) [XI [I Pest management (OP 4.09) [I [XI
Physical cultural resources (OPBP 4.1 1) [I [XI
Involuntary resettlement (OP/BP 4.12) [XI [I Indigenous peoples (OP/BP 4.10) [I [XI
Forests (OP/BP 4.36) [I [XI
Safety o f dams (OPBP 4.37) [I [XI
Projects in disputed areas (OP/BP 7.60) [I [XI Projects on international waterways (OPBP 7.50) [XI
G. Policy exceptions and readiness
89. All the key agreements have been substantially negotiated. The pre-qualification process has begun and preparation o f tender documents for major investment components (transmission line and substation works) i s underway. Project implementation arrangements, including Project Management Units in both ESCOM and EDM, Design and Supervision Consultant, the Joint Government Project Steering Committee and the Joint EDM-ESCOM Project Coordination Committee are in place and operational.
25
Annex 1: Country and Sector or Program Background
AFRICA Mozambique - Malawi Transmission Interconnection (Southern African Power Market Program APL-2)
Regional Context
1. Southern Africa exhibits substantial variations in energy resource endowments, degrees o f industrial development, levels and patterns o f power consumption and power costs. These differences present opportunities for coordinated development o f the regional power sector to generate savings through aggregation o f loads with different load profiles, efficient use o f energy resources by exploiting large scale power generation schemes that are viable on the basis o f large, multi-country markets, and managing the r isks o f climate-related power shortages in hydro-dependent countries.
2. The Southern Africa Region as a whole i s entering a period o f generation capacity shortage. At least 1 , O O O M W o f additional capacity will be required each year to meet demand growth. Much o f the new demand could be met through large, regional generation projects. Generation expansion plans in Mozambique are described in paragraphs 36 - 41 below. The Government o f South Africa and Eskom, South Africa have already taken steps to increase generation capacity in South Africa by launching a tender for 1,OOOMW o f gas-fired generation, beginning the process o f bringing back into service a 3,500MW coal-fired power plant that was previously “moth-balled” and initiating the study o f other generation expansion options. In Botswana, plans are at an advanced stage for expanding the existing Morupule coal-fired power station by 400MW, and sponsors have been selected for development o f a greenfield 3,600MW coal-fired power plant at Mmamabule, planned to be on-line in 2015. Rehabilitation o f the Inga hydropower station in Democratic Republic o f Congo (financed under APL-lb o f the SAPMP APL series) will add an additional 500MW o f generation capacity in SAPP. Zambia i s in the process o f identifying financing for several hydropower projects (including Itezhi-Tezhi, Kafue Lower and expansion o f Kariba North Bank) which could add an additional 1,000MW over the next decade. There i s also the possibility o f development o f an 800MW gas-fired power plant in Namibia. Regional trade in electricity i s expected to increase, highlighting the need to address transmission-related constraints.
3. Regional stratem. In August 1995, SADC member countries created the Southern Africa Power Pool (SAPP) by concluding an Intergovernmental Memorandum of Understanding and related agreements. The utilities o f 12 Southern African countries were the original members o f the SAPP. The main grid systems o f Botswana, DRC, Lesotho, Mozambique, Namibia, South Africa, Swaziland, Zambia, and Zimbabwe form the existing regional network. Angola, Malawi and Tanzania are not yet connected. In February 2006, membership in the SAPP was expanded to include private generation and transmission companies.
4. The SADC Protocol on Energy o f 1996 commits member states to develop and use energy to support economic growth and development, poverty alleviation and improvement o f the standard and quality o f l i fe throughout the sub-region. The Protocol further commits member states to the main objectives, which include co-operation in the development and utilization o f energy and energy pooling to ensure security and reliability o f energy supply in the most eff icient and cost-effective manner. The SADC Energy Sector Action Plan o f 1997 recommends that the SADC energy program concentrates on priority activities which could be implemented efficiently on a regional basis for the benefit o f the entire region.
5. The Regional Indicative Strategic Development Plan (RISDP), approved by SADC Heads o f State and Government in 2001, reaffirms the policy goal established by the SADC Protocol on Energy and identifies the following specific objectives in the electricity sector: (i) promote power pooling through the
26
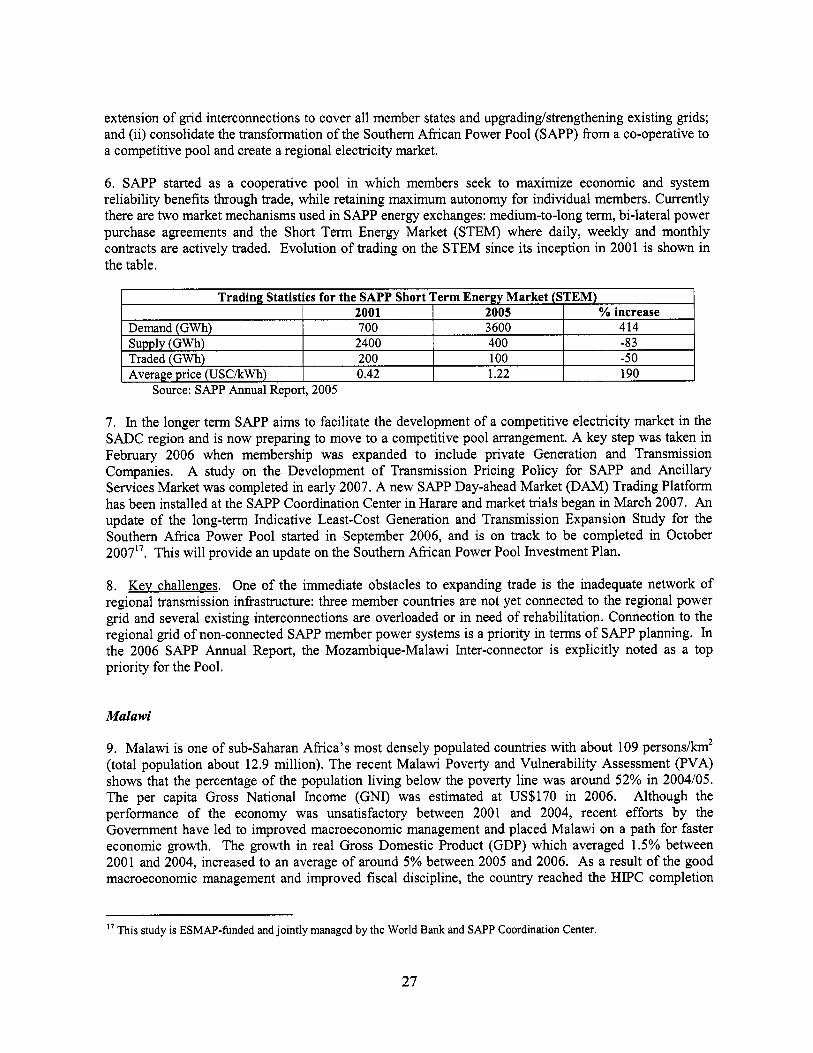
extension o f grid interconnections to cover all member states and upgradinghtrengthening existing grids; and (ii) consolidate the transformation o f the Southern African Power Pool (SAPP) from a co-operative to a competitive pool and create a regional electricity market.
2001 2005 Demand (GWh) 700 3600 Supply (GWh) 2400 400 Traded (GWh) 200 100 Average price (USCkWh) 0.42 1.22
6. SAPP started as a cooperative pool in which members seek to maximize economic and system reliability benefits through trade, while retaining maximum autonomy for individual members. Currently there are two market mechanisms used in SAPP energy exchanges: medium-to-long term, bi-lateral power purchase agreements and the Short Term Energy Market (STEM) where daily, weekly and monthly contracts are actively traded. Evolution o f trading on the STEM since i t s inception in 2001 i s shown in the table.
% increase 414 -83 -50 190
7. In the longer term SAPP aims to facilitate the development o f a competitive electricity market in the SADC region and i s now preparing to move to a competitive pool arrangement. A key step was taken in February 2006 when membership was expanded to include private Generation and Transmission Companies. A study on the Development o f Transmission Pricing Policy for SAPP and Ancillary Services Market was completed in early 2007. A new SAPP Day-ahead Market (DAM) Trading Platform has been installed at the SAPP Coordination Center in Harare and market trials began in March 2007. An update o f the long-term Indicative Least-Cost Generation and Transmission Expansion Study for the Southern Africa Power Pool started in September 2006, and i s on track to be completed in October 2007”. This will provide an update on the Southern African Power Pool Investment Plan.
8. Kev challenges. One o f the immediate obstacles to expanding trade i s the inadequate network o f regional transmission infrastructure: three member countries are not yet connected to the regional power grid and several existing interconnections are overloaded or in need o f rehabilitation. Connection to the regional grid o f non-connected SAPP member power systems i s a priority in terms o f SAPP planning. In the 2006 SAPP Annual Report, the Mozambique-Malawi Inter-connector i s explicitly noted as a top priority for the Pool.
Malawi
9. Malawi i s one o f sub-Saharan Africa’s most densely populated countries with about 109 pe rsonsh ’ (total population about 12.9 million). The recent Malawi Poverty and Vulnerability Assessment (PVA) shows that the percentage o f the population living below the poverty l ine was around 52% in 2004/05. The per capita Gross National Income (GNI) was estimated at US$170 in 2006. Although the performance o f the economy was unsatisfactory between 2001 and 2004, recent efforts by the Government have led to improved macroeconomic management and placed Malawi on a path for faster economic growth. The growth in real Gross Domestic Product (GDP) which averaged 1.5% between 2001 and 2004, increased to an average o f around 5% between 2005 and 2006. As a result o f the good macroeconomic management and improved fiscal discipline, the country reached the HIPC completion
” T h i s study i s ESMAP-funded and jointly managed by the World Bank and SAPP Coordination Center.
27

point and benefited f rom cancellation o f most external debt, thereby releasing resources for pro-poor activities.
10. Ma law i power sector context. The Electricity Supply Corporation o f Ma law i (ESCOM) i s a vertically-integrated, government-owned electric utility with about 175,000 customers and an installed hydropower capacity o f 284MW18. About 6% o f the population has access to electricity. Peak demand in Malawi i s 250MW and demand i s expected to grow at about 5% annually over the next decade.
11. Currently E S C O M electricity supply cannot meet demand. This i s in part due to the fact that the Tedzani I and I1 plant with installed capacity o f 40MW had to be taken out o f service in December 2001 due to damage as a result o f flooding on the Shire River. In late-2005 E S C O M obtained contractor financing f rom Hydel Engineering and Construction Ltd to rehabilitate the plant. Completion o f the rehabilitation o f Tedzani I i s scheduled for late 2007 and for Tedzani I1 for early 2008. The load shedding situation will improve when the rehabilitation o f Tedzani I and I1 i s completed, but installed hydropower capacity will remain below peak demand. By 2010 new capacity will be needed to avoid off-peak shortages. By 2015 Ma law i will need to have in place an estimated additional 140MW o f available capacity compared to the current installed capacity to meet demand.
12. The Mozambique-Malawi Transmission Interconnector will make possible the import o f electricity to fill part o f the shortfall. Ma law i also plans to increase domestic power generation capacity through expansion o f the Kapichira Hydropower Station (“Kapichira 11”) o n the Shire River. Kapichira I1 would involve the installation o f two additional units o f 3 2 M W each, and i s planned to be o n l ine in 201 1. However f i n a n ~ i n g ’ ~ for this investment i s not yet in place, so the timing o f commissioning remains uncertain. Having the interconnector operational as early as possible will help mitigate the risk o f further power shortages associated with any delay in the Kapichira I1 project.
13. Kapichira hydroelectric Dower scheme. The Kapichira hydroelectric power plant i s located about 70km south-west o f Blantyre and i s the most recent and lowermost addition to the Shire River cascade group o f hydroelectric power plants. Commissioned in mid-2000 under phase I of the Kapichira Hydroelectric Power Scheme and with Wor ld Bank support under the Ma law i Power V Project, the existing power plant has a current total installed capacity o f 6 4 M W f rom two 3 2 M W units. All c i v i l works for Phase I1 associated with the headrace tunnel, intake structure, powerhouse and the tailrace were included under Phase I.
14. The proposed Phase I1 o f Kapichira Hydroelectric Power Scheme comprises the installation o f two Francis turbines coupled to two generators, each 3 2 M W capacity (for a total new capacity o f 64MW), step up transformers (each 36 MVA) for the generating units, auxiliary power station electromechanical equipment including PLC, S C A D A and control equipment, GIS switchyard and approximately 30km o f 132kV transmission l ine to Blantyre West substation, with the relevant substation equipment.
15. Phase I1 works will be largely electromechanical in nature, with minimal c iv i l works, since most o f the c iv i l works for the remaining two units were already undertaken in phase I. Works and facilities for Phase I1 would include access roads, camps and other support facilities, c i v i l works (in the power house spaces for units 3 and 4 since the primary concrete structure has already been provided under Phase I), turbines, governors and anciliary equipment, generators and auxiliary equipment, transformers,
l8 In addition to the hydropower stations, ESCOM owns 20MW o f thermal generation. Due to the high cost o f operation the thermal units are primarily used for emergency situations.
l 9 I t i s likely that development o f Kapichira I1 will be supported under a new World Bank-supported Malawi Energy Sector Project planned for FY09.
28
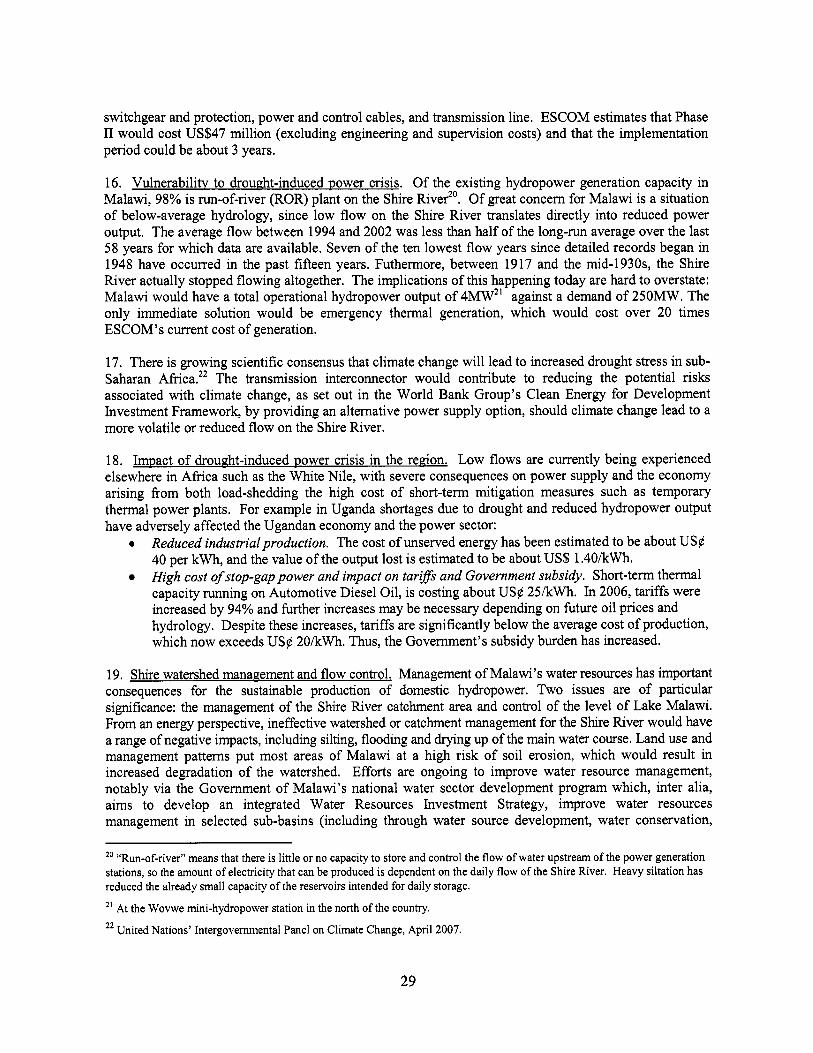
switchgear and protection, power and control cables, and transmission line. ESCOM estimates that Phase II would cost US$47 mill ion (excluding engineering and supervision costs) and that the implementation period could be about 3 years.
16. Vulnerabilitv to drought-induced power crisis. O f the existing hydropower generation capacity in Malawi, 98% i s run-of-river (ROR) plant on the Shire Rive?’. O f great concern for Malawi i s a situation o f below-average hydrology, since low flow on the Shire River translates directly into reduced power output. The average flow between 1994 and 2002 was less than half o f the long-run average over the last 58 years for which data are available. Seven o f the ten lowest f low years since detailed records began in 1948 have occurred in the past fifteen years. Futhermore, between 1917 and the mid-l930s, the Shire River actually stopped flowing altogether. The implications o f this happening today are hard to overstate: Malawi would have a total operational hydropower output o f 4MW” against a demand o f 250MW. The only immediate solution would be emergency thermal generation, which would cost over 20 times ESCOM’s current cost o f generation.
17. There i s growing scientific consensus that climate change will lead to increased drought stress in sub- Saharan Africa.” The transmission interconnector would contribute to reducing the potential r i sks associated with climate change, as set out in the World Bank Group’s Clean Energy for Development Investment Framework, by providing an alternative power supply option, should climate change lead to a more volatile or reduced flow on the Shire River.
18. Impact o f drought-induced power crisis in the rekon. L o w flows are currently being experienced elsewhere in Afkica such as the White Nile, with severe consequences on power supply and the economy arising from both load-shedding the high cost o f short-term mitigation measures such as temporary thermal power plants, For example in Uganda shortages due to drought and reduced hydropower output have adversely affected the Ugandan economy and the power sector:
e Reduced industrial production, The cost o f unserved energy has been estimated to be about U S # 40 per kWh, and the value o f the output lost i s estimated to be about US$ 1.40kWh. High cost of stop-gap power and impact on tariffs and Government subsidy. Short-term thermal capacity running on Automotive Diesel Oil, i s costing about US625kWh. In 2006, tariffs were increased by 94% and further increases may be necessary depending on future o i l prices and hydrology. Despite these increases, tar i f fs are significantly below the average cost o f production, which now exceeds U S # 20kWh. Thus, the Government’s subsidy burden has increased.
19. Shire watershed management and flow control. Management o f Malawi’s water resources has important consequences for the sustainable production o f domestic hydropower. Two issues are o f particular significance: the management o f the Shire River catchment area and control o f the level o f Lake Malawi. From an energy perspective, ineffective watershed or catchment management for the Shire River would have a range of negative impacts, including silting, flooding and drylng up o f the main water course. Land use and management patterns put most areas o f Malawi at a high risk o f soil erosion, which would result in increased degradation o f the watershed. Efforts are ongoing to improve water resource management, notably via the Government o f Malawi’s national water sector development program which, inter alia, aims to develop an integrated Water Resources Investment Strategy, improve water resources management in selected sub-basins (including through water source development, water conservation,
“Run-of-river” means that there i s little or no capacity to store and control the flow of water upstream of the power generation stations, so the amount of electricity that can be produced i s dependent on the daily flow o f the Shire River. Heavy siltation has reduced the already small capacity o f the reservoirs intended for daily storage.
At the Wovwe mini-hydropower station in the north of the country.
’2 United Nations’ Intergovernmental Panel on Climate Change, April 2007.
29

and erosion control) and enhance the relevant institutional and management mechanisms. The government’s program i s supported by the Second National Water Development Project (P096336, scheduled for presentation to the Board in mid-2007)
20. As noted earlier and in the economic analysis (see Annex 9), hydropower output i s highly dependent on the levels o f Lake Malawi. To enable active management o f the level o f the lake, a feasibility study was undertaken in 2003 to consider the utility o f a lake level control structure at Liwonde on the Shire River and a low-flow pumping scheme at the mouth o f the Shire River. The conclusion was that better lake level control can eliminate the risk o f the river going dry in all but the most severe drought sequences (less than once in a hundred years). The Second National Water Development Project will finance the engineering design for the level control structure at Liwonde, and a preliminary design for a low-flow pumping scheme at the mouth o f the Shire River, as well as associated independent environmental assessments. Additional financing for the level control structure may then be a possibility, after the necessary comprehensive design and environmental assessment and consultation processes have been completed.
2 1. Malawi ~ o w e r sector strategv. The essence o f Malawi’s strategy going forward i s to put in place measures to mitigate the consequences o f a severe drought, while at the same time ensuring that the cost o f power supply remains affordable to support a focused effort to increase access to, reliability and quality o f electricity supply.
22. Imports via the interconnector will provide an alternative source o f supply that i s independent o f the flow on the Shire River. This “diversity o f supply” represents Malawi’s best hedge against drought- induced power crisis. Accordingly, over the past three years ESCOM has explored the option o f a long term import contract. ESCOM i s in the final stages o f concluding an import agreement with Hidroelectrica Cahora Bassa in Mozambiquez3,
23. Even without a firm Power Import Agreement in place, the interconnector st i l l represents Malawi’s least-cost mitigation measure against drought-induced power crisis. Although the availability and pr ice o f opportunistic andor short-term supply are uncertain, were Malawi to experience a severe power shortage, there i s a high probability that Malawi would be able to secure imports at a cost significantly lower than supplying the same electricity from emergency thermal units.
24. ProPosed seauencing o f investments to meet demand, address drought risk and maximize benefits from generation assets. Key elements of Malawi’s strategy include (i) implementation o f the interconnection with SAPP by 2010 as the least-cost option for mitigating the risk o f drought-related power crisis, and to allow the option to import as needed and export electricity when availablez4, (ii) implementation o f the Kapichira I1 project by 201 1; (iii) by 2015, Malawi would need to have another increment o f 30 to 50MW on-line. Based on the Integrated Resource Plan for the Malawi Power sector completed in 2005, further imports are expected to be the least-cost option for this next increment o f supply.
23 Starting in 2003, ESCOM conducted an international, competitive bidding process to identify a supply source for electricity imports via the proposed interconnector. The b id from Hidroelectrica Cahora Bassa (HCB) was ranked top in the evaluation process.
24 In years o f average or good rainfall, during certain seasons and certain times o f day not al l the electricity that could be generated from installed capacity i s needed in Malawi. T h i s leads to “spilling”, i.e. energy that could be generated is not produced as there is no use for it. Interconnection with the SAPP would allow Malawi the opportunity to sell energy that would otherwise be spilled, into the SAPP Short Term Energy Market.
30

25. An additional benefit from early implementation o f the nterconnection i s that Malawi will be able to sel l energy that would otherwise be spilled, either into the SAPP Short Term Energy Market or under short term bilateral contracts with Mozambique or other SAPP members. Malawi would generate revenues from power export, and near-by countries in the SAPP (several o f which, including Mozambique, are projecting energy shortfalls in the 2010-2015 period) would benefit from importing from Malawi.
26. Malawi kev challenges in the Dower sector. A key challenge facing Malawi in implementing this plan i s the current relatively weak financial situation and commercial performance in the power sector. The Government together with ESCOM i s developing a Financial Sustainability Plan which will include elements o f improved efficiency and tariff adjustments as needed. The objective o f this plan i s to ensure that ESCOM i s in a position to implement the above strategy and meet its resulting financial commitments. Implementation o f the Financial Sustainability Plan will be a key factor in ESCOM’s ability to raise financing for the planned investments and to meet Malawi’s electric power requirements.
Mozambique
27. Between 1996 and 2005, following the end o f the war in 1992, the Mozambican economy grew at an annual rate o f 8 percent. The poverty headcount index has fallen from 69 percent in 1996/97 to 54 percent in 2002/03. GWcapita i s US%3lO/cap. Economic expansion has been made possible by overall macroeconomic stability, sound policy reforms, and continuing strong support from development partners.
28. Mozambiaue Dower sector context. Electricidade de Moqambique (EDM) i s a vertically-integrated, government-owned electric uti l i ty with an installed capacity o f 140MW hydropower (of which 86MW i s available) and 109MW in thermal power stations (of which 82MW i s available). Peak demand in Mozambique25 i s 350MW. EDM buys most o f i t s power supply (300MW) from Hidroelectrica Cahora Bassa, owner and operator o f the Cahora Bassa hydropower plant in Tete province26. Based on recent performance, Mozambique load growth i s projected at 8% in 2007, 7% annually from 2008 to 2010, and 5% thereafter. The Mozambique transmission grid i s currently interconnected with Zimbabwe, South Africa and Swaziland. About 8% o f the population has access to electricity.
29. Mozambiaue background on sector reform strategy. The approach to reform in the energy sector rests on two cornerstones: (i) Operationalizing a Strong, Independent Advisory Regulatory body, CNELEC, and (ii) an effective Performance Contract for EDM, publicly monitored by CNELEC. The Government has completed key steps in implementing the new reform program, demonstrating strong commitment: (i) In November 2005, the Board and Senior Management o f EDM was replaced, (ii) in August 2006 Minister o f Energy publicly issued instructions to CNELEC giving CNELEC the responsibility to monitor the EDM Performance Contract; (iii) In January 2007 the Government advertised for Expressions o f Interest for the CNELEC Commissioner positions. EDM, the Ministry o f Energy and the Ministry o f Finance have completed a final round o f discussions regarding the 3-year
25 Excluding Mozal Aluminum Smelter which imports power from South Africa.
26 Cahora Bassa on the Zambezi River, Tete Province operates as an Independent Power Producer. The installed capacity i s 2,075 MW. The bulk o f the generated electricity i s exported to RSA with a small amount to Zimbabwe. The Governments of Mozambique and Portugal reached agreement in 2006 for transfer of the majority of the ownership of the company from Government o f Portugal to Government of Mozambique. The initial payment and will complete the payments by December 2007.
31
EDM Performance Contract with monitorable results, and signature by these three parties i s anticipated by June 2007.
30. Mozambiaue Dower sector stratem. Mozambique’s strategy focuses on (i) rapid expansion o f access to electricity though grid intensification, grid extension and off-grid approaches, (ii) rehabilitation o f existing hydropower plants, and (iii) development o f new power generation through private sector and public-private partnerships. Mozambique i s actively pursuing development o f three large power generation projects for export to the SAPP (see below).
3 1. Because o f the significant potential for competitive generation for export, Mozambique’s strategy includes a focus on expanding opportunities for power trade. Key routes include the Mozambique- Malawi transmission interconnection, and a high voltage, high capacity transmission line from the Tete area, to Beira and Maputo, and continuing to South Africa. In the f i ture, the Mozambique-Malawi interconnection could be extended east across southern Malawi back into northern Mozambique. This further interconnection would significantly improve the quality, quantity and reliability o f supply to the north o f Mozambique, where demand for power i s growing rapidly. In 2004, the Governments o f Mozambique, Tanzania, Malawi and Zambia signed a MOU on the development o f the Mtwara Corridor along Mozambique’s northern border with Tanzania. One area intended to be facilitated by this cooperation i s the trading o f electricity between Mozambique and Tanzania. Extension o f the interconnector back into northern Mozambique i s a high priority for Mozambique from a domestic supply perspective as well as further enhancing the prospects for regional electricity trade.
32. Projected growth in Dower demand in Northern Mozambique. The recently-completed Electricity Master Plan indicates an annual growth in domestic demand (medium growth scenario) for northern region o f Mozambique o f 9%. T h i s high growth rate i s based on the opportunities for development o f the region including development o f the port at Nacala and development o f a variety o f mineral resources. For example, the Irish-based mining company, Kenmare Resources, has announced that mining and heavy mineral concentrate production has started at i t s Moma Titanium Minerals Mine in the northern Mozambican province o f Nampula. The mine contains one o f the largest deposits o f titanium-bearing mineral sands in the world. Power demand for this project alone i s projected at 50MW.
33. Mozambiaue kev challenges in the power sector. With projections for continued robust economic growth, a key challenge i s to ensure that affordable electricity supply i s available to meet the growing demand. In the near term this could involve EDM entering into expanded or new power purchase agreements, for example with HCB in Mozambique, Eskom South Afi ica andor ESCOM, Malawi (for off-peak). In the medium and long term, a key challenge in Mozambique’s energy sector will be realizing the potential for new power generation projects to meet domestic demand and for export to SAPP.
Opportunities for Mega-Power Generation projects in Mozambique.
34. Hydropower Potential in Mozambiaue. The hydropower potential in Mozambique has been recognized for many years and the Government has taken steps to assess the most promising options. The technical hydroelectric potential o f Mozambique i s estimated at 12,500MW corresponding to an average annual output o f 60,000GWh. The largest portion o f the potential i s located in the Zambezi River at sites such as Cahora Bassa, Mphanda Nkuwa, Cambwe Foz, Boroma and Lupata. So far, the only development o f this potential i s the Cahora Bassa South Bank Hydropower Project. T h i s power station, owned and operated by Hidroelectrica de Cahora Bassa (HCB) was commissioned in 1975 with an installed capacity o f 2,075MW o f which at least 1,455MW (equivalent to 12,746 G W y r ) are firm. The majority o f this energy i s exported to South Africa via two +/-533kV D C transmission l ines between Songo in Mozambique and Apollo in South Africa. The other buyers are Mozambique and Zimbabwe.
32

35. In 1999 Unidade Tecnica de Implementacao dos Projects Hidroelectricos (UTIP)” commissioned a comprehensive study o f hydropower development in the Zambezi River downstream o f Cahora Bassa. The study was executed in two phases. In the f i rst phase (March 1999 - July 2000) the most economically attractive sequence o f new developments in the Lower Zambezi was defined. Based on the resulting Project Definition Report (October 2000) the Government decided to proceed with a detailed study o f the top-ranking projects: Mphanda Nkuwa and Cahora Bassa North. During Phase 2 (October 2000 - March 2002) all the main aspects o f the two projects were addressed in detail: hydrology, geology, environmental and social impacts, civi l engineering, mechanical and electrical equipment, and economic and financial viability.
36. Mphanda Nkuwa (MN) Proiect. T h i s project ranks as one o f the f i rst projects to be implemented according to the least cost expansion plan o f SAPP. The installed capacity o f the Mphanda Nkuwa Hydropower Project (MN) in the first phase would be 1,300MW for mid-merit supply, with potential for an additional 1,000MW under a second phase. Upstream dams such as Cahora Bassa, Kariba (Zimbabwe/Zambia) and Kafue Gorge (Zambia) already regulate the flow o f the Zambezi River, so the MN project could be developed as a run-of-river project with only limited environmental impacts compared to i ts size. The feasibility study indicated that Mphanda Nkuwa and Cahora Bassa North projects are the two top-ranking options on the Zambezi River, and that from both an economic and financial point o f view, these projects are very attractive for Mozambique. The Government has established discussions with a group o f companies that intend to f o m a project company for the development o f Mphanda Nkuwa.
37. Moatize Coal Power Generation Proiect. A Brazilian company, CVRD, i s currently preparing a development plan for the Moatize mine based on export o f coking coal. As part o f the development plan a feasibility study was prepared to make use o f lower (non-export) grade coal for mine-mouth power generation. The feasibility study indicated a 1 , O O O M W capacity initially, with the potential to expand to 1,500MW as production from the mine grows.
38. In February 2007, the Ministry o f Energy, EDM and CVRD presented the project to potential sponsors at a “roadshow” in Europe. The Government i s in the process o f selecting a project sponsor and it i s anticipated that a sponsor will be in place before end-2007. Mining operations are planned to start in 2011. I t i s planned that the power generation project would be operational as soon as possible after mining commences.
39. Gas-Fired Power Generation Proiect at Temane. The Government intends to utilize domestic supplies o f natural gas for power generation. A feasibility study for a 400MW to 750MW power plant near the gas production facility in Temane has been prepared. The Government i s in the process o f selecting a project sponsor. It i s envisaged that this power plant would be operational by 2012.
27 UTIP i s a governmental body established in 1996 to safeguard the country’s interests in the Zambezi River hydropower potential and to manage i t s development.
33

Annex 2: Major Related Projects Financed by the Bank and/or Other Agencies
AFRICA Mozambique - Malawi Transmission Interconnection (Southern African Power Market Program APL-2)
Regional
World Bank Proiects
Regional Communications Infrastructure Project (RCIP). Currently under preparation and including both Malawi and Mozambique. The Development Objective i s to lower the cost o f international communications and extend the geographical reach o f broadband networks.
Proiects suuported bv other develoument finance institutions Norway, through support to SADC and development cooperation in the energy sector in southern Africa, i s providing support for harmonization o f national and regional energy policies, promoting the development o f physical infrastructure, and supporting integrated management o f trans-boundary energy resources for regional integration and development. A main goal i s to improve the infrastructure and management o f the energy sector to promote a positive social and economic development.
0
Malawi
World Bank projects
0 Malawi Infrastructure Service Project (US$40 million). Approved in 2006, closing in 2011, current rating: Satisfactory. The development objective o f the project i s to improve household welfare and strengthen economic growth in market centers and surrounding rural areas through the provision o f core infrastructure services. The project includes support for electrification and I C T services in selected market centers.
Malawi Privatization and Ut i l i t ies Reform Project (US$28.9 million). Approved in 2000, closing in December 2007, current rating: Satisfactory. The revised Project Development Objective (PDO) i s to enhance the climate for private investment by reducing the state’s direct participation in the business sector. The project supports establishment o f a new Malawi Energy Regulatory Agency.
Projects supported by other develoument finance institutions 0 Malawi Rural Electrification Program (MAREPeJapan International Cooperation Agency
(JICA). MAREP aims at increasing access to electricity in rural areas for rural transformation and development. The project covers the entire country and the Japanese Government i s providing technical assistance and procurement o f materials.
Barrier Removal to Renewable Energy Project (BARREMCUnited Nations Development Programme (UNDP)/Global Environmental Facility (GEF). BARREM aims at providing alternative energy supplies for the power requirements for rural areas. BARREM involves the following activities across Malawi: (i) institutional strengthening and capacity-building, (ii) creation o f an enabling environment for the promotion o f renewable energy technologies (RETS) in the country; and (iii) establishment o f RET demonstration centers. UNDP i s providing MK 69 mil l ion (US$96,000) to support activities o f the project during FY 2006/07.
Program for Biomass Energy Conservation (ProBec)-EU grant as part o f the SADC Portfolio. ProBEC works within the framework o f alternative energies aimed at managing energy-related environmental impacts.
0
34
0 Lilongwe-Salima Transmission Line-Nordic Development Fund Loan to ESCOM. The project financed the construction o f a 132 kV line between Lilongwe and Salima. The construction of the line was completed in 2006.
Nkula B to Lilongwe B Transmission line-Development Bank o f South Africa co-financed this project with ESCOM. The project, completed late 2006, funded the installation o f a second circuit between the two sub-stations.
0
Mozambique World Bank projects
0 Energy Reform and Access Project (FY04). Closing in December 2007. Rating: Unsatisfactory. Currently under restructuring, which will include extension o f the closing date by 24 months.
Communications Sector Reform Project. Closing in December 2007. Rating: Satisfactory. The project objective i s to improve access and quality o f efficient and affordable communications services by creating an enabling environment for competition and private participation in key sectors deemed critical to facilitate national and regional market integration, i.e. telecommunications, postal and air transport infrastructure and services.
Economic and Sector Work on Rural Communications. Closed. A study to do an assessment of Communications Infrastructure and services in the districts: current status and potential for development. The study i s entitled: “Connecting the Districts, Connecting the Nation”
0
0
Proiects supported by other development finance institutions
0 Mozambique Energy Sector Program Support-Danish International Development Agency (DANIDA). The project focuses on rural electrification.
African Development Bank support in Mozambique. Mozambique Rural Electrification Project (ELECT 111), Mozambique Energy Reform and Access Program (ERAP), Mozambique Electricity IV Project, Mozambique Electricity V Project. These projects provide support to EDM for investment and training and to the Ministry o f Energy for capacity building and studies.
Swedish and Norwegian Support to EDM. Sweden provides support to EDM through SIDA. SIDA’s current support to EDM includes: (i) a Rural Electrification project in Sofala, Manica, and Tete (co-financed with Norway), to be completed end-2008; (ii) Rural Electrification, Niassa province, preparation o f the tender documents i s underway. The development objective o f these investment projects i s to stimulate economic development and to improve the conditions in schools and health facilities; (iii) Technical Assistance to EDM (2003-2007) to improve the capacity o f EDM staff within the areas o f business development, power economics, network system planning and legal services. Future SIDA support i s expected to include a rural electrification package o f 10 projects, to be co-financed with Norway, and firther technical assistance to EDM.
0
0
35
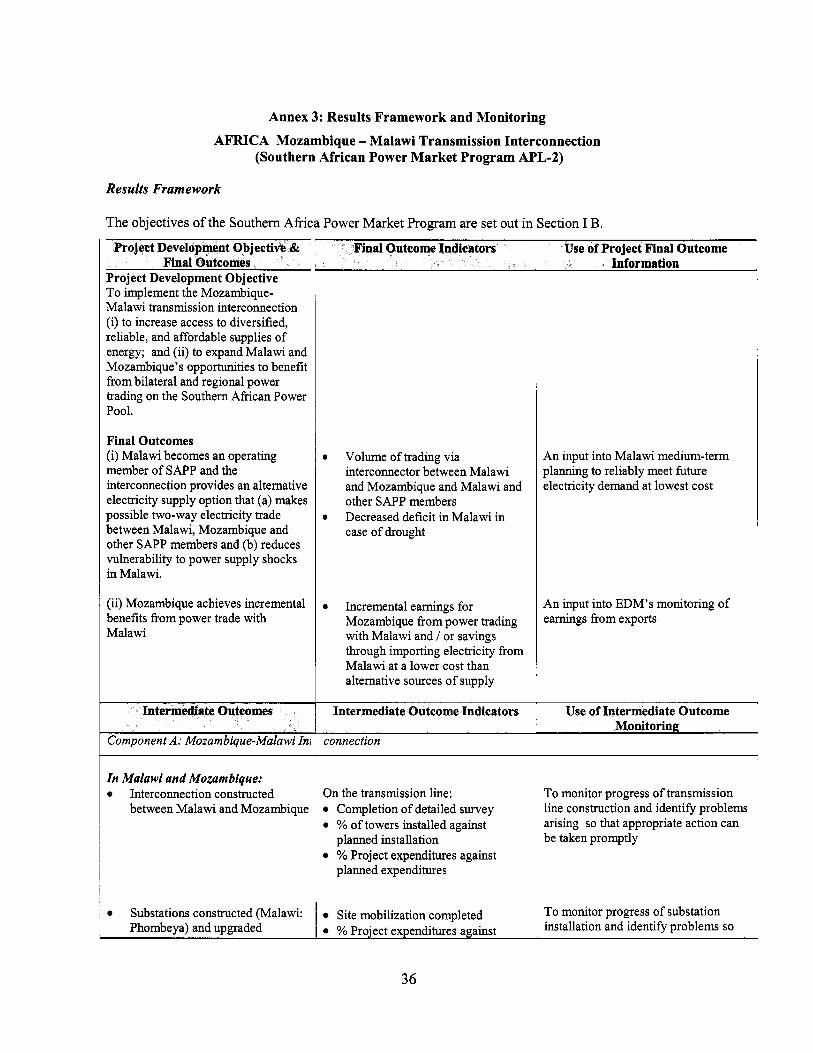
Annex 3: Results Framework and Monitoring
AFRICA Mozambique - Malawi Transmission Interconnection (Southern African Power Market Program APL-2)
Substations constructed (Malawi: Phombeya) and upgraded
Results Framework
Site mobilization completed % Project expenditures against
To monitor progress o f substation installation and identify problems so
The objectives o f the Southern A f r i ca Power Marke t Program are set out in Section I B.
Project Development Objective To implement the Mozambique- Malawi transmission interconnection (i) to increase access to diversified, reliable, and affordable supplies o f energy; and (ii) to expand Malawi and Mozambique’s opportunities to benefit from bilateral and regional power trading on the Southern African Power Pool.
Final Outcomes (i) Malawi becomes an operating member o f SAPP and the interconnection provides an alternative electricity supply option that (a) makes possible two-way electricity trade between Malawi, Mozambique and other SAPP members and (b) reduces vulnerability to power supply shocks in Malawi.
(ii) Mozambique achieves incremental benefits from power trade with Malawi
Intermediate Outcomes
Component A: Mozambique-Malawi In,
Final Outcome Indicators
Volume o f trading via interconnector between Malawi and Mozambique and Malawi and other SAPP members Decreased deficit in Malawi in case o f drought
Incremental earnings for Mozambique from power trading with Malawi and I or savings through importing electricity from Malawi at a lower cost than alternative sources of supply
Intermediate Outcome Indicators
connection
Use of Project Final Outcome Information
An input into Malawi medium-term planning to reliably meet future electricity demand at lowest cost
An input into EDM’s monitoring of earnings from exports
Use of Intermediate Outcome Monitoring
I n Malawi and Mozambique: Interconnection constructed between Malawi and Mozambique
On the transmission line: Completion o f detailed survey % o f towers installed against
% Project expenditures against planned installation
planned expenditures
To monitor progress of transmission l i ne construction and identify p rob lem arising so that appropriate action can be taken promptly
36
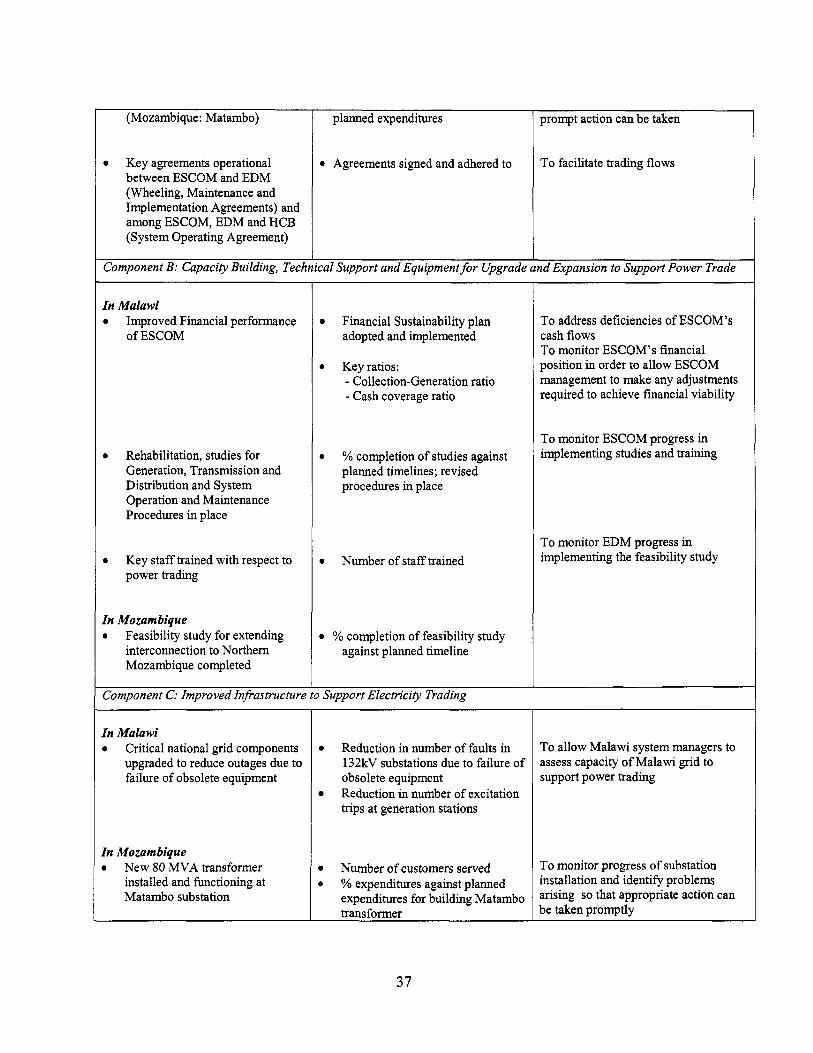
(Mozambique: Matambo)
0 Key agreements operational between ESCOM and EDM (Wheeling, Maintenance and Implementation Agreements) and among ESCOM, EDM and H C B (System Operating Agreement)
planned expenditures
0 Agreements signed and adhered to
prompt action can be taken
To facilitate trading flows
Component B: Capacity Building, Technical Support and Equipment for Upgrade and Expansion to Support Power Trade
I n Malawi Improved Financial performance o f ESCOM
Rehabilitation, studies for Generation, Transmission and Distribution and System Operation and Maintenance Procedures in place
Key staff trained with respect to power trading
Financial Sustainability plan adopted and implemented
0 Keyratios: - Collection-Generation ratio - Cash coverage ratio
0 % completion o f studies against planned timelines; revised procedures in place
0 Number o f staff trained
0 % completion o f feasibility study against planned timeline
I n Mozambique 0 Feasibility study for extending
interconnection to Northern Mozambique completed
Component C: Improved Infiastructure to Support Electricity Trading
I n Malawi 0 Critical national grid components
upgraded to reduce outages due to failure o f obsolete equipment
I n Mozambique 0 New 80 MVA transformer
installed and functioning at Matambo substation
0 Reduction in number o f faults in 132kV substations due to failure o f obsolete equipment Reduction in number o f excitation trips at generation stations
0 Number o f customers served 0 % expenditures against planned
expenditures for building Matambo transformer
To address deficiencies o f ESCOM’s cash flows To monitor ESCOM’s financial position in order to allow ESCOM management to make any adjustments required to achieve financial viability
To monitor ESCOM progress in implementing studies and training
To monitor EDM progress in implementing the feasibility study
To allow Malawi system managers to assess capacity o f Malawi grid to support power trading
To monitor progress o f substation installation and identify problems arising so that appropriate action can be taken promptly
37

I
-l > N
n n
3 0 e4
9\ 0 0 c'1
00 0 0 e4
I- O 0 N
. u
3 3
0 r)
0 3 0 3

5
J a
+
LL
2 la
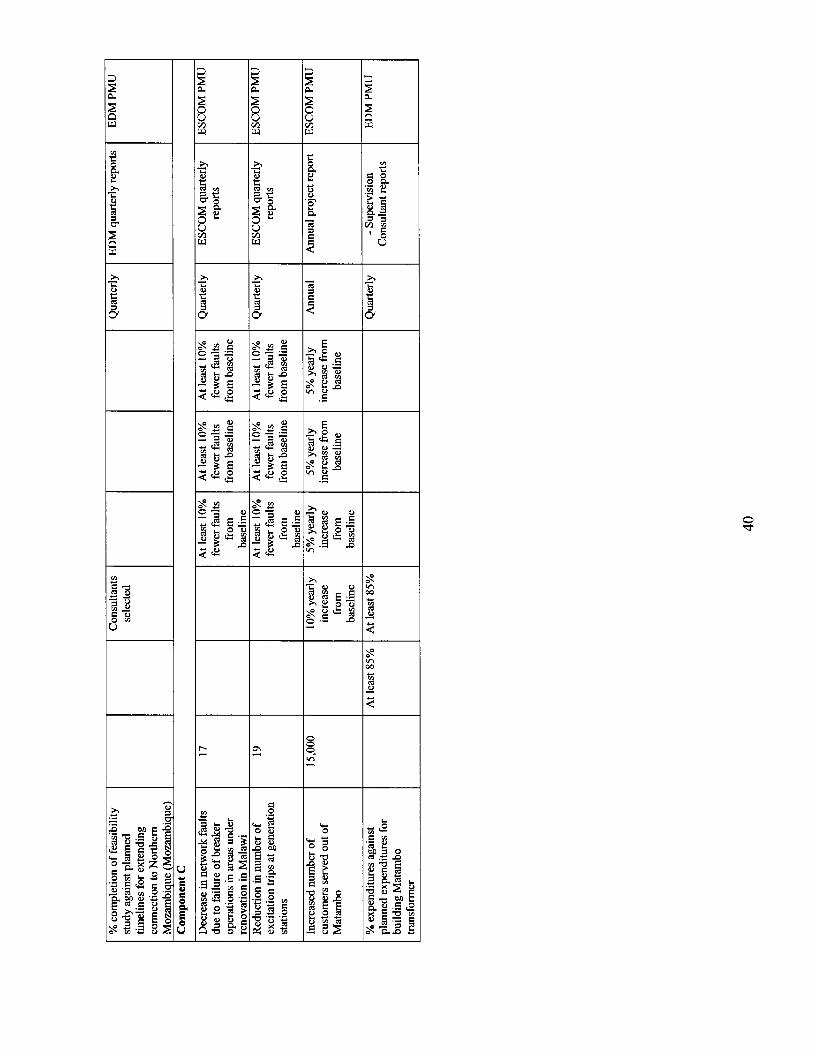
E s
0 d

Annex 4: Detailed Project Description
AFRICA Mozambique - Malawi Transmission Interconnection (Southern African Power Market Program APL-2)
1. APL-2, will be financed by two IDA Credits, one to the Government o f Malawi and one to the Government o f Mozambique. These credits will be on-lent to the respective electric power utilities: ESCOM and EDM, which would be the implementing agencies.
2. The project will consist o f three components: (A) Mozambique- Malawi Interconnection; (B) Capacity Building and Technical Support for Upgrade and Expansion to Support Power Trading; and (C) Improved Infrastructure to support Electricity Trading.
COMPONENT A: Mozambiaue-Malawi Interconnection
3. For this component the estimated costs for Malawi and Mozambique shares are respectively US$47.1 mil l ion and US$43.5 million.
4. This component will cover an approximately 2 10 km-long transmission interconnection between the electricity grid systems o f Malawi and Mozambique. This link would also jo in Malawi to the Southern Africa Power Pool (SAPP) and help it reap the benefits o f being part o f a large, interconnected grid. Based on the detailed feasibility analysis by the consultants, it has been established that the interconnection would be through a double circuit 220 kV twin bundle conductor line emanating from existing Matambo substation in Mozambique, which receives energy from the Hidroelectrica de Cahora Bassa (HCB). Extension o f the existing Matambo substation in Tete Province would be included. A new 220 kV substation would be built at Phombeya, in Balaka District in Malawi, to connect this transmission link with the ESCOM, Malawi grid. The component also covers development and implementation o f a Resettlement Action Plan, as per the Resettlement Policy Framework, once the exact route i s determined, associated studies, works, engineering and project management support to complete the interconnection, and investments for better operation and maintenance o f this critical link.
5. The feasibility for this interconnection was studied by an international consultant in 2005. The study was reviewed by EDM, ESCOM and subsequently by the World Bank team. Considering the length for interconnection, three main alternatives were considered for this interconnection - i) Single Circuit 400 kV; ii) Single circuit 220 kV; and iii) double circuit 220 kV. Though the alternative with double circuit 220 kV line was more expensive, it was the only alternative which could meet the network stability requirement for such long interconnection between the grid systems o f Malawi and northern Mozambique which are both relatively vulnerable to system-wide black- out. The other alternatives would have caused instability and black-outs in the two systems, in case o f sudden tripping o f the line due to faults. The cost o f black-outs would have been much higher than the savings in capital cost with other alternatives.
Alternatives Studied:
6. Subsequently, several optimization options were analyzed for the selected alternative o f double circuit 220 kV line, such as conductor configuration o f single conductor vs. twin bundle, type o f tower supports and building the l ine initially with single circuit and subsequently stinging the second circuit, when the power flow on the line reaches higher level. However, the final selection - stringing the double circuit immediately - was done considering the possible role o f this line as part o f SAPP system and the likely use o f this link as an import and export link for both countries. The selected configuration o f the line, as detailed below also provides the advantage o f maximizing the utilization the right o f way corridor.
41

7. The selected configuration o f the line i s a double circuit 220 kV line to transfer about 300 MW o f power through a double circuit line with twin bundle (2*431 mm2 ‘BISON’) conductor in each phase. Se l f supporting steel lattice towers are proposed. The line would carry in one o f i t s conductors an optical fiber (OPGW) link for the control and protection o f the transmission interconnection. The OPGW would have spare capacity, which could be used for voice and data transfer between the two countries. The l ine would pass through a distance o f about 134 km in Mozambique, as per the initial survey, including the river crossing at Zambezi River and then about 76 km in Malawi territory.
8. The associated works for the l ine included in the project are environment and social studies and environmental management plans, preliminary and detailed survey for the route and alignment, engineering, support for procurement, contracting and supervision and the project management during implementation. The costs o f resettlement and compensation, license costs, Right o f Way costs and normal operations o f the Project Management units will be borne by the utilities.
9. The associated work for the substations comprise of: i) Extension o f the existing 220 kV Matambo substation, in Tete region o f Mozambique, to
provide for connecting the two circuits o f the 220 kV line and associated compensation equipment, as well as the work to provide necessary SCADA interconnection and other necessary activities. A new 220 kV substation at Phombeya, in Balaka District o f Malawi, to receive and transform the electrical power to 132 kV Voltage for connecting to ESCOM, Malawi’s grid.
ii)
10. The component envisages hnding o f hotline maintenance equipment for both the utilities and procurement o f emergency restoration system3’ for Malawi, to handle any tower outage contingency. The procurement o f this equipment and training for the utilities’ staff would help to ensure a high availability o f the critical link and reduce the down time o f the link in case o f a fault.
11. Fiber-optic link to be managed on an open access basis. The Malawi-Mozambique interconnector would include a fiber-optic links to be used for data transmission (Le. telecommunication) purposes. This fiber i s primarily planned to cover ESCOM’s and EDM’s needs, but the spare capacity would also be used for commercial telecommunication services: i.e. the fiber link would be used to carry cross-border telecommunication traffic and operators and ISPs in both countries would be able to buy capacity on it. Arrangements would be needed for capacity to be accessible on an ‘open access’ basis to operators and ISPs in both countries (Le. any operator should be able to access capacity at reasonable and non- discriminatory terms). Assistance in this area would be provided under the planned World Bank- supported Regional Communications Infrastructure Project. This would also ensure that capacity prices are kept at a reasonable level, and that profitability would be maximized following a high volume, l ow margin strategy3’.
Specific Activities Under the Proiect
30 Emergency Restoration System consists o f light weight structures, which can be assembled quickly at site to temporarily restore power supply during failure o f one or more support towers of transmission lines, during natural calamities ( earth quake, storm, etc.) or due to vandalism.
3’ ESCOM and EDM’s core business i s not telecommunications, and therefore fiber-optic rollout i s a byproduct o f the buildout of transmission lines. Experience from other countries shows that management o f a fiber optic network will likely require an understanding of the business models and practices in the Telecommunications sector. For example, unless properly structured and priced, there i s a risk that the fiber infrastructure remains underutilized. The World Bank would work with both companies and potentially with other telecommunication operators in each country to provide technical assistance to determine an efficient arrangement to ensure open access to capacity. Funding for these activities would be provided through ongoing dialogue and activities under the ICT sector policy dialogue.
42
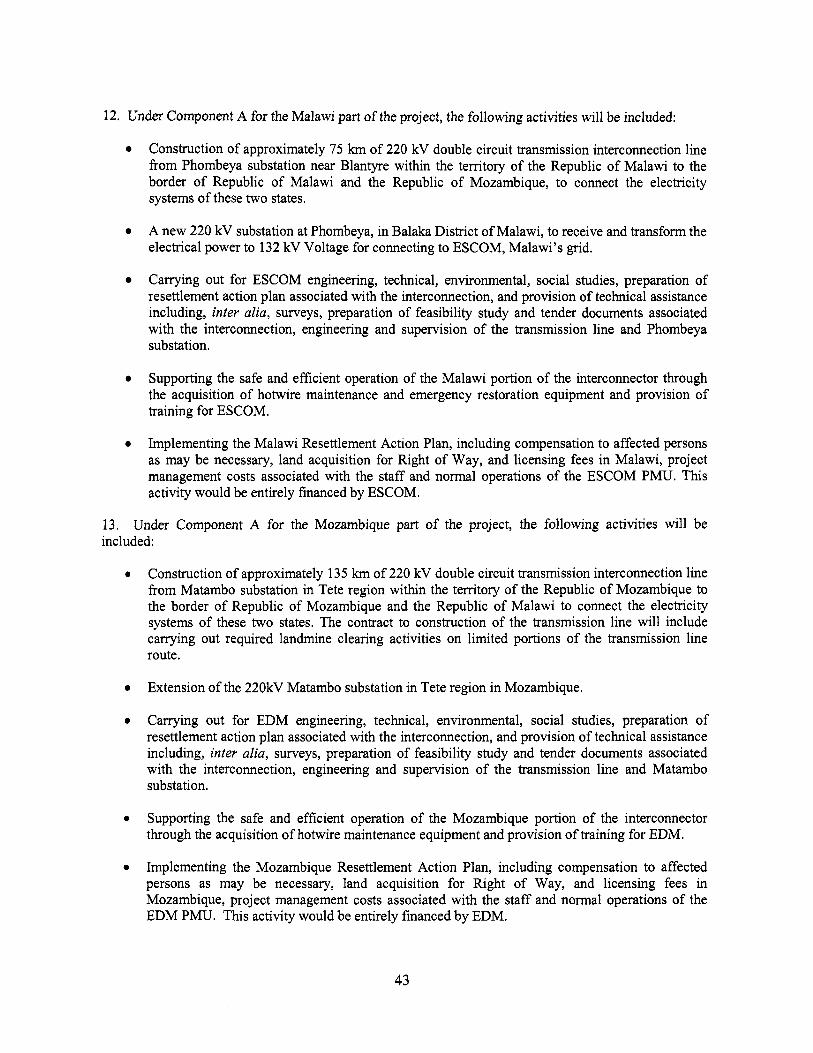
12. Under Component A for the Malawi part o f the project, the following activities will be included:
Construction o f approximately 75 km o f 220 kV double circuit transmission interconnection line from Phombeya substation near Blantyre within the territory o f the Republic o f Malawi to the border o f Republic o f Malawi and the Republic o f Mozambique, to connect the electricity systems of these two states.
A new 220 kV substation at Phombeya, in Balaka District o f Malawi, to receive and transform the electrical power to 132 kV Voltage for connecting to ESCOM, Malawi’s grid.
Carrying out for ESCOM engineering, technical, environmental, social studies, preparation o f resettlement action plan associated with the interconnection, and provision o f technical assistance including, inter alia, surveys, preparation o f feasibility study and tender documents associated with the interconnection, engineering and supervision o f the transmission line and Phombeya substation.
Supporting the safe and efficient operation o f the Malawi portion o f the interconnector through the acquisition o f hotwire maintenance and emergency restoration equipment and provision o f training for ESCOM.
Implementing the Malawi Resettlement Action Plan, including compensation to affected persons as may be necessary, land acquisition for Right o f Way, and licensing fees in Malawi, project management costs associated with the staff and normal operations o f the ESCOM PMU. T h i s activity would be entirely financed by ESCOM.
13. Under Component A for the Mozambique part o f the project, the following activities will be included:
Construction o f approximately 135 km o f 220 kV double circuit transmission interconnection line from Matambo substation in Tete region within the territory o f the Republic o f Mozambique to the border o f Republic o f Mozambique and the Republic o f Malawi to connect the electricity systems o f these two states. The contract to construction o f the transmission l ine will include carrying out required landmine clearing activities on limited portions o f the transmission line route.
Extension o f the 220kV Matambo substation in Tete region in Mozambique.
Carrying out for EDM engineering, technical, environmental, social studies, preparation o f resettlement action plan associated with the interconnection, and provision o f technical assistance including, inter alia, surveys, preparation o f feasibility study and tender documents associated with the interconnection, engineering and supervision o f the transmission line and Matambo substation.
Supporting the safe and efficient operation o f the Mozambique portion o f the interconnector through the acquisition o f hotwire maintenance equipment and provision o f training for EDM.
Implementing the Mozambique Resettlement Action Plan, including compensation to affected persons as may be necessary, land acquisition for Right o f Way, and licensing fees in Mozambique, project management costs associated with the staff and normal operations o f the EDM PMU. This activity would be entirely financed by EDM.
43
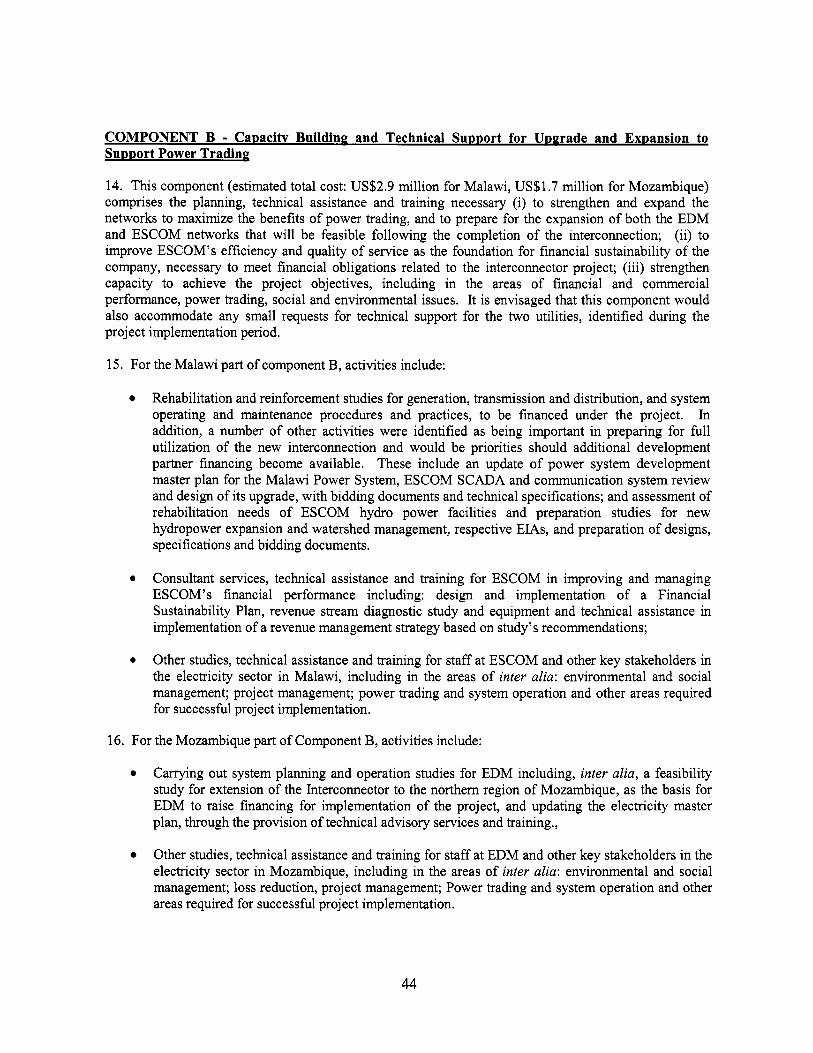
COMPONENT B - Capacitv Building and Technical Support for Upprade and Expansion to Support Power Trading
14. This component (estimated total cost: US$2.9 mill ion for Malawi, US$1.7 mil l ion for Mozambique) comprises the planning, technical assistance and training necessary (i) to strengthen and expand the networks to maximize the benefits o f power trading, and to prepare for the expansion o f both the EDM and ESCOM networks that will be feasible following the completion o f the interconnection; (ii) to improve ESCOM’s efficiency and quality o f service as the foundation for financial sustainability o f the company, necessary to meet financial obligations related to the interconnector project; (iii) strengthen capacity to achieve the project objectives, including in the areas o f financial and commercial performance, power trading, social and environmental issues. I t i s envisaged that this component would also accommodate any small requests for technical support for the two utilities, identified during the project implementation period.
15. For the Malawi part o f component By activities include:
Rehabilitation and reinforcement studies for generation, transmission and distribution, and system operating and maintenance procedures and practices, to be financed under the project. In addition, a number o f other activities were identified as being important in preparing for full utilization o f the new interconnection and would be priorities should additional development partner financing become available. These include an update o f power system development master plan for the Malawi Power System, ESCOM SCADA and communication system review and design of i t s upgrade, with bidding documents and technical specifications; and assessment o f rehabilitation needs o f ESCOM hydro power facilities and preparation studies for new hydropower expansion and watershed management, respective EMS, and preparation o f designs, specifications and bidding documents.
0 Consultant services, technical assistance and training for ESCOM in improving and managing ESCOM’ s financial performance including: design and implementation o f a Financial Sustainability Plan, revenue stream diagnostic study and equipment and technical assistance in implementation o f a revenue management strategy based on study’s recommendations;
0 Other studies, technical assistance and training for staff at ESCOM and other key stakeholders in the electricity sector in Malawi, including in the areas o f inter alia: environmental and social management; project management; power trading and system operation and other areas required for successful project implementation.
16. For the Mozambique part o f Component By activities include:
Carrying out system planning and operation studies for EDM including, inter alia, a feasibility study for extension o f the Interconnector to the northern region o f Mozambique, as the basis for EDM to raise financing for implementation o f the project, and updating the electricity master plan, through the provision o f technical advisory services and training.,
Other studies, technical assistance and training for staff at EDM and other key stakeholders in the electricity sector in Mozambique, including in the areas o f inter alia: environmental and social management; loss reduction, project management; Power trading and system operation and other areas required for successful project implementation.
44

COMPONENT C - Imuroved Infrastructure to Suuuort Electricity Trading
17. T h i s component (estimated total cost: US$9.9 mill ion for Malawi, U S 4 . 6 mil l ion for Mozambique) comprises investments necessary to address critical bottlenecks in the transmission and distribution systems which could impede the flow o f traded electricity. This component will fund limited, urgent rehabilitation and reinforcement o f the Malawi and northern Mozambique grids, required to support electricity trading.
18. For Component C o f the Malawi part o f the project, activities include:
Supporting urgent rehabilitation and reinforcement o f ESCOM’s power generation, transmission and distribution network to facilitate electricity trading, including inter alia: replacement o f worn-out or obsolete digital excitation equipment, worn-out circuit breakers and other switchgear, control and protection equipment, and some critical communication links between important load centers and generating stations and the national control centre for better system operation control and assessing the flow. Further urgent rehabilitation activities to facilitate power exchange through the interconnector may be identified as a result o f the studies to be undertaken in Component B activities, for example completion o f critical missing overhead optical fibre links on existing transmission lines to get data for critical generating stations and load centers at control centers; associated communication equipment and OPGW splitters etc.; telephone exchanges; replacement o f overloaded distribution transformers with larger capacity at the same location, replacement o f small-sized conductor with bigger conductor on same the poles. T h i s component would also finance key investment in support o f the revenue improvement activities, as per recommendations in the revenue diagnostic study, such as provision o f meters.
19. For Component C o f the Mozambique part o f the project, activites include:
Supporting rehabilitation and reinforcement o f power transmission to facilitate electricity trading, including the provision o f a new 220/66/33 kV power transformer at the existing Matambo substation in the Tete region; connecting the new transformer to the 66 kV and 33 kV systems, and associated civi l works, control and protection work at the substation. The power supply to the industrially-growing area o f Tete i s o f poor quality and reliability. The supply problem was aggravated with the damage due to f ire o f the 220/66/33 kV power transformer at Matambo substation, which had been the main source o f power supply to these areas. In a situation where EDM imports power from Malawi, this strengthening o f the Matambo transformer capacity will be critical in ensuring that the traded electricity reaches customers in northern Mozambique.
45
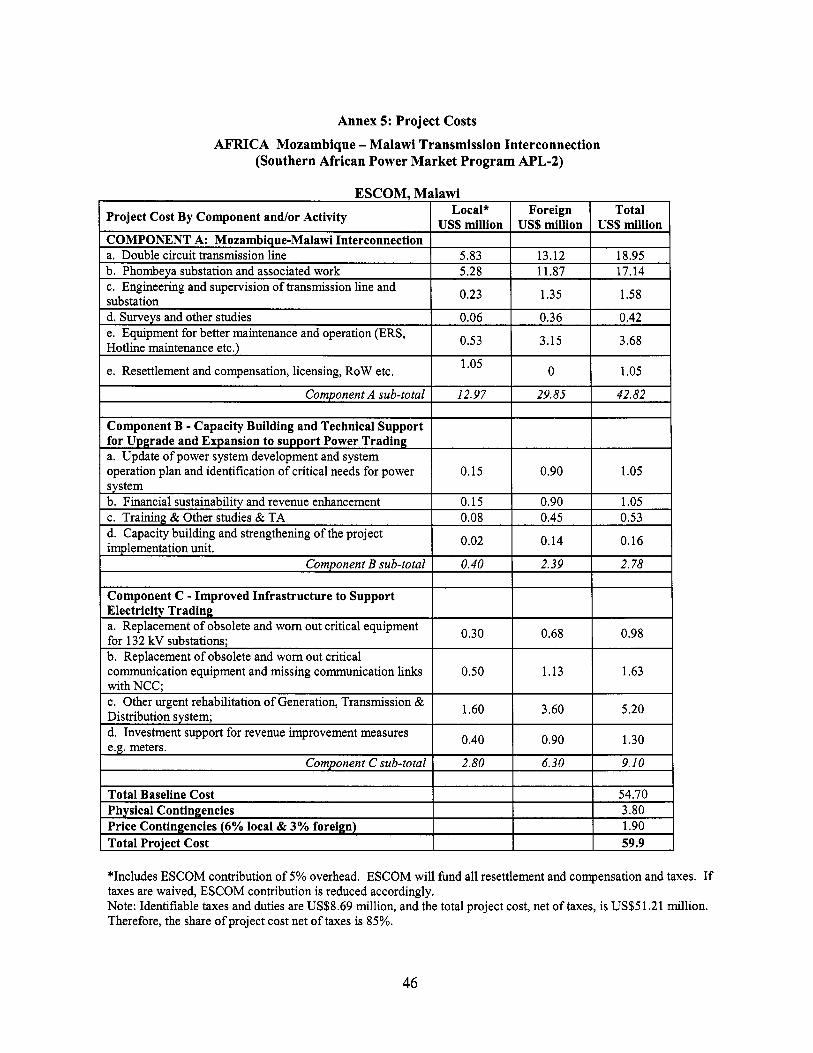
Annex 5: Project Costs
AFRICA Mozambique - Malawi Transmission Interconnection (Southern African Power Market Program APL-2)
Project Cost By Component and/or Activity
COMPONENT A: Mozambique-Malawi Interconnection a. Double circuit transmission l ine b. Phombeya substation and associated work c. Engineering and supervision o f transmission l ine and substation d. Surveys and other studies e. Equipment for better maintenance and operation (ERS, Hotline maintenance etc.)
e. Resettlement and compensation, licensing, ROW etc.
Component A sub-total
Local* US$ million
5.83 5.28
0.23
0.06
0.53
1.05
12.97
Foreign US$ million
13.12 11.87
1.35
0.36
3.15
0
29.85
I 1.60 c. Other urgent rehabilitation o f Generation, Transmission & Distribution svstem:
Total US$ million
18.95 17.14
1.58
0.42
3.68
1.05
42.82
I 0.40 d. Investment support for revenue improvement measures e.e. meters.
Component B - Capacity Building and Technical Support for Upgrade and Expansion to support Power Trading a. Update o f power system development and system operation plan and identification o f critical needs for power system b. Financial sustainability and revenue enhancement c. Training & Other studies & TA d. Capacity building and strengthening o f the project implementation unit.
Component B sub-total
Component C - Improved Infrastructure to Support Electricity Trading a. Replacement o f obsolete and worn out critical equipment for 132 kV substations; b. Replacement o f obsolete and worn out critical communication equipment and missing communication l i n k s with NCC:
0.15
0.15 0.08
0.02
0.40
0.30
0.50
0.90
0.90 0.45
0.14
2.39
1.13 I 1.63
1.05
1.05 0.53
0.16
2.78
3.60 1 5.20
54.70 =E 59.9
*Includes ESCOM contribution o f 5% overhead. ESCOM w i l l fund al l resettlement and compensation and taxes. I f taxes are waived, ESCOM contribution i s reduced accordingly. Note: Identifiable taxes and duties are US$8.69 million, and the total project cost, net o f taxes, i s US$5 1.21 million. Therefore, the share o f project cost net o f taxes i s 85%.
46

EDM, Mozambique
0.23
0.06
Project Cost B y Component and/or Activity
1.40 1.63
0.37 0.43
COMPONENT A: Mozambique-Malawi Interconnection a. Double circuit transmission line b. Matambo substation exDansion
0.15
c. Engineering and supervision o f transmission l ine and substation
0.90 1.05
d. Surveys and other studies e. Equipment for better maintenance and operation (Hotline maintenance etc.) e. Resettlement and compensation, licensing, ROW etc.
Component A sub-total
0.24
Component B - Capacity Building and Technical Support
1.44 1.68
for Upgrade and Expansion to support Power Trading a. Feasibility study for extension o f Matambo-Phombeya line to Nampula and update o f Power system development plan b Capacity building and strengthening o f the project implementation unit c. Training & Other TA & studies (Environmental, loss reduction study, project audit, etc.)
Component B sub-total
Component C - Improved Infrastructure to Support _ _ Electricity Trading a. New 220166133 kV Power Transformer at Matambo substation.
Comvonent C sub-total
Total Baseline Cost Physical Contingencies Price Contingencies (6% local & 3% foreign) Total Project Cost
Local* Foreign Total
22.54
0.23 1 l f 5 1 1.58
0.64 0.64 10.98 28.36 39.34
0.02 1 0.14 I 0.16
0.07 I 0.41 I 0.47
I
I I
45.13
1.58 49.81
*Includes EDM contribution o f 5% overhead. EDM will fund al l resettlement and compensation. Note: Identifiable taxes and duties are US$6.27 million, and the total project cost, net o f taxes, i s US$43.55 million. Therefore, the share of project cost net o f taxes i s 87%. Note that in accordance with the Mozambique Country Financing Parameters, IDA financing i s covering a portion o f the taxes for th is project. Hence, the total IDA financing amount slightly exceeds the total project cost net o f taxes.
47
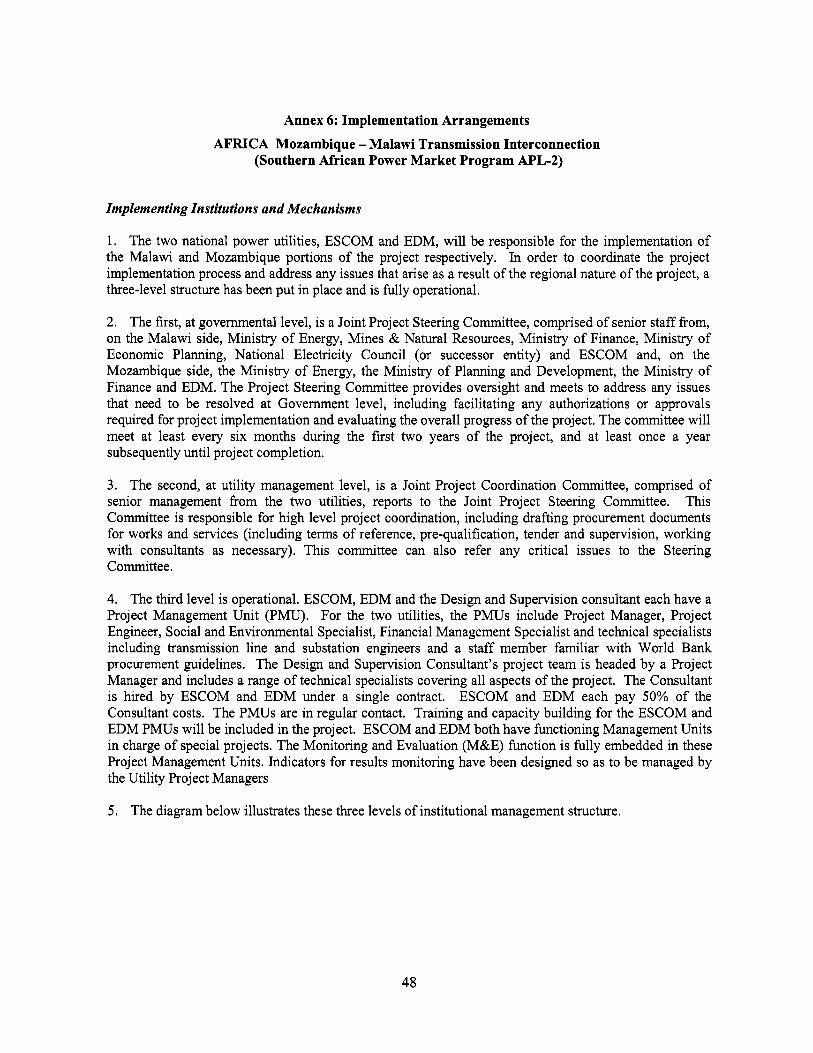
Annex 6: Implementation Arrangements
AFRICA Mozambique - Malawi Transmission Interconnection (Southern African Power Market Program APL-2)
Implementing Institutions and Mechanisms
1. The two national power utilities, ESCOM and EDM, will be responsible for the implementation o f the Malawi and Mozambique portions o f the project respectively. In order to coordinate the project implementation process and address any issues that arise as a result o f the regional nature o f the project, a three-level structure has been put in place and i s fully operational.
2. The first, at governmental level, i s a Joint Project Steering Committee, comprised o f senior staff from, on the Malawi side, Ministry o f Energy, Mines & Natural Resources, Ministry o f Finance, Ministry o f Economic Planning, National Electricity Council (or successor entity) and ESCOM and, on the Mozambique side, the Ministry o f Energy, the Ministry o f Planning and Development, the Ministry o f Finance and EDM. The Project Steering Committee provides oversight and meets to address any issues that need to be resolved at Government level, including facilitating any authorizations or approvals required for project implementation and evaluating the overall progress o f the project. The committee will meet at least every six months during the f i rst two years o f the project, and at least once a year subsequently until project completion.
3. The second, at utility management level, i s a Joint Project Coordination Committee, comprised o f senior management from the two utilities, reports to the Joint Project Steering Committee. This Committee i s responsible for high level project coordination, including drafting procurement documents for works and services (including terms o f reference, pre-qualification, tender and supervision, working with consultants as necessary). This committee can also refer any critical issues to the Steering Committee.
4. The third level i s operational. ESCOM, EDM and the Design and Supervision consultant each have a Project Management Unit (PMU). For the two utilities, the PMUs include Project Manager, Project Engineer, Social and Environmental Specialist, Financial Management Specialist and technical specialists including transmission line and substation engineers and a staff member familiar with World Bank procurement guidelines. The Design and Supervision Consultant’s project team i s headed by a Project Manager and includes a range o f technical specialists covering all aspects o f the project. The Consultant i s hired by ESCOM and EDM under a single contract. ESCOM and EDM each pay 50% o f the Consultant costs. The PMUs are in regular contact. Training and capacity building for the ESCOM and EDM PMUs will be included in the project. ESCOM and EDM both have functioning Management Units in charge o f special projects. The Monitoring and Evaluation (M&E) function i s fully embedded in these Project Management Units. Indicators for results monitoring have been designed so as to be managed by the Utility Project Managers
5. The diagram below illustrates these three levels o f institutional management structure.
48
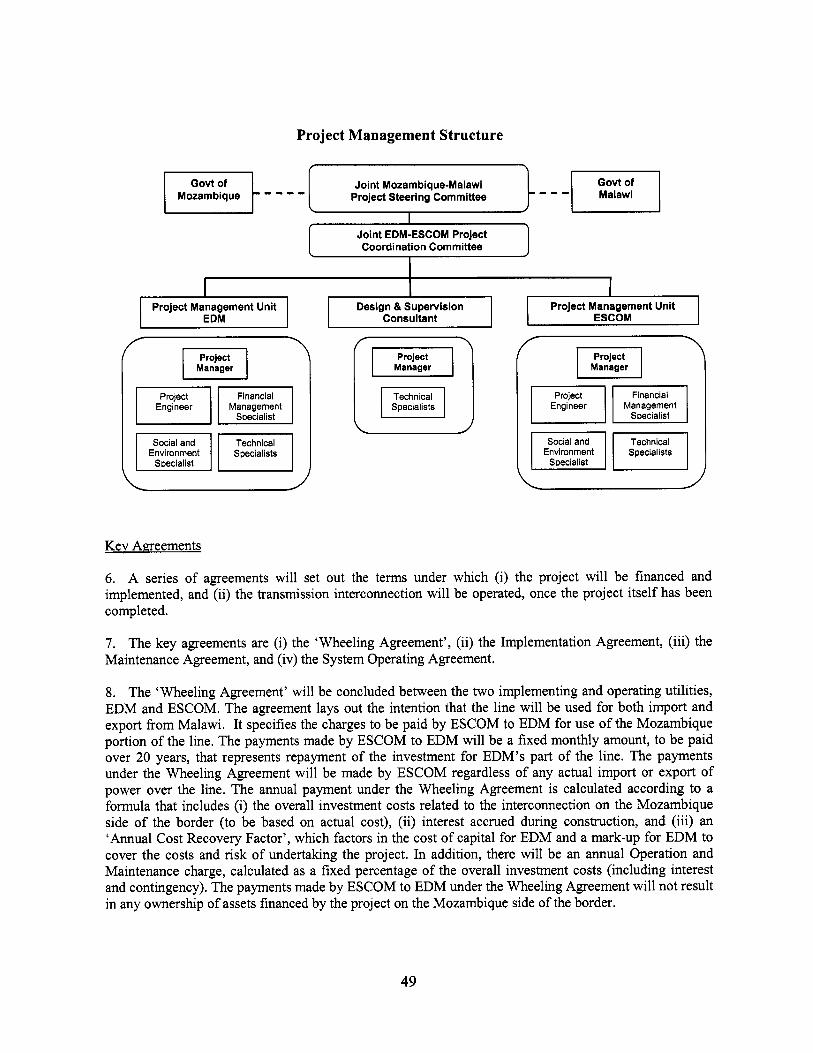
Project Management Structure
Joint Mozambique-Malawi Mozambique - - - - Project Steering Committee
1 Joint EDM-ESCOM Project Coordination Committee
Project Management Unit -1
Management
Environment Specialists
. Manager
Engineer Management Soecialist
Environment Specialists Soecialist
Kev Agreements
6. A series o f agreements will set out the terms under which (i) the project will be financed and implemented, and (ii) the transmission interconnection will be operated, once the project itself has been completed.
7. The key agreements are (i) the ‘Wheeling Agreement’, (ii) the Implementation Agreement, (iii) the Maintenance Agreement, and (iv) the System Operating Agreement.
8. The ‘Wheeling Agreement’ will be concluded between the two implementing and operating utilities, EDM and ESCOM. The agreement lays out the intention that the line will be used for both import and export from Malawi. I t specifies the charges to be paid by ESCOM to EDM for use o f the Mozambique portion o f the line. The payments made by ESCOM to EDM will be a fixed monthly amount, to be paid over 20 years, that represents repayment o f the investment for EDM’s part o f the line. The payments under the Wheeling Agreement will be made by ESCOM regardless o f any actual import or export of power over the line. The annual payment under the Wheeling Agreement i s calculated according to a formula that includes (i) the overall investment costs related to the interconnection on the Mozambique side o f the border (to be based on actual cost), (ii) interest accrued during construction, and (iii) an ‘Annual Cost Recovery Factor’, which factors in the cost o f capital for EDM and a mark-up for EDM to cover the costs and risk o f undertaking the project. In addition, there will be an annual Operation and Maintenance charge, calculated as a fixed percentage o f the overall investment costs (including interest and contingency). The payments made by ESCOM to EDM under the Wheeling Agreement will not result in any ownership o f assets financed by the project on the Mozambique side o f the border.
49

9. The Implementation Agreement wil l similarly be concluded between EDM and ESCOM. It describes the means by which the physical implementation o f the l ine shall occur, focusing particularly o n management and accountability for project delivery. I t sets out the project management structure, including the roles o f the Joint Project Steering Committee and the Joint Project Coordination Committee, as summarized above. I t sets out the project reporting structure, by which information o n project implementation will f low f rom the two PMUs up to the Joint Project Steering Committee. It also describes the physical properties o f the interconnection transmission l ine (including the principal lots for contracting works, goods and services that will need to be procured), and the activities that have already been undertaken as part o f the interconnection project (including feasibility and environmental studies).
10. The Maintenance Agreement wi l l also be agreed between EDM and ESCOM sets out the specific responsibilities o f EDM and ESCOM with repect to the quality and schedule o f maintenance o f the line, including planned and unplanned maintenance, costs and liabil i ty in the case o f failure to implement the maintenance agreement. Under the agreement, the parties will exchange schedules o f maintenance before the end o f each year for the succeeding year.
11. The System Operating Agreement will be agreed between EDM, E S C O M and HCB. HCB i s the system operator for the Matambo substation. T h i s agreement specifies the basis for operating and maintaining the transmission l ine and the interconnection systems. Under this agreement, a Joint Operating Committee with equal representation f rom EDM, ESCOM and H C B wil l be set up to establish the operating procedures required to obtain the maximum benefits f rom operation o f the interconnection with Malawi, establish interchange procedures (e.g. meter reading, energy recording and accounting), ensure spinning reserve requirements are maintained by the parties, establish operating procedures for carrying reactive loads by one system to another to ensure adequate service conditions and economical use o f the facilities, and to determine or decide upon other related matters. The Joint Operating Committee will make recommendations to the Parties concerning coordination o f maintenance schedules, coordination o f power and energy interchange procedures, installation o f any relaying or control equipment, and any amendments and revisions to this agreement. The Chairmanship o f the Joint Operating Committee shall revolve among the parties o n an annual basis.
12. In addition to these key agreements, a Memorandum o f Understanding has been signed between the Governments o f Mozambique and Malawi, which sets out in broad terms the aims and objectives o f the transmission interconnection project. The diagram below summarizes a l l the agreements relevant to project implementation.
50
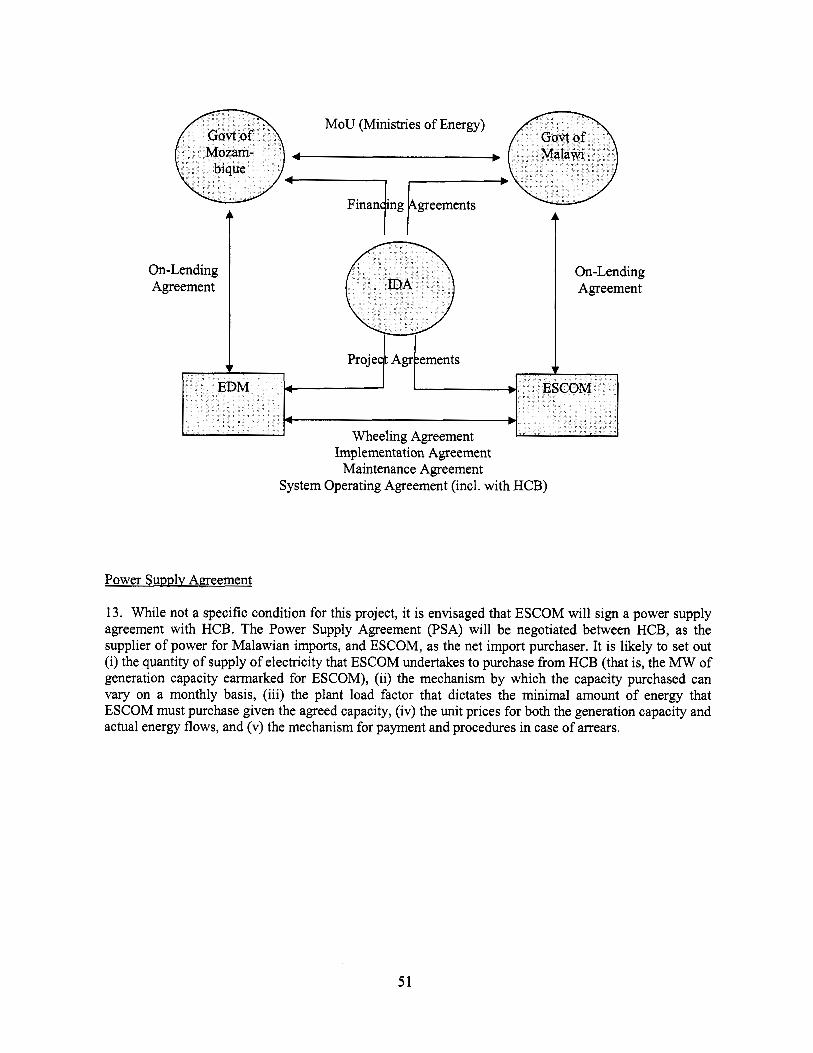
M o U (Ministries o f Energy)
Implementation Agreement Maintenance Agreement
System Operating Agreement (incl. with HCB)
Power Sumlv Aaeement
13. Whi le not a specific condition for this project, i t i s envisaged that ESCOM will s i g n a power supply agreement with HCB. The Power Supply Agreement (PSA) will be negotiated between HCB, as the supplier o f power for Malawian imports, and ESCOM, as the net import purchaser. I t i s likely to set out (i) the quantity o f supply o f electricity that ESCOM undertakes to purchase from HCB (that is, the MW o f generation capacity earmarked for ESCOM), (ii) the mechanism by which the capacity purchased can vary on a monthly basis, (iii) the plant load factor that dictates the minimal amount o f energy that ESCOM must purchase given the agreed capacity, (iv) the unit prices for both the generation capacity and actual energy flows, and (v) the mechanism for payment and procedures in case o f arrears.
5 1

Annex 7: Financial Management and Disbursement Arrangements
AFRICA Mozambique - Malawi Transmission Interconnection (Southern African Power Market Program APL-2)
Malawi
1. Introduction. The financial management assessment was done in l ine with the Financial Management Practice Manual (November 2005) o f the FM Board. The objective o f the assessment i s to determine whether the implementing entities have acceptable financial management arrangements, which will ensure (i) that funds are used only for the intended purposes in an efficient and economical way; (ii) the preparation o f accurate, reliable and timely periodic financial reports; and (iii) the safeguarding o f the entities’ assets.
2. Countw Public Financial Management Issues. initiatives3’ contributing to the improvement o f the PFM system:
There are several ongoing or recently completed
International Monetary Fund (IMF) StaflMonitored Program (SMP) and the World Bank Structural Adjustment Credit (SAC): Both o f these have performance criteria tied to fiscal discipline. They both refer to the need for an effective public expenditure management system, including through adoption o f the MTEF. FIMTAP (Financial Management, Transparency and Accountability Project): T h i s i s a Wor ld Bank funded project aimed at strengthening financial accountability and reporting. A key component i s support for the development o f IFMIS (Integrated Financial Management information System). PFEM (Public Financial and Economic Management Action Plan): This i s designed to be an umbrella framework for addressing fundamental weaknesses in the budget management and accounting system. Some key legislation under the MFAAP has already been enacted in the reform o f the Public Finance Management, the Public Audit and the Public Procurement Acts. The PEG (Project on Economic Governance) (completed): This i s a CIDA supported initiative aimed at building the capacity o f external stakeholders to engage in economic issues and the budget process. MTEF Phase 11 Program: Designed to improve budget credibility and make better linkages between the Ma law i Poverty Reduction Strategy and the budget. The programme i s financed by DFID and other donors. Macro-economic Advisory Services Project: A GTZ supported project, to strengthen macroeconomic planning and budgeting. Tikambirane -Support for Voice, Accountability and Rights: A DFID funded project, to enhance the voice and influence o f Ma law i citizens within accountable and responsive systems o f governance. Institutional Support Project for Aid-Debt Management and Governance (completed): A project supported by the African Development Bank, to build capacity o f a l l ministries and agencies engaged in aid and debt management. Institutional Cooperation with the Swedish National Audit Ofice (SNAO): A project supported by Norway and Sweden to produce high quality audits and increase the efficiency o f the National Audit Off ice (NAO). Support to the Anti Corruption Bureau: Supported by the DFID, to enable the ACB strengthen its competence and credibility as an effective anti corruption agency.
32 Capacity Building Programme For Economic Management And Policy Coordination: Technical Report NO. 32, Government o f Malawi and European union, February 2005
52
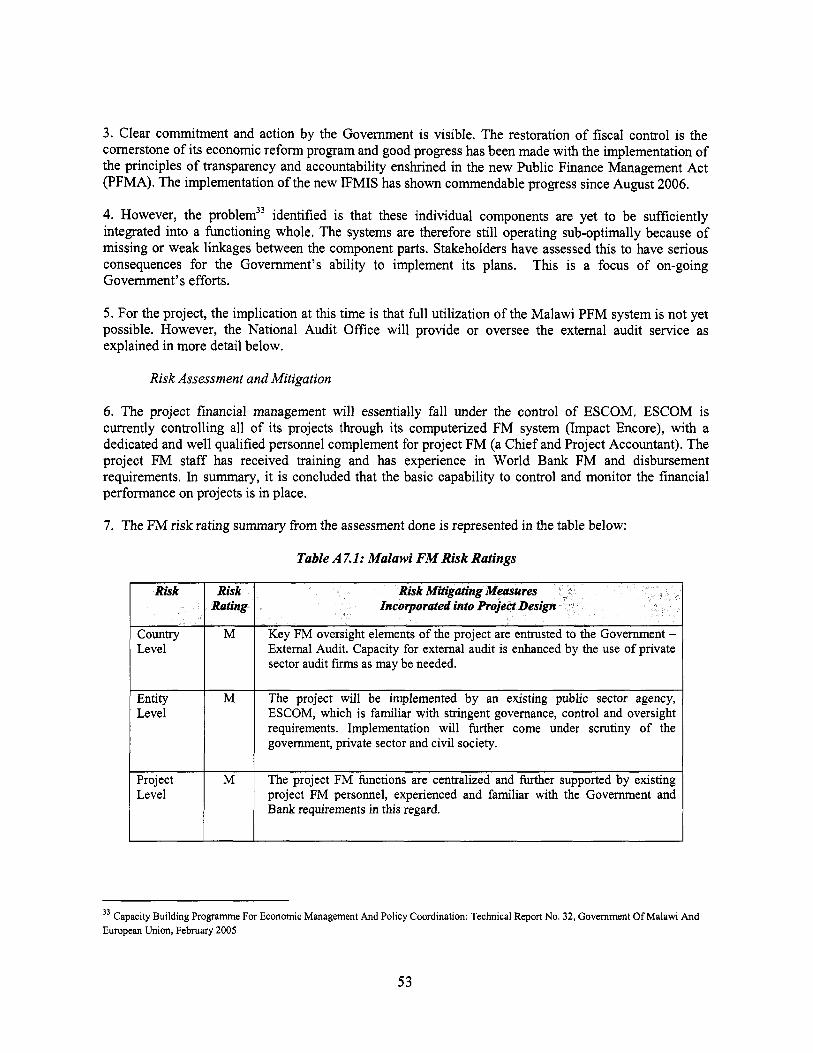
3. Clear commitment and action by the Government i s visible. The restoration o f fiscal control i s the cornerstone o f i t s economic reform program and good progress has been made with the implementation o f the principles o f transparency and accountability enshrined in the new Public Finance Management Act (PFMA). The implementation o f the new IFMIS has shown commendable progress since August 2006.
4. However, the problem33 identified i s that these individual components are yet to be sufficiently integrated into a functioning whole. The systems are therefore s t i l l operating sub-optimally because o f missing or weak linkages between the component parts. Stakeholders have assessed this to have serious consequences for the Government’s ability to implement i t s plans. This i s a focus o f on-going Government’s efforts.
5. For the project, the implication at this time i s that full utilization o f the Malawi PFM system i s not yet possible. However, the National Audit Office will provide or oversee the external audit service as explained in more detail below.
Risk Assessment and Mitigation
6. The project financial management will essentially fall under the control o f ESCOM. ESCOM i s currently controlling all o f i t s projects through i t s computerized FM system (Impact Encore), with a dedicated and well qualified personnel complement for project FM (a Chief and Project Accountant). The project FM staf f has received training and has experience in World Bank FM and disbursement requirements. In summary, it i s concluded that the basic capability to control and monitor the financial performance on projects i s in place.
7. The FM risk rating summary from the assessment done i s represented in the table below:
Table A7.1: Malawi FM Risk Ratings
udit i s enhanced by the use o f private
government, private sector and civil society.
33 Capacity Building Programme For Economic Management And Policy Coordination: Technical Report No. 32, Government Of Malawi And European Union, February 2005
53
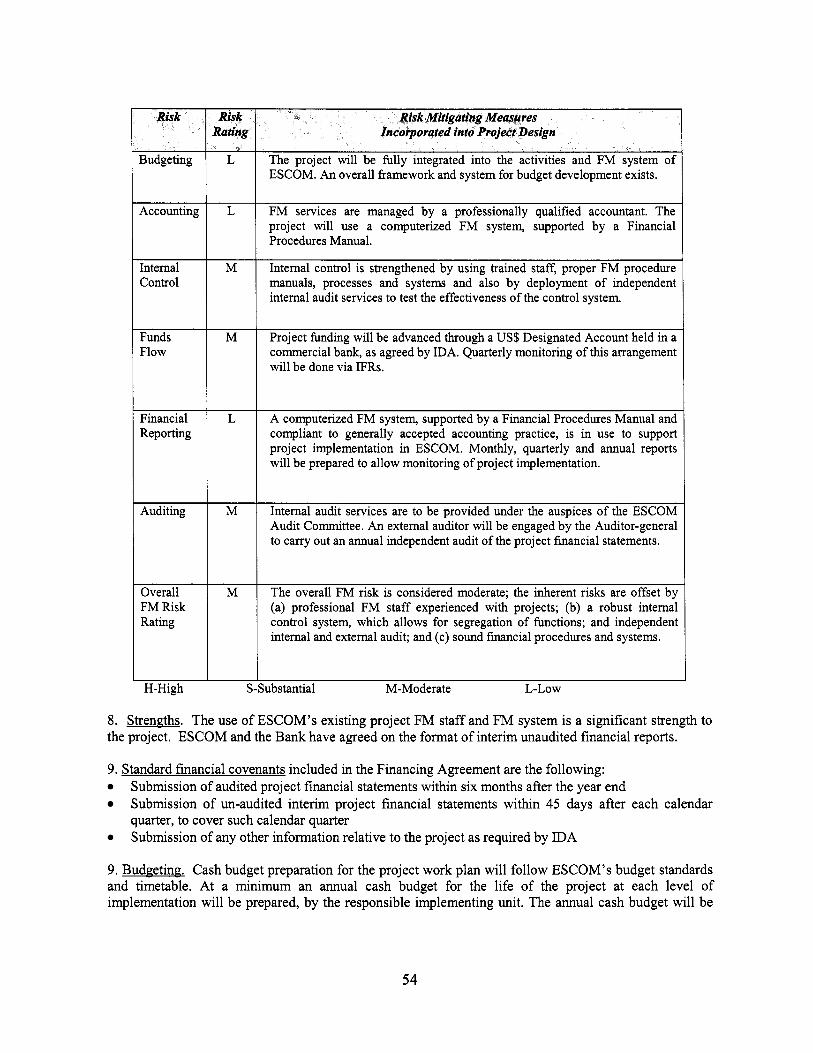
Internal Control
Financial Reporting
I
Funds I M
L
Flow
Auditing M Overall
H-High S
The project will be fully integrated into the activities and FM system o f ESCOM. An overall framework and system for budget development exists.
FM services are managed by a professionally qualified accountant. The project will use a computerized FM system, supported by a Financial Procedures Manual.
Internal control i s strengthened by using trained staff, proper FM procedure manuals, processes and systems and also by deployment o f independent internal audit services to test the effectiveness o f the control system.
Project f inding w i l l be advanced through a US$ Designated Account held in a commercial bank, as agreed by IDA. Quarterly monitoring o f t h i s arrangement w i l l be done via IFRs.
A computerized FM system, supported by a Financial Procedures Manual and compliant to generally accepted accounting practice, i s in use to support project implementation in ESCOM. Monthly, quarterly and annual reports will be prepared to allow monitoring o f project implementation.
Internal audit services are to be provided under the auspices o f the ESCOM Audit Committee. An external auditor w i l l be engaged by the Auditor-general to carry out an annual independent audit o f the project financial statements.
The overall FM risk i s considered moderate; the inherent r isks are offset by (a) professional FM staff experienced with projects; (b) a robust internal control system, which allows for segregation o f functions; and independent internal and external audit; and (c) sound financial procedures and systems.
hbstantial M-Moderate L -Low
8. Strengths. The use o f ESCOM’s existing project FM staff and FM system i s a significant strength to the project. ESCOM and the Bank have agreed on the format o f interim unaudited financial reports.
9. Standard financial covenants included in the Financing Agreement are the following: Submission o f audited project financial statements within six months after the year end Submission o f un-audited interim project financial statements within 45 days after each calendar quarter, to cover such calendar quarter Submission o f any other information relative to the project as required by IDA
9. Budgeting. Cash budget preparation for the project work plan will follow ESCOM’s budget standards and timetable. At a minimum an annual cash budget for the l i fe o f the project at each level o f implementation will be prepared, by the responsible implementing unit. The annual cash budget wil l be
54

broken down quarterly and monthly, in support o f project activities as reflected in the approved work plan and procurement plan.
10. Internal Control and Internal Auditing. Internal control comprises the whole system o f control, financial or otherwise, established by ESCOM in order to - (i) carry out the project activities in an orderly and efficient manner; (ii) ensure adherence to policies and procedures; (iii) to safeguard the assets o f the project; and (iv) secure as far as possible the completeness and accuracy o f the financial and other records.
11. The key elements to ensure a sound internal control system will include: Segregation o f duties, Physical control of assets, Authorization and approval, Clear channels o f command, Arithmetic and accounting accuracy, Integri ty and performance o f staff at all levels, Supervision.
12. Project activities will also be periodically reviewed by the Internal Audit Department o f ESCOM. The Chief Internal Auditor and staff in this unit are qualified, an audit approach has been established and they regularly prepare internal audit reports under their mandate that are submitted to ESCOM’s Audit Committee. Copies o f the internal audit reports are also to be submitted to the Central Internal Audit Department o f the Ministry o f Finance.
13. Accounting. Project accounts will be maintained on an accrual basis, based on I A S GAAP applicable to ESCOM. Accounting records will be maintained in Kwacha, using ESCOM’s normal computerized accounting system, but with transactions o f the project separately identifiable through appropriate changes to ESCOM’s Chart o f Accounts. Currently, due to two outstanding lapsed loans, ESCOM will not be able to open a DA until the Government has cleared the outstanding balances with IDA. When this issue has been resolved, ESCOM will open a Designated Account (DA). The opening and closing balances o f the US$ DA and o f any other bank accounts relating to the project that are held in a currency different from the books o f account, should be translated at the rate ruling on the opening and closing dates, respectively. Expenditures made out o f the DA (and other bank accounts as mentioned above) should be stated at the rate ruling on the transaction dates. The actual exchange rates used should be disclosed in a note to the financial reports.
14. The Chart o f Accounts wil l facilitate the preparation o f relevant monthly, quarterly and annual financial statements, including information on the following: Total project expenditures, Total financial contribution from each financier, Total expenditure on each project component/activity, Analysis o f that total expenditure into the disbursement categories o f the project, which would include goods, works, consultants’ services and operating costs. All accounting and control procedures will be documented in a FPM and regularly updated by the Project Accountant.
Financial Reporting and Monitoring
15. Minimum requirements for Interim Financial Reports (quarterly) and Annual Financial Statements are outlined below.
(9 Statement of Sources and Uses of Funds, showing by funding source for the period and cumulatively (project l i fe or year to date) inflows and outflows by project component and disbursement category, as well as opening and closing cash balances o f the project; Bank Reconciliation Statement for each bank account, including copies o f the respective bank statements Statement of Expenditure, an itemized statement summarizing eligible expenditures incurred during a stated period based on individual transactions. The expenditures are normally grouped by
(ii)
( i i i)
55
project components and disbursement categories, comparing actual and budgeted expenditures. The report will also include a cash flow forecast for the following two quarters. Payments made during the reporting period against contracts subject to the Bank’s prior review, summarizing contract payments Designated Account Reconciliation, showing deposits and replenishments received, payments supported by withdrawal applications, interest earned on the account and the balance at the end o f the reporting period. Procurement Reports, which provide information on the procurement o f goods, works, and consultants and on compliance with agreed procurement methods. The reports will compare procurement performance against the plan agreed at negotiations or subsequently updated, and highlight key procurement issues such as staffing and building borrower capacity. Physical Progress Reports, which include narrative information and output indicators (agreed during project preparation), linking financial information with physical progress and highlighting issues that require attention.
16. Indicative formats for the reports are available in a Bank guideline General formats o f FMRs are contained in: “Financial Monitoring Reports for World Bank Financed projects: Guidelines for borrower^"^^. In addition Annual Financial Statements would need to comply with relevant International Accounting Standards (IFRS) applicable to ESCOM.
17. Quarterly and annual reports are to be submitted respectively to - (i) the Accountant-general; (ii) the Auditor-general; (iii) IDA - for the purpose o f monitoring project implementation; (iv) the Project Steering Committee to ensure transparency in project activities and implementation to all stakeholders.
18. External Audit. The IDA Financing Agreement will require the submission o f audited Annual Financial Statements for the project, within six months after year-end. Relevantly qualified, experienced and independent external auditors will be appointed by the Auditor-general, based on TORS acceptable to IDA. Besides expressing an opinion on the Annual Financial Statements in compliance with International Standards on Auditing (ISAs), the auditors will be required to form an opinion on the degree o f compliance with IDA procedures for the Designated Account and the balance therein at the year-end. In addition to the audit report, the external auditors will be expected to prepare a Management Letter giving observations and comments, and providing recommendations for improvements in accounting records, systems, controls and compliance with financial covenants in the IDA agreement.
19. PPF Audit. The audit o f the Project Preparation Advance (PPF) i s overdue. The audit report for the PPF was due December 3 1,2006. ESCOM committed to accelerate the process o f auditing the PPF and will submit the report by June 30,2007.
20. FM Supervision. The first FM review will be carried out after 6 months o f project effectiveness. This detailed review will cover all aspects o f FM, internal control systems, reviewing the overall fiduciary control environment and tracing transactions from the bidding process to disbursements as well as SOE review. Thereafter, given that the FM risk rating for the project i s moderate, subsequent reviews wil l be as follows: review o f quarterly FMRs; annual SOE review as part o f the TOR o f the external auditors; review o f audited Annual Financial Statements and management letter as well as timely follow up o f issues arising; participation in project supervision missions as appropriate; and updating the financial management rating in the Implementation Status report (ISR). The FM staff at the Pretoria Country Office will play a key role in monitoring the timely implementation o f any action plans.
34 http://siteresources.worldbank.orpIINTRANETFINANCIALMGMTIResources/TOPICS/FMRs/FMR-Borrowers-Enplish-Nov- 2002.pdf
56
Funds Flow and Disbursement Arrangements
2 1. The Government o f Malawi will authorize ESCOM to open the following bank accounts:
(i) One US$ Designated Accounts (DA) at a commercial bank under terms and conditions acceptable to IDA, as agreed with IDA, into which project funds will be advanced in terms o f normal IDA disbursement guidelines3’. Any interest on DA balances will be transferred to the Kwacha operating account in (ii) below. Normal ESCOM bank account signatory arrangements will apply to the project bank accounts.
One “SAPM APL-2 IDA General Operating Bank Account” in Kwacha, opened at any commercial bank at the choice o f the ESCOM, into which draw-downs from the DA will be credited to fund eligible expenditures except those paid via the accounts mentioned above. T h i s account will be funded from the USD DA, strictly in advance for 30 days on the basis o f realistic cash forecast derived from the approved work plan, keeping balances as close as possible to zero after payments. Normal ESCOM bank account signatory arrangements will apply to the project bank accounts.
(ii)
22. Pettv Cash Svstems. As needed, ESCOM’s implementing units will be given petty cash advances for cash payment o f small administrative expenses and such petty cash records will be centrally recorded, controlled and reconciled by the PMU.
23, Disbursement Arrangements. By effectiveness, the Project will use the Transaction-based disbursement procedures, i.e., direct payment, reimbursement, and special commitments as described in the World Bank Disbursement Handbook. As project implementation proceed, the quarterly Interim Financial Reports (IFRs) produced by the Project will be reviewed. Where the reports are adequate and produced on a timely basis, and the borrower requests conversion to Report-based disbursements, a review will be undertaken by the Project Task Team to determine i f the Project i s eligible for report-based disbursement. The adoption o f report-based disbursements by the Project will enable it to move away from time-consuming voucher-by-voucher (transaction-based) disbursement methods to quarterly advances to the Project’s Designated Account based on IFRs. Detailed disbursement procedures will be documented in the FPM.
24. Minimum Value o f Auulications. The Minimum Value o f Applications for reimbursement, direct payment and special commitment i s indicated in the Disbursement Letter.
25. Reporting on Use o f Credit Proceeds. IDA would require withdrawals from the grant accounts to be made on the basis o f Statements o f Expenditure for: (a) services o f individual consultants costing less than US$50,000 equivalent per contract; (b) services o f consulting f i r m s costing less than US$lOO,OOO per contract; (c) all training; and (d) goods not costing more than US$250,000 and (e) works not costing more than US$500,000. All requests for withdrawal o f expenditures under contracts subject to IDA’S prior review would be fully documented. All supporting documentation will be retained by the ESCOM and must be made available for review by periodic World Bank review missions, internal and external auditors,
26. Designated Account (DA). The ceiling for the maximum amount o f credit proceeds that may be deposited in the DA, will be agreed at negotiations and reflected in the disbursement letter.
35g K:5 1533-theSitePK:40941 .OO.html
57
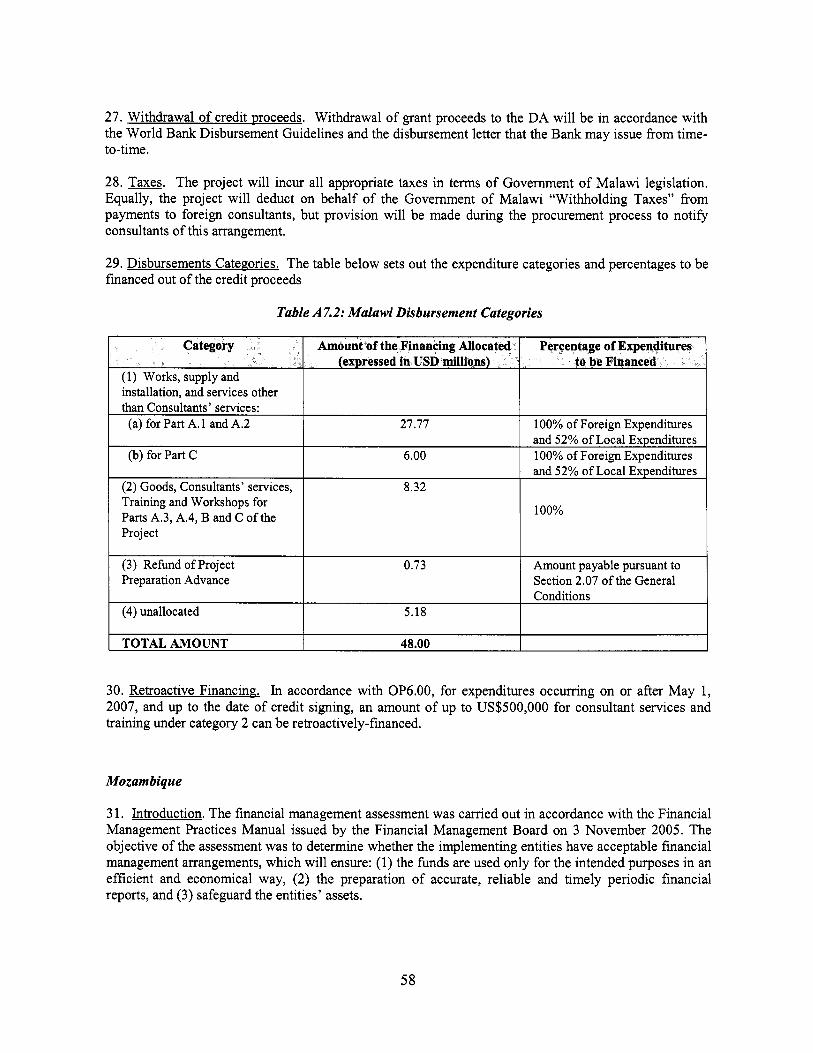
27. Withdrawal o f credit woceeds. Withdrawal o f grant proceeds to the DA will be in accordance with the Wor ld Bank Disbursement Guidelines and the disbursement letter that the Bank may issue from time- to-time.
(4) unallocated
TOTAL AMOUNT
28. Taxes. The project will incur a l l appropriate taxes in terms o f Government o f Ma law i legislation. Equally, the project will deduct on behalf o f the Government o f Ma law i “Withholding Taxes” f rom payments to foreign consultants, but provision will be made during the procurement process to not i fy consultants o f this arrangement.
5.18
48.00
29. Disbursements Categories. The table below sets out the expenditure categories and percentages to be financed out o f the credit proceeds
Table A 7.2: Malawi Disbursement Categories
Preparation Advance
30. Retroactive Financing. In accordance with OP6.00, for expenditures occurring o n or after M a y 1, 2007, and up to the date o f credit signing, an amount o f up to US$500,000 for consultant services and training under category 2 can be retroactively-financed.
Mozambique
3 1. Introduction. The financial management assessment was carried out in accordance with the Financial Management Practices Manual issued by the Financial Management Board o n 3 November 2005. The objective o f the assessment was to determine whether the implementing entities have acceptable financial management arrangements, which will ensure: (1) the funds are used only for the intended purposes in an efficient and economical way, (2) the preparation o f accurate, reliable and timely periodic financial reports, and (3) safeguard the entities’ assets.
58
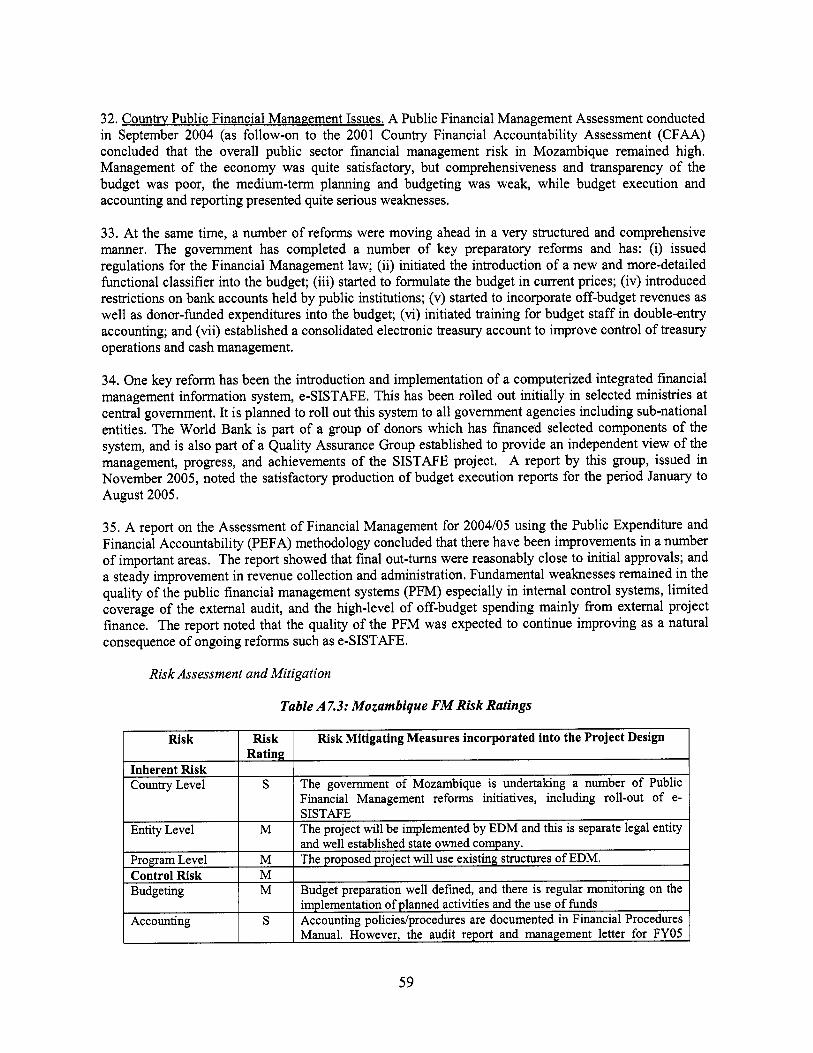
32. Countrv Public Financial Management Issues. A Public Financial Management Assessment conducted in September 2004 (as follow-on to the 2001 Country Financial Accountability Assessment (CFAA) concluded that the overall public sector financial management risk in Mozambique remained high. Management o f the economy was quite satisfactory, but comprehensiveness and transparency o f the budget was poor, the medium-term planning and budgeting was weak, while budget execution and accounting and reporting presented quite serious weaknesses.
33. At the same time, a number o f reforms were moving ahead in a very structured and comprehensive manner. The government has completed a number o f key preparatory reforms and has: (i) issued regulations for the Financial Management law; (ii) initiated the introduction o f a new and more-detailed functional classifier into the budget; (iii) started to formulate the budget in current prices; (iv) introduced restrictions on bank accounts held by public institutions; (v) started to incorporate off-budget revenues as well as donor-funded expenditures into the budget; (vi) initiated training for budget staff in double-entry accounting; and (vii) established a consolidated electronic treasury account to improve control o f treasury operations and cash management.
34. One key reform has been the introduction and implementation o f a computerized integrated financial management information system, e-SISTAFE. This has been rolled out initially in selected ministries at central government. It i s planned to ro l l out this system to all government agencies including sub-national entities. The World Bank i s part o f a group o f donors which has financed selected components o f the system, and i s also part o f a Quality Assurance Group established to provide an independent view o f the management, progress, and achievements o f the SISTAFE project. A report by this group, issued in November 2005, noted the satisfactory production o f budget execution reports for the period January to August 2005,
35. A report on the Assessment o f Financial Management for 2004/05 using the Public Expenditure and Financial Accountability (PEFA) methodology concluded that there have been improvements in a number o f important areas. The report showed that final out-turns were reasonably close to initial approvals; and a steady improvement in revenue collection and administration. Fundamental weaknesses remained in the quality o f the public financial management systems (PFM) especially in internal control systems, limited coverage o f the external audit, and the high-level o f off-budget spending mainly from external project finance. The report noted that the quality o f the PFM was expected to continue improving as a natural consequence o f ongoing reforms such as e-SISTAFE.
Risk Assessment and Mitigation
Table A7.3: Mozambique FM Risk Ratings
ment letter for FY05
59

I H-High S-Substantial
7 Auditing
M-Moderate L -Low
raised some matters o f deficiencies in accounting and internal control system o f EDM. The following i s an effectiveness condition: The EDM has established an adequate financial management system, adequate to produce interim unaudited financial reports, in form and substance satisfactory to the Association, to ensure proper accounting and monitoring o f project funds. Accounting policies/procedures are documented in the Financial Procedures Manual. However, the audit report and management letter for FY05 raised some matters o f deficiencies in accounting and internal control system o f EDM, and the Internal Audit Department i s weak. The Internal Audit DeDartment should strengthened bv hiring additional staff.
Internal Control
Funds Flow Funds f low arrangements are simple with centralized procurement and payments for the project activities. Financial reports are generally prepared on a timely basis. EDM wi l l produce interim unaudited financial reports on quarterly basis. EDM and the Bank have agreed on the format o f interim unaudited financial reports. EDM i s audited by independent audit fm annually. EDM wi l l appoint independent audit fm for the project. TOR for employment o f the independent external auditor has been agreed. No later than 3 months after effectiveness EDM will have selected the independent external auditor to undertake audit o f the project.
S
M
36. Effectiveness Condition and FM Covenants. The following effectiveness condition has been agreed: The EDM has established an adequate financial management system, adequate to produce interim unaudited financial reports, in form and substance satisfactory to the Association, to ensure proper accounting and monitoring o f project funds. The financial management covenants are the standard to be stated in the Financing and Project Agreements
37. In view o f the general country financial management issues and the issues peculiar to the project, the overall financial management risk rating for the Mozambique component o f this project i s moderate
38. Staffing. The financial management issues o f the project will be handled by the Department o f Debt and Contracts Management (DDCM) under Finance Directorate. A financial manager has been appointed to handle the financial management issues o f the proposed project. She i s currently the managing the PPF funds o f this proposed project.
39. Budgeting. Budgeting preparation at EDM i s well defined and there i s regular monitoring on the uses o f funds. The budget for the project will be prepared within the budget fkamework o f EDM. EDM prepares an annual budget, which includes the activities o f projects financed by donors and financial institutions.
40. Accounting. The EDM accounting system i s base on double entry, accrual accounting software called Agresso. In addition, the D D C M uses excel spreadsheets to account for funds o f projects financed by donors and financial intuitions. For the purposed o f the additional reporting for this project, this department will use excel spreadsheets to produce required financial reports to manage and to monitor the project.
41. Internal Control and Internal Audit. EDM has a financial procedures manual that describes the accounting system, internal control procedures, basis o f accounting, and policies and procedures that guide operations o f the company. EDM has an internal audit department that reports to the chairman o f board o f directors. However, the internal audit department should be strengthened to provide adequate
60

coverage o f all cost centers o f the company. The proposed project will use existing structures o f EDM, including those o f the internal audit function.
Financial Reporting and Monitoring
42. The EDM will rely on excel spreadsheets to produce required financial reports to manage and to monitor the project. Interim unaudited financial reports will be produced on a quarterly basis. The content and format o f these reports has been agreed with the World Bank and will include: (i) financial reports, including a statement o f sources and uses o f funds, and a statement o f uses o f funds by project components and activities, (ii) procurement, and physical progress reports.
43. The EDM will also produce an annual project financial statement, which will consist of:
a. A Statement of Sources and Uses of Funds / Cash Receipts and Payments which recognizes al l cash receipts, cash payments and cash balances controlled by the entity for this project; and separately identifies payments by third parties on behalf o f the entity.
b. The Accounting Policies Adopted and Explanatory Notes. The explanatory notes should be presented in a systematic manner with items on Statement o f Cash Receipts and Payments being cross referenced to any related information in the notes. Examples o f this information include: 0 a summary o f fixed assets by category o f assets; 0 a summary o f SOE Withdrawal Schedule, listing individual withdrawal applications; c. A Management Assertion that World Bank funds have been expended in accordance with the intended purposes as specified in the relevant World Bank legal agreement.
44. External Audit. The entity financial statements will be audited by independent auditors in accordance with International Standards on Auditing as promulgated by the International Federation o f Accountants (IFAC) and the audit report wil l be submitted to IDA within 6 months after the financial year-end.
45. The external audit on the project financial statements will be carried out by an independent auditor under TOR which have been agreed with the World Bank. I t has been agreed that the existing EDM external auditor will cover this additional project audit.
46. The auditors will be required to express a single opinion on the project financial statements, as per the guidelines “Financial Management Practices in World bank-Financed Investment Operations”, o f November 3, 2005 and the audit report will be submitted to IDA within 6 months after the financial year- end. In addition, a detailed management letter containing the auditor’s assessment o f the internal controls, accounting system and compliance with financial covenants in the IDA Financing Agreement, and suggestions for improvement will be prepared and submitted to management for follow-up.
47. The audit o f the Project Preparation Advance (PPF) to EDM i s overdue. The f i rs t audit report for the PPF was due by June 30, 2006 since there were a few disbursements in 2005, and the audit report for 2006 i s due on June 30,2007. EDM has committed to accelerate the process o f auditing the PPF and will submit the report for 2005 and 2006 by June 30,2007.
48. Suuervision. Financial management supervision will be carried out by the Financial Management Specialist (FMS) at least once a year in line with the moderate risk rating. The FMS will also conduct an FM supervision before effectivenesddisbursement; review the financial component o f the quarterly interim unaudited reports; and review the Audit Reports and Management Letters from the external auditors and follow-up on material accountability issues by engaging with the TTL, Client, and/or Auditors.
61
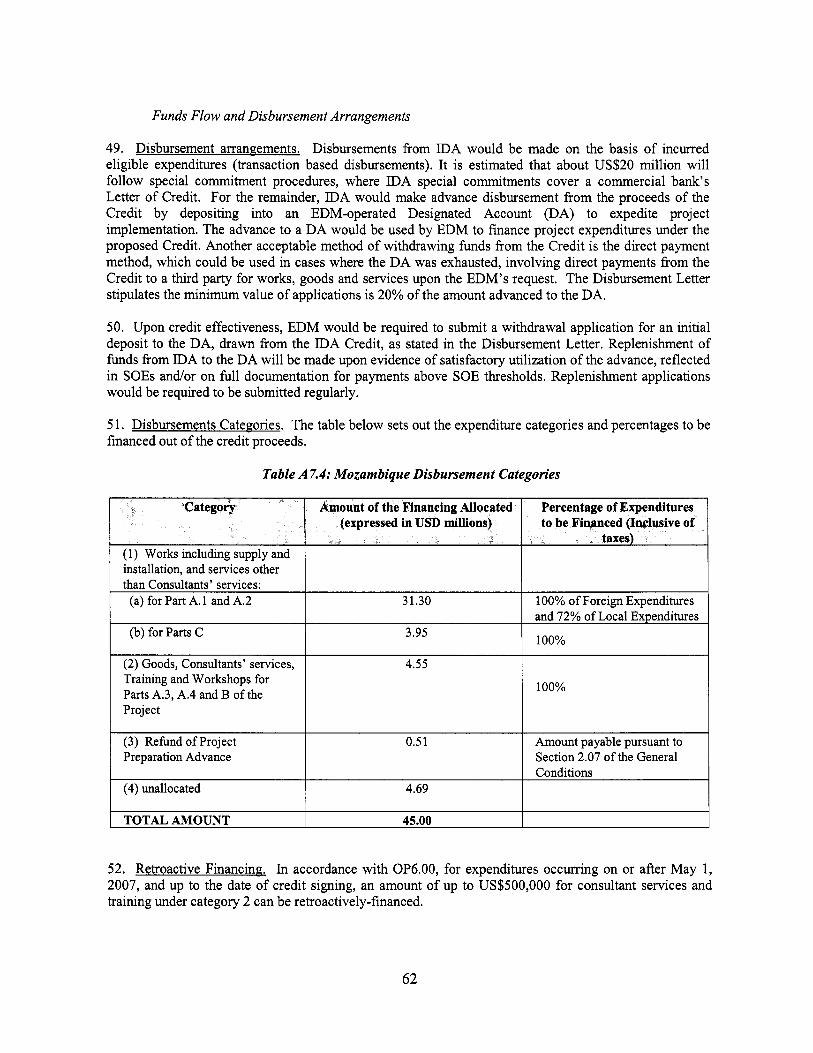
Funds Flow and Disbursement Arrangements
I TOTALAMOUNT
49. Disbursement arrangements. Disbursements f rom IDA would be made o n the basis o f incurred eligible expenditures (transaction based disbursements). It i s estimated that about US$20 mi l l ion will fo l low special commitment procedures, where IDA special commitments cover a commercial bank’s Letter o f Credit. For the remainder, IDA would make advance disbursement f rom the proceeds o f the Credit by depositing into an EDM-operated Designated Account (DA) to expedite project implementation. The advance to a DA would be used by EDM to finance project expenditures under the proposed Credit. Another acceptable method o f withdrawing funds from the Credit i s the direct payment method, which could be used in cases where the DA was exhausted, involv ing direct payments f rom the Credit to a third party for works, goods and services upon the EDM’s request. The Disbursement Letter stipulates the minimum value o f applications i s 20% o f the amount advanced to the DA.
45.00
50. Upon credit effectiveness, EDM would be required to submit a withdrawal application for an init ial deposit to the DA, drawn from the IDA Credit, as stated in the Disbursement Letter. Replenishment o f funds from IDA to the DA will be made upon evidence o f satisfactory utilization of the advance, reflected in SOEs and/or o n full documentation for payments above SOE thresholds. Replenishment applications would be required to be submitted regularly.
5 1. Disbursements Categories. The table below sets out the expenditure categories and percentages to be financed out o f the credit proceeds.
Table A 7.4: Mozambique Disbursement Categories
I (4) unallocated 4.69 I
52. Retroactive Financing. In accordance with OP6.00, for expenditures occurring o n or after M a y 1, 2007, and up to the date o f credit signing, an amount o f up to US$500,000 for consultant services and training under category 2 can be retroactively-financed.
62

53. Banking arrangements. EDM will open and maintain a Designated Account in United States dollars at commercial bank acceptable to IDA which will be used to deposit advances f iom IDA Credit Account; make payment in foreign and local currency to providers o f goods and services.
54. Conclusion. The overall conclusion o f the financial management assessment i s that the project’s financial management arrangements have an overall rating o f moderate which satisfies the Bank’s minimum requirements under OPBP 10.
63
Annex 8: Procurement Arrangements
AFRICA Mozambique - Malawi Transmission Interconnection (Southern African Power Market Program APL-2)
Malawi
General
1. Procurement for the proposed project would be carried out in accordance with the World Bank's "Guidelines: Procurement Under IBRD Loans and IDA Credits" dated May 2004, revised October 2006; and "Guidelines: Selection and Employment o f Consultants by World Bank Borrowers" dated May 2004, revised October 2006, and the provisions stipulated in the Legal Agreement. The various items under different expenditure categories are described in general below. For each contract to be financed by the Credit, the different procurement methods or consultant selection methods, the need for pre-qualification, estimated costs, prior review requirements, and time frame are agreed between the Borrower and the Bank in the Procurement Plan. The Procurement Plan will be updated at least annually or as required to reflect the actual project implementation needs and improvements in institutional capacity.
2. Procurement o f Works. Works procured under this project would include in Malawi: 76 km 220 kV Double circuit transmission line; construction o f a new 220 kV substation at Phombeya, near Blanty-re and associated works, among others; The procurement will be done using the Bank's Standard Bidding Documents (SBD) for all ICB and National SBD agreed with or satisfactory to the Bank.
3. Procurement o f Goods. Goods procured under this project in Malawi would include Project vehicles; equipment for hot wire maintenance, upgrades to transmission and distribution and revenue management and enhancement systems, etc. The procurement will be done using the Bank's SBD for all ICB and National SBD agreed with or satisfactory to the Bank.
4. Procurement o f non-consulting services. Services in Malawi to be procured under the program will include Aerial Line Survey. The procurement will be done using the Bank's SBD for al l ICB and National SBD agreed with or satisfactory to the Bank.
5. Selection o f Consultants. Consultants' services required in Malawi would cover consultancies for Engineering and supervision o f transmission line and substation; Update o f master plans and feasibility studies for the transmission line; other planning and rehabilitation assessment studies, technical assistance, studies and training for preparation o f a Financial Sustainability Plan and ESCOM Revenue Diagnostic study; preparation o f RAP; hot wire maintenance, project management, finance and commercial practices, environment and social issues and power trading, among others. Short lists o f consultants for services estimated to cost less than US$lOO,OOO equivalent per contract may be composed entirely o f national consultants in accordance with the provisions o f paragraph 2.7 o f the Consultant Guidelines.
6. The procurement procedures and SBDs to be used for each procurement method, as well as model contracts for works and goods procured, are presented in the OperationsProcurement Manual prepared by ESCOM.
64
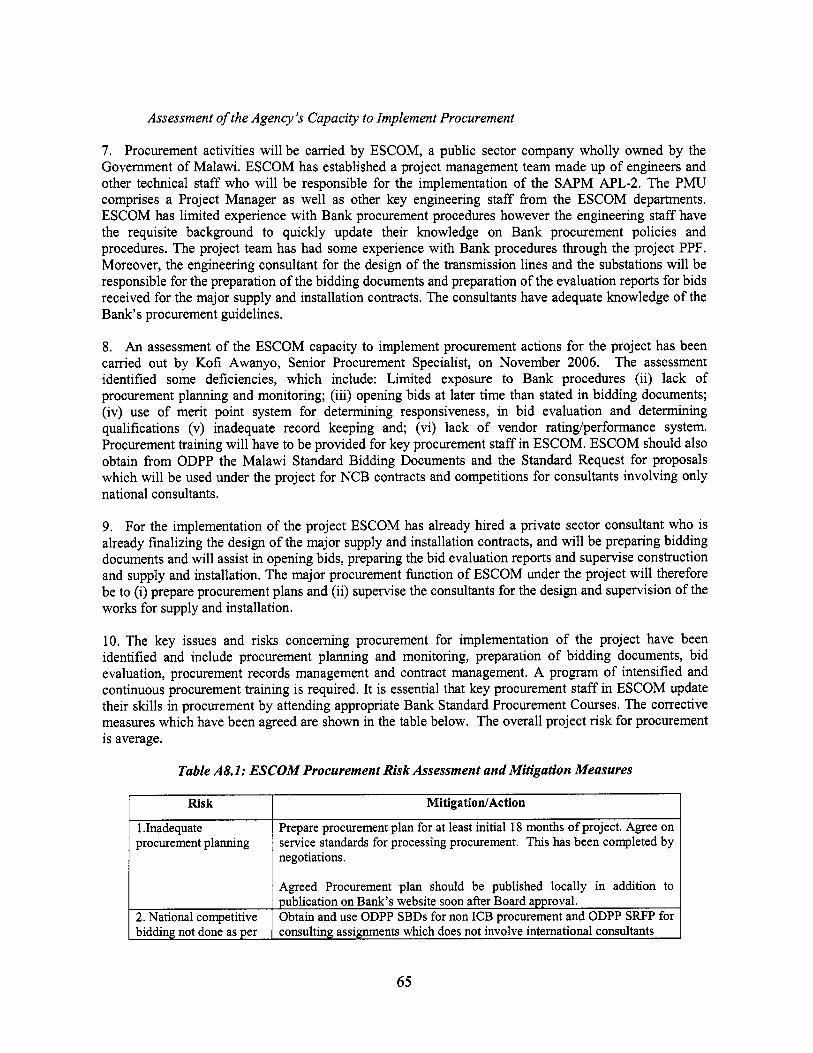
Assessment of the Agency’s Capacity to Implement Procurement
Risk
1 .Inadequate procurement planning
7. Procurement activities will be carried by ESCOM, a public sector company wholly owned by the Government o f Malawi. ESCOM has established a project management team made up o f engineers and other technical staff who will be responsible for the implementation o f the SAPM APL-2. The P M U comprises a Project Manager as well as other key engineering staf f from the ESCOM departments. ESCOM has limited experience with Bank procurement procedures however the engineering staff have the requisite background to quickly update their knowledge on Bank procurement policies and procedures. The project team has had some experience with Bank procedures through the project PPF. Moreover, the engineering consultant for the design o f the transmission lines and the substations will be responsible for the preparation o f the bidding documents and preparation o f the evaluation reports for bids received for the major supply and installation contracts. The consultants have adequate knowledge of the Bank’s procurement guidelines.
MitigatiodAction
Prepare procurement plan for at least initial 18 months o f project. Agree on service standards for processing procurement. This has been completed by negotiations.
Agreed Procurement plan should be published locally in addition to
8. An assessment o f the ESCOM capacity to implement procurement actions for the project has been carried out by Ko f i Awanyo, Senior Procurement Specialist, on November 2006. The assessment identified some deficiencies, which include: Limited exposure to Bank procedures (ii) lack o f procurement planning and monitoring; (iii) opening bids at later time than stated in bidding documents; (iv) use o f merit point system for determining responsiveness, in bid evaluation and determining qualifications (v) inadequate record keeping and; (vi) lack o f vendor ratindperformance system. Procurement training will have to be provided for key procurement staff in ESCOM. ESCOM should also obtain from ODPP the Malawi Standard Bidding Documents and the Standard Request for proposals which will be used under the project for NCB contracts and competitions for consultants involving only national consultants.
9. For the implementation o f the project ESCOM has already hired a private sector consultant who i s already finalizing the design o f the major supply and installation contracts, and will be preparing bidding documents and will assist in opening bids, preparing the bid evaluation reports and supervise construction and supply and installation. The major procurement function o f ESCOM under the project will therefore be to (i) prepare procurement plans and (ii) supervise the consultants for the design and supervision o f the works for supply and installation.
10. The key issues and risks concerning procurement for implementation o f the project have been identified and include procurement planning and monitoring, preparation o f bidding documents, bid evaluation, procurement records management and contract management. A program o f intensified and continuous procurement training i s required, It i s essential that key procurement staff in ESCOM update their sk i l l s in procurement by attending appropriate Bank Standard Procurement Courses. The corrective measures which have been agreed are shown in the table below. The overall project risk for procurement i s average.
I publication on Bank’s website soon after Board approval. I Obtain and use ODPP SBDs for non I C B procurement and ODPP SRFP for 2. National competitive I bidding not done as per 1 consulting assignments which does not involve international consultants
65
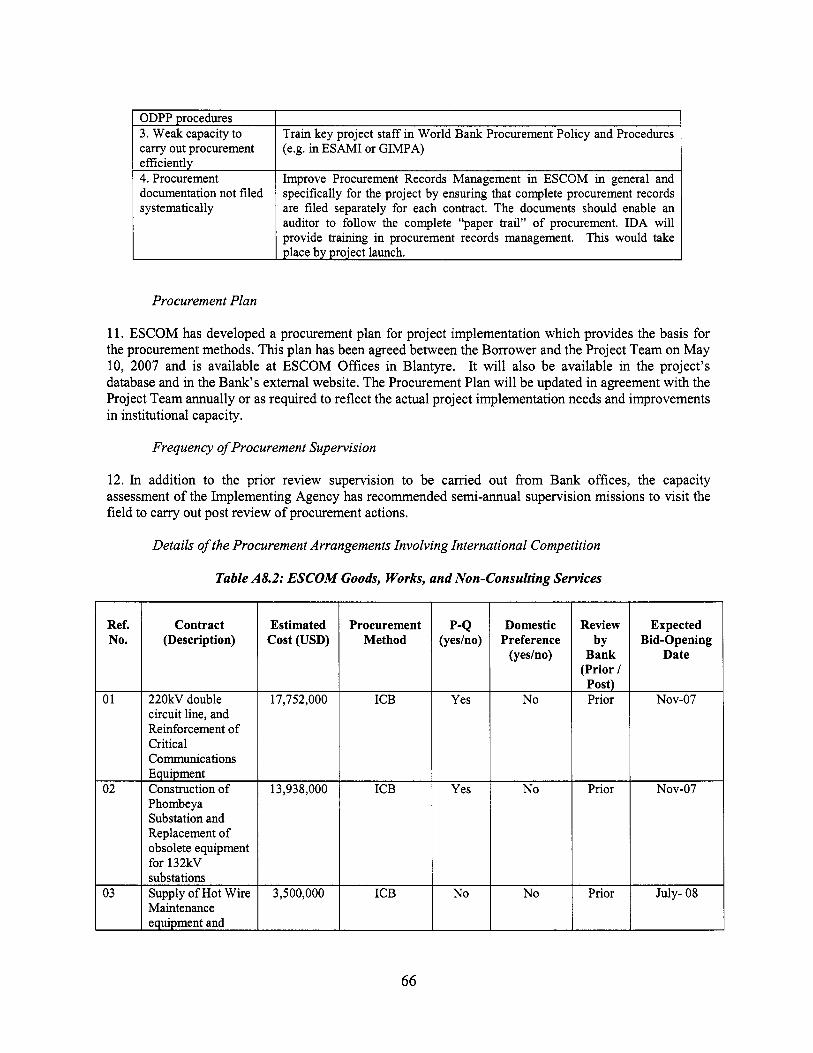
ODPP procedures 3. Weak capacity to carry out procurement efficiently 4. Procurement documentation not f i led systematically
Procurement Plan
Train key project staff in World Bank Procurement Policy and Procedures (e.g. in ESAMI or GIMPA)
Improve Procurement Records Management in ESCOM in general and specifically for the project by ensuring that complete procurement records are filed separately for each contract. The documents should enable an auditor to follow the complete “paper trail” o f procurement. IDA w i l l provide training in procurement records management. Th is would take place by project launch.
11. ESCOM has developed a procurement plan for project implementation which provides the basis for the procurement methods. This plan has been agreed between the Borrower and the Project Team on May 10, 2007 and i s available at ESCOM Offices in Blantyre. It will also be available in the project’s database and in the Bank’s external website. The Procurement Plan wil l be updated in agreement with the Project Team annually or as required to reflect the actual project implementation needs and improvements in institutional capacity.
Review by
Bank (Prior I
Frequency of Procurement Supervision
Expected Bid-Opening
Date
12. In addition to the prior review supervision to be carried out from Bank offices, the capacity assessment o f the Implementing Agency has recommended semi-annual supervision missions to v i s i t the field to carry out post review o f procurement actions.
Procurement Method
Details of the Procurement Arrangements Involving International Competition
P-Q (yesho)
Table A8.2: ESCOM Goods, Works, and Non-Consulting Services
I C B
I C B
Ref. No.
Yes
N o
01
Prior
Prior
02 NOV-07
July- 08
Contract (Description)
220kV double circuit line, and Reinforcement o f Critical Communications Equipment Construction o f Phombeya Substation and Replacement o f obsolete equipment for 132kV
Maintenance equipment and
Estimated Cost (USD)
17,752,000
13,938,000
3,500,000
Domestic Preference
(yesho)
N o
N o
N o
66

06
07
08
09
emergency restoration equipment and training
revenue Improvement Measures
Transmission rehabilitation
rehabilitation
equipment at generation stations
Equipment for 1,100,000 ICB N o No Prior Jw-08
Urgent 1,200,000 ICB N o No Prior NOV-08
Urgent Distribution 1,000,000 ICB N o N o Prior NOV-08
Digital excitation 2,000,000 ICB No N o Prior NOV-08
(a) Consultancy services estimated to cost above US$lOO,OOO per contract for firms and US$50,000 equivalent per contract for individuals and single source selection o f consultants will be subject to prior review by the Bank.
(b) Short lists composed entirely o f national consultants: Short lists o f consultants for services estimated to cost less than US$lOO,OOO equivalent per contract, may be composed entirely o f national consultants in accordance with the provisions o f paragraph 2.7 o f the Consultant Guidelines.
Ref. No.
01
02
03
Mozambique
Description of Estimated Selection Review Expected Method by Bank Proposals Submission
(Prior / Post) Date Cost (USD) Assignment
Studies on G, T and D 1,000,000 QCBS Prior Dec-07 rehabilitation including system operation and maintenance practices and procedures Preparation and 200,000 QCBS Prior Mar-08 Supervision o f RAP Revenue Diagnostic 500,000 QCBS Prior Dec-07 Study and assistance with Implementation Design o f ESCOM Prior June-07
General
13. Procurement for the proposed project would be carried out in accordance with the World Bank's "Guidelines: Procurement Under IBRD Loans and IDA Credits" dated May 2004, revised October 2006;
67
and “Guidelines: Selection and Employment o f Consultants by World Bank Borrowers” dated May 2004, revised October 2006, and the provisions stipulated in the Legal Agreement. The various items under different expenditure categories are described in general below. For each contract to be financed by the Credit, the different procurement methods or consultant selection methods, the need for pre-qualification, estimated costs, prior review requirements, and time frame are agreed between the Borrower and the Bank in the Procurement Plan. The Procurement Plan will be updated at least annually or as required to ref lect the actual project implementation needs and improvements in institutional capacity.
14. Procurement o f Works. Works procured under this project would include in Mozambique: 131 km 220 kV Double circuit transmission line; refurbishment and expansion o f Matambo substation and associated equipment and works. The procurement wil l be done using the Bank’s Standard Bidding Documents (SBD) for all ICB and National SBD agreed with or satisfactory to the Bank.
15. Procurement o f Goods. Goods procured under this project would include in Mozambique Project vehicles; equipment for hot wire maintenance. The procurement will be done using the Bank’s SBD for al l ICB and National SBD agreed with or satisfactory to the Bank.
16. Procurement o f non-consulting services. Services in Mozambique (other than consultants’ services) to be procured under the program will include Aerial Line Survey. The procurement will be done using the Bank’s SBD for all ICB and National SBD agreed with or satisfactory to the Bank.
17. Selection o f Consultants. Consultants’ services required in Mozambique would cover consultancies for Engineering and supervision o f transmission l ine and substation; update o f master plans and feasibility study o f extension o f the Matambo - Phombeya line to Nampula in Mozambique; technical assistance, studies and training in Environmental and Social aspects; audit o f project accounts, power trading; preparation o f RAP; hot wire maintenance, project management. Short l is ts o f consultants for services estimated to cost less than US$lOO,OOO equivalent per contract may be composed entirely o f national consultants in accordance with the provisions o f paragraph 2.7 o f the Consultant Guidelines.
18. The procurement procedures and SBDs to be used for each procurement method, as well as model contracts for works and goods procured, are presented in the Project Implementation Manual prepared by EDM.
Assessment of the Agency’s Capacity to Implement Procurement
19. Procurement activities will be carried out by the Project Management Unit which comprises the Electrification and Project Directorate (DEP) o f Electricidade de Mopambique (EDM). The agency i s staffed by a Project Manager supported by a Project Engineer, an Environmental and Social Specialist, a Transmission and Substation Engineer and a Financial Management Specialist, and the procurement function will be under the responsibility o f the Project Manager, who i s familiar with World Bank procedures and Guidelines and i s also currently managing the EDM component under the Energy Reform and Access Project.
20. An assessment o f the capacity o f the Implementing Agency to implement procurement actions for the project has been carried out by Antbnio Chamupo on April 3, 2007. The assessment reviewed the organizational structure for implementing the project and the interaction between the project’s staff responsible for procurement and financial management which are found to be satisfactory. EDM i s at present implementing satisfactorily i t s component under the Energy Reform and Access Project, with contracts with similar size and complexity to the envisaged under APL-2. However it was noted that record keeping needs some improvements.
68
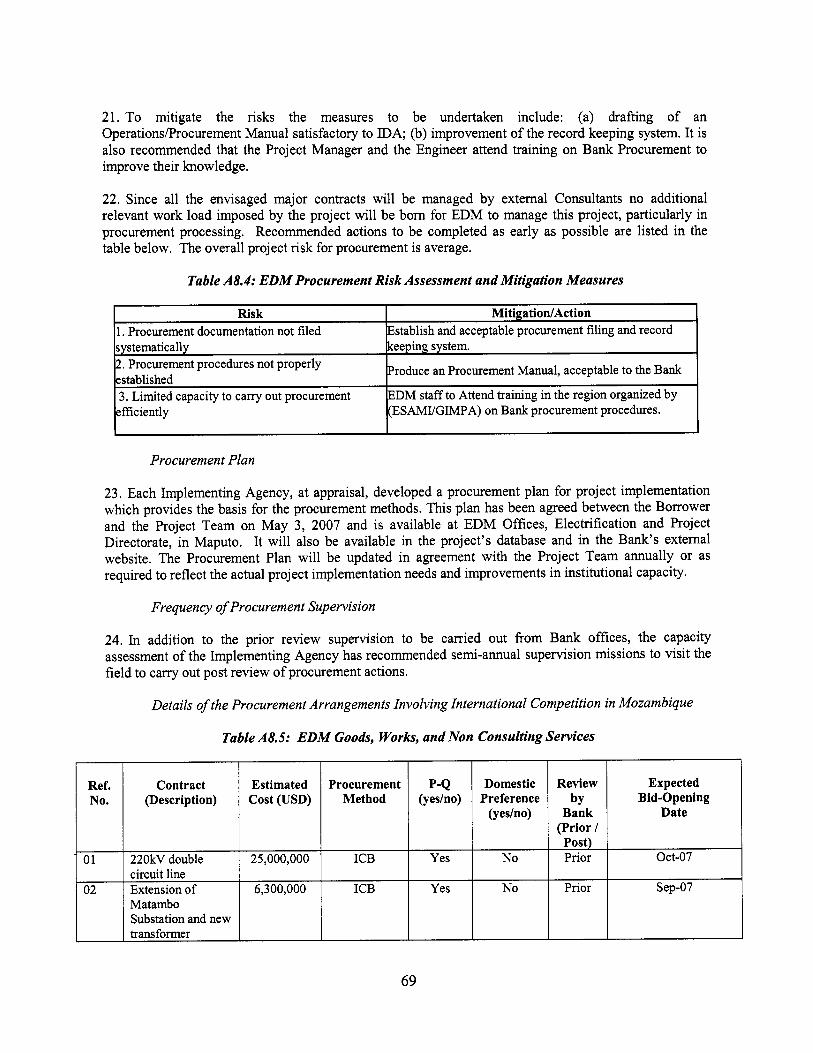
21. To mitigate the r isks the measures to be undertaken include: (a) drafting o f an OperationsProcurement Manual satisfactory to IDA; (b) improvement o f the record keeping system. I t i s also recommended that the Project Manager and the Engineer attend training on Bank Procurement to improve their lmowledge.
Risk MitigationIAction 1. Procurement documentation not filed systematically keeping system. 2. Procurement procedures not properly established 3. Limited capacity to carry out procurement
efficiently
Establish and acceptable procurement f i l ing and record
Produce an Procurement Manual, acceptable to the Bank
EDM staff to Attend training in the region organized by (ESAMVGIMPA) on Bank procurement procedures.
22. Since all the envisaged major contracts will be managed by external Consultants no additional relevant work load imposed by the project will be born for EDM to manage this project, particularly in procurement processing. Recommended actions to be completed as early as possible are listed in the table below. The overall project r isk for procurement i s average.
Review by
Bank (Prior I
Expected Bid-Opening
Date
Procurement Plan
Contract (Description)
23. Each Implementing Agency, at appraisal, developed a procurement plan for project implementation which provides the basis for the procurement methods. T h i s plan has been agreed between the Borrower and the Project Team on May 3, 2007 and i s available at EDM Offices, Electrification and Project Directorate, in Maputo. It wil l also be available in the project’s database and in the Bank’s external website. The Procurement Plan wil l be updated in agreement with the Project Team annually or as required to reflect the actual project implementation needs and improvements in institutional capacity.
Estimated Procurement Cost (USD) Method
Frequency of Procurement Supervision
24. In addition to the prior review supervision to be carried out from Bank offices, the capacity assessment o f the Implementing Agency has recommended semi-annual supervision missions to v i s i t the field to carry out post review o f procurement actions.
Details of the Procurement Arrangements Involving International Competition in Mozambique
Table A8.5: EDM Goods, Works, and Non Consulting Services
Ref. No.
01
02
I I
220kV double I 25,000,000 I ICB circuit line Extension o f I 6,300,000 I ICB Matambo Substation and new transformer
~
P-Q (yesho)
Yes
Yes
Domestic Preference
(yeslno)
No
No
69

03
Table A8.6: EDM List of Consulting Assignments with Short-list of International Firms
Supplyof 1,500,000 ICB NO No Prior July- 08 equipment and training for Hot Line Maintenance
Ref. No.
01
Description of Estimated Selection Review Expected Assignment Cost (USD) Method by Bank Proposals
(Prior / Post) Submission Date Feasibility Study for 1,000,000 QCBS Prior Dec-07 Pombeya-Nampula
I Supervision o f RAP (a) Consultancy services estimated to cost above US$lOO,OOO per contract for firms and US$50,000 equivalent per contract for individuals and single source selection of consultants will be subject to prior review by the Bank.
(b) Short l ists composed entirely of national consultants: Short l ists of consultants for services estimated to cost less than US$100,000 equivalent per contract, may be composed entirely of national consultants in accordance with the provisions of paragraph 2.7 of the Consultant Guidelines.
02 I Preparation and I 200,000 I QCBS I Prior
70
Oct-07
Annex 9: Economic and Financial Analysis AFRICA Mozambique - Malawi Transmission Interconnection
(Southern African Power Market Program APL-2)
A. Economic analysis
1. The proposed project has been analyzed over the period 2007-37. A range o f economic benefits will accrue from the Project for both Mozambique and Malawi. The economic case for the project i s predicated on two-way flows o f energy via the transmission interconnection: imports into Malawi from Mozambique during peak hours and limited off-peak exports from Malawi to Mozambique and the SAPP during off-peak hours. It i s estimated that net economic benefits from the Project will amount to approximately US$360 mil l ion in net present value (NPV) terms, and that the economic internal rate of return (IRR) wil l be approximately 28 percent. The Project i s the least-cost means o f delivering these benefits.
2. This section sets out the underlying assumptions o f the “base case” o f the economic cost-benefit analysis o f the Project. It then details the various economic benefits that will accrue to Mozambique and Malawi, as well as summarizing the sensitivity analysis for these results. The section concludes with an analysis o f least-cost alternatives.
Cost-benefit Analysis
Base case assumptions
3. Peak load demand. Peak load demand growth in Malawi i s assumed to grow at a compounded annual rate o f 4.5 percent from 2007 to 2020, moderating to 4.0 percent between 2020 and 2037. Th is assumed growth rate in the initial period i s less than Malawi’s projected annual economic growth rate o f 6.1 percent in the 2004-09 period (comprised o f two years’ historical growth data plus the current four year forward economic forecast window, as taken from the Country Assistance Strategy (CAS). Furthermore, to maintain the conservativeness o f the load demand forecasts, no increase in energy intensity for existing customers (KWh consumption per connection) i s assumed. Increase in demand i s driven entirely by the 15,000 new connections ESCOM plans to make annually going forward (including 50 new low-voltage commercial customers and 1-2 new large commercial loads). This i s slightly less than the average pace o f connections over the past three years.
4. Installed caDacity. The analysis assumes that planned rehabilitation o f ESCOM’s installed capacity will proceed as planned: that is, repairs to the 40 MW Tedzani plant will be finalized by 2008; there will only be a two-year outage for rehabilitation at the 24 MW Nkula A plant in 201 l-12;36 and the 64 MW expansion o f the Kapichira I1 plant will go ahead as anticipated in 20 1 1.
5. It i s also assumed that technical loss rates associated with the transmission and distribution o f power in Malawi in 2006 were 16.0 percent, or three-quarters o f ESCOM’s recorded total T&D losses in 2006 o f 2 1.3 per~ent .~ ’ I t i s assumed further that, as a result o f efficiency gains in ESCOM’s operations, technical losses will be reduced by one-half percentage point annually, bottoming out at 11 .O percent in 2016.
36 In other words, Nkula A will be taken offline for rehabilitation as soon as the interconnector i s commissioned. It i s assumed further that Nkula B w i l l not be refurbished in the period being analyzed.
’’ Nontechnical and collection losses are not considered in the economic analysis, because although the consumers do not pay for the energy consumed, the economic benefits sti l l accrue to the users.
71
6. Cost o f unserved enerm. The economic cost o f each hour where energy i s not available i s composed o f two principal elements: (a) the cost o f replacing electric power with alternative supplies, and (b) where alternatives are not available, the cost o f economic output lost as a result.
7. Component (a) can be further broke down into two parts: (i)
(ii)
The cost to business o f using alternative energy supplies to maintain output. Mos t enterprises resort to backup diesel generators. For domestic consumers, a “willingness-to-pay” approach can be used which looks at various alternatives to grid electricity, and which also factors in estimates o f elasticity o f demand.
8. A weighted average estimate o f the unit cost o f replacement electric power o f US$16 .0KWh i s used.38 Further, i t i s assumed that 95 percent o f f i r m s have some form o f access to backup power.39 Component (b) captures the costs o f lost production for those businesses without generators. An estimated value o f US$1.4l/KWh i s used.40 However, i t i s also assumed that only 5 percent o f formal f i r m s have n o access to backup power. Combining these various components gives an average cost o f unserved energy o f US$22.2/KWh. Given that this figure i s derived in part f rom the willingness-to-pay o f private sector enterprises, i t i s also assumed that this refers to off-peak energy (that is, during daytime business hours), when the economic cost o f unserved energy i s highest. T o be conservative, it i s assumed that the cost o f unserved energy during peak hours i s U S $ l l.l/KWh, when a large share o f demand i s f rom residential customers.
9. Proiect costs. The investment costs o f the Project are assumed to be incurred over three years, f rom 2008 to 2010, with one-third o f costs incurred in each year. Full project investment costs are set out in Annex 5.41 Ongoing operational and maintenance (O&M) costs are assumed to equal 2.5 percent o f total investment costs ann~a l l y .~ ’ Under the terms o f the new “wheeling agreement’43 - effectively a “use o f system’ charge - Mozambique’s O&M costs will be paid for in full by Malawi.
10. Discount rate. A discount rate o f 10 percent i s used for the economic analysis.
Based on PPA Associates, “Assessment of Short-Term Capacity Requirements in Uganda,” March 2006. The figures in the study have been adjusted to take account o f falls in oil prices; diesel fuel i s assumed to cost US$65 a barrel. In addition, note that this i s a variable cost only (that is, the cost of fuel + fuel transport, multiplied by a generator fue l consumption factor), and does not include capital investment, which keeps the cost of unserved energy figure conservative.
39 Data from World Bank Investment Climate Assessments suggests that in many countries a lower percentage o f firms have access to backup power sources, so this estimate i s conservative.
PPA Associates, “Assessment of Short-Tern Capacity Requirements in Uganda,” March 2006. Th is value i s derived from an analysis of the value of lost production, based on estimates of the economic value-added of the productive sectors of the Ugandan economy that have the greatest reliance on electricity. We assume that Uganda and Malawi, as relatively small, land-locked economies, are broadly comparable in this respect.
4’ Note that investment costs considered exclude subcomponents B and C on both the Malawi and Mozambique side, which relate to institutional strengthening and other capacity-building and technical assistance measures, on the basis that the economic benefits of these other components are not estimated in the analysis.
42 Estimate provided by EDM and set out in the “wheeling agreement’
43 Given that this agreement i s only to cover the cost to Mozambique of financing and maintaining the Mozambique portion o f the interconnector, this i s not strictly a wheeling agreement in a technical sense.
40
72

Overall results
NPV I EIRR Mozambique NPV Mozambique EIRR Malawi NPV Malawi economic EIRR Total project NPV Total project economic EIRR
1 1. The Project i s estimated to deliver the following economic benefits:
Values US$69 mi l l ion
26.1%
US$292 mi l l ion 29.3%
US$36lmil l ion
28.2%
Net present value Mozambique Exports to Malawi
Off-peak imports f rom Malawi, 20 1 1-20 15 Malawi
Exports o f surplus off-peak energy to SAPP
“Wheeling agreement”
Imports from Mozambique to cover deficits
Table A9.2: Summary of Gross Economic Benefits: Base Case
US$ million
56 35 14
359 14
Economic benejts: Mozambique
12. Exports to Malawi. Given Malawi’s projected peak capacity deficits, i t i s expected that Malawi will start importing power via the interconnector as soon as it i s commissioned in 201 1. In the period 201 1- 15, Malawi will face primarily deficits during peak load hours, which run from 6:OOam to 8:OOam and from 6:OOpm to 10:OOpm. As discussed in earlier sections, i t i s assumed that a PSA will be signed between HCB and ESCOM for a net 30 MW o f power on a firm basis.
13, As demand growth in Malawi results in further increases in the peak capacity deficit, it i s assumed that the PSA will be adjusted to a net 50 MW firm capacity from 2015 to 2019, and to a net 120 MW from 2020 onward.* I t i s l ikely that, from 2015 on, not all of this additional capacity will be available from HCB and some will be supplied from incremental sources o f production in Mozambique, including new gas- and coal-fired plants.
14. The economic benefit to Mozambique o f each unit o f energy exported to Malawi i s the unit price of sales to Malawi (as set out in the PSA)45 less the cost o f power production in Mozambique. In the init ial
44 Even at these levels o f net capacity imports, Malawi will s t i l l face sizeable peak deficits, that wi l l need to be managed through a combination of load shedding, demand-side management and, potentially, emergency thermal. Imports are assumed to be relatively small, however, to keep the analysis conservative.
4s For the purposes o f the analysis, an effective ““all-in” energy charge i s used that consolidates both the capacity and energy charges set out in the PSA. T h i s i s equivalent to US$3.7/KWh for 50 MW gross of firm power supplied.
73
period from 2011 to 2015, it i s assumed that the PSA will be with HCB for low-cost hydropower (at a estimated marginal production cost o f U S # l .O/KWh), and that from 2015 onward, Mozambique’s exports to Malawi will be a mix o f low-cost hydropower power and higher cost gas or coal-fired power (estimated at U S ~ ~ S K W ~ ) . ~ ~
15. Wheeling; Aaeement. Under the terms o f the proposed Wheeling Agreement,” the effective financial borrowing rate would be 11 percent (5.0 percent cost o f on-lent capital + a 6.0 percent “EDM mark-up”). Mozambique’s investment costs for the specified items plus the 10 percent contingency stipulated in the draft Wheeling Agreement come to US$39 million. The non-escalating annual payment from ESCOM to EDM that pays o f f the full amount plus interest accrued i s US$4 million, generating an IRR o f 11.7 percent for this sub~omponent.~’
16. Off-peak imDorts from Malawi, 201 1-15, EDM does not face a capacity deficit in the forecast period. I t can, however, substitute gas or coal-fired energy production, estimated at the hl ly loaded cost o f US#3.5/KWh, for cheaper Malawian hydro production in the period 2011-15.4* From Malawi’s side, while there are systemic peak deficits at all points o f the projection period, there will be limited surplus off-peak energy that can be exported to M~zambique.~’ I t i s assumed that Malawi will se l l energy at the forecasted off-peak price o f the SAPP STEM.
17. From Mozambique’s perspective, the economic value o f each unit o f off-peak energy imported i s the fully loaded cost o f domestic gas power production less the forecasted off-peak STEM price for that year.
18. Connection to northern Mozambiaue. Wh i le harder to quantify, there are additional potential economic benefits for Mozambique from the interconnector. In particular, Mozambique has identified a need to improve the supply o f power to the northern regions o f the country, centered on the Nampula area, which are currently served via a very long and relatively low-voltage radial line. Extension o f the interconnector from the Phombeya substation across Malawi and back into northern Mozambique would provide greater reliability o f supply to the north by providing an alternative route to the current l ine. A new high-voltage line would also allow greater loads to be supplied to northern Mozambique in the future, as demand grows, as well as reducing technical losses. The economic benefits to Mozambique o f this connection could be substantial, but they are both difficult to calculate and are not actually realized by the Project itself, and thus have not been factored into the economic analysis.
46 The unit costs from the new gas and coal plants factor in the cost o f the original fixed investment and ongoing variable costs (cost o f operations, including fuel, and maintenance). Estimate provided by EDM.
47 Th is aligns with the 12% “return on investment” stipulated in the new draft wheeling agreement.
48 After 2015, i t i s assumed that EDM will s ign a firm PSA with an IPP in Mozambique in order to meet growing peak demand; as such, there will be no further economic incentive to import off-peak incentive from Malawi.
49 In the scenario with Kapichira I1 commissioned by 201 1, off-peak energy surpluses persist until 2021; without Kapichira I1 commissioned, all off-peak surpluses are exhausted by 2015.
74
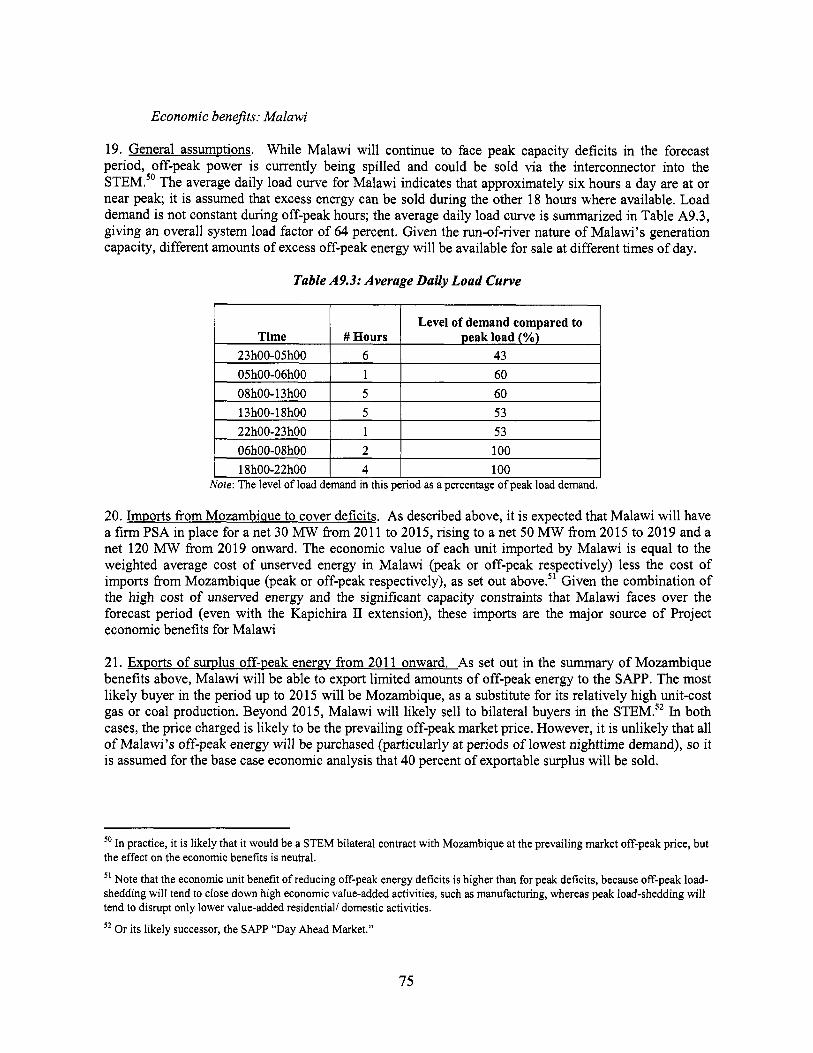
Economic benejts: Malawi
Time 23h00-05h00 05hOO-06hOO 08h00- 13 hOO 13h00-18h00 22hOO-23hOO
19. General assumptions. Whi le Malawi will continue to face peak capacity deficits in the forecast period, off-peak power i s currently being spilled and could be sold via the interconnector into the STEM.” The average daily load curve for Malawi indicates that approximately six hours a day are at or near peak; it i s assumed that excess energy can be sold during the other 18 hours where available. Load demand i s not constant during off-peak hours; the average daily load curve i s summarized in Table A9.3, giving an overall system load factor o f 64 percent. Given the run-of-river nature o f Malawi’s generation capacity, different amounts o f excess off-peak energy will be available for sale at different times o f day.
~~ ~
Level of demand compared to # Hours peak load (%)
6 43 1 60 5 60 5 53 1 53
Table A9.3: Average Daily Load Cuwe
06h00-08h00 18h00-22h00
2 100 4 100
20. ImPorts from Mozambiaue to cover deficits. As described above, i t i s expected that Malawi will have a firm PSA in place for a net 30 MW from 201 1 to 2015, rising to a net 50 MW from 2015 to 2019 and a net 120 MW from 2019 onward. The economic value o f each unit imported by Malawi i s equal to the weighted average cost o f unserved energy in Malawi (peak or off-peak respectively) less the cost o f imports from Mozambique (peak or off-peak respectively), as set out above.” Given the combination o f the high cost o f unserved energy and the significant capacity constraints that Malawi faces over the forecast period (even with the Kapichira 11 extension), these imports are the major source o f Project economic benefits for Malawi
2 1. Exports o f sumlus off-Peak enerm from 20 1 1 onward. As set out in the summary o f Mozambique benefits above, Malawi will be able to export limited amounts o f off-peak energy to the SAPP. The most likely buyer in the period up to 2015 wil l be Mozambique, as a substitute for i t s relatively high unit-cost gas or coal production. Beyond 2015, Malawi will l ikely sel l to bilateral buyers in the STEMSs2 In both cases, the price charged i s likely to be the prevailing off-peak market price. However, i t i s unlikely that all o f Malawi’s off-peak energy will be purchased (particularly at periods o f lowest nighttime demand), so i t i s assumed for the base case economic analysis that 40 percent o f exportable surplus will be sold.
” In practice, i t i s likely that i t would be a STEM bilateral contract with Mozambique at the prevailing market off-peak price, but the effect on the economic benefits i s neutral.
’’ Note that the economic unit benefit of reducing off-peak energy deficits i s higher than for peak deficits, because off-peak load- shedding wil l tend to close down high economic value-added activities, such as manufacturing, whereas peak load-shedding will tend to disrupt only lower value-added residential/ domestic activities.
’* Or i ts likely successor, the SAPP “Day Ahead Market.”
75
22. The economic benefit to Malawi o f each unit o f energy exported to Malawi i s the forecasted unit price o f sales to Mozambique or the STEM less the marginal cost o f each Malawian hydropower energy unit generated, estimated at approximately US$ 1 . O / K W h .
Sensitivity analysis
23. Wh i le any o f the assumptions used in the analysis, as detailed above, will have an impact on the economic cost-benefit ratio o f the Project, three main scenarios were analyzed in order to test the robustness o f the base case analysis to changes in the values o f the main variables.
24. Changes in hvdroloaical conditions. Perhaps the most significant exogenous variable in the economic analysis i s that o f variations in hydrological conditions in Malawi. Diversifying Malawi’s sources o f energy supply in order to mitigate the impact o f changing hydrological conditions on Malawi’s domestic energy production i s a major development objective o f this Project. With the exception o f the small 4 MW hydro plant at Wowve, all o f Malawi’s hydro capacity i s derived from three sets o f plants on the Shire River, which i s fed primarily by Lake Malawi.
25. The base case scenario presented above takes a long-run mean o f f low rates on the Shire River 53
recorded between 1954 and 2002. Years with incomplete data, and when flow rates are artificially altered due to human intervention (such as in 1965-66, when the Liwonde barrage was under construction) are excluded from the dataset.
26. Two scenarios were analyzed, to assess the robustness o f the results to different flows o f the River Shire. The f i rst scenario identified the ten-year period o f highest flows recorded. However, using the flows o f this ten-year period has no impact on the results. This i s because the rate at which energy can be generated by the hydropower plants on the Shire i s constrained the lower o f two factors: a “turbine capacity” factor (that is, the maximum energy that can be generated by the turbines themselves, no matter the volume o f water flow) and a “water flow” factor (that is, the volume o f water flowing through the turbines). In the average scenario, the turbine capacity factor i s already the constraint on energy production-and hence the higher water flows o f this scenario do not generate additional energy. In other words, the Project does not face any risk o f lower economic returns as a result o f higher water flows in the Shire.
27. The second scenario i s a more important analysis, which looks at the impact o f a drought in Malawi. The principal effect would be to lower the level o f Lake Malawi, which in turn would reduce the water flow through the turbines o f the hydro plants, which becomes the constraint on energy production. From the perspective o f the economic analysis for this stand-alone Project, this i s a “high-case” scenario, because it implies a greater economic need for the interconnector. For the purposes o f the analysis, the drought scenario used was that o f the worst continuous three year drought period for which there i s data. This i s in the period 1995-98, in which water f low fe l l to a monthly average o f 161 cubic meters per second, 41 percent o f the long-run monthly average flow o f 393 cubic meters per second. The assumption i s that this low river flow scenario would be repeated from 2012-14; that is, one year after the interconnector i s commissioned. More extreme drought scenarios could be envisaged, particularly given that the Shire River dried up entirely in the 1930s. For more severe drought conditions, the economic benefits o f the interconnection increase.
28. In a drought scenario, Malawi would be faced with an energy shortfall incremental to those already being experienced in the base case scenario. Peak energy shortages would more than double and there
53 As measured at the Liwonde barrage.
76
would also be off-peak energy shortages for certain hours o f the day. However, i t i s unlikely that Malawi would be able to negotiate firm PSAs to cover these incremental deficits, given the capacity shortfalls forecasted for the SAPP region and the unpredictable nature o f drought. It i s therefore assumed that only 50 percent of the peak and 70 percent o f the off-peak incremental energy deficits will be filled, at conservative (that is, relatively expensive) unit costs o f US#4.0/KWh for off-peak and US#7.0/KWh for peak.
29. I t should be noted that while the drought scenario results in incremental economic benefits for Malawi from the import of power via the interconnector to cover energy shortfalls, this i s somewhat offset by reduced off-peak exports to the SAPP. This i s shown in the table o f sensit ivi ty analysis results below. The balance o f benefits also changes for Mozambique: drought in Malawi means that Mozambican exports will increase, while there will be less possibility for substituting Mozambican gas-fired production for Malawian off-peak hydro production in the 201 1-15 period. Overall, the three-year drought scenario reinforces the economic case for the interconnector project, increasing net economic benefits by over US$40 million, and increasing the ERR from 28 percent to 34 percent. A longer or more severe period o f drought would increase the benefits fiwther.
30. Changes in sumlv and demand for enerm in the SAPP. The projected economic benefits o f Malawi’s imports and exports o f energy are not independent variables, but are both a function o f the aggregate energy situation in the SAPP.
3 1. In this context, a second scenario considered was that o f a “constrained” aggregate energy situation in the SAPP-that is, a combination o f relatively greater demand for energy and relatively lower supply. In this scenario, i t i s l ikely that Malawi would be able to export a higher percentage o f i t s surplus off-peak energy. But at the same time, the unit cost o f imports would l ikely increase. To model this scenario, i t i s assumed that Malawi exports 50 percent o f off-peak energy surplus into the STEM, up from 40 percent in the base case, and that, from 2015, the effective energy unit price in the PSA negotiated between Malawi and Mozambique will increase by 20 percent. The analysis shows that the increased costs o f imports for Malawi would exceed the benefits o f greater off-peak exports, driving down overall economic benefits of the project. Conversely, Mozambique’s net benefits would increase somewhat.
32. The third scenario considered was the alternative situation where there i s a “plentiful’ aggregate energy situation in the SAPP-that is, a combination o f relatively high supply for energy and relatively lower demand. In this scenario, it i s likely that Malawi would export a lower percentage o f i t s surplus off- peak energy, but that the unit cost o f imports would l ikely decrease. To model this scenario, it i s assumed that Malawi exports 30 percent o f off-peak energy surplus into the STEM and that, from 2015, the effective energy unit price in the PSA negotiated between Malawi and Mozambique will decrease by 20 percent. The analysis shows that while off-peak energy exports would decline, this would be more than offset by lower costs o f imports for Malawi, increasing the overall economic benefits o f the project. Conversely, Mozambique’s net benefits would decrease somewhat.
33. The results below show that, while these two scenarios produce a different distribution o f net economic benefits for Malawi and Mozambique, the net economic benefits o f undertaking the project remain positive for both countries in both scenarios. The overall impact o f these two scenarios on project NPV and EIRR i s almost precisely neutral, with overall project NPV remaining at approximately US$360 million.
77
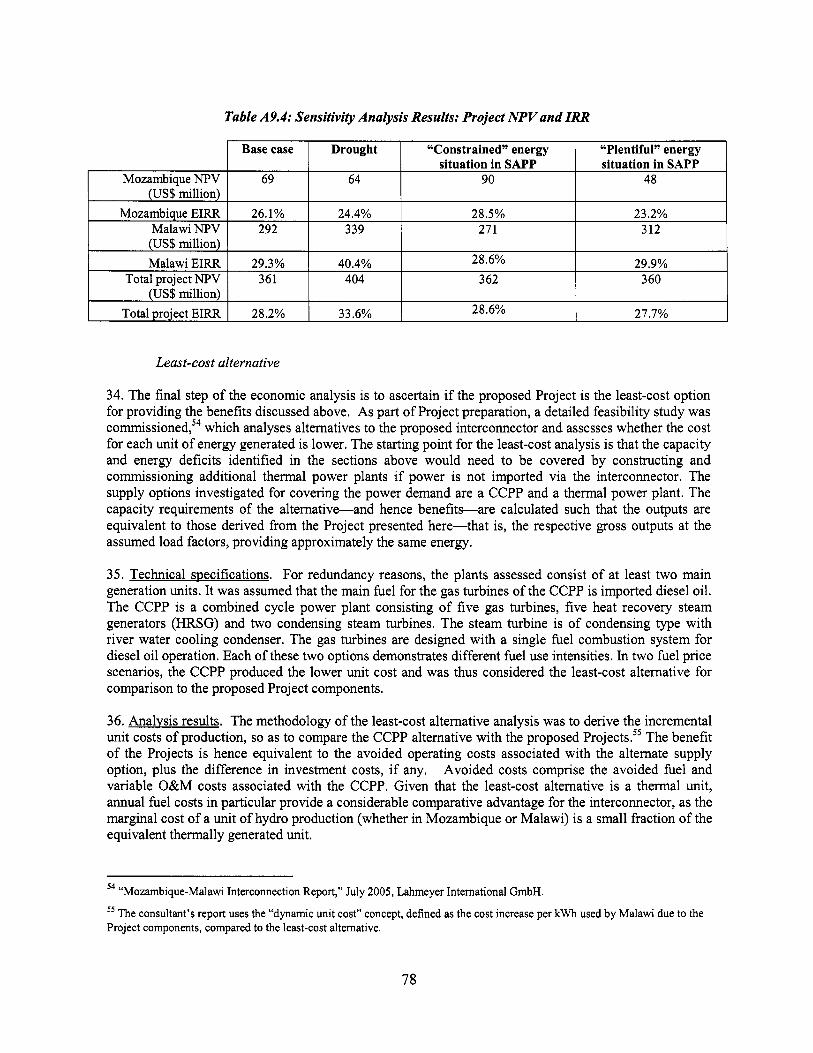
Table A9.4: Sensitivity Analysis Results: Project NPV and I .
Least-cost alternative
34. The final step o f the economic analysis i s to ascertain if the proposed Project i s the least-cost option for providing the benefits discussed above. As part o f Project preparation, a detailed feasibility study was commi~s ioned,~~ which analyses alternatives to the proposed interconnector and assesses whether the cost for each unit o f energy generated i s lower. The starting point for the least-cost analysis i s that the capacity and energy deficits identified in the sections above would need to be covered by constructing and commissioning additional thermal power plants if power i s not imported via the interconnector. The supply options investigated for covering the power demand are a CCPP and a thermal power plant. The capacity requirements o f the alternative-and hence benefits-are calculated such that the outputs are equivalent to those derived from the Project presented here-that is, the respective gross outputs at the assumed load factors, providing approximately the same energy.
35. Technical mecifications. For redundancy reasons, the plants assessed consist o f at least two main generation units. It was assumed that the main fuel for the gas turbines o f the CCPP i s imported diesel oil. The CCPP i s a combined cycle power plant consisting o f five gas turbines, five heat recovery steam generators (HRSG) and two condensing steam turbines. The steam turbine i s o f condensing type with river water cooling condenser. The gas turbines are designed with a single fuel combustion system for diesel o i l operation. Each o f these two options demonstrates different fuel use intensities. In two fuel price scenarios, the CCPP produced the lower unit cost and was thus considered the least-cost alternative for comparison to the proposed Project components.
36. Analysis results. The methodology o f the least-cost alternative analysis was to derive the incremental unit costs o f production, so as to compare the CCPP alternative with the proposed Projects.55 The benefit o f the Projects i s hence equivalent to the avoided operating costs associated with the alternate supply option, plus the difference in investment costs, i f any. Avoided costs comprise the avoided fuel and variable O&M costs associated with the CCPP. Given that the least-cost alternative i s a thermal unit, annual fuel costs in particular provide a considerable comparative advantage for the interconnector, as the marginal cost o f a unit o f hydro production (whether in Mozambique or Malawi) i s a small fraction o f the equivalent thermally generated unit.
54 “Mozambique-Malawi Interconnection Report,” July 2005, Lahmeyer International GmbH.
” The consultant’s report uses the “dynamic unit cost” concept, defined as the cost increase per kwh used by Malawi due to the Project components, compared to the least-cost alternative.
78

37. The NPV o f the avoided operational cost (fuel and variable O&M) compared to the alternative CCPP was calculated in the study at approximately US$457 mil l ion using a discount rate o f 10 percent. This represents a considerable benefit stream for the interconnector, especially in light of potential fuel price movements. While the precise energy volume on which this calculation i s l ikely to have changed since the estimates were made in mid-2005, the analysis confirms that on a per-unit basis, operational costs o f the CCPP alternative are considerably higher than for the interconnector option. Furthermore, the investment costs for the interconnector are estimated to be somewhat lower than that o f the least-cost alternative supply option. The analysis also assumed that the alternate plant will go into operation at the same time as the interconnector project-that is, late 2010.56 Given that construction time for the CCPP least-cost alternate option i s greater than for the interconnector Project, capital expenditures would be incurred earlier, increasing the investment costs o f the least-cost alternative in NPV terms.
38. Conclusion. The study established that implementation o f the interconnection i s the more economic option. The unit cost o f energy provided by the interconnector i s calculated to be US943.16KWh versus an equivalent unit cost for the CCPP alternative supply o f [email protected].
B. ESCOM, Malawi Financial Analysis
ESCOM’s historical financial situation
39. During the period FY03 to FY07 ESCOM has been able to cover all operating costs (including depreciation and bad debts) and interest costs from the tariff it charges to consumers (currently about UScents 4.3kWh). However, very poor collection performance in the past coupled with rapid devaluation o f Malawi Kwacha especially during the 1990s resulted in inadequate cash flows to meet increasing debt service obligations. In FY06 ESCOM was able to pay 79% o f i ts debt service obligations to lenders that have extended direct loans to the company, but it has been unable to meet i t s debt service obligations on the remainder o f direct loans and to the Government for on-lent loans. The Government has recently taken steps to restructure ESCOM’s debt (described in Annex 9) through a combination o f debt-equity conversion and conversion o f some foreign currency-denominated loans which have been included in the HIPC arrangements, into Kwacha-denominated loans.
40. Debt Restructuring. The Government has recently taken steps to restructure ESCOM’s debt through a combination o f debt-equity conversion and conversion o f some dollar-denominated loans, which have been included in the HIPC arrangements, into Kwacha-denominated loans. In 2004 Ministry o f Finance and ESCOM reached agreement on a debt-equity swap to convert two on-lent IDA credits, totalling US$138 mil l ion (12.76 bil l ion Kwacha) from debt to equity on the basis that (i) that both these credits have been treated under HIPC so that the Government has no further budgetary outflows related to these projects, and (ii) ESCOM has not been able to service these debts. The credits in question are (i) Fifth Power Project, Credit Number 2386 which closed in June 2000 and (ii) Energy 1 Project, Credit Number 1990 MAI, which closed in February 1996. As per the Development Credit Agreements for these two projects, the Government needs to seek approval from IDA for this restructuring before it i s concluded. The Government will make the appropriate request to IDA as a matter o f urgency.
41. The World Bank Implementation Completion Reports (ICR’s) for each project clearly indicate that the rapid devaluation o f the Kwacha relative to the USD which occurred in the 1990’s was the key factor underlying ESCOM’s inability to service these debts, since as per the legal agreements ESCOM bears the exchange rate risk. From the ICR for IDA2386, Dec, 2000: “The Kwacha depreciated from about 2.9 to
56 T h i s i s a conservative assumption for the sake o f the economic analysis.
79

the dollar at appraisal to about 55 to the dollar at project closing. ESCOM has applied the adjustment formula twice since its inception, but these adjustments have not been sufJicient in keeping the t a r i r i n parity with the sharply depreciating currency ....... The inadequate adjustment of electricity tarifs to cost recovery compromised ESCOM's financial performance and prevented it from meeting the project's Jinancial covenants and its debt service obligations".
42. A key lesson f rom the above i s that if ESCOM i s to bear the foreign exchange risk o f an on-lent credit, then the tariff that E S C O M i s permitted to charge to customers must adjust with respect t o the exchange rate movements. An automatic tar i f f adjustment mechanism i s in place to allow for adjustments to compensate for exchange rate movements and inflation. Since 2004, this mechanism has been largely effective (albeit with some delays in implementing the required tariff adjustments) and has prevented significant erosion o f the tar i f f in USD terms5'.
The Government has already taken actions to address this issue.
43. Another consideration f rom the experience o f the previous projects i s that in the case o f an exchange rate shock (i.e. a rapid devaluation over a short period o f time) when it i s unrealistic t o pass o n the full effect o f devaluation to customers immediately, there could be a mechanism by which Government absorbs some o f the impact o f such an exchange rate shock until the situation stabilizes and the end-use customer tariff has been adjusted to the appropriate level. The Financial Sustainability Plan wil l address the issue o f exchange rate shocks and propose a mechanism such that if any limitations are imposed on the automatic adjustment mechanism to avoid tar i f f shocks, E S C O M would be financially compensated by the Government.
44. In addition, the Government has converted US$23 mi l l ion equivalent o f foreign currency- denominated loans covered under HIPC, to Kwacha-denominated loans. E S C O M n o longer bears the foreign exchange risk for these loans. The effect o f these measures has been to reduce future debt service obligations o f ESCOM from US$23 mi l l ion equivalent per year in FY04 to US$14 mi l l i on equivalent in FY07, and to significantly reduce ESCOM's exposure to foreign exchange risk.
45. Table A9.5 summarizes the operating and financial performance o f E S C O M during FY03-07.
'' Average revenue rate was USc 4.47 kwh in FY04 and i s estimated at USc 4.33 kwh in FY07.
80

Table A9.5: Past Financial Performance of ESCOM (FY2003-07)
2003 2004 2005 2006 2007 Audited Audited Prov. Estimates Estimates
Net generation (GWh) 1,160 1,270 1,368 1,390 1,444 T&D losses (“h) 19.2 21.9 22.9 19.7 19.2 Total energy sold (GWh) 938 993 1,055 1,117 1,167
Average revenue rate (kwacha/kWh)-Nominal a 3.56 3.75 5.46 5.31 6.07 % Increase in nominal rate -7 5 45 -3 14
Revenue from electricity sales (US$ million) 43.2 44.4 56.9 47.4 50.5
Foreign exchange gains/losses (US$ million) (41.5) (35.4) (3.0) (6.8) ( 3 4
Operating costs (US$ million) 36.1 41.0 49.4 39.5 40.7 Operating income after interest (US$ million) 2.6 (3.7) 15.8 13.2 10.3
Earnings before tax (US$ million) (39.0) (39.0) 12.8 6.4 6.7 Gross accounts receivable (US$ million) 25.5 27.4 27.4 24.2 26.0 Accounts receivable (months o f sales equivalent) 6.9 1 8.17 6.29 6.87 6.17
a. Average revenue rate i s defined as revenues from selling electricity divided by the kwh o f energy billed to end consumers in Malawi.
Major issues from ESCOM’s past financial peflormance
46. Poor Financial Reporting. The ESCOM audit report for FY05 has only recently been completed and i s scheduled for presentation to the ESCOM Board in May 2007. The FY06 audit report i s also overdue. This situation means that financial assessment o f the current state o f the company i s based to a large extent on unaudited figures. This introduces some uncertainty in the financial projections, although there have been no material adjustments on the audit in recent years. ESCOM i s working to improve i t s accounting. It i s planned that the FY06 audit report would be ready in December 2007, and work would start immediately on the FY07 audit.
47. Poor collection o f customer arrears. Collection performance remains far from satisfactory. Accounts receivable stood at more than 8 months o f sales equivalent in FY04. Most recent (February 2007) numbers show some improvement with accounts receivable at 6.17 months o f sales equivalent, in part due to an active program o f disconnecting non-paying customers. In FY05, the amount collected was 92% o f amount billed. Estimates for FY06 and FY07 indicate that recently there has been further improvement in the collection performance. However, despite the recent improvement, poor collection performance in earlier years has resulted in accumulation o f arrears. Assessment o f the recoverability o f these arrears will be included in the development o f the Financial Sustainability Plan described below.
48. Rapid devaluation o f local currency. Between 1991 and 2001, the local currency fe l l from 2.9 Kwacha/US$ to 55 Kwacha/US$. By April 2007, the exchange rate stood at 138 Kwacha/US$. The Kwacha value o f ESCOM’s long te rm debt obligations rose accordingly. These increases in the outstanding amount o f long term debts were reported in the income statement as foreign exchange losses5*. These foreign exchange losses have been a major cause o f the negative earnings reported in ESCOM’s recent audited accounts, particularly FY03 and FY04. The increasing obligations due to currency devaluations contributed to ESCOM’s inability to fully service debts, and by FY03, the debt to total capital ratio had risen to 90%. The debt restructuring described above was undertaken in part to address this situation.
58 According to International Accounting Standard (IAS) 21, differences in obligations arising from changes in exchange rate should be dealt with as income/expense in the period in which they arise.
81
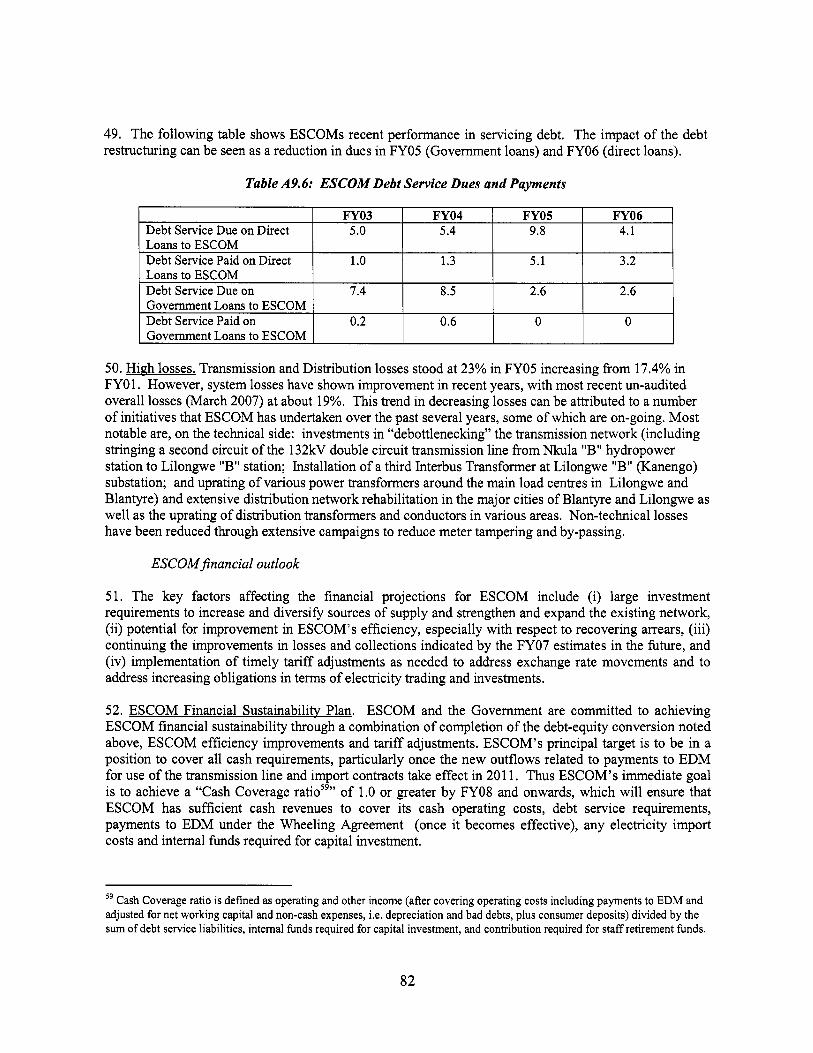
49. The following table shows ESCOMs recent performance in servicing debt. The impact o f the debt restructuring can be seen as a reduction in dues in FY05 (Government loans) and FY06 (direct loans).
Debt Service Due o n Direct Loans to E S C O M Debt Service Paid o n Direct Loans to E S C O M Debt Service Due o n
Table A9.6: ESCOM Debt Service Dues and Payments
FY03 FY04 FY05 FY06 5.0 5.4 9.8 4.1
1 .o 1.3 5.1 3.2
7.4 8.5 2.6 2.6
Debt Service Paid o n 0.2 0.6 0 0 Government Loans to E S C O M I
50. High losses. Transmission and Distribution losses stood at 23% in FY05 increasing from 17.4% in FYOl . However, system losses have shown improvement in recent years, with most recent un-audited overall losses (March 2007) at about 19%. This trend in decreasing losses can be attributed to a number o f initiatives that ESCOM has undertaken over the past several years, some o f which are on-going. Most notable are, on the technical side: investments in "debottlenecking" the transmission network (including stringing a second circuit o f the 132kV double circuit transmission line from Nkula "B'l hydropower station to Lilongwe "B" station; Installation o f a third Interbus Transformer at Lilongwe "B'l (Kanengo) substation; and uprating o f various power transformers around the main load centres in Lilongwe and Blantyre) and extensive distribution network rehabilitation in the major cities o f Blantyre and Lilongwe as well as the uprating o f distribution transformers and conductors in various areas. Non-technical losses have been reduced through extensive campaigns to reduce meter tampering and by-passing.
ESCOMjnancial outlook
51. The key factors affecting the financial projections for ESCOM include (i) large investment requirements to increase and diversify sources o f supply and strengthen and expand the existing network, (ii) potential for improvement in ESCOM's efficiency, especially with respect to recovering arrears, (iii) continuing the improvements in losses and collections indicated by the FY07 estimates in the future, and (iv) implementation o f timely tariff adjustments as needed to address exchange rate movements and to address increasing obligations in terms o f electricity trading and investments.
52. ESCOM Financial Sustainabilitv Plan. ESCOM and the Government are committed to achieving ESCOM financial sustainability through a combination o f completion o f the debt-equity conversion noted above, ESCOM efficiency improvements and tariff adjustments. ESCOM's principal target i s to be in a position to cover all cash requirements, particularly once the new outflows related to payments to EDM for use o f the transmission line and import contracts take effect in 201 1. Thus ESCOM's immediate goal i s to achieve a "Cash Coverage ratio59" o f 1.0 or greater by FY08 and onwards, which will ensure that ESCOM has sufficient cash revenues to cover i t s cash operating costs, debt service requirements, payments to EDM under the Wheeling Agreement (once it becomes effective), any electricity import costs and internal funds required for capital investment.
59 Cash Coverage ratio i s defined as operating and other income (after covering operating costs including payments to EDM and adjusted for net working capital and non-cash expenses, i.e. depreciation and bad debts, plus consumer deposits) divided by the sum of debt service liabilities, internal funds required for capital investment, and contribution required for staff retirement funds.
82
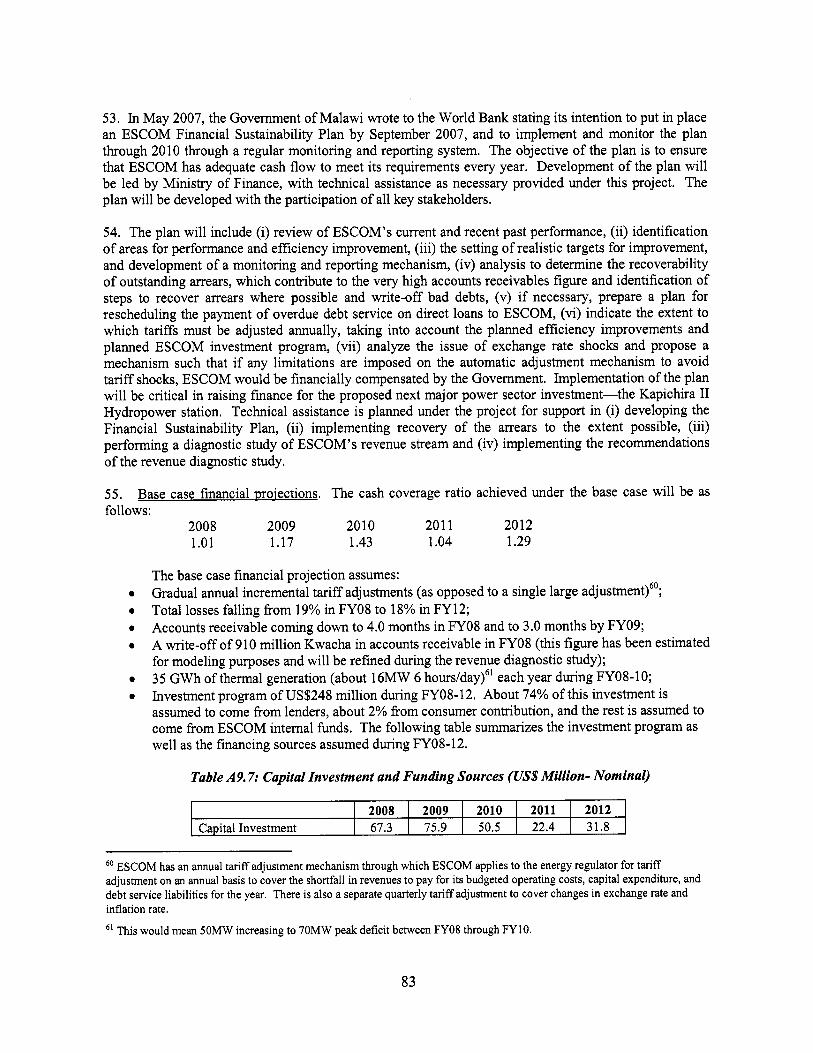
53. In May 2007, the Government o f Malawi wrote to the World Bank stating i t s intention to put in place an ESCOM Financial Sustainability Plan by September 2007, and to implement and monitor the plan through 2010 through a regular monitoring and reporting system. The objective o f the plan i s to ensure that ESCOM has adequate cash flow to meet i t s requirements every year. Development o f the plan will be led by Ministry o f Finance, with technical assistance as necessary provided under this project. The plan will be developed with the participation o f all key stakeholders.
Capital Investment
54. The plan will include (i) review o f ESCOM’s current and recent past performance, (ii) identification o f areas for performance and efficiency improvement, (iii) the setting o f realistic targets for improvement, and development o f a monitoring and reporting mechanism, (iv) analysis to determine the recoverability o f outstanding arrears, which contribute to the very high accounts receivables figure and identification o f steps to recover arrears where possible and write-off bad debts, (v) if necessary, prepare a plan for rescheduling the payment o f overdue debt service on direct loans to ESCOM, (vi) indicate the extent to which tariffs must be adjusted annually, taking into account the planned efficiency improvements and planned ESCOM investment program, (vii) analyze the issue o f exchange rate shocks and propose a mechanism such that if any limitations are imposed on the automatic adjustment mechanism to avoid tariff shocks, ESCOM would be financially compensated by the Government. Implementation o f the plan will be critical in raising finance for the proposed next major power sector investment-the Kapichira I1 Hydropower station. Technical assistance i s planned under the project for support in (i) developing the Financial Sustainability Plan, (ii) implementing recovery o f the arrears to the extent possible, (iii) performing a diagnostic study of ESCOM’s revenue stream and (iv) implementing the recommendations o f the revenue diagnostic study.
2008 2009 I 2010 I 2011 I 2012 67.3 75.9 I 50.5 I 22.4 I 31.8
55. follows:
Base case financial proiections. The cash coverage ratio achieved under the base case will be as
2008 2009 2010 201 1 2012 1.01 1.17 1.43 1.04 1.29
The base case financial projection assumes: Gradual annual incremental tariff adjustments (as opposed to a single large adjustment)60; Total losses falling from 19% in FY08 to 18% in FY12; Accounts receivable coming down to 4.0 months in FY08 and to 3.0 months by FY09; A write-off o f 910 mil l ion Kwacha in accounts receivable in FY08 (this figure has been estimated for modeling purposes and will be refined during the revenue diagnostic study); 35 GWh o f thermal generation (about 16MW 6 hoUrs/day)61 each year during FY08-10; Investment program o f US$248 mil l ion during FY08-12. About 74% o f this investment i s assumed to come from lenders, about 2% from consumer contribution, and the rest i s assumed to come from ESCOM internal funds. The following table summarizes the investment program as well as the financing sources assumed during FY08-12.
Table A9.7: Capital Investment and Funding Sources (US$ Million- Nominal)
6o ESCOM has an annual tariff adjustment mechanism through which ESCOM applies to the energy regulator for tariff adjustment on an annual basis to cover the shortfall in revenues to pay for its budgeted operating costs, capital expenditure, and debt service liabilities for the year. There i s also a separate quarterly tariff adjustment to cover changes in exchange rate and inflation rate.
Th is would mean 50MW increasing to 70MW peak deficit between FY08 through FY 10.
a3

Financed by: Long Term Debt I 51.6 I 62.0 I 38.6 I 11.2 I 19.7 Consumer Contribution ESCOM Internal Funds
0.7 0.8 0.9 0.9 0.9 15.1 13.1 11.1 10.3 11.3
56. The base case shows that the break-even cash coverage target would be achieved or exceeded in all years through 2012 with an actual tariff increase o f 5% annually f iom 2008 through 201 16*. Table A9.8 provides a summary o f ESCOM's actual and projected (assuming the base case) yearly cash flows for years 2004 to 2012.
Avg. Revenue Rate (Avg. Tariff) (KwachakWh) YO Increase
Table A9.8: Summary Base Case Cash Flow (in US$ Million)
04 05 06 07 08 I 09 I 10 I 11 I 12 08-12 Actual Est. Est. Est forecast Avg
3.75 5.46 5.31 6.07 6.37 6.69 7.03 7.38 7.60 7.01 5.4 45.5 (2.6) 14.3 5.0 5.0 5.0 5.0 3.0 4.6
Ne t CashFlows fromOperations Cash Flows from External
9.3 19.7 20.4 17.2 31.0 33.4 33.8 31.5 38.2 33.6
Cash Coverage Ratio Debt Service Coverage Ratio Collection-Generation Ratio
57. Financial moiections for alternative scenarios and sensitivity analysis. The following scenarios were also considered. In all cases the assumptions are the same as for the base case, with the exception o f the assumption specified in the scenario.
0.25 0.87 0.90 0.81 1.01 1.17 1.43 1.04 1.29 1.19 (0.61) 1.35 0.99 1.16 1.64 1.84 2.49 1.60 1.80 1.87 65% 71% 75% 78% 83% 85% 80% 80% 81% 82%
(a) Slow Efficiency Improvement, - Total Losses: 2008:19.2%, 2009:19.0%, 2010:18.9%, 2011: 18.75%, 2012 : 18.5% - Accounts receivable (months): 2008:6.0,2009:5.5,2010:5.0,2011: 4.0,2012: 3.5
- Total Losses: 2008:19.0%, 2009:18.5%, 2010:18.0%, 2011: 18.0%, 2012 : 18.0% - Accounts receivable (months): 3.5 months in 2008 and 3 months thereafter
(b) Fast Efficiency Improvement.
(c) The price o f imported electricity increases by 20% (d) The price o f imported electricity decreases by 20% (e) The price for exported electricity increases by 20% ( f ) The price for exported electricity decreases by 20%
'* The base case assumes that peak load shedding wil l continue until the interconnection i s operational. The alternative would be for ESCOM to make greater use of i ts existing thermal generation during peak times. However the cost of generation from the thermal units i s relatively high and greater use would imply a higher, earlier tariff increase.
84

58. The results are shown in the table:
Table A9.9: Percent Tariff Increase Under Various Scenarios
59. Financial Covenants 0
0
0
Implementation o f agreed ESCOM Sustainable Financial Plan Cash coverage ratio63 from 2008 onward: greater than or equal to 1 .O Collection-generation ratio64 from 2008 onward: > 75 percent.
Assumptions used in the model
66. The financial projections are based on available generation and sales data, and financial information from ESCOM’s audited accounts from FYOl through FY04 65, provisional accounts for FY05, estimates for FY06 and budget for FY0766. Financial projections are based in part on trends reflected in the historical accounts and in part on technical and financial performance targets and indicators agreed upon between ESCOM and IDA for the period FY008-12, especially for improved system management and decreased arrears in accounts receivable. The projections are expressed in current terms, using costs calculated in mid-2007, and i s based on the local inflation assumptions and exchange rate assumptions in the following table.
T h e cash coverage ratio i s defined as operating and other income (adjusted for net working capital and non-cash expenses) plus consumer deposits divided by the sum of debt service liabilities, internal funds required for capital investment, and contribution required for staff retirement funds. A cash coverage ratio of 1 .O will ensure that ESCOM has sufficient cash revenues to cover its cash operating costs, debt service requirements, and internal funds required for capital investment.
64 The collection-generation ratio measures how much of energy generated was actually collected in cash from customers. I t captures T&D losses, billing and collection performance. The term “collection-generation ratio” means: energy collected by ESCOM divided by energy sent out by ESCOM; energy collected by ESCOM i s equal to energy sent out to ESCOM less transmission and distribution losses in ESCOM’s system multiplied by ESCOM’s billing collection ratio; energy sent out means energy from ESCOM’s generation systems and energy entering ESCOM’s systems through purchases; and ESCOM billing collection ratio means energy collected divided by energy billed.
.5’ The audited accounts were unqualified with the exception in FYOO when the auditor expressed qualification related to non- recognition of an estimated K158.9 million in unhnded defined benefits obligation.
66 Until FY04, ESCOM had fiscal year ending March 31. Starting from FY06, ESCOM switched to fiscal year ending June 30. As a transitional phase, FY05 covered the period from April 1,2004 to June 30,2005.
85
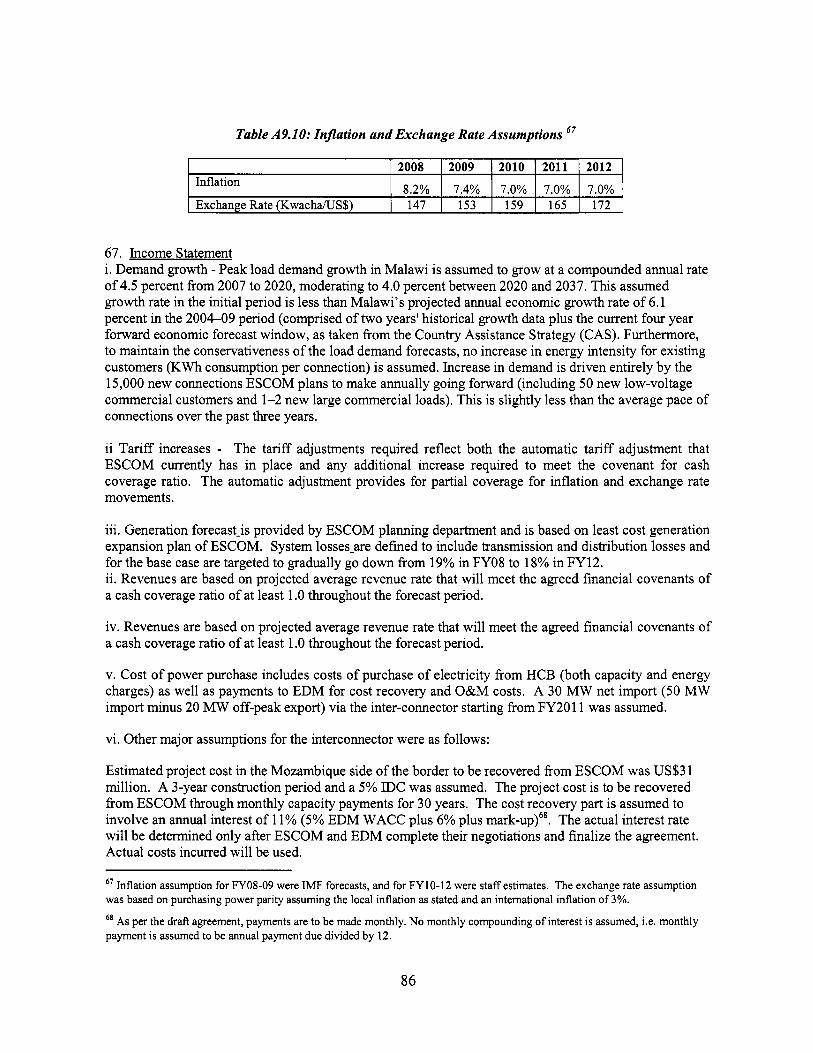
Table A9.10: Injlation and Exchange Rate Assumptions 67
Inflation
Exchange Rate (Kwacha/US$)
2008 2009 2010 2011 2012
8.2% 7.4% 7.0% 7.0% 7.0% 147 153 159 165 172
67. Income Statement i. Demand growth - Peak load demand growth in Malawi i s assumed to grow at a compounded annual rate of 4.5 percent from 2007 to 2020, moderating to 4.0 percent between 2020 and 2037. T h i s assumed growth rate in the initial period i s less than Malawi's projected annual economic growth rate o f 6.1 percent in the 2004-09 period (comprised o f two years' historical growth data plus the current four year forward economic forecast window, as taken from the Country Assistance Strategy (CAS). Furthermore, to maintain the conservativeness o f the load demand forecasts, no increase in energy intensity for existing customers (KWh consumption per connection) i s assumed. Increase in demand i s driven entirely by the 15,000 new connections ESCOM plans to make annually going forward (including 50 new low-voltage commercial customers and 1-2 new large commercial loads). This i s slightly less than the average pace o f connections over the past three years.
ii Tarif f increases - The tariff adjustments required reflect both the automatic tariff adjustment that ESCOM currently has in place and any additional increase required to meet the covenant for cash coverage ratio. The automatic adjustment provides for partial coverage for inflation and exchange rate movements.
iii. Generation forecast-is provided by ESCOM planning department and i s based on least cost generation expansion plan o f ESCOM. System losses-are defined to include transmission and distribution losses and for the base case are targeted to gradually go down from 19% in FY08 to 18% in FY12. ii. Revenues are based on projected average revenue rate that will meet the agreed financial covenants o f a cash coverage ratio o f at least 1 .O throughout the forecast period.
iv. Revenues are based on projected average revenue rate that will meet the agreed financial covenants o f a cash coverage ratio o f at least 1 .O throughout the forecast period.
v. Cost o f power purchase includes costs o f purchase o f electricity from HCB (both capacity and energy charges) as well as payments to EDM for cost recovery and O&M costs. A 30 MW net import (50 MW import minus 20 MW off-peak export) via the inter-connector starting from FY2011 was assumed.
vi. Other major assumptions for the interconnector were as follows:
Estimated project cost in the Mozambique side o f the border to be recovered from ESCOM was US$3 1 million. A 3-year construction period and a 5% I D C was assumed. The project cost i s to be recovered from ESCOM through monthly capacity payments for 30 years. The cost recovery part i s assumed to involve an annual interest o f 11% (5% EDM WACC plus 6% plus mark-up)68. The actual interest rate wil l be determined only after ESCOM and EDM complete their negotiations and finalize the agreement. Actual costs incurred will be used.
67 Inflation assumption for FY08-09 were IMF forecasts, and for FY10-12 were staff estimates. The exchange rate assumption was based on purchasing power parity assuming the local inflation as stated and an international inflation of 3%.
As per the draft agreement, payments are to be made monthly. No monthly compounding of interest i s assumed, i.e. monthly payment i s assumed to be annual payment due divided by 12.
86

It i s assumed that an additional 2.5% o f the total project cost o f the Mozambique side would be paid by ESCOM to EDM every year (paid monthly) to cover the annual operations and maintenance costs. The cost will be increasing with US inflation.
Payments to HCB for energy purchase were assumed as follows: i) a capacity payment o f US$16.57 per kW per month; and ii) energy charge o f US$O.0011 per kWh purchased. The export price was assumed to be 1.28 UScentskWh in FY2011 and was expected to increase by 4% a year thereafter. The Malawi part o f the project i s estimated to be US$48 mil l ion to be financed by the proposed IDA credit. A construction period o f 3 years and a 5% IDC was assumed. ESCOM will repay to the Government o f Malawi the on-lent IDA credit on the following terms: 5 year grace period, 5% annual interest and 20 years repayment period.
0
vii. Operating costs: Salary and operations costs were assumed to grow with inflation starting from FY09. Supplies and other costs were assumed to be a moving average o f three years. Repair and maintenance costs were assumed to be 3% o f average net fixed assets, consistent with the level o f costs in recent years. These operating costs were apportioned to generation, transmission, and distribution functions based on their relative proportion in recent years. Depreciation was assumed to be 3% o f average gross fixed assets, consistent with the level o f depreciation charged in recent years. Bad debt provisions are estimated at 5% o f gross accounts receivable, and are estimated to be sufficient to cover losses from bad debts.
viii. Interest charges were based on the debt service schedule o f ESCOM for the existing loans and new debts planned to be undertaken for financing future investment program.
ix. N o corporate tax was assumed.
68. Balance Sheet x. Accounts receivable from trade i s assumed to be 4.0 months o f sales equivalent in FY08 before write- off. A write-off o f 910 mil l ion Kwacha (25% o f accounts receivable o f FY07) in FY08 was assumed. In the base case, the accounts receivable was assumed to go down to 3 months by FY09.
xi. Inventories were assumed to be 4% o f gross fixed assets, consistent with the level o f inventory in recent years.
xii. Additions to fixed assets and work in progress were derived from the ESCOM investment program for FY08-14. The level o f investment i s significantly higher in 2007-10 than the past trend because o f the Tzedzani, the Malawi-Mozambique transmission line and Kapachira investments.
xiii. Accounts payable was assumed to go down to 4 months o f costs equivalent in FY08 and to 3 months o f costs equivalent thereafter.
xiv. Current portion o f long te rm debts (including HIPC loans) included the principal and interest obligations o f the year and was based on the debt service schedule for existing and new loans.
xv. Consumer deposits were assumed to include 750 Kwacha per domestic connection against security deposits and 6,300 Kwacha per domestic connection against customer contribution o f capital costs. Pension provision i s maintained so that the balance at the year end i s equivalent to 10% o f annual salary cost.
87

xvi. Long-term debt schedule for existing loans was obtained f i o m ESCOM and included the repayment schedule for the o ld loans. HPC loans are shown as debts as ESCOM i s s t i l l responsible for their repayment to GOM in local currency. Debt service schedule for the new loans was based o n the investment program with different interests and repayment terms depending o n the potential source o f financing. For loans for which n o financier was identified, an interest rate o f 10% including an IDC o f 5% and a repayment o f 25 years was assumed.
xvii. Nordic development fund included some 530 mi l l ion Kwacha expected to be drawn as loan f rom Nordic by FY08. As per an agreement between E S C O M and GOM, this i s expected to be converted to preferred shares o f Kwacha 1 each.
xviii. Cash Coverage Ratio has been set at 1 .O to ensure that E S C O M generates sufficient cash revenues to cover a l l i t s cash operating costs, debt service obligations and internal funds required for capital investment.
88

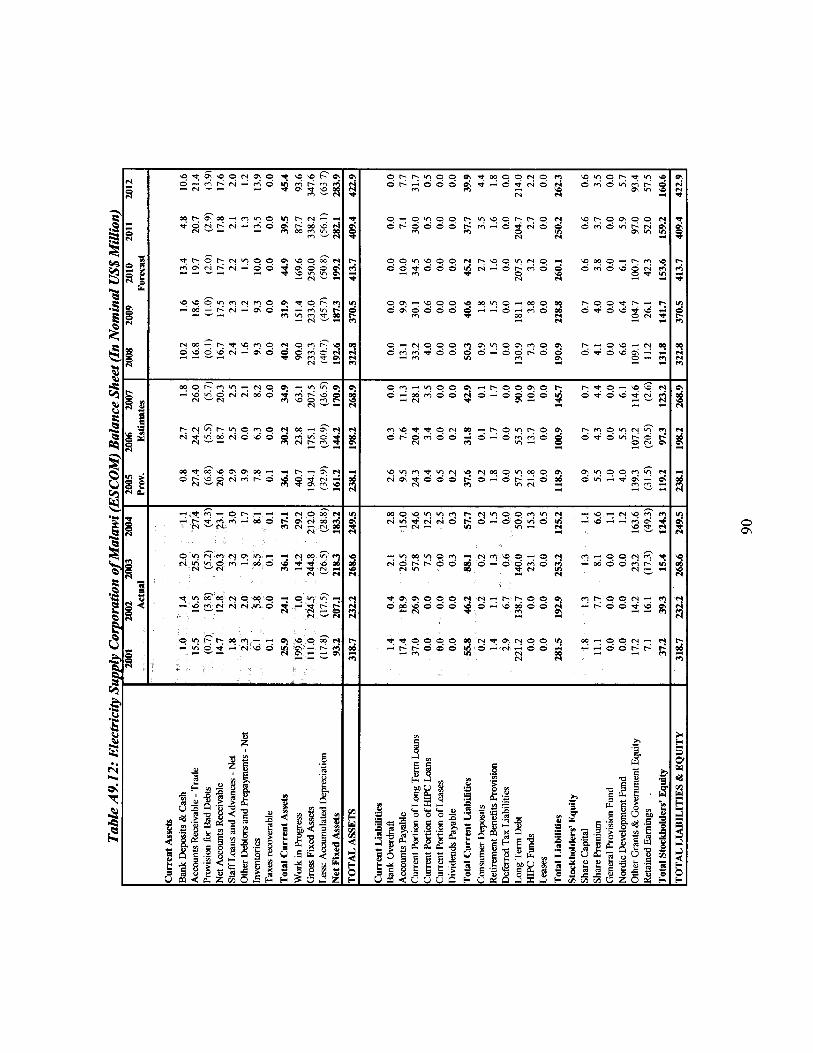
i
3 . c C
3 * .
i
1 z ,x B .-
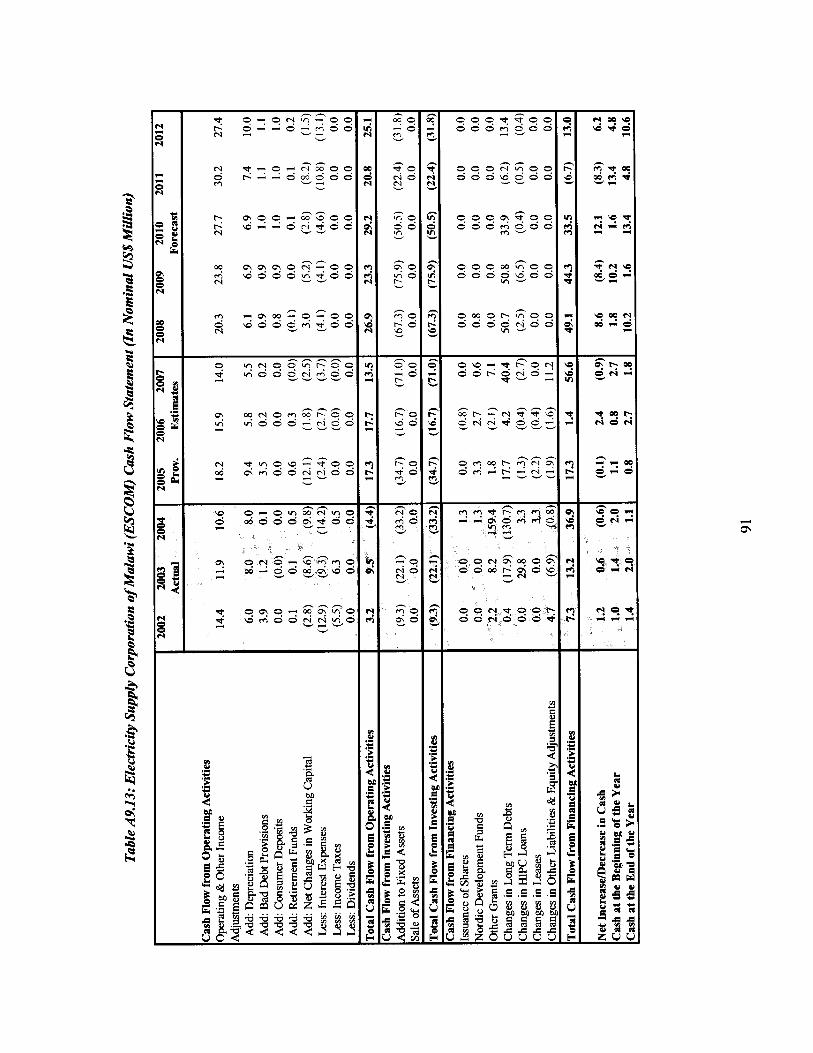
h h m m m o N - 0 0 2 \ d 0 0 0 ~ ~ o o hl
0 0 0 qq0 0 0 0 0 ~ _ o v 0 0
0 ~ 0 c ' ~ O C O O O O N O C
V I -
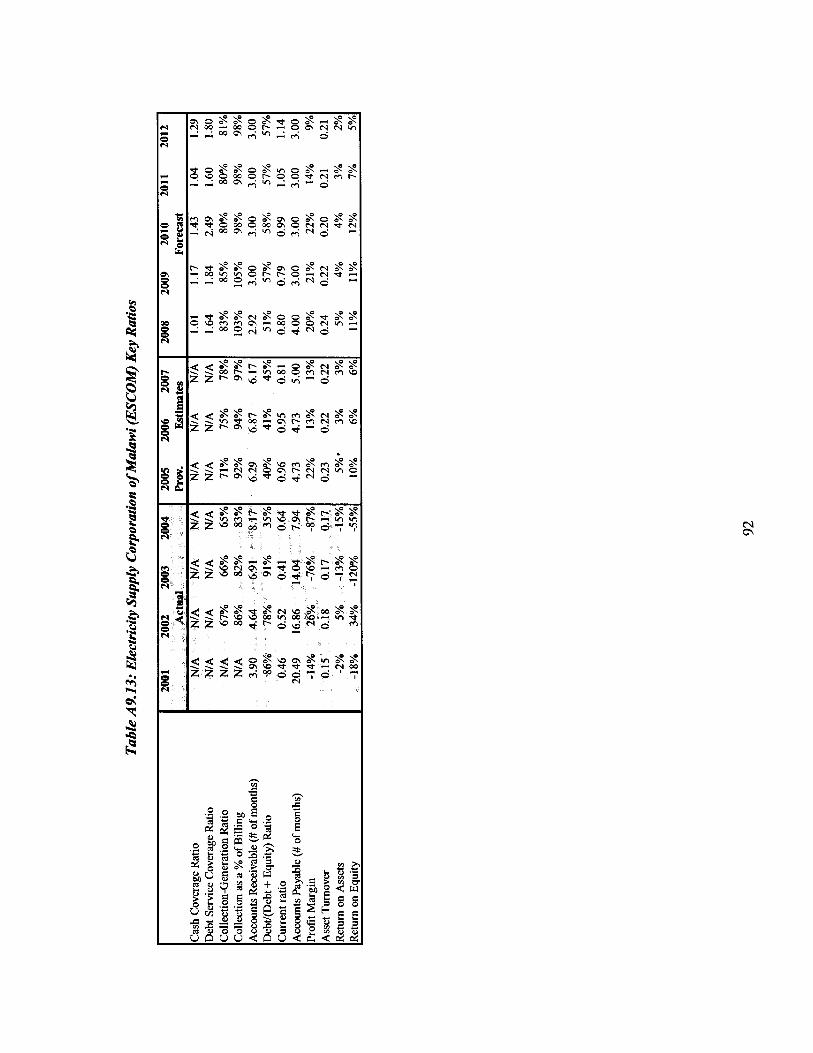
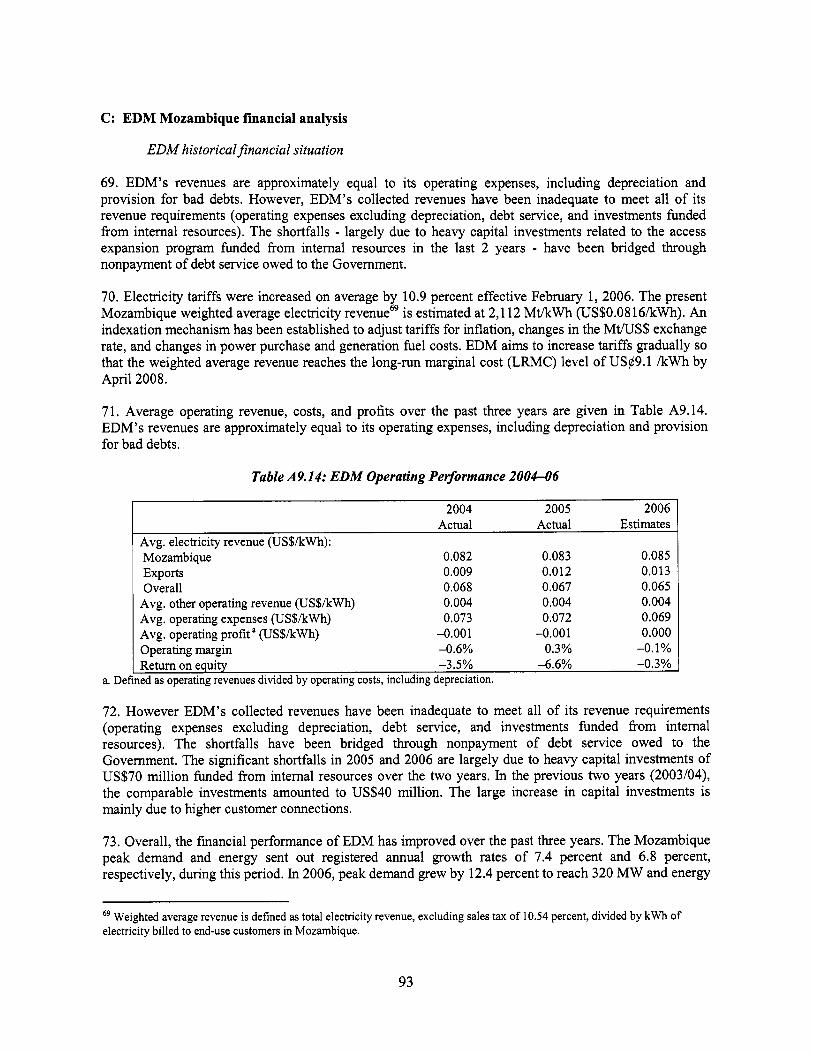
C: EDM Mozambique financial analysis
EDM historical financial situation
69. EDM’s revenues are approximately equal to i t s operating expenses, including depreciation and provision for bad debts. However, EDM’s collected revenues have been inadequate to meet all o f i t s revenue requirements (operating expenses excluding depreciation, debt service, and investments funded from internal resources). The shortfalls - largely due to heavy capital investments related to the access expansion program fimded from internal resources in the last 2 years - have been bridged through nonpayment o f debt service owed to the Government.
70. Electricity tariffs were increased on average by 10.9 percent effective February 1, 2006. The present Mozambique weighted average electricity revenue6’ i s estimated at 2,112 MtikWh (US$O.O816/kWh). An indexation mechanism has been established to adjust tariffs for inflation, changes in the Mt/US$ exchange rate, and changes in power purchase and generation fuel costs. EDM aims to increase tari f fs gradually so that the weighted average revenue reaches the long-run marginal cost (LFWC) level o f USg9.l /kWh by April 2008.
71. Average operating revenue, costs, and profits over the past three years are given in Table A9.14. EDM’s revenues are approximately equal to i t s operating expenses, including depreciation and provision for bad debts.
a. I
Table A9.14: EDM Operating Performance 2004-06
2004 2005 2006 Actual Actual Estimates
Avg. electricity revenue (US$/kWh): Mozambique 0.082 0.083 0.085 Exports 0.009 0.012 0.013 Overall 0.068 0.067 0.065
Avg. other operating revenue (US$/kWh) 0.004 0.004 0.004 Avg. operating expenses (US$/kWh) 0.073 0.072 0.069 Avg. operating profit a (US$/kWh) -0.001 -0,001 0.000 Operating margin -0.6% 0.3% -0.1% Return on equity -3.5% -6.6% -0.3%
led as operating revenues divided by operating costs, including depreciation.
72. However EDM’s collected revenues have been inadequate to meet all o f i t s revenue requirements (operating expenses excluding depreciation, debt service, and investments funded from internal resources). The shortfalls have been bridged through nonpayment o f debt service owed to the Government. The significant shortfalls in 2005 and 2006 are largely due to heavy capital investments o f US$70 mil l ion funded from internal resources over the two years. In the previous two years (2003/04), the comparable investments amounted to US$40 million. The large increase in capital investments i s mainly due to higher customer connections.
73. Overall, the financial performance o f EDM has improved over the past three years. The Mozambique peak demand and energy sent out registered annual growth rates o f 7.4 percent and 6.8 percent, respectively, during this period. In 2006, peak demand grew by 12.4 percent to reach 320 MW and energy
69 Weighted average revenue i s defined as total electricity revenue, excluding sales tax o f 10.54 percent, divided by kWh of electricity billed to end-use customers in Mozambique.
93
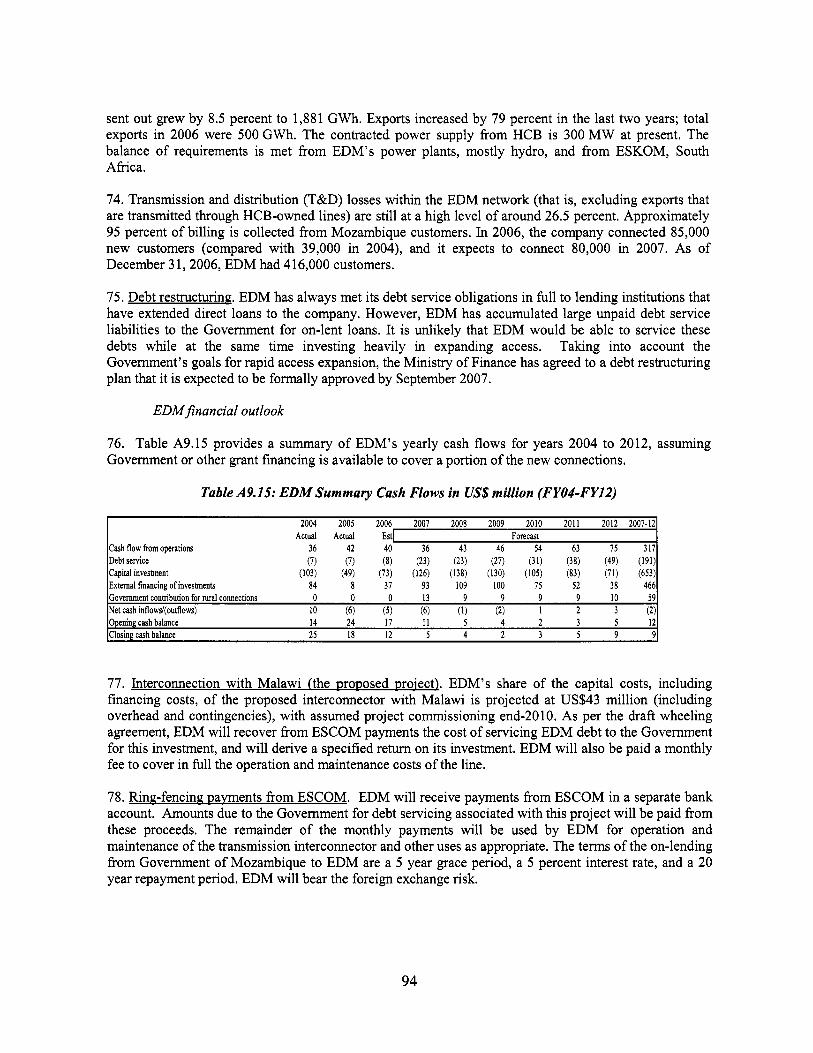
sent out grew by 8.5 percent to 1,881 GWh. Exports increased by 79 percent in the last two years; total exports in 2006 were 500 GWh. The contracted power supply from HCB i s 300 MW at present. The balance o f requirements i s met from EDM’s power plants, mostly hydro, and from ESKOM, South Africa.
74. Transmission and distribution (T&D) losses within the EDM network (that is, excluding exports that are transmitted through HCB-owned lines) are s t i l l at a high level o f around 26.5 percent. Approximately 95 percent o f billing i s collected from Mozambique customers. In 2006, the company connected 85,000 new customers (compared with 39,000 in 2004), and it expects to connect 80,000 in 2007. As o f December 3 1,2006, EDM had 4 16,000 customers.
75. Debt restructuring. EDM has always met i t s debt service obligations in full to lending institutions that have extended direct loans to the company. However, EDM has accumulated large unpaid debt service liabilities to the Government for on-lent loans. I t i s unlikely that EDM would be able to service these debts while at the same time investing heavily in expanding access. Taking into account the Government’s goals for rapid access expansion, the Ministry o f Finance has agreed to a debt restructuring plan that i t i s expected to be formally approved by September 2007.
EDMfinancial outlook
76. Table A9.15 provides a summary o f EDM’s yearly cash flows for years 2004 to 2012, assuming Government or other grant financing i s available to cover a portion o f the new connections.
Table A9.15: EDMSummary Cash Flows in US$ million (FYOI-FY12)
2004 2005 2006 2007 2008 2009 2010 2011 2012 2007-12 Actual Actual Est1 Forecast
Cash flow from operations 36 42 40 36 43 46 54 63 75 317
Capital inveshnent (103) (49) (73) (126) (138) (130) (105) (83) (71) (653) External financing of investments 84 8 37 93 109 100 75 52 38 466 Government contribution for rural connections 0 0 0 13 9 9 9 9 I O 59 Net cash inflows/(outflows) 10 (6) (5) (6) (1) (2) 1 2 3 (2)
Debt senice (7) (7) (8) (23) (23) (27) (31) (38) (49) (191)
Opening cash balance 14 24 17 11 5 4 2 3 5 12 Closing cash balance 25 18 12 5 4 2 3 5 9 9
77. Interconnection with Malawi (the proposed proiect). EDM’s share o f the capital costs, including financing costs, o f the proposed interconnector with Malawi i s projected at US$43 mil l ion (including overhead and contingencies), with assumed project commissioning end-20 10. As per the draft wheeling agreement, EDM will recover from ESCOM payments the cost o f servicing EDM debt to the Government for this investment, and will derive a specified return on i t s investment. EDM will also be paid a monthly fee to cover in full the operation and maintenance costs o f the line.
78. Ring-fencing pavments from ESCOM. EDM will receive payments from ESCOM in a separate bank account. Amounts due to the Government for debt servicing associated with this project will be paid from these proceeds. The remainder o f the monthly payments wil l be used by EDM for operation and maintenance o f the transmission interconnector and other uses as appropriate. The terms o f the on-lending from Government o f Mozambique to EDM are a 5 year grace period, a 5 percent interest rate, and a 20 year repayment period. EDM will bear the foreign exchange risk.
94

Key assumptions
79. The key assumptions made in the preparation o f these projections are summarized below. The financial forecasts are presented in nominal prices.
I
I
m
I
I
I
Mozambique load growth i s assumed at 8 percent in 2007,7 percent annually from 2008 to 2010, and 6 percent annually thereafter. The actual growth in sent-out energy in 2006 was 8.5 percent and the forecast 8 percent growth in the current year takes account o f 20 MW demand added in January 2007 by MOMA (heavy sand and mineral company). Demand over the past two years has grown annually by 6.85 percent. In view o f this growth rate and the accelerated program o f new customer connections (considering EDM’s own program and the program funded under the ERAP project), EDM i s o f the view that 7 percent annual growth rate to 2010 i s realistic. According to the last master plan o f May 2004, annual growth in 2006-10 and 201 1-15 was forecast at 5.6 percent and 4.5 percent respectively under the “low” scenario and 9.1 percent and 5.3 percent respectively under the “medium” scenario. I t i s assumed H C B supply will meet the balance o f requirements for Mozambique demand, after EDM’s own generation, Eskom supply at 0.5 percent o f total energy requirements, and minor imports for border villages. Peak demand i s forecast to grow from 320 MW in 2006 to 496 MW by 2012. I t i s assumed that surplus energy during off-peak periods will be exported. T h i s represents 17.2 percent o f total energy supply to EDM. Transmission losses are assumed at 5 percent throughout, and distribution losses are forecast to decline by 0.5 percentage point in 2007 and by 1.0 percentage point each year thereafter. On this basis, overall transmission and distribution losses in Mozambique will reduce from 26.7 percent in 2006 to 21.5 percent in 2012. The forecast reductions in losses are in l ine with the company’s strategic plan. Collection rate in Mozambique i s assumed to increase by 0.5 percentage point each year, starting with 95.0 percent collection rate in 2007 and ending with 97.5 percent in 201 1. Accounts receivable from Mozambique electricity customers are assumed 55 days’ annual billing at end 2007 and 50 days’ annual billing thereafter. In accordance with EDM’s submissions to the Government, electricity tariffs are assumed to increase by 6.3 percent effective April 1, 2007, raising the present weighted average revenue from US$8.16/kWh to US$8.68/kWh. Tariffs are assumed to increase again in April 2008 to a level o f US$9.lkWh, and maintained at that level through to 2012. Power purchase tariffs are assumed at the present contracted rates o f 0.14ZAWkWh (US#2/kWh) for Eskom, escalated in l ine with the assumed South African annual inflation rate o f 4.0 percent, and HCB tariff i s assumed to remain at 55 percent o f Eskom tariff. In addition, a standby charge of 7.01ZAR/kW, escalated for inflation, i s assumed for Eskom supply. Customer connections funded from EDM resources are assumed at 80,000 in 2007 and 75,000 annually thereafter. In addition, 79,214 new customers are to be connected during 2007-10 under the ongoing ERAP project. Investments and financing plan (see Table A9.15). The financial projections are prepared in nominal Metical, using the inflation and exchange rate forecasts below. Exchange rate o f the Metical against the US. dollar has been projected forward on the basis o f inflation differential.
95

Table A9.16: Inflation and Exchange Rates, 2007-12
2006 Actual
0 1
66
2007 2008 2009 2010 2011 2012 Inflation: Mozambique 5.9% 5.7% 5.4% 5.1% 5.0% 5.0% International 2.5% 2.5% 2.5% 2.5% 2.5% 2.5% Exchange rate (Mt/US$l): Average in year 26.299 27.145 27.952 28.702 29.416 30.133 At December 3 1 26.728 27.563 28.342 29.061 29.770 30.496
2007 2008 2009 2010 2011 2012 2007-12 2007-12
6 10 12 6 0 0 34 5% 13 32 42 41 37 22 188 29%
101 93 72 55 43 45 410 63%
80. The forecast investment plan o f EDM i s summarized in Table A9.17.
Table A9.17: Forecast Investment Plan
Investments: Generation Transmission Distribution Support investments Total
Finanacine alan: Own resources Borrowing
37 30 31 32 32 33 195 30% I ::I 79 102 93 68 48 34 424 65%
81. The investment plan o f EDM i s quite ambitious, requiring US$653 mi l l ion over six years to 2012. The investments will be funded through 65 percent (US$424 mill ion) borrowing, 5 percent (US$34 mill ion) grants, and the remaining 30 percent (US$195 mill ion) f rom internal resources.
96

Table A9.18: Development of EDM’s End-Use Customer Electricity Tarijjfs, 2003-07
lmestic m o m e n on conventional m e m Energy charge (MTikWh)
0-100 0-200 201-500 >so0
Fixed charge (MTimonth) Customm on Drwawnent metm Energy charge (MTikWh)
giicultural -n\mtional metm Energy charge (MTkWh)
0-200 201-500 >so0
Fixed charge (MTImonth)
Energy charge (MTikWh) mwawnent meten
onunmial &somen on conventional meten Energy charge (MTikWh)
0-200 201-500 >so0
Fixed charge i.MT/month) Customers on orwawnwtetos Energy charge (MTkWh)
V Large Customers Energy charge (MTikWh) Fixed charge (MTlmonth) Capacity charge (MTkW)
IV Customm Energy charge (MTkWh) Fixed charge (MTlmonth) Capacity charge (MTkW)
N Customen Energy charge (MTikWh) Fixed charee (MTimonth)
856 1,863 2,483 2,608
60,000
2,546
1,877 2,682 2,934
60.000
2,808
2,086 2,980 3,260
60,000
3,120
1,168 175,689 89,810
970 824,668 100,524
865 824,668
882 1,919 2,557 2,686
61,800
2,446
1,933 2,162 3,022
61,800
2,691
2,149 3,069 3,358
61,800
3,083
1,203 180,960 92,504
999 849,408 103,540
89 1 849,408
91 1 1,982 2,641 2,775
63,839
2,527
1,997 2,853 3,122
63,839
2,780
2,220 3,170 3,469
63,839
3,185
1,243 186,932 95,557
1,032 877,438 106,957
920 877,438
3.0% 3.0% 3.0% 3.0% 3.0%
-3.9%
3.0% 3 0% 3 0% 3.0%
-4.2%
3.0% 3.0% 3.0% 3 0%
-I 2%
3.0% 3 0% 3 0%
3.0% 3.0% 3 0%
3.0%
3.3% 3.3% 3.3% 3 3% 3.3%
3 3%
3.3% 3.3% 3.3% 3 3%
3.3%
3.3% 3 3% 3.3% 3.3%
3 3%
3.3% 3 3% 3.3%
3 3% 3.3% 3 3%
3.3%
97

Table A9.19: EDM Income Statements 2004-12 in Nominal US$ Million
1,443 1,564 1,696 1,838 1,973 2,118 480 451 483 517 548 581
1,923 2,016 2,179 2,355 2,521 2,699
2,212 2,414 2,544 2,612 2,677 2,742 357 386 415 446 478 512
1,749 1,960 2072 2,137 2,199 2,262
0084 0089 0091 0091 0091 0091 0014 0014 0015 0016 0016 0017 0067 0072 0074 0074 0 075 0075
1213 1391 1543 1673 1796 1928
3 2 2 3 6 1 4 0 8 441 413 5 2 3 1 9 I 2 I 2 1 3 1 4 1 4
Non-operahng income - net 4 3 4 4 4 5 4 6 4 7
rofitJ(l0ss) before taxation
0 0 0 0 0 0 0 0 0 0
01% 44% 45% 6 6 % 8 3% O 9 Oo71 1% 0001 0 0 0 3 0004 0005 0007
98

Table A9.20 EDM: Balance Sheets 2004-12 in Nominal US$ Million
Tangible assets at coshaluation Less: Accumulated depreciation Net book value of fined assets Project fun& Investments Tow long-term assets
ment ass& stocks Customer accounts receivable Other debtors &prepayments lnvesbnents Cash at bank and in hand Total current assets
rediton (amounts falling due within one year) Creditors Corporate tax payable Debt service due Current Portion ofLong-Term Loans Total current liabilities
et current assetsi(liabi1ities)
otal assets less current liabilities
reditors (amounts falling due after more than one year) Long-term loans Less: Current portion Long-term portion Project liabilities Pension provisions Deferred charges Customer deposits Total creditors (amounts falling due after more than one year)
let assets employed
:vi tal and reserves Paid up capital Grants for inveshnents Reserves
hareholden'
22 26 33 38 43
3 3 3 4 4 29 30 30 31 32
1 I 1 1 1
27 27 26 24 21 22 0 0 0 0 4 6 7 8
279 370 453 510 541 5491
16 16 16 16 16 19 23 27 31 36 :El 3 2 2 0 0 0
112 109 106 103 101 50 54 58 63 65
99

Table A9.21: EDM Cash Flows 2004-12 in Nominal US$ Million
(3 2) (5 7) (93) (8 7) (105) (4 2) (41 7) 3 7 3 9 4 1 3 3 5 1 5 3 255
operating proGti(loss) Depreciation (Increase)/decrease in working capital Pension provisions 8: deferred charges Other
let cash inflow/(outnow) from operating activities . e m from investnmts and senicing o f finance. Interest received Interest paid let cash outflow for r e m on invesmmts and servicing o f finance
'axation paid
westing activities: Payments to acquire tangible fixed assets Recebb from disposals o f w i l e fned assets
let cash outflow from investing activities hidends paid
let cash inflow/(oUmow) before hancin3
inancing activities: Grants for invesmats Government eonhibuuan far mi connectiom Customer deposits Borrowing Borrowing repaid Project funds and liabilities RacipW@ayments) for inveshllents
let cash inflow from financing activities
0 3 0 3 0 3 0 3 0 3 0 3 181
0 0 0 0 0 0 0 0 0 0 0 0 001
9 9 5 6 5 9 5 9 3 3 3 8 343 (off-xt agalnsl dab1 sentee due) 134 8 6 8 8 9 0 9 3 9 5 587
0 9 1 1 I 1 I 1 0 9 0 9 6 0
ncreasd(decrease) in cash and cash equivalents
'ash and cash equivalents at beguuung o f year
79 I 1024 930 68 I 476 (155) (150) (163) (189) (207) 12731 (1137)
3 4 (04) (04) (04) (03) (03) 151
h 114 4 9 4 1 1 8 3 2 5 3 1201
100
Annex 10: Safeguard Policy Issues AFRICA Mozambique - Malawi Transmission Interconnection
(Southern African Power Market Program APL-2)
A. Project location, potential environmental and social impacts, and how they are addressed
1. The project i s located in northwest Mozambique near Tete and southern Malawi. Impact on displacement and dispossession i s very limited. Based on a thorough social analysis in each country along the entire wider transmission l i ne corridor and the areas o f the two substations, a corridor with very limited human activities has been retained for the construction o f the transmission line, to avoid the hardship o f displacement. The data o f the social analysis have been represented in two Resettlement Policy Frameworks (RPF)-one for Mozambique, one for Malawi. It was determined that RPFs, rather than RAPS, would be appropriate, since the exact location o f the towers and line route within the broader corridor was not known at the time o f disclosure. At the early stage o f implementation a technical study and a survey will be conducted to determine the exact location o f the transmission l ine and towers within the corridor, and a record o f the people and assets that will be affected will be developed. Based on the results, and if needed, a RAP or an Abbreviated RAP will be prepared, approved, disclosed in-country and in the InfoShop, and implemented before the start o f any investment and construction work.
2. For both countries also a satisfactory EA was prepared, cleared by the Bank, and disclosed in-country and in the InfoShop prior to appraisal. The project corridor in Mozambique and Malawi passes mostly through agricultural land or bushland o f low biodiversity value. In Malawi an important forest reserve has been avoided by selecting another corridor outside the Thambani Forest Reserve, one o f the few remaining forest areas in the country. The project will not cause any major or irreversible environmental impacts in Mozambique or Malawi.
3. Some very limited spots along the transmission line route may need to be cleared o f landmines. A World Bank field visit revealed that the environmental impacts on natural habitat and the demining activities to be financed under the project were less severe than formerly anticipated. Clearing o f landmines i s only intended in one or two spots along the transmission l ine and not along the entire route in Mozambique as was formerly considered. In Malawi, a high-biodiversity forest reserve has been avoided by changing the corridor. For these reasons the project EA category was changed from A into B.
4. The urgent rehabilitation and reinforcement activities under Component C were defined only after disclosure o f the above EAs. None o f these activities to be included in Component C would have any environmental or social issues implications, beyond those which can be addressed in contractor specifications (for example, low-noise equipment, PCB-free material, and better erection techniques). The environmental management aspects will be handled according to the same standards as described in both EA studies. In particular, the disposal of any hazardous wastes will be handled according to international standards.
5. Because o f the existence o f high electrical voltage, the right-of-way areas will be protected and public access may be restricted. Loss o f land and other assets will be addressed through the RAP. Passageways will be provided for the public. There will be no potential indirect and/or long-term environmental impacts in either country.
101

B. Analysis of alternatives
6. During preparation, for each country two possible corridors were considered. The corridor that represents the least adverse impacts has been selected. The transmission line routing in Malawi has been changed in order to avoid the Thambani Forest Reserve, an important high-biodiversity area in Malawi. There are no other feasible alternative routing options.
C. Implementation arrangements
7. During preparation, both EDM in Mozambique and ESCOM in Malawi prepared an EA and a RPF. Both EAs contain an environmental and social management plan and an environmental capacity-building plan.
8. ESCOM and EDM both have existing environmental and social units, which have been supported by former or ongoing World Bank-financed projects. Within these units, Resettlement Officers have been identified and designated.
9. Both units will need strengthening during implementation. Technical assistance and training i s included in Component B. The resettlement and environmental officers o f both environmental and social un i ts will be trained (beginning at the launch o f the project) in the area o f World Bank safeguards, according to a training program designed with input from World Bank specialists (ASPEN). The safeguard officers will be in charge o f the implementation and monitoring o f the RAPS and the EAs with technical assistance as required. EDM and ESCOM will hire international technical assistance for environmental management during the construction o f the interconnector in order to strengthen the existing environmental management capacity within EDM and ESCOM. World Bank specialists (ASPEN) will closely monitor the implementation o f the safeguard mitigation measures.
D. Disclosure
10. ESCOM and EDM conducted a social assessment respectively in Malawi and Mozambique to assess the impact o f the project on the country at large and the local population where the transmission l ines will be implemented. The local population, local authorities, technicians, and representatives o f civil society at large were consulted and their views were used in the project design and the choice o f the corridors for the transmission lines. Interviews and focus groups were used among other consultation techniques. The two RPFs have been disclosed and debated in areas accessible to the public. Disclosure o f the RAPS, s t i l l to be prepared, will follow the same procedures. The EAs in Mozambique and Malawi have been discussed in public meetings in the project area and have been disclosed in-country and in the InfoShop prior to appraisal.
E. Places and dates of public consultation and issues raised by people
1 1. For each country, a participatory public consultation process took place during the preparation o f the EAs and RPFs. In each project area, the concerned communities, their leaders, and the public authorities were both consulted and informed regarding the project’s objectives, scope, and implications. The consultation took place in the villages and in the offices o f the local government representatives. In general, the objectives o f the project were well received and the communities contributed to the choice o f the corridors that offer the minimum disturbances in terms o f displacement and land acquisition. Issues raised by the communities and their representatives included security and adequate compensation where applicable; both issues were taken into consideration in the RPFs. In each country, the RPF has been disclosed as follows:
102

Environmental Assessment: Mozambique:
1 1/24/04
Malawi: 02/08/07 For both
Mozambique and Malawi: 02/13/07
Date o f "in-country" disclosure
Date o f submission to InfoShop
Resettlement Policy Framework Date o f "in-country'' disclosure Mozambique:
021 14/07
Malawi: 02/08/07 For both
Mozambique and Malawi: 02/12/07
Date o f submission to InfoShop
103

Annex 11: Project Preparation and Supervision
AFRICA Mozambique - Malawi Transmission Interconnection (Southern African Power Market Program APL-2)
Planned Actual PCN review* November 13,2006 November 13,2006 Init ial PKD to PIC November 13,2006 November 27,2006 Init ial ISDS to PIC November 13,2006 December 2 1,2006 Appraisal April 3,2007 April 9,2007 Negotiations April 30,2006 May 3,2007 Board approval July 17,2007 Planned date o f effectiveness Planned date o f mid-term review Planned closing date June 30,2013
November 2007 December 2009
* Although the PCN review only took place in November 2006, project preparation began in 2003.
Key institutions responsible for preparation o f the project: 0 EDM; Ministry o f Energy, Government o f Mozambique
ESCOM; Ministry o f Energy, Mines and Mineral Resources, Government o f Malawi
Bank staff and consultants who worked on the project included:
Name Wendy Hughes Fanny Missfeldt-Ringius Rob Mills Cecile Niang Edith Mwenda Suzanne Morris Modupe Adebowale Robert Robelus Mohamed Arbi Ben-Achour Husam Beides Sun i l Khosla Ko f i Awanyo Antonio Chamuco Slah Ben-Halima Gert van Der Linde Brighton Musungwa Joao Tinga Somin Mukherj i Judith Plummer Zubair Sadeque Gulam Dhalla Augustine Wright Esther Lozo Rene Mendonca Diep Nguyen-Van Houtte Joel Maweni
Title Sr. Energy Specialist and Team Leader Energy Economist Economist Infiastructure Specialist Sr. Counsel Sr. Finance Officer Sr. Finance Officer Sr. Environmental Assessment Specialist Sr. Social Scientist Sr. Power Engineer Sr. Energy Specialist Procurement Specialist Procurement Specialist Sr. Procurement Specialist Lead Financial Management Specialist Sr. Financial Management Specialist Financial Management Analyst Sr. Financial Analyst Sr. Financial Analyst Financial Analyst, Consultant Financial Analyst, Consultant Program Assistant Program Assistant Power Engineer, Consultant Monitoring Specialist, Consultant Operations Advisor and initial Team Leader
Unit AFTEG AFTEG AFTEG AFCRI LEGAF LOAG2 LOAG2 AFTS 1 AFTS 1 ECSSD SASEI AFTPC AFTPC AFTPC AFTFM AFTFM AFTFM M N S I F SASEI AFTEG AFTEG AFTEG AFCMZ M N S S D AFTRZ, LCSQE
104

Bank funds expended to date on project preparation: 1. Bank resources: US$582,943 2. Trust funds: N/A 3. Total: US$582,943
Estimated Approval and Supervision costs: 1. Remaining costs to approval: US$80,000 2. Estimated annual supervision cost: US$150,000
105
Annex 12: Documents in the Project File
AFRICA Mozambique - Malawi Transmission Interconnection (Southern African Power Market Program APL-2)
1. Regional Documents
0
Southern Africa Power Pool Inter-Governmental Memorandum o f Understanding Southern Africa Power Pool Inter-utility Memorandum o f Understanding Southern Africa Power Pool Agreement Between Operating Members Southern Africa Power Pool Operating Guidelines
2. Government Documents 0
0
Government o f Malawi Energy Sector Policy Government of Mozambique Energy Sector Policy Agreement between the Government o f the Republic o f Mozambique and the Government o f the Republic o f Malawi on the Interconnection o f the Power Systems o f Mozambique and Malawi, 1998.
3. ESCOM and EDM Documents Draft Wheeling Agreement Draft System Operating Agreement
0 Draft Maintenance Agreement Draft Implementation Agreement
4. Preparation Study Reports
0
0 Malawi Resettlement Policy framework Mozambique Resettlement Policy framework
0 ESCOM Procurement Plan EDM Procurement Plan
Malawi power sector reform consultancy reports Feasibility study for transmission interconnection Environmental Impact Assessments for Transmission Interconnection (Mozambique and Malawi reports)
Agreed format for ESCOM Financial Management Reporting Agreed format for EDM Financial Management Reporting
5. Bank Staff Assessments 0
Aide memoires Project concept note, quality enhancement review minutes, decision meeting minutes
106
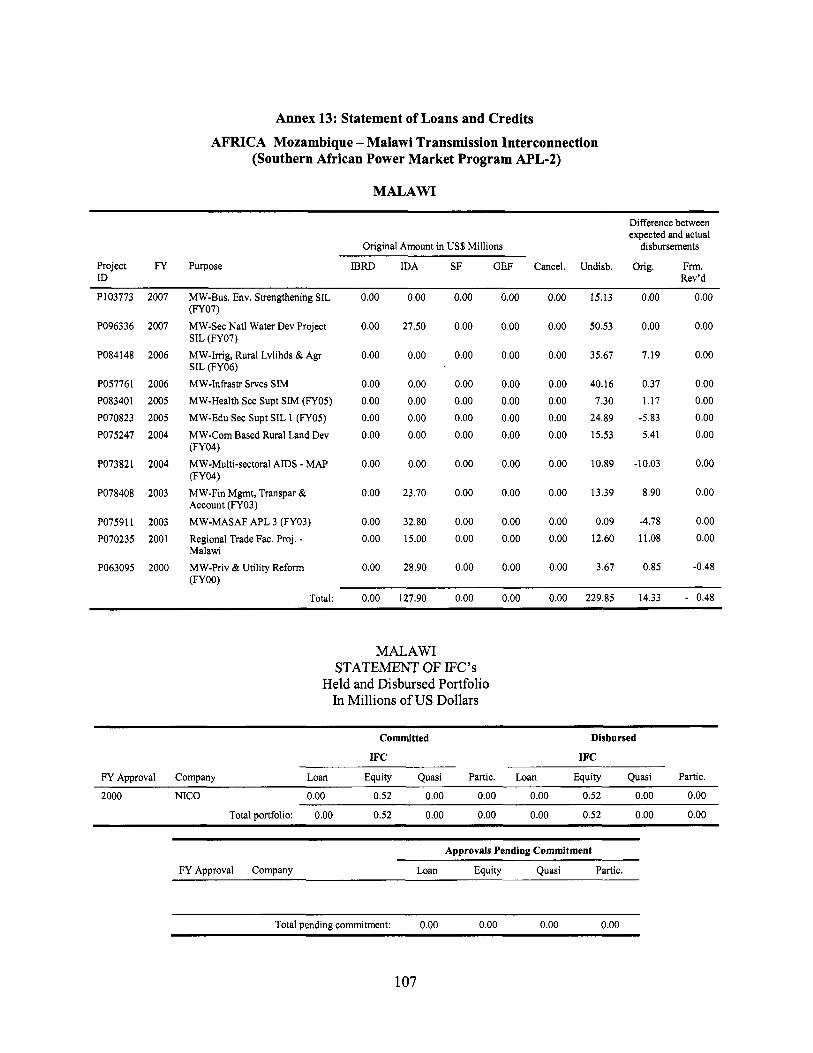
Annex 13: Statement of Loans and Credits AFRICA Mozambique - Malawi Transmission Interconnection
(Southern African Power Market Program APL-2)
MALAWI
Difference between expected and actual
disbursements Original Amount in US$ Millions
PI03773 2007
PO96336 2007
PO84148 2006
PO57761 2006 PO83401 2005 PO70823 2005 PO75247 2004
PO73821 2004
PO78408 2003
PO75911 2003 PO70235 2001
PO63095 2000
0.00
27.50
0.00
0.00 0.00 0.00 0.00
0.00
23.70
32.80 15.00
28.90
0.00
0.00
0.00
0.00 0.00 0.00
0.00
0.00
0.00
0.00 0.00
0.00
0.00 0.00
0.00 0.00
0.00 0.00
0.00 0.00 0.00 0.00
0.00 0.00 0.00 0.00
0.00 0.00
0.00 0.00
0.00 0.00 0.00 0.00
0.00 0.00
15.13
50.53
35.67
40.16 7.30
24.89 15.53
10.89
13.39
0.09 12.60
3.67
0.00 0.00
0.00 0.00
7.19 0.00
0.37 0.00 1.17 0.00
-5.83 0.00 5.41 0.00
-10.03 0.00
8.90 0.00
-4.78 0.00 11.08 0.00
0.85 -0.48
Project FY Purpose IBRD IDA SF GEF Cancel. Undisb. Orig. Frm. ID Rev’d
MW-Bus. Env. Strenahenine SIL 0.00 - - (FY07) MW-Sec Natl Water Dev Project S I L (FY07) MW-Irrig, Rural Lvlihds & Agr S IL (FY06) MW-Infrastr Srvcs SJM MW-Health Sec Supt S I M (FY05) MW-Edu Sec Supt S IL 1 (FY05) MW-Com Based Rural Land Dev (FY04) MW-Multi-sectoral AIDS - MAP (FY04) MW-Fin Mgmt, Transpar & Account (FY03) MW-MASAF APL 3 (FY03) Regional Trade Fac. Proj. - Malawi MW-Priv & Utility Reform (FYOO)
0.00
0.00
0.00 0.00 0.00
0.00
0.00
0.00
0.00 0.00
0.00
Total: 0.00 127.90 0.00 0.00 0.00 229.85 14.33 - 0.48
MALAWI STATEMENT OF IFC’s
Held and Disbursed Portfolio In Millions o f U S Dollars
Disbursed
IFC IFC
FY Approval Company Loan Equity Quasi Partic. Loan Equity Quasi Partic.
2000 NICO 0.00 0.52 0.00 0.00 0.00 0.52 0.00 0.00
Total portfolio: 0.00 0.52 0.00 0.00 0.00 0.52 0.00 0.00
Approvals Pending Commitment
FY Approval Company ~~ ~
Loan Equity Quasi Partic.
Total pending commitment: 0.00 0.00 0.00 0.00
107

MOZAMBIQUE
Difference between expected and actual
disbursements Original Amount in US$ Millions
Project ID
FY Purpose IBRD IDA SF GEF Cancel. Undisb. Orig. Frm. Rev’d
MZ-APL2 Roads & Bridges PO83325
PO96332 2007 2007
0.00 0.00
100.00
30.00 0.00 0.00 0.00 0.00
0.00 0.00
100.06 29.47
0.00 0.00 -0.81 0.00 Maputo Municipal Development
Program MZ-Market Led Smallholder Dev (FY06)
PO93 165 2006 0.00 20.00 0.00 0.00 0.00 19.19 1.87 0.00
PO87347 2006 M Z Tech & Voc Fdu & Training (FY06)
0.00 30.00 0.00 0.00 0.00 29.68 3.62 0.00
PO86169 PO71465
PO76809
2006 2006 2006
MZ-Financial Sector TA Project MZ-TFCA & Tourism Dev (FY06) MZ-GEF TFCA & Tourism Dev (FY06) MZ-Beira Railway S I L (FY05) M Z - Energy Reform and Access S i L (FY04)
MZ-Decentr Planning &Fin SIL (FY04) MZ-HIVIAIDS Response S IL (FY03) MZ: Pub Sec Reform (FY03) MZ-Com Sec Reform M Z Higher Education S I M (FY02)
MZ-Roads & Bridges MMP (FY02) MZ-Mineral NRMCP (FYOl) MZ-Coastal & Marine Biodiv Mgmt (FYOO) GEF Coastal & Marine S I L (FYOO) MZ-Natl Water 2 (FY99)
0.00 0.00 0.00
10.50 20.00 0.00
0.00 0.00 0.00 0.00 0.00 10.00
0.00
0.00 0.00
9.51
18.33 9.68
0.17 0.00 0.21 0.00 1.17 0.00
PO82618 PO69183
2005 2004
0.00 0.00
110.00 40.26
0.00 0.00 0.00 3.09
0.00 0.00
65.70 39.17
-9.71 0.00 29.99 12.17
PO01807 2004 0.00 0.00 0.00 0.00 0.00 20.94 7.78 0.00
PO78053 2003 0.00 0.00 0.00 0.00 0.00 31.55 3.28 0.00
PO72080 PO73479 PO69824 PO01785
2003 2002 2002 2002
0.00 0.00 0.00 0.00
0.00 14.90
60.00 162.00
0.00 0.00 0.00 0.00 0.00 0.00 0.00 0.00
0.00
0.00 0.00 0.00
20.63
5.97 14.36 13.66
17.10 0.00 3.74 -0.20 4.74 0.00
-12.44 -17.85
PO01 808 PO70305
2001
2000 0.00 0.00
18.00 5.60
0.00 0.00
0.00 0.00 0.00 0.00
0.92 0.17
-1.03 0.00 -0.33 -0.46
PO35919 PO52240
2000 1999
0.00 0.00
0.00 75.00
0.00 4.11
0.00 0.00 0.00 0.00
0.70 31.28
4.10 4.00 9.78 13.57
Total: 0.00 696.26 0.00 17.20 0.00 461.57 63.23 11.23
MOZAMBIQUE STATEMENT OF IFC’s
Held and Disbursed Portfolio In Millions o f U S Dollars
Committed Disbursed
IFC IFC
FY Approval Company Loan Equity Quasi Partic. Loan Equity Quasi Partic.
2004 ENH 0.00 18.50 0.00 0.00 0.00 13.37 0.00 0.00 GTFP BDC 0.1 1 0.00 0.00 0.00 0.1 1 0.00 0.00 0.00
1997 MOZAL 29.70 0.00 58.50 0.00 29.70 0.00 58.50 0.00 2001 MOZAL 10.12 0.00 0.00 0.00 10.12 0.00 0.00 0.00
108

2000 SEF Ausmoz 0.72 0.00 0.00 0.00 0.72 0.00 0.00 0.00 1997 SEF CPZ 1 .oo 0.00 0.00 0.00 1 .oo 0.00 0.00 0.00 2000 SEF Cab0 Caju 0.58 0.00 0.00 0.00 0.51 0.00 0.00 0.00 2001 SEF Grand Prix 0.33 0.00 0.00 0.00 0.33 0.00 0.00 0.00 2004 SEF Merec I .02 0.00 0.00 0.00 1.02 0.00 0.00 0.00
Total portfolio: 43.58 18.50 58.50 0.00 43.51 13.37 58.50 0.00
Approvals Pending Commitment ~~
FY Approval Company Loan Equity Quasi Partic.
Total uending commitment: 0.00 0.00 0.00 0.00
109
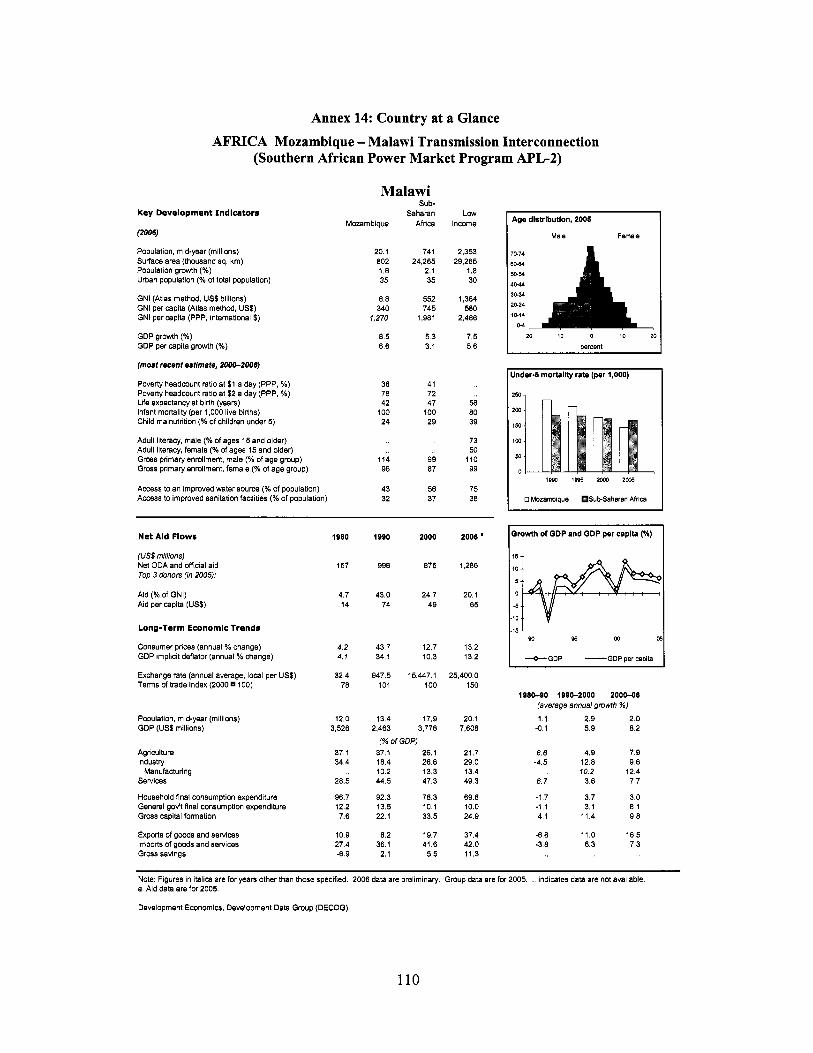
Annex 14: Country at a Glance
AFRICA Mozambique - Malawi Transmission Interconnection (Southern African Power Market Program APL-2)
Key Deve lopmen t Ind l ca to rs
(2006)
Population, mid-year (millions) Surface area (thousand sq. km) Population growth (%) Urban population (% of total population)
GNI (Atlas method, US$ billions) GNI per capita (Atlas method, US$) GNi per capita (PPP, international $)
GDP growth (%) GDP per capita growth (%)
(moat recent estimate, 200&2006)
Poverty headwunt ratio at $1 a day (PPP, %) Poverty headwunt ratio at $2 a day (PPP, %) Life expectancyat birh (years) Infant mortality (per 1,000 live births) Child malnutrition (% of children under 5)
Adult literacy, male (% of ages 15 and older) Adult literacy. female (% of ages 15 and older) Gross primary enrollment, male (% of age group) Gmss primary enrollment, female (% of age group)
Access to an improved water source (% of population) Access to improved sanitation facilities (%of population)
Malawi
Mozambique
20.1 802 1 .e 35
8.8 340
1,270
6.5 6.6
36 78 42
100 24
114 98
43 32
Sub- Saharan
Africa
74 1 24,265
2.1 35
552 745
1,981
5.3 3.1
41 72 47
100 29
99 87
58 37
LOW inwme
2,353 29,285
1.8 30
1,364 580
2.486
7.5 5.6
58 60 39
73 50
110 99
75 38
N e t A id Flows
(US$ millions) Net ODA and offcial aid Top 3 donors (in 2005):
Aid (% of GNI) Aid per capita (US$)
Long-Term Economic T rends
Consumer prices (annual % change) GDP implicit deflator (annual % change)
Exchange rate (annual average, local per US$) Terns of trade index (2000 100)
Population, mid-year (millions) GDP (US$ millions)
Agriculture Industry
Services
Household final consumption expenditure General gogt final consumotion exoenditure Gross capital formation
Exportsofgwdsandservices Imports of goods and sewices Gross savings
Manufacturing
I980
167
4.7 14
4.2 4.1
32.4 78
12.0 3,526
37.1 34.4
28.5
96.7 12.2 7.6
10.9 27.4 5 . 9
1990 2000 2006'
998 876 1.286
43.0 24.7 20.1 74 49 65
43.7 12.7 13.2 34.1 10.3 13.2
947.5 15,447.1 25,400.0 101 100 150
13.4 17.9 20.1 2,463 3,778 7,608
(% of GDP) 37.1 26.1 21.7 18.4 26.6 29.0 10.2 13.3 13.4 445 47.3 49.3
92.3 78.3 69.8 13.5 10.1 10.0 22.1 33.5 24.9
8.2 19.7 37.4 36.1 41.6 42.0 2.1 5.5 11.3
Age distribution, 2005
Male Female I 7074 e m 5054 4c-44 3034 2024
1014 w
20 10 0 10 2c
percent
I Jnder-5 mortality rate (per 1,000)
n I 2w
1 x I
1w
50
0 1880 1885 2 m 2005
0 Mozambique SubSaharan Afrlca I I
I Growth of GDP and GDP per caplta (Oh)
1080-00 1004-2000 2000-06 (average annual growth %) 1.1 2.9 2.0
4 . 1 5.9 8.2
6.6 4.9 7.9 -4.5 12.8 9.8
10.2 12.4 6.7 3.6 7.7
-1.7 3.7 3.0 -1.1 3.1 8.1 4.1 11.4 9,8
-8.8 11.0 16.5 -3.8 6.3 7.3
Note: Figures in italics are for years other than hose specified. 2008 data are preliminary. Group data are for 2005. .. indicates data are not available. a. Aid data are f w 2005.
Development Economics, Development Data Group (DECDG).
110
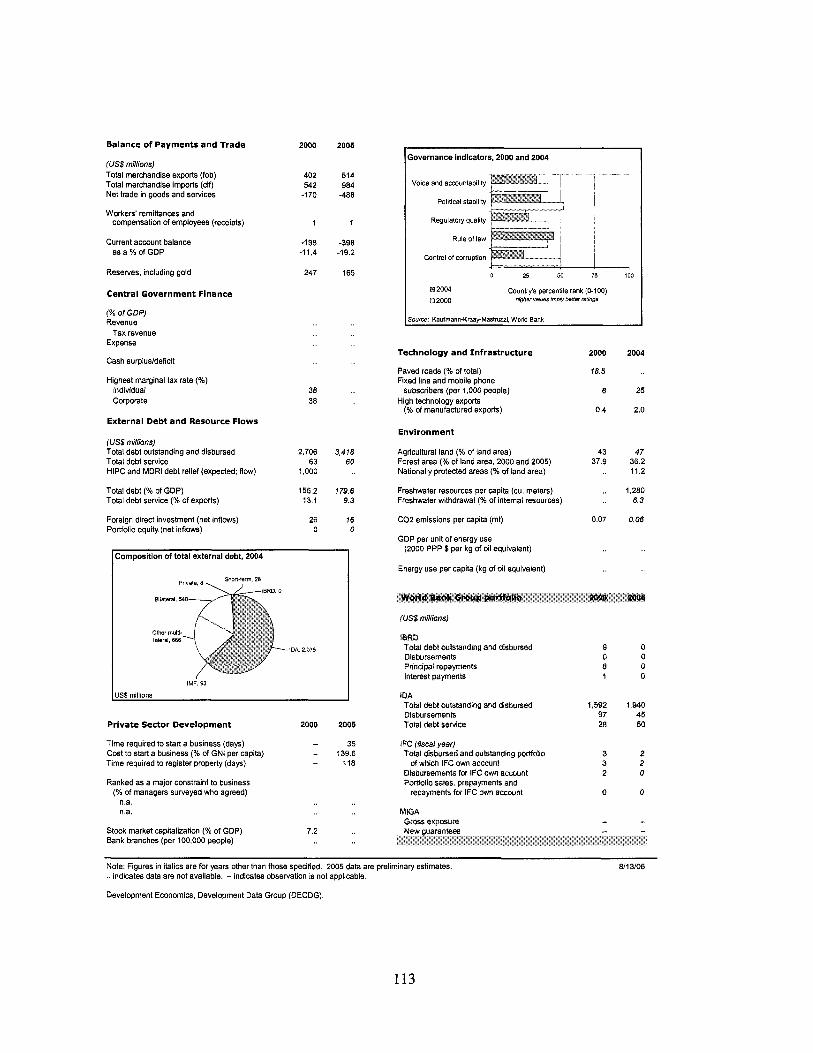
Balance of Payments and Trade
(US$ mi/lions) Total merchandise exports (fob) Total merchandise imports (&I Net trade in goods and services
Workers' remittances and compensation of employees (receipts)
Current account balance as a % of GDP
Reserves, including goid
Central Government Finance
(% of GDP) Revenue
Expense
Cash surpiusldeficit
Highest marginal tax rate (46)
Tax revenue
Individual Corporate
External Debt and Resource Flows
(US$ mi//ions) Total debt outstanding and disbursed Total debt service HIPC and MDRi debt relief (expected; flow)
Total debt (% of GDP) Total debt service (% of exports)
Foreign direct investment (net inflows) Portfolio equity (net inflows)
2000
402 542
-170
1
-198 -1 1.4
247
36 38
2,706 63
1.000
155.2 13.1
26 0
2005
514 984
-488
1
-398 -19.2
165
3,416 60
179.6 9.3
16 0
Composition of total external debt, 2004
PrlVBlC 8 Short 28
IDA 2 075
IMF. 83
US$ millions
Private Sector Development 2000 2005
Time required to start a business (days) - 35
Time required to register properly (days) - 118 Cost to start a business (% of GNi per capita) - 139.6
Ranked as a major constraint to business (% of managers SuNeyed who agreed)
n.a. n.a.
Stock market capitalization (% of GDP) Bank branches (per 100,000 people)
7.2
Sovernance indicators, 2000 and 2004
Voice and accountability
Polttlcal stability
Regulatory quality
Rule of law
Control of corruption
0 25 50 75 1w
83 2004 u20w
Country's percentlle rank (0-103) hghw vdue.9 mpY Me, mtmx
Technology and Infrastructure
Paved roads (% of total) Fixed line and mobile phone
High technology exports subscribers (per 1,000 people)
(% of manufactured exports)
Environment
Agricultural land (Oh of land area) Forest area (% of land area, 2000 and 2005) Nationally protected areas (% of land area)
Freshwater resources per capita (cu. meters) Freshwater withdrawal (% of internal resources)
C02 emissions per capita (mt)
GDP per unit of energy use (2000 PPP $ per kg of oil equivalent)
Energy use per capita (kg of oil equivalent)
2000
18.5
8
0.4
43 37.9
0.07
2004
25
2.0
47 36.2 11.2
1,280 6.3
0.06
IBRD Total debt outstanding and disbursed Disbursements Principal repayments interest payments
Total debt outstanding and disbursed Disbursements Total debt service
IDA
iFC (fiscal year) Total disbursed and outstanding portfolio
Disbursements for IFC own account Portfolio sales, prepayments and
repayments for IFC own account
of which IFC Own account
MlGA Gross exmure
9 0 8 1
1.592 97 28
3 3 2
0
I
0 0 0 0
1,340 45 50
2 2 0
0
I - New guarantees -
Note: Figures in italics are for years other than those specified. 2005 data are preliminary estimates. .. indicates data are not available. -indicates ObSeNatiOn is not applicable.
Development Economics, Development Data Group (DECDG)
8/13/06
113

Mozambique
Key Development Indicators
(2005)
Population, mid-year (millions) Surface area (thousand sq. km) Population growth (%) Urban population (% of total population)
GNi (Atias method, US$ billions) GNi per capita (Atias method, US$) GNi per capita (PPP, international $)
GDP growth (%) GDP per capita growth (%)
(most recent estimate, ZOOO-2005)
Poverty headcount ratio at $1 a day (PPP, %) Poverty headcount ratio at $2 a day (PPP, %) Life expectancy at birth (years) infant mortality (per 1,000 live births) Child malnutrition (% of children under 5)
Adult literacy, male (% of ages 15 and older) Adult literacy, female (% of ages 15 and older) Gross primaryenrollment, male (% of age group) Gross prirnaryenrollment. female (% of age group)
A m % to an improved water source (X of population) A m s s to improved sanitation facilities (% of population)
Malawi
12.9 118 2.2 17
2.1 160 650
2.6 0.4
42 76 ' 40
110 22
75 54
123 126
73 61
Sub- Saharan
Africa
741 24,265
2.1 35
552 745
1,981
5.3 3.1
44 75 48
100 29
99 87
56 37
LOW income
2,353 29,265
1.8 30
1,364 580
2,486
7.5 5.6
59 80 39
73 50
110 99
75 38
Net Aid Flows
(USS millions) Net ODA and M d a l aid Top 3 donors (in 2004):
Aid (% of GNi) Aid per capita (US$)
Long-Term Economic Trends
Consumer prices (annual % change) GDP implicit deflator (annual % change)
Exchange rate (annual average, local per US$) Terms of trade index (2000 = 100)
Population, mid-year (millions) GDP (US$ millions)
Agriculture industry
Services
Household final consumption expenditure General gob4 final consumption expenditure Gross capital formation
Exports of goods and services Imports of goods and services Gross savings
Manufacturing
__
1980
143
12.6 23
71.8 15.8
0.8
8.2 1,238
43.7 22.5 13.7 33.7
69.9 19.3 24.7
24.8 38.8
1990 2000
503 446
27.4 26.1 53 39
11.8 29.6 10.7 30.5
2.7 59.5 145 100
9.5 11.5 1,881 1,744
45.0 39.5 28.9 17.9 19.5 12.9 26.1 42.5
71.5 81.6 15.1 14.6 23.0 13.8
23.8 25.6 33.4 35.3 13.6 2.2
(% of GDP)
2005 '
476
25.6 38
15.4 15.5
118.4 104
12.9 2,072
34.7 19.4 12.5 45.9
94.9 16.7 14.5
26.8 53.0 -7.4
&e dlstrlbutlon, 2005
Male Female
70-74 I 50-84
Z ) 30-34
20-24
m IO o IO 20
percent
LlnderS mortallty rate (per 1,000)
'"1 - 2W
I W
0 I S M 1885 2wo 2 m
0 Malawi Bl SubSaharan Ahica
Srowth of GDP and GDP per capita (%)
80 85 W
+GDP - GDP per capita
1980-90 1990-2000 2000-05 (average annual growth %) 4.3 2.0 2.3 2.5 3.7 3.4
2.0 8.8 0.5 2.9 2.0 3.8 3.6 0.5 I .7 3.3 1.8 3.2
2.2 6.5 4.1 6.3 -4.4 8.5
-2.8 -8.4 2.5
2.5 4.0 2.7 -0.3 -1.1 8.1
Note: Figures in italics are for years other than those spedfied. 2005 data are preliminary estimates. .. indicates data are not available a. Country poverty estimate is for 1998. b. Aid data are for 2004.
Development Economics, Development Data Group (DECDG).
112
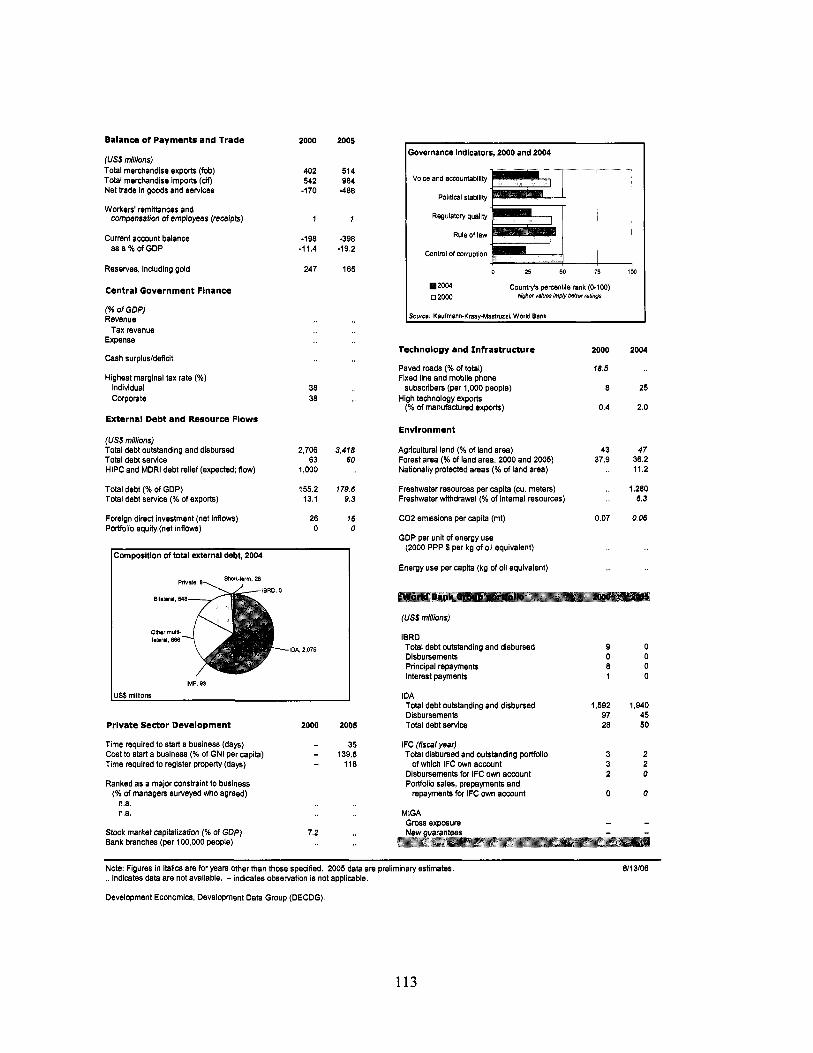
Balance of Payments and Trade
(US$ millions) Total merchandise exports (Fob) Total merchandise imports (cif) Net trade in goods and services
Workers' remittances and compensation of employees (receipts)
as a % of GDP Current account balance
Reserves, including gold
Central Government Finance
(%of GDP) Revenue
Expense
Cash surpius/deflcit
Highest marginal tax rate (%)
Tax revenue
In d i vi d u a i corporate
External Debt and Resource Flows
(US$ millions) Total debt outstanding and disbursed Total debt service HlPC and MDRl debt relief (expected; flow)
Total debt (% OF GDP) Total debt service (% of exports)
Foreign direct investment (net inflows) Portfolio equity (net inflows)
2000
402 542
-170
1
-1 98 -1 1.4
247
38 38
2,706 63
1,000
155.2 13.1
26 0
2005
514 984
-488
1
-398 -19.2
165
3,418 60
179.6 9.3
16 0
Composition of total external debt, 2004
IMF. 93
US$ nilll0ns
Private Sector Development 2000 2005
Time required to start a business (days) - 35
Time required to register properly (days) - 118 Cost to start a business (% of GNI per capita) - 139.6
Ranked as a major constraint to business (% of managers surveyed who agreed)
n.a. n.a.
Stock market capitalization (% of GDP) Bank branches (per 100,000 people)
7.2
2overnance Indlcators, 2000 and 2004
Volce and acmuntability
Political stability
Regulatory quallty
Rule of IBW
Contmi of mrmption
0 25 50 75 1W
2004 0 2000
Counby's percenble rank (0100) hmer vdm imm Mar reuw
Sou- Kau(rnann.KraayMasbuzzi World Bank
Technology and Infrastructure
Paved roads (% of total) Fixed line and mobile phone
High technology exports subscribers (per 1,000 people)
(% of manufactured exports)
Environment
Agricultural land (% of land area) Forest area (% of land area, 2000 and 2005) Nationally protected areas (% of land area)
Freshwater resources per capita (cu. meters) Freshwater withdrawal (% of internal resources)
C02 emissions per capita (mt)
GDP per unit of energy use (2000 PPP $ per kg of oil equivalent)
Energy use per capita (kg of oil equivalent)
2000
18.5
8
0.4
43 37.9
0.07
2004
25
2.0
47 36.2 11.2
1,280 6.3
0.06
(US$ millions)
IBRD Total debt outstanding and disbursed Disbursements Prinapal repayments Interest payments
IDA Total debt outstanding and disbursed Disbursements Total debt servlce
iFC (fiscal year) Total disbursed and Outstanding portfolio
Disbursements For IFC own account Podfolio sales, prepayments and
repayments For IFC own account
ofwhlch IFC own account
MlGA Gross exposure
9 0 8 1
1,592 97 28
3 3 2
0
-
0 0 0 0
1,940 45 50
2 2 0
0
- - New guarantees -
Note: Figures In italics are for years other than those specifled. 2005 data are preliminary estimates. .. indicates data are not available. -indicates observation is not applicable.
Development Economics, Development Data Group (DECDG)
811 3/06
113


Annex 15: Maps AFRICA Mozambique - Malawi Transmission Interconnection
(Southern African Power Market Program APL-2)


For Detail, See InsetFor Detail, See InsetFor Detail, See Inset
MomaMoma
57 MW steam57 MW steam78 MW gas turbines78 MW gas turbines
SalamangaSalamanga
InfuleneInfuleneManhiçaManhiça
Xai-XaiXai-Xai
MaciaMacia
BoaneBoane
MatolaMatola
MaputoMaputo
LiondeLionde
LindelaLindela
BuziBuzi
ChicambaChicamba38 MW38 MW
MavuziMavuzi52 MW52 MW
DondoDondoMangaManga
MarromeuMarromeu
PhombeyaPhombeya
QuelimaneQuelimane
CuambaCuamba
LichingaLichinga
Alto-MolAlto-Molócucue
CaiaCaia
MocubaMocuba
GuruGuruéNampula 220Nampula 220
NampulaNampulaCentralCentral
NacalaNacala
MetoroMetoro
MonapoMonapo
PembaPemba
MatamboMatambo
SONGOSONGO
WOVWEWOVWE
NKULANKULA
TEDZANITEDZANI
KAPICHIRAKAPICHIRA
MPATAMANGAMPATAMANGA
NchaloNchalo
ChiradzuluChiradzulu
MulanjeMulanje
ZombaZomba
Liwonde BarrageLiwonde Barrage
ChinthecheChintheche
MafambisseMafambisse
LamegoLamegoInchopeInchopeGondolaGondola
ChibataChibataChimoio 2Chimoio 2
Chimoio 1Chimoio 1
CorumanaCorumana14 MW14 MW
12 MW gas (jet)12 MW gas (jet)
MatamboMatambo
PhombeyaPhombeya
Xai-XaiXai-Xai
MatelaMatela
ChimoioChimoio
TeteTete
NampulaNampula
LichingaLichinga
BlantyreBlantyre
MzuzuMzuzu
LILONGWELILONGWE
MAPUTOMAPUTO
CatandicaCatandica
MessicaMessica
MutuaMutua
UapeUape
Matambo
Phombeya
Xai-Xai
Matela
Beira
Chimoio
Quelimane
Tete
Nampula
Inhambane
Pemba
Lichinga
Blantyre
Mzuzu
LILONGWE
MAPUTO
Moma
57 MW steam78 MW gas turbines
Salamanga
InfuleneManhiça
Xai-Xai
Macia
Boane
Matola
Maputo
Komatiport
Lionde
400 kV Lineto Arnot
To Apollo
400 kV Lineto Camden
Edwaleni II
Lindela
Buzi
Mutare
Manica Messica
Bindura
Chicamba38 MW
Mavuzi52 MW
DondoManga
Marromeu
Phombeya
Quelimane
Cuamba
Lichinga
Alto-Molócue
Uape
Caia
Mocuba
GuruéNampula 220
NampulaCentral
Nacala
Metoro
Monapo
Pemba
Matambo
SONGO
WOVWE
NKULA
TEDZANI
KAPICHIRA
MPATAMANGA
Nchalo
Chiradzulu
Mulanje
Zomba
Liwonde Barrage
Chintheche
KarongaChitipa
MafambisseMutua
LamegoInchopeGondola
Chibata
Catandica
Chimoio 2Chimoio 1
Corumana14 MW
12 MW gas (jet)
Z I M B A B W E
Z A M B I A
S O U T HA F R I C A
SWAZILAND
T A N Z A N I A
(Malawi)
Chisumulu I.Likoma I.
Lugenda
Messalo
Lúrio
Ligonha
Licungo
Zambeze
Buzi
Save
Changane
Zambeze
Limpopo
Bua
Songwe
Shire
Bua
Kasit
uDwangwa
Rusa
Lilon
gwe
S. R
uk
uru
N. R
ukur
u
Shire
Lago deCahora Bassa
LakeMalawi
LakeChilwa
INDIANOCEAN
INDIAN OCEAN
LakeChiuta
LakeMalombe
To Chipata
To Chipata
To Lundazi
To Muyombe
To Muyombe
To Tunduma
To Mbeya
To Mtwara
To Petauke
To Lusaka
ToMutoko
To Harare
To Masvingo
To Masvingo
To Rutenga
To Messina
To Nelspruit
To Mbabane
10° S
15° S
20° S
25° S
10° S
40° E35° E30° E
35° E30° E
15° S
20° S
25° S
SE1SE1SE7SE7
SE5SE5
SE3SE3
CTMCTM
SE2SE2
InfuleneInfuleneLaulaneLaulane
P. CaniçoP. CaniçoMachavaMachava
P. MozalP. MozalBeloluaneBeloluane
MatolaMatolaRioRio
ManhiçaKomatiport
MatolaGare
Maputo
ToArnot
ToKomatiport
ToCorumana
ToManhiça
InfuleneLaulane
P. Caniço
SE1
SE2
SE7
SE5
SE4SE6Machava
Mozal
P. MozalMatola
Beloluane
SE3CTM
CimentosBoane MatolaRio
ToMacia
ToEdwaleni
ToSalamanga
SWAZILAND
SOUTHAFRICA
INDIANOCEAN
MAPUTO
MALAWI &MOZAMBIQUE
MALAWI & MOZAMBIQUE
SOUTHERN AFRICA POWER MARKET APL 2TRANSMISSION LINE INTERCONNECTORBETWEEN MOZAMBIQUE AND MALAWI
IBRD 35355
APRIL 2007
This map was produced by the Map Design Unit of The World Bank. The boundaries, colors, denominations and any other information shown on this map do not imply, on the part of The World Bank Group, any judgment on the legal status of any territory, o r any endo r s emen t o r a c c e p t a n c e o f s u c h boundaries.
INTERCONNECTED NETWORK:
±533 kV LINES
400 kV LINES
275 kV LINES
220 kV LINES
132 kV LINES
110 kV LINES
66 kV LINES
33 kV LINES
MAJOR SUBSTATIONS
HYDRO POWER PLANTS
UNTAPPED HYDRO-POTENTIAL
THERMAL POWER PLANTS
MAIN ROADS
RAILROADS
SELECTED CITIES AND TOWNS
REGION CAPITALS
NATIONAL CAPITAL
INTERNATIONAL BOUNDARIES
PROJECT PLANNED EXISTING
0
0 50 100 150 Miles
50 100 150 200 Kilometers

PhombeyaPhombeyaMatamboMatambo
KaraviaKaravia
LuanoLuano
Nzelo &Nzelo &NsekeNseke
MwadingushaMwadingusha& Koni& Koni
SolweziSolwezi
KolweziKolwezi
Kafue LowerKafue Lower
IngaInga
CapandaCapanda
CambambeCambambe
MatalaMatala
LomaumLomaum
RuacanaRuacana
Kudu CCGTKudu CCGT
KokerboomKokerboom
EhuhaEhuha
KoebergKoeberg
AggensisAggensisAriesAries
GriepGriep
DrakensbergDrakensberg
CamdenCamden
Edwaleni IIEdwaleni II
MuellaMuella
Van DerVan DerKloofKloof
PalmietPalmiet
MerapiMerapi
MatimbaMatimba
PhokojePhokoje
MarvelMarvelInsukaminiInsukamini
SpitskopSpitskopApolloApollo
ArnotArnot
FrancistownFrancistown
KomatipoortKomatipoortCorumanaCorumana
MorupuleMorupule
HwangeHwange
BatokaBatoka
KapichiraKapichira
Cahora BassaCahora BassaMepandaMepandaUncuaUncua Nkula A&BNkula A&B
Alto MalemaAlto Malema
Gokwe NGokwe NBinduraBindura
Kariba S&NKariba S&N
VictoriaVictoriaFallsFalls
PensuloPensulo
KidatuKidatu
PanganiPangani
UbungoUbungo
HaleHale
MteraMtera
KihansiKihansiMwakibeteMwakibete
LüderitzLüderitz
Walvis BayWalvis Bay
ArushaArusha
IringaIringa
DodomaDodomaSingidaSingida
TaboreTabore
KitweKitwe
KimberleyKimberley
East LondonEast London
BloemfonteinBloemfontein
LikasiLikasi
Owen FallsOwen Falls
MwanzaMwanza
MusomaMusoma
KasamaKasama
LichingaLichinga
CuambaCuamba
NacalaNacala
PembaPemba
NampulaNampulaAlto MolocueAlto Molocue
BeiraBeira
CaiaCaia
BulawayoBulawayo
InhambaneInhambane
Temane Gas FieldsTemane Gas FieldsPande Gas FieldsPande Gas Fields
Xai-XaiXai-Xai
Louis TrichardtLouis TrichardtSeruleSerule
DurbanDurban
Richards BayRichards Bay
Port ElizabethPort ElizabethMosselbaaiMosselbaai
JohannesburgJohannesburg MbabaneMbabane
GaboroneGaborone
WindhoekWindhoek
MaseruMaseru
KigaliKigali
KampalaKampala
BujumburaBujumbura
LilongweLilongwe
Dar esDar esSalaamSalaam
HarareHarare
PretoriaPretoria
KinshasaKinshasa
LuandaLuanda
LusakaLusaka
Cape TownCape Town
MaputoMaputo
NairobiNairobi
132 kV Cable132 kV Cableto Zanzibarto Zanzibar
330
kV33
0 kV
400
kV40
0 kV
TT
TTS
S
S
S
S
S
S
S
S
S
S
S
S
S
SS
S
S
S
S
S
S
SS
S
S
SS
S
S
S
S
S
S
S
S
S
T T
T TT
T
T
T
T
PhombeyaMatambo
Karavia
Luano
Nzelo &Nseke
Mwadingusha& Koni
Solwezi
Kolwezi
Kafue Lower
Inga
Capanda
Cambambe
Matala
Lomaum
Ruacana
Kudu CCGT
Kokerboom
Ehuha
Koeberg
AggensisAries
Griep
Drakensberg
Camden
Edwaleni II
Muella
Van DerKloof
Palmiet
Merapi
Matimba
Phokoje
MarvelInsukamini
SpitskopApollo
Arnot
Francistown
KomatipoortCorumana
Morupule
Hwange
Batoka
Kapichira
Cahora BassaMepandaUncua Nkula A&B
Alto Malema
Gokwe NBindura
Kariba S&N
VictoriaFalls
Pensulo
Kidatu
Pangani
Ubungo
Hale
Mtera
KihansiMwakibete
500 kV DC
220 kV
220 kV
220 kV220 kV
220 kV
330 kV
400 kV400 kV
400 kV
400 kV
275 kV
220 kV
330 kV
330 kV
330
kV
330
kV
330 kV
220
kV
220 kV
132 kV
132 kV
132 kV Cableto Zanzibar
110 kV
220 kV
220 kV
400
kV
132 kV
220
kV
110 kV
HVDC
or H
VAC
Tran
smiss
ion
Syste
m
533
kV D
C
Lüderitz
Walvis Bay
Arusha
Iringa
DodomaSingida
Tabore
Kitwe
Kimberley
East London
Bloemfontein
Likasi
Owen Falls
Mwanza
Musoma
Kasama
Lichinga
Cuamba
Nacala
Pemba
NampulaAlto Molocue
Beira
Caia
Bulawayo
Inhambane
Temane Gas FieldsPande Gas Fields
Xai-Xai
Louis TrichardtSerule
Durban
Richards Bay
Port ElizabethMosselbaai
Johannesburg Mbabane
Gaborone
Windhoek
Maseru
Kigali
Kampala
Bujumbura
Lilongwe
Dar esSalaam
Harare
Pretoria
Kinshasa
Luanda
Lusaka
Cape Town
Maputo
Nairobi
UGANDA
SUDAN ETHIOPIA
GABON
CONGO
EQ.GUINEA
DEM. REP.OF CONGO
A N G O L A
N A M I B I A
ZAMBIA
MALAWI
BOTSWANA
SOUTHAFRICA LESOTHO
SWAZILAND
ZIMBABWE
CAMEROON
TANZANIA
BURUNDI
RWANDA
KENYA
20°
10°
0°
30°
20°
10°
0°
20° 30°
30° 40°
LakeTurkana
Lake AlbertCongo
Kasai
Lake
Victoria
Lake Tanganyika
Lake Malawi
LakeKariba
Zambezi
LakeMweru
Ubangi
Orange
Limpopo
Orange
AT L A N T I C
O C E A N
I N D I A NO C E A N
Con
go
This map was produced by the Map Design Unit of The World Bank. The boundaries, colors, denominations and any other information shown on this map do not imply, on the part of The World Bank Group, any judgment on the legal status of any territory, o r any endo r s emen t o r a c c e p t a n c e o f s u c h boundaries.
IBRD 35356
APRIL 2007
SELECTED CITIES
NATIONAL CAPITAL
RIVERS
INTERNATIONAL BOUNDARIES
SOUTHERN AFRICA
SOUTHERN AFRICANPOWER POOL
POWER LINES
REHABILITATED POWER LINES
SUBSTATIONS
HYDRO POWER PLANTS
THERMAL POWER PLANTS
NUCLEAR POWER PLANTS
COORDINATION CENTER
S
TTT
S
EXISTINGPOSSIBLEFUTURE PROGRAM
0
0 100 200 300 Miles
100 200 300 400 Kilometers
Maseru