the$act$trial$ - ercongressi.it 27, 2015/02... · 2012...2015. t-cell lymphomas: we are...
TRANSCRIPT

2012...2015. T-Cell Lymphomas: We are illuminating
the darkest of tunnels
The ACT trial for adult pa1ents with treatment-‐naïve, systemic
PTCL Francesco d’Amore, MD PhD
Aarhus University Hospital Denmark

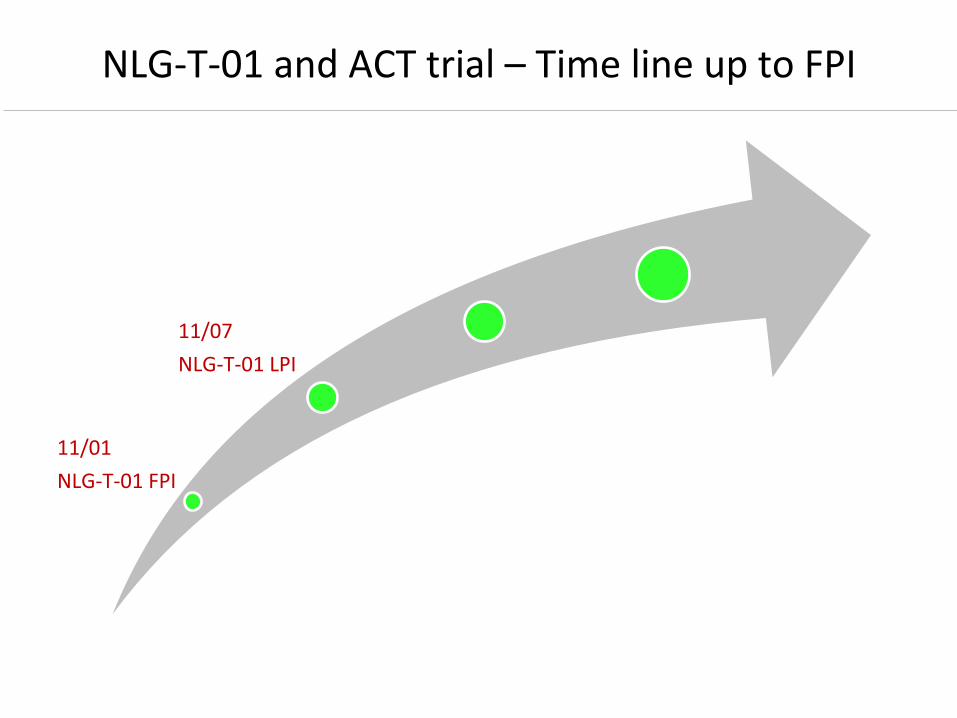
NLG-‐T-‐01 and ACT trial – Time line up to FPI
11/01 NLG-‐T-‐01 FPI
11/07 NLG-‐T-‐01 LPI

CHO(E)P-‐14d x 3
CHO(E)P-‐14d x 3 (stem cell collection)
HDT (BEAM)
Follow-‐up
Excluded: • Precursor TCL • alk+ ALCL • CTCL • Primary leukemic PTCL
CHO(E)P : 18-‐60 yrs: CHOEP-‐14 (n=118) 61-‐67 yrs: CHOP-‐14 (n=42)
CR, PR NC,PD
CR, PR NC,PD
JCO 2012;30(25):3093-‐9
60 mo median follow-‐up
N evaluable pts: 160
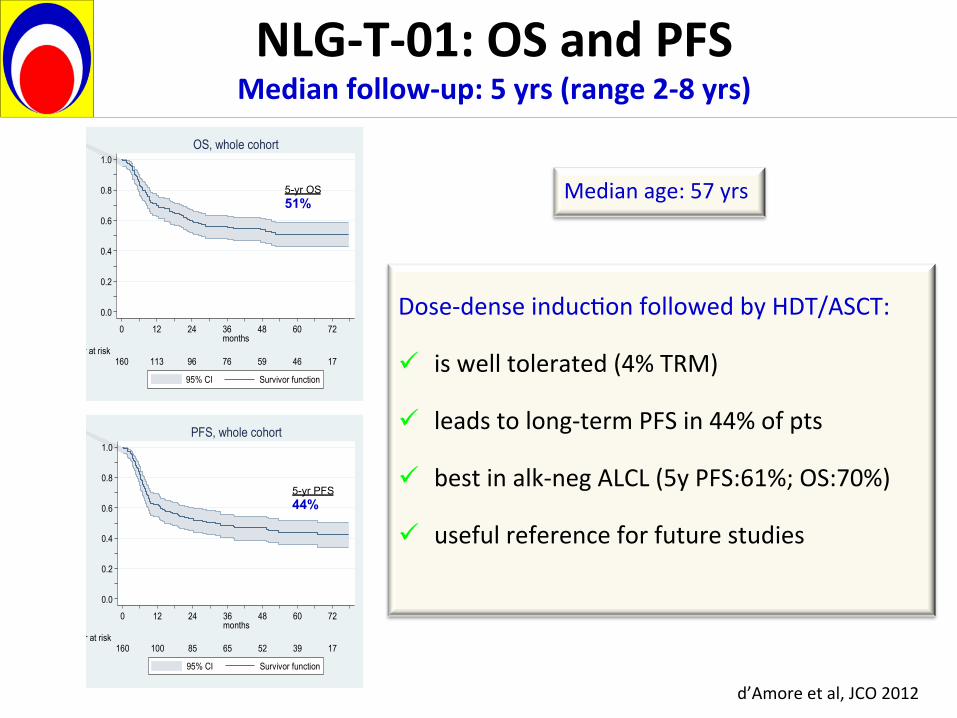
NLG-‐T-‐01: OS and PFS Median follow-‐up: 5 yrs (range 2-‐8 yrs)
0.0
0.2
0.4
0.6
0.8
1.0
0 12 24 36 48 60 72months
160 113 96 76 59 46 17 Number at risk
95% CI Survivor function
OS, whole cohort
5-yr OS 51%
0.0
0.2
0.4
0.6
0.8
1.0
0 12 24 36 48 60 72months
160 100 85 65 52 39 17 Number at risk
95% CI Survivor function
PFS, whole cohort
5-yr PFS 44%
Dose-‐dense induc1on followed by HDT/ASCT: ü is well tolerated (4% TRM) ü leads to long-‐term PFS in 44% of pts ü best in alk-‐neg ALCL (5y PFS:61%; OS:70%) ü useful reference for future studies
Median age: 57 yrs
d’Amore et al, JCO 2012
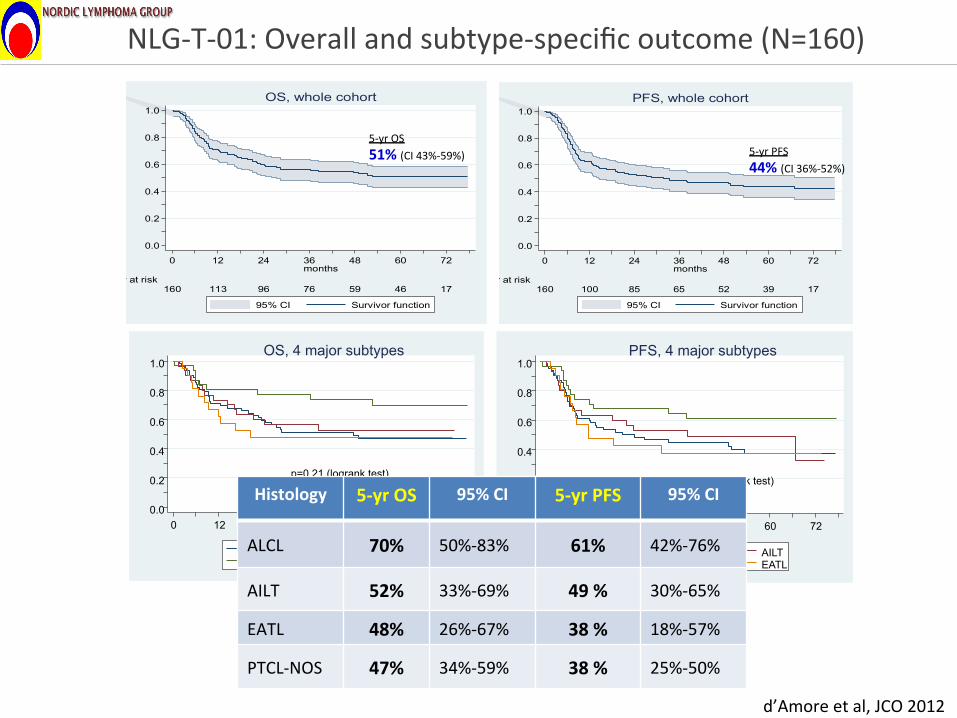
NLG-‐T-‐01: Overall and subtype-‐specific outcome (N=160)
0.0
0.2
0.4
0.6
0.8
1.0
0 12 24 36 48 60 72months
160 113 96 76 59 46 17 Number at risk
95% CI Survivor function
OS, whole cohort
5-‐yr OS 51% (CI 43%-‐59%)
0.0
0.2
0.4
0.6
0.8
1.0
0 12 24 36 48 60 72months
160 100 85 65 52 39 17 Number at risk
95% CI Survivor function
PFS, whole cohort
5-‐yr PFS 44% (CI 36%-‐52%)
d’Amore et al, JCO 2012
p=0.21 (logrank test) 0.0
0.4 0.2
0.6 0.8 1.0
0 12 24 36 48 60 72 months
PTCL-NOS AILT Alk-negative ALCL EATL
OS, 4 major subtypes
p=0.26 (logrank test) 0.0 0.2 0.4 0.6 0.8 1.0
0 12 24 36 48 60 72 months
PTCL-NOS AILT Alk-negative ALCL EATL
PFS, 4 major subtypes
Histology 5-‐yr OS 95% CI 5-‐yr PFS 95% CI
ALCL 70% 50%-‐83% 61% 42%-‐76%
AILT 52% 33%-‐69% 49 % 30%-‐65%
EATL 48% 26%-‐67% 38 % 18%-‐57%
PTCL-‐NOS 47% 34%-‐59% 38 % 25%-‐50%

NLG-‐T-‐01 -‐ Long-‐term follow-‐up (10yrs med; range:7-‐13 yrs )
OS PFS DSS
41% 38% 51%
d’Amore et al, ICML 2015
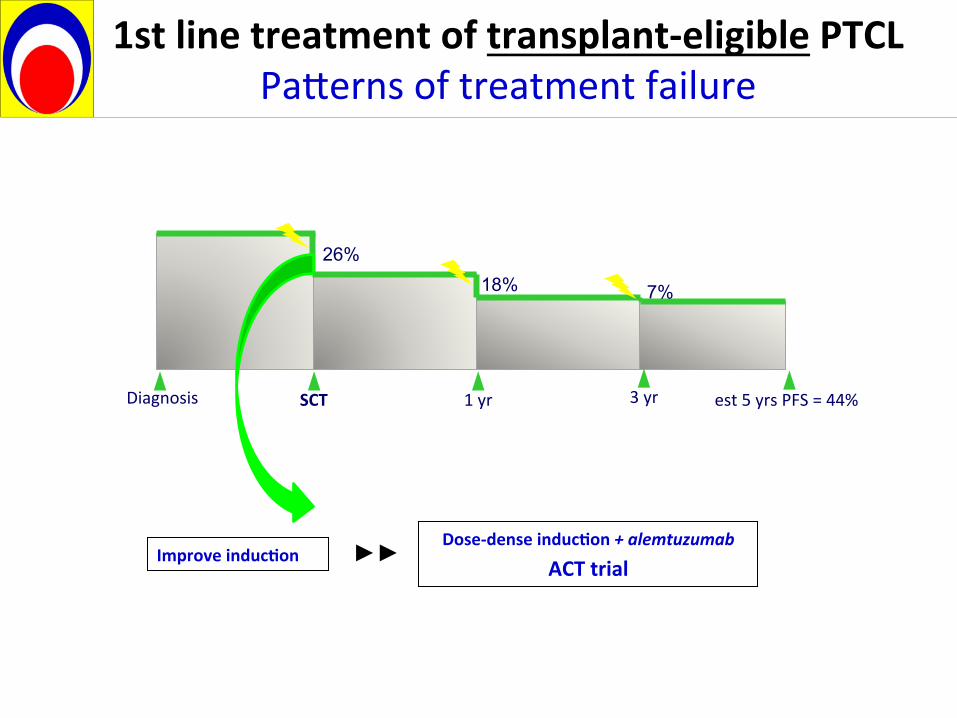
1st line treatment of transplant-‐eligible PTCL Paeerns of treatment failure
Improve inducTon
Diagnosis 1 yr est 5 yrs PFS = 44%
26% 18% 7%
3 yr SCT
Dose-‐dense inducTon + alemtuzumab
ACT trial ►►

ACT-‐1
ACT study Trial design
RANDOMIZATION
6 x CHOP-‐14 + HDT-‐ASCT
6 x CHOP-‐14 with Alemtuzumab
+ HDT-‐ASCT
RANDOMIZATION
6 x CHOP-‐14
6 x CHOP-‐14 with Alemtuzumab
ACT-‐2

NLG-‐T-‐01 and ACT trial – Time line up to FPI
11/01 NLG-‐T-‐01 FPI
11/07 NLG-‐T-‐01 LPI
11/07 ACT-‐2 FPI
06/08 ACT-‐1 FPI
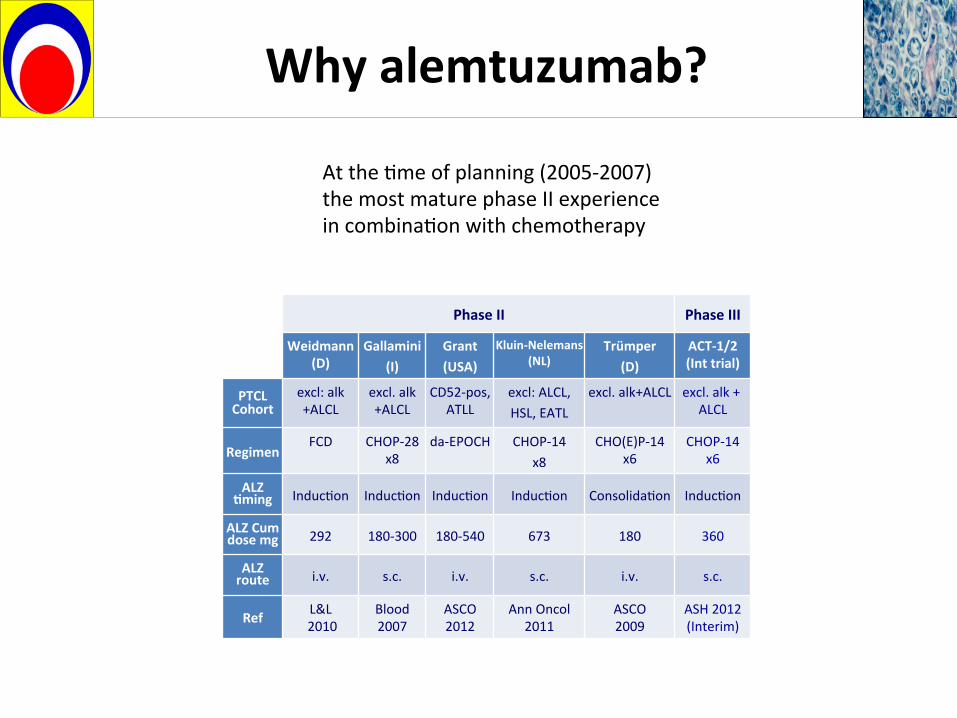
Why alemtuzumab?
Phase II Phase III
Weidmann (D)
Gallamini (I)
Grant (USA)
Kluin-‐Nelemans (NL)
Trümper (D)
ACT-‐1/2 (Int trial)
PTCL Cohort
excl: alk+ALCL
excl. alk+ALCL
CD52-‐pos, ATLL
excl: ALCL, HSL, EATL
excl. alk+ALCL excl. alk + ALCL
Regimen FCD CHOP-‐28
x8 da-‐EPOCH CHOP-‐14
x8 CHO(E)P-‐14
x6 CHOP-‐14
x6
ALZ Tming Induc1on Induc1on Induc1on Induc1on Consolida1on Induc1on
ALZ Cum dose mg 292 180-‐300 180-‐540 673 180 360
ALZ route i.v. s.c. i.v. s.c. i.v. s.c.
Ref L&L 2010
Blood 2007
ASCO 2012
Ann Oncol 2011
ASCO 2009
ASH 2012 (Interim)
At the 1me of planning (2005-‐2007) the most mature phase II experience in combina1on with chemotherapy

Efficacy of Alemtuzumab in combination with dose-adjusted EPOCH in untreated nodal PTCL
Grant C et al ASCO 2012, Abstr.8051
Nodal PTCL
ATLL P=0.06 ATLL
Nodal PTCL
P=0.08
45 mo median follow-up Jiang BJH 2009
Geissinger L& L 2009
PTCL-‐NOS 93% 90 %
AILT 100% 90%
ALCL -‐-‐-‐ 0%
HS 100%
T/NK 25%
CD52 expression
Prior dose-‐finding Phase I study (Janik et al, ASH 2007) ►► 30 mg pr course of daEPOCH
Courtesy of dr. Cliona Grant (adapted)
CD52 expression required for protocol entry

Auto
A60 - CHOP-14
The ACT trial Original schedule
CHOP-14
CHOP-14
CHOP-14
CHOP-14
CHOP-14
CHOP-14
A60 - CHOP-14
A60 - CHOP-14
A60 - CHOP-14
A60 - CHOP-14
Auto
R
CHOP-14
CHOP-14
CHOP-14
CHOP-14
CHOP-14
CHOP-14
A60 - CHOP-14
A60 - CHOP-14
A60 - CHOP-14
A60 - CHOP-14
A60 - CHOP-14
R
18
60 - 65
80
A60 - CHOP-14
A60 - CHOP-14
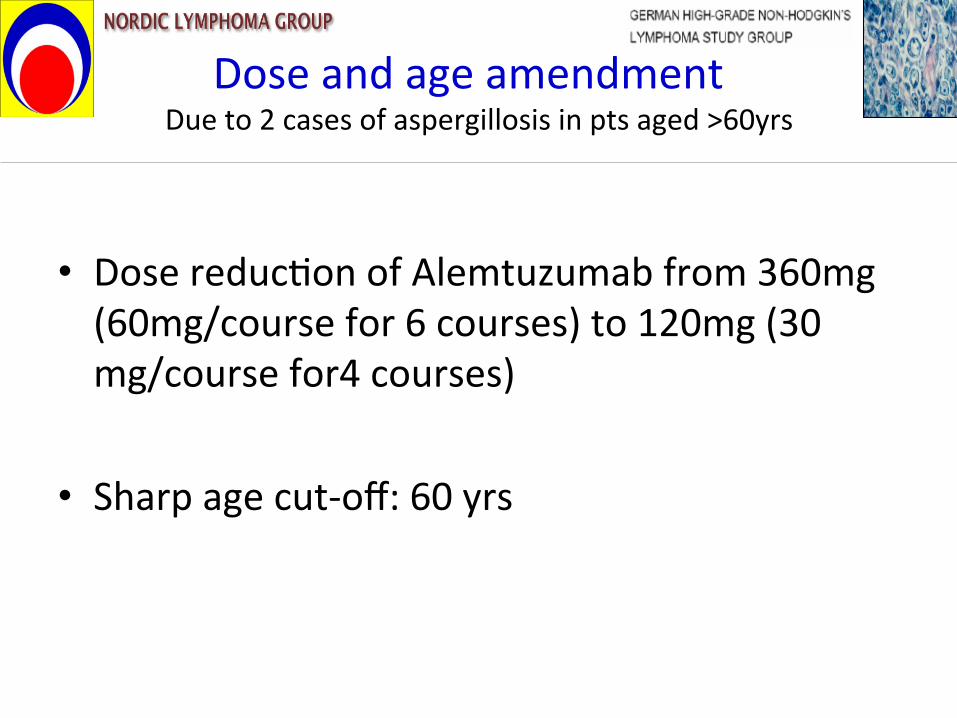
Dose and age amendment Due to 2 cases of aspergillosis in pts aged >60yrs
• Dose reduc1on of Alemtuzumab from 360mg (60mg/course for 6 courses) to 120mg (30 mg/course for4 courses)
• Sharp age cut-‐off: 60 yrs

CHOP-‐14
HDT
The ACT trial AFTER the dose/age amendment
CHOP-‐14
CHOP-‐14
CHOP-‐14
CHOP-‐14
CHOP-‐14
CHOP-‐14
A30 -‐ CHOP-‐14
A30 -‐ CHOP-‐14
A30 -‐ CHOP-‐14
A30 -‐ CHOP-‐14
HDT
R
CHOP-‐14
CHOP-‐14
CHOP-‐14
CHOP-‐14
CHOP-‐14
CHOP-‐14
A30 -‐ CHOP-‐14
A30 -‐ CHOP-‐14
A30 -‐ CHOP-‐14
A30 -‐ CHOP-‐14
CHOP-‐14
R
18 yrs
60 yrs 80 yrs
CHOP-‐14
N=133 N=250
A60
A60
A60
CHOP-‐14 A60
N=117

0
20
40
60
80
100
120
140
Pat
ietn
s in
clud
ed (N
)
Date of dose/age amendment
Cohort Pre-amendment Post-amendment Total
N pts 9 59 68
N evaluable pts 7 56 63
A / B arm 3 / 4 28 / 28 31 / 32
Cut-off date for inclusion in interim analysis
ACT-‐1 Interim analysis cohort
133 pts Patients included (N)
Accrual period

Treatment group
SAE per patient
Before amendment
(n=7)
After amendment
(n=56)
6x CHOP-14 (n=31) 2/ 3 (0.67) 13/ 28 (0.46)
6x CHOP-14 + A (n=32) 13/ 4 (3.25) 24/ 28 (0.86)
Total (n=63) 15/7 (2.43) 37/56 (0.66)
ACT-‐1 SAEs before and ader the ALZ dose amendment
0
0,5
1
1,5
2
2,5
3
3,5
CHOP-‐14 CHOP-‐14+A
Before
After
CTC
(grade ≥3)
% pts 6 x
CHOP-14 6 x
CHOP-14 + A all
Leukocytopenia 24.0 69.0 48.1
Thrombocytopenia 20.0 12.0 15.6
Anemia 19.4 31.2 25.4
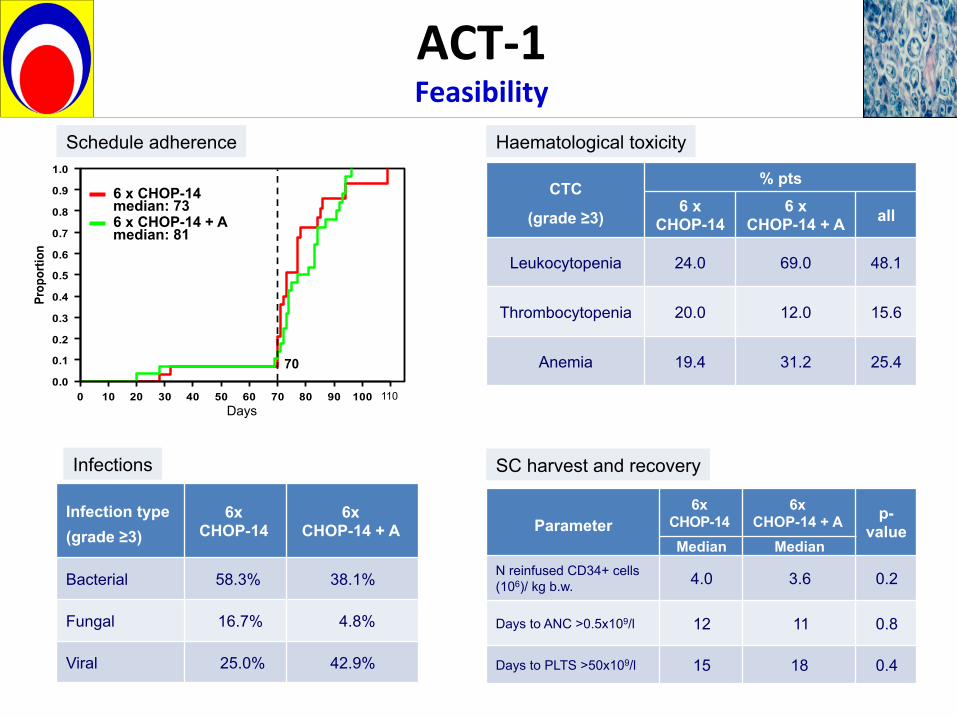
ACT-‐1 Feasibility
Haematological toxicity
Infection type (grade ≥3)
6x CHOP-14
6x CHOP-14 + A
Bacterial 58.3% 38.1%
Fungal 16.7% 4.8%
Viral 25.0% 42.9%
Infections
Parameter 6x
CHOP-14 6x
CHOP-14 + A p-value
Median Median N reinfused CD34+ cells (106)/ kg b.w. 4.0 3.6 0.2
Days to ANC >0.5x10⁹/l 12 11 0.8
Days to PLTS >50x109/l 15 18 0.4
SC harvest and recovery
Days
Proportion
0 10 20 30 40 50 60 70 80 90 1000.0
0.1
0.2
0.3
0.4
0.5
0.6
0.7
0.8
0.9
1.0
6 x CHOP-14 median: 73 6 x CHOP-14 + A median: 81
70
110 Days
Schedule adherence

4 pat. with > 35 days (thrombocytes>50x109/l), 1 pat. with not recovered thrombocytes, 4 unknown values
ACT-1 study Hematopoietic Recovery
Days to ANC > 0.5x10⁹/l
Days to leucocytes > 1x10⁹/l
Days to thrombocytes > 20x109/l Days to thrombocytes > 50x109/l
5
10
15
20
25
30
35
Day
s
without Alemtuzumab with Alemtuzumab
NLG 03.05.12

Time-‐related end-‐points (not arm-‐specific) Response rates
ACT-‐1 Response rates and 1me-‐related end-‐points
Response rates N (%)
ORR 42 (67)
CR/CRu 38 (61)
PR 4 (6)
SD 3 (5)
PD 16 (25)
Not evaluable 2 (3)
Total 63 (100)
Months
Proportion
0 5 10 15 20 25 30 35 40 45 500.0
0.1
0.2
0.3
0.4
0.5
0.6
0.7
0.8
0.9
1.0
EFS
Months
Proportion
0 5 10 15 20 25 30 35 40 45 500.0
0.1
0.2
0.3
0.4
0.5
0.6
0.7
0.8
0.9
1.0
PFS
Primary Secondary
End-‐point 1-‐yr (95% CI)
EFS 55% (42-‐67)
PFS 54% (42-‐67)
OS 78% (67-‐88)
15 mo median follow-‐up
d’Amore et al, ASH 2012 abs #57
Results of the final analysis: July 2015
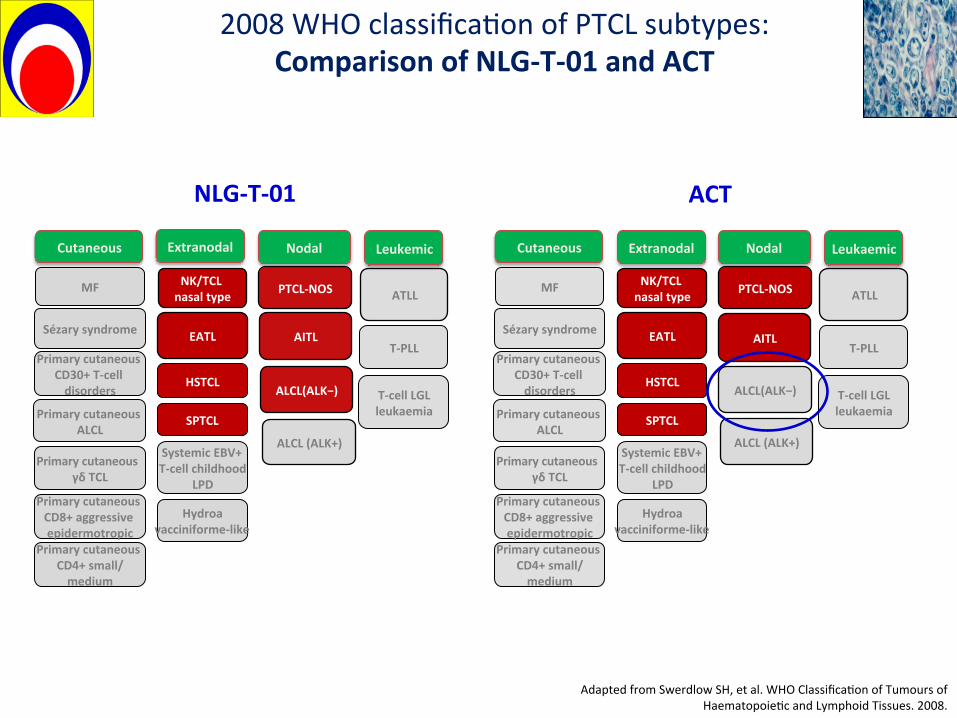
2008 WHO classifica1on of PTCL subtypes: Comparison of NLG-‐T-‐01 and ACT
Adapted from Swerdlow SH, et al. WHO Classifica1on of Tumours of Haematopoie1c and Lymphoid Tissues. 2008.
Cutaneous
Primary cutaneous CD30+ T-‐cell disorders
MF
Extranodal
NK/TCL nasal type ATLL
T-‐cell LGL leukaemia
SPTCL
Leukemic
EATL
HSTCL
T-‐PLL
Primary cutaneous ALCL
Primary cutaneous γδ TCL
Sézary syndrome
PTCL-‐NOS
Nodal
AITL
ALCL (ALK+)
Primary cutaneous CD8+ aggressive epidermotropic
Primary cutaneous CD4+ small/medium
Systemic EBV+ T-‐cell childhood
LPD
Hydroa vacciniforme-‐like
ALCL(ALK−)
NLG-‐T-‐01
Cutaneous
Primary cutaneous CD30+ T-‐cell disorders
MF
Extranodal
NK/TCL nasal type ATLL
T-‐cell LGL leukaemia
SPTCL
Leukaemic
EATL
HSTCL
T-‐PLL
Primary cutaneous ALCL
Primary cutaneous γδ TCL
Sézary syndrome
PTCL-‐NOS
Nodal
AITL
ALCL (ALK+)
Primary cutaneous CD8+ aggressive epidermotropic
Primary cutaneous CD4+ small/medium
Systemic EBV+ T-‐cell childhood
LPD
Hydroa vacciniforme-‐like
ALCL(ALK−)
ACT

ACT-1 vs NLG-T-01
ORR and 1-year PFS/OS
The non arm-‐specific outcome of the ACT-‐1 trial is similar to the one of the NLG-‐T-‐01 trial for both ORR, CR and 1-‐yr PFS and OS
ACT-1 (not arm-specific)
50% CHOP -‐14x6 50% A-‐CHOP-‐14 x6
NLG-T-01 (without ALCL)
CHOEP-‐14 x6 +ASCT
ORR % 67 64
CR-CRu (%) 61 56
1-yr PFS (%) 54.4
(95% CI: 42;67) 57,5
(95% CI: 50; 65)
1-yr OS (%) 77.6
(95% CI: 67;88) 68,3
(95% CI: 61; 75)
+ ASCT
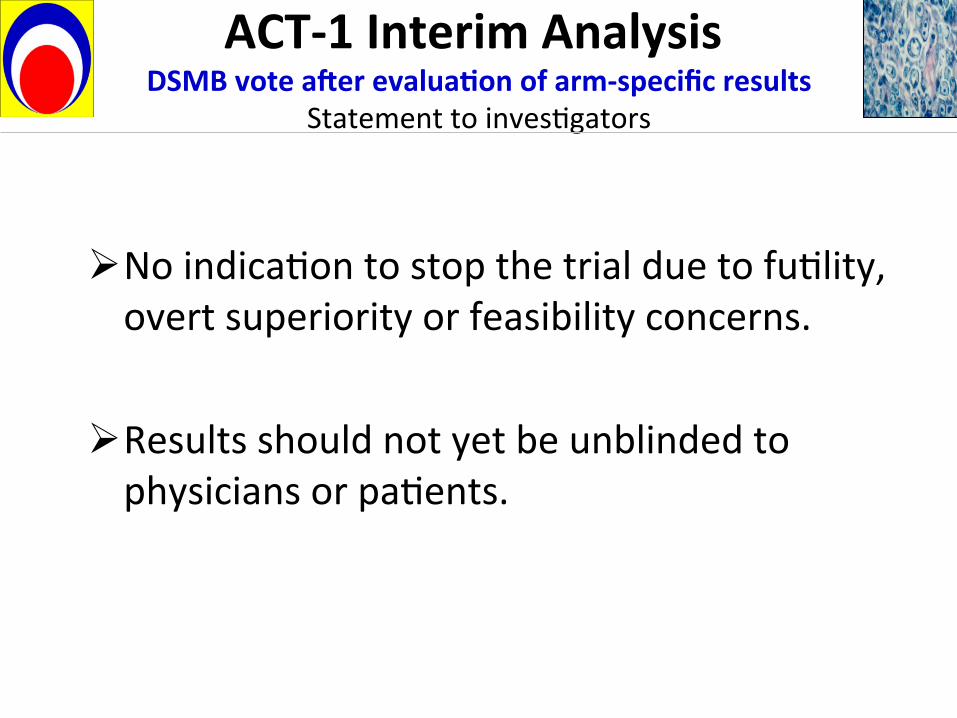
ACT-‐1 Interim Analysis DSMB vote ader evaluaTon of arm-‐specific results
Statement to inves1gators
Ø No indica1on to stop the trial due to fu1lity, overt superiority or feasibility concerns.
Ø Results should not yet be unblinded to physicians or pa1ents.

The ACT trial Final analysis
CHOP-‐14
CHOP-‐14
CHOP-‐14
CHOP-‐14
CHOP-‐14
CHOP-‐14
CHOP-‐14
A30 -‐ CHOP-‐14
A30 -‐ CHOP-‐14
A30 -‐ CHOP-‐14
A30 -‐ CHOP-‐14
CHOP-‐14
R
Auto
CHOP-‐14
CHOP-‐14
CHOP-‐14
CHOP-‐14
CHOP-‐14
CHOP-‐14
A30 -‐ CHOP-‐14
A30 -‐ CHOP-‐14
A30 -‐ CHOP-‐14
A30 -‐ CHOP-‐14
Auto
R
CHOP-‐14
CHOP-‐14
A B C D
Analysis Cohort Parameter CD52 Biology PET
A vs B ACT-‐1 EFS, PFS, OS End-‐points according to CD52 status
Correla1ve biological studies
Correla1ve imaging studies C vs D ACT-‐2 EFS, PFS, OS
A+C vs B+D ACT-‐1+2 ORR

The ACT trial Joined NLG-‐T-‐01/ACT analysis with regard to ASCT
Auto
CHOP-‐14
CHOP-‐14
CHOP-‐14
CHOP-‐14
CHOP-‐14
CHOP-‐14
CHOP-‐14
A30 -‐ CHOP-‐14
A30 -‐ CHOP-‐14
A30 -‐ CHOP-‐14
A30 -‐ CHOP-‐14
Auto
R
CHOP-‐14
CHOP-‐14
CHOP-‐14
CHOP-‐14
CHOP-‐14
CHOP-‐14
A30 -‐ CHOP-‐14
A30 -‐ CHOP-‐14
A30 -‐ CHOP-‐14
A30 -‐ CHOP-‐14
CHOP-‐14
R
CHOP-‐14
CHOP-‐14
”Meta-‐analysis”
Cohort Est. N
NLG-‐T-‐01 61-‐67 yrs (CHOP + HDT) 60-‐70
Std ACT-‐1 50-‐60 yrs (CHOP + HDT)
Std ACT-‐2 61-‐70 yrs (CHOP) 60-‐70
CHO(E)P-‐14
CHO(E)P-‐14
CHO(E)P-‐14
CHO(E)P-‐14
CHO(E)P-‐14
CHO(E)P-‐14
Auto
NLG-T-01 (>60yrs)

PTCL restricted prospecTve trials with > 100 pts
Study Design Cohort size
Accrual status Ref.
1st line treatment
ACT phase 3 250 Closed ASH 2012
NLG-‐T-‐01 phase 2 160 Closed JCO 2012
Relapsed/refractory
NCI/Rmdps phase 2 130 Closed JCO 2012
PROPEL phase 2 109 Closed JCO 2011
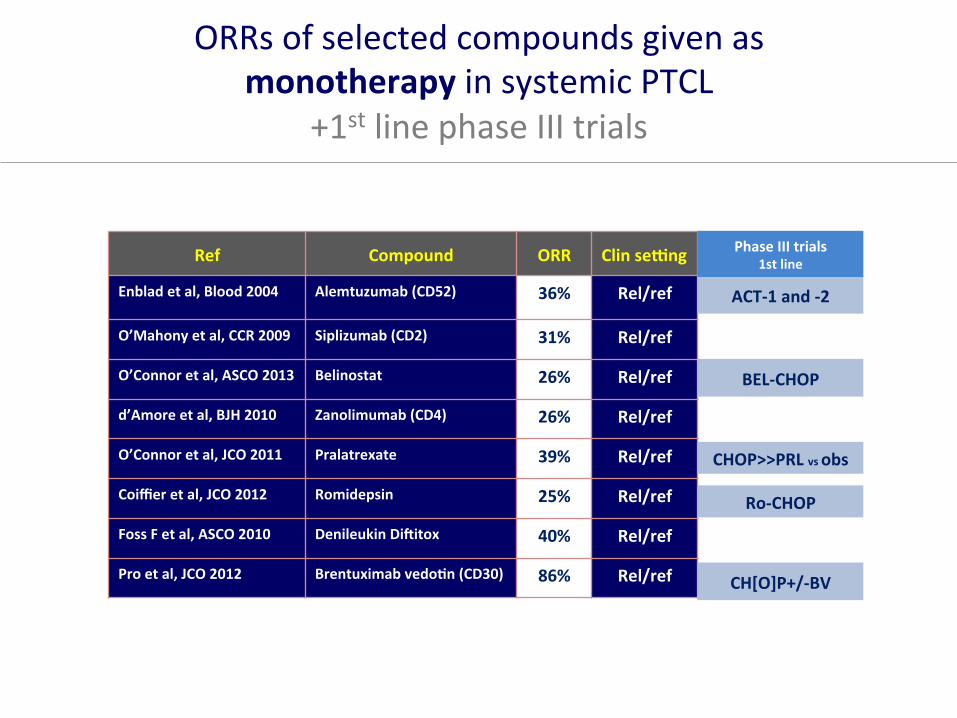
ORRs of selected compounds given as monotherapy in systemic PTCL
+1st line phase III trials
Ref Compound ORR Clin senng
Enblad et al, Blood 2004 Alemtuzumab (CD52) 36% Rel/ref
O’Mahony et al, CCR 2009 Siplizumab (CD2) 31% Rel/ref
O’Connor et al, ASCO 2013 Belinostat 26% Rel/ref
d’Amore et al, BJH 2010 Zanolimumab (CD4) 26% Rel/ref
O’Connor et al, JCO 2011 Pralatrexate 39% Rel/ref
Coiffier et al, JCO 2012 Romidepsin 25% Rel/ref
Foss F et al, ASCO 2010 Denileukin Diditox 40% Rel/ref
Pro et al, JCO 2012 Brentuximab vedoTn (CD30) 86% Rel/ref CH[O]P+/-‐BV
ACT-‐1 and -‐2
Ro-‐CHOP
BEL-‐CHOP
CHOP>>PRL vs obs
Phase III trials 1st line