theearthquakecycleinthesanfranciscobayregion…activetectonics.asu.edu/activefaultingseminar/papers/schwartz_etal... ·...
TRANSCRIPT

The Earthquake Cycle in the San Francisco Bay Region: A.D. 1600–2012
by David P. Schwartz, James J. Lienkaemper, Suzanne Hecker, Keith I. Kelson,Thomas E. Fumal,* John N. Baldwin, Gordon G. Seitz, and Tina M. Niemi
Abstract Stress changes produced by the 1906 San Francisco earthquake had aprofound effect on the seismicity of the San Francisco Bay region (SFBR), dramati-cally reducing it in the twentieth century. Whether the SFBR is still within or hasemerged from this seismic quiescence is an issue of debate with implications for earth-quake mechanics and seismic hazards. Historically, the SFBR has not experienced onecomplete earthquake cycle (i.e., the accumulation of stress, its release primarily ascoseismic slip during surface-faulting earthquakes, its re-accumulation in the intervalfollowing, and its subsequent rerelease). The historical record of earthquake occur-rence in the SFBR appears to be complete at aboutM 5.5 back to 1850 (Bakun, 1999).For large events, the record may be complete back to 1776, which represents abouthalf a cycle. Paleoseismic data provide a more complete view of the most recent pre-1906 SFBR earthquake cycle, extending it back to about 1600. Using these, we havedeveloped estimates of magnitude and seismic moment for alternative sequences ofsurface-faulting paleoearthquakes occurring between 1600 and 1776 on the region’smajor faults. From these we calculate seismic moment and moment release rates fordifferent time intervals between 1600 and 2012. These show the variability in momentrelease and suggest that, in the SFBR regional plate boundary, stress can be released ona single fault in great earthquakes such as that in 1906 and in multiple ruptures dis-tributed on the regional plate boundary fault system on a decadal time scale.
Introduction
The earthquake cycle paradigm (the accumulation ofstress, its release as slip on a fault or a set of faults, andits re-accumulation) has long been of interest to earthquakescientists. It provides a broad framework for developing anunderstanding of repeated behavior of faults and fault sys-tems and has implications for evaluating likely future ruptureoccurrence. Its roots lie in observations such as those ofGilbert (1884) for fault scarps in the Basin and Range andof the 1872 earthquake and surface rupture. In his explana-tion of mountain building, he states “Suddenly, and almostinstantaneously, there is an amount of motion sufficient torelieve the strain, and this is followed by a long period ofquiet, during which the strain is gradually reimposed.” Thisprescient interpretation of Earth behavior reached earlymaturation with the Reid (1910) formalization of elastic re-bound following geologic and geodetic observations made ofthe 1906 M 7.9 San Francisco, California, earthquake. Theconcept of the earthquake cycle has been applied to earth-quake recurrence on individual faults, as well as to an assem-blage of faults in a region. Interpretations of regional cyclesare primarily based on historical seismicity catalogs, fromwhich it has been suggested that an earthquake sequence,
which is initiated by the occurrence of a great earthquake,is followed first by a reduction in the rate of regional seis-micity and then by the acceleration of regional moment re-lease preceding the next large or great event (Ellsworth et al.,1981; Sykes and Jaume, 1990; Bakun, 1999; Bowman andKing, 2001; Bebbington et al., 2010). This perspective on theearthquake cycle is extremely important but has temporallimitations in that full cycles, at least in regions of shallowcontinental crust, have rarely, if ever, been documented. Inmost seismically active areas, many of the principal faultshave not failed historically, let alone repeatedly. In this paper,we present a longer-term view of the earthquake cycle for theSan Francisco Bay region (SFBR) by expanding the earth-quake timeline back to approximately A.D. 1600 (hereafterall dates are A.D.) through the dating of paleoearthquakes onthe region’s major faults.
The SFBR is defined as the area within the rectangle inFigure 1 following the regional seismicity analysis of Bakun(1999) and usage adopted by the Working Group onCalifornia Earthquake Probabilities (WGCEP, 1999, 2003,2008). The SFBR is within the boundary between the Pacificand North American plates. Plate boundary slip is accommo-dated by the coseismic offset, and to a lesser extent bycreep, along the region’s principal faults: the San Andreas,*Deceased (2010).
BSSA Early Edition / 1
Bulletin of the Seismological Society of America, Vol. 104, No. 3, pp. –, June 2014, doi: 10.1785/0120120322

San Gregorio, Calaveras, Hayward–Rodgers Creek, Green-ville, and Concord–Green Valley faults (Fig. 1, Table 1). TheSFBR is a natural laboratory to assess earthquake cycles on aregional scale because (a) the distribution of the plate boun-dary strike-slip faults that release essentially all of the accu-mulated seismic moment from plate motions is well known;(b) short- and long-term plate rates have been geologicallyand geodetically measured; (c) there is information on thehistorical seismic record back to the early–mid 1800s; and(d) a paleoearthquake chronology is emerging that permitsextension of the timeline of large earthquakes to precedethe historical record.
The tectonic loading or slip rate across the SFBR fromplate motions appears generally constant, within uncertain-ties, over widely varying intervals of time. The budget be-tween what goes into the system as stress and what comesout as earthquakes is an important element of the earthquakecycle. On a long-term basis, slip from the Nuvel 1A plate
model averages 41� 4 mm=yr for the past four million years(DeMets et al., 1994). Geologic slip rates for the past severalhundred to several thousand years obtained from SFBR faultsgive a rate of 36–43 mm=yr when summed across the region(WGCEP, 2003). The short-term geodetic rate derived frommeasurements made from 1993 to 2003 is 37� 0:6 mm=yr(d’Alessio et al., 2005). Although the similarity in rates overthese three very different timescales could be fortuitous, it islikely that given the overall size of the fault system that passesthrough the region, the tectonic stressing rate has been essen-tially constant for the time interval of interest in our analysis.
Historically, the SFBR has not experienced a completeearthquake cycle, which classically has been considered asthe interval between repeats of the great 1906 rupture ofthe San Andreas fault (Ellsworth et al., 1981). The recordof earthquakes of M ≥5:5 appears to be complete back to1850 (Bakun, 1999), which is only part of a cycle. Toppozadaand Borchardt (1998) suggest that for large events (M ∼ 7),the record is complete to 1776, which is the beginning of con-struction of Spanish Missions in the SFBR. From 1776through the present, surface rupture may have occurred alonga section of the SanAndreas fault in 1838 (AppendixA); how-ever, only the southern Hayward (HS) fault in 1868 and thefull northern San Andreas fault in 1906 can be definitivelyidentified as having produced large surface ruptures.
Paleoseismic observations provide information on thetiming of surface-faulting earthquakes prior to, and in somecases during the early part of, the historical record. These formthe core of our analysis. Because of uncertainties inherent indating paleoearthquakes, alternative surface-rupture sequen-ces are developed for the major faults for the 1600–1776interval and for the shorter 1690–1776 interval. For eachpaleorupture in these models, we estimate the magnitudeand seismic moment of the associated paleoearthquakebased on (with minor modifications) the seismic source
Figure 1. Map of principal plate boundary faults in the SanFrancisco Bay region (SFBR) and northern California. The rectangleencloses the area defined as the SFBR, which was developed by Ba-kun (1999) for his analysis of historical seismicity and used by theWGCEP (1999, 2003, 2008) to evaluate SFBR earthquake probabil-ities. Arrows indicate relative direction of plate movement. Faultsegmentation is fromWGCEP (2003), with addition of the San JuanBautista (SJB) segment in the present analysis. Segment acronymsand associated segment names are listed in Table 1. MTJ, Mendo-cino triple junction; PA, Point Arena; and GG, Golden Gate.
Table 1List of San Francisco Bay Region (SFBR) Faults and
Fault Segments
Fault/Segment Acronyms*
San Andreas Offshore SAOSan Andreas North Coast SANSan Andreas Peninsula SAPSan Andreas Santa Cruz Mountains SASSan Andreas San Juan Bautista SJBSan Gregorio SGRodgers Creek RCHayward North HNHayward South HSCalaveras North CNCalaveras Central CCCalaveras South CSConcord–Green Valley CGVMount Diablo MTDGreenville GR
*Fault and fault segment acronyms are used in figures and intables. Segments are shown in Figure 1.
2 D. P. Schwartz, J. J. Lienkaemper, S. Hecker, K. I. Kelson, T. E. Fumal, J. N. Baldwin, G. G. Seitz, and T. M. Niemi
BSSA Early Edition

characterization developed by the WGCEP (2003). The re-sulting paleoseismic record and the historical seismic recordare used to develop two models of the earthquake cycle interms of seismic moment release during different intervalsof time in the 412-year period from 1600 to 2012. One modelis based solely on the occurrence of paleoseismic and histori-cal surface ruptures. The other combines thesewith the occur-rence of historical M ≤5�M ≥5:5 earthquakes (Bakun,1999). Seismic moment release in the SFBR is then discussedin the context of the earthquake cycle, showing that it occurs inmultiple modes. Finally, the implications of our interpreta-tions for seismic hazard in the SFBR are presented.
Expanding the SFBR Earthquake Catalog
Key Timelines
There are three key timelines that provide informationon the occurrence of SFBR earthquakes. These are (1) thehistorical record of moderate magnitude events, (2) the his-torical record of large magnitude earthquakes, and (3) thepaleoseismic record of surface-faulting earthquakes.
Bakun (1999) is the primary source of information onhistorical Bay Area seismicity, including estimates of seismicmoment release prior to and following the 1906 earthquake.In analyzing available information on shaking intensity, hedeveloped a catalog of SFBR earthquakes that extends backto 1836. It includes preinstrumental magnitude estimates us-ing modified Mercalli intensity values to produce an inten-sity magnitude (MI) that is calibrated to moment magnitude(Bakun and Wentworth, 1997). Bakun (1999) considers theearthquake record complete for M ≥5:5 back to 1850. Henotes that little is known about SFBR seismicity prior to thatdate, although he lists four earthquakes, three with estimatedmagnitudes of 6.0–6.5 and the fourth and largest (the 1838M 6.8 earthquake) between 1836 and 1850 (Bakun, 1999, histable 2). Prior to 1836, Townley and Allen (1939) report atleast seven felt earthquakes in the SFBR between October1800 and September 1829. From May 1851 through April1903, Bakun (1999) lists 55 earthquakes in the 4.6–6.4 mag-nitude range. Of these, 44 are estimated to have beenM ≥5:5. The magnitudes noted here are mean values fromthe analysis of Bakun (1999), and the uncertainties can belarge. It is difficult to identify the sources of most of the pre-instrumental seismicity. Wesson et al. (2003) applied Baye-sian inference to associate the preinstrumental earthquakeswith specific faults. They conclude that while reasonableprobabilities of an association can be made for some of thelarger earthquakes, the sources of most of the events in theBakun (1999) catalog are uncertain.
In their overview of the effects of pre-1900 earthquakesthroughout California, Toppozada et al. (1981) conclude thatby 1800 the record of earthquakes within 100 km of the coastbetween San Diego and Sonoma is probably complete forearthquakes of M ∼ 7 or larger. The founding of the MissionDolores and the Presidio in San Francisco in 1776 provides an
important point in time for evaluating the occurrence of largeSFBR earthquakes. Mission Dolores was the first of six Fran-ciscan missions constructed along the length of the Bay Areabetween San Juan Bautista (1797) and Sonoma (1827). Themissions are known to have kept records of felt earthquakesand earthquake damage. In their research and review of the1836 and 1838 earthquakes, Toppozada and Borchardt (1998)found no historical evidence of the occurrence of any largeSFBR earthquakes between the founding of the Mission Do-lores and 1838. The earliest earthquakes listed for the SFBR(Townley and Allen, 1939) occurred 11 October through 31October 1800. They were felt in San Juan Bautista (sometimessix in a day), buildings were damaged, and ground crackswere reported near rivers. Therefore, 1776 has become the ac-cepted date for the beginning of the historical period for large(M ∼ 7 or larger) earthquakes in the SFBR and has been usedin a series of studies (i.e., Hecker et al., 2005; Hall and Niemi,2008; Kelson et al., 2008) to trim radiocarbon probability den-sity functions (PDFs) in dating models of recent SFBR pale-oearthquakes. There is probably some softness in this date,for although the Mission Dolores was founded in 1776, con-struction of the permanent mission building was started in1782 and completed in 1791. Acknowledging this caveat,we continue to use 1776 as the beginning of the historicalperiod for large earthquakes and a cap for radiocarbon datingof post-1600 paleoearthquakes.
Prior to the historical record, the basis for the occurrenceand timing of large (surface faulting) Bay Area earthquakesis paleoseismology. The length of the record and its com-pleteness vary for each fault. However, the timing of themost recent surface rupture is available for the principalfaults that have not broken historically (Rodgers Creek,northern section of the Hayward, northern Calaveras, SanGregorio, Concord–Green Valley). Dates of the penultimaterupture also have been developed at locations along the 1906rupture trace of the San Andreas fault and on the 1868 Hay-ward fault rupture. There are no paleoearthquake dates forthe Greenville fault, the Mt. Diablo blind thrust, or thenorthern extension of the Concord–Green Valley fault. Withthe exceptions noted here, the overall paleoseismic recordappears to be complete back to about 1600. It is on this basisthat we start our regional clock at this date.
Surface-Faulting Earthquakes since 1600
Dating the Recent Surface Ruptures
Fault ruptures that produce large moment-releasingearthquakes typically leave their signature at the surface. Thisis recorded in the stratigraphy exposed in trenches excavatedacross the faults. Paleoearthquake dates for the SFBR pri-marily rely on the use of radiocarbon dating, with the mostcommonly available organic material being detrital charcoal.A single sample provides a mean age of the sample and acounting uncertainty. This, in turn, is dendrochronologicallycalendar corrected to provide the full possible age range of the
The Earthquake Cycle in the San Francisco Bay Region: A.D. 1600–2012 3
BSSA Early Edition
sample, which is represented by a PDF. The ideal field situa-tion is the occurrence of datable deposits immediately belowand above a rupture event horizon, but even here the uncer-tainties in the age ranges of these units can be broad. By usingradiocarbon PDFs for each horizon, the probability distribu-tion can be trimmed and reweighted using a radiocarbon cal-ibration program such as OxCal (Bronk Ramsey, 2001, 2007;Lienkaemper and Bronk Ramsey, 2009). The result, gener-ally, is a tighter distribution from which a mean date of theevent and 1σ and 2σ uncertainty ranges can be extracted.For radiocarbon samples formed in the seventeenth and eigh-teenth centuries, the age-range probabilities can extend wellinto the nineteenth and/or twentieth centuries. This is a poten-tial problem for estimating the ages of the relatively recentpaleoearthquakes considered here, particularly where a rup-ture offsets a dated horizon and there is no unfaulted overlyingdeposit or the postevent deposit is not datable. For this reason,the historical record provides a major time constraint thatallows radiocarbon PDFs to be truncated at 1776.
In addition to radiocarbon, the presence or absence ofnon-native pollen (Mensing and Byrne, 1998; Reidy, 2001)has provided a basis for event dating at some locations. Ofparticular importance is non-native Erodium pollen, whichfirst appeared in the SFBR about 1770 and was ubiquitousin the region by 1800. The presence or absence of this pollenin critical deposits plays an important role in dating SFBR
paleoearthquakes that occurred between the mid–late 1700sand early–middle 1800s.
Timing of Paleoearthquakes
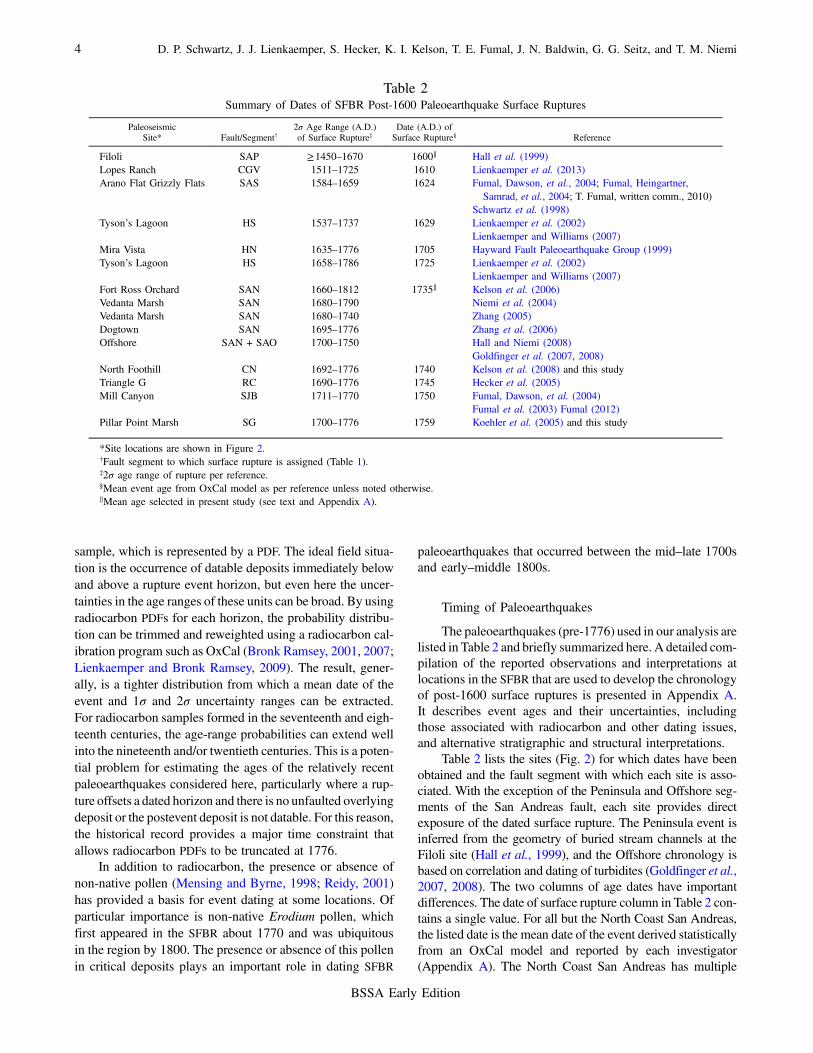
The paleoearthquakes (pre-1776) used in our analysis arelisted in Table 2 and briefly summarized here. A detailed com-pilation of the reported observations and interpretations atlocations in the SFBR that are used to develop the chronologyof post-1600 surface ruptures is presented in Appendix A.It describes event ages and their uncertainties, includingthose associated with radiocarbon and other dating issues,and alternative stratigraphic and structural interpretations.
Table 2 lists the sites (Fig. 2) for which dates have beenobtained and the fault segment with which each site is asso-ciated. With the exception of the Peninsula and Offshore seg-ments of the San Andreas fault, each site provides directexposure of the dated surface rupture. The Peninsula event isinferred from the geometry of buried stream channels at theFiloli site (Hall et al., 1999), and the Offshore chronology isbased on correlation and dating of turbidites (Goldfinger et al.,2007, 2008). The two columns of age dates have importantdifferences. The date of surface rupture column in Table 2 con-tains a single value. For all but the North Coast San Andreas,the listed date is the mean date of the event derived statisticallyfrom an OxCal model and reported by each investigator(Appendix A). The North Coast San Andreas has multiple
Table 2Summary of Dates of SFBR Post-1600 Paleoearthquake Surface Ruptures
PaleoseismicSite* Fault/Segment†
2σ Age Range (A.D.)of Surface Rupture‡
Date (A.D.) ofSurface Rupture§ Reference
Filoli SAP ≥1450–1670 1600‖ Hall et al. (1999)Lopes Ranch CGV 1511–1725 1610 Lienkaemper et al. (2013)Arano Flat Grizzly Flats SAS 1584–1659 1624 Fumal, Dawson, et al., 2004; Fumal, Heingartner,
Samrad, et al., 2004; T. Fumal, written comm., 2010)Schwartz et al. (1998)
Tyson’s Lagoon HS 1537–1737 1629 Lienkaemper et al. (2002)Lienkaemper and Williams (2007)
Mira Vista HN 1635–1776 1705 Hayward Fault Paleoearthquake Group (1999)Tyson’s Lagoon HS 1658–1786 1725 Lienkaemper et al. (2002)
Lienkaemper and Williams (2007)Fort Ross OrchardVedanta MarshVedanta MarshDogtownOffshore
SANSANSANSAN
SAN + SAO
1660–18121680–17901680–17401695–17761700–1750
1735‖ Kelson et al. (2006)Niemi et al. (2004)Zhang (2005)Zhang et al. (2006)Hall and Niemi (2008)Goldfinger et al. (2007, 2008)
North Foothill CN 1692–1776 1740 Kelson et al. (2008) and this studyTriangle G RC 1690–1776 1745 Hecker et al. (2005)Mill Canyon SJB 1711–1770 1750 Fumal, Dawson, et al. (2004)
Fumal et al. (2003) Fumal (2012)Pillar Point Marsh SG 1700–1776 1759 Koehler et al. (2005) and this study
*Site locations are shown in Figure 2.†Fault segment to which surface rupture is assigned (Table 1).‡2σ age range of rupture per reference.§Mean event age from OxCal model as per reference unless noted otherwise.‖Mean age selected in present study (see text and Appendix A).
4 D. P. Schwartz, J. J. Lienkaemper, S. Hecker, K. I. Kelson, T. E. Fumal, J. N. Baldwin, G. G. Seitz, and T. M. Niemi
BSSA Early Edition
penultimate event dates from both land and offshore sites, andwe have arbitrarily set the event date at the midpoint of the 2σage ranges. The mean dates are regarded as the placeholdersfor each event and are used in the figures and tables that fol-low. Although they may reasonably approximate the actualdate of each rupture, they are free to be moved about within
the more robustly constraining 2σ age range. The 2σ age rangeof surface rupture column in Table 2 lists the OxCal-derivedage range for each. The event must postdate the oldest date inthe range. The upper bound of this range is derived either di-rectly from the dating or from the historical constraints dis-cussed previously in this paper.
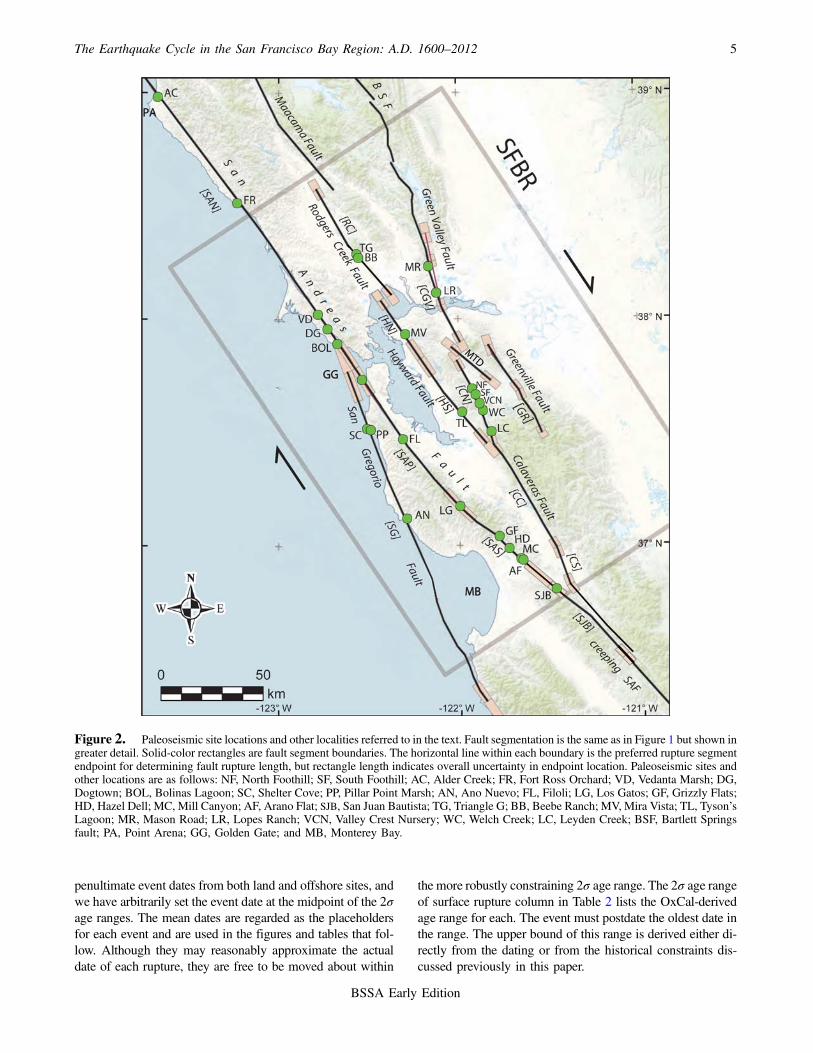
Figure 2. Paleoseismic site locations and other localities referred to in the text. Fault segmentation is the same as in Figure 1 but shown ingreater detail. Solid-color rectangles are fault segment boundaries. The horizontal line within each boundary is the preferred rupture segmentendpoint for determining fault rupture length, but rectangle length indicates overall uncertainty in endpoint location. Paleoseismic sites andother locations are as follows: NF, North Foothill; SF, South Foothill; AC, Alder Creek; FR, Fort Ross Orchard; VD, Vedanta Marsh; DG,Dogtown; BOL, Bolinas Lagoon; SC, Shelter Cove; PP, Pillar Point Marsh; AN, Ano Nuevo; FL, Filoli; LG, Los Gatos; GF, Grizzly Flats;HD, Hazel Dell; MC, Mill Canyon; AF, Arano Flat; SJB, San Juan Bautista; TG, Triangle G; BB, Beebe Ranch; MV, Mira Vista; TL, Tyson’sLagoon; MR, Mason Road; LR, Lopes Ranch; VCN, Valley Crest Nursery; WC, Welch Creek; LC, Leyden Creek; BSF, Bartlett Springsfault; PA, Point Arena; GG, Golden Gate; and MB, Monterey Bay.
The Earthquake Cycle in the San Francisco Bay Region: A.D. 1600–2012 5
BSSA Early Edition

Between 1635 and the founding of the Mission Dolores(1776), ruptures occurred on the Hayward fault (north andsouth segments), San Andreas fault (North Coast and likelyOffshore, and the San Juan Bautista segment), northernCalaveras fault, Rodgers Creek fault, and San Gregorio fault.It is likely that these were post-1658 if the northern andsouthern Hayward segments failed together, and they may haveall occurred after 1690. Prior to 1635, we list ruptures on theHayward (south), San Andreas (Santa Cruz mountains andPeninsula segments), and Concord–Green Valley faults. Withinthe 2σ uncertainty, the true age of each event could predate1600, although their mean dates place them in the early1600s. Also listed is a San Andreas Peninsula event, for whichoccurrence is permissive although poorly constrained (Ap-pendix A).
Multiple Segment Ruptures
Examination of the 2σ age ranges shows the timing ofthe most recent event at the Triangle G site on the RodgersCreek fault overlaps the timing of the most recent event at theMira Vista site on the northern Hayward fault and the penul-timate event on the southern Hayward at Tyson’s Lagoon.This allows the possibility that both faults, or sections of bothfaults, could have ruptured together. Alternative rupture sce-narios for the Hayward and Rodgers Creek faults have beenpreviously described (WGCEP, 2003; Hecker et al., 2005)and incorporated into the estimates of SFBR earthquake prob-ability (WGCEP, 2003, 2008).
The dates of the penultimate rupture on the North CoastSan Andreas segment (from multiple sites) and theSan Gregorio fault at Pillar Point Marsh overlap (Table 2). Theintersection geometry of these faults is similar to that of theintersection of the Denali and Totschunda faults in Alaska(Schwartz et al., 2012), where the 2002 rupture of the Mw 7.9Denali fault earthquake propagated from the central Denalifault onto the Totschunda fault (Haeussler et al., 2004).Schwartz et al. (2012) entertain the possibility that the San An-dreas and San Gregorio faults ruptured together. Based onthe combination of intersection geometry and paleoearthquakedates, we include a scenario in which the North Coast San An-dreas and San Gregorio faults failed together in the post-1600 period. Goldfinger et al. (2007, 2008) interpret thedistribution of turbidites offshore of the northern San Andreasfault as evidence of rupture between theMendocino triple junc-tion and the Golden Gate, which would include the NorthCoast and Offshore segments of the San Andreas (Fig. 1).In this case, a combined rupture of the San Andreas andSan Gregorio faults is a multifault rupture scenario that is com-parable in length to that of 1906. The uncertainty associatedwith the occurrence of a mid-1600s Peninsula segment rupturehas been noted. Even so, we allow the possibility that if it oc-curred, it could have failed along with the Santa Cruz moun-tains segment. These alternative rupture scenarios are used inthe construction of the alternative SFBR paleoearthquake se-quences (Figs. 3 and 4, Table 3).
Magnitudes of Post-1600 Earthquakes
The observations at each SFBR paleoseismic site show thata fault ruptured the surface at some datable time in the past.The question is, what magnitude earthquakes do these rupturesrepresent? Estimating the magnitude of paleoearthquakes is achallenge, but there are types of observations and analysis fromwhich estimates can be developed. These include (1) theamount of coseismic surface offset associated with a paleorup-ture, measured directly from offset channels exposed in fault-parallel trenches (for strike-slip faults) or from associated geo-morphic features, and the amount of average slip calculatedfrom a fault slip rate and recurrence interval (RI) and (2) the useof scaling relations between magnitude and static fault param-eters such as fault area. Through a series of field observationsand statistical relations, we show that the post-1600 paleoearth-quake ruptures described from the SFBR trenches are indicativeof large slip per event (Appendix B) and that we can make rea-sonable estimates of the magnitude they represent.
Observed Paleo Offsets
The inventory of measured coseismic surface offsets forboth paleoruptures and historical ruptures on SFBR faults issmall, with only a limited number of post-1600 measure-ments (Table 4, Appendix B). These have been made on thenorthern San Andreas at Alder Creek, the San Gregorio faultat Seal Cove, the Rodgers Creek fault at the Beebe Ranchand Triangle G sites, and the Hayward fault at Tyson’sLagoon (Fig. 2). A geodetic estimate of average slip has beenmodeled for the 1868 Hayward fault rupture (Yu and Segall,1996); although not paleoseismic, it is the single estimate ofright lateral coseismic offset along the fault.
For long surface ruptures, the amount of slip typicallyvaries along strike. With only one or at most a couple ofmeasurements along a fault, the question is open as to whetherthe observed offset represents the average or a value muchgreater or less than the average. The maximum slip is gener-ally limited to a short section of a rupture (see reviews of faultslip distributions by Hemphill-Haley andWeldon, 1999; Man-ighetti et al., 2005; Wesnousky, 2008; Hecker et al., 2010),and the likelihood of having sampled it at one of the SFBRpaleoseismic localities is small. Similarly, the minimum slipgenerally occurs at the ends of a rupture, and the offset loca-tions listed in Table 4 are not close to fault segment endpoints(Fig. 2). Hemphill-Haley and Weldon (1999) look at the re-lation between the number of sampling sites and the slip dis-tribution for surface ruptures. They conclude the mean slip fora small number of measurement locations overestimates theactual mean for an entire rupture by 10%–20%, which is asmall difference. We suggest the SFBR field measurementsare more likely to approach average slip values for the respec-tive paleoearthquakes. Note from Table 4 that the paleoseismi-cally and/or historically measured slip at a point is, within afactor of two, the amount of average slip per event calculatedfrom slip rate and recurrence interval.
6 D. P. Schwartz, J. J. Lienkaemper, S. Hecker, K. I. Kelson, T. E. Fumal, J. N. Baldwin, G. G. Seitz, and T. M. Niemi
BSSA Early Edition
8
7.5
7
6.5
6
5.5
18
40
18
80
19
20
19
60
20
00
16
80
17
20
17
60
18
00
16
00
16
40
Ma
gn
itud
e
Mw
Paleoseismic Record Historical Record
HS
SG
SAP
HSSAP(?)
SA
LP
1906
198918681838
SANSAO++
CNCGV
SJB
+HSHN+RC
SAS+
(a)
MD
P
8
7.5
7
6.5
6
5.5
18
40
18
80
19
20
19
60
20
00
16
80
17
20
17
60
18
00
16
00
16
40
Ma
gn
itud
e
Mw
Paleoseismic Record Historical Record
HS
SAS HSSAP(?)
SA
LP
1906
198918681838
SAN
CGV
RCSAP
SG
SJBHNHS CN
(b)
8
7.5
7
6.5
6
5.5
18
40
18
80
19
20
19
60
20
00
16
80
17
20
17
60
18
00
16
00
16
40
Ma
gn
itud
e
Mw
Paleoseismic Record Historical Record
HSSAP(?)
SA
LP
1906
198918681838
HS
SAS
SAN
CGV
SJB
HS
SG
+
+SAO
RCHN
CN
(c)
MD
PM
DP
Year (A.D.)
Year (A.D.)
Year (A.D.)
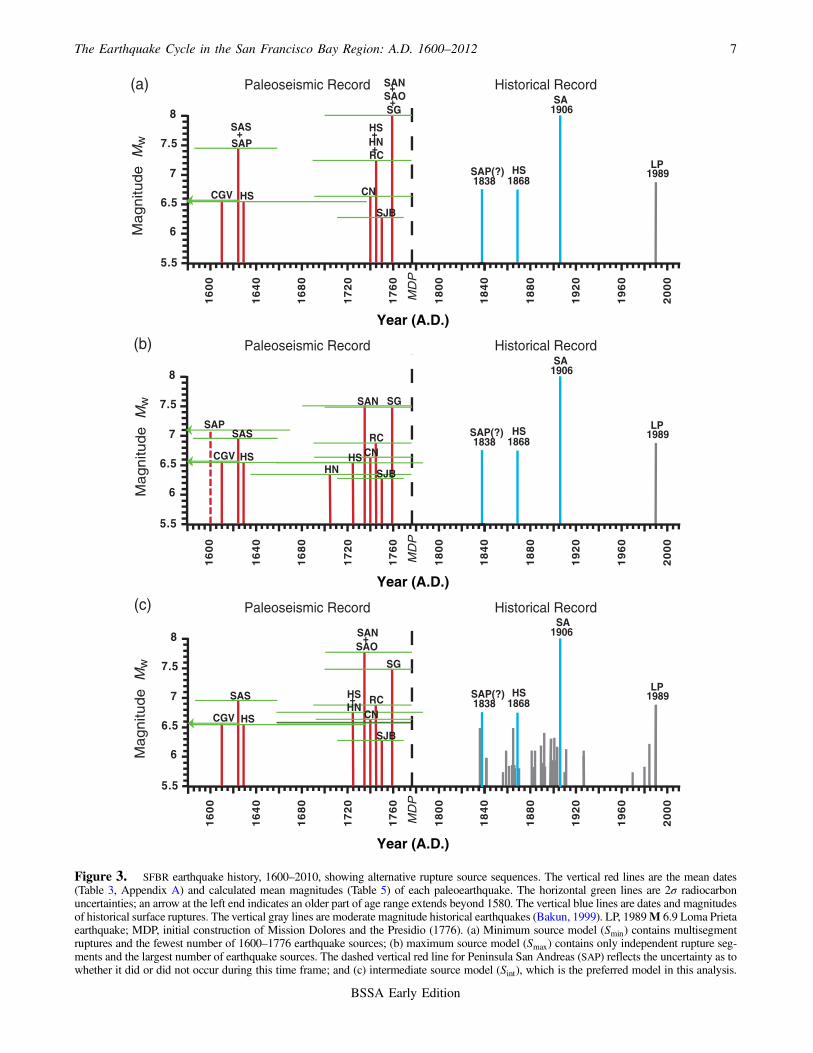
Figure 3. SFBR earthquake history, 1600–2010, showing alternative rupture source sequences. The vertical red lines are the mean dates(Table 3, Appendix A) and calculated mean magnitudes (Table 5) of each paleoearthquake. The horizontal green lines are 2σ radiocarbonuncertainties; an arrow at the left end indicates an older part of age range extends beyond 1580. The vertical blue lines are dates and magnitudesof historical surface ruptures. The vertical gray lines are moderate magnitude historical earthquakes (Bakun, 1999). LP, 1989M 6.9 Loma Prietaearthquake; MDP, initial construction of Mission Dolores and the Presidio (1776). (a) Minimum source model (Smin) contains multisegmentruptures and the fewest number of 1600–1776 earthquake sources; (b) maximum source model (Smax) contains only independent rupture seg-ments and the largest number of earthquake sources. The dashed vertical red line for Peninsula San Andreas (SAP) reflects the uncertainty as towhether it did or did not occur during this time frame; and (c) intermediate source model (Sint), which is the preferred model in this analysis.
The Earthquake Cycle in the San Francisco Bay Region: A.D. 1600–2012 7
BSSA Early Edition
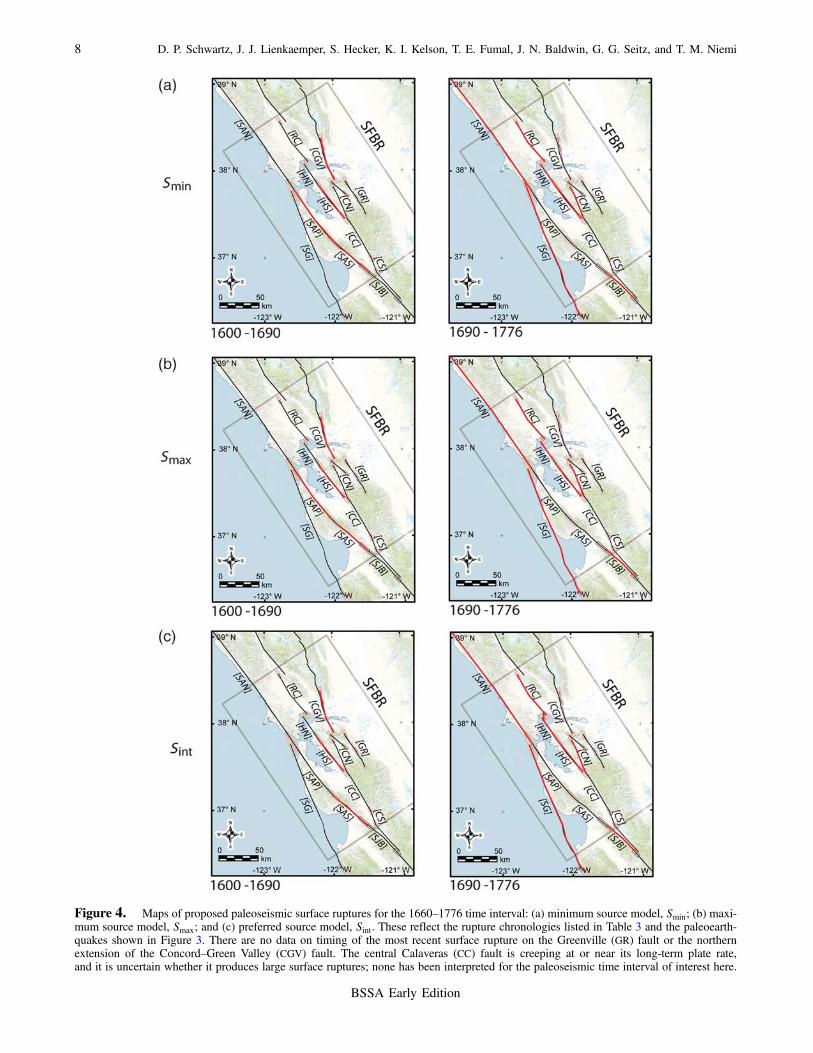
Figure 4. Maps of proposed paleoseismic surface ruptures for the 1660–1776 time interval: (a) minimum source model, Smin; (b) maxi-mum source model, Smax; and (c) preferred source model, Sint. These reflect the rupture chronologies listed in Table 3 and the paleoearth-quakes shown in Figure 3. There are no data on timing of the most recent surface rupture on the Greenville (GR) fault or the northernextension of the Concord–Green Valley (CGV) fault. The central Calaveras (CC) fault is creeping at or near its long-term plate rate,and it is uncertain whether it produces large surface ruptures; none has been interpreted for the paleoseismic time interval of interest here.
8 D. P. Schwartz, J. J. Lienkaemper, S. Hecker, K. I. Kelson, T. E. Fumal, J. N. Baldwin, G. G. Seitz, and T. M. Niemi
BSSA Early Edition

Average Slip from Slip Rate and Recurrence Interval
Slip rates for SFBR faults listed in Table 4were developedby theWGCEP (2003) as consensus rates. They are primarilybased on geologic offsets and represent rates averaged overseveral hundred to several thousand years. Creep rates playamajor role in estimating the slip rate for the central Calaverasfault and to a lesser degree the slip rates on the Concord–Green Valley and Hayward faults. d’Alessio et al. (2005)developed slip rates from a geodetic block model for theSFBR. These are in general agreement with the geologic ratesonTable4, although thepreferredgeodetic rates (d’Alessioetal.,2005) are somewhat higher for theGreenville fault (5:6 mm=yr)and Concord–Green Valley fault (6:7–7 mm=yr) and lower forthe San Gregorio fault (2:5 mm=yr). Recurrence interval esti-mates listed in Table 4 are (a) calculated from the SFBR faultmodel by WGCEP (2003, their table 4.9) and (b) a subset ofSFBR faults for which there is paleoseismic information (appen-dix B of WGCEP, 2008). Table 4 lists these geologic slip ratesand recurrence intervals, aswell as the slip per event thatwehavecalculated from these parameters. The average slip per eventanywhere along the SFBR fault system is larger than 1 m.
Wells and Coppersmith (1994) developed a series of re-gressions relating moment magnitude to a range of faultparameters. One of these is the relation between average dis-placement and magnitude:
M � a� b × log�AD�; �1�
in which a and b are coefficients and AD is the average dis-placement. For strike-slip faults, the value of a is 7.04(�0:05) and b is 0.89 (�0:09). Using the calculated meanaverage slip per event (Table 3) and the Wells and Copper-smith (1994) regression, the minimum calculated meanmoment magnitude for the fault system is M 7, which is on
the Concord–Green Valley fault. Although this indicates thatthe paleoearthquakes we are concerned with are large, themagnitude developed using only average slip lacks the pre-cision we require and, at least for the creeping faults, likelyoverestimates it.
Magnitude Estimates from Fault Area
To estimate the magnitudes of paleoearthquakes in the1600–1776 interval, we use the relation between fault areaand moment magnitude, which requires information on faultrupture length and width. We rely heavily on the WGCEP(2003) model of the SFBR fault system that includes esti-mates of fault rupture lengths, down-dip fault widths, and theeffects of creep on earthquake magnitude. (See Data andResources for online access to the full WGCEP, 2003,report, or to specific chapters of the report; chapter 3,Characterization the SFBR Rupture Sources, provides detailsof the SFBR fault segmentation modeling, and chapter 4, TheSFBR Earthquake Source Model: Magnitudes and Long-Term Rates, addresses the model itself.)
The basic building blocks for modeling SFBR faultruptures are fault segments. These are faults or sections offaults that are considered capable of failing independentlyto produce an earthquake (e.g., the 1868 rupture of thesouthern part of Hayward fault) or that can join in multiseg-ment ruptures, such as occurred in 1906. The fault segmentsand the boundary zones between segments are shown inFigures 1 and 2. These are derived from behavioral andkinematic observations. The behavioral considerations pro-vide the strongest basis for segmentation, with the differencein timing of events on adjacent parts of a fault, either frompaleoseismic observations or from the extent of historicalsurface rupture, being primary. For example, the estimatedextent of the 1868 Hayward rupture (Yu and Segall, 1996)
Table 3SFBR Rupture Source Sequences
Minimum RuptureSource (Smin)* Event Age†
Maximum RuptureSource (Smax)* Event Age†
Intermediate RuptureSource (Sint)* Event Age*
CGV 1511–1625 (1610) SAP ≥1450–1670 (1600) CGV 1511–1625 (1610)SAS + SAP 1585–1659 (1624) CGV 1511–1625 (1610) SAS 1585–1659 (1624)HS 1537–1737 (1629) SAS 1585–1659 (1624) HS 1537–1737 (1629)CN 1692–1776 (1740) HS 1537–1737 (1629) HN + HS 1658–1786 (1725)RC + HN + HS 1690–1776 (1745) HN 1635–1776 (1705) SAO + SAN 1700–1776 (1735)SJB 1711–1770 (1750) HS 1658–1786 (1725) CN 1692–1776 (1740)SAO + SAN + SG 1700–1776 (1759) SAN 1680–1776 (1735) RC 1690–1776 (1745)
CN 1692–1776 (1740) SJB 1711–1770 (1750)RC 1690–1776 (1745) SG 1700–1776 (1759)SJB 1711–1770 (1750)SG 1700–1776 (1759)
Three models that bracket the range of rupture sources are shown. These are the minimum source model (Smin), which containsmultisegment ruptures and the fewest number of 1600–1776 earthquake sources; the maximum source model (Smax), which containsall independent and the largest number of earthquake sources; and (Sint), which is the preferred source model.*Fault and fault segment names as listed in Table 1.†Event age is shown as 2σ range and mean date. Where multiple fault segments comprise a rupture source, the best-constrained segment
date (italics) is used for the mean event age. These source sequences are plotted graphically in Figure 3.
The Earthquake Cycle in the San Francisco Bay Region: A.D. 1600–2012 9
BSSA Early Edition
combined with differences in timing of post-1600 surfaceruptures (Table 2, Appendix A) resulted in the division of theHayward fault into northern and southern rupture segments.Locations of changes in slip rate (common at fault branches),the transition from locked to creeping sections of a fault orchanges in the rate of creep along a fault, and the distributionof microearthquake activity provide additional bases for seg-mentation. Kinematic considerations are related to aspects offault geometry that could affect rupture propagation. Theseinclude changes in strike, bends, and steps (the 5 km wideright step between the Rodgers Creek and Hayward fault is aprincipal basis for that boundary), branching or intersectionpoints, changes in fault trace complexity, and variation inlithology along a fault. WGCEP (2003) recognized that rup-tures may not stop at preferred segment end points, hence itdefined zones of uncertainty based on the range of availableobservations (Fig. 2). In contrast to WGCEP (2008), whichdefined specific segment endpoints with no uncertainty, theWGCEP (2003) segmentation model provides mean, maxi-mum, and minimum fault rupture lengths (WGCEP, 2003,their table 3.8).
The present analysis modifies the WGCEP segmenta-tion model slightly. It treats the San Gregorio fault as a singlestructure (SG in Figs. 1 and 2, Table 1) because there was
little basis for a segment boundary in Monterey Bay. It alsoredefines the southern end of the Santa Cruz Mountainssegment as the San Juan Bautista segment (Appendix A),following Johanson and Burgmann (2005), who concludeit is a distinct transition zone into the fully creeping sectionof the San Andreas fault. With these modifications, theWGCEP (2003) fault segment lengths are used in our calcu-lation of fault area.
WGCEP (2003) estimated fault widths and their uncer-tainties (their table 3.8) based on the depth distribution ofseismicity along each fault and a regional heat flow model.Rather than a single rupture width for all sources, the fault-specific width varies based on these observations. The aver-age depth of seismicity in the SFBR is 11–12 km and locallyextends to 15–16 km. The areas of deepest seismicity, suchas the Santa Cruz Mountains and Mt. Diablo, are regions oftranspression in the strike-slip fault system with thickenedbrittle crust.
Creep occurs on some faults in the SFBR, including theHayward, Concord–Green Valley, Northern Calaveras, andthe northern section of the Rodgers Creek. To account forit, a seismogenic-scaling factor, R, was developed (WGCEP,2003, their table 3.8), which uses measured or estimatedcreep rates for each fault and has the effect of reducing
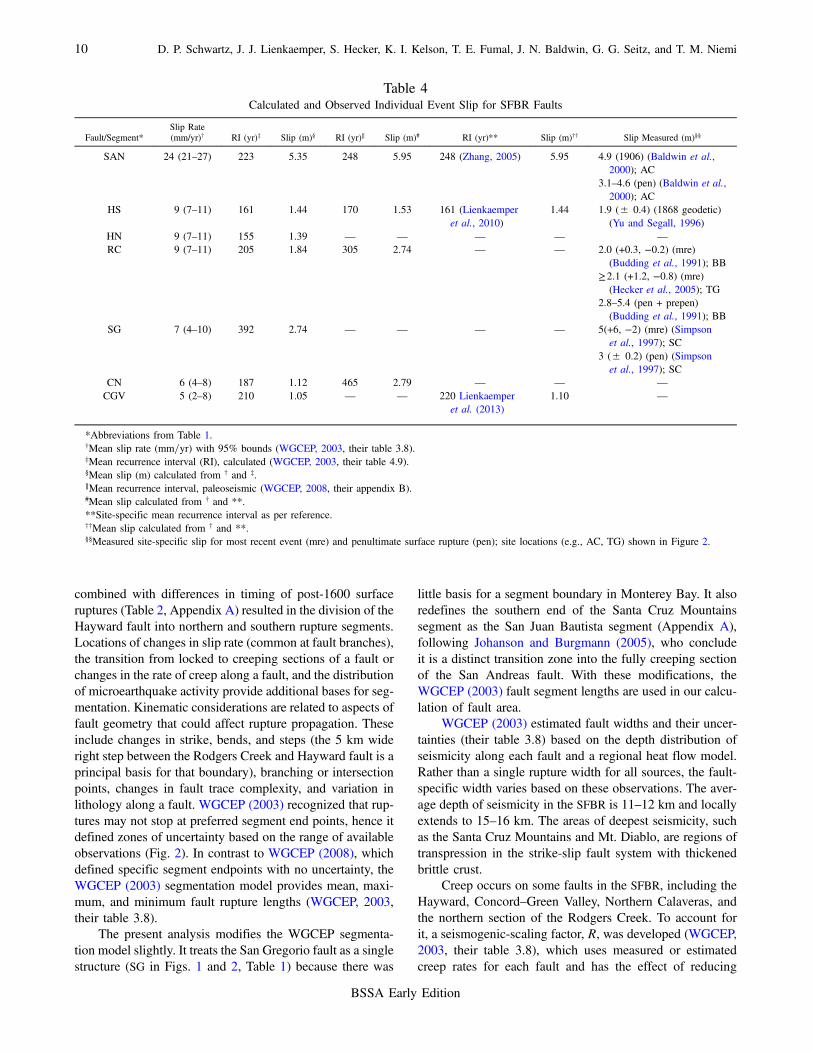
Table 4Calculated and Observed Individual Event Slip for SFBR Faults
Fault/Segment*Slip Rate(mm/yr)† RI (yr)‡ Slip (m)§ RI (yr)‖ Slip (m)# RI (yr)** Slip (m)†† Slip Measured (m)§§
SAN 24 (21–27) 223 5.35 248 5.95 248 (Zhang, 2005) 5.95 4.9 (1906) (Baldwin et al.,2000); AC
3.1–4.6 (pen) (Baldwin et al.,2000); AC
HS 9 (7–11) 161 1.44 170 1.53 161 (Lienkaemperet al., 2010)
1.44 1.9 (± 0.4) (1868 geodetic)(Yu and Segall, 1996)
HN 9 (7–11) 155 1.39 — — — — —RC 9 (7–11) 205 1.84 305 2.74 — — 2.0 (+0.3, −0.2) (mre)
(Budding et al., 1991); BB≥2:1 (+1.2, −0.8) (mre)
(Hecker et al., 2005); TG2.8–5.4 (pen + prepen)
(Budding et al., 1991); BBSG 7 (4–10) 392 2.74 — — — — 5(+6, −2) (mre) (Simpson
et al., 1997); SC3 (± 0.2) (pen) (Simpson
et al., 1997); SCCN 6 (4–8) 187 1.12 465 2.79 — — —CGV 5 (2–8) 210 1.05 — — 220 Lienkaemper
et al. (2013)1.10 —
*Abbreviations from Table 1.†Mean slip rate (mm=yr) with 95% bounds (WGCEP, 2003, their table 3.8).‡Mean recurrence interval (RI), calculated (WGCEP, 2003, their table 4.9).§Mean slip (m) calculated from † and ‡.‖Mean recurrence interval, paleoseismic (WGCEP, 2008, their appendix B).#Mean slip calculated from † and **.**Site-specific mean recurrence interval as per reference.††Mean slip calculated from † and **.§§Measured site-specific slip for most recent event (mre) and penultimate surface rupture (pen); site locations (e.g., AC, TG) shown in Figure 2.
10 D. P. Schwartz, J. J. Lienkaemper, S. Hecker, K. I. Kelson, T. E. Fumal, J. N. Baldwin, G. G. Seitz, and T. M. Niemi
BSSA Early Edition

the fault surface area available for rupture. This incorporatescreep into the estimates of moment magnitude and momentrelease. Length, width, and R are combined to calculate theseismogenic area for each fault segment, including the meanand 95th percentile values (WGCEP, 2003, their table 4.4).The mean is the preferred value based on the combined ob-servations. The uncertainties are listed throughout the analy-sis that follows, but our calculations and interpretations relyprincipally on the mean (preferred) values.
Using the seismogenic rupture areas, we calculate themean magnitude (with uncertainties) for each potential rup-ture source for the post-1600 paleoearthquakes. These arelisted in Table 5. These magnitudes differ slightly from thosecalculated by WGCEP (2003, their table 4.4). That analysisuses and equally weights two distinct magnitude–area rela-tions, those of Ellsworth in WGCEP (2003) and Hanks andBakun (2002). The present analysis uses a single magnitude–area relation (Hanks and Bakun, 2002, 2008) to calculate thepaleomagnitudes. The Hanks and Bakun relation is a bi-sloped curve with a change in slope at M 6.71. Two equa-tions give the magnitude for fault areas less than and greaterthan 537 km2:
M � logA� 3:98� 0:03�A ≤ 537 km2� �2�
and
M � 4=3 logA� 3:07� 0:04�A ≥ 537 km2�: �3�Hanks and Bakun (2002, 2008) is used in preference
over Wells and Coppersmith (1994) because the latter under-estimates the magnitude for larger fault areas. This is impor-tant when dealing with the longer rupture scenarios for theSFBR. From the estimates of magnitude, the moment for eachcan be calculated from the relation
M � 2=3 logM0 − 10:7 �4�(Hanks and Kanamori, 1979). Table 5 lists the mean, maxi-mum, and minimum moment calculated for each potentialrupture source. The seismic moment of each and momentsums for different time intervals during the post-1600 earth-quake sequence (Table 6) are the basic inputs for discussingmoment release over time and the SFBR earthquake cycle.
Discussion
In the following sections, the data on the timing of pastsurface-faulting earthquakes, the estimates of moment mag-nitude for different paleoruptures, and the historical seismicrecord are combined to discuss the chronology and size ofsurface-faulting earthquakes in the SFBR since approxi-mately 1600, seismic moment release during this interval,and the implications for the earthquake cycle.
Table 5Estimates of Moment Magnitude (Mw) and Seismic Moment (M0) for SFBR Earthquake Rupture Sources
EarthquakeRupture*
SeismogenicArea
Mean† (km2)
AreaMaximum(km2)
AreaMinimum(km2)
MwMean‡
MwMaximum
MwMinimum
M0 Mean(10E dyn·cm)§
M0
Maximum(dyn·cm)
M0
Minimum(dyn·cm)
HN 235 391 119 6.35 6.57 6.06 3:7725 8:1025 1:3625
HS 367 599 210 6.54 6.77 6.30 7:3625 1:6226 3:1925
HN + HS 616 882 400 6.79 7.00 6.54 1:7126 3:5226 7:2325
RC 736 949 563 6.89 7.04 6.74 2:4526 4:0726 1:4326
HS + HN + RC 1359 1737 1044 7.25 7.39 7.09 8:3526 1:3627 4:9226
SAN + SAO 3482 4432 2755 7.79 7.93 7.66 5:4827 8:8827 3:4327
SAN 2042 2678 1545 7.48 7.64 7.32 1:8827 3:2427 1:0827
SAN SFBR 1001 1306 757 7.07 7.22 6.91 4:5326 7:7126 2:5926
SAP 1066 1483 765 7.11 7.30 6.91 5:1326 9:9426 2:6426
SAS 829 1141 606 6.96 7.15 6.78 3:1126 5:8826 1:6626
SAS + SAP 1907 2412 1483 7.44 7.58 7.30 1:6427 2:6327 9:9426
SJB 202 332 97 6.29 6.50 5.97 3:0125 6:3325 9:7724
SJB SFBR 88 130 54 5.92 6.09 5.71 8:6424 1:5525 1:0025
1906 SFBR 2908 3718 2249 7.69 7.83 7.54 3:8227 6:2527 2:2927
SG 1983 2513 1556 7.47 7.60 7.33 1:7827 2:8527 1:0927
SG SFBR 1767 1995 1539 7.39 7.47 7.32 1:3627 1:8027 1:0727
SG + SAN + SAO 5465 6945 4311 8.05 8.19 7.91 1:3328 2:1628 8:2227
SG +SAN + SAO SFBR 2768 3301 2296 7.66 7.76 7.55 3:4727 4:9027 2:3727
CGV 395 668 182 6.58 6.84 6.24 8:2225 2:0226 2:5725
CN 465 610 348 6.65 6.78 6.52 1:0526 1:6826 6:8025
*Earthquake rupture sources; SFBR notation is for sections of sources that are in the SFBR rectangle but whose lengths extend beyond the boundaries. (SeeTable 1 for abbreviations.)
†Mean seismogenic area from WGCEP (2003); those with SFBR notation are calculated here. The mean is a preferred value (WGCEP, 2003) with widthbased on seismogenic crustal thickness from seismicity, length on best estimate of segment boundaries, and seismogenic scaling factor (R) from creep.Variations in these parameters provide the maximum and minimum area, considered by WGCEP (2003) to be 2.5%–95% bounds.
‡Magnitude (Mw) calculated using Hanks and Bakun (2008).§Seismic moment (M0) calculated from the magnitude; mean is the preferred value.
The Earthquake Cycle in the San Francisco Bay Region: A.D. 1600–2012 11
BSSA Early Edition
SFBR Earthquake History since 1600
The development of a chronology of earthquakes for thepast 400 years is confronted with a range of uncertainties andassumptions. For the paleoearthquakes, these include thetiming of individual surface ruptures, the accuracy of faultsegmentation models, the extrapolation of rupture timing ata point along a fault segment or a multisegment rupture, andestimates of fault area for calculating magnitude. For prein-strumental historical earthquakes (Bakun, 1999), the sourcesand magnitudes are the primary uncertainties. We incorpo-rate these as far as possible by constructing alternativemodels of the SFBR earthquake history, particularly forthe 1600–1776 paleoseismic interval. Three models are pre-sented (Figs. 3, 4, Table 3) that we consider to reasonablybracket paleoearthquake rupture behavior based on our inter-pretation of the available data (Appendix A). These are (1) aminimum source chronology (Smin) that contains the largestnumber of multisegment fault ruptures and the fewest pale-oearthquakes (Figs. 3a, 4a), (2) a maximum source chronol-ogy (Smax) that contains only single segment ruptures and thelargest number of events (Figs. 3b, 4b), and (3) an intermedi-ate source chronology (Sint) that is our preferred interpreta-tion of the paleorupture history (Figs. 2c, 3c). For multiple
segment ruptures, the best-constrained date on the participat-ing segments is the basis for both the 2σ age range and themean date (Table 3). Historical ruptures are added toFigure 3c, along with the year and mean magnitude of themoderated M ≤5�M ≥5:5 historical events (Bakun,1999) to extend the earthquake history to 2012.
The most robust observation from the paleoseismic datais that in an interval of 176 years (1600–1776), the completeSFBR fault system essentially failed in a series of surface-faulting earthquakes that physically spanned the length ofthe SFBR rectangle (Fig. 4). The two major strike-slip faultsin the region for which there are no surface-rupture timingdata are the Greenville fault and the northern continuationof the Concord–Green Valley fault (Bartlett Springs fault).The sequences of individual paleoseismic events shown inFigure 3 reflect the mean dates developed in OxCal modelingof these ruptures (Tables 2 and 3, Appendix A). Given the 2σradiocarbon uncertainties, if one could shuffle and redeal thispaleoseismic card deck, the actual sequences might have beenquite different. Nonetheless, the paleoseismic analysis sug-gests that it wasmore likely that (a) theConcord–GreenValleyfault, southernHayward fault, and SanAndreas fault (either asthe Santa Cruz Mountains segment or as a combined rupture
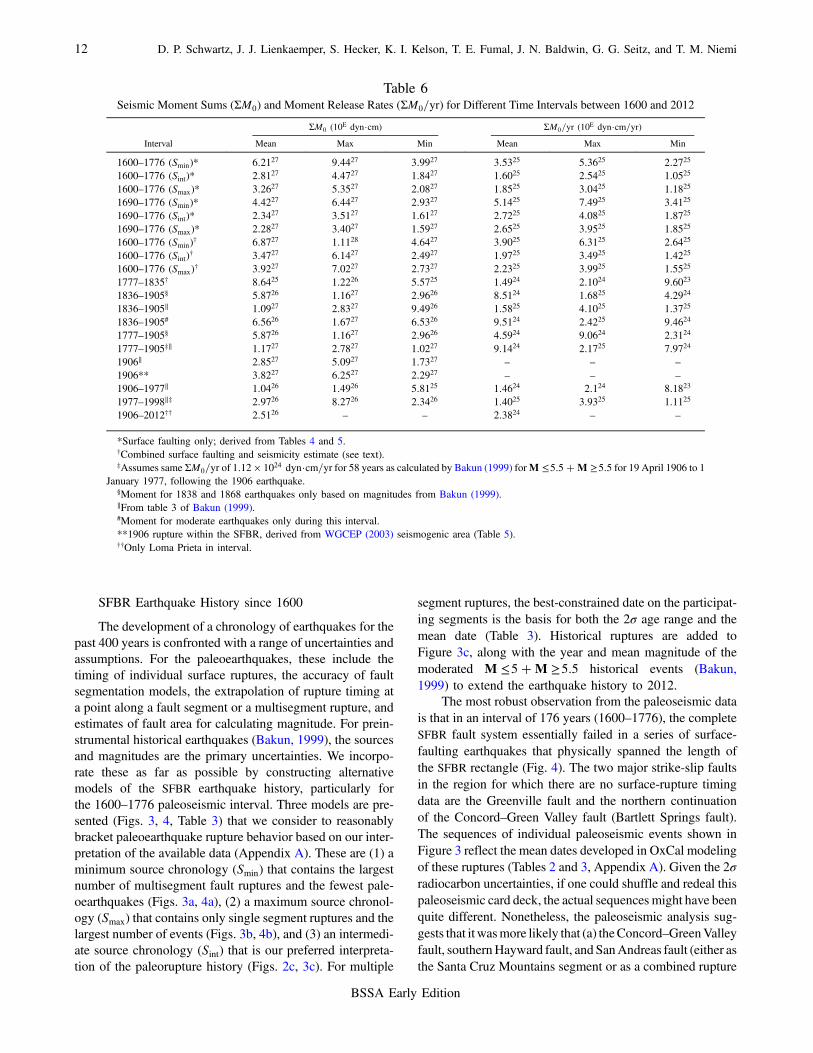
Table 6Seismic Moment Sums (ΣM0) and Moment Release Rates (ΣM0=yr) for Different Time Intervals between 1600 and 2012
ΣM0 (10E dyn·cm) ΣM0=yr (10E dyn·cm=yr)
Interval Mean Max Min Mean Max Min
1600–1776 (Smin)* 6:2127 9:4427 3:9927 3:5325 5:3625 2:2725
1600–1776 (Sint)* 2:8127 4:4727 1:8427 1:6025 2:5425 1:0525
1600–1776 (Smax)* 3:2627 5:3527 2:0827 1:8525 3:0425 1:1825
1690–1776 (Smin)* 4:4227 6:4427 2:9327 5:1425 7:4925 3:4125
1690–1776 (Sint)* 2:3427 3:5127 1:6127 2:7225 4:0825 1:8725
1690–1776 (Smax)* 2:2827 3:4027 1:5927 2:6525 3:9525 1:8525
1600–1776 (Smin)† 6:8727 1:1128 4:6427 3:9025 6:3125 2:6425
1600–1776 (Sint)† 3:4727 6:1427 2:4927 1:9725 3:4925 1:4225
1600–1776 (Smax)† 3:9227 7:0227 2:7327 2:2325 3:9925 1:5525
1777–1835† 8:6425 1:2226 5:5725 1:4924 2:1024 9:6023
1836–1905§ 5:8726 1:1627 2:9626 8:5124 1:6825 4:2924
1836–1905‖ 1:0927 2:8327 9:4926 1:5825 4:1025 1:3725
1836–1905# 6:5626 1:6727 6:5326 9:5124 2:4225 9:4624
1777–1905§ 5:8726 1:1627 2:9626 4:5924 9:0624 2:3124
1777–1905‡‖ 1:1727 2:7827 1:0227 9:1424 2:1725 7:9724
1906‖ 2:8527 5:0927 1:7327 – – –1906** 3:8227 6:2527 2:2927 – – –1906–1977‖ 1:0426 1:4926 5:8125 1:4624 2:124 8:1823
1977–1998‖‡ 2:9726 8:2726 2:3426 1:4025 3:9325 1:1125
1906–2012†† 2:5126 – – 2:3824 – –
*Surface faulting only; derived from Tables 4 and 5.†Combined surface faulting and seismicity estimate (see text).‡Assumes same ΣM0=yr of 1:12 × 1024 dyn·cm=yr for 58 years as calculated by Bakun (1999) forM ≤5:5�M ≥5:5 for 19 April 1906 to 1
January 1977, following the 1906 earthquake.§Moment for 1838 and 1868 earthquakes only based on magnitudes from Bakun (1999).‖From table 3 of Bakun (1999).#Moment for moderate earthquakes only during this interval.**1906 rupture within the SFBR, derived from WGCEP (2003) seismogenic area (Table 5).††Only Loma Prieta in interval.
12 D. P. Schwartz, J. J. Lienkaemper, S. Hecker, K. I. Kelson, T. E. Fumal, J. N. Baldwin, G. G. Seitz, and T. M. Niemi
BSSA Early Edition

with the Peninsula segment) produced earthquakes in theearly part of the interval and (b) the majority of events (Hay-ward north and south, Rodgers Creek, northern Calaveras,San Andreas, and San Gregorio faults) occurred in the latterpart of the interval. We interpret the more recent part of thesequence as a regional earthquake cluster.
Estimates of the duration of the cluster vary. The 2σ radio-carbon age ranges permit a start date as early as 1635 if thenorthern Hayward ruptured as a separate segment (Table 2),yielding a maximum duration of 141 years. However, the clus-ter length was likely shorter. The North Coast San Andreas,southern Hayward, Rodgers Creek, northern Calaveras, SanGregorio, and San Juan Bautista ruptures occurred after1658 (Table 2), giving a 118-year interval with the bulk ofthe probability density in the eighteenth century. If the southernand northern Hayward fault segments failed together, thiswould be a maximum interval (based on the southern Haywardage range). The Hayward event certainly could have occurredin the 1700s, and there are no other ruptures older than 1690.Additionally, the rupture sequence may have ended a decade ortwo prior to the construction of the Mission Dolores and Pre-sidio. Although the duration of the cluster could have been aslong as 118 years, it is more likely that the largest, if not all, ofthese paleoearthquakes occurred during a period of 100 yearsor less. For the purpose of calculating seismic moment rates,we have adopted a start date for the regional earthquake clusterof 1690.
From the end of the cluster until 1906, the SFBR wascharacterized by the infrequent occurrence of surface-faulting earthquakes on the major plate boundary faults.There appear to have been no large events for a minimumof 61 years (1776–1837), and there were only two duringa minimum interval of 130 years (1776–1906). These were(1) the 1838 earthquake, the source of which (as noted pre-viously) is uncertain, although attributed by many to the Pen-insula San Andreas or more recently to the Santa Cruzmountains segment (Streig et al., 2014), and (2) the 1868Hayward fault earthquake. These ruptures occupy only asmall percentage of the total length of the plate boundaryfault system through the SFBR. As described by Bakun(1999) and illustrated in Figure 3c, other smaller earthquakesoccurred throughout the region. The low frequency of occur-rence of large earthquakes following the regional earthquakecluster is qualitatively similar to the absence of large earth-quakes on principal SFBR faults during the 107 years (todate) following the 1906 event.
SFBR Moment Sums and MomentRelease: 1600–2012
Earthquake recurrence also is viewed as moment releasethrough time. One of our objectives is to quantify this releaseover the past approximately 400 years. Using the momentestimates from the regional earthquake sources (Table 5) andthose from historical and instrumental seismicity (Bakun,1999), we sum the moment (ΣM0) for different time intervals
and derive the moment rate per year (ΣM0=yr) (Table 6). Indoing this, we have constructed two models that show esti-mates of the seismic moment distribution from 1600 to thepresent. One is based on estimates of moment for only theregional events associated with surface rupture (Fig. 5a). The1989 Mw 6.9 Loma Prieta earthquake is the largest regionalevent since 1906 and contributes to SFBR moment release,but it did not rupture the surface and is not included in thatplot. The second model combines paleoseismic and histori-cal moment release (Fig. 5b). For each, we use the mean val-ues of ΣM0 and ΣM0=yr; similar models can be constructedusing both the maximum and minimum estimates of thesevalues (Table 5).
ΣM0=yr in Surface-Faulting Earthquakes. The magnitudeshown for each paleoearthquake in Figure 3 is for the fullrupture of that source. The 1906 rupture involved all segmentsof the San Andreas fault between the Mendocino triple junc-tion and San Juan Bautista, and the ∼1735 northern San An-dreas event likely involved both the North Coast and Offshoresegments (Appendix A). These extend beyond the boundariesof the SFBR, as do full ruptures of the San Juan Bautista seg-ment of the San Andreas fault and the San Gregorio fault(Figs. 1, 4). However, our interest is with the amount of mo-ment released in the SFBR crust. Therefore, only the southern90 km of the North Coast segment and the northern 20 km ofthe San Juan Bautista segment are used for ruptures involvingthose sources. The San Gregorio fault has been shortened by25 km to reflect rupturewithin the SFBR. These changes to thearea of the San Juan Bautista segment and San Gregorio haveminor impact on overall moment release. Themagnitudes andmoments calculated for these shortened sources are listed inTable 5 with the designation SFBR.
The largest single contributor to moment release in theSFBR in the past 400 years is the 1906 earthquake. Estimatesof its magnitude and of the moment released in the SFBR dur-ing that earthquake vary considerably. The seismic model ofWald et al. (1993) and the geodetic model of Thatcher et al.(1997) provide magnitudes of Ms 7.7 and Mw 7.9, respec-tively, with the seismic model yielding little information onthe slip offshore northwest of Point Arena. Song et al.(2008) use triangulation data employing newprojectionmeth-ods that both confirm and refine previous geodetic analysis ofthe rupture (Thatcher et al., 1997), and particularly offshoreof PointArena. Their final slipmodel, which uses a fault widthof 12 km, gives amoment of 7:9 × 1027 dyn·cm and anMw of7.9.Bakun (1999) considersM 7.8 to be ameanmagnitude for1906 and uses two methods to estimate moment in the SFBRfrom it. One method assumes constant moment release alongthe rupture and calculates its value for the length of the fault inthe SFBR. The other uses the average 1906 geodetic slip alongthe San Andreas (Thatcher et al., 1997) within the SFBR and afault width of 10 km. The estimated moments from thesemethods are 2:82 × 1027 dyn·cm and 2:88 × 1027 dyn·cm,respectively, for 1906 within the SFBR, and Bakun (1999, histable 3) averages them for a moment of 2:85 × 1027 dyn·cm.
The Earthquake Cycle in the San Francisco Bay Region: A.D. 1600–2012 13
BSSA Early Edition

From the slip values of Song et al. (2008, their electronic sup-plement), we calculate an average slip of 3.91m along 246 kmof the rupture in the SFBR. Using a fault width of 12 km(Song et al., 2008) produces a seismic moment of3:46 × 1027 dyn·cm. For the same length of fault, the seismo-genic area parameters of WGCEP (2003) yield a mean mo-ment of 3:82 × 1027 dyn·cm. This higher moment reflectsa wider fault plane used for the Peninsula (13 km) andSanta Cruz Mountains (15 km) segments. This is the seismicmoment preferred in this paper (1906 SFBR, Table 5) becauseit uses the same fault area parameters as our estimates of mag-nitude and moment for the paleoearthquakes, and it is thevalue used in the surface-faulting-only model of moment re-lease (Fig. 5a). Both it and the Bakun (1999) estimates areused to develop alternative moment release rates for the
1777–2012 interval in the combined paleoseismic and histori-cal seismicity model (Fig. 5b).
The sums of the moment (ΣM0) and the moment ratesper year (ΣM0=yr) for selected time intervals between 1600and 2012 are listed in Table 6, and the rates are showngraphically in Figure 5. For the paleoseismic events, momentsums and release rates are developed from the three chrono-logic source models (Smin, Sint, Smax) from 1600 to 1776 andfor the 1690–1776 cluster. From 1600 through 1776, the es-timated mean paleoseismic ΣM0=yr for the range of modelsis 1:60 × 1025 to 3:53 × 1025 dyn·cm=yr. The higher ratereflects the multisegment ruptures of the minimum sourcemodel. The rates for the maximum and intermediate sourcemodels are comparable. Our preferred rate for this interval is1:60 × 1025 dyn·cm=yr, which is derived from the inter-mediate source model. The long-term moment release rate
(a) (b)
Figure 5. Models of seismic moment release (ΣM0=yr) in the SFBR for the interval 1600–2012. (a) Moment release rates for differenttime intervals from surface-faulting events only. Horizontal lines are ΣM0=yr over specified interval. Shaded rectangles are bound rates fromthe three paleoseismic rupture sequences; the dashed red line is Smin, dashed black line is Smax, and solid gray line is Sint. The large rectangleis 1600–1776; and the small rectangle is the 1690–1776 cluster. The solid green line is the preferred mean ΣM0=yr of 1:75 × 1027 dyn·cmfrom surface-faulting earthquakes. Note the decrease in large-earthquake moment release between the end of the cluster and 1906. The 1777–2012 interval is dominated by the 1906 moment release, which cannot be plotted at the scale of the figure. Since 1906, there have been nolarge surface-faulting earthquakes on the major SFBR plate boundary faults. The upper part of the figure is a plot of the cumulative momentrelease from paleoseismic and historical surface-faulting earthquakes. Steps in the cumulative moment release accompany the 1690–1776cluster and 1906 earthquake. The solid line is the long-term average moment release rate derived from Argus and Gordon (2001). (b) ΣM0=yrfrom combined paleoseismic and historical seismic records. Symbols are the same as for (a). The ΣM0=yr for different intervals between1600–2012 combine moment from surface-faulting earthquakes, moment estimated by Bakun (1999) from historical seismicity, and ourestimates of moderate event seismicity during the 1600–1776 paleoseismic and 1777–1835 early historical intervals. Two rates of momentrelease are shown for 1777–2012. The higher-value dashed line (WG) uses the 1906 moment release in the SFBR based on WGCEP (2003)fault parameters; the lower-value dashed line (B) is based on the Bakun (1999) estimate of the 1906 moment release in the SFBR. The solidgreen line is the preferred mean for 1600–2012 ΣM0=yr of 2:21 × 1027 dyn·cm for the combined model of surface-faulting earthquakes andseismicity.
14 D. P. Schwartz, J. J. Lienkaemper, S. Hecker, K. I. Kelson, T. E. Fumal, J. N. Baldwin, G. G. Seitz, and T. M. Niemi
BSSA Early Edition
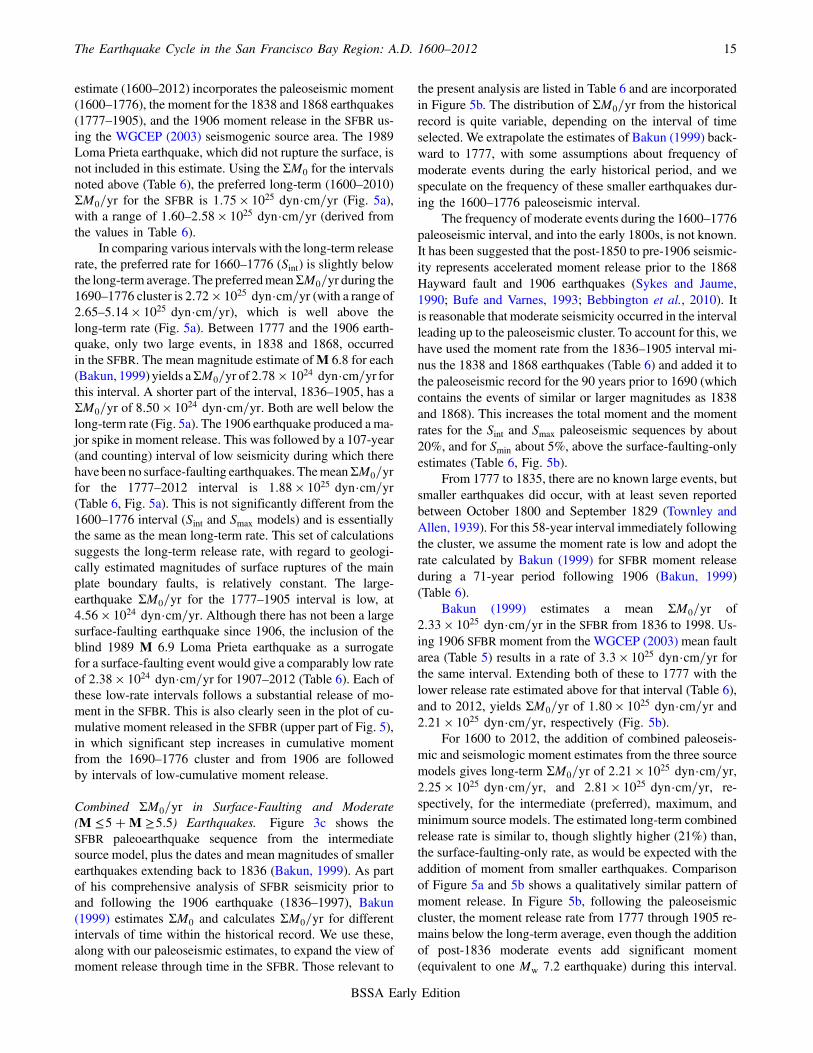
estimate (1600–2012) incorporates the paleoseismic moment(1600–1776), the moment for the 1838 and 1868 earthquakes(1777–1905), and the 1906 moment release in the SFBR us-ing the WGCEP (2003) seismogenic source area. The 1989Loma Prieta earthquake, which did not rupture the surface, isnot included in this estimate. Using the ΣM0 for the intervalsnoted above (Table 6), the preferred long-term (1600–2010)ΣM0=yr for the SFBR is 1:75 × 1025 dyn·cm=yr (Fig. 5a),with a range of 1:60–2:58 × 1025 dyn·cm=yr (derived fromthe values in Table 6).
In comparing various intervals with the long-term releaserate, the preferred rate for 1660–1776 (Sint) is slightly belowthe long-term average. The preferredmeanΣM0=yr during the1690–1776 cluster is 2:72 × 1025 dyn·cm=yr (with a range of2:65–5:14 × 1025 dyn·cm=yr), which is well above thelong-term rate (Fig. 5a). Between 1777 and the 1906 earth-quake, only two large events, in 1838 and 1868, occurredin the SFBR. The mean magnitude estimate ofM 6.8 for each(Bakun, 1999) yields aΣM0=yr of 2:78 × 1024 dyn·cm=yr forthis interval. A shorter part of the interval, 1836–1905, has aΣM0=yr of 8:50 × 1024 dyn·cm=yr. Both are well below thelong-term rate (Fig. 5a). The 1906 earthquake produced a ma-jor spike in moment release. This was followed by a 107-year(and counting) interval of low seismicity during which therehave been no surface-faulting earthquakes. ThemeanΣM0=yrfor the 1777–2012 interval is 1:88 × 1025 dyn·cm=yr(Table 6, Fig. 5a). This is not significantly different from the1600–1776 interval (Sint and Smax models) and is essentiallythe same as the mean long-term rate. This set of calculationssuggests the long-term release rate, with regard to geologi-cally estimated magnitudes of surface ruptures of the mainplate boundary faults, is relatively constant. The large-earthquake ΣM0=yr for the 1777–1905 interval is low, at4:56 × 1024 dyn·cm=yr. Although there has not been a largesurface-faulting earthquake since 1906, the inclusion of theblind 1989 M 6.9 Loma Prieta earthquake as a surrogatefor a surface-faulting event would give a comparably low rateof 2:38 × 1024 dyn·cm=yr for 1907–2012 (Table 6). Each ofthese low-rate intervals follows a substantial release of mo-ment in the SFBR. This is also clearly seen in the plot of cu-mulative moment released in the SFBR (upper part of Fig. 5),in which significant step increases in cumulative momentfrom the 1690–1776 cluster and from 1906 are followedby intervals of low-cumulative moment release.
Combined ΣM0=yr in Surface-Faulting and Moderate(M ≤5�M ≥5:5) Earthquakes. Figure 3c shows theSFBR paleoearthquake sequence from the intermediatesource model, plus the dates and mean magnitudes of smallerearthquakes extending back to 1836 (Bakun, 1999). As partof his comprehensive analysis of SFBR seismicity prior toand following the 1906 earthquake (1836–1997), Bakun(1999) estimates ΣM0 and calculates ΣM0=yr for differentintervals of time within the historical record. We use these,along with our paleoseismic estimates, to expand the view ofmoment release through time in the SFBR. Those relevant to
the present analysis are listed in Table 6 and are incorporatedin Figure 5b. The distribution of ΣM0=yr from the historicalrecord is quite variable, depending on the interval of timeselected. We extrapolate the estimates of Bakun (1999) back-ward to 1777, with some assumptions about frequency ofmoderate events during the early historical period, and wespeculate on the frequency of these smaller earthquakes dur-ing the 1600–1776 paleoseismic interval.
The frequency of moderate events during the 1600–1776paleoseismic interval, and into the early 1800s, is not known.It has been suggested that the post-1850 to pre-1906 seismic-ity represents accelerated moment release prior to the 1868Hayward fault and 1906 earthquakes (Sykes and Jaume,1990; Bufe and Varnes, 1993; Bebbington et al., 2010). Itis reasonable that moderate seismicity occurred in the intervalleading up to the paleoseismic cluster. To account for this, wehave used the moment rate from the 1836–1905 interval mi-nus the 1838 and 1868 earthquakes (Table 6) and added it tothe paleoseismic record for the 90 years prior to 1690 (whichcontains the events of similar or larger magnitudes as 1838and 1868). This increases the total moment and the momentrates for the Sint and Smax paleoseismic sequences by about20%, and for Smin about 5%, above the surface-faulting-onlyestimates (Table 6, Fig. 5b).
From 1777 to 1835, there are no known large events, butsmaller earthquakes did occur, with at least seven reportedbetween October 1800 and September 1829 (Townley andAllen, 1939). For this 58-year interval immediately followingthe cluster, we assume the moment rate is low and adopt therate calculated by Bakun (1999) for SFBR moment releaseduring a 71-year period following 1906 (Bakun, 1999)(Table 6).
Bakun (1999) estimates a mean ΣM0=yr of2:33 × 1025 dyn·cm=yr in the SFBR from 1836 to 1998. Us-ing 1906 SFBR moment from the WGCEP (2003) mean faultarea (Table 5) results in a rate of 3:3 × 1025 dyn·cm=yr forthe same interval. Extending both of these to 1777 with thelower release rate estimated above for that interval (Table 6),and to 2012, yields ΣM0=yr of 1:80 × 1025 dyn·cm=yr and2:21 × 1025 dyn·cm=yr, respectively (Fig. 5b).
For 1600 to 2012, the addition of combined paleoseis-mic and seismologic moment estimates from the three sourcemodels gives long-term ΣM0=yr of 2:21 × 1025 dyn·cm=yr,2:25 × 1025 dyn·cm=yr, and 2:81 × 1025 dyn·cm=yr, re-spectively, for the intermediate (preferred), maximum, andminimum source models. The estimated long-term combinedrelease rate is similar to, though slightly higher (21%) than,the surface-faulting-only rate, as would be expected with theaddition of moment from smaller earthquakes. Comparisonof Figure 5a and 5b shows a qualitatively similar pattern ofmoment release. In Figure 5b, following the paleoseismiccluster, the moment release rate from 1777 through 1905 re-mains below the long-term average, even though the additionof post-1836 moderate events add significant moment(equivalent to one Mw 7.2 earthquake) during this interval.
The Earthquake Cycle in the San Francisco Bay Region: A.D. 1600–2012 15
BSSA Early Edition

ΣM0 of the Paleoseismic Sequence and Comparison to1906. An important comparison is the ΣM0 for the paleo-seismic interval, particularly the cluster, and the moment re-leased in the SFBR in 1906. Table 6 lists a range of estimatesfor each, and these are shown graphically as cumulative mo-ment from surface-rupturing earthquakes in the upper part ofFigure 5. For the paleoseismic interval, the ΣM0 ranges from2:81 × 1027 to 6:21 × 1027 dyn·cm (Table 6). As noted pre-viously, for 1600–1776 our preference is the Sint model, withΣM0 of 2:81 × 1027 dyn·cm. For the more temporally lim-ited cluster (1690–1776), the ΣM0 ranges from 2:28 × 1027
to 4:42 × 1027 dyn·cm, with our preferred Sint ΣM0 of2:34 × 1027 (Table 6). The values for Smax are quite compa-rable. The ΣM0 for 1600–1776 (all models) is a minimum ifduring this period additional large earthquakes occurred onthe Greenville fault or northern extension of the Concord–Green Valley fault, or if the 1750 San Andreas rupture thatwe have restricted to the San Juan Bautista segment (Appen-dix A) actually ruptured through the Santa Cruz Mountains.
The estimates of moment released in the SFBR in 1906range from 2:82 × 1027 to 3:82 × 1027 dyn·cm. Table 7 liststhe percentage of paleoseismic ΣM0 relative to 1906 SFBRmoment for different paleoseismic source models and 1906moment values. In this comparison, we use the Bakun (1999)estimate of 1906 SFBR moment of 2:85 × 1027 for the lowervalue and the moment based on WGCEP (2003) fault param-eters and presented here (Table 5) at the upper end. The ΣM0
for the longer 1600–1776 paleoseismic interval varies from74% to 219% of 1906. For the 1690–1776 cluster, the rangeis 52%–116%. The percentages for the Smin model seem veryhigh. The ΣM0 from the paleoseismic sequence is slightlylower than (though, given the uncertainties, comparable to)1906 for the preferred Sint and the similar Smax source sequen-ces. The plot of cumulative moment (upper panel of Fig. 5)clearly shows the similarity in the increase in moment releaseassociated with both the 1690–1776 cluster and the 1906 sur-face rupture, and the lower moment rate that followed each.
Earthquake Cycles and Stress Shadows
One of the basic characteristics ascribed to the earth-quake cycle is the decrease in the rate of seismic activityon a regional scale following a great earthquake. The SFBRhas figured prominently in the development of this conceptwith the observation that the rate of moderate (M ≥5:5)earthquakes was significantly higher in the decades prior tothe 1906 earthquake than in the period following it (Tocher,1959; Ellsworth et al., 1981; Simpson and Reasenberg,1994; Jaume and Sykes, 1996). Bakun (1999) concludes thatin the 70 years before the 1906 earthquake (1836–1906),there had been ≥55 earthquakes ofM ≥4:6, of which 9 wereM ≥6:2; in contrast, during the 90 years from 1906 through1997, there were 17 events ofM ≥5:3 with 3 earthquakes ofM ≥6:2. In addition, he calculates the ΣM0=yr in the 56years before 1906 is approximately 10 times the rate for the70 years after. This change in seismicity rate in the SFBR hasbeen termed as a stress shadow (Simpson and Reasen-berg, 1994).
The various phases suggested for the earthquake cycle,such as an increase of seismicity prior to a great earthquakeor decrease following one, are based on a generally short rec-ord of earthquake occurrence. The length of the record oflarge earthquakes in the SFBR discussed here, approximately400 years, is more than twice the length of the historical rec-ord. Figure 3 shows that between 1600 and our historical cut-off of 1776 (and even if cutoff uncertainty is extended to1800), there were anywhere from 7 to 11 surface-faultingearthquakes in a maximum interval of 176 years (one per16–25 years) and possibly from 4 to 7 events in an intervalof 86 years (1690–1776) or less (one per 12–21 years). Notonly does the frequency of small earthquakes change overtime, it appears from this longer record that the frequencyof M ≥6:5 events can also vary considerably. Using thesepaleoseismic interpretations, we look at the SFBR from theperspective of a more complete and possibly a full earth-quake cycle—one that includes primary seismic moment re-lease in two distinct ways. These are as a single-fault greatearthquake (such as 1906) and as a temporal cluster of largeearthquakes that we have interpreted from the paleoseismicrecord.
There is little disagreement that the regional rate of seis-micity dropped abruptly after 1906, but there is a consider-able difference of opinion about the physical controls andduration of this quiescence in the SFBR. Harris and Simpson(1998) suggest that static Coulomb stress changes affectingthe stress on regional faults parallel to the San Andreas couldexplain the post-1906 quiescence. Kenner and Segall (1999)analyze the 1906 stress shadow and its duration using fourgeometric and rheological models. They suggest the stressshadow can be a time-dependent process reflecting structureand rheology of the lower crust and mantle. Without givingspecific time estimates, Kenner and Segall (1999) concludethat the duration of the shadow will largely depend on theconnectivity of parallel fault structures in the lower crust.
Table 7Comparison of the Sum of the Moment (ΣM0) for PaleoseismicRupture Source Sequences Versus 1906 Moment Release in the
SFBR
PaleoseismicRupture SourceSequence*
ΣM0 Mean(10E dyn·cm)†
Paleoseismic/1906(2:85 × 1027) (%)‡
Paleoseismic/1906(3:82 × 1027) (%)§
Smin (1600–1776) 6:2127 219 163Smin (1690–1776) 4:4227 155 116Smax (1600–1776) 3:2627 114 85Smax (1690–1776) 2:2827 80 52Sint (1600–1776) 2:8127 98 74Sint (1690–1776) 2:3427 82 61
*Listed in Table 3.†Listed in Table 5.‡Preferred moment (dyn·cm) of Bakun (1999, his table 3) for 1906
in SFBR.§1906 moment (dyn·cm) in SFBR from WGCEP (2003) fault parameters.
16 D. P. Schwartz, J. J. Lienkaemper, S. Hecker, K. I. Kelson, T. E. Fumal, J. N. Baldwin, G. G. Seitz, and T. M. Niemi
BSSA Early Edition

Parsons (2002) analyzes the stress shadow through a finiteelement model that uses a range of stressing distributionsfor SFBR faults and intervening crust, as well as postseismiceffects such as deep afterslip and viscoelastic relaxation inthe upper mantle. Parsons (2002) notes the duration of thestress shadow decreases on each SFBR fault with increasingdistance from the 1906 rupture. For the finite element modelthe duration of the stress shadow is 11 to 56 years if visco-elastic effects are neglected, and 17 to 74 years if they areincluded, depending on the fault. This contrasts with a dis-location loading model for which the duration of the shadowon individual faults is between 7 and 54 years.
In the analyses cited, the primary cause of the stressshadow is the stress change from a combination of short-termstatic and longer-term viscoelastic stress interactions, and themodeling suggests that the shadow effect should have ended.Yet in the SFBR, seismic quiescence is ongoing, which ledReasenberg et al. (2003) to propose an empirical model toaccount for continuing stress shadow effects in the calcula-tion of SFBR probabilities by WGCEP (2003). The chronol-ogy of SFBR surface-faulting earthquakes provides a basis tosuggest that factors other than stress change may play a rolein producing or increasing the duration of a period ofregional seismic quiescence.
Pollitz and Schwartz (2008) present a model of stressevolution in the SFBR that is based in part on an earlier versionof the paleoearthquake chronology described here. Theysuggest that through static and viscoelastic interactions, a rup-ture sequence beginning in 1656 (an arbitrary date for theanalysis) produced stress shadows around individual faultsthat by 1776 cumulatively resulted in a regional stress de-crease comparable to the regional stress decrease following1906. Comparisons of the modeled stress in the SFBR in 1770and 1910 are shown in Figure 6. Figure 3 illustrates the rel-atively infrequent occurrence of large earthquakes in the SFBRbetween 1776 and 1906. Subsequent to the paleoseismiccluster, the average moment release per year, even includingthe post-1836 moderate events (Fig. 5b), was below the long-term average until 1906. Qualitatively the post-1776 decreasein moment release per year is not substantially different fromthe decrease following 1906. However, it resulted frommulti-ple events on subparallel faults over a period of time ratherthan from a single great rupture.
Although stress changes and fault interactions clearlyplay a major role, we suggest that part of the stress shadowprocess, and a possible control on its duration, is the regionaldepletion of accumulated strain in the event or events that cul-minate a cycle. It simply requires time, possibly longer thanthe effect of stress changes alone, to re-accumulate this. Asnoted, the cumulative moment released by the seventeenthto eighteenth century paleoearthquakes (with the major per-centage between 1690 and 1776) and the moment of 1906 inthe SFBR are comparable within the uncertainties presented.The 1906 earthquake was the result of slip on one fault, withan average of 4.1 m (Song et al., 2008) along the full length ofthe rupture and 3.91 m (our calculation) in the SFBR. With a
regional stressing rate of 40 mm=yr (a reasonable midpointfor the various estimates), approximately 5.2 m of slip wouldhave accumulated in the SFBR between 1776 and 1906, givenno other release outlet. Some percentage of this slip was re-leased in the 1838 and 1868 earthquakes, additional slip oc-curred during the moderate historical events, and some wasreleased through creep. However, clearly by 1906, the SFBRcrustal volume had reloaded sufficiently to initiate failure ofthe system, and perhaps 4m is the critical level required. If thisis the case, then the time necessary to reach this level mayextend beyond the temporal influence of both coseismicand postseismic stress changes.
Conclusions
The paleoseismic record of surface-faulting earthquakesprovides a unique opportunity to extend our understanding ofthe process of plate boundary stress accumulation and release—the earthquake cycle—well beyond the historical seismicrecord. Paleoseismic studies of the major faults in the SFBRhave given us a nearly complete inventory of large rupturessince 1600. From the analysis developed here, we estimatethese surface ruptures are associated with earthquakes rang-ing in magnitude (mean) from aboutM ≥6:6 to aboutM 7.8.The paleoearthquake chronology from 1600 to 1776 (the be-ginning of the historical record of large earthquakes with thefounding of the Mission Dolores and Presidio in San Fran-cisco) provides evidence for rupture of the San Andreas fault(North Coast plus Offshore, Santa Cruz Mountains, and SanJuan Bautista segments), Hayward fault (twice on thesouthern Hayward with the penultimate likely includingthe northern Hayward), Rodgers Creek fault, San Gregoriofault, northern Calaveras fault, and Concord–Green Valleyfault. The evidence for the extent and location of rupture onthe Peninsula segment of the San Andreas fault during thisinterval is equivocal, and there are no paleoearthquake datafor the Greenville fault or northern extension of theConcord–Green Valley fault.
Perhaps the most intriguing, and a quite robust, obser-vation is that a subset of these paleoearthquakes appears tohave occurred as a cluster of events along the major SFBRplate boundary faults between the mid to late-seventeenthand late-eighteenth centuries. It includes the North CoastSan Andreas, southern and northern Hayward, RodgersCreek, northern Calaveras, San Gregorio, and San Juan Bau-tista ruptures. Two-sigma OxCal-modeled radiocarbon ageranges allow a combined southern and northern Haywardfault rupture to have occurred as early as 1658, althoughit was likely in the eighteenth century, and they constrainthe remaining ruptures to post-1690. Historical constraintscap the occurrence of these paleoearthquakes at 1776.
Estimates of the preferred ΣM0=yr for the 1660–2012 in-terval range from 1:75 × 1025 dyn·cm=yr from modelingonly surface-faulting earthquakes to 2:21 × 1025 dyn·cm=yrfrom a combination of surface ruptures and seismicity. Amajor result of our analysis is that the SFBR earthquake
The Earthquake Cycle in the San Francisco Bay Region: A.D. 1600–2012 17
BSSA Early Edition

cycle—the release of seismic moment in the form of large anddamaging earthquakes—varies considerably over time.Although the regional plate tectonic stressing rate, withinuncertainties, remains constant, its release in SFBR crustcan occur in one great event like 1906, or it can be distributedacross the region as rupture of the primary plate boundaryfaults during a relatively short, decadal interval. This appearsto have been the case during the most recent full cycle,and variations likely occur. The estimated mean ΣM0 fromthe beginning of our paleoearthquake chronology in 1600 tothe beginning of the historical record of large earthquakes in
1776 ranges from 2:81 × 1027 to 6:21 × 1027 dyn·cm. Themean ΣM0 estimated for the 1690–1776 cluster is2:28 × 1027 to 4:42 × 1027 dyn·cm. The cluster was fol-lowed by a 128-year period of quiescence for large surface-rupturing earthquakes on the primary plate boundary faults inthe SFBR, with only the 1868Hayward fault rupture occurringon one with certainty. The seismic moment of the 1906 earth-quake within the SFBR is variously estimated at 2.82 to3:82 × 1027 dyn·cm. To date, the 1906 event has been fol-lowed by a 107-year interval during which no large plateboundary strike-slip surface ruptures have occurred. The only
Figure 6. Snapshots of modeled cumulative stress changes in the SFBR. Three time slices from a stress evolution model extending from1660 to 2040 are shown (modified from Pollitz and Schwartz, 2008). The warmer colors indicate increased Coulomb stress, and the coolercolors define decreased stress. The time slice for 1770 shows the regional decrease in stress following a sequence of large earthquakes similarto that described here. The time slice for 1910 shows the modeled stress in the SFBR following the 1906 earthquake. The time slice at 2010reflects the general increase in stress across the SFBR at essentially the present time.
18 D. P. Schwartz, J. J. Lienkaemper, S. Hecker, K. I. Kelson, T. E. Fumal, J. N. Baldwin, G. G. Seitz, and T. M. Niemi
BSSA Early Edition

large event during this periodwas the 1989M 6.9 Loma Prietaearthquake, which occurred on a blind reverse-oblique sliprupture adjacent to the San Andreas fault. The similarity inthe limited occurrence of surface-rupturing plate boundaryfault earthquakes following a large regional moment releasein two different ways suggests the re-accumulation of regionalstress to a critical failure level for the system is a long processthat eventually overrides the waning influence of both coseis-mic and postseismic stress changes.
To date, the accumulated system-wide slip deficit in theSFBR since 1906 is approximately 4 m, with a small percent-age already released through creep and the Loma Prieta earth-quake. By 2036, it will be 5m. TheWGCEP (2003) calculateda 62% probability of one or moreM ≥6:7 earthquakes in theSFBR between 2002 and 2031. The WGCEP (2008) revisedthis to 63% between 2007 and 2036. These probabilities aredistributed on faults across the SFBR, with a very small like-lihood of a 1906 repeat during these time intervals. There is noguarantee what path the occurrence of future large earth-quakes in the SFBRwill take, but given the earthquake historysince 1600, there is a strong likelihood that it will be moresimilar to the paleoseismic cluster—the plate boundary faultshave to slip—than to 1906. This is conceptually consistentwith the Working Group probabilities.
Data and Resources
All data and resources used in the development of theobservations and interpretations presented here are openlyavailable in the cited references, with the exceptions ofKelson and Baldwin (2000a,b,c), Kelson and Randolph(2000), and Simpson and Knudsen (2000), which are un-published contract reports written for the U.S. GeologicalSurvey.
A primary source for the SFBR fault characterization de-veloped in this paper is USGS Open-File Report 03-214,Earthquake Probabilities in the SFBR: 2002–2031. The fullreport can be downloaded at http://pubs.usgs.gov/of/2003/of03‑214/OFR‑03‑214_FullText.pdf (last accessed Au-gust 2013).
Chapter 3 of the USGS report, “Characterization of theSFBR Earthquake Sources,” provides details of the SFBRfault segmentation model used in this paper and includes10 figures with maps detailing the segments and their boun-daries. This can be downloaded directly at http://pubs.usgs.gov/of/2003/of03‑214/WG02_OFR‑03‑214_Chapter3.pdf(last accessed August 2013).
Chapter 4 of the USGS report, “The SFBR EarthquakeSource Model: Magnitudes and Long-Term Rates,” can bedownloaded at http://pubs.usgs.gov/of/2003/of03‑214/WG02_OFR‑03‑214_Chapter4.pdf (last accessed August 2013).
The Calib 7.0 radiocarbon calibration program can beaccessed at http://calib.qub.ac.uk/calib/calib.html (last ac-cessed October 2013).
Acknowledgments
We appreciate the thorough reviews of Timothy Dawson, Fred Pollitz,Jeff Ritz, Yann Klinger, and an anonymous reviewer. Much of the paleoseis-mic data discussed here are the direct outgrowth of investigations initiated bythe Bay Area Paleoearthquake Experiment (BAPEX), part of a CooperativeResearch and Development Agreement (CRADA) between the U.S. Geo-logical Survey (USGS) and the Pacific Gas and Electric Company, to in-crease understanding of earthquake sources in the San Francisco BayRegion (SFBR). In regard to this, we thank Lloyd Cluff for his foresightand support of this effort. A special thank you goes to the paleoseismologistsand earthquake geologists who have worked, and are still working, to extendthe earthquake history of the SFBR back in time.
References
Argus, D. F., and R. G. Gordon (2001). Present tectonic motion across theCoast Ranges and San Andreas fault system in central California,Geol. Soc. Am. Bull. 113, 1580–1592.
Bakun, W. H. (1999). Seismic activity of the San Francisco Bay region, Bull.Seismol. Soc. Am. 89, 764–784.
Bakun, W. H., and C. M. Wentworth (1997). Estimating earthquake locationand magnitude from seismic intensity data, Bull. Seismol. Soc. Am. 87,1502–1521.
Baldwin, J. N., K. I. Kelson, and C. E. Randolph (1998). Timing of the most-recent surface faulting event on the northern Calaveras fault, nearSunol, California [abs.], Eos Trans. AGU 79, no. 4 (Fall meeting).
Baldwin, J. N., K. L. Knudsen, A. Lee, C. S. Prentice, and R. Gross (2000).Preliminary estimate of coseismic displacement of the penultimateearthquake on the northern San Andreas fault, Pt. Arena, California,in Tectonic Problems of the San Andreas Fault System, G. Bokelmanand R. Kovachs (Editors), Stanford University Publications, Stanford,California, Geological Sciences, Vol. XXI, 355–368.
Baldwin, J. N., R. Turner, and J. J. Lienkaemper (2008). Earthquake recordof the Green Valley fault, Lopes Ranch, Solano County, California,U.S. Geological Survey, National Earthquake Hazards ReductionProgram, Final Technical Report Award Number 06HQGR0144,39 pp.
Bebbington, M. S., D. S. Harte, and S. C. Jaume (2010). Repeated intermit-tent earthquake cycle in the San Francisco Bay region, Pure Appl.Geophys. 167, 801–818, doi: 10.1007/s00024-010-0064-6.
Bowman, D. D., and G. C. P. King (2001). Accelerating seismicity andstress accumulation before large earthquakes, Geophys. Res. Lett.28, 4039–4042.
Bronk Ramsey, C. (2001). Development of the radiocarbon calibrationprogram OxCal, Radiocarbon 43, no. 2a, 355–363.
Bronk Ramsey, C. (2007). OxCal Program, v. 4.0, Radiocarbon AcceleratorUnit, University of Oxford, United Kingdom.
Budding, K. E., D. P. Schwartz, and D. H. Oppenheimer (1991). Slip rate,earthquake recurrence, and seismogenic potential of the RodgersCreek fault zone, northern California: Initial results, Geophys. Res.Lett. 18, 447–450.
Bufe, C. G., and D. J. Varnes (1993). Predictive modeling of the seismiccycle in the greater San Francisco Bay region, J. Geophys. Res. 98,9871–9883.
Bürgmann, R., D. Schmidt, R. M. Nadeau, M. d’Alessio, E. Fielding,D. Manaker, T. V. McEvilly, and M. H. Murray (2000). Earthquakepotential along the northern Hayward fault, Science 289, 1178–1182.
Cotton, W. R., N. T. Hall, and E. A. Hay (1982). Holocene behavior of theSan Andreas fault at Dogtown, Point Reyes National Seashore,California, National Earthquake Hazards Reduction Program FinalTechnical Report, Contract 14-08-0001-19841, 33 pp.
d’Alessio, M., I. A. Johanson, R. Bürgmann, D. A. Schmidt, andM. H. Murray (2005). Slicing up the San Francisco Bay area: Blockkinematics and fault slip rates from GPS-derived surface velocities,J. Geophys. Res. 110, no. B06403, doi: 10.1029/2004JB003496.
The Earthquake Cycle in the San Francisco Bay Region: A.D. 1600–2012 19
BSSA Early Edition

DeMets, C., R. G. Gordon, D. F. Argus, and S. Stein (1994). Effect of recentrevisions to the geomagnetic reversal time scale on estimates of currentplate motions, Geophys. Res. Lett. 21, 2191–2194.
Ellsworth, W. L., A. G. Lindh, W. H. Prescott, and D. G. Herd (1981).The1906 San Francisco earthquake and the seismic cycle, in Earth-quake Prediction, An International Review, D. W. Simpson and P.G. Richards (Editors), Maurice Ewing Series 4, American GeophysicalUnion Monograph, Washington, D.C., 126–140.
Fumal, T. E. (2012). Timing of large earthquakes during the past 500 yearsalong the Santa Cruz mountains segment of the San Andreas fault atMill Canyon, near Watsonville, California, Bull. Seismol. Soc. Am.102, 1099–1119.
Fumal, T. E., T. E. Dawson, R. Flowers, J. C. Hamilton, G. F. Heingartner,J. Kessler, and L. Samrad (2004). Photomosaics and logs of trencheson the San Andreas fault at Mill Canyon near Watsonville, California,U.S. Geol. Surv. Open-File Rept. 03-469, 1 sheet.
Fumal, T. E., G. F. Heingartner, T. E. Dawson, R. Flowers, J. C. Hamilton,J. Kessler, L. M. Reidy, L. Samrad, G. G. Seitz, and J. Southon(2003). A 100-year average recurrence interval for the San Andreasfault, southern San Francisco Bay area, California (abstract S12B–0388), Eos Trans. AGU 84, no. 46 (Fall Meet. Suppl.), F1003,S12B–0388.
Fumal, T. E., G. F. Heingartner, L. Samrad, T. E. Dawson, J. C. Hamilton,and J. N. Baldwin (2004). Photomosaics and Logs of Trenches on theSan Andreas Fault at Arano Flat near Watsonville, California, U.S.Geol. Surv. Open-File Rept. 03-450, 3 sheets.
Gilbert, G. K. (1884). A theory of the earthquakes of the Great Basin, with apractical application, Am. J. Sci. Ser. 3 27, no. 157, 49–54.
Gillespie, R. (1984). Radiocarbon User’s Handbook, Oxford Univ. Comm.for Archeaol., Oxbow Books, Oxford, England, 154 pp.
Goldfinger, C., K. Grijalva, R. Bürgmann, A. E. Morey, J. E. Johnson, C. H.Nelson, J. Gutiérrez-Pastor, A. Ericsson, E. Karabanov, J. D. Chaytor,J. Patton, and E. Gràcia (2008). Late Holocene rupture of the northernSan Andreas fault and possible stress linkage to the Cascadia subduc-tion zone, Bull. Seismol. Soc. Am. 98, 861–889.
Goldfinger, C., A. E. Morey, C. H. Nelson, J. Gutiérrez-Pastor, J. E. Johnson,E. Karabanov, J. Chaytor, and A. Eriksson (2007). Rupture lengths andtemporal history of significant earthquakes on the Offshore and NorthCoast segments of the northern San Andreas fault based on turbiditestratigraphy, Earth Planet. Sci. Lett. 254, 9–27.
Haeussler, P. J., D. P. Schwartz, T. E. Dawson, H. D. Stenner, J. J. Lienkaemper,B. Sherrod, F. R. Cinti, P. Montone, P. A. Craw, A. J. Crone, andS. F. Personius (2004). Surface rupture and slip distribution of the Denaliand Totschunda faults in the 3 November 2002M 7.9 earthquake, Alaska,Bull. Seismol. Soc. Am. 94, no. 6, S23–S52.
Hall, N. T. (1981). The San Andreas fault in Marin County, California:Stops 4, 5, 6, and 7, in The Franciscan Complex and the San AndreasFault from Golden Gate to Point Reyes, in Pacific Section Book 51,J. R. Kleist (Editor), American Association of Petroleum Geologists,Tulsa, Oklahoma, 17–28.
Hall, N. T., and T. M. Niemi (2008). The 1906 earthquake fault rupture andpaleoseismic investigation of the northern San Andreas fault at theDogtown site, Marin County, California, Bull. Seismol. Soc. Am.98, 2191–2208.
Hall, N. T., R. H. Wright, and K. B. Clahan (1999). Paleoseismic studies ofthe San Francisco Peninsula segment of the San Andreas fault zonenear Woodside, California, J. Geophys. Res. 104, 23,215–23,236.
Hanks, T. C., and W. H. Bakun (2002). A bilinear source-scaling model forM log A observations of continental earthquakes, Bull. Seismol. Soc.Am. 92, 1841–1846.
Hanks, T. C., andW. H. Bakun (2008). M-log A observations for recent largeearthquakes, Bull. Seismol. Soc. Am. 98, 490–494.
Hanks, T. C., and H. Kanamori (1979). A moment magnitude scale,J. Geophys. Res. 84, 2348–2350.
Harris, R. A., and R.W. Simpson (1998). Suppression of large earthquake bystress shadows: A comparison of Coulomb and rate-and-state failure, J.Geophys. Res. 103, 24,439–24,451.
Hayward Fault Paleoearthquake Group (1999). Timing of paleoearthquakeson the northern Hayward fault—Preliminary evidence in El Cerrito,California, U.S. Geol. Surv. Open-File Rept. 99-318, 33 pp.
Hecker, S., T. E. Dawson, and D. P. Schwartz (2010). Normal-faultingdisplacement and stress drop variability: A geological perspective,Bull. Seismol. Soc. Am. 100, 3130–3147.
Hecker, S., D. Pantosti, D. P. Schwartz, J. C. Hamilton, L. M. Reidy, andT. J. Powers (2005). The most recent large earthquake on theRodgers Creek fault, San Francisco Bay area, Bull. Seismol. Soc. Am.95, 844–860.
Hemphill-Haley, M. A., and R. J. Weldon (1999). Estimating prehistoricearthquake magnitude from point measurements of surface rupture,Bull. Seismol. Soc. Am. 89, 1264–1279.
Jacoby, G. C. (1995). Absolute dating of prehistoric earthquakes bytree-ring analysis in California, U.S. Geol. Surv. Open-File Rept.95-210, 455–458.
Jaume, S. C., and L. R. Sykes (1996). Evolution of moderate seismicity inthe San Francisco Bay region, 1850 to 1993: Seismicity changesrelated to the occurrence of large and great earthquakes, J. Geophys.Res. 101, 765–789.
Johanson, I. A., and R. Burgmann (2005). Creep and quakes on thenorthern transition zone of the San Andreas fault from GPS andInSAR data, Geophys. Res. Lett. 32, L14306, doi: 10.1029/2005GL023150.
Kelson, K. I. (2001). Geologic characterization of the Calaveras fault as apotential seismic source, San Francisco Bay area, Calif. Div. MinesGeol. Spec. Publ. 212, 179–192.
Kelson, K. I., and J. N. Baldwin (2000a). Paleoseismic feasibility study ofthe northern Calaveras fault at Norris Canyon Road, San Ramon,California, Final Technical Report submitted to the U.S. GeologicalSurvey Bay Area Paleoseismological Experiment (BAPEX), ContractNumber 98WRCN1012, CLIN0012, 11 pp.
Kelson, K. I., and J. N. Baldwin (2000b). Paleoseismic feasibility study ofthe northern Calaveras fault at Forest Home Farm, San Ramon,California, Final Technical Report submitted to the U.S. GeologicalSurvey Bay Area Paleoseismological Experiment (BAPEX), ContractNumber 98WRCN1012, CLIN0013, 16 pp.
Kelson, K. I., and J. N. Baldwin (2000c). Paleoseismic feasibility study ofthe northern Calaveras fault at Martin Canyon, Dublin, California,Final Technical Report submitted to the U.S. Geological SurveyBay Area Paleoseismological Experiment (BAPEX), Contract Number98WRCN1012, CLIN0011, 15 pp.
Kelson, K. I., and C. E. Randolph (2000). Paleoseismic study of the northernCalaveras fault at 4120 Foothill Road, Pleasanton, California, FinalTechnical Report submitted to the U.S. Geological Survey Bay AreaPaleoseismological Experiment (BAPEX), Contract Number98WRCN1012, 21 pp.
Kelson, K. I., and S. T. Sundermann (2007). Digital compilation of northernCalaveras fault data for the Northern California Quaternary Fault MapDatabase, Final Technical Report submitted to the U.S. GeologicalSurvey NEHRP, Award No. 05HQGR0023; http://earthquake.usgs.gov/research/external/reports/05HQGR0023.pdf (last accessed Au-gust 2013).
Kelson, K. I., J. S. Hoeft, andM. Buga (2008). Assessment of possible surfacerupture on the northern Calaveras fault, eastern San Francisco Bay area,Final Technical Report, U.S. Geological Survey National EarthquakeHazards Reduction Program, Award Number 07HQGR0082, 37 pp,http://earthquake.usgs.gov/research/external/reports/07HQGR0082.pdf(last accessed August 2013).
Kelson, K. I., G. D. Simpson, W. R. Lettis, and C. Haraden (1996).Holocene slip rate and earthquake recurrence of the northern Calaverasfault at Leyden Creek, northern California, J. Geophys. Res. 101,5961–5975.
Kelson, K. I., R. Streig, R. D. Koehler, and K.-H. Kang (2006). Timing oflate Holocene paleoearthquakes on the northern San Andreas fault atthe Fort Ross Orchard site, Sonoma County, California, Bull. Seismol.Soc. Am. 95, 1012–1028.
20 D. P. Schwartz, J. J. Lienkaemper, S. Hecker, K. I. Kelson, T. E. Fumal, J. N. Baldwin, G. G. Seitz, and T. M. Niemi
BSSA Early Edition

Kenner, S., and P. Segall (1999). Time-dependence of the stressshadowing effect and its relation to structure of the lower crust,Geology 27, 119–122.
Knudsen, K. L., C. E. Garrison, J. N. Baldwin, G. A. Carver, and W. R.Lettis (1997). Evidence for earthquake-induced, rapid subsidence pre-served in estuarine sediment along the North Coast segment of the SanAndreas fault (abs.), GSA Abstr. Programs, 29, no. 6, 206.
Knudsen, K. L., R. C. Witter, C. E. Garrison-Laney, J. N. Baldwin, andG. A. Carver (2002). Past earthquake-induced rapid subsidence alongthe northern San Andreas fault: A paleoseismological method for in-vestigating strike-slip faults, Bull. Seismol. Soc. Am. 92, 2612–2636.
Koehler, R. D., R. C. Witter, G. D. Simpson, E. Hemphill-Haley, andW. R. Lettis (2005). Paleoseismic investigation of the northern SanGre-gorio fault, Half Moon Bay, California, Final Technical Report, U.S.Geological Survey National Earthquake Hazards Reduction Program,Award No. 04HQGR0045, 70 pp, http://earthquake.usgs.gov/research/external/reports/04HQGR0045.pdf (last accessed August 2013).
Lawson, A. C. (1908). The California Earthquake of April 18, 1906, Reportof the State Earthquake Investigation Commission, Vol. 1, CarnegieInst., Washington, 451 pp.
Lienkaemper, J. J., and C. Bronk Ramsey (2009). Oxcal: Versatile tool fordeveloping paleoearthquake chronologies—A primer, Seismol. Res.Lett. 80, 431–434.
Lienkaemper, J. J., and P. L. Williams (2007). A record of large earthquakeson the southern Hayward fault for the past 1800 years, Bull. Seismol.Soc. Am. 97, 1803–1819.
Lienkaemper, J. J., J. N. Baldwin, R. R. Sickler, R. Turner, and J. Brown(2013). A record of large earthquakes during the past two millennia onthe southern Green Valley fault, California, Bull. Seismol. Soc. Am.103, 2386–2403, doi: 10.1785/0120120198.
Lienkaemper, J. J., T. E. Dawson, S. F. Personius, G. G. Seitz, L. M. Reidy,and D. P. Schwartz (2002). A record of large earthquakes on thesouthern Hayward fault for the past 500 years, Bull. Seismol. Soc.Am. 92, 2637–2658.
Lienkaemper, J. J., F. S. McFarland, R. W. Simpson, R. G. Bilham, D. A.Ponce1, J. J. Boatwright, and S. J. Caskey (2012). Long-term creeprates on the Hayward fault: Evidence for controls on the size andfrequency of large earthquakes, Bull. Seismol. Soc. Am. 102, 31–41.
Lienkaemper, J. J., P. L. Williams, and T. P. Guilderson (2010). Evidence fora 12th large earthquake on the southern Hayward fault in the past 1900years, Bull. Seismol. Soc. Am. 100, 2024–2034.
Louderback, G. D. (1947). Central California earthquakes of the 1830’s,Bull. Seismol. Soc. Am. 37, 33–74.
Manighetti, I. M., M. Campillo, P. M. Mai, and G. King (2005). Evidence forself-similar, triangular slip distribution earthquakes: Implications forearthquake and fault mechanics, J. Geophys. Res. 110, no. B05409,doi: 10.1029/2004JB003174.
McFarland, F. S., J. J. Lienkaemper, S. J. Caskey, and K. Grove (2007). Datafrom theodolite measurements of creep rates on San Francisco Bayregion faults, California: 1979–2007, U.S. Geol. Surv. Open-File Rept.07-1367, 111 pp.
Mensing, S., and R. Byrne (1998). Pre-mission invasion of Erodiumcicutarium in California, J. Biogeogr. 25, 757–762.
Niemi, T. M., H. Zhang, S. Generaux, and T. Fumal (2004). A 2500-yearrecord of large earthquakes along the northern San Andreas fault atthe Vedanta marsh, Olema, CA, in Proceedings of the First AnnualNorthern California Earthquake Hazards Workshop, M. L. Zoback(Editor), 13–14 January 2004, USGS Open File Rept. 2004-1424,74 pp.
Parsons, T. (2002). Post-1906 stress recovery of the San Andreas faultsystem calculated from 3-D finite element analysis, J. Geophys.Res. 107, ESE 3-1–ESE 3-13.
Pollitz, F. R., and D. P. Schwartz (2008). Probabilistic seismic hazard in theSan Francisco Bay area based on a simplified viscoelastic-cycle,J. Geophys. Res. 113, no. B05409, doi: 10.1029/2007JB005227.
Prentice, C. S., and D. P. Schwartz (1991). Re-evaluation of 1906 surfacefaulting, 888 geomorphic expression, and seismic hazard along the
San Andreas fault in the 889 southern Santa Cruz Mountains, Bull.Seismol. Soc. Am. 81, 1424–1479.
Reasenberg, P. A., T. C. Hanks, and W. H. Bakun (2003). An empiricalmodel for earthquake probabilities in the San Francisco Bay region,California, Bull. Seismol. Soc. Am. 93, 1–13.
Reid, H. F. (1910). The Mechanics of the Earthquake, The CaliforniaEarthquake of April 18, 1906, Report of the State Investigation Commis-sion, 2, Carnegie Institution of Washington, Washington, D.C., 16–28.
Reidy, L. M. (2001). Evidence of environmental change over the last 2000years at Mountain Lake, in the northern San Francisco Peninsula,California, M.A. Thesis, University of California, Berkeley, 108 pp.
Schwartz, D. P. (2006). A look back at 1906—Perspectives on great earth-quakes and post-earthquake investigations, Seismol. Res. Lett. 77,123–127.
Schwartz, D. P., P. H. Haeussler, G. G. Seitz, and T. E. Dawson (2012). Whythe 2002 Denali fault rupture propagated onto the Totschunda fault:Implications for fault branching and seismic hazards, J. Geophys.Res. 117, no. B11304, doi: 10.1029/2011JB008918.
Schwartz, D. P., D. Pantosti, S. Hecker, K. Okumura, K. E. Budding, andT. Powers (1992). Late Holocene behavior and seismogenic potentialof the Rodgers Creek fault zone, Sonoma County, California, inG. Borchardt, S. E. Hirschfeld, J. J. Lienkaemper, P. McClellan,and I. G. Wong (Editors), Proc. of the Second Conference on Earth-quake Hazards in the Eastern San Francisco Bay Area, Calif. Div.Mines Geol. Spec. Publ., 113, 393–398.
Schwartz, D. P., D. Pantosti, K. Okumura, T. J. Powers, and J. Hamilton(1998). Paleoseismic investigations in the Santa Cruz Mountains,CA: Implications for recurrence of large magnitude earthquakes onthe San Andreas fault, J. Geophys. Res. 103, 17,985–18,001.
Sieh, K. E. (1978). Slip along the San Andreas fault associated with the great1857 earthquake, Bull. Seismol. Soc. Am. 68, 1421–1448.
Simpson, G. D., and K. L. Knudsen (2000). Paleoseismic investigation of thenorthern San Gregorio fault at the Pillar Point Marsh near Half MoonBay, California, Final Technical Report submitted to U.S. GeologicalSurvey Western Region, Bay Area Paleoseismological Experiment(BAPEX), Contract Number 98WRCN1012, CLIN0014, 34 pp.
Simpson, G. D., J. N. Baldwin, K. I. Kelson, and W. R. Lettis (1999). LateHolocene slip rate and earthquake history for the northern Calaverasfault at Welch Creek, eastern San Francisco Bay area, California, Bull.Seismol. Soc. Am. 89, 1250–1263.
Simpson, G. D., S. C. Thompson, J. S. Noller, and W. R. Lettis (1997). Thenorthern San Gregorio fault zone: Evidence for the timing of lateHolocene earthquakes near Seal Cove, California, Bull. Seismol.Soc. Am. 87, 1158–1170.
Simpson, R. W., and P. A. Reasenberg (1994). Earthquake-induced staticstress changes on central California faults, in The Loma Prieta,California, Earthquake of October 17, 1989—Tectonic Processesand Models, U.S. Geol. Surv. Prof. Pap. 1550-F, 55–89.
Sims, J. D. (1993). Parkfield area tectonic framework [abs.], in Summaries ofTechnical Reports, M. L. Jacobson (Editor), Vol. XXXIV, Prepared byparticipants in the National Earthquake Hazards Reduction Program,U.S. Geol. Surv. Open-File Rept. 93-195, 682–684.
Song, S. G., G. C. Beroza, and P. Segall (2008). A unified source model for the1906 San Francisco earthquake, Bull. Seismol. Soc. Am. 98, 823–831.
Streig, A. R., T. E. Dawson, and R. J. Weldon II (2014). Paleoseismicevidence of the 1890 and 1838 earthquakes on the Santa Cruz Moun-tains section of the San Andreas fault, near Corralitos, CA, Bull. Seis-mol. Soc. Am. 104, 285–300, doi: 10.1785/0120130009.
Sykes, L. R., and S. C. Jaume (1990). Seismic activity on neighboring faultsas a long-term precursor to large earthquakes in the San Francisco Bayarea, Nature 348, 595–599.
Sykes, L. R., and S. P. Nishenko (1984). Probabilities of occurrence oflarge plate rupturing earthquakes for the San Andreas, San Jacinto,and Imperial faults, California, 1983-2003, J. Geophys. Res. 89,5905–5927.
Thatcher, W., G. Marshall, and M. Lisowski (1997). Resolution offault slip along the 470-km-long rupture of the great 1906
The Earthquake Cycle in the San Francisco Bay Region: A.D. 1600–2012 21
BSSA Early Edition

San Francisco earthquake and its implications, J. Geophys. Res. 102,5353–5367.
Tocher, D. (1959). Seismic history of the San Francisco region, in San Fran-cisco Earthquakes of 1957,Calif. Div. Mines Geol. Spec. Rept. 57, 39–48.
Toppozada, T. R., and G. Borchardt (1998). Re-evaluation of the 1836 “Hay-ward Fault” and the 1838 San Andreas earthquakes, Bull. Seismol. Soc.Am. 88, 140–159.
Toppozada, T. R., C. R. Real, and D. L. Parke (1981). Preparation of iso-seismal maps and summaries of reported effects for pre-1900California earthquakes, Calif. Div. Mines Geol. Open-File Rept.81-11 SAC, 182 pp.
Townley, S. D., and M. W. Allen (1939). Descriptive catalog of earthquakesof the Pacific coast of the United States 1769 to 1928, Bull. Seismol.Soc. Am. 29, 1–297.
Tuttle, M. P., and L. R. Sykes (1992). Re-evaluation of several large historicearthquakes in the vicinity of the Loma Prieta and peninsular segments ofthe San Andreas fault, California, Bull. Seismol. Soc. Am. 82, 1802–1820.
Wald, D. W., H. Kanamori, D. V. Helmberger, and T. H. Heaton (1993).Source study of the 1906 San Francisco earthquake, Bull. Seismol.Soc. Am. 83, 981–1019.
Wells, D. L., and K. J. Coppersmith (1994). New empirical relationshipsamong magnitude, rupture length, rupture width, rupture area, and sur-face displacement, Bull. Seismol. Soc. Am. 84, 974–1002.
Wesnousky, S. G. (2008). Displacement and geometrical characteristics ofearthquake surface ruptures: Issues and implications for seismic hazardanalysis and the process of earthquake rupture, Bull. Seismol. Soc. Am.98, 1609–1632.
Wesson, R. L., W. H. Bakun, and D.M. Perkins (2003). Association of earth-quakes in San Francisco Bay area using Bayesian inference, Bull. Seis-mol. Soc. Am. 93, 1306–1332.
Working Group on California Earthquake Probabilities (WGCEP) (1988).Probabilities of large earthquakes occurring in California, U.S. Geol.Surv. Open-File Rept. 88-398, 62 pp.
Working Group on California Earthquake Probabilities (WGCEP) (1990).Probabilities of large earthquakes in the San Francisco Bay region,California, U.S. Geol. Surv. Circ. 1053, 51 pp.
Working Group on California Earthquake Probabilities (WGCEP) (1999).Earthquake probabilities in the San Francisco Bay region: 2000–2030, U.S. Geol. Surv. Open-File Rept. 99-517, 55 pp.
Working Group on California Earthquake Probabilities (WGCEP) (2003).Earthquake probabilities in the San Francisco Bay region: 2002–2031, U.S. Geol. Surv. Open-File Rept. 03-214, 235 pp., http://pubs.usgs.gov/of/2003/of03‑214/ (last accessed August 2013).
Working Group on California Earthquake Probabilities (WGCEP) (2008).The uniform California earthquake rupture forecast, U.S. Geol. Surv.Open-File Rept. 2007-1437, http://pubs.usgs.gov/of/2007/1437/ (lastaccessed August 2013).
Yu, E., and P. Segall (1996). Slip in the 1868 Hayward earthquake from theanalysis of historical triangulation data, J. Geophys. Res. 101, 16,101–16,118.
Zhang, H. (2005). Paleoseismic studies of the northern San Andreas fault atVedanta Marsh site, Olema, California, Ph.D. dissertation, Universityof Missouri-Kansas City, Kansas City, 334 pp.
Zhang, H., T. Niemi, and T. Fumal (2006). A 3000-year record of earth-quakes on the northern San Andreas fault at the Vedanta Marsh site,Olema, California, Seismol. Res. Lett. 77, 176.
Zielke, O., R. J. Arrowsmith, L. Grant Ludwig, and S. O. Akçiz (2010). Slipin the 1857 and earlier large earthquakes along the Carrizo Plain, SanAndreas fault, Science 327, 1119–1122.
Appendix A
Dating the Recent Surface Ruptures
This appendix provides detail of the observations and analy-ses that are used to develop the chronology of the surface-rup-
turing earthquakes in the San Francisco Bay Region (SFBR)since ∼1600. Surface ruptures that produce large moment-re-leasing earthquakes typically leave their signature at the surface.This is recorded as disruption of the stratigraphy exposed intrenches excavated across the faults. Paleoearthquake datesfor the SFBR primarily rely on the use of radiocarbon dating,with the most commonly available organic material being detri-tal charcoal. A single sample provides a mean age of the sampleand a counting uncertainty. This, in turn, is dendrochronologi-cally calendar corrected to provide the full possible age range ofthe sample, which is represented by a probability density func-tion (PDF). The ideal field situation is the occurrence of databledeposits immediately below and above a rupture event horizon,but even here the uncertainties in the age ranges of these unitscan be broad. By using radiocarbon PDFs for each horizon, theprobability distribution can be trimmed and reweighted using aradiocarbon calibration program such as OxCal (Bronk Ramsey,2001, 2007; Lienkaemper and Bronk Ramsey, 2009). The result,generally, is a tighter distribution from which a mean date of theevent and 1σ and 2σ uncertainty ranges can be extracted. Formany radiocarbon samples formed in the seventeenth and eigh-teenth centuries, the age-range probabilities can extend well intothe nineteenth and/or twentieth centuries. This is a potentialproblem for estimating the ages of the relatively young paleo-earthquakes considered here, particularly where a rupture offsetsa dated horizon and there is no unfaulted overlying deposit or thepostevent deposit is not datable. For this reason the founding ofthe Mission Dolores and Presidio provides a major time con-straint that allows radiocarbon PDFs to be truncated at 1776.
In addition to radiocarbon, the presence or absence ofnon-native pollen (Mensing and Byrne, 1998; Reidy, 2001)has provided a basis for event dating at some locations. Ofparticular importance is Erodium cicutarium, a non-nativepollen that first appeared in the SFBR about 1770 and wasubiquitous in the region by 1800. The presence or absenceof this pollen in critical deposits plays an important role indating SFBR paleoearthquakes that occurred between themid-late 1700s and early-middle 1800s.
The occurrence and dating of post-1600 earthquakes aredescribed below. For long faults such as the San Andreas andHayward–Rodgers Creek, where either absence of observationsor overlapping radiocarbon dates at different localities permitalternative rupture histories, we present these alternatives. Siteswhere event ages have been obtained are shown in Figure 2.The mean paleoearthquake dates and 2σ age ranges are listedin Table 2 and shown graphically in Figure 3. All dates given inthe following discussions, figures, and tables are in A.D. Thedescription of faults and fault segments follows the nomencla-ture developed by Working Group on California EarthquakeProbabilities (WGCEP) (2003) and shown in Figures 1 and 2.
San Andreas Fault
The San Andreas fault is the dominant active structuralelement in the SFBR. It has the highest slip rate and
22 D. P. Schwartz, J. J. Lienkaemper, S. Hecker, K. I. Kelson, T. E. Fumal, J. N. Baldwin, G. G. Seitz, and T. M. Niemi
BSSA Early Edition
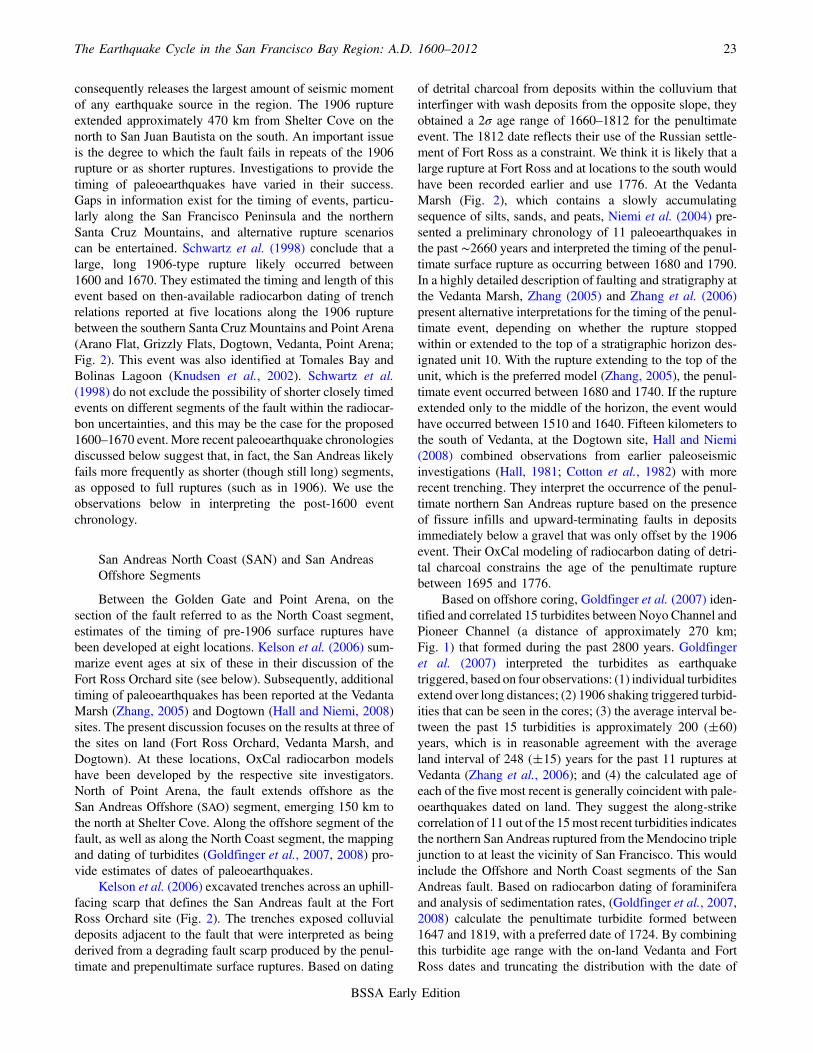
consequently releases the largest amount of seismic momentof any earthquake source in the region. The 1906 ruptureextended approximately 470 km from Shelter Cove on thenorth to San Juan Bautista on the south. An important issueis the degree to which the fault fails in repeats of the 1906rupture or as shorter ruptures. Investigations to provide thetiming of paleoearthquakes have varied in their success.Gaps in information exist for the timing of events, particu-larly along the San Francisco Peninsula and the northernSanta Cruz Mountains, and alternative rupture scenarioscan be entertained. Schwartz et al. (1998) conclude that alarge, long 1906-type rupture likely occurred between1600 and 1670. They estimated the timing and length of thisevent based on then-available radiocarbon dating of trenchrelations reported at five locations along the 1906 rupturebetween the southern Santa Cruz Mountains and Point Arena(Arano Flat, Grizzly Flats, Dogtown, Vedanta, Point Arena;Fig. 2). This event was also identified at Tomales Bay andBolinas Lagoon (Knudsen et al., 2002). Schwartz et al.(1998) do not exclude the possibility of shorter closely timedevents on different segments of the fault within the radiocar-bon uncertainties, and this may be the case for the proposed1600–1670 event. More recent paleoearthquake chronologiesdiscussed below suggest that, in fact, the San Andreas likelyfails more frequently as shorter (though still long) segments,as opposed to full ruptures (such as in 1906). We use theobservations below in interpreting the post-1600 eventchronology.
San Andreas North Coast (SAN) and San AndreasOffshore Segments
Between the Golden Gate and Point Arena, on thesection of the fault referred to as the North Coast segment,estimates of the timing of pre-1906 surface ruptures havebeen developed at eight locations. Kelson et al. (2006) sum-marize event ages at six of these in their discussion of theFort Ross Orchard site (see below). Subsequently, additionaltiming of paleoearthquakes has been reported at the VedantaMarsh (Zhang, 2005) and Dogtown (Hall and Niemi, 2008)sites. The present discussion focuses on the results at three ofthe sites on land (Fort Ross Orchard, Vedanta Marsh, andDogtown). At these locations, OxCal radiocarbon modelshave been developed by the respective site investigators.North of Point Arena, the fault extends offshore as theSan Andreas Offshore (SAO) segment, emerging 150 km tothe north at Shelter Cove. Along the offshore segment of thefault, as well as along the North Coast segment, the mappingand dating of turbidites (Goldfinger et al., 2007, 2008) pro-vide estimates of dates of paleoearthquakes.
Kelson et al. (2006) excavated trenches across an uphill-facing scarp that defines the San Andreas fault at the FortRoss Orchard site (Fig. 2). The trenches exposed colluvialdeposits adjacent to the fault that were interpreted as beingderived from a degrading fault scarp produced by the penul-timate and prepenultimate surface ruptures. Based on dating
of detrital charcoal from deposits within the colluvium thatinterfinger with wash deposits from the opposite slope, theyobtained a 2σ age range of 1660–1812 for the penultimateevent. The 1812 date reflects their use of the Russian settle-ment of Fort Ross as a constraint. We think it is likely that alarge rupture at Fort Ross and at locations to the south wouldhave been recorded earlier and use 1776. At the VedantaMarsh (Fig. 2), which contains a slowly accumulatingsequence of silts, sands, and peats, Niemi et al. (2004) pre-sented a preliminary chronology of 11 paleoearthquakes inthe past ∼2660 years and interpreted the timing of the penul-timate surface rupture as occurring between 1680 and 1790.In a highly detailed description of faulting and stratigraphy atthe Vedanta Marsh, Zhang (2005) and Zhang et al. (2006)present alternative interpretations for the timing of the penul-timate event, depending on whether the rupture stoppedwithin or extended to the top of a stratigraphic horizon des-ignated unit 10. With the rupture extending to the top of theunit, which is the preferred model (Zhang, 2005), the penul-timate event occurred between 1680 and 1740. If the ruptureextended only to the middle of the horizon, the event wouldhave occurred between 1510 and 1640. Fifteen kilometers tothe south of Vedanta, at the Dogtown site, Hall and Niemi(2008) combined observations from earlier paleoseismicinvestigations (Hall, 1981; Cotton et al., 1982) with morerecent trenching. They interpret the occurrence of the penul-timate northern San Andreas rupture based on the presenceof fissure infills and upward-terminating faults in depositsimmediately below a gravel that was only offset by the 1906event. Their OxCal modeling of radiocarbon dating of detri-tal charcoal constrains the age of the penultimate rupturebetween 1695 and 1776.
Based on offshore coring, Goldfinger et al. (2007) iden-tified and correlated 15 turbidites between Noyo Channel andPioneer Channel (a distance of approximately 270 km;Fig. 1) that formed during the past 2800 years. Goldfingeret al. (2007) interpreted the turbidites as earthquaketriggered, based on four observations: (1) individual turbiditesextend over long distances; (2) 1906 shaking triggered turbid-ities that can be seen in the cores; (3) the average interval be-tween the past 15 turbidities is approximately 200 (�60)years, which is in reasonable agreement with the averageland interval of 248 (�15) years for the past 11 ruptures atVedanta (Zhang et al., 2006); and (4) the calculated age ofeach of the five most recent is generally coincident with pale-oearthquakes dated on land. They suggest the along-strikecorrelation of 11 out of the 15most recent turbidities indicatesthe northern San Andreas ruptured from theMendocino triplejunction to at least the vicinity of San Francisco. This wouldinclude the Offshore and North Coast segments of the SanAndreas fault. Based on radiocarbon dating of foraminiferaand analysis of sedimentation rates, (Goldfinger et al., 2007,2008) calculate the penultimate turbidite formed between1647 and 1819, with a preferred date of 1724. By combiningthis turbidite age range with the on-land Vedanta and FortRoss dates and truncating the distribution with the date of
The Earthquake Cycle in the San Francisco Bay Region: A.D. 1600–2012 23
BSSA Early Edition

San Francisco mission construction (given, without discus-sion, as 1769 as opposed to 1776), Goldfinger et al. (2008)conclude the penultimate earthquake occurred between1700 and 1750.
Peninsula San Andreas
This section of the San Andreas fault, as defined byWGCEP (1999, 2003) extends approximately 85 km fromthe Golden Gate to the north end of the Santa Cruz Moun-tains near Los Gatos (Fig. 2). There are no well-constrainedgeologic observations for either the historical or paleoseis-mic record, and the Peninsula San Andreas (SAP) presentsa major gap in the Bay Area earthquake history. The histori-cal 1838 earthquake has been attributed to this section of theSan Andreas (Louderback, 1947; WGCEP, 1988, 1990).Sykes and Nishenko (1984), Tuttle and Sykes (1992), andToppozada and Borchardt (1998) compared intensity obser-vations at Monterey from the 1838, 1906, and 1989 (LomaPrieta) earthquakes, and all conclude that the 1838 ruptureextended from the San Francisco Peninsula into the SantaCruz Mountains and possibly as far south as San Juan Bau-tista. Tuttle and Sykes (1992) estimated a magnitude ofM ≥7:2, and Toppozada and Borchardt (1998) estimatedan M ∼ 7:5. Bakun (1999) presents a thorough discussionof these issues. Using the same intensity reports, Bakun(1999) interprets the Peninsula segment as a high-probabilitysource for the earthquake but estimates a smaller magnitudeof M 6.8 (M 6.3–7.2 at 95% confidence range).
Geological studies have yet to show conclusivelywhether the 1838 earthquake was or was not produced byrupture of the SAP. Hall et al. (1999) reconstructed buriedstream channels offset by the San Andreas fault at the Filolisite (Fig. 2). They conclude that a channel with a radiocarbonage of 330� 200 years B.P. is offset to 4:1� 0:5 m. This isinterpreted as recording 2.5 m (�0:2) of surface slip thatoccurred at this location in 1906 and 1:6� 0:7 m of slipin the penultimate rupture, which they contend is 1838.Although the 1.6 m mean offset is consistent with theBakun (1999) magnitude suggested for 1838, the radiocar-bon dating provides no absolute constraint. Based onthese observations, we assign the 1838 event to the SAP,noting that there is significant uncertainty in this interpre-tation.
A possible earlier rupture is even less clear. Hall et al.(1999) identify fault-parallel channels in the Filoli trenches.They speculate that these channels, in contrast to those thatcross the fault, likely formed in response to local topographyproduced by the rupture that diverted channel flow. Althoughthis interpretation is permissive, it is highly uncertain. Basedon the radiocarbon dating of detrital charcoal from oneof the fault-parallel channels, Hall et al. (1999) concludethat they formed within or slightly after the interval of1450–1670.
Santa Cruz Mountains Segment (SAS)/San JuanBautista Segment
The Santa Cruz Mountains segment of the San Andreas,as defined by WGCEP (2003), extends 62 km (�15) fromthe north end of the Loma Prieta aftershock zone near LosGatos to the south end of the 1906 rupture at San Juan Bau-tista. The Working Group placed a �5 km uncertainty onthis southeast end point (Fig. 2). As originally defined,the segment includes the transition from a locked to a creep-ing section of the fault along its southern 15 km. Johansonand Burgmann (2005) use Global Positioning System andInterferometric Synthetic Aperture Radar data to proposea 46 km long transition zone from a locked to a fully creepingSan Andreas fault, similar to the Parkfield transition zone,that they name the San Juan Bautista (SJB) segment. It ex-tends from 16 km north of San Juan Bautista to 30 km southof it and encompasses the southern part of the WGCEP(2003) Santa Cruz Mountains segment. We have adopted thisinterpretation and modified the WGCEP (2003) segmenta-tion to make a significantly longer (20 km) zone of uncer-tainty as to where ruptures associated with each segmentare likely to extend (Figs. 1, 2).
Johanson and Burgmann (2005) suggest the San JuanBautista segment is accumulating strain energy at the rateof one M 6.3–6.7 per century. Because the southern boun-dary of our SFBR rectangle is located just south of San JuanBautista, the overall area of the SJB segment does not affectseismic moment in our analysis, but its modeled rupturebehavior has implications for interpretation of paleoseismicobservations. The timing of surface ruptures since 1600 forthe Santa Cruz Mountains and San Juan Bautista segments ofthe San Andreas fault relies on observations at Grizzly Flats(Schwartz et al., 1998), Mill Canyon (Fumal, Dawson, et al.,2004; Fumal, 2012), Arano Flat (Fumal et al., 2003; Fumal,Heingartner, Samrad, et al., 2004), and Hazel Dell (Streiget al., 2014) (Fig. 2). Grizzly Flats is located 16 km northof the transition from creeping to locked fault, and HazelDell is 10 km to the north of it. The Mill Canyon and Aranoflat sites are located 2 km and 1 km, respectively, north of thetransition (Fig. 2).
At Grizzly Flats, Schwartz et al. (1998) interpreted aseries of alluvial sands and silts deposited since the mid-1660s to be offset, within the resolution of the trenchexposures, by only the 1906 rupture. The oldest unit in thisstratigraphic sequence is dated at 1640–1659 with 100% ofthe probability within this range. This unusually tight rangewas obtained by combining the ages of all samples in thedeposit to calculate a weighted mean age, and then calibrat-ing the weighted mean. This method (Gillespie, 1984)resulted in a large reduction in the sample age uncertaintyand the ensuing narrow age range for the deposit (averagingof radiocarbon dates is not presently used in OxCal model-ing). The age of the penultimate event is not directlyconstrained by subsurface observations at Grizzly Flats.Jacoby (1995) identified a redwood stump located on the
24 D. P. Schwartz, J. J. Lienkaemper, S. Hecker, K. I. Kelson, T. E. Fumal, J. N. Baldwin, G. G. Seitz, and T. M. Niemi
BSSA Early Edition

fault just south of the Grizzly Flats trenches. His analysis ofa tree-ring core obtained from the stump showed wide treerings just prior to an abrupt decrease in ring width. Jacoby(1995) interprets the growth change to be the result of surfacerupture affecting the tree. He dated the wide rings at220� 50 yr B:P:, which yielded a preferred 2σ range of1632–1822. Schwartz et al. (1998) combined the trenchand tree-ring observations and placed the penultimate rupturebetween 1632 and 1659. They note that, because of analyticand stratigraphic uncertainties, the interval may be too nar-row and refer to the penultimate event as a mid-1600s earth-quake. With current calibration curves such as Calib 7.0 (seeData and Resources), the original radiocarbon date of the treerings yields a 2σ age range of 1520–1592 (0.085), 1619–1700 (0.315), 1703–1705 (0.001), 1727–1819 (0.425),1832–1880 (0.048), and 1915–1950 (0.126).
The Mill Canyon and Arano Flat sites, 15.0 and 16.0 kmsouth of Grizzly Flats (Fig. 2), respectively, have a combinedpaleoseismic record that shows evidence of at least nine rup-tures during the past approximately 1000 years (Fumal et al.,2003; Fumal, Dawson, et al., 2004; Fumal, Heingartner, Sam-rad, et al., 2004). At Mill Canyon (Fumal, 2012), the mostrecent surface-rupturing event is the 1906 San Francisco earth-quake, and it is well expressed as a series of in-filled fissuresand small scarps. In addition to that of 1906, evidence wasfound for three surface-rupturing earthquakes since about1500. Radiocarbon ages of detrital charcoal suggest an ageof the penultimate earthquake of 1711–1770, with a mean dateof 1750. Support for this age comes from a 1.5 m deep fissurethat formed during this earthquake. It was sampled forErodium pollen, which was not found and would have beenpresent at this site in 1838 in the fill of any fissure formedduring an earthquake of that vintage (Fumal, Heingartner,Samrad, et al., 2004). Fumal (2012) favors this interpretationbut also offers an alternative model for this event of 1789–1904, suggesting that it could be either the 1838 or 1865SFBR earthquakes. The prepenultimate rupture at Mill Canyonwas initially dated between 1600 and 1680, with a mean dateof this rupture at 1640 (Fumal, Dawson, et al., 2004) and re-vised to 1660–1720 with a mean date of 1690 (Fumal, 2012).Additionally, Fumal (2012) uses OxCal to model the radiocar-bon dates from Grizzly Flats and presents his own structuralinterpretation of the trench logs. He suggests that in addition tothe 1906 event, there could be two other ruptures, one ofwhich correlates with the penultimate event at Mill Canyon.
At Arano Flat, faulting is expressed as a 1–2 m wide zonethat deforms alluvial fan deposits overlying well-beddedstream overbank deposits. The trenches at this location wereinterpreted to contain evidence for at least nine surface-fault-ing earthquakes since about 1000 (Fumal, Dawson, et al.,2004; Fumal, Heingartner, Samrad, et al., 2004). Evidencefor ground-rupturing events includes in-filled fissures, foldingwith growth strata, and multiple upward terminations of faulttraces. Subsequent to the investigations noted above, addi-tional OxCal modeling of dates was undertaken (T. Fumal,written comm., 2010), which dated the penultimate rupture
at Arano Flat between 1721 and 1785 (2σ), with a mean dateof 1753. This appears to be the same event as Mill Canyon.For the third event back at Arano Flat, the revised analysisdates the rupture at 1624 with a 2σ age range of 1584–1659.
Streig et al. (2014) excavated trenches across theSanAndreas fault at the Hazel Dell site, 6 km south of GrizzlyFlats. They report the occurrence of four surface-faulting eventsthrough a sequence of stream overbank deposits. On the basisof wood chips in their unit 400a, which are interpreted as beingaxe cut, and historical review of the redwood logging history ofthat area, they interpret the three most recent events as histori-cal, with the prepenultimate being the rupture from the 1838earthquake. They conclude that a younger rupture representsthe 1890 earthquake, for which surface rupture is known atSan JuanBautista (Lawson, 1908) and at least 3 km to the northof it (Prentice and Schwartz, 1991). The most recent event is1906. With this working chronology, Streig et al. (2014)reinterpret the event chronology at Arano Flat andMill Canyonto include 1838 and 1890 and suggest that at least the 1838rupture is present at Grizzly Flats.
San Andreas: Summary
Significant effort has been spent on obtaining dates ofpaleoearthquakes along the 1906 rupture of the San Andreasfault. On the North Coast segment, there appears to be a con-vergence of dating estimates from multiple sites, includingfrom offshore turbidite analysis, which indicates there hasbeen one large surface rupture along it between 1660 and1776. Two-sigma age ranges at three land sites (and fromoffshore) indicate the rupture did not occur earlier than 1660and suggest a more likely occurrence time in the 1700s.There does not appear to be a statistical basis for specifyinga mean date for the event, and we place it at the midpoint ofthe range, which is 1735.
The Peninsula segment of the San Andreas fault remainsan enigma and a data gap. As discussed, we assign the 1838event to the Peninsula San Andreas, noting that there is sig-nificant uncertainty in this interpretation. There is no firmbasis at present to identify, let alone date, older events onthe Peninsula. Based on radiocarbon dating of detrital char-coal from a fault-parallel channel that may have beendiverted by surface faulting, Hall et al. (1999) suggest thatan event occurred within or slightly after the 1450–1670 in-terval. Even if the interpretation is correct, the range is highlyunconstrained, although we place a tentative date of 1600(shown as a dashed line) to allow for the possibility of itsoccurrence as part of the maximum source model (Fig. 3b).
For most of the length of the Santa Cruz Mountains seg-ment, there are no paleoseismic data. The evolving and alter-native interpretations of both timing and extent of rupture atits southern end, at or near the transition to the creeping SanJuan Bautista segment, are summarized above. The effects ofthese alternatives on the moment sums and moment rates de-veloped in the present paper are noted here. If the 1838 rup-ture is at Hazel Dell and it extended onto the Peninsula
The Earthquake Cycle in the San Francisco Bay Region: A.D. 1600–2012 25
BSSA Early Edition
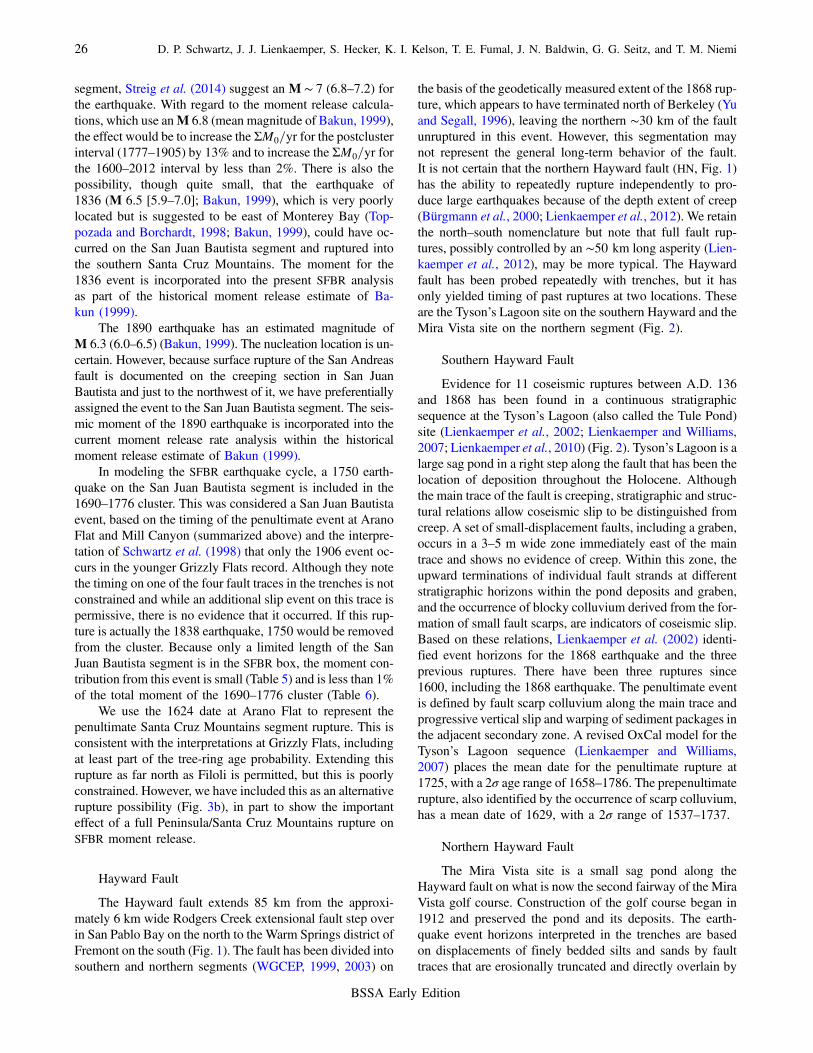
segment, Streig et al. (2014) suggest an M ∼ 7 (6.8–7.2) forthe earthquake. With regard to the moment release calcula-tions, which use anM 6.8 (mean magnitude of Bakun, 1999),the effect would be to increase the ΣM0=yr for the postclusterinterval (1777–1905) by 13% and to increase the ΣM0=yr forthe 1600–2012 interval by less than 2%. There is also thepossibility, though quite small, that the earthquake of1836 (M 6.5 [5.9–7.0]; Bakun, 1999), which is very poorlylocated but is suggested to be east of Monterey Bay (Top-pozada and Borchardt, 1998; Bakun, 1999), could have oc-curred on the San Juan Bautista segment and ruptured intothe southern Santa Cruz Mountains. The moment for the1836 event is incorporated into the present SFBR analysisas part of the historical moment release estimate of Ba-kun (1999).
The 1890 earthquake has an estimated magnitude ofM 6.3 (6.0–6.5) (Bakun, 1999). The nucleation location is un-certain. However, because surface rupture of the San Andreasfault is documented on the creeping section in San JuanBautista and just to the northwest of it, we have preferentiallyassigned the event to the San Juan Bautista segment. The seis-mic moment of the 1890 earthquake is incorporated into thecurrent moment release rate analysis within the historicalmoment release estimate of Bakun (1999).
In modeling the SFBR earthquake cycle, a 1750 earth-quake on the San Juan Bautista segment is included in the1690–1776 cluster. This was considered a San Juan Bautistaevent, based on the timing of the penultimate event at AranoFlat and Mill Canyon (summarized above) and the interpre-tation of Schwartz et al. (1998) that only the 1906 event oc-curs in the younger Grizzly Flats record. Although they notethe timing on one of the four fault traces in the trenches is notconstrained and while an additional slip event on this trace ispermissive, there is no evidence that it occurred. If this rup-ture is actually the 1838 earthquake, 1750 would be removedfrom the cluster. Because only a limited length of the SanJuan Bautista segment is in the SFBR box, the moment con-tribution from this event is small (Table 5) and is less than 1%of the total moment of the 1690–1776 cluster (Table 6).
We use the 1624 date at Arano Flat to represent thepenultimate Santa Cruz Mountains segment rupture. This isconsistent with the interpretations at Grizzly Flats, includingat least part of the tree-ring age probability. Extending thisrupture as far north as Filoli is permitted, but this is poorlyconstrained. However, we have included this as an alternativerupture possibility (Fig. 3b), in part to show the importanteffect of a full Peninsula/Santa Cruz Mountains rupture onSFBR moment release.
Hayward Fault
The Hayward fault extends 85 km from the approxi-mately 6 km wide Rodgers Creek extensional fault step overin San Pablo Bay on the north to the Warm Springs district ofFremont on the south (Fig. 1). The fault has been divided intosouthern and northern segments (WGCEP, 1999, 2003) on
the basis of the geodetically measured extent of the 1868 rup-ture, which appears to have terminated north of Berkeley (Yuand Segall, 1996), leaving the northern ∼30 km of the faultunruptured in this event. However, this segmentation maynot represent the general long-term behavior of the fault.It is not certain that the northern Hayward fault (HN, Fig. 1)has the ability to repeatedly rupture independently to pro-duce large earthquakes because of the depth extent of creep(Bürgmann et al., 2000; Lienkaemper et al., 2012). We retainthe north–south nomenclature but note that full fault rup-tures, possibly controlled by an ∼50 km long asperity (Lien-kaemper et al., 2012), may be more typical. The Haywardfault has been probed repeatedly with trenches, but it hasonly yielded timing of past ruptures at two locations. Theseare the Tyson’s Lagoon site on the southern Hayward and theMira Vista site on the northern segment (Fig. 2).
Southern Hayward Fault
Evidence for 11 coseismic ruptures between A.D. 136and 1868 has been found in a continuous stratigraphicsequence at the Tyson’s Lagoon (also called the Tule Pond)site (Lienkaemper et al., 2002; Lienkaemper and Williams,2007; Lienkaemper et al., 2010) (Fig. 2). Tyson’s Lagoon is alarge sag pond in a right step along the fault that has been thelocation of deposition throughout the Holocene. Althoughthe main trace of the fault is creeping, stratigraphic and struc-tural relations allow coseismic slip to be distinguished fromcreep. A set of small-displacement faults, including a graben,occurs in a 3–5 m wide zone immediately east of the maintrace and shows no evidence of creep. Within this zone, theupward terminations of individual fault strands at differentstratigraphic horizons within the pond deposits and graben,and the occurrence of blocky colluvium derived from the for-mation of small fault scarps, are indicators of coseismic slip.Based on these relations, Lienkaemper et al. (2002) identi-fied event horizons for the 1868 earthquake and the threeprevious ruptures. There have been three ruptures since1600, including the 1868 earthquake. The penultimate eventis defined by fault scarp colluvium along the main trace andprogressive vertical slip and warping of sediment packages inthe adjacent secondary zone. A revised OxCal model for theTyson’s Lagoon sequence (Lienkaemper and Williams,2007) places the mean date for the penultimate rupture at1725, with a 2σ age range of 1658–1786. The prepenultimaterupture, also identified by the occurrence of scarp colluvium,has a mean date of 1629, with a 2σ range of 1537–1737.
Northern Hayward Fault
The Mira Vista site is a small sag pond along theHayward fault on what is now the second fairway of the MiraVista golf course. Construction of the golf course began in1912 and preserved the pond and its deposits. The earth-quake event horizons interpreted in the trenches are basedon displacements of finely bedded silts and sands by faulttraces that are erosionally truncated and directly overlain by
26 D. P. Schwartz, J. J. Lienkaemper, S. Hecker, K. I. Kelson, T. E. Fumal, J. N. Baldwin, G. G. Seitz, and T. M. Niemi
BSSA Early Edition

unfaulted deposits (Hayward Fault Paleoearthquake Group,1999). These faults with brittle slip and no apparent creep areimmediately east of the main creeping trace in a structuralsetting similar to that adjacent to the main creeping trace atTyson’s Lagoon. The Hayward Fault Paleoearthquake Group(1999) interpreted a minimum of four to seven surface rup-tures during the past 2400 years, acknowledging uncertaintyin the completeness of the stratigraphic and earthquake rec-ord in the sag pond. However, evidence for the most recentevent is among the best at this location. It is expressed by afissure infill and five small (2–5 cm) individual vertical dis-placements of a stratigraphic contact, all of which are cappedby unfaulted colluvium. The mean date of the most recentevent at Mira Vista is 1705. The 2σ age range is 1635–1776; the 1σ range for this date is 1665–1776. The timingof the most recent event at the Mira Vista site and the penul-timate event at the Tule Pond overlap and may very likelyrepresent a rupture of the full Hayward fault.
Rodgers Creek Fault
The Rodgers Creek fault is a northern continuation ofthe Hayward fault. It extends 63 km (�10) from San PabloBay to about 10 km south of Healdsburg (Fig. 1). The faulthas not produced a large historical rupture. The most recentlarge surface rupture is expressed as geomorphically freshscarplets and short sections of mole track with left-steppingReidel shears and extension fractures that occur intermit-tently along at least 35 km of the fault.
Paleoseismic trenches on the south-central reach of theRodgers Creek (RC) fault at the Triangle G site (Fig. 2) pro-vide the basis for dating the most recent surface rupture(Hecker et al., 2005). These exposed both offset and un-faulted overbank and channel deposits that constrain the tim-ing of the most recent large rupture. Using a range ofcharcoal sample ordering sequences, Hecker et al. (2005)ran four OxCal chronological models. With the 1776 Mis-sion Dolores timing constraint at the younger end, theseshow that at 2σ the most recent large rupture occurred noearlier than 1690. The preferred model places the most recentevent at no older than 1715, with the probability distributionasymmetric and weighted toward the historical period.The mean date for the event is 1745. At 1σ, the probabilitydistribution begins at 1750. If the historical constraint ischanged to 1824, the date of the founding of the nearbySonomaMission, 95% of the age distribution is no older than1740. In addition non-native pollen is absent in the most re-cently faulted deposit and makes its first appearance in theoverlying unfaulted units. This is consistent with the pro-posed mid-eighteenth century date.
The timing of the most recent event at the Triangle G siteoverlaps the timing of the most recent event at the Mira Vistasite on the northern Hayward and the penultimate event onthe southern Hayward at the Tyson’s Lagoon, allowing the
possibility that both faults could have ruptured at the sametime (WGCEP, 2003; Hecker et al., 2005).
San Gregorio Fault
The San Gregorio (SG) fault extends fromMonterey Bayon the south 110 km northward to a likely intersection withthe San Andreas fault south of Bolinas Lagoon (Fig. 1). Fortwo-thirds of its length, the fault is underwater, leaving fewlocations for obtaining paleoseismic data. The primary sitesfor the timing of past large earthquakes are at Seal Cove andPillar Point Marsh (Fig. 2).
Initial investigation of the timing of paleoearthquakeswas undertaken by Simpson et al. (1997). They exposedevidence of the past two surface-faulting earthquakes intrenches excavated at Seal Cove. The most recent rupture off-sets a Native American cooking hearth dated at 1270–1400.They conclude that it occurred within or more recently than adate in this range and 1775 (their stated arrival date of Span-ish missionaries). Based on upward fault terminations in thetrench exposures, Simpson et al. (1997) interpret the penul-timate event to have occurred between 600 and 1400.
Pillar Point Marsh is a small graben along an extensionalstep in the SG fault 2.5 km south of Seal Cove (Fig. 2).Coring of the marsh deposits (Simpson and Knudsen, 2000)revealed a buried peat layer about 1.5 m below the presentmarsh surface. A sharp contact between the peat and over-lying organic-poor mud, coupled with the presence of a fossiltidal flat diatom assemblage in the mud and a fresh waterassemblage in deposits below the peat, led Simpson andKnudsen (2000) to conclude that the peat was buried as aresult of rapid sea level change. They interpret this as coseis-mic subsidence during the most recent rupture of the SGfault, similar to what was observed at Bolinas Lagoon andTomales Bay in 1906 (Knudsen et al., 1997, 2002). Initialdating of the peat indicated burial between 1640 and 1776(2σ), with a possible shorter interval of 1685–1776.
Building on this, Koehler et al. (2005) conducted exten-sive additional coring of the marsh, as well as trenching at thenorth end. They found five buried peats in the marshstratigraphy. Based on changes in diatom paleoecology, theyconclude that tectonic subsidence has resulted in submer-gence of the Pillar Point Marsh and burial of peat soils(interpreted to represent former subareal marsh surfaces),two to four times during the past 4150–4410 cal yr B.P. Theyoungest peat (labeled “peat 1” on their fig. 6 and the samepeat identified by Simpson andKnudsen, 2000) is found in allcores and is overlain across the entire marsh by a silty loam.The abrupt transition from fresh–brackish water diatoms inthe peat to a low-marsh tidal flat environment in the loamindicates rapid sea level rise associated with submergenceof the peat to a lower tidal level. Koehler et al. (2005)develop a set of criteria to rate the likelihood that each peatrepresents coseismic subsidence. This includes the presenceof an abrupt lithologic contact, diatom evidence for abrupt sea
The Earthquake Cycle in the San Francisco Bay Region: A.D. 1600–2012 27
BSSA Early Edition
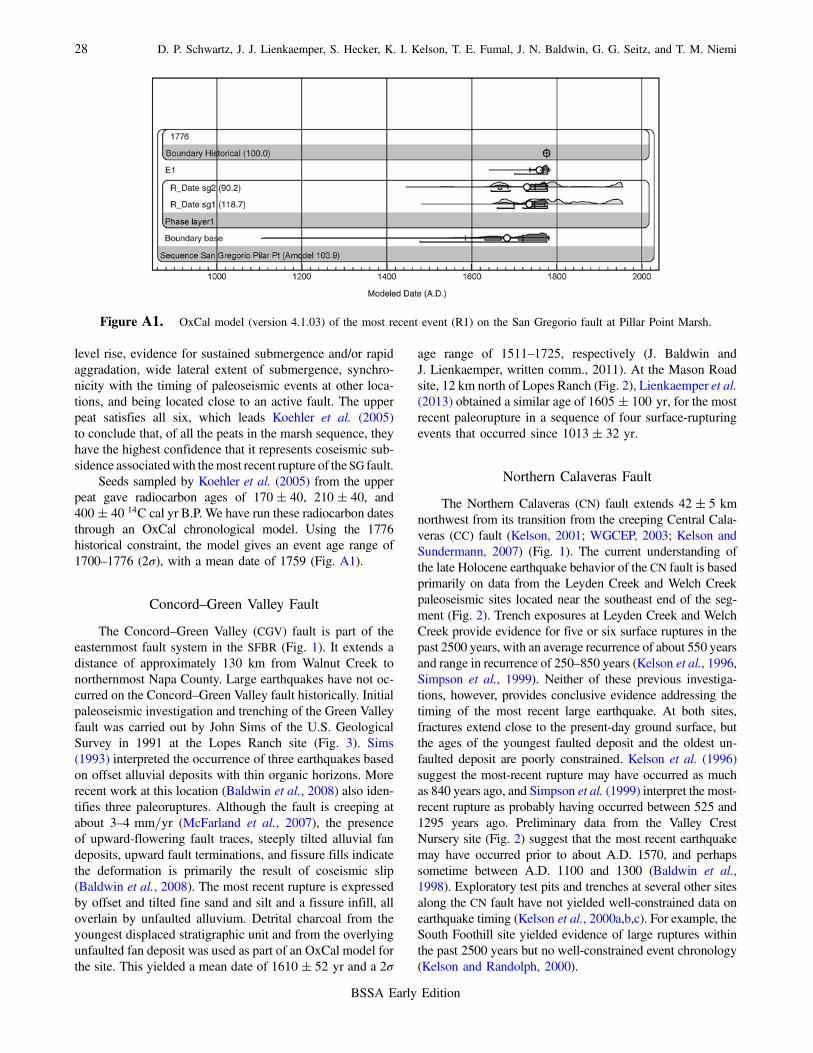
level rise, evidence for sustained submergence and/or rapidaggradation, wide lateral extent of submergence, synchro-nicity with the timing of paleoseismic events at other loca-tions, and being located close to an active fault. The upperpeat satisfies all six, which leads Koehler et al. (2005)to conclude that, of all the peats in the marsh sequence, theyhave the highest confidence that it represents coseismic sub-sidence associatedwith themost recent rupture of the SG fault.
Seeds sampled by Koehler et al. (2005) from the upperpeat gave radiocarbon ages of 170� 40, 210� 40, and400� 40 14C cal yr B.P. We have run these radiocarbon datesthrough an OxCal chronological model. Using the 1776historical constraint, the model gives an event age range of1700–1776 (2σ), with a mean date of 1759 (Fig. A1).
Concord–Green Valley Fault
The Concord–Green Valley (CGV) fault is part of theeasternmost fault system in the SFBR (Fig. 1). It extends adistance of approximately 130 km from Walnut Creek tonorthernmost Napa County. Large earthquakes have not oc-curred on the Concord–Green Valley fault historically. Initialpaleoseismic investigation and trenching of the Green Valleyfault was carried out by John Sims of the U.S. GeologicalSurvey in 1991 at the Lopes Ranch site (Fig. 3). Sims(1993) interpreted the occurrence of three earthquakes basedon offset alluvial deposits with thin organic horizons. Morerecent work at this location (Baldwin et al., 2008) also iden-tifies three paleoruptures. Although the fault is creeping atabout 3–4 mm=yr (McFarland et al., 2007), the presenceof upward-flowering fault traces, steeply tilted alluvial fandeposits, upward fault terminations, and fissure fills indicatethe deformation is primarily the result of coseismic slip(Baldwin et al., 2008). The most recent rupture is expressedby offset and tilted fine sand and silt and a fissure infill, alloverlain by unfaulted alluvium. Detrital charcoal from theyoungest displaced stratigraphic unit and from the overlyingunfaulted fan deposit was used as part of an OxCal model forthe site. This yielded a mean date of 1610� 52 yr and a 2σ
age range of 1511–1725, respectively (J. Baldwin andJ. Lienkaemper, written comm., 2011). At the Mason Roadsite, 12 km north of Lopes Ranch (Fig. 2), Lienkaemper et al.(2013) obtained a similar age of 1605� 100 yr, for the mostrecent paleorupture in a sequence of four surface-rupturingevents that occurred since 1013� 32 yr.
Northern Calaveras Fault
The Northern Calaveras (CN) fault extends 42� 5 kmnorthwest from its transition from the creeping Central Cala-veras (CC) fault (Kelson, 2001; WGCEP, 2003; Kelson andSundermann, 2007) (Fig. 1). The current understanding ofthe late Holocene earthquake behavior of the CN fault is basedprimarily on data from the Leyden Creek and Welch Creekpaleoseismic sites located near the southeast end of the seg-ment (Fig. 2). Trench exposures at Leyden Creek and WelchCreek provide evidence for five or six surface ruptures in thepast 2500 years, with an average recurrence of about 550 yearsand range in recurrence of 250–850 years (Kelson et al., 1996,Simpson et al., 1999). Neither of these previous investiga-tions, however, provides conclusive evidence addressing thetiming of the most recent large earthquake. At both sites,fractures extend close to the present-day ground surface, butthe ages of the youngest faulted deposit and the oldest un-faulted deposit are poorly constrained. Kelson et al. (1996)suggest the most-recent rupture may have occurred as muchas 840 years ago, and Simpson et al. (1999) interpret the most-recent rupture as probably having occurred between 525 and1295 years ago. Preliminary data from the Valley CrestNursery site (Fig. 2) suggest that the most recent earthquakemay have occurred prior to about A.D. 1570, and perhapssometime between A.D. 1100 and 1300 (Baldwin et al.,1998). Exploratory test pits and trenches at several other sitesalong the CN fault have not yielded well-constrained data onearthquake timing (Kelson et al., 2000a,b,c). For example, theSouth Foothill site yielded evidence of large ruptures withinthe past 2500 years but no well-constrained event chronology(Kelson and Randolph, 2000).
Figure A1. OxCal model (version 4.1.03) of the most recent event (R1) on the San Gregorio fault at Pillar Point Marsh.
28 D. P. Schwartz, J. J. Lienkaemper, S. Hecker, K. I. Kelson, T. E. Fumal, J. N. Baldwin, G. G. Seitz, and T. M. Niemi
BSSA Early Edition

Research on the timing of ruptures on the CN faultoccurred at the North Foothill site (Kelson et al., 2008)(Fig. 2), which included multiple trench exposures contain-ing a well-developed shear fabric that extends upward fromthe prominent bedrock fault zone and into prehistorical andhistorical deposits. Three distinct gravel-filled paleochannelsare deformed within the fault zone, and evidence for recentsurface rupture at this site is based on deformation of pale-ochannel deposits along a noncreeping, secondary reverse-oblique fault strand. Based on the trench exposures andlimited age estimates from radiocarbon dating of detritalcharcoal in the offset paleochannels, Kelson et al. (2008)conclude the most recent surface rupture along the CN faultappears to have occurred between 1660 and 1776. We haverun the paleochannel radiocarbon date through OxCal(Fig. A2). This gives a mean date of 1740 and a 2σ eventrange of 1692–1778, with the probability distributionskewed toward the historical period.
Appendix B
Observations of Paleo Offsets on SFBR Faults
San Andreas Fault
Large historical surface ruptures provide important cal-ibration for recognizing and measuring offsets from priorruptures, particularly at geomorphic piercing points suchas gullies or small channels. The 1906 San Andreas ruptureis estimated to have had a length of about 470 km (Thatcheret al., 1997; Song et al., 2008); however, about 60% occurredoffshore. A review of the description of surface faultingdocumented in Lawson (1908) shows there are 36 locations,primarily fences and roads, where the amount of 1906 sur-face offset is reported or can be estimated; of these, only 20are reliable measurements (Schwartz, 2006). Given thedearth of 1906 geomorphic offsets, it is not surprising thatstudies along the 1906 rupture have not reported small chan-nels or other surface features that show cumulative offsets forthe past several earthquakes such as observed, for example,along the San Andreas fault in the Carrizo Plain (Sieh, 1978;Zielke et al., 2010).
There are, however, some offset estimates from paleo-seismic studies. Baldwin et al. (2000) exposed a buriedpaleochannel margin in trenches excavated parallel to theSan Andreas fault at Alder Creek near Point Arena on theNorth Coast segment (Fig. 2). They interpret the channelto be offset by two ruptures, 1906 and the penultimate. Theymeasured a net offset of the channel margin of 8.0–9.5 m.Baldwin et al. (2000) note that in 1906 a 4.9 m offset wasreported 1.2 km south of this site. Accounting for uncertain-ties in projection of the channel margin to the fault and sub-tracting the nearby amount of 1906 offset, Baldwin et al.(2000) measure a penultimate northern San Andreas offsetof 3.1–4.6 m.
At the Filoli site on the Peninsula segment of the fault(Fig. 2), Hall et al. (1999) reconstructed buried stream chan-nels offset by the San Andreas. They conclude that a channelwith a radiocarbon age of 330� 200 yr B.P. is offset4:1� 0:5 m. This is interpreted as recording 2.5 m (�0:2)of surface slip that occurred at this location in 1906 and1:6� 0:7 m of slip in the penultimate rupture, which theycontend is 1838.
Rodgers Creek Fault
The Rodgers Creek fault exhibits intermittent geomor-phic expression of the most recent event in the form of shortscarplets, small left stepping en echelon pushups, sharplinear furrows, and at least one offset channel. Much of thisfault geomorphology is being modified by grazing, grapeplanting, and slope processes. The clearest evidence of theamount of slip during the most recent event is at the BeebeRanch (Fig. 2). A channel with an associated debris flow levyon its south margin was right-laterally offset 2 m (0.2,�0:3)during the most recent rupture (Budding et al., 1991).In 2000, a debris flow filled this channel and modified itsgeometry.
At the Triangle G site (Fig. 2), 0.7 km to the north, thefault is expressed as a short pressure ridge. Hecker et al.(2005) reconstruct the gradient of a buried debris flow offsetalong the northeast trace of the fault during the most recent
Figure A2. OxCal model (version 4.1.7) of the most recent event (R_Date b-238053) on the northern Calaveras fault at the NorthFoothill site.
The Earthquake Cycle in the San Francisco Bay Region: A.D. 1600–2012 29
BSSA Early Edition

surface rupture. Their estimate of 2.2 m (�1:2, 0.8) of right-lateral slip along the northeast side of the pressure ridge is aminimum for the site because an unknown amount of addi-tional slip occurred on the fault flanking the southwest sideof the ridge. They conclude the amount of slip at the TriangleG Ranch site during this event is similar to, but probablylarger than, the surface offset measured for the same ruptureat Beebe Ranch.
There is also evidence that multimeter single event off-sets occurred during ruptures prior to the most recent event.At Beebe Ranch, Budding et al. (1991) correlate buriedchannels across the fault exposed in fault-parallel trenches.This provides an estimate of net offset of 5.1–7.2 m. Radio-carbon dating at the Beebe Ranch and at Triangle G indicatesthat this offset represents three ruptures (Schwartz et al.,1992). Removing slip from the most recent event leaves any-where from 2.8 to 5.4 m for the penultimate and prepenulti-mate ruptures at this location.
San Gregorio Fault
Simpson et al. (1997) combine trench and site mappingrelations to estimate slip during both the most recent and thepenultimate surface rupture across the San Gregorio fault atSeal Cove (Fig. 2). Each event occurred on a different faultstrand and the offsets were measured separately. The mostrecent San Gregorio surface rupture extends through a NativeAmerican midden that was mapped using 145 hand augerborings. Simpson et al. (1997) conclude that it is deflectedacross the fault 5 m (2, �6). For the penultimate event,Simpson et al. (1997) reconstructed the geometry of a wedgeof offset terrace sand, and they estimate slip of 3:0� 0:2 m.
Hayward Fault
There are no geologically measured horizontal slips perevent data for the Hayward fault. Surface rupture did occurduring 1868, as reported in Lawson (1908), extending at least36 km from San Leandro to Warm Springs. Although thelocation of “the crack” (as the fault trace is primarily referredto in Lawson, 1908) is described, references to offset arevague. In some places it exhibited displacement of 8 or
10 inches and in others “a displacement of 3 feet is said tobe observed” (Lawson, 1908, p. 435). Yu and Segall (1996)geodetically modeled the 1868 rupture, suggesting a lengthof 45–60 km and an average displacement of 1.9 m (�0:4).
In their investigation of the southern Hayward fault atTyson’s Lagoon (Fig. 2), Lienkaemper et al. (2002) measurevertical separation for the past four ruptures. Based on thethickness of small colluvial wedges adjacent to the main faulttrace, they estimate a vertical component of slip of 0.1–0.2 mfor 1868 and 0.3, 0.2, and 0.45 m for the penultimate, third,and fourth events back, respectively. Lienkaemper et al.(2002) conclude that if the horizontal-to-vertical ratio of slipremains generally constant, then the similarity of verticaldisplacement for the past four Tyson Lagoon events suggestsgenerally similar horizontal slip at this location.
U.S. Geological Survey345 Middlefield RoadMenlo Park, California 94025
(D.P.S., J.J.L., S.H., T.E.F.)
URS Corporation1333 BroadwayOakland, California 94612
(K.I.K.)
Lettis Consultants International1981 N. BroadwayWalnut Creek, California 94596
(J.N.B.)
California Geological Survey345 Middlefield RoadMenlo Park, California 94025
(G.G.S.)
Department of GeosciencesUniversity of Missouri-Kansas City5100 Rockhill RoadKansas City, Missouri 64110
(T.M.N.)
Manuscript received 29 October 2012;Published Online 20 May 2014
30 D. P. Schwartz, J. J. Lienkaemper, S. Hecker, K. I. Kelson, T. E. Fumal, J. N. Baldwin, G. G. Seitz, and T. M. Niemi
BSSA Early Edition