theglobal financialcentres index 11 - long 11.pdf · paris 22 650 24 643 2 7 luxembourg 23 648 29...
TRANSCRIPT

TheGlobalFinancialCentresIndex11MARCH 2012
1 – 2012FinancialCentre Futures

The Qatar Financial Centre Authority sponsorsLong Finance’s ‘Financial Centre Futures’programme.
Qatar Financial Centre (QFC) is a financial andbusiness centre established by the governmentof Qatar in 2005 to attract international financialservices andmultinational corporations to growand develop themarket for financial services inthe region.
QFC consists of a commercial arm, the QFCAuthority; and an independent financialregulator, the QFC Regulatory Authority. Italso has an independent judiciary whichcomprises a civil and commercial court and aregulatory tribunal.
QFC aims to help all QFC licensed firms generatenew and sustainable revenue streams. It providesaccess to local and regional investmentopportunities. Business can be transacted insideor outside Qatar, in local or foreign currency.
Uniquely, this allows businesses to operate bothlocally and internationally. Furthermore, QFCallows 100%ownership by foreign companies,and all profits can be remitted outside of Qatar.
TheQFCAuthority is responsible for theorganisation’s commercial strategy and fordeveloping relationships with the globalfinancial community and other key institutionsboth within and outside Qatar. One of themostimportant roles of QFCA is to approve and issuelicences to individuals, businesses and otherentities that wish to incorporate or establishthemselves in Qatar with the Centre.
TheQFC Regulatory Authority is anindependent statutory body and authorises andsupervises businesses that conduct financialservices activities in, or from, the QFC. It haspowers to authorise, supervise and, wherenecessary, discipline regulated firms andindividuals.
Z/Yen Group thanks the City of LondonCorporation for its cooperation in thedevelopment of the GFCI and for the use of therelated data still used in the GFCI.
The author of this report, Mark Yeandle, is verygrateful to other members of the GFCI team –in particular, Nick Danev, Chiara von Gunten,Stephanie Rochford andMichael Mainelli.

Foreword
The Global Financial Centres Index 11 1
The Global Financial Centres Index is abarometer, tracking the shifts ofcompetitiveness in global financial centres, andover the last few years it has shown thatCanada’s economy is weathering the storm. Weentered the downturn in better condition thanmany, because when times were good wemanaged surplus budgets and kept down thenational debt. Today Canada has the lowest netdebt to GDP ratio in the G-7.
Forbes magazine ranks Canada as the bestcountry in the world in which to do business.We have generous R&D tax incentives, first ratetechnology and innovation, a highly skilledworkforce, investor protection and a lack of redtape. The OECD and the IMF predict that oureconomy will continue to be a leader in theindustrialised world over the next two years.
Canada’s banks are well capitalised, stable andsecure. They largely stayed out of sub-primemortgages and mortgage backed securities,and their strong balance sheets have enabledthem to expand and pick up both assets andtalent that other global banks were forced tosell. In 2012, for the fourth year in a row, TheWorld Economic Forum described Canada’sbanks “as the soundest in the world”. Six of theworld’s 50 safest banks and four of NorthAmerica’s ten largest banks are Canadian.Strong leadership, good management and aprudent regulatory system served us well.
Canada’s financial services sector has grownand diversified significantly, generating sales ofmore than $82.4 billion in 2010. Canada hasleading banks, major insurance companies,asset managers including cutting edge pensionfunds, and some of the largest wealthmanagement operations in the world. We areincreasingly competitive and global in reach.
Four Canadian cities are now in the top 30 ofthe Global Financial Centres Index. Torontooffers a breadth of financial services activitythat makes it the third largest financialservices centre in all of North America.Vancouver is Canada’s Pacific gateway,offering unique access to trade financing inthe fast growing Asia Pacific markets. Calgaryis a global hub for energy and commodityfinancing. Montreal has strong expertise inpension management, and leads indeveloping software for the financial servicessector.
Canada’s financial services sector is a key assetof the Canadian economy. Looking ahead, wewill continue to build partnerships andinternational networks that aim to captureopportunities as the global economy returns togrowth and prosperity.
Gordon CampbellCanadian High Commissionerto the United Kingdom

The GFCI provides profiles, ratings and rankingsfor 77 financial centres, drawing on twoseparate sources of data – instrumental factors(external indices) and responses to an onlinesurvey. The GFCI was first published by theZ/Yen Group in March 2007 and hassubsequently been updated every six months.Successive growth in the number ofrespondents and data has enabled us tohighlight the changing priorities and concernsof financial professionals over this time,particularly since financial crises began tounfold in 2007 and 2008. This is the eleventhedition of GFCI (GFCI 11).
Instrumental factors: previous researchindicates that many factors combine to make afinancial centre competitive. These factors canbe grouped into five over-arching ‘areas ofcompetitiveness’: People, BusinessEnvironment, Infrastructure, Market Access andGeneral Competitiveness. Evidence of a centre’sperformance in these areas is drawn from arange of external measures. For example,evidence about a fair and just businessenvironment is drawn from a corruptionperception index and an opacity index. 80factors have been used in GFCI 11, of which 37have been updated since GFCI 10 and five arenew to the GFCI (see page 42 for details on allexternal measures used in the GFCI 11 model).
Financial centre assessments: GFCI usesresponses to an ongoing online questionnairecompleted by international financial servicesprofessionals. Respondents are asked to ratethose centres with which they are familiar andto answer a number of questions relating totheir perceptions of competitiveness. Overall,26,853 financial centre assessments from 1,778financial services professionals were used tocompute GFCI 11, with older assessmentsdiscounted according to age.
Full details of the methodology behind GFCI 11can be found on page 37. The ratings and
rankings are calculated using a ‘factorassessment model’, which combines theinstrumental factors and questionnaireassessments. The full list of the 77 financialcentres rated and profiled in GFCI 11 is shownon page 4.
The main headlines of GFCI 11 are:
• The past trend of large rises in the ratings ofAsia/Pacific centres has paused. Hong Kong,Singapore, Tokyo, Shanghai, Beijing, Taipei andShenzhen all decline in GFCI 11. Centres on themainland of China have seen significantdeclines with Shanghai down 37 points andBeijing down 11. Hong Kong sees a 16 pointdrop and is now 27 points below London.
We believe that these results in Asia are justan interlude in the long-term trend of theincreasing importance of the region ratherthan a fundamental change in fortunes.Overall respondents think that the Asiancentres will continue to become moresignificant. Some respondents questionwhether financial centres on mainland Chinawill be able to continue their growth withoutrelaxations in currency controls. It is worthnoting that Seoul and Sydney are the onlycentres in Asia/Pacific showing higher ratingsthan in GFCI 10.
“Several commentators on Chinaare revising their expectationsdownwards – currency controlsare a real issue.”Asset Manager based in Hong Kong
• Offshore centres have suffered significantreputational damage in the past four years. InGFCI 10 several of these centres werebeginning to recover and this trend hascontinued. Jersey, Guernsey, the CaymanIslands, the British Virgin Islands, the Isle ofMan, Gibraltar and Mauritius (listed in order
2 The Global Financial Centres Index 11
GFCI 11 – Summary and Headlines

The Global Financial Centres Index 11 3
of GFCI rank) have all made modest gains inthe ratings. Jersey and Guernsey remain theleading offshore centres. A number of ourrespondents believe that centres like Zurich,Geneva and Luxembourg, whilst notgeographically ‘offshore’, compete in asimilar manner to the genuinely offshorecentres. It is interesting to note that Zurich,Geneva and Luxembourg have all risen in theGFCI 11 ratings.
• The recent crisis of the Euro has changed thebalance of interest within the Eurozone. Thecapital cities of the weaker Euro economiesare clearly suffering. Dublin, Milan, Madrid,Lisbon and Athens were all down in GFCI 10and this decline has continued in GFCI 11 withthese five centres all down in the rankingsagain. In contrast to the centres in the weakerEurozone economies, Frankfurt and Paris haveboth risen in the ranks (by two places and
three places respectively). This may be as aresult of the political lead that Germany andFrance have been showing in attempting tocome to terms with the Eurozone crisis.Historically, Frankfurt and Paris have moved upand down in the rankings together in alleditions of the GFCI (this can be seen in Chart10 on page 16). There have been some otherstrong performances in Europe with Vienna(up 21 points), Amsterdam (up 12), Warsaw(up 13), and the Scandinavian centres ofStockholm, Oslo and Helsinki all doing well.
• Confidence amongst financial servicesprofessionals, measured by averageassessments of the leading centres, wasrelatively stable during 2011. This isdemonstrated by a stability in the ‘spread’(measured by standard deviation) ofassessments. Chart 1 below shows thestability of overall ratings in 2011.
Chart 1 | Threemonth rolling average assessments of the top 25 centres
4 The Global Financial Centres Index 11
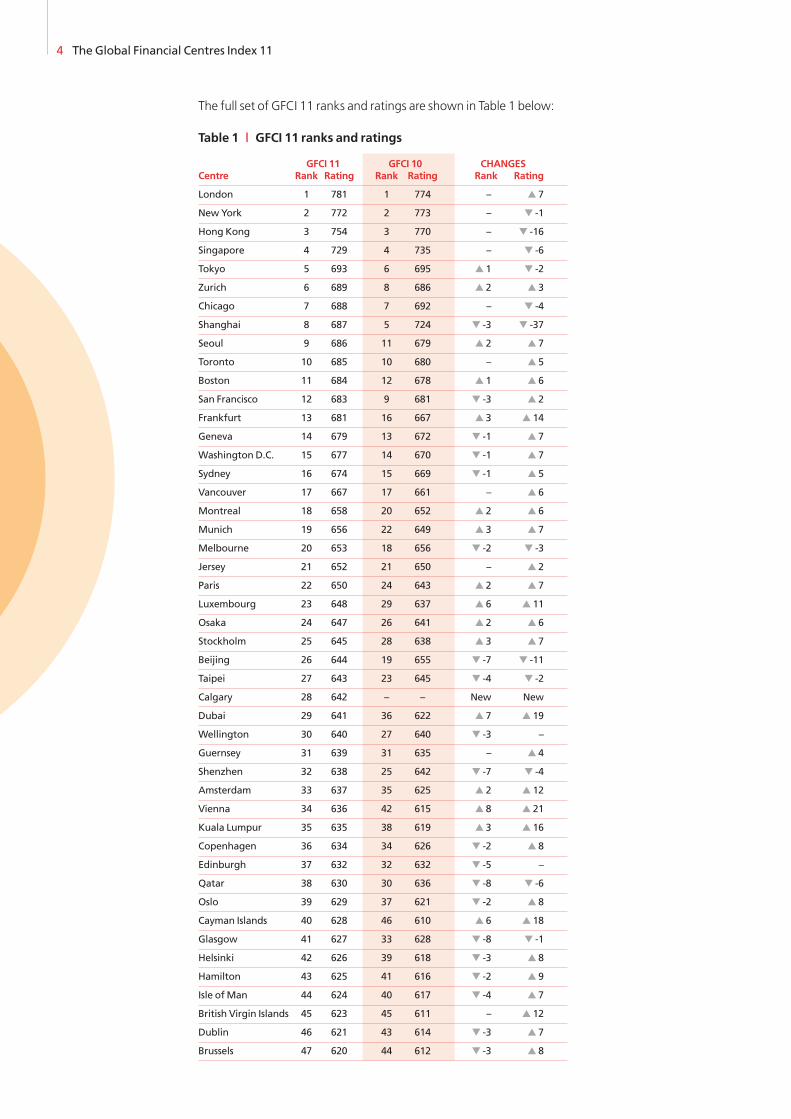
Table 1 | GFCI 11 ranks and ratings
GFCI 11 GFCI 10 CHANGESCentre Rank Rating Rank Rating Rank Rating
London 1 781 1 774 – � 7
NewYork 2 772 2 773 – � -1
Hong Kong 3 754 3 770 – � -16
Singapore 4 729 4 735 – � -6
Tokyo 5 693 6 695 � 1 � -2
Zurich 6 689 8 686 � 2 � 3
Chicago 7 688 7 692 – � -4
Shanghai 8 687 5 724 � -3 � -37
Seoul 9 686 11 679 � 2 � 7
Toronto 10 685 10 680 – � 5
Boston 11 684 12 678 � 1 � 6
San Francisco 12 683 9 681 � -3 � 2
Frankfurt 13 681 16 667 � 3 � 14
Geneva 14 679 13 672 � -1 � 7
Washington D.C. 15 677 14 670 � -1 � 7
Sydney 16 674 15 669 � -1 � 5
Vancouver 17 667 17 661 – � 6
Montreal 18 658 20 652 � 2 � 6
Munich 19 656 22 649 � 3 � 7
Melbourne 20 653 18 656 � -2 � -3
Jersey 21 652 21 650 – � 2
Paris 22 650 24 643 � 2 � 7
Luxembourg 23 648 29 637 � 6 � 11
Osaka 24 647 26 641 � 2 � 6
Stockholm 25 645 28 638 � 3 � 7
Beijing 26 644 19 655 � -7 � -11
Taipei 27 643 23 645 � -4 � -2
Calgary 28 642 – – New New
Dubai 29 641 36 622 � 7 � 19
Wellington 30 640 27 640 � -3 –
Guernsey 31 639 31 635 – � 4
Shenzhen 32 638 25 642 � -7 � -4
Amsterdam 33 637 35 625 � 2 � 12
Vienna 34 636 42 615 � 8 � 21
Kuala Lumpur 35 635 38 619 � 3 � 16
Copenhagen 36 634 34 626 � -2 � 8
Edinburgh 37 632 32 632 � -5 –
Qatar 38 630 30 636 � -8 � -6
Oslo 39 629 37 621 � -2 � 8
Cayman Islands 40 628 46 610 � 6 � 18
Glasgow 41 627 33 628 � -8 � -1
Helsinki 42 626 39 618 � -3 � 8
Hamilton 43 625 41 616 � -2 � 9
Isle ofMan 44 624 40 617 � -4 � 7
British Virgin Islands 45 623 45 611 – � 12
Dublin 46 621 43 614 � -3 � 7
Brussels 47 620 44 612 � -3 � 8
The full set of GFCI 11 ranks and ratings are shown in Table 1 below:

The Global Financial Centres Index 11 5
GFCI 11 GFCI 10 CHANGESCentre Rank Rating Rank Rating Rank Rating
AbuDhabi 48 618 - - New New
Madrid 49 617 48 608 � -1 � 9
Sao Paulo 50 612 49 607 � -1 � 5
Mexico City 51 610 47 609 � -4 � 1
Milan 52 609 50 606 � -2 � 3
Rio de Janeiro 53 608 53 602 – � 6
Warsaw 54 606 56 593 � 2 � 13
Johannesburg 55 603 52 603 � -3 –
Prague 56 602 51 605 � -5 � -3
Bahrain 57 600 55 596 � -2 � 4
Rome 58 596 54 597 � -4 � -1
Bangkok 59 594 57 585 � -2 � 9
Monaco 60 593 59 583 � -1 � 10
Istanbul 61 590 62 580 � 1 � 10
Jakarta 62 588 65 577 � 3 � 11
Gibraltar 63 587 58 584 � -5 � 3
Mumbai 64 584 64 578 – � 6
Moscow 65 583 61 581 � -4 � 2
Mauritius 66 578 68 571 � 2 � 7
Buenos Aires 67 577 63 579 � -4 � -2
Lisbon 68 575 60 582 � -8 � -7
Manila 69 573 69 570 – � 3
Riyadh 70 572 66 575 � -4 � -3
Tallinn 71 570 67 574 � -4 � -4
Malta 72 568 70 568 � -2 –
St. Petersburg 73 567 71 554 � -2 � 13
Budapest 74 552 73 543 � -1 � 9
Bahamas 75 550 72 545 � -3 � 5
Reykjavik 76 517 74 491 � -2 � 26
Athens 77 468 75 477 � -2 � -9

Abu Dhabi and Calgary enter the GFCI for thefirst time. Canada now has four centres in thetop 30 of the GFCI. Panama, Cyprus and Tel Avivhave been added to the GFCI questionnairerecently but have yet to acquire enoughassessments to be rated in the index.
Chart 2 shows the relative stability of theleading centres.
In GFCI 10 Hong Kong was just three pointsbehind New York and four points behindLondon. Hong Kong has now fallen back a littlebut maintains its position as the third globalfinancial centre. These three centres control alarge proportion of financial transactions
(approximately 70% of equity trading) and arelikely to remain powerful financial centres forthe foreseeable future.
We continue to believe that the relationshipsbetween London, New York and Hong Kong aremutually supportive. Whilst some industry
professionals still see a great deal ofcompetition, others from the industry appear torecognise that working together on certainelements of regulatory reform is likely toenhance the competitiveness of these centres.We recently asked GFCI respondents “If afinancial centre which was closely linked withyour centre, became significantly moreimportant, how would this affect your financial
6 The Global Financial Centres Index 11
My financial centre would benefit from thelinks with this centre 51%
My financial centre would see little or nochange 20%
My financial centre would lose business tothis centre 29%
Chart 3 | Close linkswith another financial centre
500
570
640
710
780
850
GFCI 11
GFCI 10
GFCI 9
GFCI 8
GFCI 7
GFCI 6
GFCI 5
GFCI 4
GFCI 3
GFCI 2
GFCI 1
London ■
New York ■
Hong Kong ■
Singapore ■
Chart 2 | Top four centres GFCI ratings over time

centre. Chart 3 shows that just over half therespondents think that financial centres canbenefit from close links with other centres.
London and New York must not believe thatthey are ‘untouchable’. Whilst Hong Kong andother Asian centres have declined a little in GFCI11, the overall trend of the leading Asiancentres is upward. London still has to negotiatesome challenging regulatory changes (forexample as recommended by the Vickersreport1). Tax levels in the UK remain unpopularwithin the financial services sector. In particular,the 50% personal tax rate for top earners (grossincome greater than £150K) is deeplyunpopular among financial servicesprofessionals and is the subject of muchconjecture as to how much damage it is doingto the competitiveness of London.
We sent a supplementary questionnaire to GFCIrespondents in February 2012 asking foropinions on several topical issues in financialservices. The number of responses is fewer thanin the overall GFCI, but they are still statisticallysignificant.
The first question asked was – “How would theimposition of a financial transaction tax affectthe competitiveness of your financial centre?”The responses are shown in Chart 4 and there isan overwhelming feeling that transaction taxes(unless imposed in all financial centres) wouldreduce competitiveness:
The Global Financial Centres Index 11 7
It would enhance the competitiveness of myfinancial centre 8%
It would have little or no effect on myfinancial centre 18%
It would lead to a decrease in thecompetitiveness of my financial centre 73%
Chart 4 | The effect of a financial transaction tax
“Any steps to introduce financial transaction taxes should betaken at a global level rather than in individual jurisdictions orfinancial centres.”Director of Investment Bank based in Paris
1 The IndependentCommission on Banking,Final Report andRecommendations, Sir JohnVickers, September 2011

When asked “How would the mandatoryseparation of retail and investment bankingaffect your financial centre?” over half of ourrespondents did not think mandatoryseparation would have a significant effect ontheir financial centres.
Many comments suggest that respondents arein favour of separating retail and investmentbanking but some question whether it wouldbe effective:
Our next question was “If your local regulatorrestricted the activities of firms that are too bigto fail, how would this affect your financialcentre?” Over a third of respondents feel thatgreater regulatory involvement would decreasecompetitiveness in those centres affected:
Several respondents blame regulators forallowing firms to become too big:
8 The Global Financial Centres Index 11
“It is not clear that the universalbanking model was a cause of thecrisis, or that constraining it willhave positive effects.”Financial Services Consultant based in London
It would enhance the competitiveness of myfinancial centre 27%
It would have little or no effect on myfinancial centre 28%
It would lead to a decrease in thecompetitiveness of my financial centre 36%
There are no firms that are too big to fail inthis financial centre 8%
Chart 6 | The effect of greater regulatory involvement on firms that are too big to fail
“Financial firms become too big to fail because they have regulatoryprotection! Enhancing competitiveness would ensure that firmsdon’t grow too big.”Financial Services Advisor based in Jersey
It would enhance the competitiveness of myfinancial centre 26%
it would have little or no effect on myfinancial centre 57%
it would lead to a decrease in thecompetitiveness of my financial centre 17%
Chart 5 | The effect of a separation of retail and investment banking

We asked our respondents about the most likelyoutcome of the Eurozone crisis:
Finally we asked about what would be requiredfor a return to long-term financial systemstability. Over 80% of respondents feel that thiswill require international co-operation:
The Global Financial Centres Index 11 9
The Eurozone will lose members 29%
The Eurozone will fragment 26%
The Eurozone will consolidate into a singlecentral bank and bond market 30%
Other 15%
Chart 7 | Themost likely outcome of the eurozone crisis
Will require multilateral internationalco-operation 82%
Can be solved at a national level bynational institutions 10%
Cannot be achieved 8%
Chart 8 | A return to long-termfinancial system stability

The GFCI questionnaire asks about the mostimportant factors for competitiveness. The numberof times that each area is mentioned is summarisedin Table 2:
The GFCI questionnaire asks respondents to namethe single regulatory change that would improve afinancial centre’s competitiveness. Although a largenumber of possible changes were named, the fourmentioned most often are shown in Table 3 below:
The GFCI questionnaire also asks respondents howfinancial centres can best signal their long-termcommitment to financial services. There were alarge number of ‘signals’ mentioned but the fourmost common are shown in Table 4 below:
10 The Global Financial Centres Index 11
Main Areas of Competitiveness
Table 2 | Main areas of competitiveness
Area of competitiveness Number ofmentions Main concerns
Taxation 74 Personal and corporate tax
Business environment 32 Stability and predictability
People 26 Quality of staff
General economic conditions 26 Eurozone recession
Infrastructure 15 Air transport
Table 3 | Top four single regulatory changes
Regulatory change Number ofmentions Main issues
Taxation 49 Personal tax
Regulation 41 Fairness and predictability
Level playing field 32 Competitiveness with others
Business freedom / ease 30 Ease of running a business
Table 4 | Best signals of commitment to financial services
Area of competitiveness Number ofmentions
Stability and transparency of regulation 45
Lack of corruption 34
Taxation 32
Lack of government interference 26
Infrastructure development 18
The Global Financial Centres Index 11 11
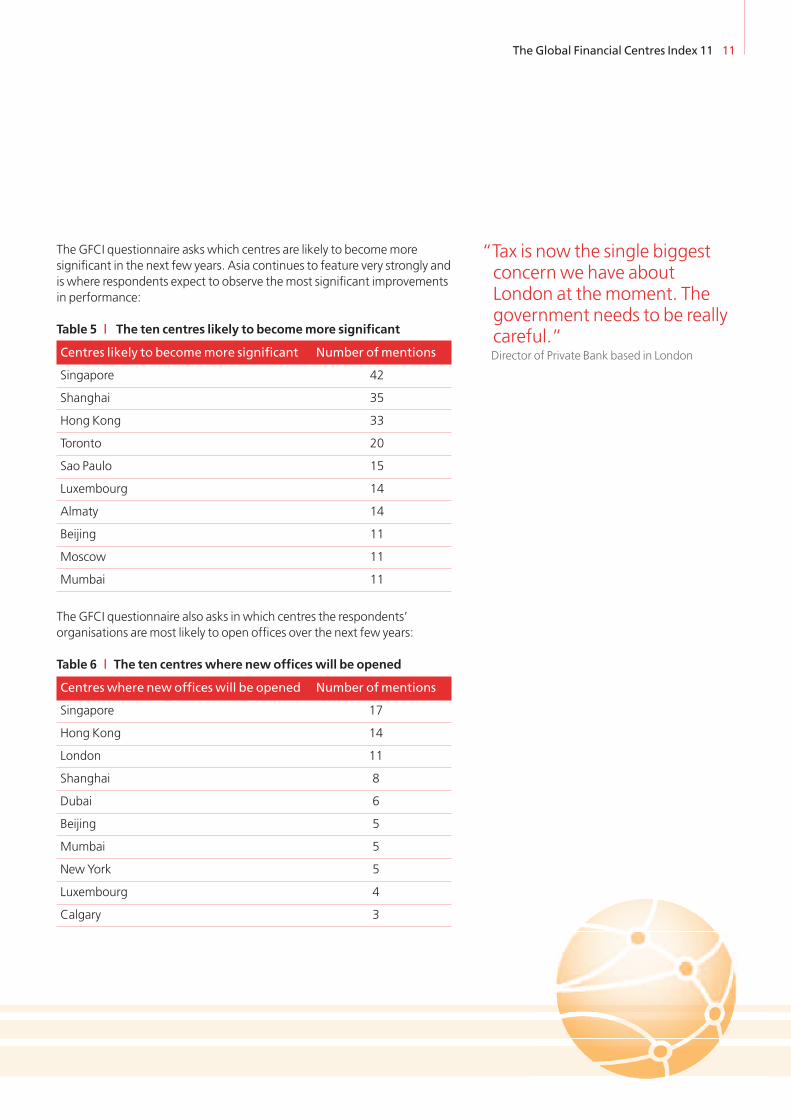
The GFCI questionnaire asks which centres are likely to become moresignificant in the next few years. Asia continues to feature very strongly andis where respondents expect to observe the most significant improvementsin performance:
The GFCI questionnaire also asks in which centres the respondents’organisations are most likely to open offices over the next few years:
Table 6 | The ten centreswhere newofficeswill be opened
Centres where newofficeswill be opened Number ofmentions
Singapore 17
Hong Kong 14
London 11
Shanghai 8
Dubai 6
Beijing 5
Mumbai 5
New York 5
Luxembourg 4
Calgary 3
Table 5 | The ten centres likely to becomemore significant
Centres likely to becomemore significant Number ofmentions
Singapore 42
Shanghai 35
Hong Kong 33
Toronto 20
Sao Paulo 15
Luxembourg 14
Almaty 14
Beijing 11
Moscow 11
Mumbai 11
“Tax is now the single biggestconcern we have aboutLondon at the moment. Thegovernment needs to be reallycareful.”Director of Private Bank based in London

12 The Global Financial Centres Index 11
Using clustering and correlation analysis wehave identified three key measures (axes) thatdetermine a financial centre’s profile alongdifferent dimensions of competitiveness:
‘Connectivity’ – the extent to which a centre iswell known around the world and how muchnon-resident professionals believe it isconnected to other financial centres.Respondents are asked to assess only thosecentres with which they are personally familiar.A centre’s connectivity is assessed using acombination of ‘inbound’ assessment locations(the number of locations from which aparticular centre receives assessments) and‘outbound’ assessment locations (the numberof other centres assessed by respondents from aparticular centre). If the weighted assessmentsfor a centre are provided by over 65% of othercentres, this centre is deemed to be ‘Global’. Ifthe ratings are provided by over 45% of othercentres, this centre is deemed to be‘Transnational’.
‘Diversity’– the breadth of industry sectors thatflourish in a financial centre. We consider this‘richness’ of the business environment to bemeasurable in a similar way to that of thenatural environment and therefore, use acombination of biodiversity indices (calculatedon the instrumental factors) to assess a centre’sdiversity. A high score means that a centre iswell diversified; a low diversity score reflects aless rich business environment.
‘Speciality’ - the depth within a financial centreof the following industry sectors: assetmanagement, investment banking, insurance,professional services and wealth management.A centre’s ‘speciality’ performance is calculatedfrom the difference between the GFCI ratingand the industry sector ratings.
In Table 7, ‘Diversity’ (Breadth) and ‘Speciality’(Depth) are combined on one axis to create atwo dimensional table of financial centreprofiles. The 77 centres are assigned a profile onthe basis of a set of rules for the three measures:how well connected a centre is, how broad itsservices are and how specialised it is.
Connectivity
Speciality
Diversity
Financial Centre Profiles

The Global Financial Centres Index 11 13
Table 7 | GFCI 11 financial centre profiles
Broad& deep Relatively broad Relatively deep Emerging
Global
Global leaders Global diversified Global specialists Global contenders
Chicago Amsterdam Beijing Luxembourg
Frankfurt Dublin Moscow
Hong Kong Seoul
London Shanghai
New York Singapore
Paris
Tokyo
Toronto
Zurich
Transnational
EstablishedTransnational
TransnationalDiversified
TransnationalSpecialists
TransnationalContenders
Copenhagen Boston Athens Bahrain
Geneva Istanbul Dubai British Virgin Islands
Madrid Kuala Lumpur Edinburgh Cayman Islands
Montreal Washington DC Glasgow Gibraltar
Munich Mumbai Guernsey
Sydney Qatar Isle of Man
Vancouver Shenzhen Jersey
Local
Established Players Local Diversified Local Specialists Evolving Centres
Brussels Bangkok Abu Dhabi Buenos Aires
Calgary Warsaw Bahamas Jakarta
Helsinki Budapest Johannesburg
Lisbon Hamilton Manila
Melbourne Malta Mauritius
Mexico City Monaco Osaka
Milan Oslo Taipei
Prague Reykjavik Wellington
Rome Rio de Janeiro
San Francisco Riyadh
Sao Paulo St Petersburg
Stockholm Tallinn
Vienna

14 The Global Financial Centres Index 11
This profile ‘map’ shows the nine Global Leaders(in the top left of the table) which have bothbroad and deep financial services activities andare connected with many other financialcentres. This list includes London, New York andHong Kong, the leading global financial centres.Seoul, Shanghai and Singapore are GlobalDiversified centres as they are equally wellconnected but do not exhibit the same depth indifferent sectors to be considered GlobalLeaders. The only Global Contenders areMoscow and Luxembourg which are assigned aglobal profile because there is widespreadawareness of their activities, but their financialservices are not currently sufficiently broad anddeep for them to be considered leaders.
The ‘movers’ since GFCI 10 include Shanghai(from Established Transnational to GlobalDiversified), Paris becoming a Global Leader(from Global Diversified), Montreal,Copenhagen and Munich becoming EstablishedTransnational centres (from TransnationalDiversified) and the European Centres ofHelsinki, Lisbon, Rome and Stockholm allbecoming Established Players from being LocalDiversified and Local Specialist centres. Chart 9below shows the profiles mapped against theGFCI 11 ranges:
400
450
500
550
600
650
700
750
800
Chart 9 | Financial centre profilesmapped against GFCI 11 ranges
“It is interesting to see Moscow as a Global Contender – that isexactly what it is. The leaders in Moscow are putting a lot of effort inchanging Moscow into a more established global player.”Asset Manager based in London

The Global Financial Centres Index 11 15
Table 8 shows the top 20 European financialcentres. The main centres of countries sufferingin the Euro-crisis have all declined in therankings. In the UK, Edinburgh and Glasgowsee the largest falls in Europe (five places andeight places respectively).
Frankfurt, Paris, Zurich and Geneva are amongstthose European centres that have risen in theratings. Ten of the top 20 European centres havedeclined in the ranks:
Table 8 | The leading 20 European centres in GFCI 11
GFCI 11rank
GFCI 11rating
GFCI 10rank
GFCI 10rating
Change inrank
Change inrating
London 1 781 1 774 – � 7
Zurich 6 689 8 686 � 2 � 2
Frankfurt 13 681 16 667 � 3 � 14
Geneva 14 679 13 672 � -1 � 7
Munich 19 656 22 649 � 3 � 7
Paris 22 650 24 643 � 2 � 7
Luxembourg 23 648 29 637 � 6 � 11
Stockholm 25 645 28 638 � 3 � 7
Amsterdam 33 637 35 625 � 2 � 12
Vienna 34 636 42 615 � 8 � 21
Copenhagen 36 634 34 626 � -2 � 8
Edinburgh 37 632 32 632 � -5 –
Oslo 39 629 37 621 � -2 � 7
Glasgow 41 627 33 628 � -8 � -1
Helsinki 42 626 39 618 � -3 � 8
Dublin 46 621 43 614 � -3 � 7
Brussels 47 620 44 612 � -3 � 8
Madrid 49 617 48 608 � -1 � 9
Milan 52 609 50 606 � -2 � 3
Warsaw 54 606 56 593 � 2 � 13
European Centres

Examining the assessments given to eachmajor centre is a useful means of assessing therelative strength and weakness of theirreputations in different regions. It is importantto note that assessments given to a centre bypeople based there are excluded from the GFCImodel to eliminate ‘home preference’. Thecharts below show the difference betweenoverall mean assessments by region. Theadditional vertical line shows the mean if allassessments from the whole of the homeregion are removed:
London’s overall average assessment is 780.The chart indicates that London is wellregarded in North America (and by the fewrespondents in Latin America) but less wellrated by respondents from offshore centres,the Middle East/Africa and Asia/Pacific.
16 The Global Financial Centres Index 11
500
570
640
710
780
850
GFCI 11
GFCI 10
GFCI 9
GFCI 8
GFCI 7
GFCI 6
GFCI 5
GFCI 4
GFCI 3
GFCI 2
GFCI 1
London ■
Zurich ■
Frankfurt ■Geneva ■
Paris ■
Chart 10 | The leading European centres over GFCI editions
-150 -100 -50 0 50 100 150
Middle East/Africa (1.4%)
Latin America (0.2%)
North America (10.5%)
Asia/Pacific (26.5%)
Offshore (27%)
Europe (34.3%)
Chart 11 | Assessments by region – difference from themean – London
Mean withoutEuropean
assessments

Zurich’s overall average assessment is 717, up from 702 in GFCI 10. North American assessments ofZurich together with those from the Middle East & Africa are strong. Offshore and Europeanrespondents are much closer to the mean. Asia/Pacific respondents are less favourable.
Frankfurt’s overall average assessment is 709 up from 693 in GFCI 10. Frankfurt is given lowerassessments by people based in offshore locations and Latin America.
The overall average assessment for Paris is 664 up from 637 in GFCI 10. Paris is given lowerassessments by other European respondents and the offshore centres but gets more favourableresponses from the Asia/Pacific region.
The Global Financial Centres Index 11 17
-150 -100 -50 0 50 100 150
Middle East/Africa (2.4%)
Latin America (0.3%)
North America (11.4%)
Asia/Pacific (29.8%)
Offshore (10.8%)
Europe (45.3%)
-155
Chart 13 | Assessments by region – difference from themean – Frankfurt
Mean withoutEuropean
assessments
-150 -100 -50 0 50 100 150
Middle East/Africa (2.4%)
Latin America (0.2%)
North America (11.1%)
Asia/Pacific (31.6%)
Offshore (12.4%)
Europe (42.3%)
Chart 14 | Assessments by region – difference from themean – Paris
-150 -100 -50 0 50 100 150
Middle East/Africa (1.5%)
Latin America (0.5%)
North America (7.6%)
Asia/Pacific (17.8%)
Offshore (32.2%)
Europe (40.4%)
Chart 12 | Assessments by region – difference from themean – Zurich
Mean withoutEuropean
assessments
“Frankfurt hasbenefitedfrom theleadershipthat AngelaMerkel hasshown in theEuro crisis.”Asset Manager basedin Zurich
Mean withoutEuropean
assessments

18 The Global Financial Centres Index 11
Asia/Pacific Centres
GFCI 11 ratings have, on average, risen sinceGFCI 10. In Asia however, the ratings of some ofthe leading centres have shown markeddecreases. Hong Kong, Shanghai and Beijing inparticular have shown declines. However theAsian/Pacific region still has five centres in theoverall top ten – more than Europe and theAmericas:
Shenzhen has now fallen outside the top 30 forthe first time since entering the GFCI.
Table 9 | The leading ten Asia/Pacific centres in GFCI 11
GFCI 11rank
GFCI 11rating
GFCI 10rank
GFCI 10rating
Change inrank
Change inrating
Hong Kong 3 754 3 770 – �-16
Singapore 4 729 4 735 – � -6
Tokyo 5 693 6 695 1 � -2
Shanghai 8 687 5 724 � -2 �-37
Seoul 9 686 11 679 � 2 � 7
Sydney 16 674 15 669 � -1 � 5
Melbourne 20 653 18 656 � -2 � -3
Osaka 24 647 26 641 � 2 � 6
Beijing 26 644 19 655 � -7 �-11
Taipei 27 643 23 645 � -4 � -2
400
450
500
550
600
650
700
750
800
GFCI 11
GFCI 10
GFCI 9
GFCI 8
GFCI 7
GFCI 6
GFCI 5
GFCI 4
GFCI 3
GFCI 2
GFCI 1
Hong Kong ■
Singapore ■
Tokyo ■
Shanghai ■Beijing ■
Seoul ■Shenzhen ■
Chart 15 | The leading Asian centres over GFCI editions

The Global Financial Centres Index 11 19
The mean rating of Hong Kong is 782 (downfrom 790 in GFCI 10), the mean for Singapore is764 (761 in GFCI 10) and the mean for Tokyo is739 (718 in GFCI 10). Responses from NorthAmerica, Latin America and the MiddleEast/Africa are more positive than averageabout Hong Kong and Singapore. Responsesfrom Europe and the offshore centres are lesspositive than average about Asian centres.
“Seoul has identified that theircity is less attractive to live infor Western expats than theyimagined. They are beginningto change that but still have along way to go.”Asset Manager based in Hong Kong
-150 -100 -50 0 50 100 150
Middle East/Africa (1.4%)
Latin America (0.4%)
North America (9.5%)
Asia/Pacific (41.9%)
Offshore (21.9%)
Europe (25%)
Chart 16 | Assessments by region – difference from themean – Hong Kong
-150 -100 -50 0 50 100 150
Middle East/Africa (1.6%)
Latin America (0.4%)
North America (9.2%)
Asia/Pacific (42%)
Offshore (20.9%)
Europe (26%)
Chart 17 | Assessments by region – difference from themean – Singapore
-150 -100 -50 0 50 100 150
Middle East/Africa (2.2%)
Latin America (0.7%)
North America (12%)
Asia/Pacific (54.5%)
Offshore (6.8%)
Europe (23.9%)
Chart 18 | Assessments by region – difference from themean – Tokyo
Mean withoutAsian
assessments
Mean withoutAsian
assessments
Mean withoutAsian
assessments

20 The Global Financial Centres Index 11
New York, Chicago and Toronto retain theirpositions in the GFCI 11 top ten. Boston andMontreal rose in the ranks. Calgary is a newentrant into the GFCI in 28th place. Canada
now has four centres in the GFCI, all within thetop 30. Chart 19 below shows New Yorkmaintaining its leadership in North America:
North American Centres
Table 10 | The leading North American and Latin American Centres in GFCI 11
GFCI 11rank
GFCI 11rating
GFCI 10rank
GFCI 10rating
Change inrank
Change inrating
NewYork 2 772 2 773 – �-1
Chicago 7 688 7 692 – �-5
Toronto 10 685 10 680 – � 5
Boston 11 684 12 678 � 1 � 6
San Francisco 12 683 9 681 �-3 � 2
Washington D.C. 15 677 14 670 �-1 � 7
Vancouver 17 667 17 661 – � 6
Montreal 18 658 20 652 � 2 � 6
Calgary 28 642 New New
Sao Paulo 50 612 49 607 �-1 � 5
Mexico City 51 610 47 609 �-4 � 1
Rio de Janeiro 53 608 53 602 – � 6
Buenos Aires 67 577 63 579 �-4 �-2
400
450
500
550
600
650
700
750
800
850
GFCI 11
GFCI 10
GFCI 9
GFCI 8
GFCI 7
GFCI 6
GFCI 5
GFCI 4
GFCI 3
GFCI 2
GFCI 1
New York ■
Chicago ■
Toronto ■
Boston ■
Montreal ■Sao Paulol ■
Buenos Aires ■
Chart 19 | The leading North American and Latin American centres over GFCI editions
North American and Latin American centres show a mixed performance in GFCI 11.

The difference between regional assessmentsfor some of the major North American centres isshown below:
The overall average assessment for New York is764 down from 801 in GFCI 10. New Yorkbenefits from strong North American support.Offshore centres assess New York less positively,possibly due to US clampdowns on offshoreactivities.
Chicago has an overall average assessment of726 up from 710 in GFCI 10. Assessments ofChicago show that respondents from theAsia/Pacific region and Europe gave the city aless favourable score than average.
The Global Financial Centres Index 11 21
-150 -100 -50 0 50 100 150
Middle East/Africa (1.9%)
Latin America (0.3%)
North America (15%)
Asia/Pacific (31.5%)
Offshore (18.3%)
Europe (33%)
Chart 20 | Assessments by region – difference from themean – NewYork
-150 -100 -50 0 50 100 150
Middle East/Africa (2.2%)
Latin America (0.4%)
North America (21.4%)
Asia/Pacific (38.6%)
Offshore (9.7%)
Europe (27.7%)
Chart 21 | Assessments by region – difference from themean – Chicago
Mean withoutNorth American
assessments
Mean withoutNorth American
assessments

Respondents from North America gave Torontoand Montreal scores higher than average, whilstrespondents from elsewhere gave lower scores.
22 The Global Financial Centres Index 11
-150 -100 -50 0 50 100 150
Middle East/Africa (3%)
North America (32.5%)
Asia/Pacific (22.2%)
Offshore (19%)
Europe (23.3%)
Chart 22 | Assessments by region – difference from themean – Toronto
-150 -100 -50 0 50 100 150
Middle East/Africa (2%)
North America (47%)
Asia/Pacific (17%)
Offshore (17.4%)
Europe (16.6%)
Chart 23 | Assessments by region – difference from themean –Montreal
Mean withoutNorth American
assessments
Mean withoutNorth American
assessments
“Toronto has been the leadingcentre in Canada for a whilenow but Montreal andVancouver are also gettingstronger – particularly in assetmanagement.”Asset Manager based in Boston

The Global Financial Centres Index 11 23
Of the four Middle Eastern centres in the GFCI,Dubai has overtaken Qatar to regain the statusof leading Middle Eastern centre in GFCI 11. Webelieve that Qatar has strong underlyingfundamentals to challenge Dubai. Abu Dhabi isa new entrant to the GFCI and has come in justabove Bahrain. Johannesburg and Istanbul donot yet fulfil their potential. We certainly expectIstanbul to become more significant in themedium term.
Middle East/African Centres
Table 11 | TheMiddle East/African centres in GFCI 11
GFCI 11rank
GFCI 11rating
GFCI 10rank
GFCI 10rating
Change inrank
Change inrating
Dubai 29 641 36 622 � 7 �19
Qatar 38 630 30 636 � -8 � -7
AbuDhabi 48 618 New New
Johannesburg 55 603 52 603 � -3 –
Bahrain 57 600 55 596 � -2 � 4
Istanbul 61 590 62 580 � 1 �10
Riyadh 70 572 66 575 � -4 � -3
400
450
500
550
600
650
700
GFCI 11
GFCI 10
GFCI 9
GFCI 8
GFCI 7
GFCI 6
GFCI 5
GFCI 4
GFCI 3
GFCI 2
GFCI 1
Dubai ■Qatar ■
Johannesburg ■
Bahrain ■
Istanbul ■
Chart 24 | SelectedMiddle East/African centres over GFCI editions

There is a mixed pattern of assessments for theMiddle Eastern centres. Dubai gets strongsupport from Asia/Pacific and below averagescores from the offshore centres. Qatar doeswell with respondents from Asia/Pacific and alsoNorth America. Istanbul is well supported by theMiddle East and North America but has a lowerreputation amongst European respondents:
24 The Global Financial Centres Index 11
-150 -100 -50 0 50 100 150
Middle East/Africa (3%)
Latin America (0.2%)
North America (5.7%)
Asia/Pacific (30.2%)
Offshore (32.1%)
Europe (28.7%)
722
Chart 25 | Assessments by region – difference from themean – Dubai
-150 -100 -50 0 50 100 150
Middle East/Africa (4.3%)
North America (2.9%)
Asia/Pacific (31.7%)
Offshore (28.8%)
Europe (32.4%)
Chart 26 | Assessments by region – difference from themean –Qatar
-150 -100 -50 0 50 100 150
Middle East/Africa (5.7%)
Latin America (0.6%)
North America (7.5%)
Asia/Pacific (46.5%)
Offshore (8.2%)
Europe (31.4%)
Chart 27 | Assessments by region – difference from themean – Istanbul
Mean withoutMiddle Eastern
assessments
Mean withoutMiddle Eastern
assessments
Mean withoutMiddle Eastern
assessments

Johannesburg is well regarded by respondentsfrom the Asia/Pacific centres but not fromelsewhere.
The Global Financial Centres Index 11 25
-150 -100 -50 0 50 100 150
Middle East/Africa (1%)
North America (6.3%)
Asia/Pacific (23%)
Offshore (41.9%)
Europe (27.7%)
Chart 28 | Assessments by region – difference from themean – Johannesburg
Mean withoutMiddle Eastern
assessments
“Dubai is still in the duldrums but watch Qatar with interest over thenext couple of years – I think it has much to offer.”Investment Manager based in London and the Middle East

Offshore centres have suffered significantreputational damage in the past four years.GFCI 10 showed that many of these centres’reputations were starting to recover. GFCI 11shows that this recovery is gaining pace. All thetop offshore centres have made gains in GFCI11 ratings. Jersey and Guernsey remain theleading offshore centres:
A significant proportion of the assessments ofoffshore centres are coming from other offshorecentres. Jersey and Guernsey get goodassessments from the other offshore centreswhereas the Cayman Islands do less well fromthe other offshore centres and better fromNorth American and Asia/Pacific respondents.
Offshore Centres
26 The Global Financial Centres Index 11
500
525
550
575
600
625
650
675
700
GFCI 11
GFCI 10
GFCI 9
GFCI 8
GFCI 7
GFCI 6
GFCI 5
GFCI 4
GFCI 3
GFCI 2
GFCI 1
Jersey ■
Guernsey ■
Hamilton ■
Isle of Man ■
Cayman Islands ■British Virgin Islands ■
Chart 29 | The top offshore centres over GFCI Editions
Table12 | Top ten offshore centres in GFCI 11
GFCI 11rank
GFCI 11rating
GFCI 10rank
GFCI 10rating
Change inrank
Change inrating
Jersey 21 652 21 650 – � 2
Guernsey 31 639 31 635 – � 4
Cayman Islands 40 628 46 610 � 7 �18
Hamilton 43 625 41 616 � -2 � 9
Isle ofMan 44 624 40 617 � -4 � 7
British Virgin Islands 45 623 45 611 – �12
Monaco 60 593 59 583 � -1 �10
Gibraltar 63 587 58 584 � -5 � 3
Mauritius 66 578 68 571 � 2 � 7
Malta 72 568 70 568 � -2 –
Bahamas 75 550 72 545 � -3 � 5
“We are doing business in Jersey and Guernsey but our business withLuxembourg and Geneva has increased most strongly.”Trust Fund Manager based in Paris

The Global Financial Centres Index 11 27
Hamilton has a different business mix than the other offshore centres with its speciality being re-insurance. It might therefore be expected to have a different profile amongst respondents and is wellregarded by North American and European respondents.
-150 -100 -50 0 50 100 150
Middle East/Africa (1.3%)
Latin America (0.2%)
North America (4.2%)
Asia/Pacific (6.2%)
Offshore (57.7%)
Europe (30.3%)
324
Chart 30 | Assessments by region – difference from themean – Jersey
-150 -100 -50 0 50 100 150
Middle East/Africa (1%)
Latin America (0.2%)
North America (3.5%)
Asia/Pacific (4.9%)
Offshore (59.3%)
Europe (31.1%)
298
-164
-185
Chart 31 | Assessments by region – difference from themean – Guernsey
-150 -100 -50 0 50 100 150
Middle East/Africa (1.2%)
Latin America (0.2%)
North America (5.9%)
Asia/Pacific (12.5%)
Offshore (50.6%)
Europe (29.6%)
381
Chart 32 | Assessments by region – difference from themean – Cayman Islands
-150 -100 -50 0 50 100 150
Middle East/Africa (0.5%)
Latin America (0.3%)
North America (8.8%)
Asia/Pacific (9.6%)
Offshore (49.4%)
Europe (31.5%)
180
Chart 33 | Assessments by region – difference from themean – Hamilton
Mean withoutEuropean
assessments
Mean withoutEuropean
assessments
Mean withoutEuropean
assessments
Mean withoutEuropean
assessments

28 The Global Financial Centres Index 11
The GFCI World
7 10
1511
45
18
2
17
40
53
67
75
43
51
12
28
76
50
31 21
49
33
22
1
36
1914
47
61
77
63
60
72
25
52
4441 37
46
23
58
3942
68
5456
3413
6
73
74
71
See insetdetailedmap

The Global Financial Centres Index 11 29
4
5
16
32
269
8
273
5738 29
35
64
65
30
66
48
55
20
62
6959
24
70
Broad and deep
Global leaders
Established transnational
Established players
Relatively broad
Global diversified
Transnational diversified
Local diversified
Relatively deep
Global specialists
Transnational specialists
Local nodes
Emerging
Global contenders
Transnational contenders
Evolving centres
The numbers on themap show theGFCI ranking of the relevant centre
30 The Global Financial Centres Index 11
Industry Sectors
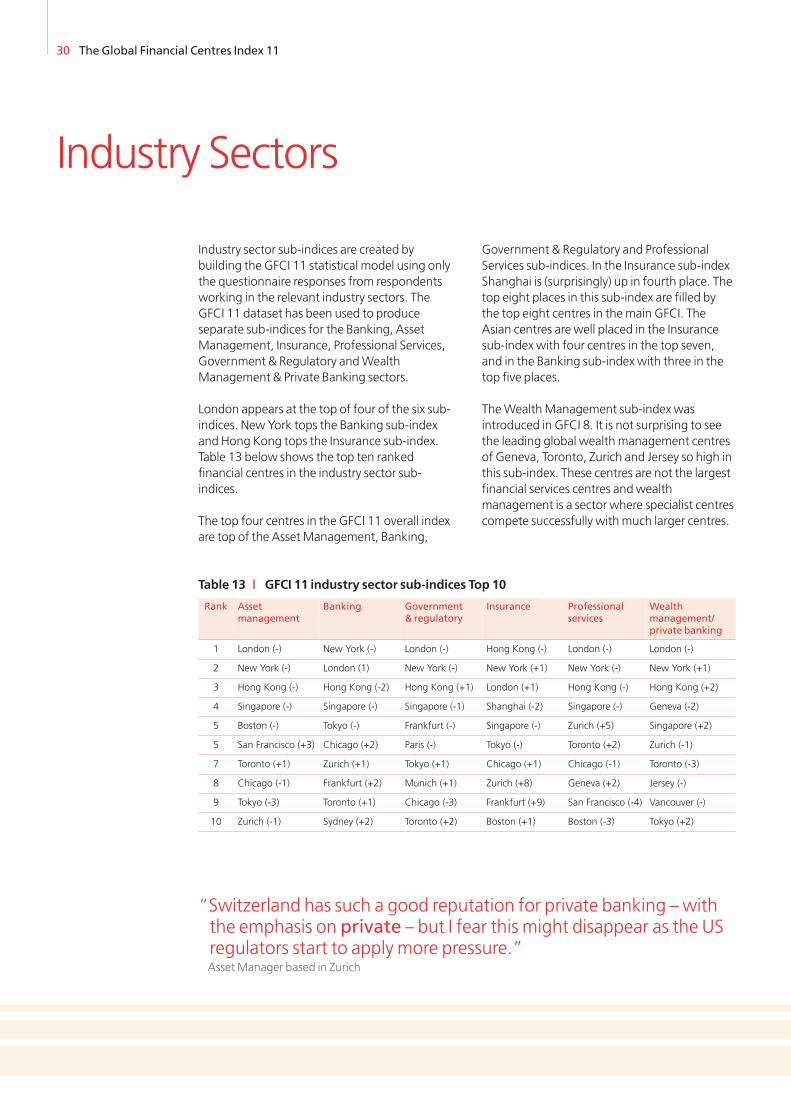
Industry sector sub-indices are created bybuilding the GFCI 11 statistical model using onlythe questionnaire responses from respondentsworking in the relevant industry sectors. TheGFCI 11 dataset has been used to produceseparate sub-indices for the Banking, AssetManagement, Insurance, Professional Services,Government & Regulatory and WealthManagement & Private Banking sectors.
London appears at the top of four of the six sub-indices. New York tops the Banking sub-indexand Hong Kong tops the Insurance sub-index.Table 13 below shows the top ten rankedfinancial centres in the industry sector sub-indices.
The top four centres in the GFCI 11 overall indexare top of the Asset Management, Banking,
Government & Regulatory and ProfessionalServices sub-indices. In the Insurance sub-indexShanghai is (surprisingly) up in fourth place. Thetop eight places in this sub-index are filled bythe top eight centres in the main GFCI. TheAsian centres are well placed in the Insurancesub-index with four centres in the top seven,and in the Banking sub-index with three in thetop five places.
The Wealth Management sub-index wasintroduced in GFCI 8. It is not surprising to seethe leading global wealth management centresof Geneva, Toronto, Zurich and Jersey so high inthis sub-index. These centres are not the largestfinancial services centres and wealthmanagement is a sector where specialist centrescompete successfully with much larger centres.
Table 13 | GFCI 11 industry sector sub-indices Top 10
Rank Assetmanagement
Banking Government& regulatory
Insurance Professionalservices
Wealthmanagement/private banking
1 London (-) New York (-) London (-) Hong Kong (-) London (-) London (-)
2 New York (-) London (1) New York (-) New York (+1) New York (-) New York (+1)
3 Hong Kong (-) Hong Kong (-2) Hong Kong (+1) London (+1) Hong Kong (-) Hong Kong (+2)
4 Singapore (-) Singapore (-) Singapore (-1) Shanghai (-2) Singapore (-) Geneva (-2)
5 Boston (-) Tokyo (-) Frankfurt (-) Singapore (-) Zurich (+5) Singapore (+2)
5 San Francisco (+3) Chicago (+2) Paris (-) Tokyo (-) Toronto (+2) Zurich (-1)
7 Toronto (+1) Zurich (+1) Tokyo (+1) Chicago (+1) Chicago (-1) Toronto (-3)
8 Chicago (-1) Frankfurt (+2) Munich (+1) Zurich (+8) Geneva (+2) Jersey (-)
9 Tokyo (-3) Toronto (+1) Chicago (-3) Frankfurt (+9) San Francisco (-4) Vancouver (-)
10 Zurich (-1) Sydney (+2) Toronto (+2) Boston (+1) Boston (-3) Tokyo (+2)
“Switzerland has such a good reputation for private banking – withthe emphasis on private – but I fear this might disappear as the USregulators start to apply more pressure.”Asset Manager based in Zurich

The instrumental factors used in the GFCI 11model are grouped into five key areas ofcompetitiveness (People, Business Environment,Market Access, Infrastructure and GeneralCompetitiveness). The GFCI 11 factorassessment model is run with one set ofinstrumental factors at a time. Table 14 showsthe top ten ranked centres in each sub-index:
The top four financial centres in GFCI 11 –London, New York, Hong Kong and Singapore –also share the top four places in each of thesesub indices (as they have in the past threeeditions of GFCI). This confirms their strength inall five areas of competitiveness. It also confirmsour belief that a genuinely top global centre iscompetitive in all areas – successful people liketo live and work in successful centres.
Seoul is in fifth place in both the GeneralCompetitiveness and Infrastructure sub-indicesand within the top seven in all five of these sub-indices – it is now up two places in the overallGFCI and is in ninth place overall. Torontoremains in the top ten in the BusinessEnvironment, Market Access and GeneralCompetitiveness sub-indices.
“Seoul is making strides to be amore welcoming city toWesterners but it still has a wayto go.”Investment Banker based in New York
The Global Financial Centres Index 11 31
Five Areas of Competitiveness
Table 14 | GFCI 11 Area of competitiveness sub-indices – Top 10
Rank People Business environment Market access Infrastructure Generalcompetitiveness
1 London (-) London (-) London (-) London (-) London (-)
2 New York (-) New York (-) New York (-) New York (-) New York (-)
3 Hong Kong (-) Hong Kong (-) Hong Kong (-) Hong Kong (-) Hong Kong (-)
4 Singapore (-) Singapore (-) Singapore (-) Singapore (-) Singapore (-)
5 Tokyo (+1) Seoul (+1) Tokyo (+1) Tokyo (+1) Seoul (-)
5 Chicago (+1) Chicago (-1) Zurich (+2) Seoul (-1) Tokyo (+1)
7 Seoul (-) Tokyo (+1) Seoul (+1) Zurich (+2) Chicago (+1)
8 Shanghai (-3) Zurich (+2) Chicago (+2) Chicago (-) Zurich (+6)
9 Boston (+2) Toronto (+1) Shanghai (-4) Geneva (+8) Toronto (+3)
10 Zurich (-) Geneva (+2) Toronto (-) Frankfurt (+6) Shanghai (-4)

It is useful to look at how the leading centres areviewed by respondents working for differentsizes of organisation.
Chart 34 above shows that London is assessedmore highly than both New York and HongKong by respondents from small organisations(with fewer than 100 employees). At the otherend of the scale New York and Hong Kong areassessed slightly higher than London byrespondents from organisations with over5,000 employees. In the mid-sizedorganisations (500 to 1,000 employees) HongKong is a clear leader from London and NewYork.
32 The Global Financial Centres Index 11
Size of Organisation
“London is still the best basefor us for our internationalbusiness.”Director of Small Mergers and AcquisitionsConsulting Business based in London
“You have to be in New York, London and Hong Kong if you haveaspirations to be seen as global.”Investment Banker based in Hong Kong
Chart 34 | Top three centres – average assessments by respondent’s organisation size
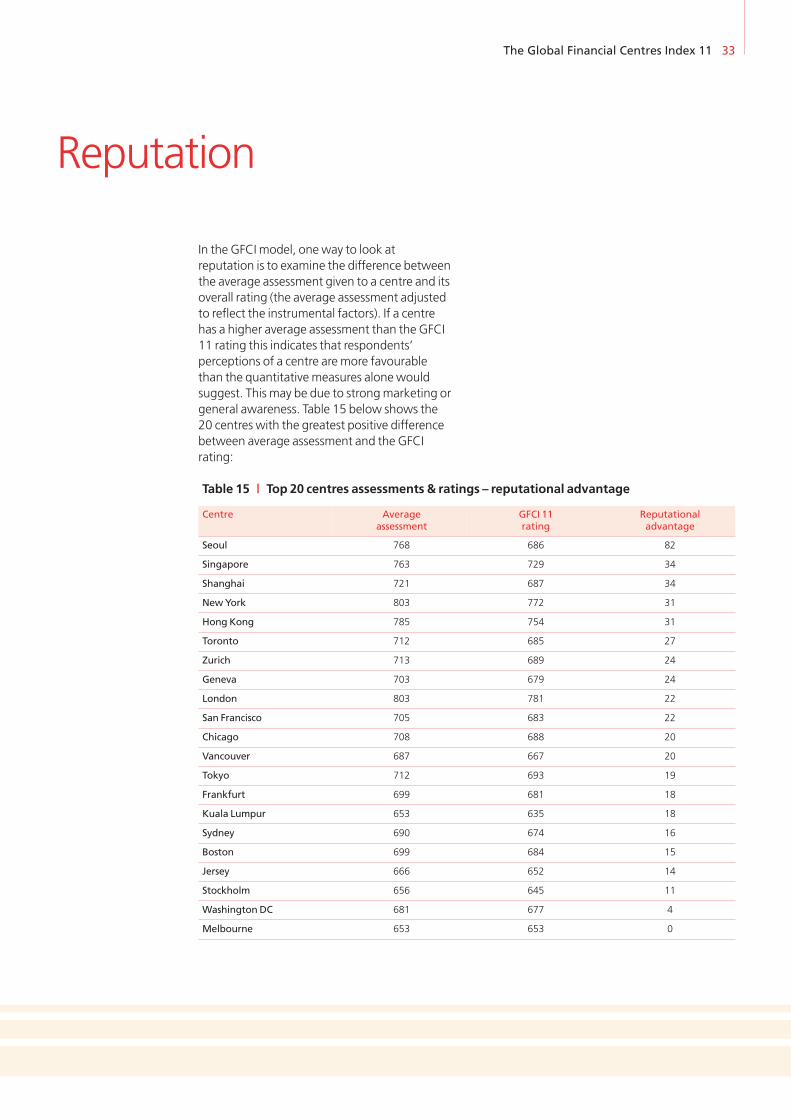
In the GFCI model, one way to look atreputation is to examine the difference betweenthe average assessment given to a centre and itsoverall rating (the average assessment adjustedto reflect the instrumental factors). If a centrehas a higher average assessment than the GFCI11 rating this indicates that respondents’perceptions of a centre are more favourablethan the quantitative measures alone wouldsuggest. This may be due to strong marketing orgeneral awareness. Table 15 below shows the20 centres with the greatest positive differencebetween average assessment and the GFCIrating:
The Global Financial Centres Index 11 33
Reputation
Table 15 | Top 20 centres assessments & ratings – reputational advantage
Centre Averageassessment
GFCI 11rating
Reputationaladvantage
Seoul 768 686 82
Singapore 763 729 34
Shanghai 721 687 34
NewYork 803 772 31
Hong Kong 785 754 31
Toronto 712 685 27
Zurich 713 689 24
Geneva 703 679 24
London 803 781 22
San Francisco 705 683 22
Chicago 708 688 20
Vancouver 687 667 20
Tokyo 712 693 19
Frankfurt 699 681 18
Kuala Lumpur 653 635 18
Sydney 690 674 16
Boston 699 684 15
Jersey 666 652 14
Stockholm 656 645 11
Washington DC 681 677 4
Melbourne 653 653 0

34 The Global Financial Centres Index 11
Overall reputational advantage has remainedfairly stable since GFCI 10. It is notable that fourof the top five financial centres by reputationaladvantage are Asian. It should be stressed thatfor these centres a large proportion offavourable assessments came from other Asiancentres rather than from non-Asian centres.
Table 16 below shows the ten centres with thelowest reputational advantage – an indicationthat respondents’ perceptions of a centre areless favourable than the quantitative measuresalone would suggest:
It is no surprise to us that Athens tops this list orthat Lisbon and Reykjavik are so high up.
Table 16 | GFCI 11 Bottom 10 centres assessments and ratings – reputational advantage
Centre Averageassessment
GFCI 11rating
Reputationaladvantage
Athens 353 468 -115
Tallinn 460 570 -110
Budapest 454 552 -98
Lisbon 484 575 -91
Reykjavik 432 517 -85
Riyadh 490 572 -82
Manila 495 573 -78
Moscow 506 583 -77
Warsaw 541 606 -65
Glasgow 566 627 -61
“The Eurozone continues to suffer from reputational damage. Ittakes years to gain a good reputation and no time at all to lose it!”International Banker based in Frankfurt
The Global Financial Centres Index 11 35
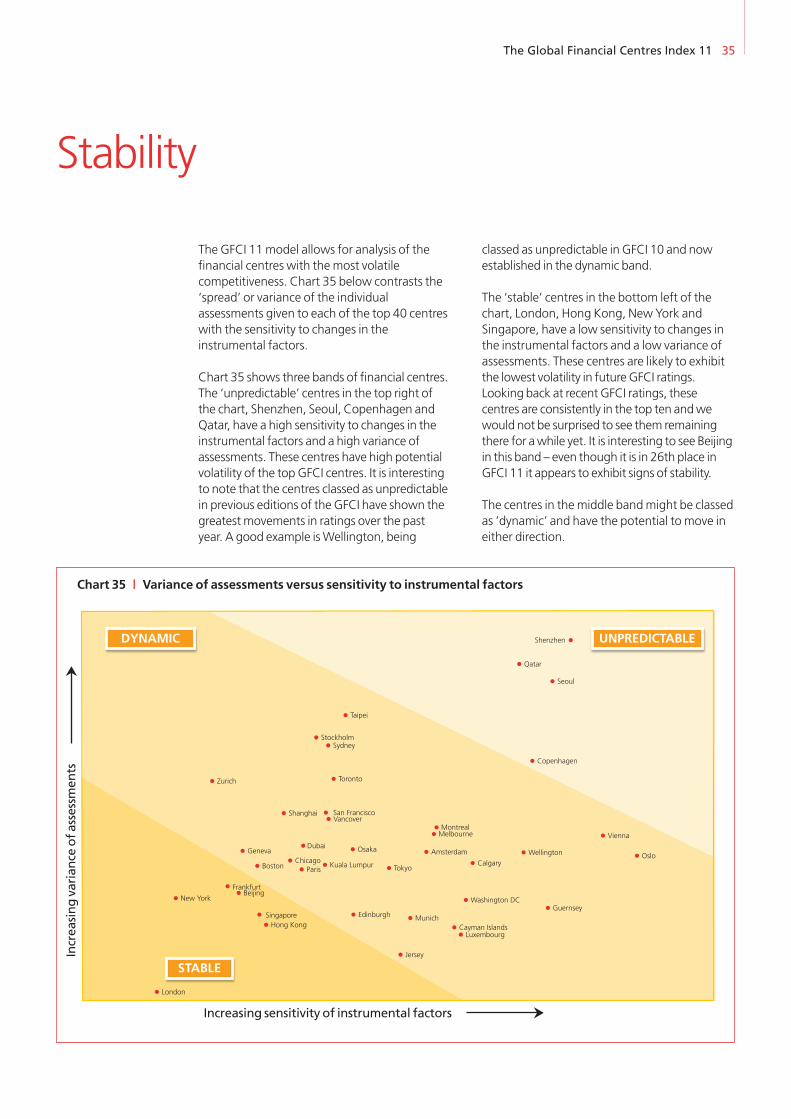
The GFCI 11 model allows for analysis of thefinancial centres with the most volatilecompetitiveness. Chart 35 below contrasts the‘spread’ or variance of the individualassessments given to each of the top 40 centreswith the sensitivity to changes in theinstrumental factors.
Chart 35 shows three bands of financial centres.The ‘unpredictable’ centres in the top right ofthe chart, Shenzhen, Seoul, Copenhagen andQatar, have a high sensitivity to changes in theinstrumental factors and a high variance ofassessments. These centres have high potentialvolatility of the top GFCI centres. It is interestingto note that the centres classed as unpredictablein previous editions of the GFCI have shown thegreatest movements in ratings over the pastyear. A good example is Wellington, being
classed as unpredictable in GFCI 10 and nowestablished in the dynamic band.
The ‘stable’ centres in the bottom left of thechart, London, Hong Kong, New York andSingapore, have a low sensitivity to changes inthe instrumental factors and a low variance ofassessments. These centres are likely to exhibitthe lowest volatility in future GFCI ratings.Looking back at recent GFCI ratings, thesecentres are consistently in the top ten and wewould not be surprised to see them remainingthere for a while yet. It is interesting to see Beijingin this band – even though it is in 26th place inGFCI 11 it appears to exhibit signs of stability.
The centres in the middle band might be classedas ‘dynamic’ and have the potential to move ineither direction.
Stability
Frankfurt
Geneva
London
StockholmSydney
Zurich
Hong KongSingapore
New York
Toronto
CalgaryChicagoParisBoston
San Francisco
MontrealMelbourne
Seoul
Copenhagen
Munich
Washington DC
Shanghai
OsakaOslo
Taipei
Tokyo
Qatar
Wellington
Vienna
Kuala Lumpur
Cayman Islands
Guernsey
Jersey
Vancover
Luxembourg
Edinburgh
Amsterdam
Beijing
Shenzhen
Dubai
Increasing sensitivity of instrumental factors
Increasingvarianceofassessm
ents
�
�
Chart 35 | Variance of assessments versus sensitivity to instrumental factors
UNPREDICTABLEDYNAMIC
STABLE

36 The Global Financial Centres Index 11
Appendices1. Assessment Details
Table 17 | Assessment details
Centre GFCI 11 Number ofassessments
Averageassessment
Standarddeviation ofassessments
London 781 1,384 734 166
NewYork 772 1,162 764 179
Hong Kong 754 1,068 759 185
Singapore 729 828 753 184
Tokyo 693 575 751 205
Zurich 688 490 711 176
Shanghai 687 646 710 189
Chicago 687 505 726 188
Seoul 686 591 731 228
Toronto 685 422 684 196
Boston 684 350 705 184
San Francisco 683 468 693 195
Frankfurt 681 378 705 184
Geneva 679 594 703 182
Washington DC 677 626 713 216
Sydney 674 402 701 196
Vancouver 667 280 685 195
Montreal 658 157 655 212
Munich 656 655 658 208
Melbourne 653 247 709 211
Jersey 652 613 665 206
Paris 650 149 664 192
Luxembourg 648 163 733 215
Osaka 647 156 669 199
Stockholm 645 262 700 194
Beijing 644 218 672 181
Taipei 643 686 640 198
Calgary 642 68 501 217
Dubai 641 180 656 191
Wellington 640 549 668 224
Guernsey 639 84 631 227
Shenzhen 638 592 665 230
Amsterdam 637 142 604 210
Vienna 636 510 636 235
Kuala Lumpur 636 113 579 195
Copenhagen 634 484 593 225
Edinburgh 632 594 603 199
Qatar 629 456 659 244
Oslo 628 200 604 239
Centre GFCI 11 Number ofassessments
Averageassessment
Standarddeviation ofassessments
Cayman Islands 628 743 593214
Glasgow 627 352 605 236
Helsinki 626 391 630 234
Hamilton 625 117 616 188
Isle ofMan 624 139 602 216
British VirginIslands
623 534 593 228
Dublin 621 208 596 216
Brussels 620 387 643 208
AbuDhabi 618 262 544 189
Madrid 617 270 711 200
Sao Paulo 612 235 600 215
Mexico City 610 422 601 208
Milan 609 156 617 209
Rio de Janeiro 608 93 584 226
Warsaw 606 125 581 245
Johannesburg 603 221 589 187
Prague 602 144 637 223
Bahrain 600 191 614 196
Rome 596 103 610 220
Bangkok 594 255 592 184
Monaco 593 229 597 204
Istanbul 590 159 610 232
Jakarta 588 235 603 196
Gibraltar 587 200 589 218
Mumbai 584 376 569 202
Moscow 583 113 560 225
Mauritius 578 113 572 219
Buenos Aires 577 135 613 217
Lisbon 575 271 607 234
Manila 573 108 570 206
Riyadh 572 359 563 205
Tallinn 570 258 603 273
Malta 568 115 588 202
St Petersburg 567 74 601 257
Budapest 552 319 578 210
Bahamas 550 56 557 216
Reykjavik 517 157 496 271
Athens 468 181 454 211

The Global Financial Centres Index 11 37
3. Methodology
The GFCI provides ratings for financial centrescalculated by a ‘factor assessment model’ thatuses two distinct sets of input:
• Instrumental factors (external indices thatcontribute to competitiveness): objectiveevidence of competitiveness was sought froma wide variety of comparable sources. Forexample, evidence about the infrastructurecompetitiveness of a financial centre is drawnfrom a survey of property and an index ofoccupancy costs. Evidence about a fair andjust business environment is drawn from acorruption perception index and an opacityindex. A total of 80 external sources wereused in GFCI 11. Not all financial centres arerepresented in all the external sources, andthe statistical model takes account of thesegaps.
• Financial centre assessments: by means ofan online questionnaire, runningcontinuously since 2007, we use 26,853financial centre assessments drawn from1,778 respondents in GFCI 11. 6,094assessments from 399 respondents have beengathered since GFCI 10.
The 80 instrumental factors were selectedbecause the features they measure contribute invarious ways to the fourteen competitivenessfactors identified in previous research2. Theseare shown in Table 21.
2 ‘The Competitive Position of London as a Global Financial Centre’, Z/Yen Limited, The Corporation of London, 2005
2. Respondents’ Details
Table 18 | Respondents byindustry sector
Table 19 | Respondents bysize of organisation
Sector Total %
Asset Management 181 10.2%
Banking 424 23.8%
Government & Regulatory 90 5.1%
Insurance 265 14.9%
Professional Services 305 17.2%
Wealth Management 128 7.2%
Other 385 21.7%
Total 1,778
Number of employeesworldwide
Total %
Fewer than 100 486 27.3%
100 to 500 279 15.7%
500 to 1,000 186 10.5%
1,000 to 2,000 91 5.1%
2,000 to 5,000 153 8.6%
More than 5,000 566 31.8%
Unspecified 17 1.0%
Total 1,778
Location Total %
Asia/Pacific 604 34.0%
Europe 527 29.6%
Latin America 6 0.3%
Middle East/Africa 27 1.5%
North America 195 11.0%
Offshore 419 23.6%
Total 1,778
Table 20 | Respondents by location
Table 21 | Competitiveness factorsand their relative importance
Competitiveness factors Rank
The availability of skilled personnel 1
The regulatory environment 2
Access to international financialmarkets
3
The availability of businessinfrastructure
4
Access to customers 5
A fair and just business environment 6
Government responsiveness 7
The corporate tax regime 8
Operational costs 9
Access to suppliers of professionalservices
10
Quality of life 11
Culture & language 12
Quality / availability of commercialproperty
13
The personal tax regime 14

38 The Global Financial Centres Index 11
Financial centres are added to the GFCI modelwhen they receive five or more mentions in theonline questionnaire in response to thequestion: “Are there any financial centres thatmight become significantly more importantover the next 2 to 3 years?” A centre is onlygiven a GFCI rating and ranking if it receivesmore than 200 assessments from other centresin the online survey.
At the beginning of our work on the GFCI, anumber of guidelines were set out. AdditionalInstrumental Factors are added to the GFCImodel when relevant and meaningful ones arediscovered:
• indices should come from a reputable bodyand be derived by a sound methodology;
• indices should be readily available (ideally inthe public domain) and be regularly updated;
• updates to the indices are collected andcollated every six months;
• no weightings are applied to indices;
• indices are entered into the GFCI model asdirectly as possible, whether this is a rank, aderived score, a value, a distribution around amean or a distribution around a benchmark;
• if a factor is at a national level, the score willbe used for all centres in that country; nation-based factors will be avoided if financialcentre (city)-based factors are available;
• if an index has multiple values for a city ornation, the most relevant value is used (andthe method for judging relevance is noted);
• if an index is at a regional level, the mostrelevant allocation of scores to each centre ismade (and the method for judging relevanceis noted);
• if an index does not contain a value for aparticular city, a blank is entered against thatcentre (no average or mean is used). Onlyindices which have values for at least onethird of the financial centres (currently 26) willbe included.
Creating the GFCI does not involve totaling oraveraging scores across instrumental factors. Anapproach involving totaling and averagingwould involve a number of difficulties:
• indices are published in a variety of differentforms: an average or base point of 100 withscores above and below this; a simpleranking; actual values (e.g. $ per square footof occupancy costs); a composite ‘score’;
• indices would have to be normalised, e.g. insome indices a high score is positive while inothers a low score is positive;
• not all centres are included in all indices;
• the indices would have to be weighted.
The guidelines for financial centre assessmentsby respondents are:
• responses are collected via an onlinequestionnaire which runs continuously. A linkto this questionnaire is emailed to the targetlist of respondents at regular intervals andother interested parties can fill this in byfollowing the link given in the GFCIpublications;
• financial centre assessments will be includedin the GFCI model for 24 months after theyhave been received;
• respondents rating fewer than 3 or more thanhalf of the centres are excluded from themodel;
• respondents who do not say where they workare excluded;
• financial centre assessments from the monthwhen the GFCI is created are given fullweighting and earlier responses are given areduced weighting on a log scale.

The financial centre assessments andinstrumental factors are used to build apredictive model of centre competitivenessusing a support vector machine (SVM). The SVMused for the GFCI is PropheZy – Z/Yen’sproprietary system. SVMs are based uponstatistical techniques that classify and modelcomplex historic data in order to makepredictions of new data. SVMs work well ondiscrete, categorical data but also handlecontinuous numerical or time series data. TheSVM used for the GFCI provides informationabout the confidence with which each specificclassification is made and the likelihood of otherpossible classifications.
A factor assessment model is built using thecentre assessments from responses to the onlinequestionnaire. Assessments from respondents’home centres are excluded from the factorassessment model to remove home bias. Themodel then predicts how respondents wouldhave assessed centres they are not familiar with,by answering questions such as:
If an investment banker gives Singaporeand Sydney certain assessments then, basedon the relevant data for Singapore, Sydneyand Paris, howwould that person assessParis?
Or
If a pension fundmanager gives EdinburghandMunich a certain assessment then,based on the relevant data for Edinburgh,Munich and Zurich, howwould that personassess Zurich?
Financial centre predictions from the SVM arere-combined with actual financial centreassessments (except those from therespondents’ home centres) to produce theGFCI – a set of financial centre ratings. The GFCIis dynamically updated either by updating andadding to the instrumental factors or throughnew financial centre assessments. Theseupdates permit, for instance, a recentlychanged index of rental costs to affect thecompetitiveness rating of the centres.
The Global Financial Centres Index 11 39
0.0
0.2
0.4
0.6
0.8
Logm
ultiple
1.00
0-1-2-3-4-5-6-7-8-9-10-11
-12-13
-14-15
-16-17
-18-19
-20-21
-22-23
Months
Chart 36 | Log scale for timeweightings

40 The Global Financial Centres Index 11
The process of creating the GFCI is outlineddiagrammatically below.
It is worth drawing attention to a fewconsequences of basing the GFCI oninstrumental factors and questionnaireresponses.
• several indices can be used for eachcompetitive factor;
• a strong international group of ‘raters’ hasdeveloped as the GFCI progresses;
• sector-specific ratings are available - using thebusiness sectors represented by questionnairerespondents. This makes it possible to rateLondon as competitive in Insurance (forinstance) while less competitive in AssetManagement (for instance);
• the factor assessment model can be queriedin a ‘what if’ mode – “how much wouldLondon rental costs need to fall in order toincrease London’s ranking against NewYork?”
Part of the process of building the GFCI isextensive sensitivity testing to changes in factorsof competitiveness and financial centreassessments. There are over ten million datapoints in the current model. The accuracy ofpredictions given by the SVM are regularlytested against actual assessments.
Chart 36 | The GFCI process
UpdatedGFCI published
�
�
Instrumental FactorUpdate
�
�
Instrumental Factor
Instrumental Factor
Instrumental Factor
Instrumental Factor
Competitiveness Factor
Competitiveness Factor
Competitiveness Factor
Competitiveness Factor
Competitiveness Factor
� Change in FinancialCentre Assessments
�Instrumental FactorPrediction Engine –
PropheZy
�
Regular Online Surveyof Financial Centre
Assessments

The Global Financial Centres Index 11 41
4. Instrumental Factors
Table 22 shows how closely instrumental factorrankings correlate with the GFCI 11 rankings forthe top 20 instrumental factors:
It is interesting (but perhaps unsurprising) to seethat the broader measures of competitivenessseem to act as good indicators for financialcentre competitiveness. Four of the top fivemost highly correlated instrumental factors areall broad measures of competitiveness ratherthan being specific to financial services. Thisindicates that cities that are successful at mostthings are likely to be very competitive financialcentres. A full list of instrumental factors isshown overleaf.
Table 22 | Top20 instrumental factors bycorrelationwithGFCI 11
Instrumental factor Correlationmeasured by R2
MA2 Centres of Commerce Index 0.599
G1 World Competitiveness Scoreboard 0.562
MA18 Credit Ratings 0.534
G2 Global Competitiveness Index 0.509
G12 Global Power City Index 0.506
BE16 Banking Industry CountryRisk Assessments 0.451
G14 Global Cities Index 0.436
G8 Global Innovation Index 0.429
MA1 Capital Access Index 0.378
G13 World Cities Survey 0.354
MA3 The Access Opportunities Index 0.342
I12 Global Air Travel Connectivity 0.332
BE18 Political Risk 0.315
G17 Innovation Cities Global Index 0.292
I5 E – Readiness Score 0.287
I9 Quality of Roads 0.276
MA5 Capitalisation of Stock Exchanges 0.276
BE1 Business Environment 0.269
I8 Quality of Ground Transport Network 0.262
BE21 Financial Secrecy Index 0.260

42 The Global Financial Centres Index 11
Table 23 | People related instrumental factors
Instrumental factor Source WebsiteUpdated since
GFCI 10
Graduates in Social Science Business and Law World Bank www.worldbank.org/education �
Gross Tertiary Education Ratio World Bank www.worldbank.org/education �
Visa Restrictions Index Henley & Partners http://www.henleyglobal.com/citizenship/visa-re-strictions/
Human Development Index UN Development Programme http://hdr.undp.org �
Citizens Purchasing Power City Mayors http://www.citymayors.com/economics/usb-pur-chasing-power.html
Quality of Living Survey Mercer HR www.mercerhr.com �
Happy Planet Index New Economics Foundation (NEF) http://www.happyplanetindex.org/explore/global/index.html
Number of High Net Worth Individuals City Bank & Knight Frank http://www.knightfrank.com/wealthreport/
Personal Safety Index Mercer HR www.mercerhr.com �
Homicide Rates UN Office of Drugs and Crime http://www.unodc.org/unodc/en/data-and-analysis/
NEW
World’s Top Tourism Destinations Euromonitor Archive www.euromonitor.org �
Average Days with Precipitation per Year Sperling’s Best Places www.bestplaces.net
Table 24 | Business environment related instrumental factors
Instrumental factor Source WebsiteUpdated since
GFCI 10
Business Environment EIU www.economist.com/markets/rankings �
Ease of Doing Business Index The World Bank www.doingbusiness.org/economyrankings �
Operational Risk Rating EIU �
Real Interest Rate World Bank http://data.worldbank.org/indicator/FR.INR.RINR �
Projected City Economic Growth Price Waterhouse Cooper https://www.ukmediacentre.pwc.com/content/detail.aspx?releaseid=3421&newsareaid=2
Global Services Location Index AT Kearney www.atkearney.com
Opacity Index Milken Institute www.milkeninstitute.org/publications
Corruption Perceptions Index Transparency International www.transparency.org/publications �
Wage Comparison Index UBS www.ubs.com �
Corporate Tax Rates Price Waterhouse Coopers n/a �
Employee Effective Tax Rates Price Waterhouse Coopers n/a
Personal Tax Rates OECD www.oecd.org �
Total Tax Receipts (as % of GDP) OECD http://oberon.sourceoecd.org �
Bilateral Tax InformationExchange Agreements
OECD http://www.oecd.org �
Economic Freedom of the World Fraser Institute www.freetheworld.com/release.html �
Banking Industry Country Risk Assessments Standard & Poors http://www2.standardandpoors.com �
Government Debt as Percentage of GDP CIA World Fact Book https://www.cia.gov/library/publications/the-world-factbook/rankorder/2186rank.html
Political Risk Index Exclusive Analysis Ltd http://www.exclusive-analysis.com/
Global Peace Index The Institute of Economics and Peace http://www.visionofhumanity.org/info-center/global-peace-index-2011/
NEW
City GDP Rank Foreign Policy Magazine http://www.foreignpolicy.com/node/373401
Financial Secrecy Index Tax Justice Network http://www.financialsecrecyindex.com/ NEW

The Global Financial Centres Index 11 43
Table 25 | Market access related instrumental factors
Instrumental factor Source WebsiteUpdated since
GFCI 10
Capital Access Index Milken Institute www.milkeninstitute.org/research
Centres of Commerce Master Card www.mastercard.com/us/company/en/wcoc/index.html
Access Opportunities Index SRI International www.sri.com/news/releases
Securitisation International Financial Services London www.ifsl.org.uk
Capitalisation of Stock Exchanges World Federation of Stock Exchanges www.world-exchanges.org �
Value of Share Trading World Federation of Stock Exchanges www.world-exchanges.org �
Volume of Share Trading World Federation of Stock Exchanges www.world-exchanges.org �
Broad Stock Index Levels World Federation of Stock Exchanges www.world-exchanges.org �
Value of Bond Trading World Federation of Stock Exchanges www.world-exchanges.org �
Volume of Stock Options Trading World Federation of Stock Exchanges www.world-exchanges.org �
Volume of Stock Futures Trading World Federation of Stock Exchanges www.world-exchanges.org �
Domestic Credit Provided by Banks (% GDP) World Bank http://data.worldbank.org/indicator/FS.AST.DOMS.GD.ZS
�
Percentage of Firms Using Bank Credit toFinance Investment
World Bank http://data.worldbank.org/indicator/IC.FRM.BNKS.ZS
�
Total Net Assets of Mutual Funds Investment Company Institute http://www.icifactbook.org/
Islamic Finance International Financial Services London(IFSL)
http://www.thecityuk.com/what-we-do/the-research-centre/reports.aspx
Net External Position of Banks Bank for International Settlements http://www.bis.org/statistics/bankstats.htm �
External Position of Central Banks(as % GDP)
Bank for International Settlements http://www.bis.org/statistics/bankstats.htm �
Global Credit Rankings Institutional Investor Magazine http://www.iimagazinerankings.com/rank-ingsRankCCMaGlobal09/globalRanking.asp
Table 26 | Infrastructure related instrumental factors
Instrumental factor Source WebsiteUpdated since
GFCI 10
Office Occupancy Costs CBRE http://www.cbre.com/EN/Research/Global+Re-ports/
Office Space Across the World Cushman & Wakefield www.cushwake.com/cwglobal
Global Property Index Investment Property Databank http://www.ipd.com/ �
Real Estate Transparency Index Jones Lang LaSalle www.joneslanglasalle.co.uk
E-Readiness Ranking EIU www.economist.com/markets/rankings
Telecommunication Infrastructure Index United Nations http://www.unpan.org/egovkb/global_reports/08report.htm
City Infrastructure Mercer HR http://www.mercer.com/qualityofliving
Quality of Ground Transport Network World Economic Forum http://www.weforum.org/en/initiatives/gcp/TravelandTourismReport
Quality of Roads World Economic Forum http://www.weforum.org/en/initiatives/gcp/TravelandTourismReport
Roadways per Land Area CIA World Fact Book https://www.cia.gov/library/publications/the-world-factbook/rankorder/2085rank.html
Railways per Land Area CIA World Fact Book https://www.cia.gov/library/publications/the-world-factbook/rankorder/2121rank.html
Global Air Travel Connectivity City Rank http://www.cityrank.ch/indicators/14

44 The Global Financial Centres Index 11
Table 27 | General competitiveness related instrumental factors
Instrumental factor Source WebsiteUpdated since
GFCI 10
World Competitiveness Scoreboard IMD www.imd.ch/research
Global Competitiveness Index World Economic Forum www.weforum.org �
Global Business Confidence Grant Thornton www.grantthorntonibos.com �
Foreign Direct Investment Inflows UNCTAD http://www.unctad.org �
FDI Confidence AT Kearney http://www.atkearney.com/images/global/pdf/Investing_in_a_Rebound-FDICI_2010.pdf
City to Country GDP Ratio World BankPrice Waterhouse Cooper
https://www.ukmediacentre.pwc.com/content/detail.aspx?releaseid=3421&newsareaid=2
�
GDP per Person Employed World Bank http://data.worldbank.org/indicator/SL.GDP.PCAP.EM.KD
Global Innovation Index INSEAD http://www.globalinnovationindex.org/gii/ NEW
Global Intellectual Property Index Taylor Wessing http://www.taylorwessing.com/ipindex/
Retail Price Index Economist www.economist.com/markets/indicators �
Price Levels UBS http://www.ubs.com/1/e/wealthmanagement/wealth_management_research/prices_earnings.html
NEW
Global Power City Index Institute for Urban Strategies & MoriMemorial Foundation
http://www.mori-m-foundation.or.jp/english/index.shtml
�
World Cities Survey City Bank & Knight Frank http://www.knightfrank.com/wealthreport/
Global Cities Index AT Kearney http://www.foreignpolicy.com/story/cms.php?story_id=4509
Number of International Fairs & Exhibitions World Economic Forum http://www.weforum.org/en/initiatives/gcp/TravelandTourismReport
City Population Density City Mayors Statistics http://www.citymayors.com/statistics/largest-cities-density-125.html
Innovation Cities Global Index 2thinknow Innovation Cities™ Project http://www.innovation-cities.com/innovation-cities-global-index-2010-city-rankings/
�
Long Finance
Established in 2007 by Z/Yen Group inconjunction with GreshamCollege, theLong Finance initiative beganwith aconundrum – “whenwould we know ourfinancial system is working?” Long Finance aimsto “improve society’s understanding and use offinance over the long term” in contrast to theshort-termism that defines today’s financial andeconomic views.
Long Finance publishes papers under theFinancial Centre Futures series in order to initiatediscussion on the changing landscape of globalfinance. Financial Centre Futures consists of in-depth research as well as the popular GlobalFinancial Centres Index (GFCI). Long Finance hasinitiated two other publication series: EternalBrevities and Finance Shorts. Long Finance is acommunity which can be explored and joined atwww.longfinance.net.

FINANCIAL CENTRE FUTURESIS SPONSORED BY
www.qfc.com.qa
The Qatar Financial Centre is afinancial centre established by thegovernment of Qatar in 2005 toattract international financial services
AND PRODUCED BY
www.zyen.com
As the City of London’s leadingcommercial think-tank, Z/Yen helpsorganisations make better choices.
Price: £10ISBN number – 978-0-9546207-7-6
www.longfinance.net