then click the box for normal probability plot. in the box labeled standardized residual plots,...
TRANSCRIPT

then click the boxfor Normal probability plot.
In the box labeled Standardized Residual Plots, first click the checkbox for Histogram,
Multiple Linear Regression:
Standardized Residual Plots

This tutorial requests none of the other plots available in the Linear Regression procedure. Click the Continue button.
Multiple Linear Regression:
Standardized Residual Plots

The independent variables can be entered into the analysis using five different methods. This tutorial includes the Enter and Stepwise methods.
Choose one of the following:
Multiple Linear Regression:
Method of Variable Entry
• Enter • Stepwise

The independent variables can be entered into the analysis using five different methods. This tutorial includes the Enter and Stepwise methods.
Choose one of the following:
Multiple Linear Regression:
Enter Method
• Enter • Stepwise

Enter is the default method of variable entry. Click the OK button to run the Multiple Linear Regression procedure.
Multiple Linear Regression:
Enter Method

The independent variables can be entered into the analysis using five different methods. This tutorial includes the Enter and Stepwise methods.
Choose one of the following:
Multiple Linear Regression:
Stepwise Method
• Enter • Stepwise

To select the stepwise method of variable entry, click the drop-down arrow for Method (next to Enter, which is the default method).
Multiple Linear Regression:
Stepwise Method

Point to Stepwise
Multiple Linear Regression:
Stepwise Method

Multiple Linear Regression:
Stepwise Method
Point to Stepwiseand click.

Multiple Linear Regression:
Stepwise Method
Click the OK button to run the Multiple Linear Regression procedure.

Multiple Linear Regression Output:
Descriptive Statistics
The labels and format of your output may be somewhat different.
Next

Multiple Linear Regression Output:
Correlations
Next
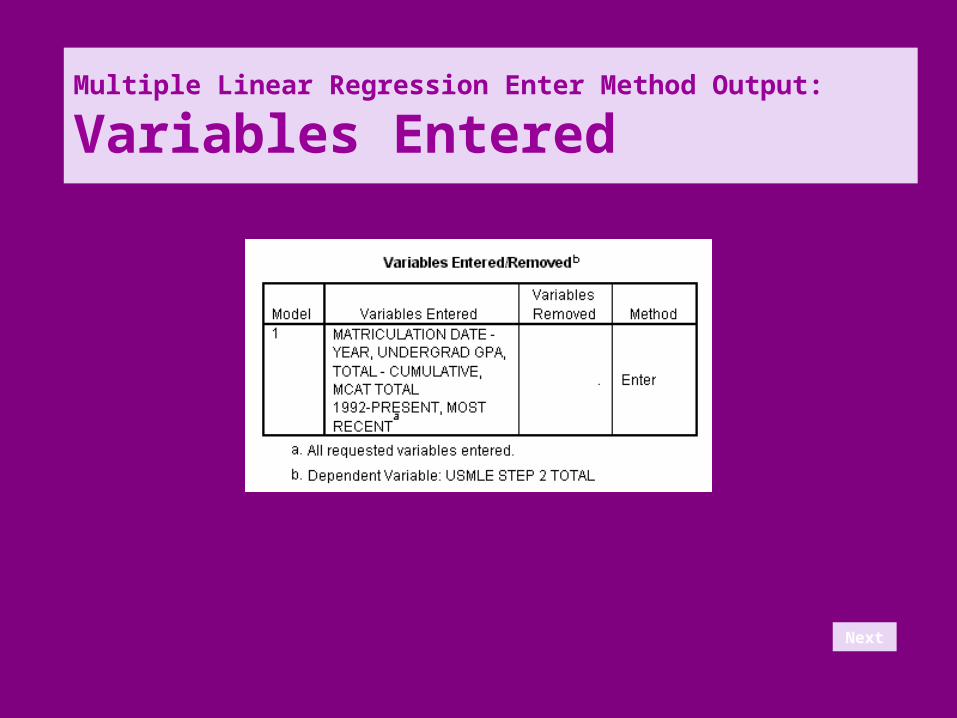
Multiple Linear Regression Enter Method Output:
Variables Entered
Next

Multiple Linear Regression Enter Method Output:
Model Summary
Next
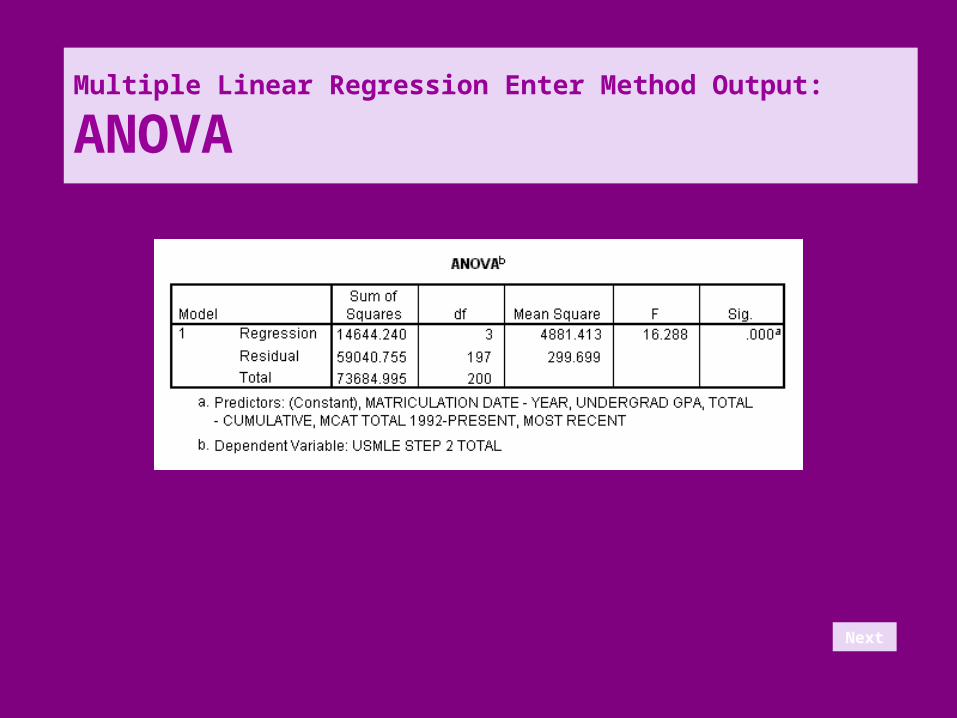
Multiple Linear Regression Enter Method Output:
ANOVA
Next

Multiple Linear Regression Enter Method Output:
Coefficients and Correlations
Next

Multiple Linear Regression Enter Method Output:
Residuals Statistics
Next

Multiple Linear Regression Enter Method Output:
Residuals Histogram
Next

Multiple Linear Regression Enter Method Output:
Plot of Standardized Residuals
Next

Multiple Linear Regression Output:
Descriptive Statistics
The labels and format of your output may be somewhat different.
Next

Multiple Linear Regression Output:
Correlations
Next

Multiple Linear Regression Stepwise Method Output:
Variables Entered
Next

Multiple Linear Regression Stepwise Method Output:
Model Summary
Next

Multiple Linear Regression Stepwise Method Output:
ANOVA
Next

Multiple Linear Regression Stepwise Method Output:
Coefficients and Correlations
Next

Multiple Linear Regression Stepwise Method Output:
Excluded Variables
Next
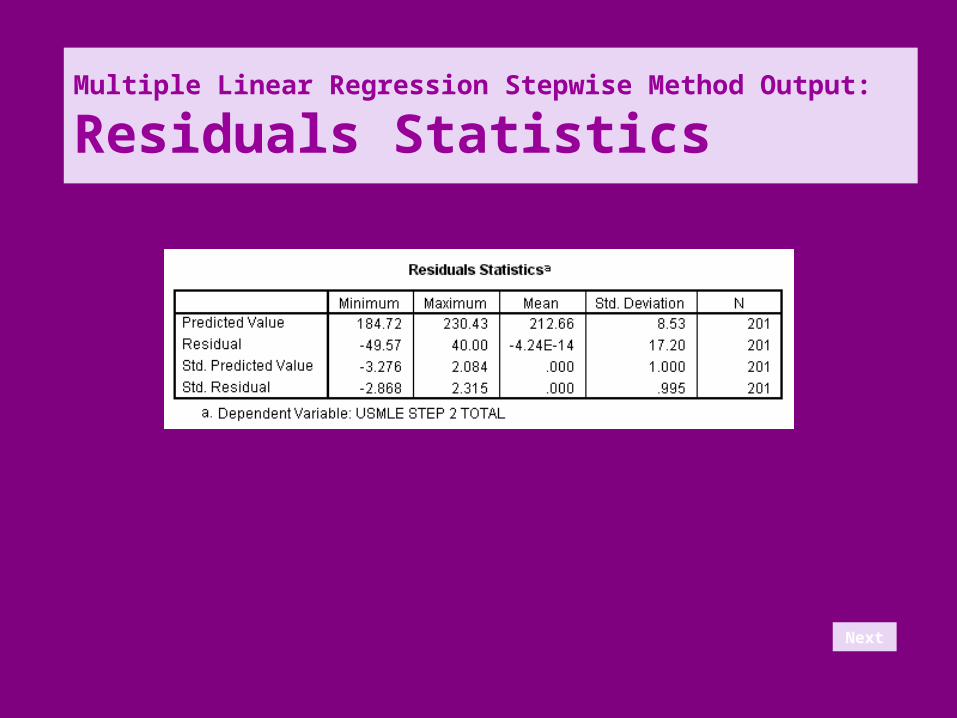
Multiple Linear Regression Stepwise Method Output:
Residuals Statistics
Next

Multiple Linear Regression Stepwise Method Output:
Residuals Histogram
Next

Multiple Linear Regression Stepwise Method Output:
Plot of Standardized Residuals
Next

An Interactive Tutorial for SPSS 10.0 for Windows©:
Multiple Linear Regression
• Repeat this tutorial
Click one of the following:
• Return to the choice of methods of variable entry
• Return to the list of tutorials