theories, techniques and the formation of german business ... · german business cycle forecasts:...
TRANSCRIPT
Department Socioeconomics
Theories, techniques and the formation of
German business cycle forecasts: Evidence
from a survey among professional forecasters
Jörg Döpke
Ulrich Fritsche
Gabi Waldhof
DEP (Socioeconomics) Discussion Papers
Macroeconomics and Finance Series
1/2017
Hamburg, 2017
Theories, techniques and the formation of German business cycle
forecasts: Evidence from a survey among professional forecasters
Jorg Dopke∗, Ulrich Fritsche†, Gabi Waldhof‡
July 19, 2017
Abstract
The paper reports results of a survey among active forecasters of the German business cycle.Relying on 82 respondents from 37 different institutions, we investigate what models and theo-ries forecasters subscribe to and find that they are pronounced conservative in the sense, thatthey overwhelmingly rely on methods and theories that have been well-established for a longtime, while more recent approaches are relatively unimportant for the practice of business cycleforecasting. DSGE models are mostly used in public institutions. In line with findings in theliterature there are tendencies of “leaning towards consensus” (especially for public institutions)and “sticky adjustment of forecasts” with regard to new information. We find little evidencethat the behaviour of forecasters has changed fundamentally since the Great Recession but thereare signs that forecast errors are evaluated more carefully. Also, a stable relationship betweenpreferred theories and methods and forecast accuracy cannot be established. (150 words)
Keywords: Forecast error evaluation, questionnaire, survey, business cycle forecast, professionalforecaster
JEL classification: E32, E37, C83
∗University of Applied Sciences Merseburg (Hochschule Merseburg)†Corresponding author: Ulrich Fritsche, Universitat Hamburg, Department Socioeconomics, Welckerstr. 8,
20354 Hamburg, Other affiliations: KOF ETH Zurich, GWU Research Program on Forecasting, email: E-Mail:[email protected]: We thank Christian Breuer, seminar participants at TU Chemnitz and Johannes Gutenberg Uni-versitat Mainz, as well as participants at the 1st annual workshop of the German Science Foundation (DFG) PriorityProgram 1859 “Experience and Expectations: Historical Foundations of Economic Behaviour” for helpful comments.Michael Braun (GESIS Leibniz Institute for the Social Sciences Mannheim) gave highly valuable comments on anearly draft of the survey. We thank the DFG for financial support (project “Macroeconomic Forecasting in GreatCrisis” within the Priority Program 1859).‡Martin-Luther-Universitat Halle-Wittenberg
1
1 Introduction
Professional forecasters are a special caste of the econ tribe (Leijonhufvud, 1973). Ever since theinvention of professional economic forecasting as a business some members of the caste regularlyattract public attention (Friedman, 2014; FAZ, 2016) and are often regarded as a “synonym” forthe “prototype” economist (Nienhaus, 2009). In reality, however, the work of this group is to alarge extent a “black box” for other (i.e. academic) economists or the general public.
So, why are professional forecasters, possible interactions among them, their work and forecast-ing models of interest at all?
First, policy-relevant institutions as ECB or the Federal Reserve System in the U.S. but alsoprivate firms like “Consensus Economics” regularly poll forecasters on how economically educatedactors form their expectations of future macroeconomic development. Arguably, professional fore-casters seem to play a prominent role in shaping society’s expectations on economic issues even ifjournalists and politicians regularly blame them as “duds”. Second, rational inattention models(Sims, 1998, 2003; Woodford, 2002; Mackowiak and Wiederholt, 2009) as well as models of stickyinformation (Mankiw, 2006) received a lot of interest in the last couple of years in macroeconomics.Carroll (2003) implicitly assumes a sticky information environment and delivers a model basedon “epidemiology” (= informedness as a passive desease infection) to model the trickle-down ofinformation flows from highly informed experts to the general public, Coibion and Gorodnichenko(2015) argue that the dynamics of expectation formation and the updating of expectations asobserved in survey data is more in line with “rational inattention”. As different models of ex-pectation formation compete with each other, it is therefore necessary to investigate the processof forecasting itself. Third, the turmoil of the recent financial crisis and the deep recession in itsaftermath brought economists, economic models and especially the forecasters in Leijonhufvud’secon tribe story under the harsh criticism of not having foreseen such a crisis. The catchy titleof Carmen Reinhart’s and Ken Rogoff’s much disputed book on financial crises – “This time isdifferent” ironically mirrors that (Reinhart and Rogoff, 2009). The topic of short memory is old ineconomic history. On the title page of the 2005 edition of Charles Kindleberger’s “Manias, Panicsand Crashes”, Paul Samuelson was cited with the quotation “Sometime in the next five years youmay kick yourself for not reading and re-reading Kindleberger’s ’Manias, Panics, and Crashes’.”(Kindleberger and Aliber, 2005) This, however, did not avoid the largest post-war financial andeconomic crisis to occur. Such a misfortune already hit Irving Fisher back in the 1930s hard inits reputation (Friedman, 2014).1 Therefore, getting a better understanding about the forecastingindustry and how forecasters cope with misfortune in great financial and economic crises is, of highrelevance for the future development of economic models and the general public.
This paper is an attempt to shed light into the dark room of prophecy and the work of the“fortune tellers” (Friedman, 2014) nowadays and to answer some questions about the motivationand models behind macroeconomic forecasting in Germany. For this purpose, we conducted anonline-survey among professional forecasters which are all making forecasts for Germany – either inpublic or private institutions in Germany or in supranational or international organizations outsideGermany.2
Our approach is linked to several strands of the literature on surveys in economics: First, itrelates to the literature on questionnaires among economists in general, which have been conductedfor long time and for a variety of reasons. The macroeconomic controversies of the seventies andeighties prompted some efforts (see, e.g., Frey et al., 1984, 1983; Pommerehne et al., 1983, 1984;Schneider et al., 1983) to clarify to which school of thought the majority of economist tended andwhether some consensus exists among economists. Consequently, a number of papers addresses the
1Ex post, from a longer historical perspective, it is always astonishing how naıvely the rosy economic developmentis regularly expected to last for longer. However, a deeper investigation on the theories behind expectation formationas in Beckert (2016) is beyond the scope of this empirical paper.
2We concentrated our efforts on institutions based in Germany and surveyed only some forecasters in internationalorganizations producing forecasts for the German economy.
1
broader question, whether economists can achieve a consensus over recommendations for economicpolicy (Pommerehne et al., 1984; Whaples, 1996; Fuller and Geide-Stevenson, 2003). There are,however, more aspects which are investigated by surveying economists. Enste et al. (2009) ask,whether notable difference to the beliefs of economic “layman” exist. In this context the politicaland general beliefs of economists and their interaction with policy advice have been of interest(Schneider et al., 2007; Frey et al., 2010). The process of educating economists is an evergreen topicin the literature (see, e.g., Colander, 2005, 2003), which has become subject of critical scrutiny in theaftermath of the financial crisis. Furthermore, internal issues of the profession have led to severalsurvey-based studies, e.g., the ranking of scholarly journals (Brauninger and Haucap, 2001), themagnitude of scientific misconduct (Necker, 2012), or the happiness of academic economists (Feldet al., 2015).
Second, the paper relates to the literature using surveys among professional forecasters. Batch-elor and Dua (1990a,b) analyse, how divergent theories and models are across different forecastinginstitutions and ask, whether forecasting accuracy depends on these differences. To make a longstory short, the authors of these early studies do not find a strong impact of theoretical positionsand forecasting techniques on the quality of the forecasts. In a similar vein, Ashiya (2006) cannotfind a respective connection based on Japanese data. The European Central Bank (2009, 2014) hasconducted special surveys among participants of the regular “Survey of Professional Forecasters”.The results confirm a great importance of judgemental forecasting as opposed to model based fore-casting (Fildes and Stekler, 2002; Lawrence et al., 2006). Furthermore, they find a very low “relativeweight” of use of modern macroeconomic (i.e. DSGE) models, which contrasts to the high academicimportance of these models (Wieland and Wolters, 2013; Del Negro and Schorfheide, 2013). In asimilar vein, Stark (2013) presents results based on a special survey among the U.S. “Survey ofProfessional Forecasters”. According to his results, forecasters use a combination of methods witha high degree of judgemental methods. Again, models, that are arguably a little old-fashioned butrobust – like traditional IS/ LM models – , are still of great relative importance for the forecaster’stool box (Krugman, 2000).
The successes and failures of macroeconomic forecasting have also been addressed from a soci-ological perspective. Evans (2002) has conducted interviews with British forecasters. Based on thecollected information he emphasizes the impact of political developments on the theoretical orien-tation of forecasters and their related policy advice. Reichmann (2013) has interviewed forecastersin three Austrian research institutes as well as representative users of the forecasts in economicand political organizations. He concludes that macroeconomic models are rather unimportant forthe emergence of a consensus among forecasters. Instead, various formal and informal networksdominate the macroeconomic discussion.
Our paper adds to the literature by investigating the following issues: Which models andtheories forecasters do subscribe to? Do theories differ when it comes to forecasting in contrast togeneral beliefs about how the economy works? Has the behaviour of forecasters or the models usedchanged since the Great Recession? Is there a relationship between theories/ models and forecastaccuracy? What about “leaning towards consensus” or herding, inefficient information processingor changes in risk-aversion/ attitudes?
Confirming previous findings, we are not able to establish a link between forecast accuracy onthe one hand and theories and methods on the other hand. Regarding the latter, we find thatpractitioners tend to be hesitant in adopting methods that are currently championed by the aca-demic discussion with some signs that the younger generation seems to be more open to non-linearand machine-learning-based methods. We find that forecasters are pronounced conservative in thesense, that they overwhelmingly rely on methods and theories that have been well-established fora long time, while more recent approaches are relatively unimportant for the practice of businesscycle forecasting. The academic evaluation of publicly funded research institutes (Leibniz associa-tion institutes) 3 seems to have changed this to some extent as DSGE models are significantly more
3Following the advice of Wissenschaftsrat (1998), the research institutes have undergone a pronounced overhaul
2
often used in public institutions.We find almost no evidence that the (self-reported) behaviour offorecasters has changed substantially since the Great Recession. However, there is evidence fora “leaning-towards-consensus” attitude (especially among forecasters in public institutions) andinefficient information processing. Furthermore, the awareness to evaluate forecasts on a regularbase seems to be higher after the crisis.
Section 2 describes the data set. In Section 3 we present the empirical analysis with respect tothe questions raised above. Section 4 discusses the result and summarizes. Further details aboutthe questionnaire can be found in the appendix sections.
2 Data
2.1 The statistical population
To define the underlying sample of our investigation we have to clarify what we understand as thekind of ”forecaster” we are interested in. We identified the following criteria to define the groupwe are aiming at:
• The institution provides forecasts for the German economy.
• The forecasts are of quantitative nature, i.e. at least a prediction for real GDP growth isprovided. For example, this criterion rules out, associations, which comment on the cur-rent economic situation, but don’t provide numbers. Also, some commentators on economicpolicy with a more heterodox theoretical background, such as the Arbeitsgruppe alternativeWirtschaftspolitik (Memorandum-Gruppe) (2016) do not match this criterion.
• The forecast is a macroeconomic forecast, i.e. we exclude institutions that provide forecasts forindividual sectors, branches, or regions only from our sample. For example, neither BITKOM- Germany’s digital association (2016), which provides forecasts for the IT branch only, nor theNiedersachsisches Institut fur Wirtschaftsforschung (NIW) (2016), which provides forecastsfor just only one German state, are part of our sample.
• The institution forecasts on a regular basis. This criterion excludes some individuals, whichhave been credited for foreseeing the financial crisis like, e.g. Otte (2011). We do so, since”false alarms” might be harmful for economic policy as well.
• We refer to business cycle forecasts. In other words, the forecasts have to be made at leastat annual frequency and refer to the economic situation in the coming period.
• We refer to forecasts that are — at least in part — offered as a public good. Some institutionsprovide a detailed explanation of the forecasts only for their customers, but are counted inpublic rankings with their ”headline” numbers of, say, real GDP growth. Our net-basedsearch strategy, however, will miss firms that provides their forecasts exclusively for theircustomers, although we are not aware of such a firm. Generally, since media coverage isarguably very important as a marketing tool, we are quite confident that we have not missedan important part of the forecasting industry.
• In contrast to previous related studies, our basic statistical unit are not the forecasting in-stitutions, but the individual forecasters. This renders it possible to collect information overforecasting processes, the motivations of forecasters and the like.
• We refer to currently active forecasters.4
after 1998, which has – inter alia – led to a much stronger orientation towards the academic publication record(Ketzler and Zimmermann, 2013)
4We have asked retired forecasters and individuals, who are still active as economist, but not as a forecaster forcomments on a pre-test version of the questionnaire.
3
Table 1: Response rate to the survey
Number of E-Mails sent 266Number of E-Mails undeliverable -12Number of responses ”not appropriate” -17Number of long-term absences -1Number of remaining invitations 237Number of responses 81Number of responses (complete survey) 56Response rate (persons) 34%Response rate (persons, complete) 24%Response rate (institutions) 67%
Relying on publicly available information we have identified 266 persons that might work onforecasts for the German economy on a regular basis. We have taken into account institutions thathave been listed in the ranking of Fricke (2016) and the regular reports of Consensus ForecastTM
(2016). Some information we have collected from several web-pages the internet appeared to bemisleading: in some cases the mails have been undeliverable, in same cases automatic responsemails indicated a long term absence of the person and some colleagues informed us that they arenor in charge of forecasting the German economy. A complete list of all institutions, to which wehave sent at least one invitation email is provided in the appendix. Table 1 gives the quantitativeoverview over the responses. The response rates were 34 %, for the contacted persons, and 67 % forthe listed institutions, which are sufficiently high response rates for an online survey. To protectthe anonymity of the respondents, we have to keep the groups rather broad and distinguish four ofthem:
• Publicly financed institutes,
• Privately financed institutes,
• Government, central banks, international institutions, and institutions of policy advice,
• Private firms and associations.
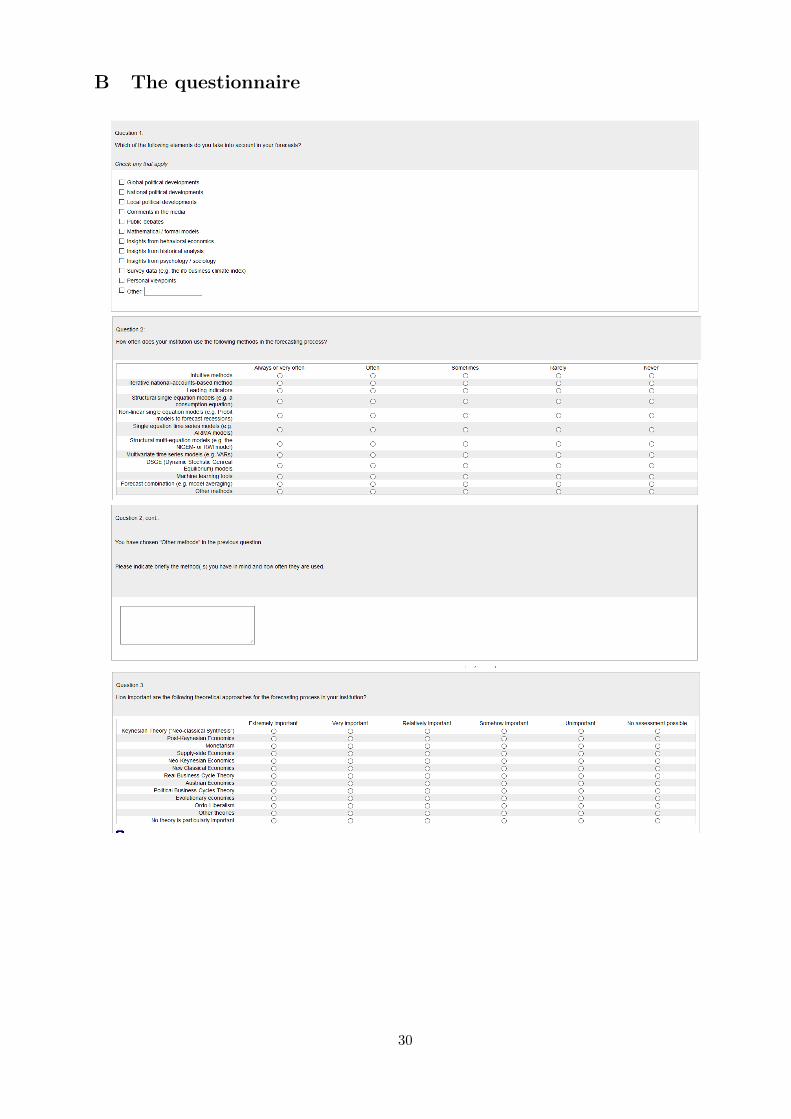
2.2 The questionnaire
The final version of the questionnaire consists of nine parts with a total of 24 questions. With this,we designed a comprehensive and exploratory questionnaire that makes use of different methodolo-gies for data collection. Consequently, the questions differ quite widely in complexity and estimatedresponse time. Depending on which seemed most appropriate for a particular question, we includedLikert scales, list boxes and free-text questions.
More specifically, we asked participants about models used for forecasting and theories theysubscribe to hold which may both influence the forecast and the forecasting process, and askedthem quantitative assessment questions aiming at their macroeconomic beliefs. Furthermore, weaddressed questions related to forecasting teams, forecast errors, and potential adjustments thatmay have been made after the Great Recession. We were also interested in potential herding be-haviour and risk management of forecasting teams and also asked about the individual forecaster’smotivation for choosing economic forecasting as their profession. In the last section, we collecteddemographical data. Finally, participants were given the opportunity to comment on the question-naires and leave their suggestions.
All questions (in English5) can be found in appendix section B. The survey was conductedas an on-line survey using Limesurvey (LimeSurvey Project Team / Carsten Schmitz, 2017) from
5Potential participants had the choice to answer in German or English.
4
January 23rd 2017 to March 6th 2017 (last answer recorded). All possible participants have beeninvited to take part by email on January 23rd 2017. Those, that have not answered until then havebeen reminded on February 2nd 2017. We also run a pre-test of the survey among a group of retiredforecasters and persons that are still working, but have left the field of macroeconomic forecasting.
3 Empirical results
3.1 Basic demographic statistics
Table 2 gives some information about the survey respondents. While the median age is not aston-ishing, the median length of work experience gives some food for thought. The cyclical peak beforethe Great Recession is usually dated in 2007. This implies that roughly half of the forecasters todayhas no on-the-job experience with a (pronounced) recession. This leads to the question, whethersome institutionally embedded experience exists, for example, in the form of experienced colleaguesthat might share their memories from the last cyclical downturn (and upswing).
Table 2: Some demographic information
nMedian age of respondent 43 49 [37; 52.5]
Median years experience as a forecaster 50 10 [5; 18]
Share of female forecasters 54 13%
Academic degree or position 56
Diplom: 9Master of Science: 4
Dr.: 39Professor: 3
Other: 1
Field of studies 57
Economics: 53Mathematics: 1
Others: 2
Group of institutions 81
Public institutes: 18Private institutes: 12
Policy related institutions: 19Private firms: 31
In brackets: 25 % and 75 % quartiles.
The forecasting industry seems to be “a man’s world”: The share of female forecasters is lowin comparison to the share of women holding a degree in Economics Germany. This is line withfindings of Fondsfrauen (2015), a lobby group promoting women’s careers in the finance industry,which counts just 4 out of 55 institutions having a female chief economist.
Forecasters usually hold academic degrees, a majority of them received doctoral or Ph.D degrees.Practically all forecasters named economics as their main field of studies. Only one person hasstudied mathematics and two others choose the option “other” fields, but both have a similar fieldor an additional field of studies. For the moment, there doesn’t seem to be much competitionfor the economists in the field of macroeconomic forecasting. This might be different in relatedfields (finance) or, perhaps, will change in the (near) future as machine learning tools become moreaccepted as a forecasting tool in this area.
3.2 What theories/ methods do forecasters use?
We start our investigation of methods and theories underlying the regular forecasts with a rathergeneral question on the factors that influence the forecast. With this question we aim at seeinghow strongly forecasters rely on the use of specific forecasting methodologies or information. For
5
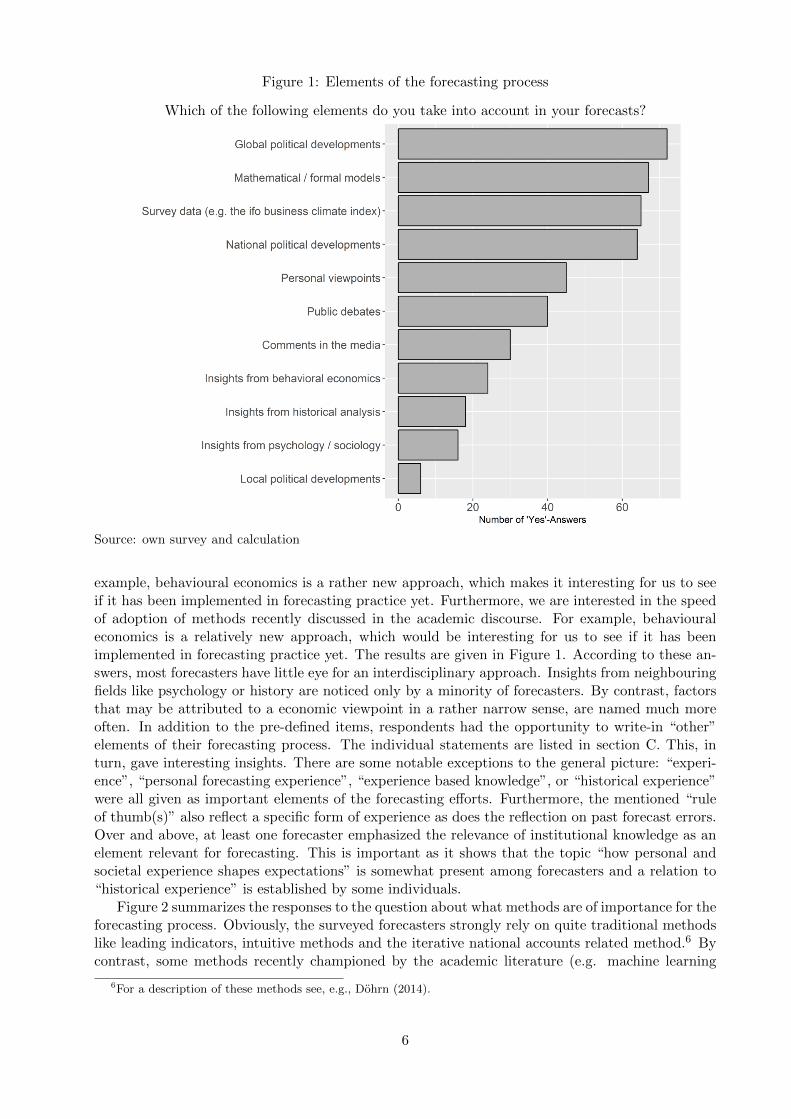
Figure 1: Elements of the forecasting process
Which of the following elements do you take into account in your forecasts?
Source: own survey and calculation
example, behavioural economics is a rather new approach, which makes it interesting for us to seeif it has been implemented in forecasting practice yet. Furthermore, we are interested in the speedof adoption of methods recently discussed in the academic discourse. For example, behaviouraleconomics is a relatively new approach, which would be interesting for us to see if it has beenimplemented in forecasting practice yet. The results are given in Figure 1. According to these an-swers, most forecasters have little eye for an interdisciplinary approach. Insights from neighbouringfields like psychology or history are noticed only by a minority of forecasters. By contrast, factorsthat may be attributed to a economic viewpoint in a rather narrow sense, are named much moreoften. In addition to the pre-defined items, respondents had the opportunity to write-in “other”elements of their forecasting process. The individual statements are listed in section C. This, inturn, gave interesting insights. There are some notable exceptions to the general picture: “experi-ence”, “personal forecasting experience”, “experience based knowledge”, or “historical experience”were all given as important elements of the forecasting efforts. Furthermore, the mentioned “ruleof thumb(s)” also reflect a specific form of experience as does the reflection on past forecast errors.Over and above, at least one forecaster emphasized the relevance of institutional knowledge as anelement relevant for forecasting. This is important as it shows that the topic “how personal andsocietal experience shapes expectations” is somewhat present among forecasters and a relation to“historical experience” is established by some individuals.
Figure 2 summarizes the responses to the question about what methods are of importance for theforecasting process. Obviously, the surveyed forecasters strongly rely on quite traditional methodslike leading indicators, intuitive methods and the iterative national accounts related method.6 Bycontrast, some methods recently championed by the academic literature (e.g. machine learning
6For a description of these methods see, e.g., Dohrn (2014).
6
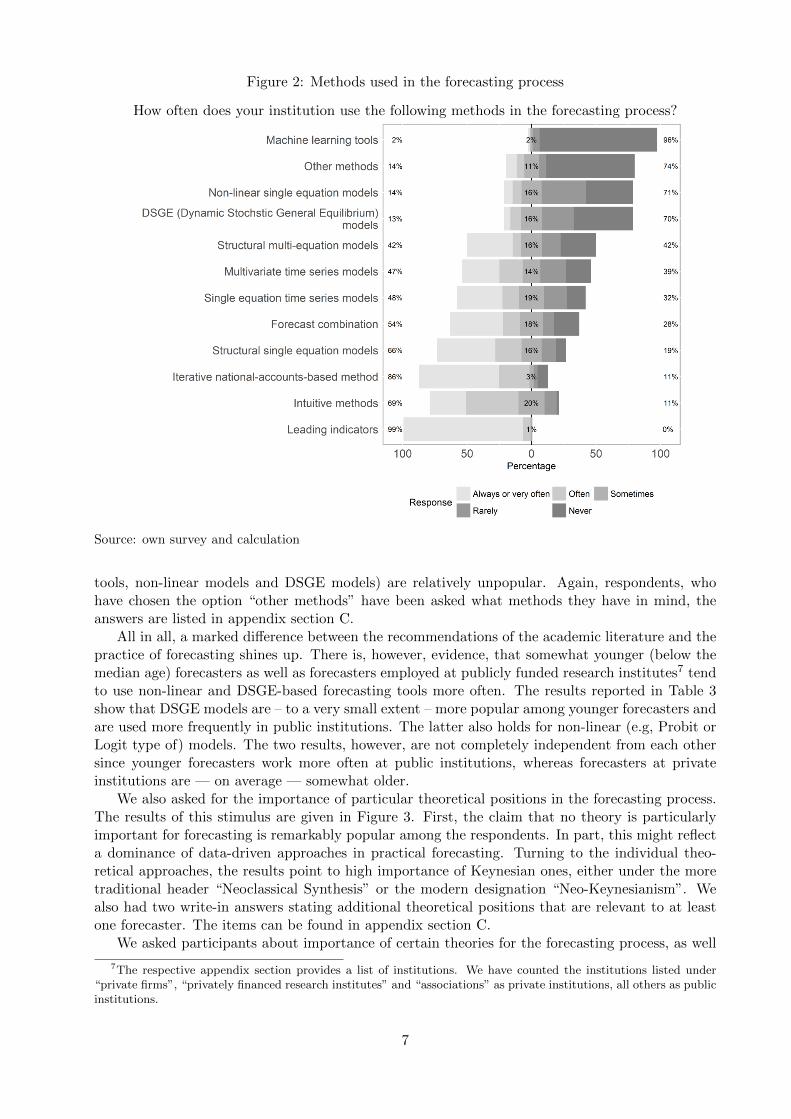
Figure 2: Methods used in the forecasting process
How often does your institution use the following methods in the forecasting process?
Source: own survey and calculation
tools, non-linear models and DSGE models) are relatively unpopular. Again, respondents, whohave chosen the option “other methods” have been asked what methods they have in mind, theanswers are listed in appendix section C.
All in all, a marked difference between the recommendations of the academic literature and thepractice of forecasting shines up. There is, however, evidence, that somewhat younger (below themedian age) forecasters as well as forecasters employed at publicly funded research institutes7 tendto use non-linear and DSGE-based forecasting tools more often. The results reported in Table 3show that DSGE models are – to a very small extent – more popular among younger forecasters andare used more frequently in public institutions. The latter also holds for non-linear (e.g, Probit orLogit type of) models. The two results, however, are not completely independent from each othersince younger forecasters work more often at public institutions, whereas forecasters at privateinstitutions are — on average — somewhat older.
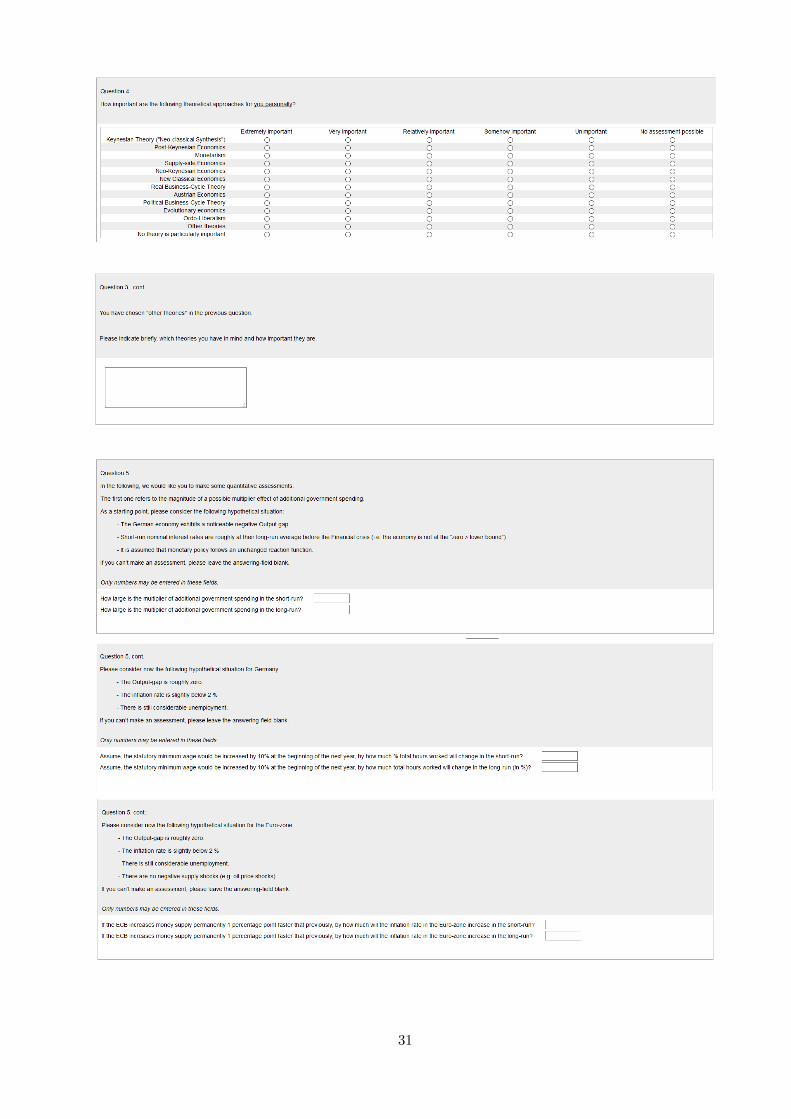
We also asked for the importance of particular theoretical positions in the forecasting process.The results of this stimulus are given in Figure 3. First, the claim that no theory is particularlyimportant for forecasting is remarkably popular among the respondents. In part, this might reflecta dominance of data-driven approaches in practical forecasting. Turning to the individual theo-retical approaches, the results point to high importance of Keynesian ones, either under the moretraditional header “Neoclassical Synthesis” or the modern designation “Neo-Keynesianism”. Wealso had two write-in answers stating additional theoretical positions that are relevant to at leastone forecaster. The items can be found in appendix section C.
We asked participants about importance of certain theories for the forecasting process, as well
7The respective appendix section provides a list of institutions. We have counted the institutions listed under“private firms”, “privately financed research institutes” and “associations” as private institutions, all others as publicinstitutions.
7
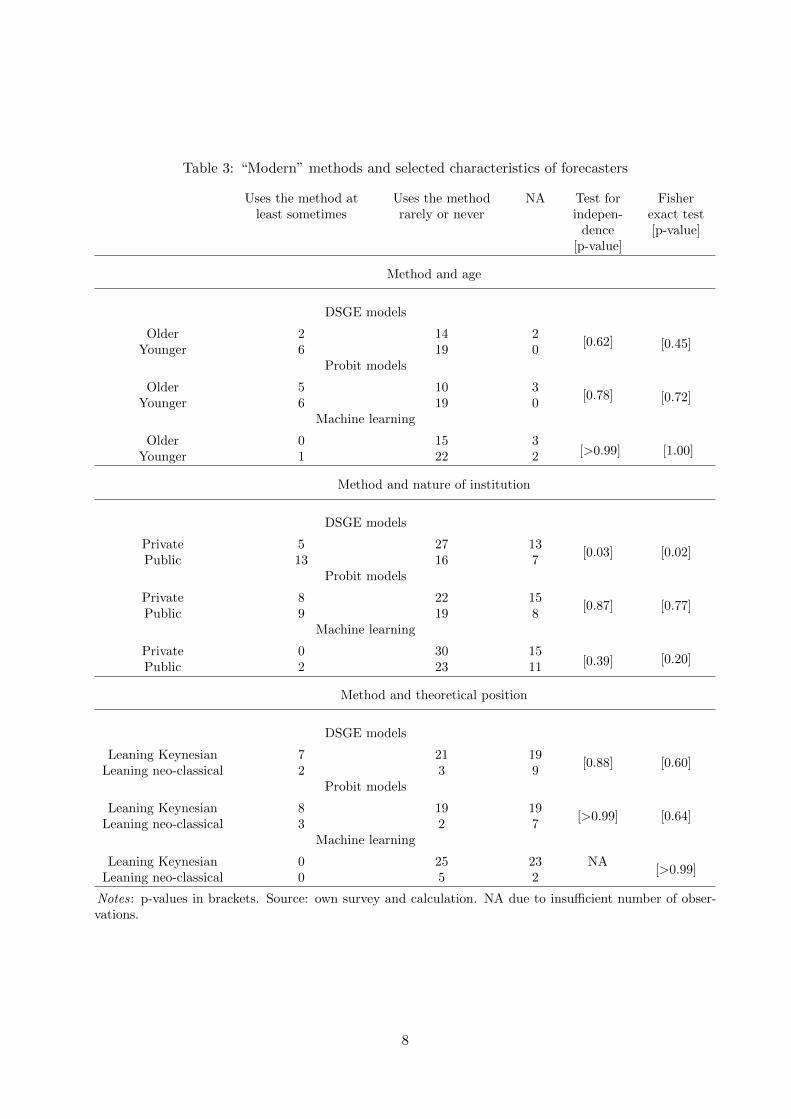
Table 3: “Modern” methods and selected characteristics of forecasters
Uses the method atleast sometimes
Uses the methodrarely or never
NA Test forindepen-
dence[p-value]
Fisherexact test[p-value]
Method and age
DSGE models
Older 2 14 2[0.62] [0.45]Younger 6 19 0
Probit models
Older 5 10 3[0.78] [0.72]Younger 6 19 0
Machine learning
Older 0 15 3[>0.99] [1.00]Younger 1 22 2
Method and nature of institution
DSGE models
Private 5 27 13[0.03] [0.02]
Public 13 16 7Probit models
Private 8 22 15[0.87] [0.77]
Public 9 19 8Machine learning
Private 0 30 15[0.39] [0.20]
Public 2 23 11
Method and theoretical position
DSGE models
Leaning Keynesian 7 21 19[0.88] [0.60]
Leaning neo-classical 2 3 9Probit models
Leaning Keynesian 8 19 19[>0.99] [0.64]
Leaning neo-classical 3 2 7Machine learning
Leaning Keynesian 0 25 23 NA[>0.99]
Leaning neo-classical 0 5 2
Notes: p-values in brackets. Source: own survey and calculation. NA due to insufficient number of obser-vations.
8
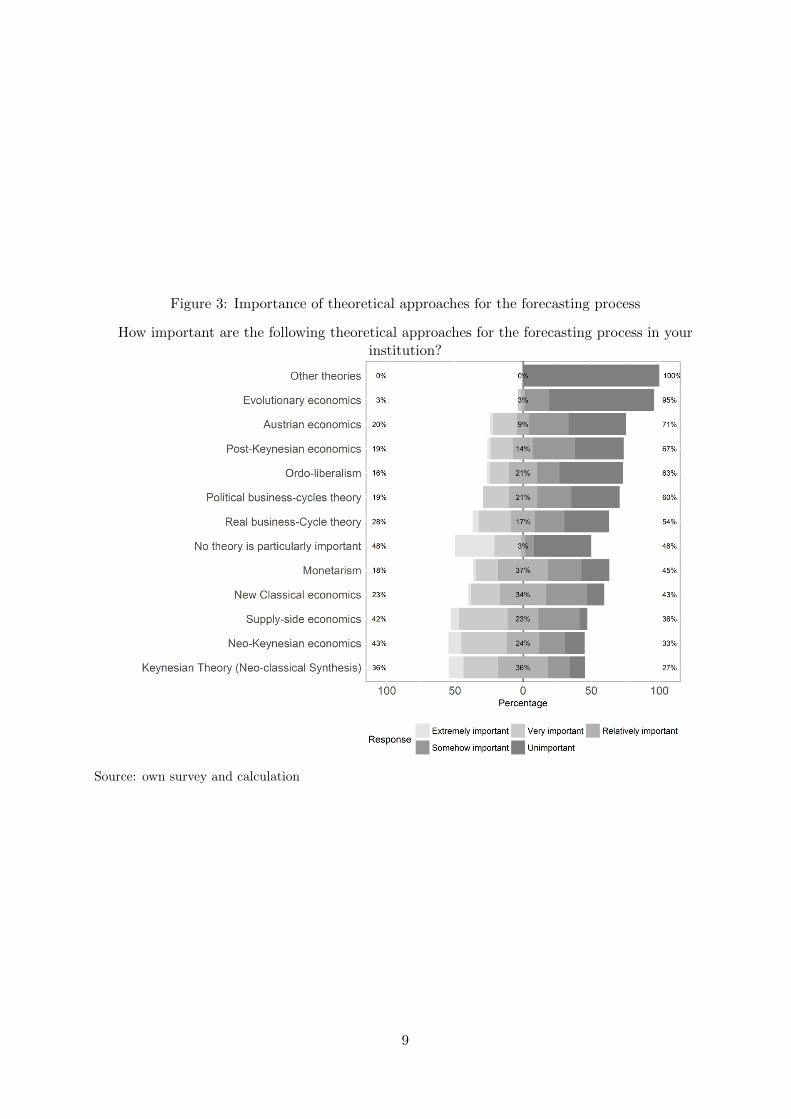
Figure 3: Importance of theoretical approaches for the forecasting process
How important are the following theoretical approaches for the forecasting process in yourinstitution?
Source: own survey and calculation
9
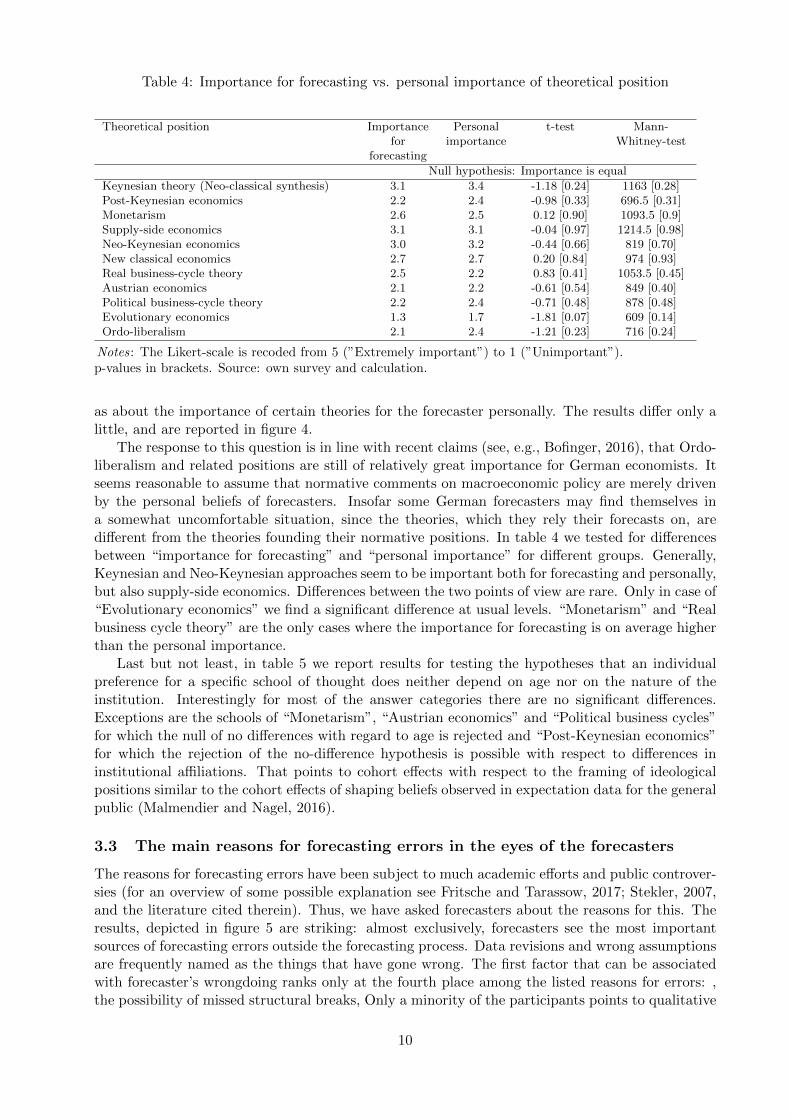
Table 4: Importance for forecasting vs. personal importance of theoretical position
Theoretical position Importancefor
forecasting
Personalimportance
t-test Mann-Whitney-test
Null hypothesis: Importance is equal
Keynesian theory (Neo-classical synthesis) 3.1 3.4 -1.18 [0.24] 1163 [0.28]Post-Keynesian economics 2.2 2.4 -0.98 [0.33] 696.5 [0.31]Monetarism 2.6 2.5 0.12 [0.90] 1093.5 [0.9]Supply-side economics 3.1 3.1 -0.04 [0.97] 1214.5 [0.98]Neo-Keynesian economics 3.0 3.2 -0.44 [0.66] 819 [0.70]New classical economics 2.7 2.7 0.20 [0.84] 974 [0.93]Real business-cycle theory 2.5 2.2 0.83 [0.41] 1053.5 [0.45]Austrian economics 2.1 2.2 -0.61 [0.54] 849 [0.40]Political business-cycle theory 2.2 2.4 -0.71 [0.48] 878 [0.48]Evolutionary economics 1.3 1.7 -1.81 [0.07] 609 [0.14]Ordo-liberalism 2.1 2.4 -1.21 [0.23] 716 [0.24]
Notes: The Likert-scale is recoded from 5 (”Extremely important”) to 1 (”Unimportant”).p-values in brackets. Source: own survey and calculation.
as about the importance of certain theories for the forecaster personally. The results differ only alittle, and are reported in figure 4.
The response to this question is in line with recent claims (see, e.g., Bofinger, 2016), that Ordo-liberalism and related positions are still of relatively great importance for German economists. Itseems reasonable to assume that normative comments on macroeconomic policy are merely drivenby the personal beliefs of forecasters. Insofar some German forecasters may find themselves ina somewhat uncomfortable situation, since the theories, which they rely their forecasts on, aredifferent from the theories founding their normative positions. In table 4 we tested for differencesbetween “importance for forecasting” and “personal importance” for different groups. Generally,Keynesian and Neo-Keynesian approaches seem to be important both for forecasting and personally,but also supply-side economics. Differences between the two points of view are rare. Only in case of“Evolutionary economics” we find a significant difference at usual levels. “Monetarism” and “Realbusiness cycle theory” are the only cases where the importance for forecasting is on average higherthan the personal importance.
Last but not least, in table 5 we report results for testing the hypotheses that an individualpreference for a specific school of thought does neither depend on age nor on the nature of theinstitution. Interestingly for most of the answer categories there are no significant differences.Exceptions are the schools of “Monetarism”, “Austrian economics” and “Political business cycles”for which the null of no differences with regard to age is rejected and “Post-Keynesian economics”for which the rejection of the no-difference hypothesis is possible with respect to differences ininstitutional affiliations. That points to cohort effects with respect to the framing of ideologicalpositions similar to the cohort effects of shaping beliefs observed in expectation data for the generalpublic (Malmendier and Nagel, 2016).
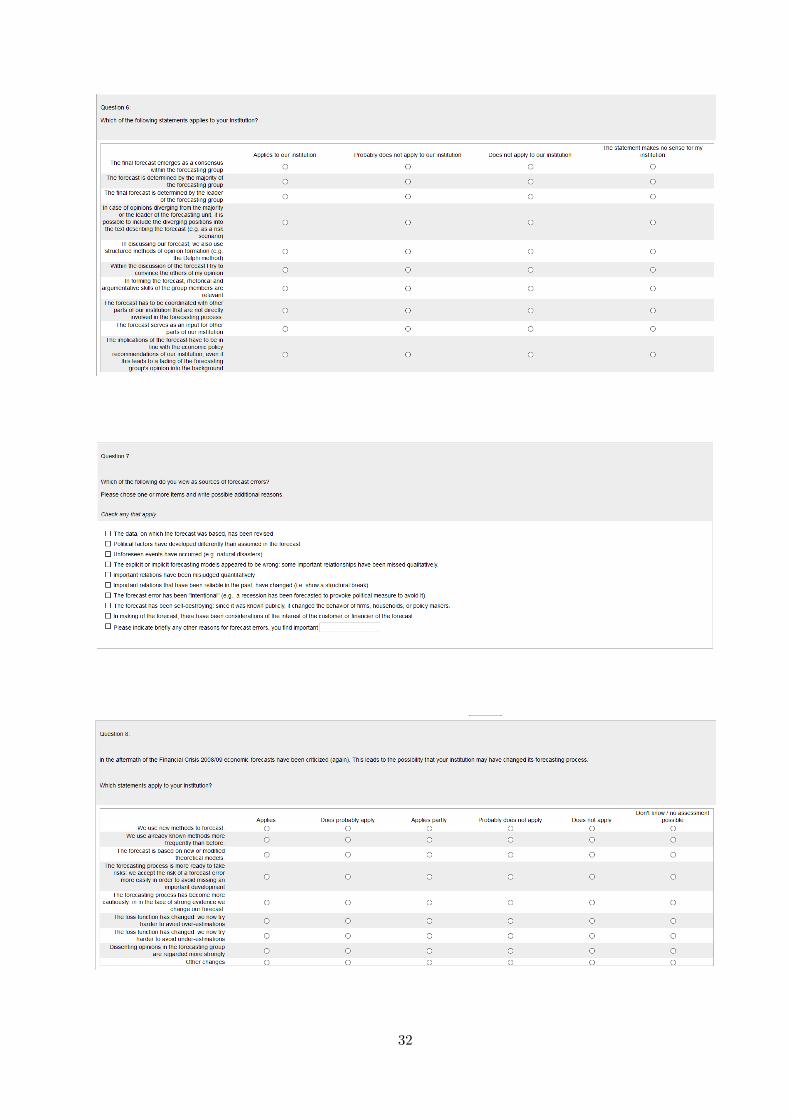
3.3 The main reasons for forecasting errors in the eyes of the forecasters
The reasons for forecasting errors have been subject to much academic efforts and public controver-sies (for an overview of some possible explanation see Fritsche and Tarassow, 2017; Stekler, 2007,and the literature cited therein). Thus, we have asked forecasters about the reasons for this. Theresults, depicted in figure 5 are striking: almost exclusively, forecasters see the most importantsources of forecasting errors outside the forecasting process. Data revisions and wrong assumptionsare frequently named as the things that have gone wrong. The first factor that can be associatedwith forecaster’s wrongdoing ranks only at the fourth place among the listed reasons for errors: ,the possibility of missed structural breaks, Only a minority of the participants points to qualitative
10
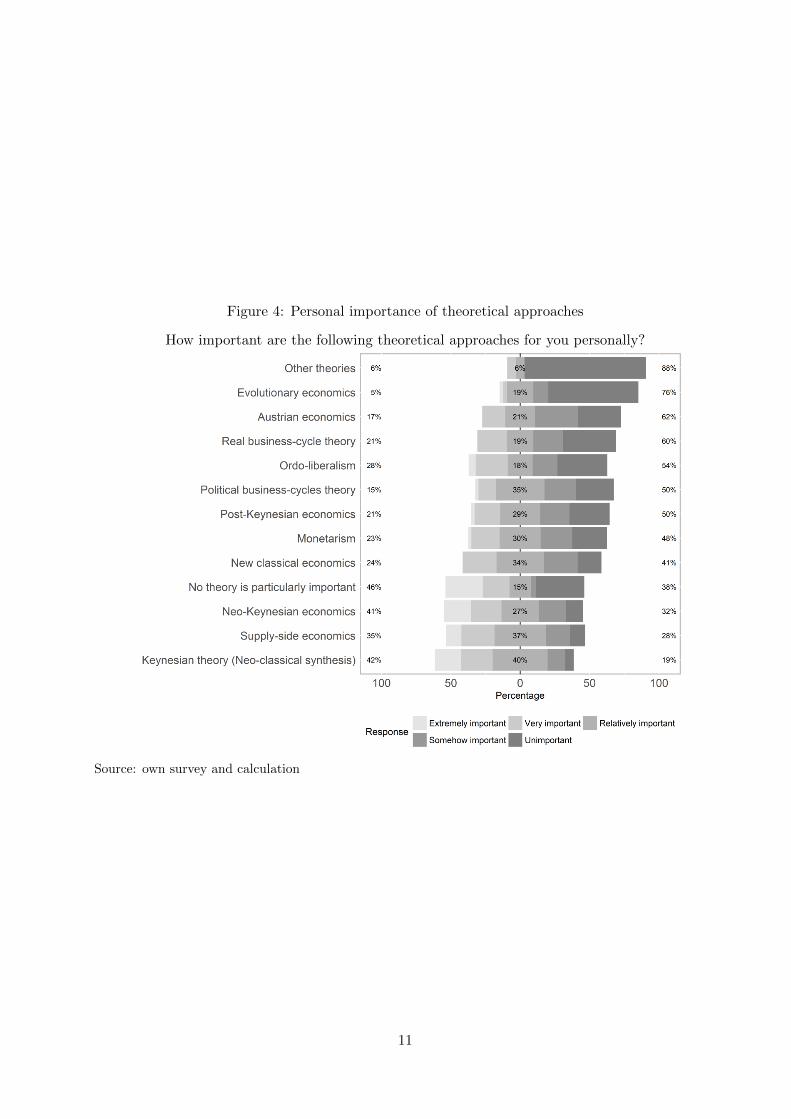
Figure 4: Personal importance of theoretical approaches
How important are the following theoretical approaches for you personally?
Source: own survey and calculation
11
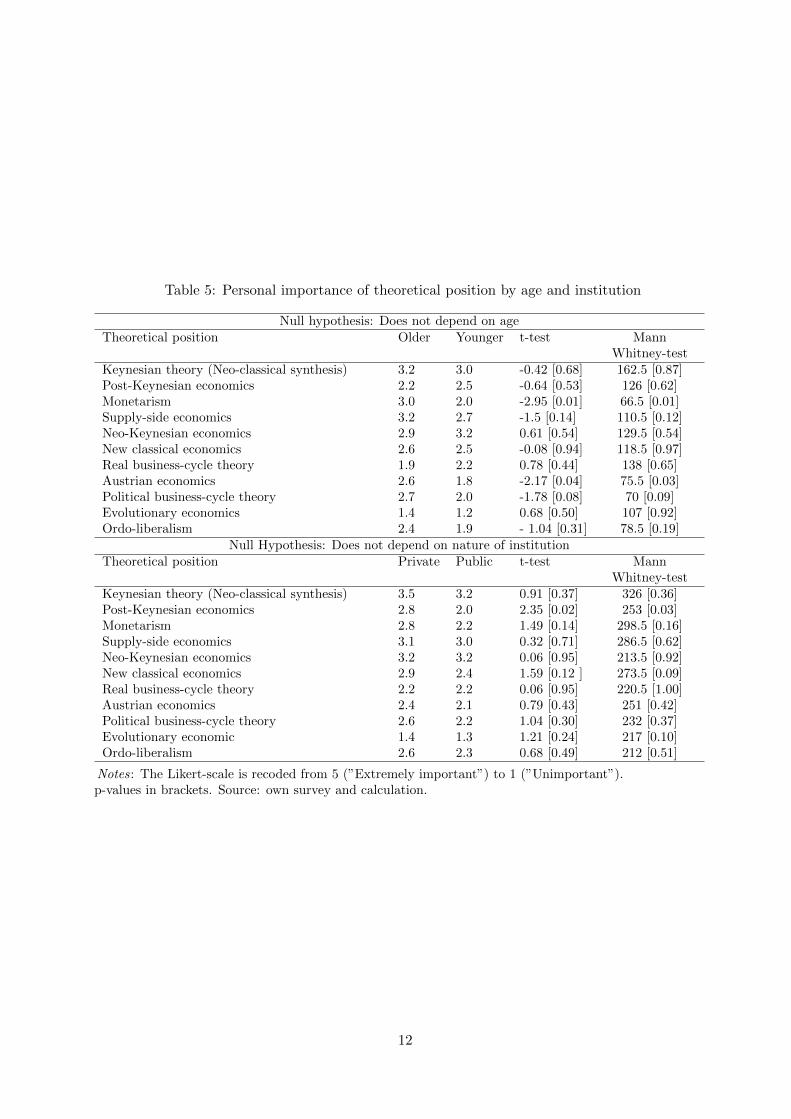
Table 5: Personal importance of theoretical position by age and institution
Null hypothesis: Does not depend on ageTheoretical position Older Younger t-test Mann
Whitney-testKeynesian theory (Neo-classical synthesis) 3.2 3.0 -0.42 [0.68] 162.5 [0.87]Post-Keynesian economics 2.2 2.5 -0.64 [0.53] 126 [0.62]Monetarism 3.0 2.0 -2.95 [0.01] 66.5 [0.01]Supply-side economics 3.2 2.7 -1.5 [0.14] 110.5 [0.12]Neo-Keynesian economics 2.9 3.2 0.61 [0.54] 129.5 [0.54]New classical economics 2.6 2.5 -0.08 [0.94] 118.5 [0.97]Real business-cycle theory 1.9 2.2 0.78 [0.44] 138 [0.65]Austrian economics 2.6 1.8 -2.17 [0.04] 75.5 [0.03]Political business-cycle theory 2.7 2.0 -1.78 [0.08] 70 [0.09]Evolutionary economics 1.4 1.2 0.68 [0.50] 107 [0.92]Ordo-liberalism 2.4 1.9 - 1.04 [0.31] 78.5 [0.19]
Null Hypothesis: Does not depend on nature of institutionTheoretical position Private Public t-test Mann
Whitney-testKeynesian theory (Neo-classical synthesis) 3.5 3.2 0.91 [0.37] 326 [0.36]Post-Keynesian economics 2.8 2.0 2.35 [0.02] 253 [0.03]Monetarism 2.8 2.2 1.49 [0.14] 298.5 [0.16]Supply-side economics 3.1 3.0 0.32 [0.71] 286.5 [0.62]Neo-Keynesian economics 3.2 3.2 0.06 [0.95] 213.5 [0.92]New classical economics 2.9 2.4 1.59 [0.12 ] 273.5 [0.09]Real business-cycle theory 2.2 2.2 0.06 [0.95] 220.5 [1.00]Austrian economics 2.4 2.1 0.79 [0.43] 251 [0.42]Political business-cycle theory 2.6 2.2 1.04 [0.30] 232 [0.37]Evolutionary economic 1.4 1.3 1.21 [0.24] 217 [0.10]Ordo-liberalism 2.6 2.3 0.68 [0.49] 212 [0.51]
Notes: The Likert-scale is recoded from 5 (”Extremely important”) to 1 (”Unimportant”).p-values in brackets. Source: own survey and calculation.
12
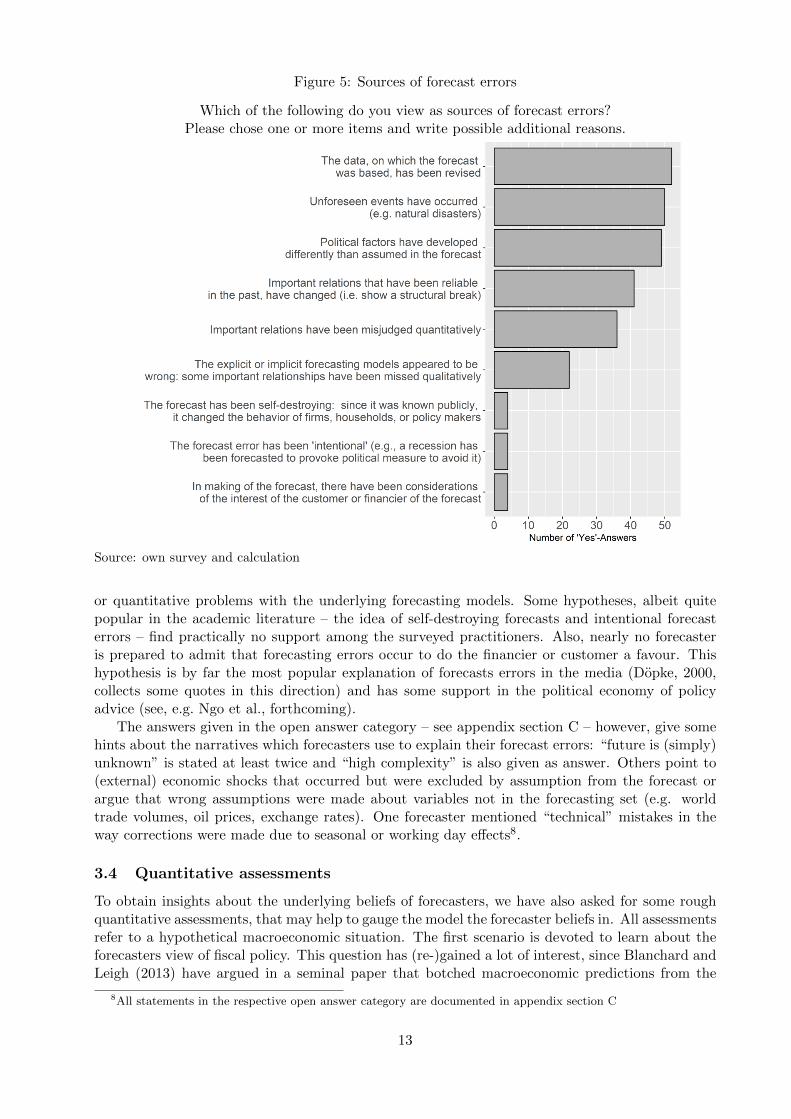
Figure 5: Sources of forecast errors
Which of the following do you view as sources of forecast errors?Please chose one or more items and write possible additional reasons.
Source: own survey and calculation
or quantitative problems with the underlying forecasting models. Some hypotheses, albeit quitepopular in the academic literature – the idea of self-destroying forecasts and intentional forecasterrors – find practically no support among the surveyed practitioners. Also, nearly no forecasteris prepared to admit that forecasting errors occur to do the financier or customer a favour. Thishypothesis is by far the most popular explanation of forecasts errors in the media (Dopke, 2000,collects some quotes in this direction) and has some support in the political economy of policyadvice (see, e.g. Ngo et al., forthcoming).
The answers given in the open answer category – see appendix section C – however, give somehints about the narratives which forecasters use to explain their forecast errors: “future is (simply)unknown” is stated at least twice and “high complexity” is also given as answer. Others point to(external) economic shocks that occurred but were excluded by assumption from the forecast orargue that wrong assumptions were made about variables not in the forecasting set (e.g. worldtrade volumes, oil prices, exchange rates). One forecaster mentioned “technical” mistakes in theway corrections were made due to seasonal or working day effects8.
3.4 Quantitative assessments
To obtain insights about the underlying beliefs of forecasters, we have also asked for some roughquantitative assessments, that may help to gauge the model the forecaster beliefs in. All assessmentsrefer to a hypothetical macroeconomic situation. The first scenario is devoted to learn about theforecasters view of fiscal policy. This question has (re-)gained a lot of interest, since Blanchard andLeigh (2013) have argued in a seminal paper that botched macroeconomic predictions from the
8All statements in the respective open answer category are documented in appendix section C
13
IMF may be attributed to an underestimation of the magnitude of the fiscal multiplier. For the“fiscal thought experiment”, the questionnaire lists several assumptions as documented in appendixsection B.9
Figure 6a shows the magnitude of the multiplier estimated by the respondents in the short-run and in the long-run. The distribution of the estimates points to the possibility that Germanforecasters are at least short-run Keynesians: all multiplier exceed one and the distribution centersaround 1. In the long-run, however, the vast majority of the forecasters that have responded donot assume that fiscal policy can do any good and assumes a multiplier of by about zero. It isnoteworthy, though, that the survey asked the forecasters to leave the form blank, if they arenot able to give an assessment, which 41 persons actually did (as compared to 40, which gave anestimate). Furthermore, at least one person took the opportunity of the general comment at theend of the survey to argue that the information given on the scenario is not sufficient to quantifythe impact of fiscal policy on growth.
The second “thought experiment”, for which respondents are asked to give quantitative guess isan acceleration of money growth in the Euro area (the ECB increases money supply permanently1 percentage point faster than previously done) starting from an vaguely defined “equilibrium”situation in the absence of negative supply shocks.10 Figure 6b shows the distribution of theestimates in the short- as well as in the long-run. While virtually no forecasters gives moneysupply a big role for inflation in the short-run, there is considerable disagreement regarding thelong-run effects: some forecasters see a zero or a minor impact of money growth on inflation.Roughly half of the respondents, however, assumes even a one-to-one relation between the twonumbers (which might even correspond better to the old-school pre-Friedman quantity theory ofmoney, as to the version with a non-stable, but predictable money demand).
As a third “thought experiment” – see figure 6c – we asked forecasters about the employmenteffects of a 10 % increase of the minimum wage.11 Interestingly, the bulk of answers point to “no”effects in the short as well as in the long run. However, disagreement is high: Some even assume along-run elasticity of 0.75.
To check whether the quantitative assessments are in line with the reported underlying theo-retical position of the forecasters, we grouped the forecasters into two subgroups: those, who leantowards more neoclassical positions and those, who have described themselves rather as a Keynesianand compare the quantitative assessments between these two groups (see Table 6). We confirm sig-nificant differences regarding the effects of money-supply shifts between the “neo-classical” and the“Keynesian” camps. We can furthermore see significant differences in the assessment of minimumwage increases between forecasters working in private and those working in public institutions. Itis interesting to see, that on average forecasters working in public institutions are more concernedabout negative consequences of minimum wage increases than those working in private institutions.To what extent ideological positions of the respective institutions play a role is a question for furtherresearch. There are no significant differences between the camps regarding the “fiscal multiplierthought experiment”.
3.5 Consequences of the Great Recession
Figure 7 shows the responses to a question exploring changes in the forecasting process that mighthave happened following the recent financial crisis and the subsequent Great Recession. The mostpopular answer is that the institutions now uses “new” methods in forecasting. However, weoffered a write-in possibility in this question to add “additional” methods that have been used forforecasting in the institution. Hence, the “new” method mentioned should shine up in the write-ins
9Basically a negative output gap, somewhat “normal” interest rates, no “zero lower bound” situation and a“normal” Taylor rule for monetary policy reaction.
10Again the assumptions are given in appendix section B.11Again the assumptions are given in appendix section B.
14
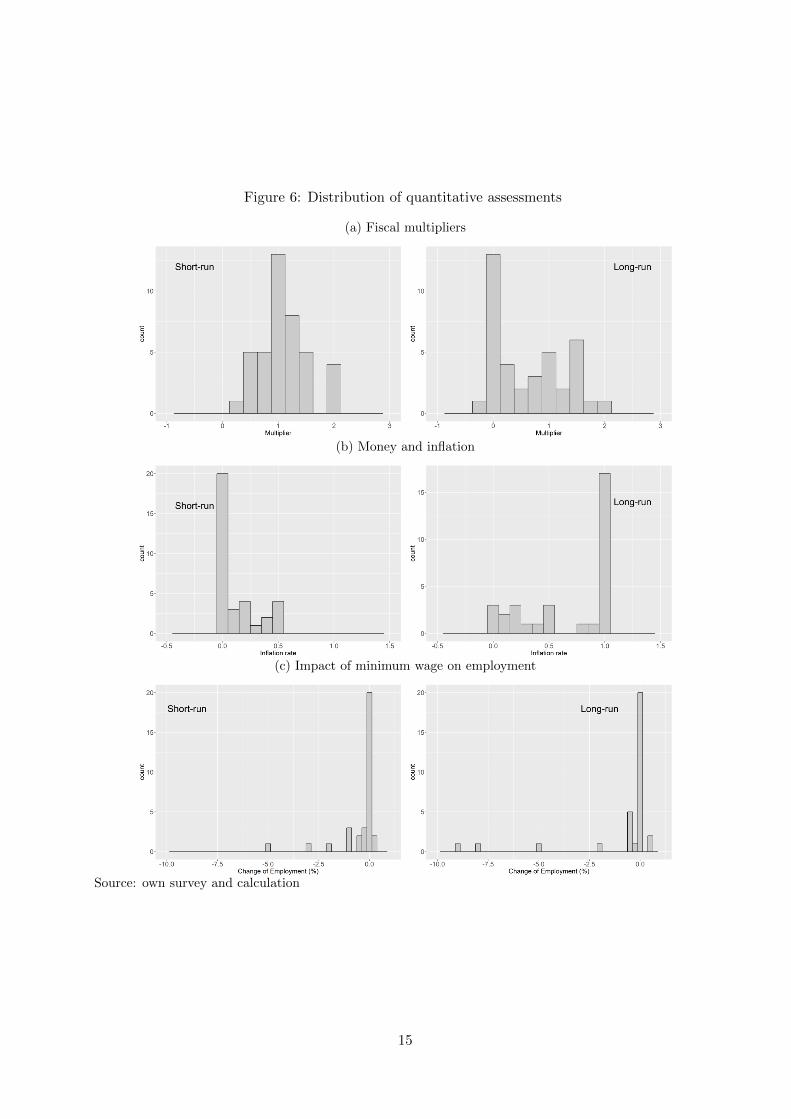
Figure 6: Distribution of quantitative assessments
(a) Fiscal multipliers
(b) Money and inflation
(c) Impact of minimum wage on employment
Source: own survey and calculation
15
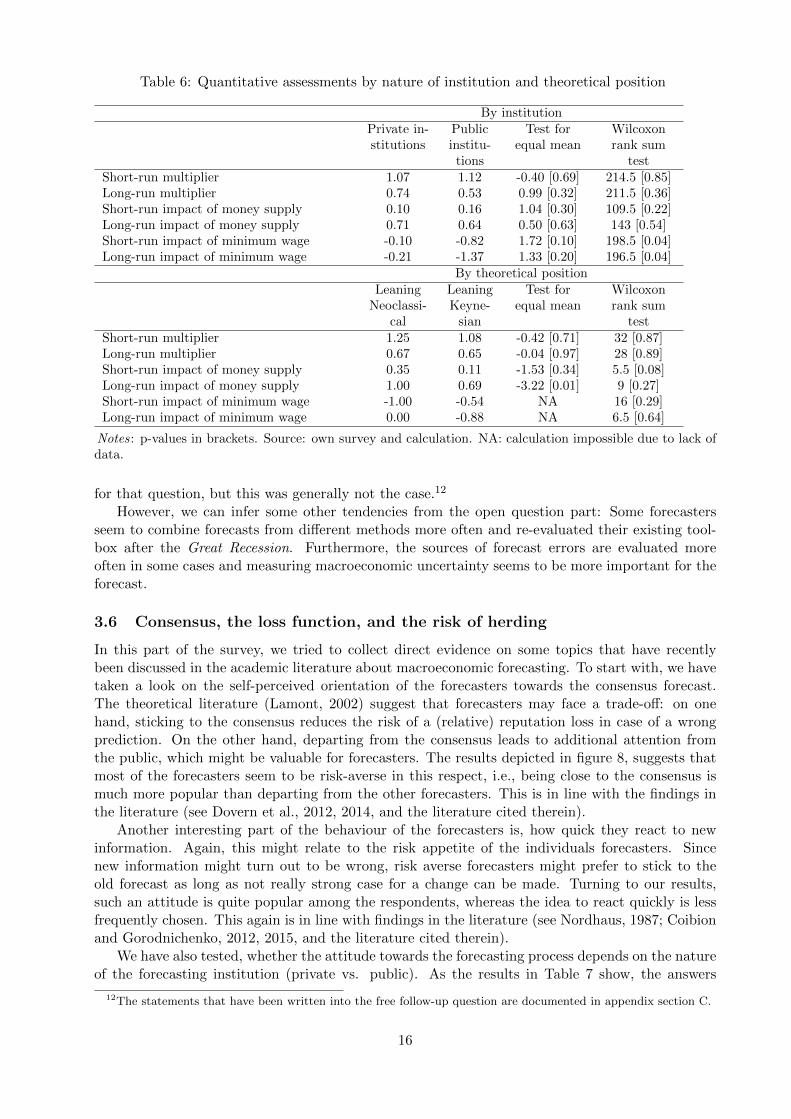
Table 6: Quantitative assessments by nature of institution and theoretical position
By institutionPrivate in-stitutions
Publicinstitu-tions
Test forequal mean
Wilcoxonrank sum
testShort-run multiplier 1.07 1.12 -0.40 [0.69] 214.5 [0.85]Long-run multiplier 0.74 0.53 0.99 [0.32] 211.5 [0.36]Short-run impact of money supply 0.10 0.16 1.04 [0.30] 109.5 [0.22]Long-run impact of money supply 0.71 0.64 0.50 [0.63] 143 [0.54]Short-run impact of minimum wage -0.10 -0.82 1.72 [0.10] 198.5 [0.04]Long-run impact of minimum wage -0.21 -1.37 1.33 [0.20] 196.5 [0.04]
By theoretical positionLeaning
Neoclassi-cal
LeaningKeyne-
sian
Test forequal mean
Wilcoxonrank sum
testShort-run multiplier 1.25 1.08 -0.42 [0.71] 32 [0.87]Long-run multiplier 0.67 0.65 -0.04 [0.97] 28 [0.89]Short-run impact of money supply 0.35 0.11 -1.53 [0.34] 5.5 [0.08]Long-run impact of money supply 1.00 0.69 -3.22 [0.01] 9 [0.27]Short-run impact of minimum wage -1.00 -0.54 NA 16 [0.29]Long-run impact of minimum wage 0.00 -0.88 NA 6.5 [0.64]
Notes: p-values in brackets. Source: own survey and calculation. NA: calculation impossible due to lack ofdata.
for that question, but this was generally not the case.12
However, we can infer some other tendencies from the open question part: Some forecastersseem to combine forecasts from different methods more often and re-evaluated their existing tool-box after the Great Recession. Furthermore, the sources of forecast errors are evaluated moreoften in some cases and measuring macroeconomic uncertainty seems to be more important for theforecast.
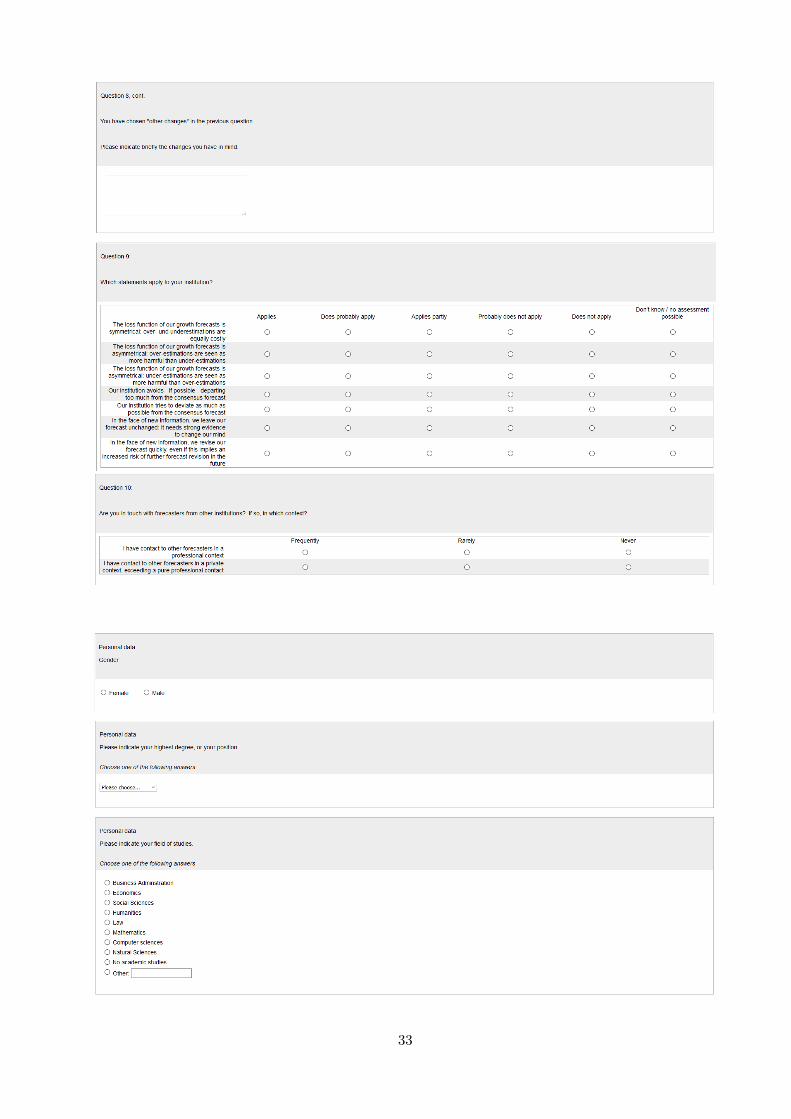
3.6 Consensus, the loss function, and the risk of herding
In this part of the survey, we tried to collect direct evidence on some topics that have recentlybeen discussed in the academic literature about macroeconomic forecasting. To start with, we havetaken a look on the self-perceived orientation of the forecasters towards the consensus forecast.The theoretical literature (Lamont, 2002) suggest that forecasters may face a trade-off: on onehand, sticking to the consensus reduces the risk of a (relative) reputation loss in case of a wrongprediction. On the other hand, departing from the consensus leads to additional attention fromthe public, which might be valuable for forecasters. The results depicted in figure 8, suggests thatmost of the forecasters seem to be risk-averse in this respect, i.e., being close to the consensus ismuch more popular than departing from the other forecasters. This is in line with the findings inthe literature (see Dovern et al., 2012, 2014, and the literature cited therein).
Another interesting part of the behaviour of the forecasters is, how quick they react to newinformation. Again, this might relate to the risk appetite of the individuals forecasters. Sincenew information might turn out to be wrong, risk averse forecasters might prefer to stick to theold forecast as long as not really strong case for a change can be made. Turning to our results,such an attitude is quite popular among the respondents, whereas the idea to react quickly is lessfrequently chosen. This again is in line with findings in the literature (see Nordhaus, 1987; Coibionand Gorodnichenko, 2012, 2015, and the literature cited therein).
We have also tested, whether the attitude towards the forecasting process depends on the natureof the forecasting institution (private vs. public). As the results in Table 7 show, the answers
12The statements that have been written into the free follow-up question are documented in appendix section C.
16
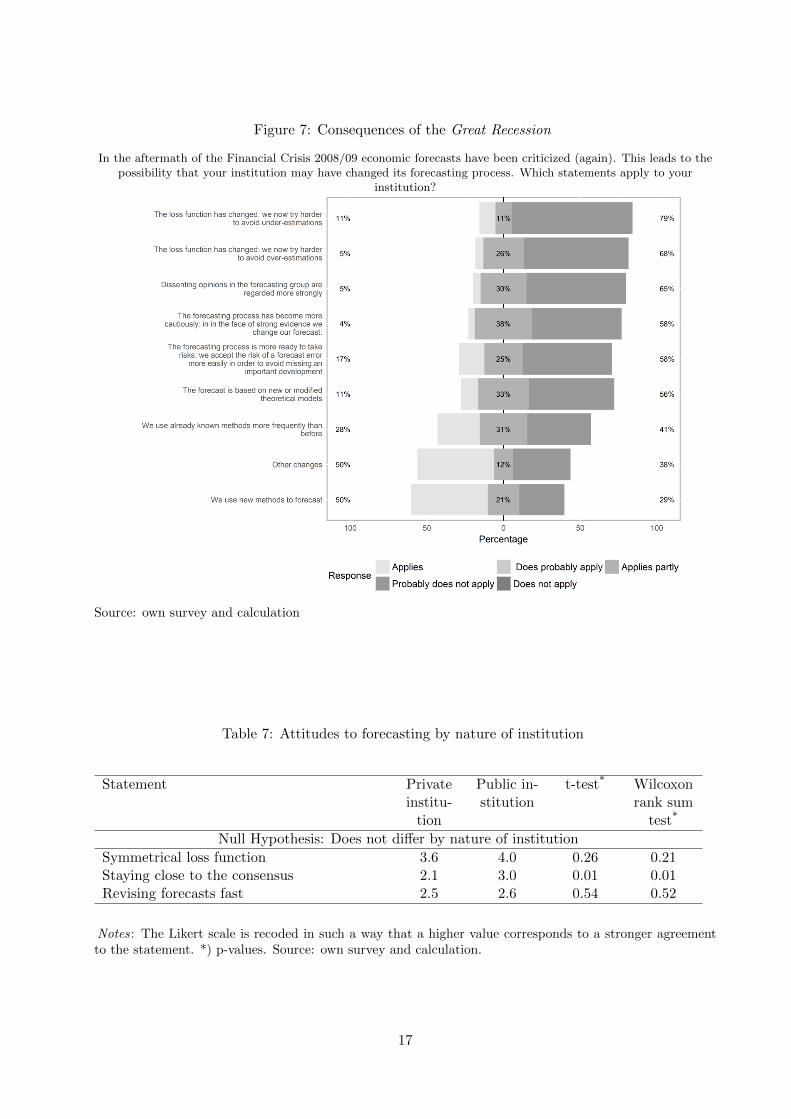
Figure 7: Consequences of the Great Recession
In the aftermath of the Financial Crisis 2008/09 economic forecasts have been criticized (again). This leads to thepossibility that your institution may have changed its forecasting process. Which statements apply to your
institution?
Source: own survey and calculation
Table 7: Attitudes to forecasting by nature of institution
Statement Privateinstitu-
tion
Public in-stitution
t-test* Wilcoxonrank sum
test*
Null Hypothesis: Does not differ by nature of institution
Symmetrical loss function 3.6 4.0 0.26 0.21Staying close to the consensus 2.1 3.0 0.01 0.01Revising forecasts fast 2.5 2.6 0.54 0.52
Notes: The Likert scale is recoded in such a way that a higher value corresponds to a stronger agreementto the statement. *) p-values. Source: own survey and calculation.
17
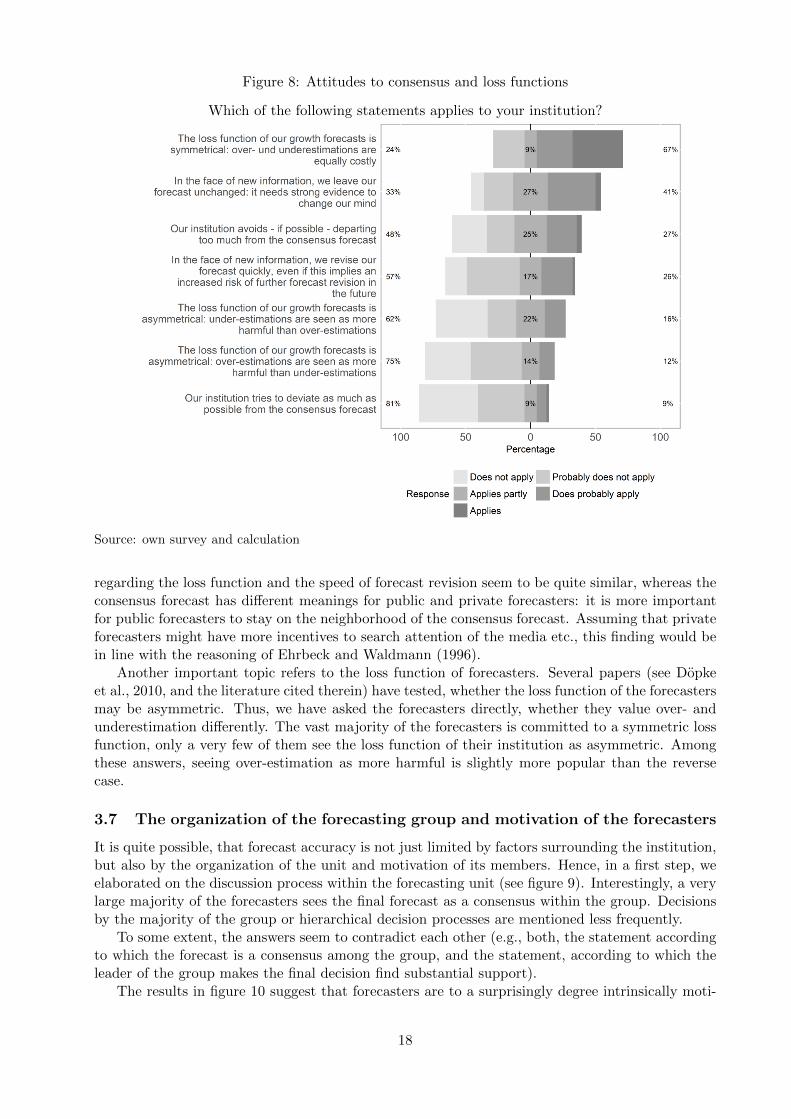
Figure 8: Attitudes to consensus and loss functions
Which of the following statements applies to your institution?
Source: own survey and calculation
regarding the loss function and the speed of forecast revision seem to be quite similar, whereas theconsensus forecast has different meanings for public and private forecasters: it is more importantfor public forecasters to stay on the neighborhood of the consensus forecast. Assuming that privateforecasters might have more incentives to search attention of the media etc., this finding would bein line with the reasoning of Ehrbeck and Waldmann (1996).
Another important topic refers to the loss function of forecasters. Several papers (see Dopkeet al., 2010, and the literature cited therein) have tested, whether the loss function of the forecastersmay be asymmetric. Thus, we have asked the forecasters directly, whether they value over- andunderestimation differently. The vast majority of the forecasters is committed to a symmetric lossfunction, only a very few of them see the loss function of their institution as asymmetric. Amongthese answers, seeing over-estimation as more harmful is slightly more popular than the reversecase.
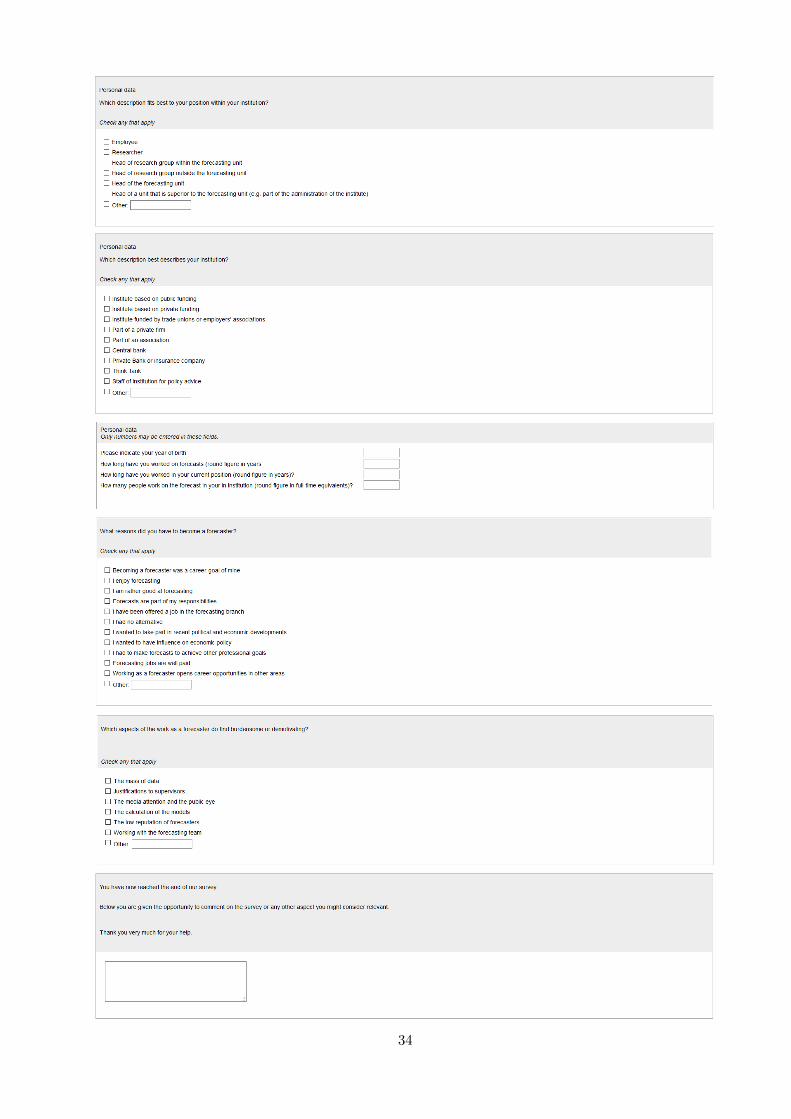
3.7 The organization of the forecasting group and motivation of the forecasters
It is quite possible, that forecast accuracy is not just limited by factors surrounding the institution,but also by the organization of the unit and motivation of its members. Hence, in a first step, weelaborated on the discussion process within the forecasting unit (see figure 9). Interestingly, a verylarge majority of the forecasters sees the final forecast as a consensus within the group. Decisionsby the majority of the group or hierarchical decision processes are mentioned less frequently.
To some extent, the answers seem to contradict each other (e.g., both, the statement accordingto which the forecast is a consensus among the group, and the statement, according to which theleader of the group makes the final decision find substantial support).
The results in figure 10 suggest that forecasters are to a surprisingly degree intrinsically moti-
18
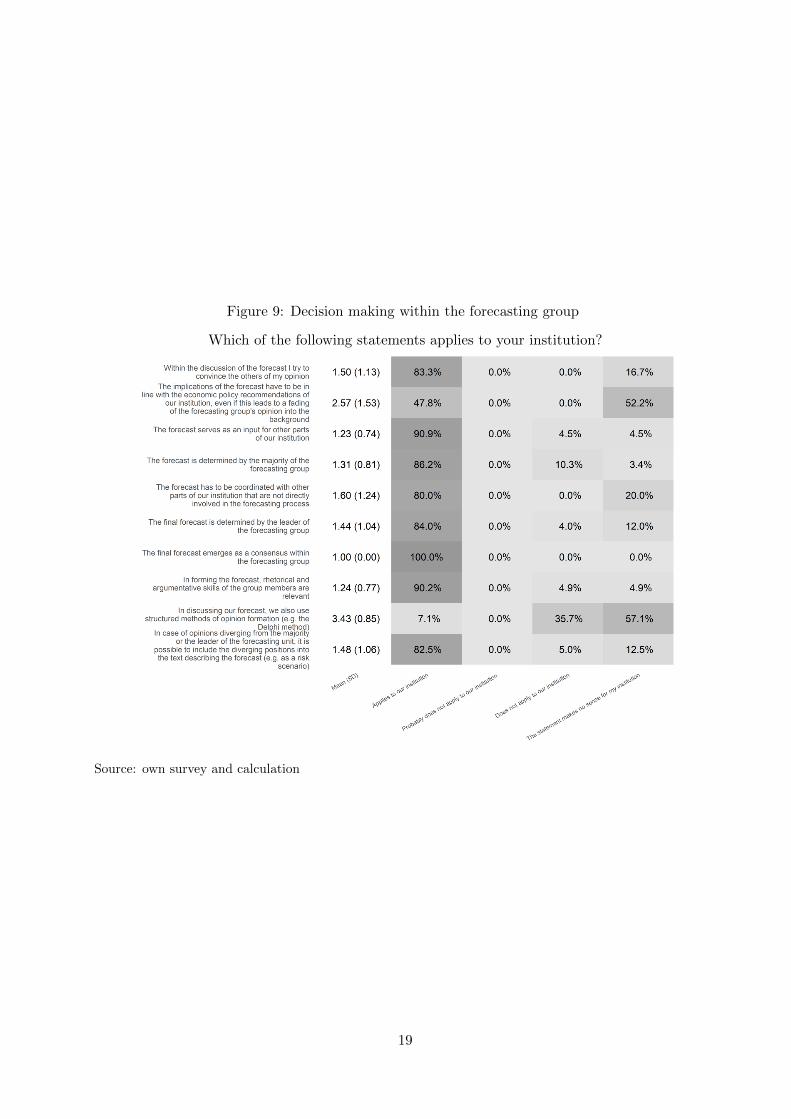
Figure 9: Decision making within the forecasting group
Which of the following statements applies to your institution?
Source: own survey and calculation
19
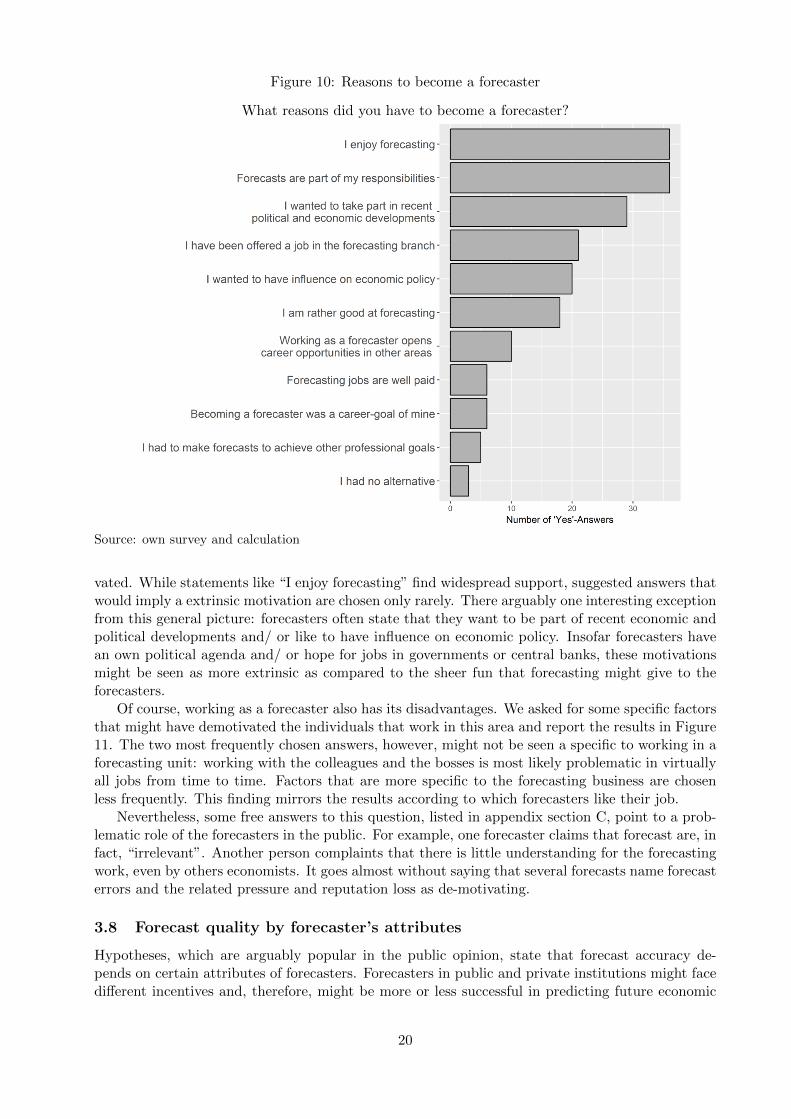
Figure 10: Reasons to become a forecaster
What reasons did you have to become a forecaster?
Source: own survey and calculation
vated. While statements like “I enjoy forecasting” find widespread support, suggested answers thatwould imply a extrinsic motivation are chosen only rarely. There arguably one interesting exceptionfrom this general picture: forecasters often state that they want to be part of recent economic andpolitical developments and/ or like to have influence on economic policy. Insofar forecasters havean own political agenda and/ or hope for jobs in governments or central banks, these motivationsmight be seen as more extrinsic as compared to the sheer fun that forecasting might give to theforecasters.
Of course, working as a forecaster also has its disadvantages. We asked for some specific factorsthat might have demotivated the individuals that work in this area and report the results in Figure11. The two most frequently chosen answers, however, might not be seen a specific to working in aforecasting unit: working with the colleagues and the bosses is most likely problematic in virtuallyall jobs from time to time. Factors that are more specific to the forecasting business are chosenless frequently. This finding mirrors the results according to which forecasters like their job.
Nevertheless, some free answers to this question, listed in appendix section C, point to a prob-lematic role of the forecasters in the public. For example, one forecaster claims that forecast are, infact, “irrelevant”. Another person complaints that there is little understanding for the forecastingwork, even by others economists. It goes almost without saying that several forecasts name forecasterrors and the related pressure and reputation loss as de-motivating.
3.8 Forecast quality by forecaster’s attributes
Hypotheses, which are arguably popular in the public opinion, state that forecast accuracy de-pends on certain attributes of forecasters. Forecasters in public and private institutions might facedifferent incentives and, therefore, might be more or less successful in predicting future economic
20
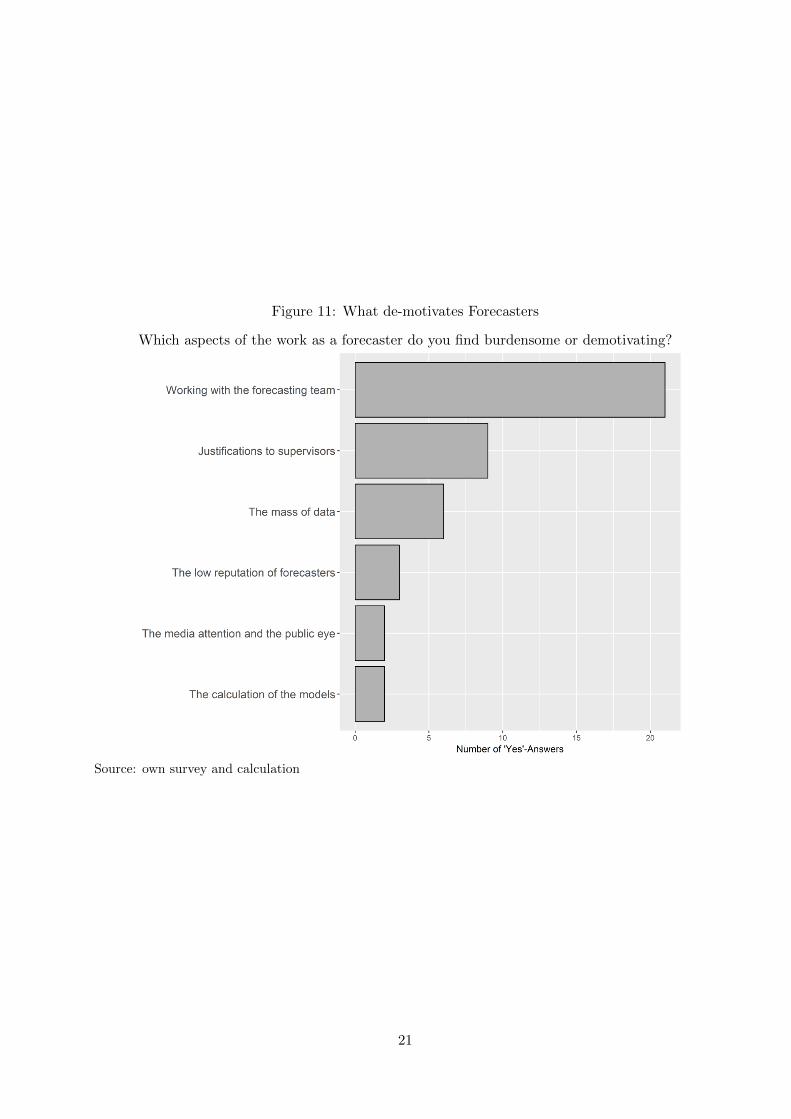
Figure 11: What de-motivates Forecasters
Which aspects of the work as a forecaster do you find burdensome or demotivating?
Source: own survey and calculation
21
developments. Forecasters that rely on a specific theoretical model might also be systematicallybetter or worse than those, who believe in another model.
Relying on the information of our survey, we are able to link a sub-sample of the forecasters tothe forecast accuracy of their institution. To this end, we use the “long-term” evaluation conductedby Fricke (2016), who ranks several institution by forecast accuracy. Figure 12 depicts the (long-run) rank of a forecasting institution by theoretical position (Panel (a) and by nature of institution((Panel (b)). A higher rank corresponds to better forecast quality. While it seems not reasonable toundertake any statistical inference (we have only 4 institutions that qualify as leaning Neoclassical)eye-balling the data suggest no important differences between the two theoretical camps, althoughthe Keynesian-leaning forecasters perform slightly better if one refers to the mean rank. By andlarge, the same holds for a break-down by the nature of the institution: no noteworthy differencesare detectable. There is, however, a much smaller variance across the public institutions in theranks.13 Still, we would conclude that our results are in line with previous findings of, e.g., Batchelorand Dua (1990a), who conclude that “all forecasters are (statistically) equal.”
4 Conclusions
We have conducted a survey among active forecasters of the German business cycle. 82 forecastersstemming from 37 different institutions have responded. The results suggest that practitioners inthe forecasting branch subscribe to well-established methods and theories. We find no close linkto the recent debates in the more academic sphere. This might relate to the distinction betweeneconomists as “scientists” and “engineers” as argued by Mankiw (2006) and Colander (2017).Recent approaches from the academic literature (like, e.g., DSGE models) are more popular amongforecaster from public institutions than among their colleagues from private institutions. In thiscontext, the differences between “scientists” and “engineers” is not necessarily a problem: as bothpopular commentators of economic policy (Smith, 2017) and eminent academics (Blanchard, 2017)have pointed out, there are divergent aims of macroeconomics require different types of models.
Regarding two aspects, we can confirm findings from the earlier literature: First, forecastersseem to be risk-averse and tend to lean towards the consensus and second, there is a self-reportedbehaviour to revise forecasts only gradually. Both is in line with the finding in the literature.
According to our results, there is almost no evidence that the behavior of forecasters has changedsubstantially since the Great Recession. Confirming results form previous studies (Batchelor andDua, 1990b) we also cannot establish a stable relationship between preferred theories and methodsand forecast accuracy. The differences with respect to the theories forecasters subscribe to, however,point to cohort effects similar to effects observed among the general public (Malmendier and Nagel,2016).
Furthermore, from the open answer categories we can infer, that large forecast errors seem tohave in impact on the self-perception and self-reflection of forecasters. Several forecasters reportthe high importance of uncertainty (in the Knightian sense) and report efforts to evaluate forecastsmore regularly and try to minimize the dependency from one method.
Further research should employ qualitative methods from other social science disciplines (sociol-ogy, psychology, political sciences) to shed more light on the mechanisms of expectation formationand the role of personal (historical) experience therein.
13At this point it is necessary to recall an important caveat of our analysis: we held the individual forecasteraccountable for the accuracy of his/ her institution. It might well be the case that the forecasters would have knownbetter, but was in a minority position within his/ her institution.
22
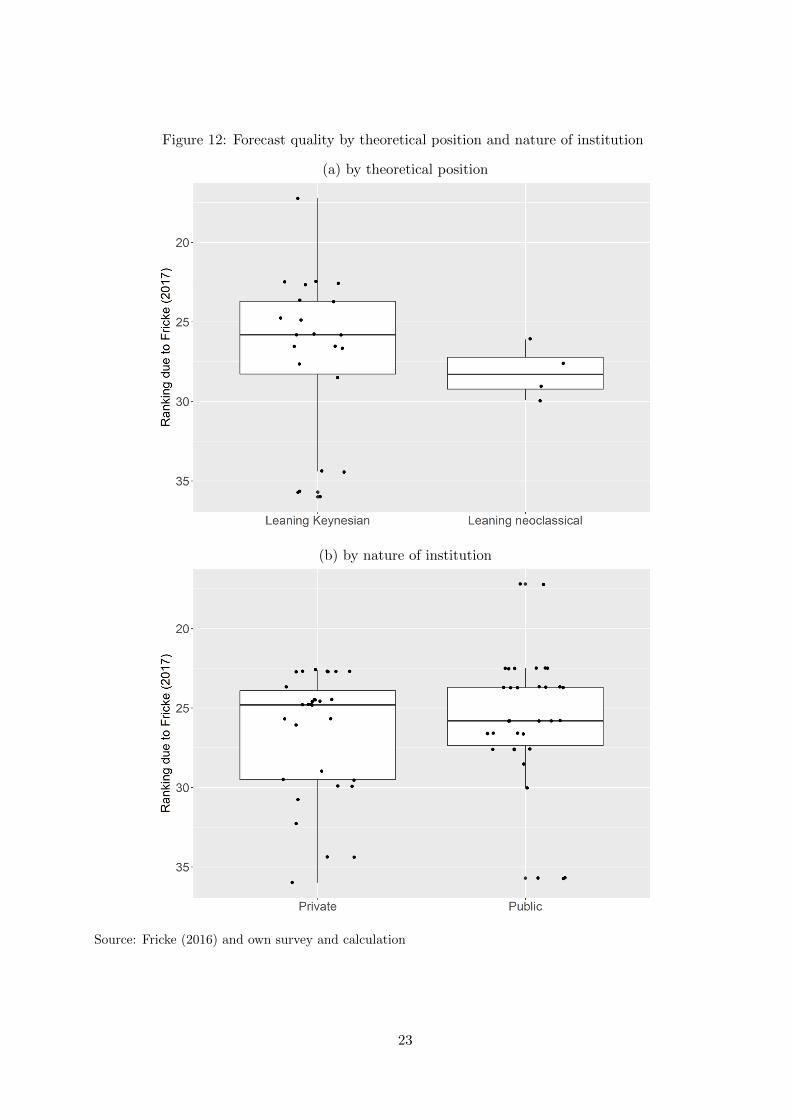
Figure 12: Forecast quality by theoretical position and nature of institution
(a) by theoretical position
(b) by nature of institution
Source: Fricke (2016) and own survey and calculation
23
References
Arbeitsgruppe alternative Wirtschaftspolitik (Memorandum-Gruppe) (2016): Memoran-dum 2016, http://www.alternative-wirtschaftspolitik.de/veroeffentlichungen_der_
arbeitsgruppe/memorandum_2016/index.html. Download: 22.3.2017.
Ashiya, M. (2006): “Forecast accuracy and product differentiation of Japanese institutional fore-casters”, International Journal of Forecasting 22(2), 395–401.
Batchelor, D. / Dua, P. (1990a): “All forecasters are equal”, Journal of Business and EconomicStatistics 8, 143–144.
Batchelor, R. / Dua, P. (1990b): “Forecaster ideology, forecasting technique, and the accuracy ofeconomic forecasts”, International Journal of Forecasting 6(1), 3–10.
Beckert, J. (2016): “Imagined futures: fictional expectations and capitalist dynamics”, HarvardUniversity Press.
BITKOM - Germany’s digital association (2016): Thema: ITK-Konjunktur, https://www.bitkom.org/Marktdaten/ITK-Konjunktur/index.jsp. Download: 22.3.2017.
Blanchard, O. (2017): On the need for (at least) five classes of macro models, https://piie.com/blogs/realtime-economic-issues-watch/need-least-five-classes-macro-models.
Blanchard, O. J. / Leigh, D. (2013): “Growth forecast errors and fiscal multipliers”, The AmericanEconomic Review 103(3), 117–120.
Bofinger, P. (2016): German macroeconomics: the long shadow of Wal-ter Eucken, VOX - CEPR’s Policy Portal, http://voxeu.org/article/
german-macroeconomics-long-shadow-walter-eucken.
Brauninger, M. / Haucap, J. (2001): “Was Okonomen lesen und schatzen: Ergebnisse einer Um-frage”, Perspektiven der Wirtschaftspolitik 2(2), 185–210.
Carroll, C. D. (2003): “Macroeconomic expectations of households and professional forecasters”,the Quarterly Journal of Economics 118(1), 269–298.
Coibion, O. / Gorodnichenko, Y. (2012): “What can survey forecasts tell us about informationalrigidities?”, Journal of Political Economy 120(1), 116–159.
– (2015): “Information rigidity and the expectations formation process: a simple framework andnew Facts”, American Economic Review 105, 2644–2678.
Colander, D. (2003): “The aging of an economist”, Journal of the History of Economic Thought25(2), 157–176.
– (2005): “The making of an economist redux”, The Journal of Economic Perspectives 19(1),175–198.
– (2017): “Economists should stop doing it with models (and start doing it with heuristics)”,https://www.aeaweb.org/conference/2017/preliminary/paper/9BiBSHD4.
Consensus ForecastTM (2016): “G7 and Western Europe” .
Del Negro, M. / Schorfheide, F. (2013): “DSGE Model-Based Forecasts”, in: Handbook of Eco-nomic Forecasting, Vol 2., ed. by Elliott, G. / Granger, C. / Timmermann, A. B., 57–140,Elsevier.
24
Dohrn, R. (2014): “Konjunkturdiagnose und -prognose: Eine anwendungsorientierte Einfuhrung”,Springer-Verlag.
Dopke, J. (2000): “Haben Konjunkturprognosen in Deutschland einen politischen Bias?”,Schmollers Jahrbuch 120(4), 587–620.
Dopke, J. / Fritsche, U. / Siliverstovs, B. (2010): “Evaluating German business cycle forecastsunder an asymmetric loss function”, OECD Journal: Journal of Business Cycle Measurementand Analysis 2010(1), 1–18.
Dovern, J. / Fritsche, U. / Loungani, P. / Tamirisa, N. (2014): “Information rigidities: Com-paring average and individual forecasts for a large international panel”, International Journal ofForecasting doi:DOI:10.1016/j.ijforecast.2014.06.002.
Dovern, J. / Fritsche, U. / Slacalek, J. (2012): “Disagreement among forecasters in G7 countries”,The Review of Economics and Statistics 94(4), 1081–1096, http://ideas.repec.org/a/tpr/restat/v94y2012i4p1081-1096.html.
Ehrbeck, T. / Waldmann, R. (1996): “Why are professional forecasters biased? Agency versusbehavioral explanations”, The Quarterly Journal of Economics 111(1), 21–40.
Enste, D. H. / Haferkamp, A. / Fetchenhauer, D. (2009): “Unterschiede im Denken zwischenOkonomen und Laien–Erklarungsansatze zur Verbesserung der wirtschaftspolitischen Beratung”,Perspektiven der Wirtschaftspolitik 10(1), 60–78.
European Central Bank (2009): “Results of a special questionnaire for participants in the ECBSurvey of Professional Forecasters (SPF)”, Monthly Bulletin, April, 1–16.
– (2014): “Results of the second special questionnaire for participants in the ECB Survey of Pro-fessional Forecasters”, Monthly Bulletin, January, 1–28.
Evans, R. (2002): “Macroeconomic forecasting: A sociological appraisal”, Routledge.
FAZ (2016): Deutschlands einflussreichste Okonomen, http://www.faz.net/aktuell/
wirtschaft/wirtschaftswissen/f-a-z-oekonomenranking-2016-die-tabellen-14417392.
html.
Feld, L. P. / Necker, S. / Frey, B. S. (2015): “Happiness of economists”, Applied Economics 47(10),990–1007.
Fildes, R. / Stekler, H. O. (2002): “The state of macroeconomic forecasting”, Journal of Macroe-conomics 24, 435–468.
Fondsfrauen (2015): Chefvolkswirte-Liste, http://fondsfrauen.de/fondsfrauen/.
Frey, B. S. / Humbert, S. / Schneider, F. (2010): “What is economics? Attitudes and views ofGerman economists”, Journal of Economic Methodology 17(3), 317–332.
Frey, B. S. / Pommerehne, W. W. / Schneider, F. (1983): “Are we all Monetarists now? anempirical inquiry”, Journal of Post Keynesian Economics 6(1), 89–96.
Frey, B. S. / Pommerehne, W. W. / Schneider, F. / Gilbert, G. (1984): “Consensus and dissensionamong economists: An empirical inquiry”, The American Economic Review 74(5), 986–994.
Fricke, T. (2016): Prognostiker des Jahres 2016 - die Langzeitauswertung, https://
neuewirtschaftswunder.de/.
25
Friedman, W. A. (2014): “Fortune tellers: The story of America’s first economic forecasters”,Princeton University Press.
Fritsche, U. / Tarassow, A. (2017): “Vergleichende Evaluation der Konjunkturprognosen desInstituts fur Makrookonomie und Konjunkturforschung an der Hans-Bockler-Stiftung fur denZeitraum 2005-2014”, IMK Study.
Fuller, D. / Geide-Stevenson, D. (2003): “Consensus among economists: revisited”, The Journalof Economic Education 34(4), 369–387.
Heinsohn, G. / Steiger, O. (2013): “Ownership economics: On the foundations of interest, money,markets, business cycles and economic development”, Routledge.
Ketzler, R. / Zimmermann, K. F. (2013): “A citation-analysis of economic research institutes”,Scientometrics 95(3), 1095–1112.
Kindleberger, C. P. / Aliber, R. Z. (2005): “Manias, panics and crashes: A history of financialcrisis”, Wiley, 5.
Krugman, P. (2000): “How complicated does the model have to be?”, Oxford Review of EconomicPolicy 16(4), 33–42.
Lamont, O. A. (2002): “Macroeconomic forecasts and microeconomic forecasters”, Journal of Eco-nomic Behavior & Organization 48(3), 265–280.
Lawrence, M. / Goodwin, P. / O’ Connor, M. / Onkal, D. (2006): “Judgmental forecasting: Areview of progress over the last 25 years”, International Journal of Forecasting 22(3), 493–518.
Leijonhufvud, A. (1973): “Life among the econ”, Western Economic Journal 11(3), 327–337.
LimeSurvey Project Team / Carsten Schmitz (2017): LimeSurvey: An open source survey tool.LimeSurvey Project, Hamburg, Germany, http://www.limesurvey.org.
Mackowiak, B. / Wiederholt, M. (2009): “Optimal sticky prices under rational inattention”, TheAmerican Economic Review 99(3), 769–803.
Malmendier, U. / Nagel, S. (2016): “Learning from Inflation Experiences”, Quarterly Journal ofEconomics 131(1), 53–87.
Mankiw, N. G. (2006): “The macroeconomist as scientist and engineer”, The Journal of EconomicPerspectives 20(4), 29–46.
Necker, S. (2012): “Wissenschaftliches Fehlverhalten–ein Problem in der deutschen Volkswirtschaft-slehre?”, Perspektiven der Wirtschaftspolitik 13(4), 267–285.
Ngo, H. Q. / Potrafke, N. / Riem, M. / Schinke, C. (forthcoming): “Ideology and dissent amongeconomists: The Joint Economic Forecast of German economic research institutes”, EasternEconomic Journal .
Niedersachsisches Institut fur Wirtschaftsforschung (NIW) (2016): NIW erwartet einevorubergehende Abschwachung des Wachstums der Niedersachsischen Wirtschaft, http://www.niw.de/index.php/presse-detail/items/konjunkturletter-sommer-2012.html. Down-load: 22.3.2107.
Nienhaus, L. (2009): “Die Blindganger: Warum die Okonomen auch kunftige Krisen nicht erkennenwerden”, Campus Verlag.
26
Nordhaus, W. D. (1987): “Forecasting efficiency: concepts and applications”, The Review of Eco-nomics and Statistics 69(4), 667–674.
Otte, M. (2011): “Die Finanzkrise, die Okonomen, der ”Crashprophet” und die Wissenschaft vonder Okonomie”, Jahrbuch fur Wirtschaftsgeschichte/Economic History Yearbook 52(1), 191–217.
Pommerehne, W. W. / Schneider, F. / Frey, B. S. (1983): “Quot homines, tot Sententiae?”,Empirica 10(2), 93–127.
Pommerehne, W. W. / Schneider, F. / Gilbert, G. / Frey, B. S. (1984): “Concordia discors: Or:What do economists think?”, Theory and Decision 16(3), 251–308.
R Core Team (2017): R: A Language and Environment for Statistical Computing. R Foundationfor Statistical Computing, Vienna, Austria, https://www.R-project.org/.
Reichmann, W. (2013): “Epistemic participation: How to produce knowledge about the economicfuture”, Social Studies of Science 43(6), 852–877.
Reinhart, C. M. / Rogoff, K. S. (2009): “This Time is Different: Eight Centuries of FinancialFolly”, Princeton University Press.
Schneider, F. / Frey, B. / Humbert, S. (2007): “Was denken deutsche Okonomen? Eine em-pirische Auswertung einer Internetbefragung unter den Mitgliedern des Vereins fur Socialpolitikim Sommer 2006”, Perspektiven der Wirtschaftspolitik 8(4), 359–377.
Schneider, F. / Pommerehne, W. W. / Frey, B. S. (1983): “Relata referimus: Ergebnisseund Analyse einer Befragung deutscher Okonomen”, Zeitschrift fur die gesamte Staatswis-senschaft/Journal of Institutional and Theoretical Economics , 19–66.
Sims, C. A. (1998): “Stickiness”, Carnegie-Rochester Conference Series on Public Policy 49, 317–356.
– (2003): “Implications of rational inattention”, Journal of Monetary Economics 50(3), 665–690.
Smith, N. (2017): Summing up my thoughts on macroeconomics, http://noahpinionblog.
blogspot.de/2017/06/summing-up-my-thoughts-on-macroeconomics.html.
Stark, T. (2013): “SPF panelists forecasting methods: A note on the aggregate results of a Novem-ber 2009 special survey”, Federal Reserve Bank of Philadelphia .
Stekler, H. O. (2007): “The future of macroeconomic forecasting: Understanding the forecastingprocess”, International Journal of Forecasting 23(2), 237–248.
Whaples, R. (1996): “Is there consensus among American labor economists? Survey results onforty propositions”, Journal of Labor Research 17(4), 725–734.
Wieland, V. / Wolters, M. (2013): “Forecasting and policy making”, in: Handbook of EconomicForecasting, Vol. 2., ed. by Elliott, G. / Granger, C. / Timmermann, A. B., 239–325, Elsevier.
Wissenschaftsrat (1998): Stellungnahme zu den Wirtschaftsforschungsinstituten der BlauenListe in den alten Landern Allgemeine Gesichtspunkte, https://www.ratswd.de/download/
3320-98-1.pdf.
Woodford, M. (2002): “Imperfect common knowledge and the effects of monetary policy”, in:Knowledge, information, and expectations in modern macroeconomics: In honor of Edmund S.Phelps, ed. by Aghion, P. / Frydman, R. / Stiglitz, J. / Woodford, M., chap. Imperfect CommonKnowledge and the Effects of Monetary Policy, 25–58, Princeton University Press.
27

A List of institutions invited
• Economic research institutes, that are formally politically and economically independent:
1. German Institute for Economic Research (DIW)
2. RWI - Leibniz-Institute for Economic Research
3. Halle Institute of Economic Research (IWH)
4. Kiel Institute for the World Economy
5. Ifo Institute – Leibniz Institute for Economic Research at the University of Munich
6. Institute for Employment Research (IAB)
• (Mostly) privately financed forecasting institutions:
7. Kiel Economics
8. FERI
9. Handelsblatt Research Institute
10. IHS Global
11. Hamburg Institute of International Economics (HWWI)14
12. Prognos
• Institutes that are financed by interest groups:
13. Macroeconomic Policy Institute (IMK)
14. Cologne Institute for Economic Research (IW)
• International organizations
15. International Monetary Fund (IMF)
16. European Commission (EC)
17. OECD
• Political institutions or institutions within the process of economic policy advice
18. German Council of Economic Experts (Staff)
19. Federal Ministry for Economic Affairs and Energy
20. German Bundesbank
• Private Firms
21. Commerzbank
22. Deutsche Bank Research
23. Postbank Research
24. Allianz Economic Research
25. MM Warburg Research
26. Helaba Research
27. Berenberg Bank
28. DZ Bank
29. Societe Generale Research
30. Union Investment
31. Goldman Sachs
32. ING Bank Germany
33. Landesbank Berlin
34. Sal. Oppenheim
35. Deka Bank
36. IKB
37. NORD LB
38. Bayern LB
39. HSBC Trinkaus
14Up to 2005, this institute was named HWWA and mainly publicly funded. From 2006 onwards, the institute hasbeen run as a privately funded institute.
28
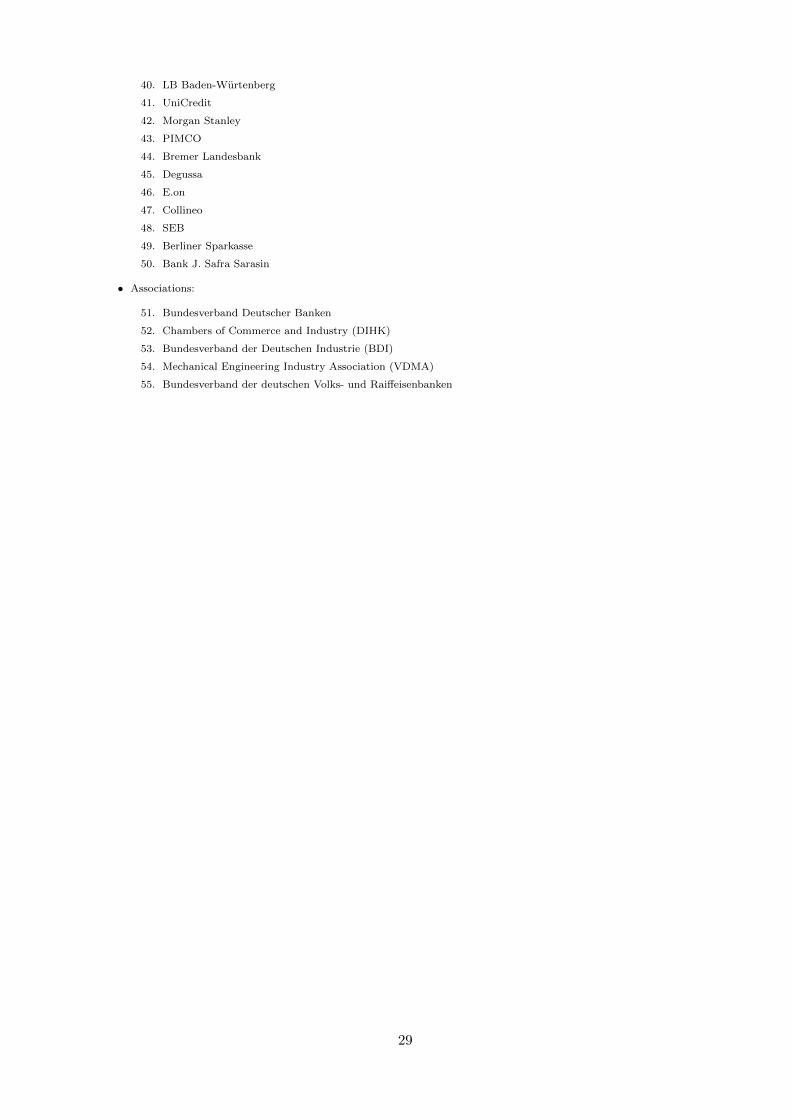
40. LB Baden-Wurtenberg
41. UniCredit
42. Morgan Stanley
43. PIMCO
44. Bremer Landesbank
45. Degussa
46. E.on
47. Collineo
48. SEB
49. Berliner Sparkasse
50. Bank J. Safra Sarasin
• Associations:
51. Bundesverband Deutscher Banken
52. Chambers of Commerce and Industry (DIHK)
53. Bundesverband der Deutschen Industrie (BDI)
54. Mechanical Engineering Industry Association (VDMA)
55. Bundesverband der deutschen Volks- und Raiffeisenbanken
29
B The questionnaire
30
31
32
33
34
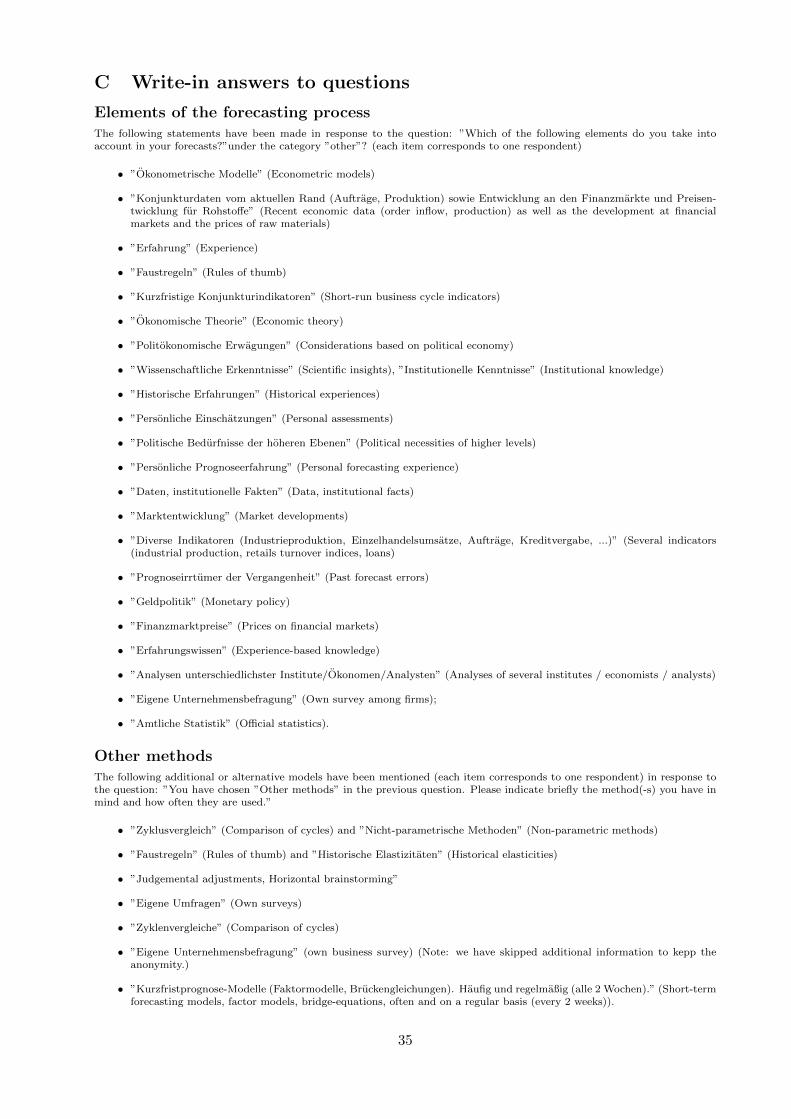
C Write-in answers to questions
Elements of the forecasting processThe following statements have been made in response to the question: ”Which of the following elements do you take intoaccount in your forecasts?”under the category ”other”? (each item corresponds to one respondent)
• ”Okonometrische Modelle” (Econometric models)
• ”Konjunkturdaten vom aktuellen Rand (Auftrage, Produktion) sowie Entwicklung an den Finanzmarkte und Preisen-twicklung fur Rohstoffe” (Recent economic data (order inflow, production) as well as the development at financialmarkets and the prices of raw materials)
• ”Erfahrung” (Experience)
• ”Faustregeln” (Rules of thumb)
• ”Kurzfristige Konjunkturindikatoren” (Short-run business cycle indicators)
• ”Okonomische Theorie” (Economic theory)
• ”Politokonomische Erwagungen” (Considerations based on political economy)
• ”Wissenschaftliche Erkenntnisse” (Scientific insights), ”Institutionelle Kenntnisse” (Institutional knowledge)
• ”Historische Erfahrungen” (Historical experiences)
• ”Personliche Einschatzungen” (Personal assessments)
• ”Politische Bedurfnisse der hoheren Ebenen” (Political necessities of higher levels)
• ”Personliche Prognoseerfahrung” (Personal forecasting experience)
• ”Daten, institutionelle Fakten” (Data, institutional facts)
• ”Marktentwicklung” (Market developments)
• ”Diverse Indikatoren (Industrieproduktion, Einzelhandelsumsatze, Auftrage, Kreditvergabe, ...)” (Several indicators(industrial production, retails turnover indices, loans)
• ”Prognoseirrtumer der Vergangenheit” (Past forecast errors)
• ”Geldpolitik” (Monetary policy)
• ”Finanzmarktpreise” (Prices on financial markets)
• ”Erfahrungswissen” (Experience-based knowledge)
• ”Analysen unterschiedlichster Institute/Okonomen/Analysten” (Analyses of several institutes / economists / analysts)
• ”Eigene Unternehmensbefragung” (Own survey among firms);
• ”Amtliche Statistik” (Official statistics).
Other methodsThe following additional or alternative models have been mentioned (each item corresponds to one respondent) in response tothe question: ”You have chosen ”Other methods” in the previous question. Please indicate briefly the method(-s) you have inmind and how often they are used.”
• ”Zyklusvergleich” (Comparison of cycles) and ”Nicht-parametrische Methoden” (Non-parametric methods)
• ”Faustregeln” (Rules of thumb) and ”Historische Elastizitaten” (Historical elasticities)
• ”Judgemental adjustments, Horizontal brainstorming”
• ”Eigene Umfragen” (Own surveys)
• ”Zyklenvergleiche” (Comparison of cycles)
• ”Eigene Unternehmensbefragung” (own business survey) (Note: we have skipped additional information to kepp theanonymity.)
• ”Kurzfristprognose-Modelle (Faktormodelle, Bruckengleichungen). Haufig und regelmaßig (alle 2 Wochen).” (Short-termforecasting models, factor models, bridge-equations, often and on a regular basis (every 2 weeks)).
35
Other theoriesThe following statements have been made in response to the question: ”You have chosen ”other theories” in the previousquestion. Please indicate briefly, which theories you have in mind and how important they are.”
• ”Debitismus” 15
• ”Klassische Politische Okonomie(,) Marxismus” (Classical political economy, Marxism)
Reasons for forecast errorsThe following additional possible reasons of forecast errors have been mentioned (each item corresponds to one respondent):
• ”Annahme unveranderter Politik” (Assumption of an unchanged policy)
• ”Hohe Komplexitat: Die falschen Wirkungszusammenhange hervorgehoben” (High complexity, the wrong causal rela-tions highlighted)
• ”Die Zukunft ist unbekannt.” (The future is unknown)
• ”Unvorhergesehen Ereignisse, außer Naturkatastrophen.” (Unforeseen events except natural disasters)
• ”Prognosefehler bei exogenen Variablen, die als Input im Modell verwendet werden, z.B. Welthandel, Wechselkurs,Olpreis” (Forecast errors for exogenous variables, that are used as inputs for the model (e.g. world trade, exchangerates, oil prices)
• ”Die Frage ist allgemein formuliert, d.h. alle denkbaren Grunde sind irgendwann irgendwo einmal relevant gewesen”(The question is formulated too general, i.e. all possible reasons have been relevant at some place for a certain time.)
• ”Die Zukunft ist unbekannt.” (The future is unknown)
• ”Ferientage und Saisoneffekte falsch” (Trading days and seasonal effects wrong)
• ”Uberbewertung von personlichen Eindrucken und Stimmungen” (Too much weight for personal impressions and senti-ments)
• ”Shit happens”.
• ”okonomische Schocks treten auf, die per Annahme ausgeschlossen wurden.” (Economic shocks occur that have beenruled out by assumption)
Changes due to financial crisisThe following statements have been given in response to the question about what has changed in the forecasting process dueto the Financial Crisis:
• ”Uberarbeitung bestehender und Schatzung neuer okonometrischer Modelle (neue Indikatoren, Model Averaging)”(Overhaul of existing and estimation of new econometric models (new indicators, model averaging))
• ”Wir sind uns der Ungenauigkeit bewusster, denken in großeren Banbbreiten, legen mehr Wert auf Risikoszenarien”(We are more aware of inaccuracy, think in broader bandwidths, give greater emphasize on risk scenarios)
• ”Systematische Prognosefehlerevaluation” (Systematic forecast error evaluation)
• ”Literatur zur Prognose ist vielschichtiger geworden und erfordert eingehenderes Studium.” (The literature regardingforecasts has become more complex and demands in-depth studies)
• ”Vielfalt der Prognosemethoden und -modelle und Prognosekombination” (Diversity of forecasting methods, models,and combination)
• ”Wir schauen starker auf Unsicherheitsmaße, die auf Marktpreisen basieren. Außerdem beachten wir mehr die Bilanzender Unternehmen und privaten Haushalte, weil laufende Bilanzbereinigungen das Wachstum schwachen. Schließlichsind Blasen wichtiger geworden.” (We are looking more strongly on measures of uncertainty, that rely on market prices.Moreover, consider more strongly the balance sheets of firms and private households, since balance sheet adjustmentsweaken economic growth. Finally, bubbles have become more important.)
• ”Anpassung der eigenen Befragungsmethodik (kurzerer Befraungszeitraum, schnellere Veroffentlichung)” (Adjustmentof the own survey technique (shorter survey period, faster publication). )
15This view traces back to Heinsohn and Steiger (2013).
36
DemotivationThe following statements have been given in response to the question, what possibly de-motivates forecasters (each itemcorresponds to one respondent):
• ”Konjunkturprognosen sind faktisch irrelevant.” (Business cycle forecasts are - in fact - irrelevant)
• ”Dass wenig Zeit fur anderes bleibt” (That there is not enough time for other things)
• ”Die falsche Wahrnehmung uber die Treffsicherheit von Konjunkturprognosen. In der Offentlichkeit und bei Kollegenwird zu wenig anerkannt, wie unsicher (Schocks usw.) das Eintreten von Prognosen ist. Ferner wird dann auf fehlendeKompetenz geschlossen. Das trifft nicht nur auf die Offentlichkeit, sondern auch auf andere Volkswirte anderer Bereichezu.” (The wrong perception of the forecasts. The public opinion and the colleagues do not sufficiently recognize howuncertain (shocks etc.) the realisation of forecasts is. Moreover, from this it is concluded that forecasters are notcompetent. This does not only hold for the general public, but also for economist from other areas).
• ”Nichts” (Nothing).
• ”Politische Einflussnahme” (Political influencing)
• ”Das geringe Grundverstandnis anderer Wissenschaftler und der Offentlichkeit fur die Prognosearbeit (z.B. inharentePrognosefehler, Aufwand Porognosen zu erstellen, Relevanz fur andere Bereiche wie wirtschaftspolitische Bereiche” (Thelittle understanding of other scientist and the public for forecasting work. (e.g., inherent forecast errors, the effort toproduce forecasts, the relevance for other areas and areas of economic policy).
• ”Nichts davon in relevantem Maße” (Nothing of the above to a relevant extend)
• ”Die Datenqualitaet” (Data quality)
• ”Die geringe Prognosegute” (The lack of forecasts accuracy)
• ”Ungunstiges Verhaltnis von Aufwand (Daten-, Modellupdate, Text schreiben etc.) und Ertrag (Aufmerksamkeit i.S.v.”in der wirtschaftspolitischen Debatte Gehor finden” (Unfavourable relation of effort (data and model update, writingtext, etc.) and rewards (attention in the economic policy debate)
• ”Nichts” (Nothing)
• ”Keine” (None)
• ”Fehlprognosen” (Forecast errors)
• ”Nichts” (Nothing)
• ”Limited time budget”
• ”Der generelle Stress im Beruf” (The general stress in the job)
• ”Druck bei Fehlprognosen” (Pressure in case of forecast errors).
Other remarksAt the end of the questionnaire, we asked in a free question for general comments, which may have occurred during answeringthe survey
• ”Die Fragen zu Fiskalmultiplikator, Mindestlohn etc empfide ich als sehr problematisch, da das Situationsbedingte/derKontext noch viel mehr abgefragt werden musste” (I see the question regarding the fiscal multiplier, minimum wageetc. as very problematic, since the situational context should have been queried much more precisely)
• ”Beim langfristigen Fiskalmultiplikator hatte ich gerne die Moglichkeit gehabt, einen negativen Wert einzugeben.” (Asregards the long-run multiplier I would like to had the opportunity to enter a negative value)
• ”Mir waren oftmals eindeutige Antwortmoglichkeiten wie ja/nein lieber als diese graduellen Abstufungen.” (I wouldhave preferred clear-cut yes/no-answer opportunities instead of the graduations.)
• ”Makrookonomische Konjunkturprognosen sind weit mehr als nur eine moglichst treffsichere Punktprognose fur BIP-Wachstum oder Inflation. Jenseits der kurzen Frist (1-2 Quartale) ist die Prognosegute nicht anhand des Prognosefehlersfestzumachen (einfache Vergleichsmodelle wie AR-Prognosen sind dort namlich kaum zu schlagen), sondern anhand derKonsistenz und Stimmigkeit des Prognosegesamtbildes und seiner verschiedenen Komponenten (”Story” hinter demPrognose-Basisszeario - dieses stellt die aus Sicht des Prognostikers wahrscheinlichste Entwicklung bedingt auf dieexogenen Annahmen und auf die Annahme des Abklingens vergangener okonomischer Schocks und des Ausbleibenszukunftiger Schocks dar” (Macroeconomic business cycle forecasts are much more than just as precise as possible apoint forecast of GDP growth or inflation. Beyond the very short-run time horizon(1-2 quarters) forecast accuracycannot be measured with a simple forecast error (since simple competing models like AR models are much better inthis regard). Rather, forecasts have to be judged by the consistency and coherence of the underlying picture and itsdifferent components (the ”story” of the base-scenario of the forecast, which gives the most likely development in theeyes of the forecaster given the assumptions for exogenous factors and the unwinding of past economic shocks and thenon-existence of future shocks) )
37