therapeutic benefits of nature images on health: the
TRANSCRIPT

THERAPEUTIC BENEFITS
OF NATURE IMAGES
ON HEALTH:
The Effects of Presence and Influence in Nature Images
in a Simulated Hospital Patient Room
Ellen Vincent + Dina Battisto
Rotterdam, The Netherlands 26.5.2009
E N V I R O N M E N T A L D E S I G N & PL A N N I N G P h. D. P R O G R A M

A C K N O W L E D G E M E N T S
Supported in part by a grant from the
Department of Defense
through
Spartanburg Regional Health System and
NXT Health, Inc.

I N T R O D U C T I O N
Research grounded
in theory and
experimental design
that is replicable and
randomized is
needed to guide the
selection of nature
images for
therapeutic
environments (Malenbaum et al., 2008;
van den Berg, 2005; RMNO,
2004; Stamps, 2004; Dilani,
2001) .
Getty images

T H E O R Y
Prospect refuge theory of landscape
preference
“To see without being seen.”
Jay Appleton, 1996
Present day landscape preferences stem from
our hereditary hunter-gatherer roles in the
African savannah.
Human‟s selection of habitats had serious life
and death consequences.
Appleton developed a descriptive functional
classification for landscapes.
Categories include “prospect”; “refuge”; and
“hazard”.
Getty image

I N T R O D U C T I O N : P U R P O S E
How can we
study the impact
of nature
images?
Establish a
methodology to
select images and
then study how
they impact
physiological and
psychological
indicators. Getty images
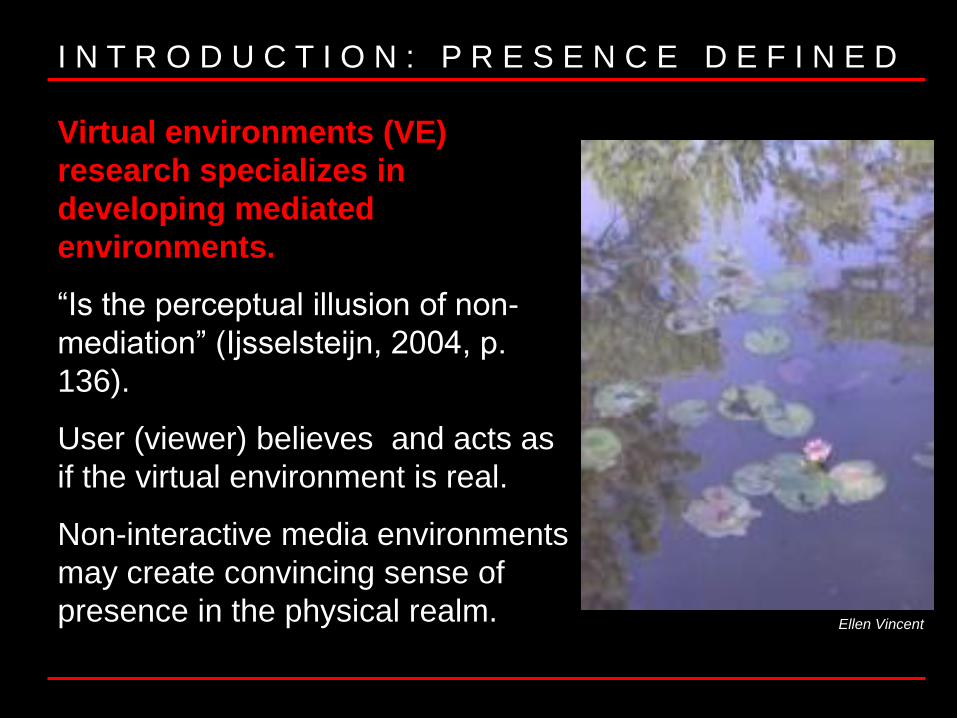
I N T R O D U C T I O N : P R E S E N C E D E F I N E D
Virtual environments (VE)
research specializes in
developing mediated
environments.
“Is the perceptual illusion of non-
mediation” (Ijsselsteijn, 2004, p.
136).
User (viewer) believes and acts as
if the virtual environment is real.
Non-interactive media environments
may create convincing sense of
presence in the physical realm. Ellen Vincent
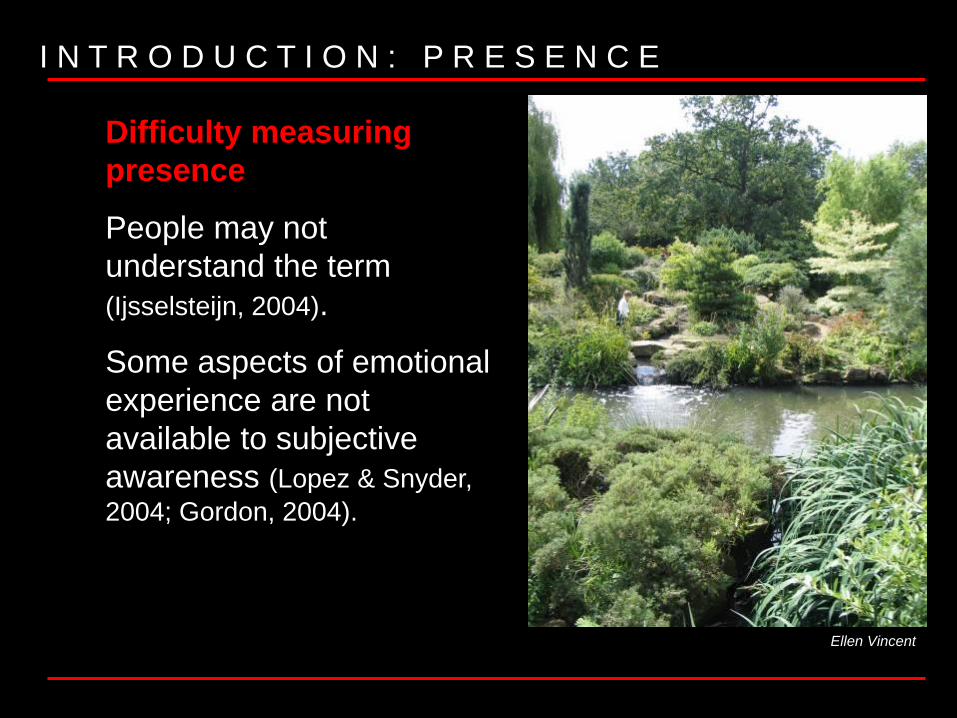
I N T R O D U C T I O N : P R E S E N C E
Difficulty measuring
presence
People may not
understand the term
(Ijsselsteijn, 2004).
Some aspects of emotional
experience are not
available to subjective
awareness (Lopez & Snyder,
2004; Gordon, 2004).
Ellen Vincent

I N T R O D U C T I O N : I N F L U E N C E
v. “To affect or alter” (Merriam
Webster, 1989, p. 382)).
v. “Sway, affect, alter, change,
induce, persuade” (Agnes & Laird,
2002, p. 328).
Influence question added
because of pilot participant
response. Influence of image
on thoughts may be easier to
comprehend than presence.
Ellen Vincent

R E S E A R C H Q U E S T I O N S
1) Is there a difference in the level of
presence between the selected images?
2) Is there a difference in the level of
influence between the selected images?
3) Is there a correlation between levels of
presence and levels of influence?
R E S E A R C H H Y P O T H E S I S
Higher degrees of presence and/or
influence in the still photograph make it
more effective at holding the viewer‟s
attention, which may then distract the
viewer from pain.
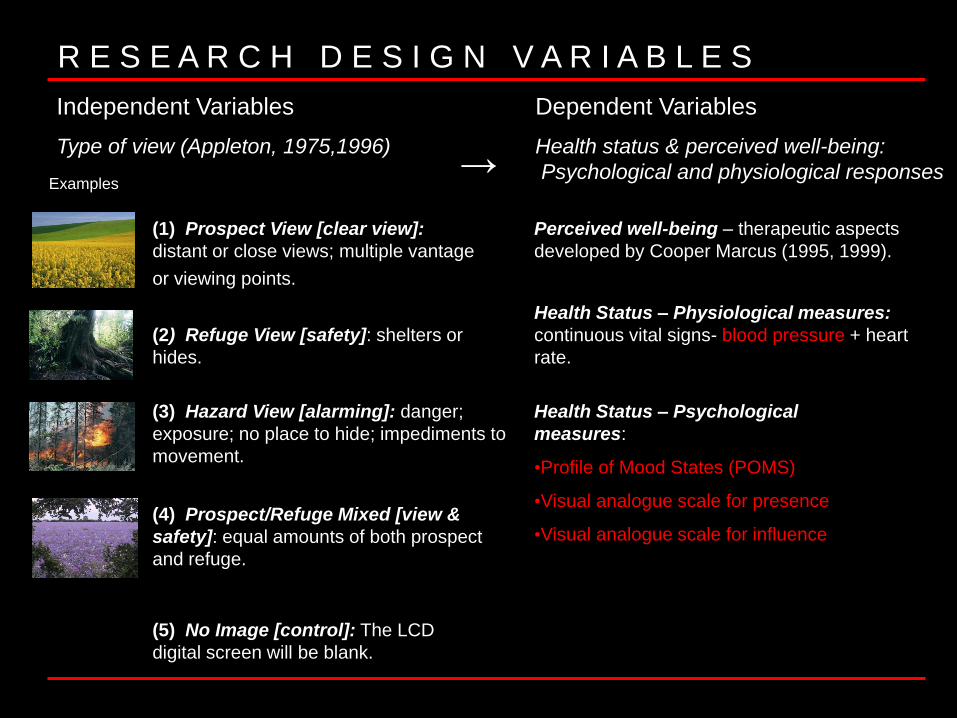
R E S E A R C H D E S I G N V A R I A B L E S
(1) Prospect View [clear view]:
distant or close views; multiple vantage
or viewing points.
Independent Variables Dependent Variables
Type of view (Appleton, 1975,1996) Health status & perceived well-being:
Psychological and physiological responsesExamples
Perceived well-being – therapeutic aspects
developed by Cooper Marcus (1995, 1999).
(2) Refuge View [safety]: shelters or
hides.
(3) Hazard View [alarming]: danger;
exposure; no place to hide; impediments to
movement.
Health Status – Physiological measures:
continuous vital signs- blood pressure + heart
rate.
(5) No Image [control]: The LCD
digital screen will be blank.
Health Status – Psychological
measures:
•Profile of Mood States (POMS)
•Visual analogue scale for presence
•Visual analogue scale for influence
→
(4) Prospect/Refuge Mixed [view &
safety]: equal amounts of both prospect
and refuge.
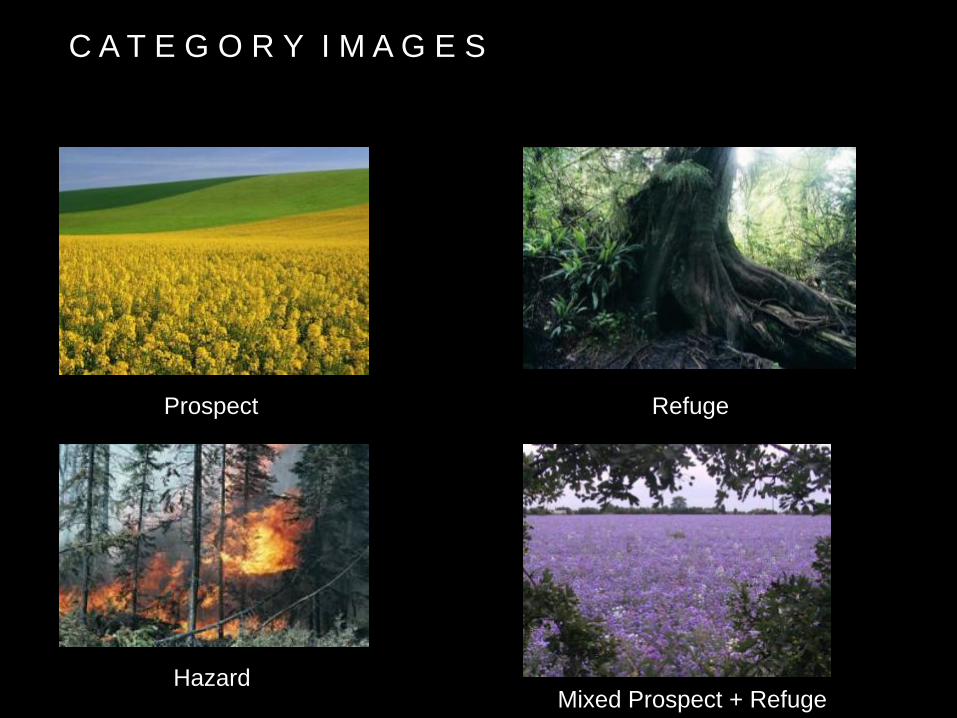
Prospect Refuge
HazardMixed Prospect + Refuge
C A T E G O R Y I M A G E S
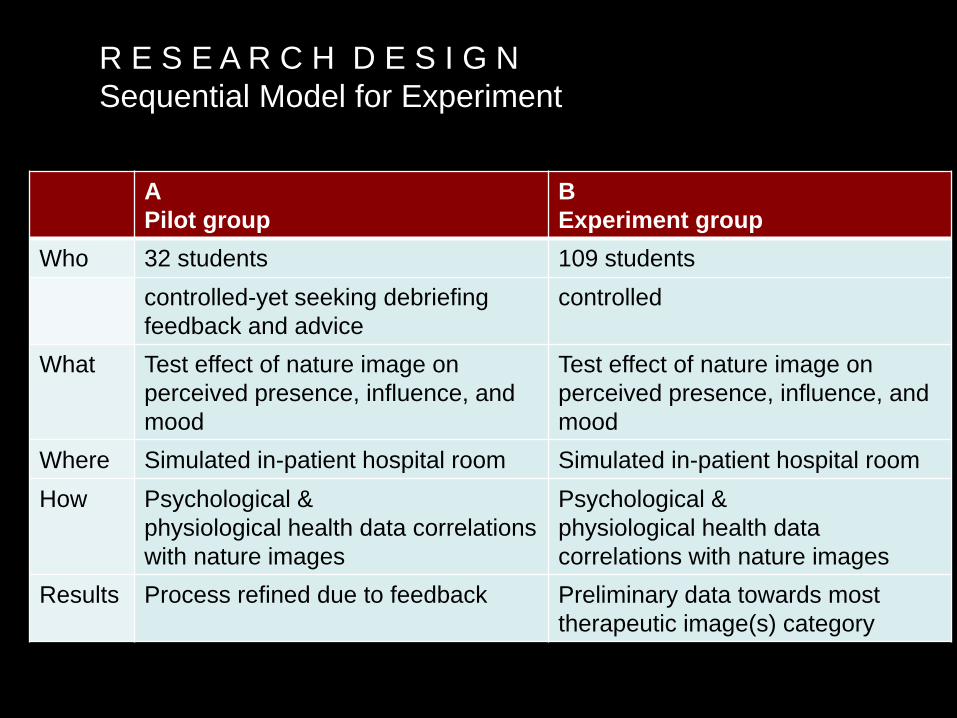
A
Pilot group
B
Experiment group
Who 32 students 109 students
controlled-yet seeking debriefing
feedback and advice
controlled
What Test effect of nature image on
perceived presence, influence, and
mood
Test effect of nature image on
perceived presence, influence, and
mood
Where Simulated in-patient hospital room Simulated in-patient hospital room
How Psychological &
physiological health data correlations
with nature images
Psychological &
physiological health data
correlations with nature images
Results Process refined due to feedback Preliminary data towards most
therapeutic image(s) category
R E S E A R C H D E S I G N
Sequential Model for Experiment
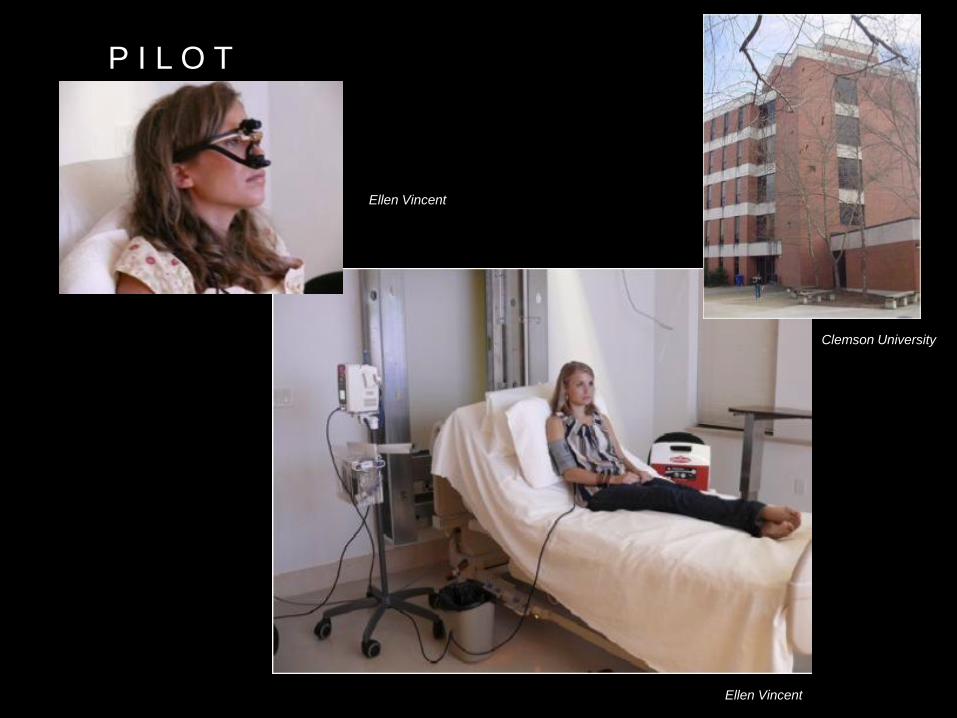
P I L O T
Ellen Vincent
Ellen Vincent
Clemson University

P I L O T
Ellen Vincent
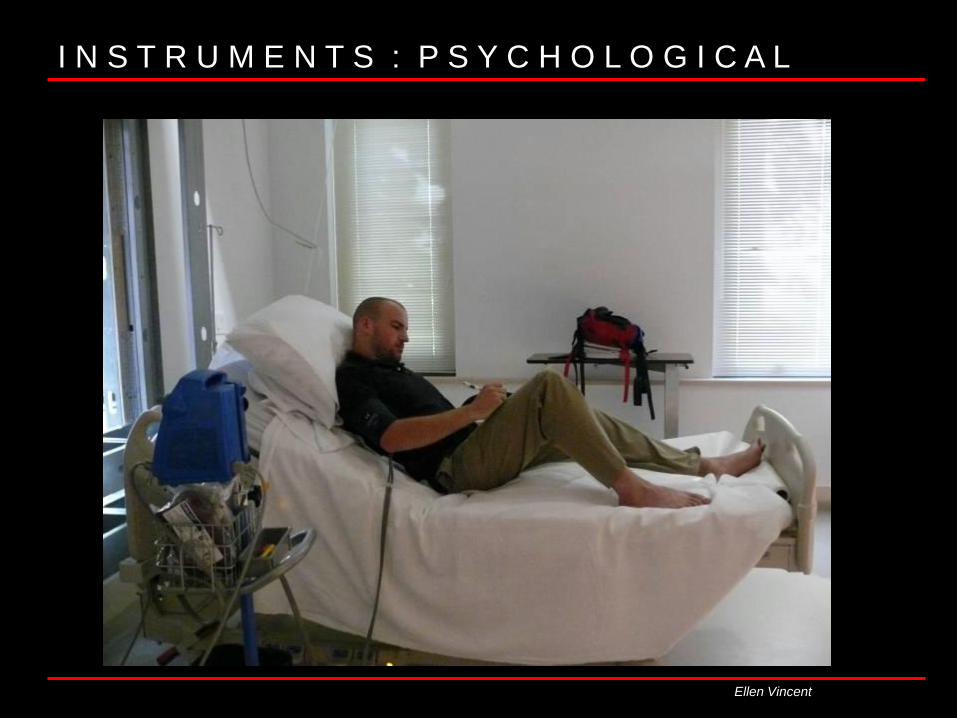
I N S T R U M E N T S : P S Y C H O L O G I C A L
Ellen Vincent

I N S T R U M E N T S : P S Y C H O L O G I C A L
Presence Influence
Presence Visual Analogue
Scale (VAS)
Influence Visual
Analogue Scale (VAS)
How strong is your sense
of presence, „bring there‟,
in the image right now?
How strong is the image
at influencing your
thoughts, either directly
or indirectly right now?
Vertical slash responses were made on a
10-cm. line anchored by terms “extremely
weak” and “extremely strong.”
Responses were measured with a ruler
and assigned a number.
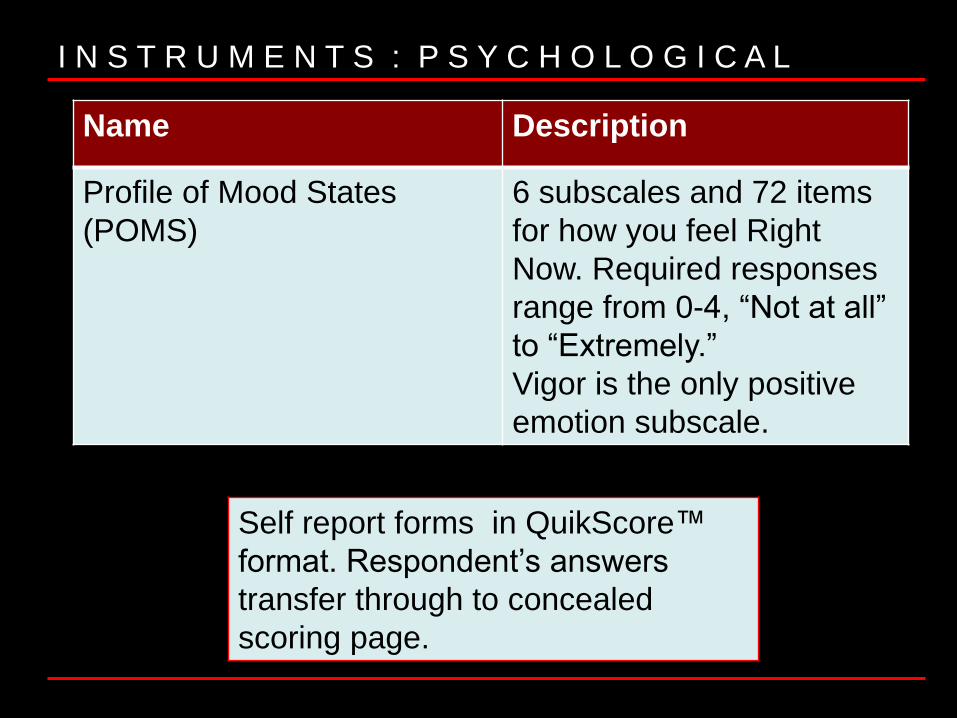
I N S T R U M E N T S : P S Y C H O L O G I C A L
Name Description
Profile of Mood States
(POMS)
6 subscales and 72 items
for how you feel Right
Now. Required responses
range from 0-4, “Not at all”
to “Extremely.”
Vigor is the only positive
emotion subscale.
Self report forms in QuikScore™
format. Respondent‟s answers
transfer through to concealed
scoring page..

I N S T R U M E N T S : P H Y S I O L O G I C A L
Ellen Vincent
Ellen Vincent
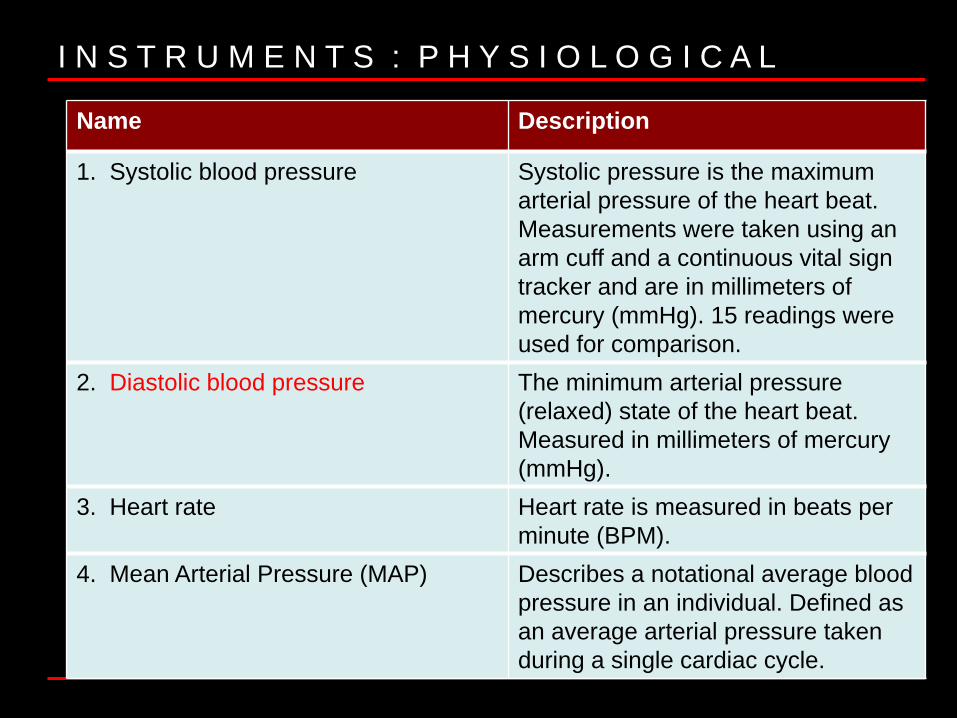
I N S T R U M E N T S : P H Y S I O L O G I C A L
Name Description
1. Systolic blood pressure Systolic pressure is the maximum
arterial pressure of the heart beat.
Measurements were taken using an
arm cuff and a continuous vital sign
tracker and are in millimeters of
mercury (mmHg). 15 readings were
used for comparison.
2. Diastolic blood pressure The minimum arterial pressure
(relaxed) state of the heart beat.
Measured in millimeters of mercury
(mmHg).
3. Heart rate Heart rate is measured in beats per
minute (BPM).
4. Mean Arterial Pressure (MAP) Describes a notational average blood
pressure in an individual. Defined as
an average arterial pressure taken
during a single cardiac cycle.
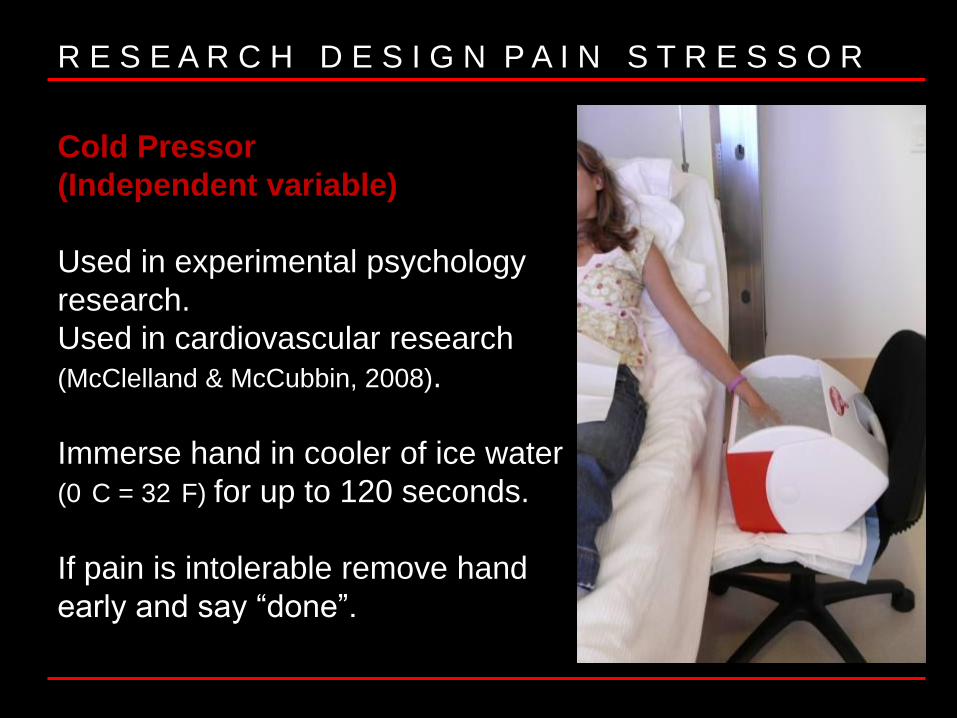
R E S E A R C H D E S I G N P A I N S T R E S S O R
Cold Pressor
(Independent variable)
Used in experimental psychology
research.
Used in cardiovascular research
(McClelland & McCubbin, 2008).
Immerse hand in cooler of ice water
(0 C = 32 F) for up to 120 seconds.
If pain is intolerable remove hand
early and say “done”.
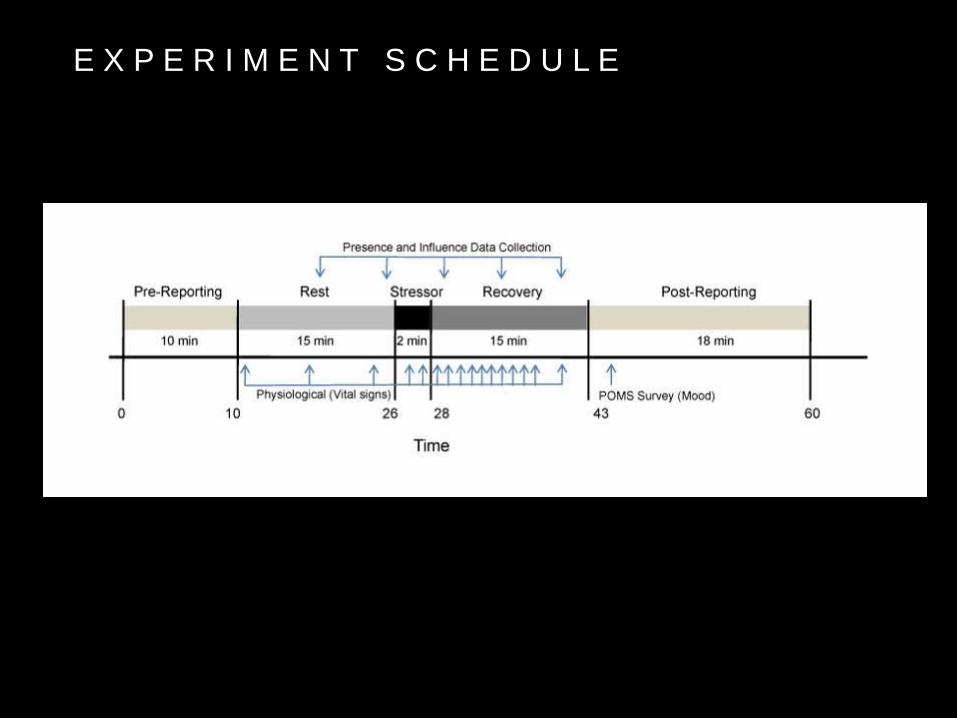
E X P E R I M E N T S C H E D U L E

R E S U L T S : P S Y C H O L O G I C A L
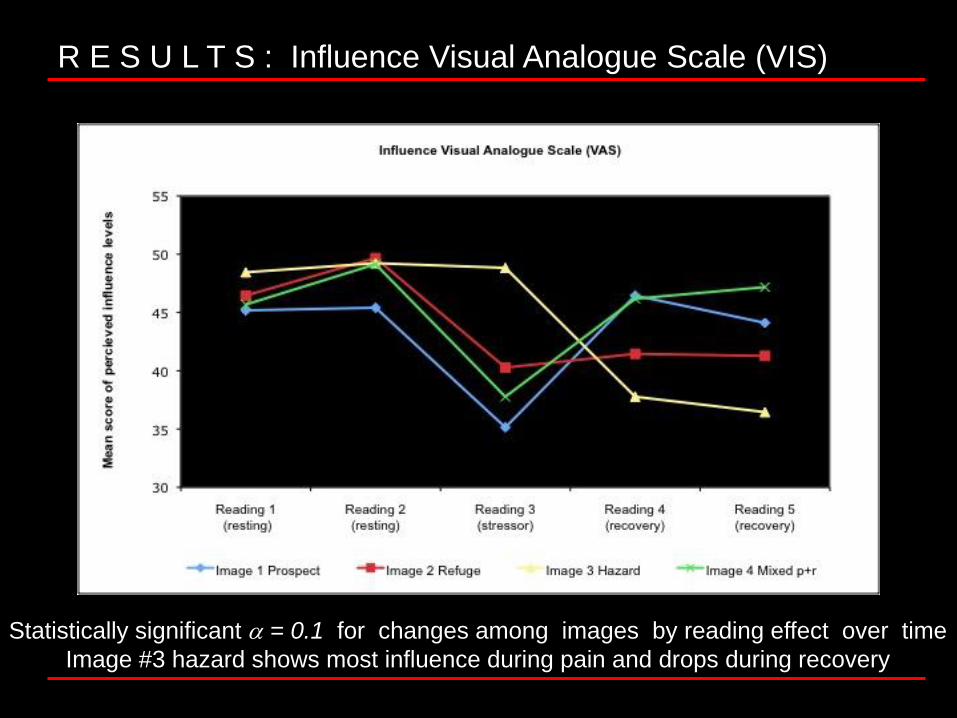
R E S U L T S : Influence Visual Analogue Scale (VIS)
Statistically significant = 0.1 for changes among images by reading effect over time
Image #3 hazard shows most influence during pain and drops during recovery

Statistics of influence response for image and reading
Mixed model analysis of variance with a repeated measure
design
**Statistically significant = 0.1 to assess trends for changes among
images by reading effect over time.
Hazard image showed highest influence responses during pain and least
during recovery
Effect Numerator
DF
Denominator
DF
F
Value
Probability F
Image 3 83.9 0.07 0.9745
Reading 4 332.0 4.29 0.0021**
Image
*Reading
12 332.0 1.95 0.0277**
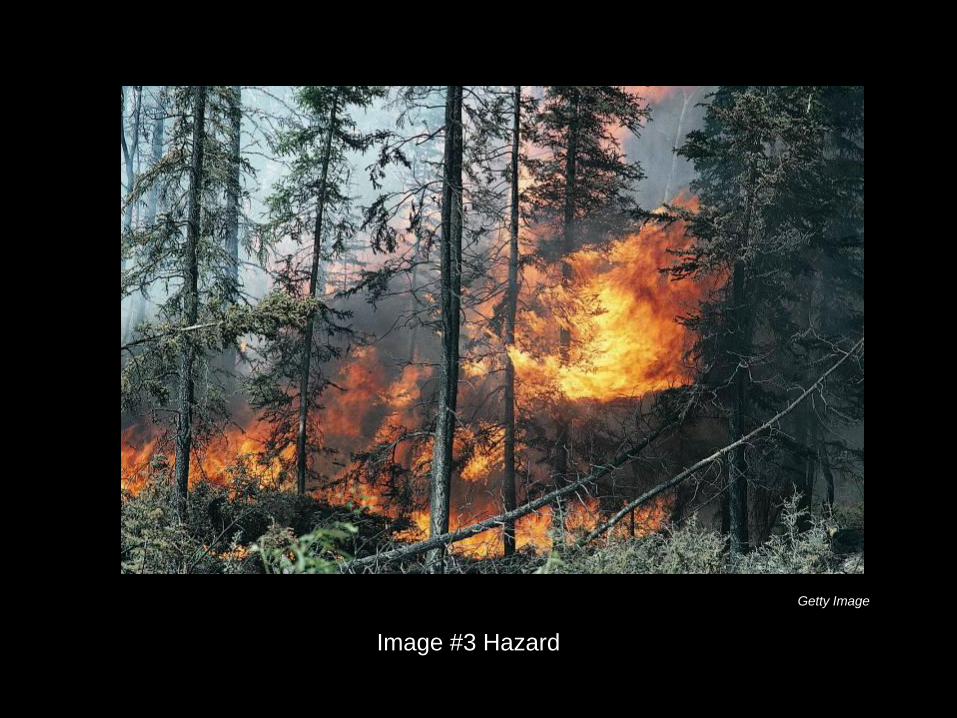
Image #3 Hazard
Getty Image
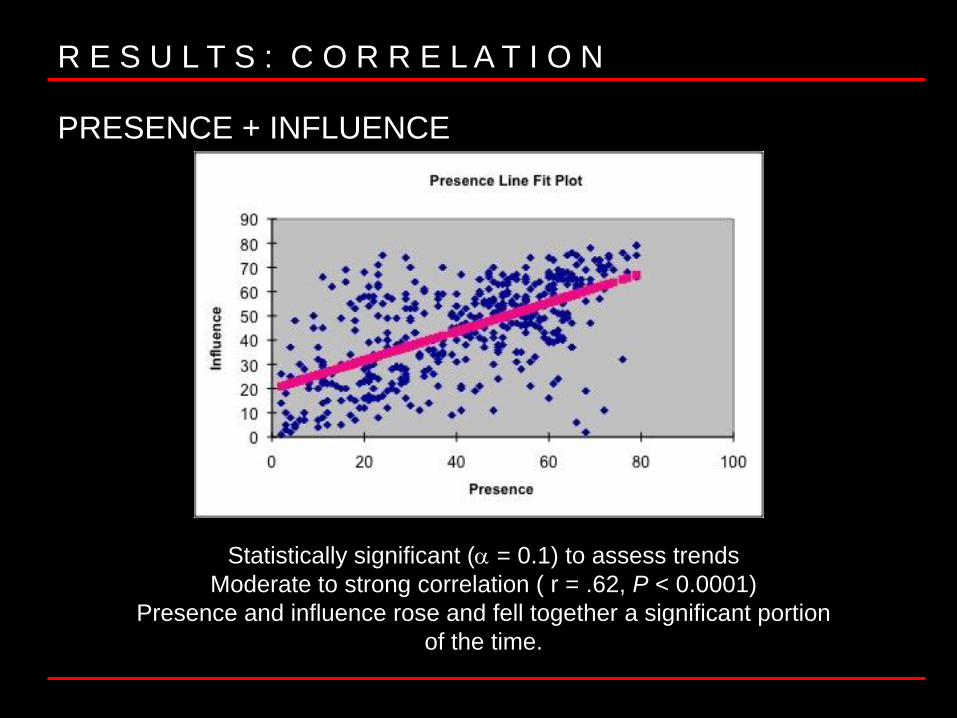
R E S U L T S : C O R R E L A T I O N
Statistically significant ( = 0.1) to assess trends
Moderate to strong correlation ( r = .62, P < 0.0001)
Presence and influence rose and fell together a significant portion
of the time.
PRESENCE + INFLUENCE
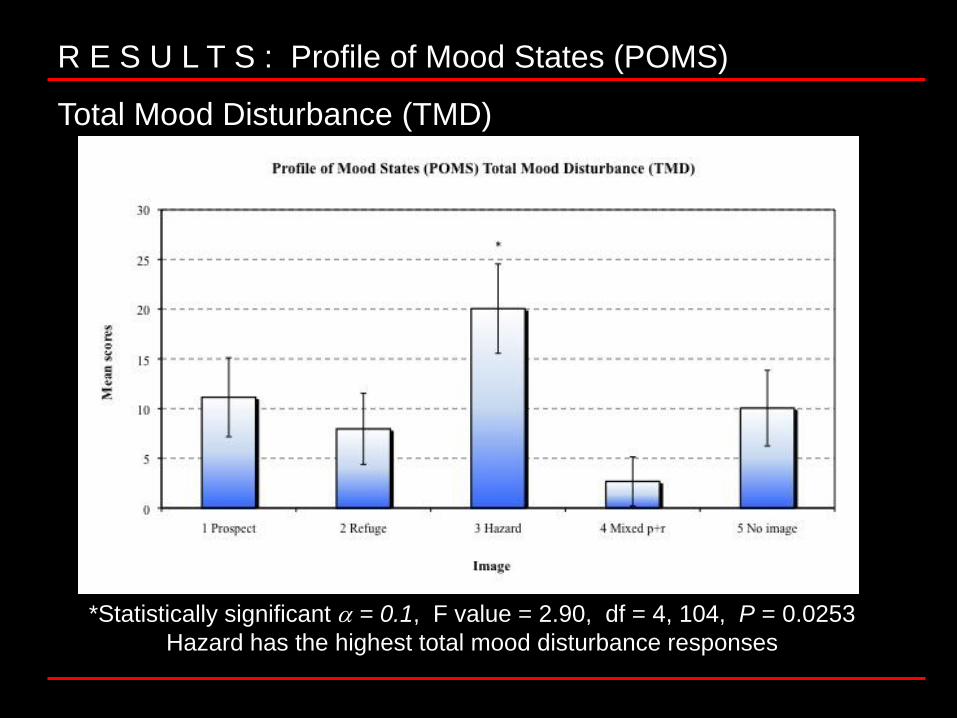
R E S U L T S : Profile of Mood States (POMS)
Total Mood Disturbance (TMD)
*Statistically significant = 0.1, F value = 2.90, df = 4, 104, P = 0.0253
Hazard has the highest total mood disturbance responses
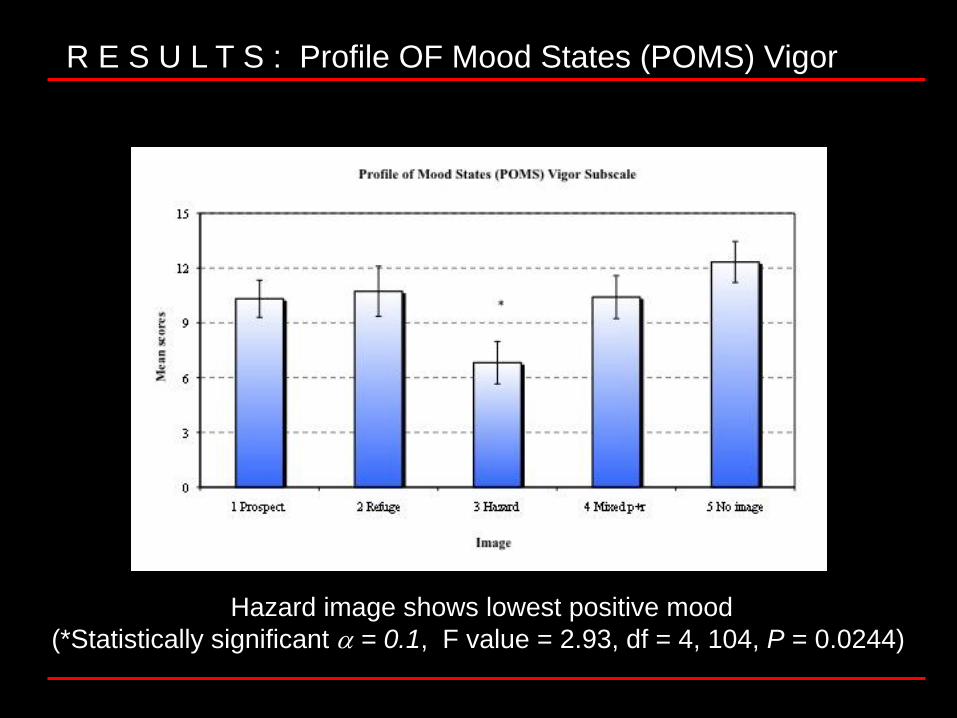
R E S U L T S : Profile OF Mood States (POMS) Vigor
Hazard image shows lowest positive mood
(*Statistically significant = 0.1, F value = 2.93, df = 4, 104, P = 0.0244)

R E S U L T S : P H Y S I O L O G I C A L
Ellen Vincent
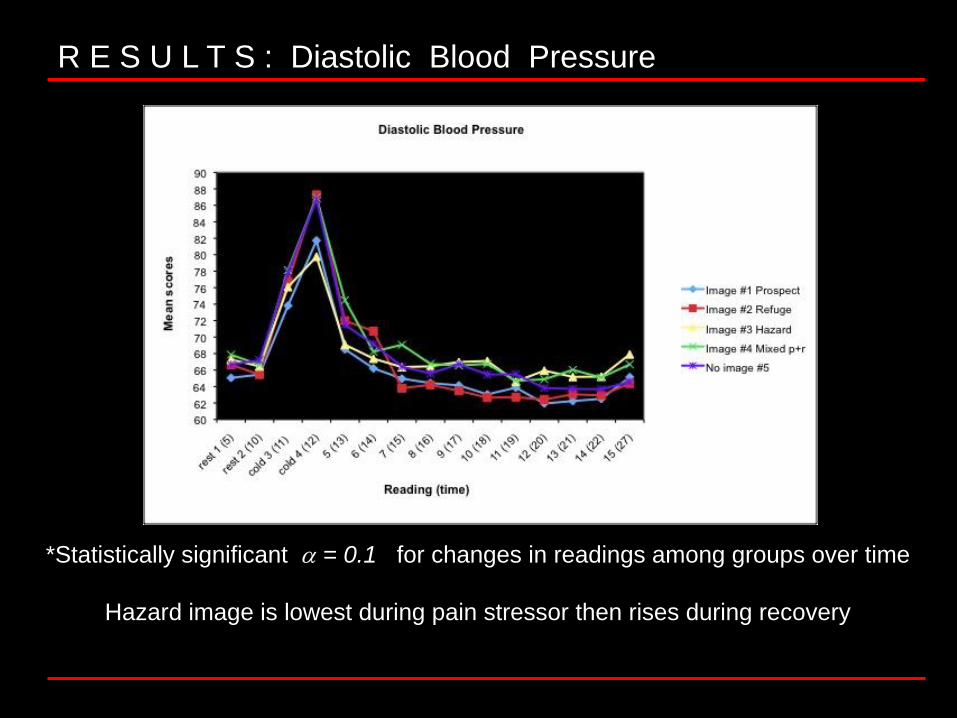
R E S U L T S : Diastolic Blood Pressure
*Statistically significant = 0.1 for changes in readings among groups over time
Hazard image is lowest during pain stressor then rises during recovery
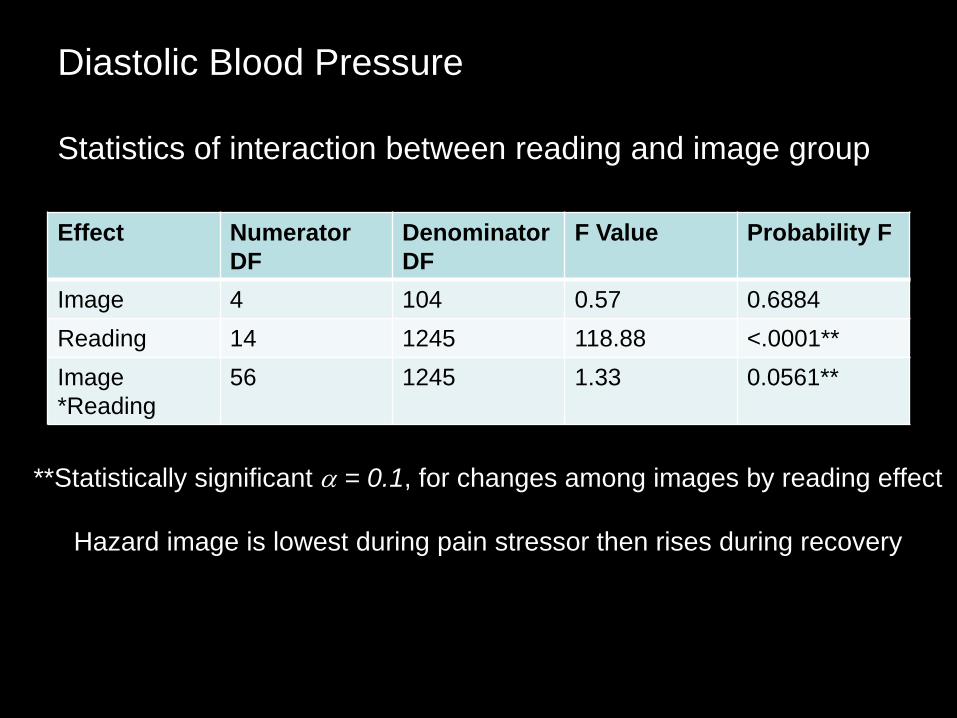
Diastolic Blood Pressure
Statistics of interaction between reading and image group
**Statistically significant = 0.1, for changes among images by reading effect
Hazard image is lowest during pain stressor then rises during recovery
Effect Numerator
DF
Denominator
DF
F Value Probability F
Image 4 104 0.57 0.6884
Reading 14 1245 118.88 <.0001**
Image
*Reading
56 1245 1.33 0.0561**
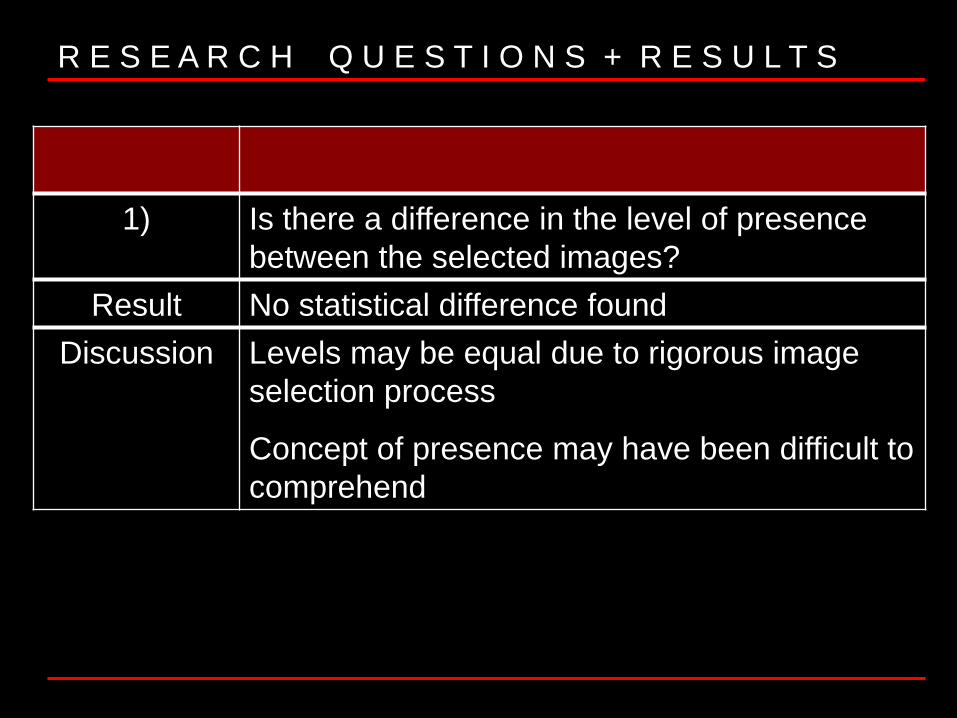
R E S E A R C H Q U E S T I O N S + R E S U L T S
1) Is there a difference in the level of presence
between the selected images?
Result No statistical difference found
Discussion Levels may be equal due to rigorous image
selection process
Concept of presence may have been difficult to
comprehend
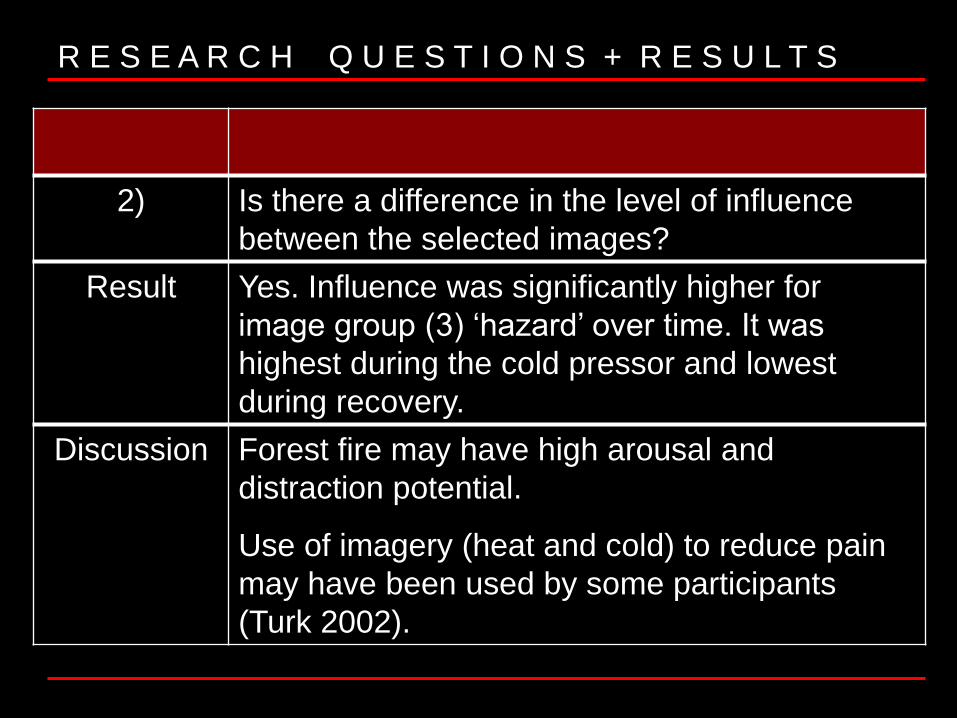
R E S E A R C H Q U E S T I O N S + R E S U L T S
2) Is there a difference in the level of influence
between the selected images?
Result Yes. Influence was significantly higher for
image group (3) „hazard‟ over time. It was
highest during the cold pressor and lowest
during recovery.
Discussion Forest fire may have high arousal and
distraction potential.
Use of imagery (heat and cold) to reduce pain
may have been used by some participants
(Turk 2002).
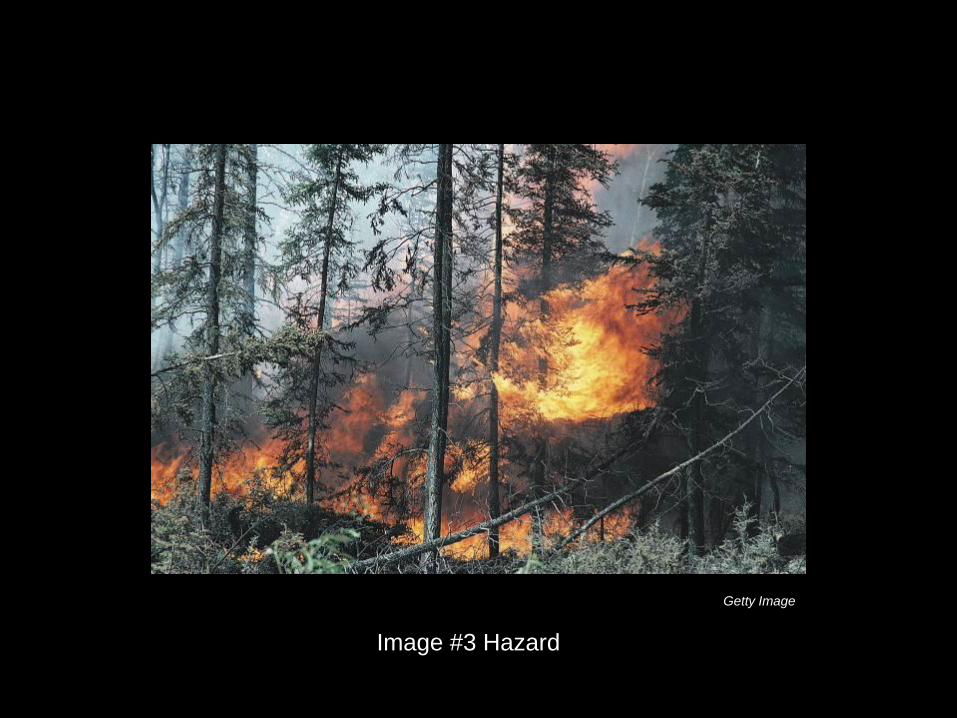
Image #3 Hazard
Getty Image

R E S E A R C H Q U E S T I O N S
3) Is there a correlation between levels of presence
and levels of influence?
Result Yes. A moderate to strong correlation (r = .62)
was found between perceived presence and
influence in this study.
Discussion It is not known at this time whether this
correlation is coincidence or not. Additional
studies are needed.
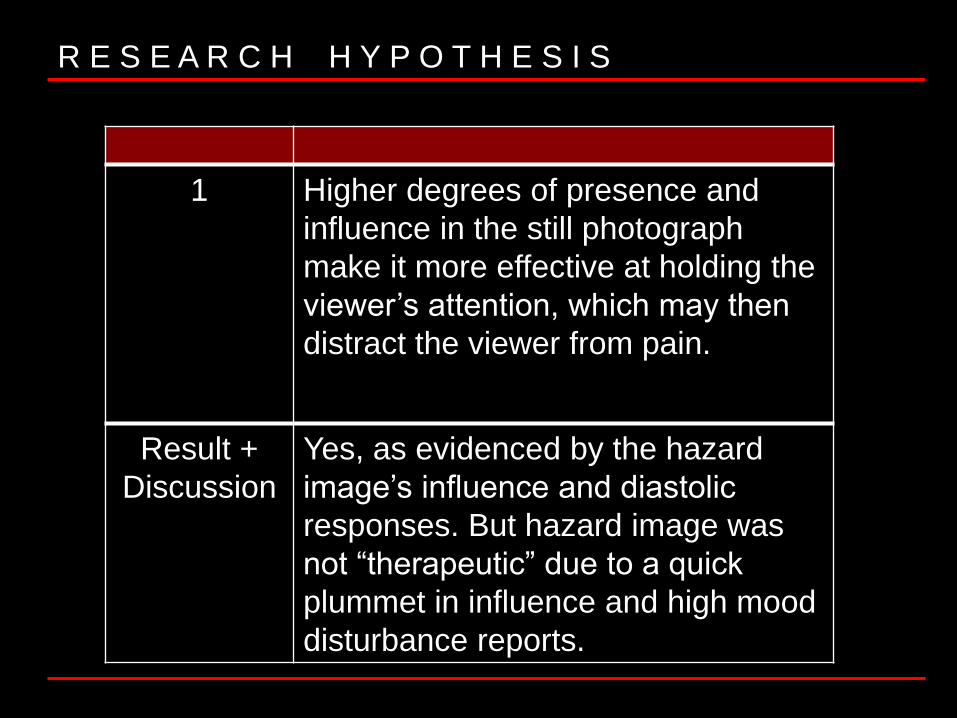
R E S E A R C H H Y P O T H E S I S
1 Higher degrees of presence and
influence in the still photograph
make it more effective at holding the
viewer‟s attention, which may then
distract the viewer from pain.
Result +
Discussion
Yes, as evidenced by the hazard
image‟s influence and diastolic
responses. But hazard image was
not “therapeutic” due to a quick
plummet in influence and high mood
disturbance reports.

External generalization to other
populations not possible with one
study and small sample size.
R E S E A R C H D E S I G N L I M I T A T I O N S
Ellen Vincent
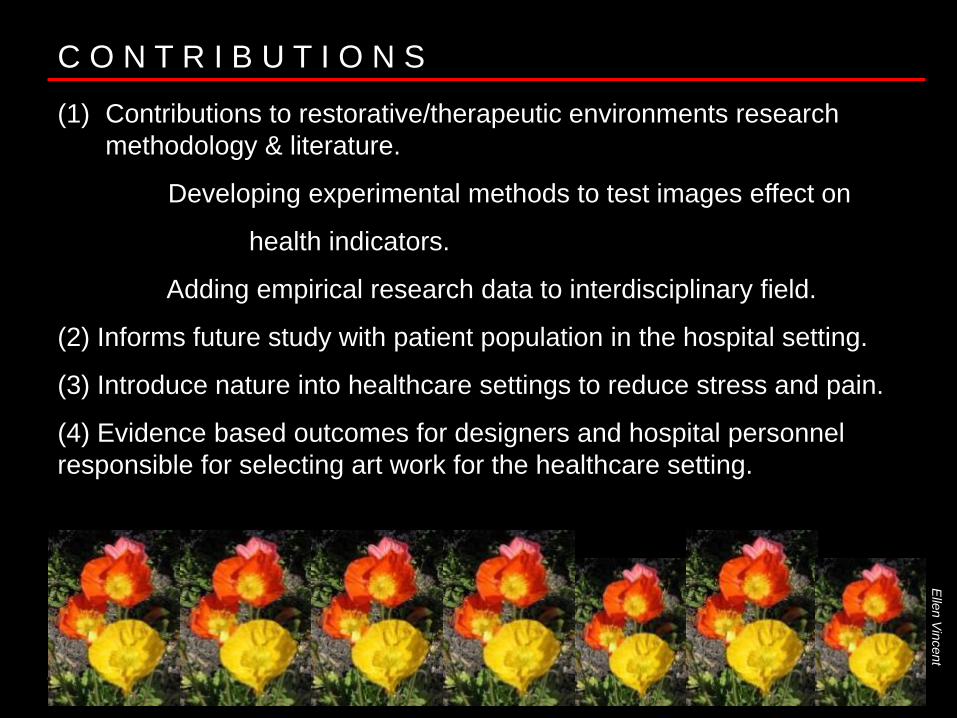
C O N T R I B U T I O N S
(1) Contributions to restorative/therapeutic environments research
methodology & literature.
Developing experimental methods to test images effect on
health indicators.
Adding empirical research data to interdisciplinary field.
(2) Informs future study with patient population in the hospital setting.
(3) Introduce nature into healthcare settings to reduce stress and pain.
(4) Evidence based outcomes for designers and hospital personnel
responsible for selecting art work for the healthcare setting.
Artificial impediment
hazard-London gate
Elle
n V
ince
nt
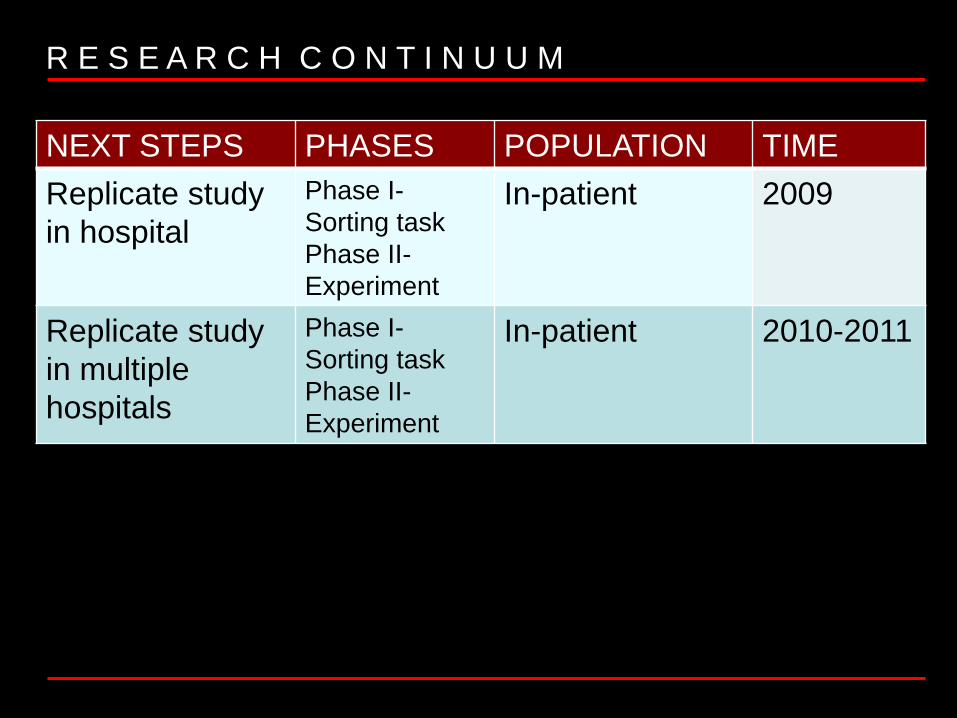
R E S E A R C H C O N T I N U U M
NEXT STEPS PHASES POPULATION TIME
Replicate study
in hospital
Phase I-
Sorting task
Phase II-
Experiment
In-patient 2009
Replicate study
in multiple
hospitals
Phase I-
Sorting task
Phase II-
Experiment
In-patient 2010-2011

T H A N K Y O U
Getty image

C O N T A C T I N F O R MA T I O N
Ellen A. Vincent
Environmental Landscape Specialist
Horticulture Dept. Box 340319
Clemson, SC 29634-0319
USA
864.656.1342
803.243.8888 (cell)