thermal and power performance of vacuum bipv curtain wall
TRANSCRIPT

RESEARCHSUMMARY
Research S
umm
aryC
onstruction Industry Council
Investigation on the thermal and power performance of vacuum BIPV curtain wall technology and its application potential in buildings in Hong Kong
INVESTIGATION ON THE THERMAL AND POWER PERFORMANCE OF VACUUM BIPV CURTAIN WALL TECHNOLOGY AND ITS APPLICATION POTENTIAL IN BUILDINGS IN HONG KONG


The information given in this report is correct and complete to the best of knowledge of the authors and publisher. All recommendations are made without guarantee on the part of the authors or publisher. The authors and publisher disclaim any liability in connection with the use of the information given in this report.
Enquiries Enquiries on this research may be made to the CIC Secretariat at:
CIC Headquarters 38/F, COS Centre, 56 Tsun Yip Street, Kwun Tong, Kowloon
Tel.: (852) 2100 9000
Fax: (852) 2100 9090
Email: [email protected]
Website: www.cic.hk
© 2018 Construction Industry Council.
DISCLAIMER
AuthorProf. YANG HongxingThe Hong Kong Polytechnic University
Published byConstruction Industry Council, Hong Kong SAR
The comparison of building energy between Model 1, Model 2 and Model 3 is summarized in Table 6, which includes energy use of lighting, equipment, district cooling and district heating. Although Model 2 and Model 3 consume slightly more lighting energy due to the reduced visible transmittance of the PV glazing, the great energy saving in cooling and heating leads to the net reduction in the total building energy consumption. The total energy consumption of the Model 2 and 3 declines by 20.77 and 22.37 kWh/m2, accounting for 10.44% and 11.20% of Model 1 respectively. Generated electricity of windows and walls in three directions is also presented in Table 7. The south window produced the most electricity, 1527.13 kWh for Model 2 and 3203.76 kWh for Model 3 in a year, taking up nearly 47.80% the total electricity generated by windows. As for the west window, the electricity generated in a year is close to that of east window. Electricity generated by wall
3.2 Experimental study of the vacuum PV glazingOutdoor experimental test was first conducted on the developed prototype vacuum PV (VPV) glazing with the standard size (1.1m × 1.3m), whose various parameters including the ambient air temperature, incident solar irradiation, surface temperatures of the vacuum PV glazing as well as the I-V curves and the power generation were measured and recorded. The power generation and thermal performances of the prototype were also analysed during the test. To further justify the advantage of the vacuum PV glazing, experimental studies were carried out to compare the thermal performance of scaled-down samples (0.3m × 0.3m) with other advanced windows.
(1) Energy performance of the prototypeIn order to evaluate the energy performance of the vacuum PV glazing, an outdoor field measurement was conducted on the platform of Block Z in The Hong Kong Polytechnic University. The vacuum PV glazing was set up horizontally 0.4m above the floor on stilts so that the external temperatures of both sides of the vacuum PV glazing were approximately equal. Various parameters were measured during this test, including the ambient air temperature, the exterior and transmitted horizontal incident solar irradiation, the outer and inner surface temperatures of the vacuum PV glazing as well as the I-V curves and the power generation from the vacuum PV glazing. All the data was logged at an interval of 1 minute. Power generation and thermal performances of the vacuum PV glazing were analyzed based on the outdoor tests. Figure 7 shows the exterior and transmitted incident solar irradiation. It can be seen that the average solar irradiation transmittance during the period is approximately 0.08. Such low transmittance means that vast majority of solar irradiation is blocked by the vacuum PV glazing. Figure 8 presents the outer and inner surface temperature of the vacuum PV glazing. It can be seen that the outer surface temperature is much higher than the inner surface temperature at daytime. The maximum outer surface temperature is 75.3°C, 30°C higher than the inner surface temperature, which indicates that most of the waste heat is dissipated from the outside surface of the vacuum PV glazing, and the heat transfer to the inside space by convection is mitigated. Thus, compared with the conventional single-glazed PV glazing, the structure of the vacuum PV glazing can help reduce the cooling load and improve the indoor thermal comfort.
Then the vacuum PV glazing was mounted on the front side of an experimental test chamber as shown in Figure 9. Clear glass was also adopted in this study for comparison. Figure 10 presents the instantaneous power output of the vacuum PV glazing in 2 sunny days. It can be seen that the power generation from the vacuum PV glazing is consistent with incident solar radiation. A comparative study in terms of internal air temperature of the chamber between the vacuum PV glazing and the clear glass was conducted in a day of June.
As shown in Figure 11, the internal air temperature in the chamber with the vacuum PV glazing is much lower than that with a clear glass. The measured average and maximum internal air temperature for the vacuum PV glazing is 39.6°C and 40.3°C, respectively, while the corresponding average and maximum internal air temperature of the clear glass are 43.6°C and 44.7°C. The maximum internal air temperature difference between the vacuum PV glazing and the clear glass is 4.4°C, occurring in the morning. There are three temperature peaks of internal air temperature. Since the ambient temperature was relatively stable, the main heat gain of the internal air temperature was from incident solar irradiation. The internal air temperature for vacuum PV glazing is much more stable compared with that for the clear glass. The reason is that the vacuum PV glazing has better heat insulation performance so that the internal air temperature is not affected by the external environment significantly. It can also be seen in this figure that the internal air temperature of the chamber drops continuously at 15:00, which shows that the incident solar irradiation on the façade decreases so that the heat gains of the internal air from the sun also drops.
(2) Comparison with other advanced windows
To further justify the advantage of the vacuum PV glazing, experimental studies were carried out to compare it with other advanced windows. Samples of different types of glazing were mounted on the top of two hotboxes (i.e. test rigs) with the uniform dimension of 300 mm (L) × 300 mm (W) × 450mm (H) to implement both indoor and outdoor tests. Firstly, a co-heating test methodology was adopted for the thermal analysis of the vacuum PV glazing. The test rig was filled with the ice-water mixture to ensure the temperature difference between the inside and outside glazing surfaces larger than 5°C. Heat flux and
Figure 12 shows the internal and external temperatures of the vacuum PV glazing sample. The presented data were selected after the hotbox achieved the steady-state condition, when the temperature difference was around 8°C. Heat flux though the glazing sample and the U-value were then determined as illustrated in Figure 13. The average heat flux from the vacuum glazing was measured to be 15.4 W/m2. And the average U-value was calculated as 1.5 W/m2 × K which is much lower than a regular double pane window with the U-value of 2.5W/m2 × K. Considering the edge heat transfer which would strongly affect the heat flux measurement when the sample is small, it can be expected that the centre U-valve of the vacuum PV glazing should be lower than 1.5 W/m2 × K for a larger scale application (e.g. 1.1m × 1.3m).
(3) Cost effective analysis based on simulation
To address the economic benefits of the developed product, the simple payback period of the vacuum PV glazing is calculated with reference to available PV glazing on the market in both Hong Kong and Beijing’s scenarios.
Based on an average electricity price of 1.25 HKD/kWh from HK Electric, the simple payback period (See Figure 26) when applying the product to the west and east façade is calculated to be 7.5 and 8.0 years compared to the single-pane PV glazing. The payback periods are increased to 8.6 and 8.8 years when compared with double-pane PV glazing as shown in Figure 27. However, when applied to the south façade, the extra initial cost of the product cannot be recovered within 10 years.
The solar simulator in the laboratory can provide relatively steady horizontal incident solar irradiation, so that test rigs were located at the same spot to ensure each window sample exposed to the same radiation level. As shown in Figure 14, SHGCs of the vacuum PV glazing and double-pane PV glazing are much smaller than those of the vacuum glazing and double clear glazing, because the coupled PV module can absorb most of the solar irradiation. The vacuum PV glazing has the lowest SHGC of 0.10 which can act as the excellent thermal insulation.
The outdoor test lasted four days from September 26th to September 30th. As shown in Figure 15, September 26th, 27th and 30th were cloudy days and September 28th could be considered as a sunny day. It can be found that the vacuum PV glazing blocks most solar irradiation compared with the double-pane glazing. Figure 16 presents the temperature profile of the vacuum PV glazing and double-pane glazing in the sunny day. The internal surface temperature of both glazing was much higher than the ambient temperature when the outside incident solar radiation is strong. The internal glazing surface and air temperatures of the test rig with the vacuum PV glazing are lower than those of the test rig with the double-pane glazing. The difference between the internal air temperatures of test rigs is much smaller than that of internal glazing surface temperatures. Therefore, the application of vacuum PV glazing can achieve better indoor environment by reducing the solar heat gain.
3.3 Simulation study of the vacuum PV glazing(1) Simulation of a generic building model
Although a series of field tests have been conducted in the outdoor test bed to study the power and thermal performances of the vacuum BIPV glazing, the experimental scenarios are impossible to represent all the situations and variables. Thus, the numerical study was conducted to comprehensively investigate and compare the energy performance of the vacuum PV glazing and other commonly used energy-efficient glazing. As detailed in the research methodology, a comprehensive simulation model based on EnergyPlus and WINDOW has been developed to simulate the overall energy performance of different windows taking into account of their thermal and power output performance. This model is used to simulate the overall energy performance of the vacuum BIPV curtain wall in comparison with other commonly used windows. The key properties of different types of glazing are shown in Table 4 and the electrical specifications of the PV glazing under standard test conditions are referenced to Table 2.
In order to simulate the annual thermal performance and power performance of these types of glazing in Hong Kong for comparison purpose, a typical office room model has been created for simulation, as shown in Figure 17. The dimension of the office model was 2.5m × 2.3m × 2.5m (L × W × H). This room has only one external wall with three identical windows exposed to the outdoor environment. Simulations were conducted for different orientations, i.e. south (S), east (E), west (W) and north (N). A heat transfer model and PV performance model in EnergyPlus are adopted to investigate
the thermal and power performance of different glazing. The heat transfer model is used to calculate the cooling loads of the office room. The cooling loads are then converted to electricity use of air-conditioning system with a presumed coefficient of performance (COP) of 2.78. The equivalent one-diode model is selected to simulate the annual electricity generation from PV elements. The typical meteorological year (TMY) in Hong Kong is selected a reasonable representation of local climates.
The annual cooling electricity use of different types of glazing in different orientations in Hong Kong are shown in Figure 18. It can be observed that the room using vacuum PV glazing consumes the least cooling electricity for all orientations. The south facing room with vacuum PV glazing consumes about 705.56 kWh per year, which was approximately 14.2%, 9.8%, 8.4%, 7.1% and 4.1% less than the corresponding room with single-pane clear glazing, double-pane clear glazing, vacuum glazing, single-pane PV glazing and double-pane PV glazing, respectively. This is because the vacuum PV glazing have the lowest U-value and SHGC among all types of glazing, as shown in Table 4.3. A lower U-value indicates a higher level of heat insulation performance of the glazing, and a lower SHGC means less solar radiation will pass through the windows. Therefore, the vacuum PV glazing performs the best in the area with big temperature difference between indoor and outdoor environment. In addition, the most cooling electricity use of the office room occurs at the west orientation, followed by east, south and north. Therefore, east and west facing windows should have better solar heat insulation performance, to reduce heat gains from outside environment.
In addition to reduce the cooling load of the office room, the PV glazing can also generate electricity in situ. The annual electricity generation of the three types of PV glazing are shown in Figure 19. It can be seen that the annual electricity generation of the three types of PV glazing is similar to each other. The electricity generation from the vacuum PV glazing is a little less than the single-pane PV glazing due to increased solar cell temperature. However, since the temperature coefficient of the thin-film a-Si solar cells is small, the PV conversion efficiency is not reduced significantly. The annual electricity generation from a-Si PV glazing with 12.0% transmittance is around 113.81 kWh per year. Among all orientations, it is better to install PV glazing on the south facade in order to maximize the electricity output in Hong Kong. And it is not recommended to apply PV glazing on north façade due to limited solar radiation available.
Based on the results above, the vacuum PV glazing not only has the best thermal performance among all types of widely used glazing, but also produces a considerable amount of electricity per year. It is recommended to install vacuum PV glazing on south facade to perform the best overall energy performance.
(2) Simulation of the whole building
Apart from modelling studies conducted under the hot and humid climate of Hong Kong, the annual energy performance of different types of glazing in a cold region (i.e. Beijing) was also simulated for comparison. Simulation results are shown in Figure 20 and Figure 21. It can be observed that the room using the vacuum PV glazing achieves the lowest cooling consumption in both climates. In Beijing, the consumed cooling energy with the vacuum PV glazing is much smaller and is 30.2%, 20.8%, 17.0%, 13.8%, 4.4% less than that of the room with other types of glazing. It can be concluded that the energy saving potential of the vacuum PV glazing is much larger in a cold climate while the electricity generation is much higher during the summer time of Beijing due to the smaller solar incidence angle.
The developed simulation model was further applied to a 20-floor prototype office building. Typical floors of the building are divided into 5 conditioned zones, with a total floor area of 540 m2 (as shown in Figure 22). The reference case – Model 1 keeps all windows as the commonly used double-pane clear glazing, while the design cases include Model 2 and Model 3. Model 2 keeps the north-facing window as the conventional double-pane glazing while changes windows orientated to the other three directions to the developed vacuum PV glazing. The opaque part of all building facades is assumed to be covered with traditional crystalline BIPV with a power conversion efficiency of 15% to maximize the power generation potential of the building envelope. Model 3 shares similar settings with Model 2, except that the window transparency is tuned to 20% with a crystalline silicon (c-Si) as shown in Figure 23. Table 5 shows detailed settings of window properties for the three models respectively. The U-value and SHGC of a-Si vacuum PV glazing are obtained from previous experiments and those of double-pane clear glazing are calculated by the simulation software WINDOW. Thermal and power generation properties of c-Si vacuum PV glazing are obtained from existing literatures.
The simulation results of the total heat gain and loss through all windows are presented in Figure 24 and Figure 25. The heat gain and loss both decrease sharply when traditional double-pane clear glazing is replaced by the PV vacuum glazing. The obvious differences between these three models can be identified from the figures. Compared with the performance of Model 1, the heat gain through windows of Model 2 and Model 3 drops up to 77.89% and 77.97% (south-facing windows), while the heat loss of the two models declines up to 79.28% and 79.32% (south-facing windows), respectively.
On the other side, based on the peak office hour electricity price of 1.4 CNY/kWh for cooling and 0.25 CNY/kWh for heating from the Beijing authority, the simple payback period (See Figure 28) when applying the product to the west, east, and south façade is calculated to be 3.8, 4.6 and 5.3 years compared to the single-pane PV glazing. The payback periods are increased to 4.5, 5.4 and 6.5 years when compared with double-pane PV glazing as shown in Figure 29.
As a result, the product can be considered as a cost-effective application in building facades when considering its tremendous saving of air-conditioning energy and corresponding annual expenses. In addition, the property developer could also benefit from a potential increment in renting rates and popularity, if the building gets certified under a green building scheme by claiming credits in CO2 reduction and renewable application assessment criteria. All the abovementioned potential benefits with the application of the vacuum PV glazing would attract more attention from the construction industry.
3.4 Brief technical guideline for the vacuum PV glazingDesigning the vacuum PV glazing (i.e. vacuum BIPV curtain wall) system is a more complex process than a standard added-on PV system. The architectural context, structural requirements, economic considerations and building regulation requirements should all be considered, so that this brief guidance mainly focuses on the below aspects: design strategy, environmental variables, multifunctionality, installation situation, electrical components, and economic aspects (Polysolar Limited, 2015).
(1) Design strategy
Architects, property developers and building users become more inclined to consider renewable and energy efficient applications to meet building and planning regulations due to rising energy bills and awareness of environmental sustainability. The combination of PV and vacuum glazing is an innovative and promising solution to meet these requirements in the new building developments or refurbishment projects. As proved in the above sections of this report, the developed product offers the added advantage of providing a return of investment from the building envelope. Architectural and structural factors, as well as economic considerations should be taken into account at an early stage in any building projects to integrate renewable systems through a more satisfactory approach.
(2) Environmental variables
When designing a BIPV system, a compromise must be reached between the requirements of energy yield optimisation and those of the architectural environment. Therefore, the orientation, lighting performance, shading and temperature are the four mainly concerned issues in BIPV design. According to simulation and experimental results presented in the above sections, the optimal orientation of the installed PV glazing should be south for maximizing the annual power generation, while cooling load reduction is more conspicuous when the product is applied on the west and east facades. Therefore, it is preferable to install the product on all three facades for an optimal overall building energy-saving performance. The visible light transmittance is only 12% in the developed prototype, which might cause slightly more lighting power consumption compared to traditional double-pane clear glazing. However, the transmittance can be easily adjusted to higher than 20% in the manufacture process depending on the effective area of PV materials. There will always be a trade-off between power generation and permeable light, whereas this research has proved that the combined power generation and cooling load reduction can be more than the increased lighting energy use. Power generation performance of the a-Si PV is less sensitive to shadings, so that the prototype is subject to less influence from peripheral shadings. However, if we change the PV material to c-Si for higher conversion efficiency, a shading calculation should be conducted before allocating the BIPV glazing. Lastly, the conversion efficiency of a-Si glazing is also less sensitive to the increase of the panel temperature. The temperature coefficient must be considered if changing the PV material to c-Si.
The vacuum PV glazing was made by sandwiching a layer of PVB between an external PV laminated glass with a visible light transmittance of 12% and an internal vacuum glass. A low-e coating was also adopted to enhance its thermal performance. The structure of the vacuum PV glazing is shown in Figure 5. The dimension of the vacuum PV glazing is 1300 mm (width) × 1100 mm (height) × 20.87 mm (thickness), thinner than commonly used PV double glazed insulating glass units. Figure 6 presents the pictures of the sample of vacuum PV glazing.
This section presents the main findings and outcomes of the research project and indicates their potential impacts on the local energy use and construction industry. Achievements of the specified research objectives are illustrated, and limitations of the project are also mentioned for the reference of future studies.
3.1 Design and production of the prototype productInitially, we proposed a prototype design as specified by Figure 2, where the vacuum layer was directly coupled with the laminated PV panel. However, during initial manufacture trials, the air pressure difference between internal and external spaces of the vacuum glass samples produced by the laminating machine caused the breakage of the vacuum glass samples. Then, we followed an alternative approach using pre-pressure furnace, whereas the molten state of the polyvinyl butyral (PVB) could not meet the expected requirements and the bubbles greatly impacted the appearance and performance of PV module. Finally, we proposed the current product design based on the experience acquired from previous failures (See Figure 5).
The electrical specifications of the vacuum PV glazing under standard test conditions (STC: air mass 1.5, solar irradiation 1000 W/m2 and cell temperature 25°C) are shown in Table 2. Table 3 presents the given thermal and optical properties of the PV laminated glass and vacuum glass, respectively.
(3) Multi-functionality
Due to their mechanical structures, the PV vacuum glazing can perform the functions of the building envelope in addition to generating emission-free energy, and can thus substitute for conventional construction windows or curtain walls. Apart from power generation and architectural function, the product can provide solar shading with its low SHGC value. It can also act as thermal and sound insulation due to its low U-value and acoustic resistance caused by the vacuum chamber between glazing layers. If applied with special coatings/films on top of PV glazing, it can also provide weather protection.
(4) Mounting system and installation
Based on specific requirements of each project in each region, safety, loading capacity and PV installation specifications can have a decisive impact on the method of fixing/mounting the vacuum. We have in this guide attempted to provide a range of options, highlighting what is possible in current design. The product can be installed with a linear mounting system as mullion-transom facades or structural sealant glazing. It can also be mounted with point-fixing systems including clamp fixings and undercut anchor fixings or mounted into standard curtain walling, rain screen cladding and window systems.
(5) Electrical system
In the curtain wall system, several PV glazing with standard size are usually connected together in a string to form the power generator. The generated direct current is usually fed to an inverter where the direct current is converted to alternating current. If on-site storage is not available, which is the common case in urban areas, the electrical power is registered via an electricity meter and connected to the public supply grid, which will require special permissions from the power grid companies (e.g. CLP in Hong Kong). Therefore, the application of the product will require a full set of electrical systems including cables and connections for parallel or series arrays, direct current load-break switches, inverters and generation meters.
(6) Economic considerations
The economic benefits of the product mainly lie in the following aspects: the substitute for original construction component, CO2 emission reduction and corresponding electricity fee waving, compliance with relevant building regulations (i.e. BEAM Plus in Hong Kong) and application of the feed-in-tariff policy (remuneration for electricity generation from PV).
temperature measurements were conducted through the centre of the vacuum PV sample to calculate the U-value. Secondly, the solar heat gains coefficient (SHGC) of the vacuum PV glazing sample was obtained and compared with three other advanced glazing types in an indoor solar irradiation test. Lastly, an outdoor test was conducted on the platform of Block Z in The Hong Kong Polytechnic University to evaluate the overall thermal performance of vacuum PV glazing. A conventional double clear pane glazing was used as a baseline in the outdoor test.
surfaces shows a similar trend in the three directions. Summing up electricity generation in all floors, the integrated PV modules in Model 2 and 3 can provide 285074.72 kWh/year and 355226.3 kWh/year, which accounts for 13.27% and 16.54% of the total building energy consumption of Model 1. Therefore, given the energy use reduction due to less external heat gain, using the vacuum BIPV glazing can save 27.74% (Model 3) electricity compared to a reference building.

Climate change was one of the biggest challenges facing mankind. The HKSAR Government was embarking upon a series of measures to reduce greenhouse gas (GHG) emissions and proposed a target of reducing 50% to 60% Carbon Intensity by 2020 on the 2005 basis. In 2015, the total GHG emissions in HK was about 41.6 million tonnes of carbon dioxide equivalent and about 66% were released from electricity generation so promoting wider use of renewable energy became essential to meet the reduction target.
Solar energy is the most convenient source of renewable energy and it can be easily collected by a photovoltaic (PV) system. Using PV systems in building envelope is the global trend to enhance the urban sustainability. Typical examples in Hong Kong include CYC building at The University of Hong Kong and buildings in the Science Park. With the vision of developing low or zero carbon high-rise buildings, the CIC initiated the research by engaging a research team to investigate building-integrated photovoltaic curtain wall and develop vacuum BIPV curtain wall panel technology.
The research work presented in this report was funded by the CIC Research Fund, which was set up in September 2012 to provide financial support to research institutes/construction industry organizations to undertake research projects which can benefit the Hong Kong construction industry through practical application of the research outcomes. CIC believes that research and innovation are of great importance to the sustainable development of the Hong Kong construction industry. Hence, CIC is committed to working closely with industry stakeholders to drive innovation and initiate practical research projects.
The research work described in the report was carried out by a research team led by Prof. YANG Hongxing, who had successfully built a prototype based on the research study, from The Hong Kong Polytechnic University. The project cannot succeed without the dedicated effort of the research team. I would like to give thanks to all who took part in this valuable work.
Ir Albert CHENGExecutive Director of Construction Industry Council
FOREWORD
The comparison of building energy between Model 1, Model 2 and Model 3 is summarized in Table 6, which includes energy use of lighting, equipment, district cooling and district heating. Although Model 2 and Model 3 consume slightly more lighting energy due to the reduced visible transmittance of the PV glazing, the great energy saving in cooling and heating leads to the net reduction in the total building energy consumption. The total energy consumption of the Model 2 and 3 declines by 20.77 and 22.37 kWh/m2, accounting for 10.44% and 11.20% of Model 1 respectively. Generated electricity of windows and walls in three directions is also presented in Table 7. The south window produced the most electricity, 1527.13 kWh for Model 2 and 3203.76 kWh for Model 3 in a year, taking up nearly 47.80% the total electricity generated by windows. As for the west window, the electricity generated in a year is close to that of east window. Electricity generated by wall
3.2 Experimental study of the vacuum PV glazingOutdoor experimental test was first conducted on the developed prototype vacuum PV (VPV) glazing with the standard size (1.1m × 1.3m), whose various parameters including the ambient air temperature, incident solar irradiation, surface temperatures of the vacuum PV glazing as well as the I-V curves and the power generation were measured and recorded. The power generation and thermal performances of the prototype were also analysed during the test. To further justify the advantage of the vacuum PV glazing, experimental studies were carried out to compare the thermal performance of scaled-down samples (0.3m × 0.3m) with other advanced windows.
(1) Energy performance of the prototypeIn order to evaluate the energy performance of the vacuum PV glazing, an outdoor field measurement was conducted on the platform of Block Z in The Hong Kong Polytechnic University. The vacuum PV glazing was set up horizontally 0.4m above the floor on stilts so that the external temperatures of both sides of the vacuum PV glazing were approximately equal. Various parameters were measured during this test, including the ambient air temperature, the exterior and transmitted horizontal incident solar irradiation, the outer and inner surface temperatures of the vacuum PV glazing as well as the I-V curves and the power generation from the vacuum PV glazing. All the data was logged at an interval of 1 minute. Power generation and thermal performances of the vacuum PV glazing were analyzed based on the outdoor tests. Figure 7 shows the exterior and transmitted incident solar irradiation. It can be seen that the average solar irradiation transmittance during the period is approximately 0.08. Such low transmittance means that vast majority of solar irradiation is blocked by the vacuum PV glazing. Figure 8 presents the outer and inner surface temperature of the vacuum PV glazing. It can be seen that the outer surface temperature is much higher than the inner surface temperature at daytime. The maximum outer surface temperature is 75.3°C, 30°C higher than the inner surface temperature, which indicates that most of the waste heat is dissipated from the outside surface of the vacuum PV glazing, and the heat transfer to the inside space by convection is mitigated. Thus, compared with the conventional single-glazed PV glazing, the structure of the vacuum PV glazing can help reduce the cooling load and improve the indoor thermal comfort.
Then the vacuum PV glazing was mounted on the front side of an experimental test chamber as shown in Figure 9. Clear glass was also adopted in this study for comparison. Figure 10 presents the instantaneous power output of the vacuum PV glazing in 2 sunny days. It can be seen that the power generation from the vacuum PV glazing is consistent with incident solar radiation. A comparative study in terms of internal air temperature of the chamber between the vacuum PV glazing and the clear glass was conducted in a day of June.
As shown in Figure 11, the internal air temperature in the chamber with the vacuum PV glazing is much lower than that with a clear glass. The measured average and maximum internal air temperature for the vacuum PV glazing is 39.6°C and 40.3°C, respectively, while the corresponding average and maximum internal air temperature of the clear glass are 43.6°C and 44.7°C. The maximum internal air temperature difference between the vacuum PV glazing and the clear glass is 4.4°C, occurring in the morning. There are three temperature peaks of internal air temperature. Since the ambient temperature was relatively stable, the main heat gain of the internal air temperature was from incident solar irradiation. The internal air temperature for vacuum PV glazing is much more stable compared with that for the clear glass. The reason is that the vacuum PV glazing has better heat insulation performance so that the internal air temperature is not affected by the external environment significantly. It can also be seen in this figure that the internal air temperature of the chamber drops continuously at 15:00, which shows that the incident solar irradiation on the façade decreases so that the heat gains of the internal air from the sun also drops.
(2) Comparison with other advanced windows
To further justify the advantage of the vacuum PV glazing, experimental studies were carried out to compare it with other advanced windows. Samples of different types of glazing were mounted on the top of two hotboxes (i.e. test rigs) with the uniform dimension of 300 mm (L) × 300 mm (W) × 450mm (H) to implement both indoor and outdoor tests. Firstly, a co-heating test methodology was adopted for the thermal analysis of the vacuum PV glazing. The test rig was filled with the ice-water mixture to ensure the temperature difference between the inside and outside glazing surfaces larger than 5°C. Heat flux and
Figure 12 shows the internal and external temperatures of the vacuum PV glazing sample. The presented data were selected after the hotbox achieved the steady-state condition, when the temperature difference was around 8°C. Heat flux though the glazing sample and the U-value were then determined as illustrated in Figure 13. The average heat flux from the vacuum glazing was measured to be 15.4 W/m2. And the average U-value was calculated as 1.5 W/m2 × K which is much lower than a regular double pane window with the U-value of 2.5W/m2 × K. Considering the edge heat transfer which would strongly affect the heat flux measurement when the sample is small, it can be expected that the centre U-valve of the vacuum PV glazing should be lower than 1.5 W/m2 × K for a larger scale application (e.g. 1.1m × 1.3m).
(3) Cost effective analysis based on simulation
To address the economic benefits of the developed product, the simple payback period of the vacuum PV glazing is calculated with reference to available PV glazing on the market in both Hong Kong and Beijing’s scenarios.
Based on an average electricity price of 1.25 HKD/kWh from HK Electric, the simple payback period (See Figure 26) when applying the product to the west and east façade is calculated to be 7.5 and 8.0 years compared to the single-pane PV glazing. The payback periods are increased to 8.6 and 8.8 years when compared with double-pane PV glazing as shown in Figure 27. However, when applied to the south façade, the extra initial cost of the product cannot be recovered within 10 years.
The solar simulator in the laboratory can provide relatively steady horizontal incident solar irradiation, so that test rigs were located at the same spot to ensure each window sample exposed to the same radiation level. As shown in Figure 14, SHGCs of the vacuum PV glazing and double-pane PV glazing are much smaller than those of the vacuum glazing and double clear glazing, because the coupled PV module can absorb most of the solar irradiation. The vacuum PV glazing has the lowest SHGC of 0.10 which can act as the excellent thermal insulation.
The outdoor test lasted four days from September 26th to September 30th. As shown in Figure 15, September 26th, 27th and 30th were cloudy days and September 28th could be considered as a sunny day. It can be found that the vacuum PV glazing blocks most solar irradiation compared with the double-pane glazing. Figure 16 presents the temperature profile of the vacuum PV glazing and double-pane glazing in the sunny day. The internal surface temperature of both glazing was much higher than the ambient temperature when the outside incident solar radiation is strong. The internal glazing surface and air temperatures of the test rig with the vacuum PV glazing are lower than those of the test rig with the double-pane glazing. The difference between the internal air temperatures of test rigs is much smaller than that of internal glazing surface temperatures. Therefore, the application of vacuum PV glazing can achieve better indoor environment by reducing the solar heat gain.
3.3 Simulation study of the vacuum PV glazing(1) Simulation of a generic building model
Although a series of field tests have been conducted in the outdoor test bed to study the power and thermal performances of the vacuum BIPV glazing, the experimental scenarios are impossible to represent all the situations and variables. Thus, the numerical study was conducted to comprehensively investigate and compare the energy performance of the vacuum PV glazing and other commonly used energy-efficient glazing. As detailed in the research methodology, a comprehensive simulation model based on EnergyPlus and WINDOW has been developed to simulate the overall energy performance of different windows taking into account of their thermal and power output performance. This model is used to simulate the overall energy performance of the vacuum BIPV curtain wall in comparison with other commonly used windows. The key properties of different types of glazing are shown in Table 4 and the electrical specifications of the PV glazing under standard test conditions are referenced to Table 2.
In order to simulate the annual thermal performance and power performance of these types of glazing in Hong Kong for comparison purpose, a typical office room model has been created for simulation, as shown in Figure 17. The dimension of the office model was 2.5m × 2.3m × 2.5m (L × W × H). This room has only one external wall with three identical windows exposed to the outdoor environment. Simulations were conducted for different orientations, i.e. south (S), east (E), west (W) and north (N). A heat transfer model and PV performance model in EnergyPlus are adopted to investigate
the thermal and power performance of different glazing. The heat transfer model is used to calculate the cooling loads of the office room. The cooling loads are then converted to electricity use of air-conditioning system with a presumed coefficient of performance (COP) of 2.78. The equivalent one-diode model is selected to simulate the annual electricity generation from PV elements. The typical meteorological year (TMY) in Hong Kong is selected a reasonable representation of local climates.
The annual cooling electricity use of different types of glazing in different orientations in Hong Kong are shown in Figure 18. It can be observed that the room using vacuum PV glazing consumes the least cooling electricity for all orientations. The south facing room with vacuum PV glazing consumes about 705.56 kWh per year, which was approximately 14.2%, 9.8%, 8.4%, 7.1% and 4.1% less than the corresponding room with single-pane clear glazing, double-pane clear glazing, vacuum glazing, single-pane PV glazing and double-pane PV glazing, respectively. This is because the vacuum PV glazing have the lowest U-value and SHGC among all types of glazing, as shown in Table 4.3. A lower U-value indicates a higher level of heat insulation performance of the glazing, and a lower SHGC means less solar radiation will pass through the windows. Therefore, the vacuum PV glazing performs the best in the area with big temperature difference between indoor and outdoor environment. In addition, the most cooling electricity use of the office room occurs at the west orientation, followed by east, south and north. Therefore, east and west facing windows should have better solar heat insulation performance, to reduce heat gains from outside environment.
In addition to reduce the cooling load of the office room, the PV glazing can also generate electricity in situ. The annual electricity generation of the three types of PV glazing are shown in Figure 19. It can be seen that the annual electricity generation of the three types of PV glazing is similar to each other. The electricity generation from the vacuum PV glazing is a little less than the single-pane PV glazing due to increased solar cell temperature. However, since the temperature coefficient of the thin-film a-Si solar cells is small, the PV conversion efficiency is not reduced significantly. The annual electricity generation from a-Si PV glazing with 12.0% transmittance is around 113.81 kWh per year. Among all orientations, it is better to install PV glazing on the south facade in order to maximize the electricity output in Hong Kong. And it is not recommended to apply PV glazing on north façade due to limited solar radiation available.
Based on the results above, the vacuum PV glazing not only has the best thermal performance among all types of widely used glazing, but also produces a considerable amount of electricity per year. It is recommended to install vacuum PV glazing on south facade to perform the best overall energy performance.
(2) Simulation of the whole building
Apart from modelling studies conducted under the hot and humid climate of Hong Kong, the annual energy performance of different types of glazing in a cold region (i.e. Beijing) was also simulated for comparison. Simulation results are shown in Figure 20 and Figure 21. It can be observed that the room using the vacuum PV glazing achieves the lowest cooling consumption in both climates. In Beijing, the consumed cooling energy with the vacuum PV glazing is much smaller and is 30.2%, 20.8%, 17.0%, 13.8%, 4.4% less than that of the room with other types of glazing. It can be concluded that the energy saving potential of the vacuum PV glazing is much larger in a cold climate while the electricity generation is much higher during the summer time of Beijing due to the smaller solar incidence angle.
The developed simulation model was further applied to a 20-floor prototype office building. Typical floors of the building are divided into 5 conditioned zones, with a total floor area of 540 m2 (as shown in Figure 22). The reference case – Model 1 keeps all windows as the commonly used double-pane clear glazing, while the design cases include Model 2 and Model 3. Model 2 keeps the north-facing window as the conventional double-pane glazing while changes windows orientated to the other three directions to the developed vacuum PV glazing. The opaque part of all building facades is assumed to be covered with traditional crystalline BIPV with a power conversion efficiency of 15% to maximize the power generation potential of the building envelope. Model 3 shares similar settings with Model 2, except that the window transparency is tuned to 20% with a crystalline silicon (c-Si) as shown in Figure 23. Table 5 shows detailed settings of window properties for the three models respectively. The U-value and SHGC of a-Si vacuum PV glazing are obtained from previous experiments and those of double-pane clear glazing are calculated by the simulation software WINDOW. Thermal and power generation properties of c-Si vacuum PV glazing are obtained from existing literatures.
The simulation results of the total heat gain and loss through all windows are presented in Figure 24 and Figure 25. The heat gain and loss both decrease sharply when traditional double-pane clear glazing is replaced by the PV vacuum glazing. The obvious differences between these three models can be identified from the figures. Compared with the performance of Model 1, the heat gain through windows of Model 2 and Model 3 drops up to 77.89% and 77.97% (south-facing windows), while the heat loss of the two models declines up to 79.28% and 79.32% (south-facing windows), respectively.
On the other side, based on the peak office hour electricity price of 1.4 CNY/kWh for cooling and 0.25 CNY/kWh for heating from the Beijing authority, the simple payback period (See Figure 28) when applying the product to the west, east, and south façade is calculated to be 3.8, 4.6 and 5.3 years compared to the single-pane PV glazing. The payback periods are increased to 4.5, 5.4 and 6.5 years when compared with double-pane PV glazing as shown in Figure 29.
As a result, the product can be considered as a cost-effective application in building facades when considering its tremendous saving of air-conditioning energy and corresponding annual expenses. In addition, the property developer could also benefit from a potential increment in renting rates and popularity, if the building gets certified under a green building scheme by claiming credits in CO2 reduction and renewable application assessment criteria. All the abovementioned potential benefits with the application of the vacuum PV glazing would attract more attention from the construction industry.
3.4 Brief technical guideline for the vacuum PV glazingDesigning the vacuum PV glazing (i.e. vacuum BIPV curtain wall) system is a more complex process than a standard added-on PV system. The architectural context, structural requirements, economic considerations and building regulation requirements should all be considered, so that this brief guidance mainly focuses on the below aspects: design strategy, environmental variables, multifunctionality, installation situation, electrical components, and economic aspects (Polysolar Limited, 2015).
(1) Design strategy
Architects, property developers and building users become more inclined to consider renewable and energy efficient applications to meet building and planning regulations due to rising energy bills and awareness of environmental sustainability. The combination of PV and vacuum glazing is an innovative and promising solution to meet these requirements in the new building developments or refurbishment projects. As proved in the above sections of this report, the developed product offers the added advantage of providing a return of investment from the building envelope. Architectural and structural factors, as well as economic considerations should be taken into account at an early stage in any building projects to integrate renewable systems through a more satisfactory approach.
(2) Environmental variables
When designing a BIPV system, a compromise must be reached between the requirements of energy yield optimisation and those of the architectural environment. Therefore, the orientation, lighting performance, shading and temperature are the four mainly concerned issues in BIPV design. According to simulation and experimental results presented in the above sections, the optimal orientation of the installed PV glazing should be south for maximizing the annual power generation, while cooling load reduction is more conspicuous when the product is applied on the west and east facades. Therefore, it is preferable to install the product on all three facades for an optimal overall building energy-saving performance. The visible light transmittance is only 12% in the developed prototype, which might cause slightly more lighting power consumption compared to traditional double-pane clear glazing. However, the transmittance can be easily adjusted to higher than 20% in the manufacture process depending on the effective area of PV materials. There will always be a trade-off between power generation and permeable light, whereas this research has proved that the combined power generation and cooling load reduction can be more than the increased lighting energy use. Power generation performance of the a-Si PV is less sensitive to shadings, so that the prototype is subject to less influence from peripheral shadings. However, if we change the PV material to c-Si for higher conversion efficiency, a shading calculation should be conducted before allocating the BIPV glazing. Lastly, the conversion efficiency of a-Si glazing is also less sensitive to the increase of the panel temperature. The temperature coefficient must be considered if changing the PV material to c-Si.
The vacuum PV glazing was made by sandwiching a layer of PVB between an external PV laminated glass with a visible light transmittance of 12% and an internal vacuum glass. A low-e coating was also adopted to enhance its thermal performance. The structure of the vacuum PV glazing is shown in Figure 5. The dimension of the vacuum PV glazing is 1300 mm (width) × 1100 mm (height) × 20.87 mm (thickness), thinner than commonly used PV double glazed insulating glass units. Figure 6 presents the pictures of the sample of vacuum PV glazing.
This section presents the main findings and outcomes of the research project and indicates their potential impacts on the local energy use and construction industry. Achievements of the specified research objectives are illustrated, and limitations of the project are also mentioned for the reference of future studies.
3.1 Design and production of the prototype productInitially, we proposed a prototype design as specified by Figure 2, where the vacuum layer was directly coupled with the laminated PV panel. However, during initial manufacture trials, the air pressure difference between internal and external spaces of the vacuum glass samples produced by the laminating machine caused the breakage of the vacuum glass samples. Then, we followed an alternative approach using pre-pressure furnace, whereas the molten state of the polyvinyl butyral (PVB) could not meet the expected requirements and the bubbles greatly impacted the appearance and performance of PV module. Finally, we proposed the current product design based on the experience acquired from previous failures (See Figure 5).
The electrical specifications of the vacuum PV glazing under standard test conditions (STC: air mass 1.5, solar irradiation 1000 W/m2 and cell temperature 25°C) are shown in Table 2. Table 3 presents the given thermal and optical properties of the PV laminated glass and vacuum glass, respectively.
(3) Multi-functionality
Due to their mechanical structures, the PV vacuum glazing can perform the functions of the building envelope in addition to generating emission-free energy, and can thus substitute for conventional construction windows or curtain walls. Apart from power generation and architectural function, the product can provide solar shading with its low SHGC value. It can also act as thermal and sound insulation due to its low U-value and acoustic resistance caused by the vacuum chamber between glazing layers. If applied with special coatings/films on top of PV glazing, it can also provide weather protection.
(4) Mounting system and installation
Based on specific requirements of each project in each region, safety, loading capacity and PV installation specifications can have a decisive impact on the method of fixing/mounting the vacuum. We have in this guide attempted to provide a range of options, highlighting what is possible in current design. The product can be installed with a linear mounting system as mullion-transom facades or structural sealant glazing. It can also be mounted with point-fixing systems including clamp fixings and undercut anchor fixings or mounted into standard curtain walling, rain screen cladding and window systems.
(5) Electrical system
In the curtain wall system, several PV glazing with standard size are usually connected together in a string to form the power generator. The generated direct current is usually fed to an inverter where the direct current is converted to alternating current. If on-site storage is not available, which is the common case in urban areas, the electrical power is registered via an electricity meter and connected to the public supply grid, which will require special permissions from the power grid companies (e.g. CLP in Hong Kong). Therefore, the application of the product will require a full set of electrical systems including cables and connections for parallel or series arrays, direct current load-break switches, inverters and generation meters.
(6) Economic considerations
The economic benefits of the product mainly lie in the following aspects: the substitute for original construction component, CO2 emission reduction and corresponding electricity fee waving, compliance with relevant building regulations (i.e. BEAM Plus in Hong Kong) and application of the feed-in-tariff policy (remuneration for electricity generation from PV).
temperature measurements were conducted through the centre of the vacuum PV sample to calculate the U-value. Secondly, the solar heat gains coefficient (SHGC) of the vacuum PV glazing sample was obtained and compared with three other advanced glazing types in an indoor solar irradiation test. Lastly, an outdoor test was conducted on the platform of Block Z in The Hong Kong Polytechnic University to evaluate the overall thermal performance of vacuum PV glazing. A conventional double clear pane glazing was used as a baseline in the outdoor test.
surfaces shows a similar trend in the three directions. Summing up electricity generation in all floors, the integrated PV modules in Model 2 and 3 can provide 285074.72 kWh/year and 355226.3 kWh/year, which accounts for 13.27% and 16.54% of the total building energy consumption of Model 1. Therefore, given the energy use reduction due to less external heat gain, using the vacuum BIPV glazing can save 27.74% (Model 3) electricity compared to a reference building.

The Department of Building Services Engineering (BSE) was officially established in December 1981 and has been very successful in running self-financed programmes. BSE colleagues spend most of their spare time on upgrading themselves, apart from the heavy work load in teaching. Most of them are having dual duties in teaching and development in scholarly activities. There is strong co-operation among the academic, technical and clerical staff so that all problems encountered in the past had been and will be solved without any difficulties.
BSE focuses on applied research into the building energy efficiency, fire & safety engineering, acoustics & vibration, renewable energy studies and advanced building materials. The department academic faculty consists of 3 chair professors, 6 professors and 9 associate professors. There are many new areas such as sustainability, healthy buildings and facilities management with good potential for strong development. New leaders who are competent in teaching, research and service to community in those areas will be appointed. With other existing strengths, BSE will keep on serving the community by providing quality teaching and applied research. The department will be managed transparently with open discussions and hot debates including research threshold, promotion criteria and renewal of contract. Closer links with the building industry will be explored. Participation in the key professional bodies including those for facilities management will be enhanced. Alumni are welcome to provide advice and share their experience with our teaching staffs at any time. Continued Professional Development activities for upgrading their knowledge will be organized from time to time.
Prof. YANG HongxingThe Department of Building Services EngineeringThe Hong Kong Polytechnic University
PREFACE
The comparison of building energy between Model 1, Model 2 and Model 3 is summarized in Table 6, which includes energy use of lighting, equipment, district cooling and district heating. Although Model 2 and Model 3 consume slightly more lighting energy due to the reduced visible transmittance of the PV glazing, the great energy saving in cooling and heating leads to the net reduction in the total building energy consumption. The total energy consumption of the Model 2 and 3 declines by 20.77 and 22.37 kWh/m2, accounting for 10.44% and 11.20% of Model 1 respectively. Generated electricity of windows and walls in three directions is also presented in Table 7. The south window produced the most electricity, 1527.13 kWh for Model 2 and 3203.76 kWh for Model 3 in a year, taking up nearly 47.80% the total electricity generated by windows. As for the west window, the electricity generated in a year is close to that of east window. Electricity generated by wall
3.2 Experimental study of the vacuum PV glazingOutdoor experimental test was first conducted on the developed prototype vacuum PV (VPV) glazing with the standard size (1.1m × 1.3m), whose various parameters including the ambient air temperature, incident solar irradiation, surface temperatures of the vacuum PV glazing as well as the I-V curves and the power generation were measured and recorded. The power generation and thermal performances of the prototype were also analysed during the test. To further justify the advantage of the vacuum PV glazing, experimental studies were carried out to compare the thermal performance of scaled-down samples (0.3m × 0.3m) with other advanced windows.
(1) Energy performance of the prototypeIn order to evaluate the energy performance of the vacuum PV glazing, an outdoor field measurement was conducted on the platform of Block Z in The Hong Kong Polytechnic University. The vacuum PV glazing was set up horizontally 0.4m above the floor on stilts so that the external temperatures of both sides of the vacuum PV glazing were approximately equal. Various parameters were measured during this test, including the ambient air temperature, the exterior and transmitted horizontal incident solar irradiation, the outer and inner surface temperatures of the vacuum PV glazing as well as the I-V curves and the power generation from the vacuum PV glazing. All the data was logged at an interval of 1 minute. Power generation and thermal performances of the vacuum PV glazing were analyzed based on the outdoor tests. Figure 7 shows the exterior and transmitted incident solar irradiation. It can be seen that the average solar irradiation transmittance during the period is approximately 0.08. Such low transmittance means that vast majority of solar irradiation is blocked by the vacuum PV glazing. Figure 8 presents the outer and inner surface temperature of the vacuum PV glazing. It can be seen that the outer surface temperature is much higher than the inner surface temperature at daytime. The maximum outer surface temperature is 75.3°C, 30°C higher than the inner surface temperature, which indicates that most of the waste heat is dissipated from the outside surface of the vacuum PV glazing, and the heat transfer to the inside space by convection is mitigated. Thus, compared with the conventional single-glazed PV glazing, the structure of the vacuum PV glazing can help reduce the cooling load and improve the indoor thermal comfort.
Then the vacuum PV glazing was mounted on the front side of an experimental test chamber as shown in Figure 9. Clear glass was also adopted in this study for comparison. Figure 10 presents the instantaneous power output of the vacuum PV glazing in 2 sunny days. It can be seen that the power generation from the vacuum PV glazing is consistent with incident solar radiation. A comparative study in terms of internal air temperature of the chamber between the vacuum PV glazing and the clear glass was conducted in a day of June.
As shown in Figure 11, the internal air temperature in the chamber with the vacuum PV glazing is much lower than that with a clear glass. The measured average and maximum internal air temperature for the vacuum PV glazing is 39.6°C and 40.3°C, respectively, while the corresponding average and maximum internal air temperature of the clear glass are 43.6°C and 44.7°C. The maximum internal air temperature difference between the vacuum PV glazing and the clear glass is 4.4°C, occurring in the morning. There are three temperature peaks of internal air temperature. Since the ambient temperature was relatively stable, the main heat gain of the internal air temperature was from incident solar irradiation. The internal air temperature for vacuum PV glazing is much more stable compared with that for the clear glass. The reason is that the vacuum PV glazing has better heat insulation performance so that the internal air temperature is not affected by the external environment significantly. It can also be seen in this figure that the internal air temperature of the chamber drops continuously at 15:00, which shows that the incident solar irradiation on the façade decreases so that the heat gains of the internal air from the sun also drops.
(2) Comparison with other advanced windows
To further justify the advantage of the vacuum PV glazing, experimental studies were carried out to compare it with other advanced windows. Samples of different types of glazing were mounted on the top of two hotboxes (i.e. test rigs) with the uniform dimension of 300 mm (L) × 300 mm (W) × 450mm (H) to implement both indoor and outdoor tests. Firstly, a co-heating test methodology was adopted for the thermal analysis of the vacuum PV glazing. The test rig was filled with the ice-water mixture to ensure the temperature difference between the inside and outside glazing surfaces larger than 5°C. Heat flux and
Figure 12 shows the internal and external temperatures of the vacuum PV glazing sample. The presented data were selected after the hotbox achieved the steady-state condition, when the temperature difference was around 8°C. Heat flux though the glazing sample and the U-value were then determined as illustrated in Figure 13. The average heat flux from the vacuum glazing was measured to be 15.4 W/m2. And the average U-value was calculated as 1.5 W/m2 × K which is much lower than a regular double pane window with the U-value of 2.5W/m2 × K. Considering the edge heat transfer which would strongly affect the heat flux measurement when the sample is small, it can be expected that the centre U-valve of the vacuum PV glazing should be lower than 1.5 W/m2 × K for a larger scale application (e.g. 1.1m × 1.3m).
(3) Cost effective analysis based on simulation
To address the economic benefits of the developed product, the simple payback period of the vacuum PV glazing is calculated with reference to available PV glazing on the market in both Hong Kong and Beijing’s scenarios.
Based on an average electricity price of 1.25 HKD/kWh from HK Electric, the simple payback period (See Figure 26) when applying the product to the west and east façade is calculated to be 7.5 and 8.0 years compared to the single-pane PV glazing. The payback periods are increased to 8.6 and 8.8 years when compared with double-pane PV glazing as shown in Figure 27. However, when applied to the south façade, the extra initial cost of the product cannot be recovered within 10 years.
The solar simulator in the laboratory can provide relatively steady horizontal incident solar irradiation, so that test rigs were located at the same spot to ensure each window sample exposed to the same radiation level. As shown in Figure 14, SHGCs of the vacuum PV glazing and double-pane PV glazing are much smaller than those of the vacuum glazing and double clear glazing, because the coupled PV module can absorb most of the solar irradiation. The vacuum PV glazing has the lowest SHGC of 0.10 which can act as the excellent thermal insulation.
The outdoor test lasted four days from September 26th to September 30th. As shown in Figure 15, September 26th, 27th and 30th were cloudy days and September 28th could be considered as a sunny day. It can be found that the vacuum PV glazing blocks most solar irradiation compared with the double-pane glazing. Figure 16 presents the temperature profile of the vacuum PV glazing and double-pane glazing in the sunny day. The internal surface temperature of both glazing was much higher than the ambient temperature when the outside incident solar radiation is strong. The internal glazing surface and air temperatures of the test rig with the vacuum PV glazing are lower than those of the test rig with the double-pane glazing. The difference between the internal air temperatures of test rigs is much smaller than that of internal glazing surface temperatures. Therefore, the application of vacuum PV glazing can achieve better indoor environment by reducing the solar heat gain.
3.3 Simulation study of the vacuum PV glazing(1) Simulation of a generic building model
Although a series of field tests have been conducted in the outdoor test bed to study the power and thermal performances of the vacuum BIPV glazing, the experimental scenarios are impossible to represent all the situations and variables. Thus, the numerical study was conducted to comprehensively investigate and compare the energy performance of the vacuum PV glazing and other commonly used energy-efficient glazing. As detailed in the research methodology, a comprehensive simulation model based on EnergyPlus and WINDOW has been developed to simulate the overall energy performance of different windows taking into account of their thermal and power output performance. This model is used to simulate the overall energy performance of the vacuum BIPV curtain wall in comparison with other commonly used windows. The key properties of different types of glazing are shown in Table 4 and the electrical specifications of the PV glazing under standard test conditions are referenced to Table 2.
In order to simulate the annual thermal performance and power performance of these types of glazing in Hong Kong for comparison purpose, a typical office room model has been created for simulation, as shown in Figure 17. The dimension of the office model was 2.5m × 2.3m × 2.5m (L × W × H). This room has only one external wall with three identical windows exposed to the outdoor environment. Simulations were conducted for different orientations, i.e. south (S), east (E), west (W) and north (N). A heat transfer model and PV performance model in EnergyPlus are adopted to investigate
the thermal and power performance of different glazing. The heat transfer model is used to calculate the cooling loads of the office room. The cooling loads are then converted to electricity use of air-conditioning system with a presumed coefficient of performance (COP) of 2.78. The equivalent one-diode model is selected to simulate the annual electricity generation from PV elements. The typical meteorological year (TMY) in Hong Kong is selected a reasonable representation of local climates.
The annual cooling electricity use of different types of glazing in different orientations in Hong Kong are shown in Figure 18. It can be observed that the room using vacuum PV glazing consumes the least cooling electricity for all orientations. The south facing room with vacuum PV glazing consumes about 705.56 kWh per year, which was approximately 14.2%, 9.8%, 8.4%, 7.1% and 4.1% less than the corresponding room with single-pane clear glazing, double-pane clear glazing, vacuum glazing, single-pane PV glazing and double-pane PV glazing, respectively. This is because the vacuum PV glazing have the lowest U-value and SHGC among all types of glazing, as shown in Table 4.3. A lower U-value indicates a higher level of heat insulation performance of the glazing, and a lower SHGC means less solar radiation will pass through the windows. Therefore, the vacuum PV glazing performs the best in the area with big temperature difference between indoor and outdoor environment. In addition, the most cooling electricity use of the office room occurs at the west orientation, followed by east, south and north. Therefore, east and west facing windows should have better solar heat insulation performance, to reduce heat gains from outside environment.
In addition to reduce the cooling load of the office room, the PV glazing can also generate electricity in situ. The annual electricity generation of the three types of PV glazing are shown in Figure 19. It can be seen that the annual electricity generation of the three types of PV glazing is similar to each other. The electricity generation from the vacuum PV glazing is a little less than the single-pane PV glazing due to increased solar cell temperature. However, since the temperature coefficient of the thin-film a-Si solar cells is small, the PV conversion efficiency is not reduced significantly. The annual electricity generation from a-Si PV glazing with 12.0% transmittance is around 113.81 kWh per year. Among all orientations, it is better to install PV glazing on the south facade in order to maximize the electricity output in Hong Kong. And it is not recommended to apply PV glazing on north façade due to limited solar radiation available.
Based on the results above, the vacuum PV glazing not only has the best thermal performance among all types of widely used glazing, but also produces a considerable amount of electricity per year. It is recommended to install vacuum PV glazing on south facade to perform the best overall energy performance.
(2) Simulation of the whole building
Apart from modelling studies conducted under the hot and humid climate of Hong Kong, the annual energy performance of different types of glazing in a cold region (i.e. Beijing) was also simulated for comparison. Simulation results are shown in Figure 20 and Figure 21. It can be observed that the room using the vacuum PV glazing achieves the lowest cooling consumption in both climates. In Beijing, the consumed cooling energy with the vacuum PV glazing is much smaller and is 30.2%, 20.8%, 17.0%, 13.8%, 4.4% less than that of the room with other types of glazing. It can be concluded that the energy saving potential of the vacuum PV glazing is much larger in a cold climate while the electricity generation is much higher during the summer time of Beijing due to the smaller solar incidence angle.
The developed simulation model was further applied to a 20-floor prototype office building. Typical floors of the building are divided into 5 conditioned zones, with a total floor area of 540 m2 (as shown in Figure 22). The reference case – Model 1 keeps all windows as the commonly used double-pane clear glazing, while the design cases include Model 2 and Model 3. Model 2 keeps the north-facing window as the conventional double-pane glazing while changes windows orientated to the other three directions to the developed vacuum PV glazing. The opaque part of all building facades is assumed to be covered with traditional crystalline BIPV with a power conversion efficiency of 15% to maximize the power generation potential of the building envelope. Model 3 shares similar settings with Model 2, except that the window transparency is tuned to 20% with a crystalline silicon (c-Si) as shown in Figure 23. Table 5 shows detailed settings of window properties for the three models respectively. The U-value and SHGC of a-Si vacuum PV glazing are obtained from previous experiments and those of double-pane clear glazing are calculated by the simulation software WINDOW. Thermal and power generation properties of c-Si vacuum PV glazing are obtained from existing literatures.
The simulation results of the total heat gain and loss through all windows are presented in Figure 24 and Figure 25. The heat gain and loss both decrease sharply when traditional double-pane clear glazing is replaced by the PV vacuum glazing. The obvious differences between these three models can be identified from the figures. Compared with the performance of Model 1, the heat gain through windows of Model 2 and Model 3 drops up to 77.89% and 77.97% (south-facing windows), while the heat loss of the two models declines up to 79.28% and 79.32% (south-facing windows), respectively.
On the other side, based on the peak office hour electricity price of 1.4 CNY/kWh for cooling and 0.25 CNY/kWh for heating from the Beijing authority, the simple payback period (See Figure 28) when applying the product to the west, east, and south façade is calculated to be 3.8, 4.6 and 5.3 years compared to the single-pane PV glazing. The payback periods are increased to 4.5, 5.4 and 6.5 years when compared with double-pane PV glazing as shown in Figure 29.
As a result, the product can be considered as a cost-effective application in building facades when considering its tremendous saving of air-conditioning energy and corresponding annual expenses. In addition, the property developer could also benefit from a potential increment in renting rates and popularity, if the building gets certified under a green building scheme by claiming credits in CO2 reduction and renewable application assessment criteria. All the abovementioned potential benefits with the application of the vacuum PV glazing would attract more attention from the construction industry.
3.4 Brief technical guideline for the vacuum PV glazingDesigning the vacuum PV glazing (i.e. vacuum BIPV curtain wall) system is a more complex process than a standard added-on PV system. The architectural context, structural requirements, economic considerations and building regulation requirements should all be considered, so that this brief guidance mainly focuses on the below aspects: design strategy, environmental variables, multifunctionality, installation situation, electrical components, and economic aspects (Polysolar Limited, 2015).
(1) Design strategy
Architects, property developers and building users become more inclined to consider renewable and energy efficient applications to meet building and planning regulations due to rising energy bills and awareness of environmental sustainability. The combination of PV and vacuum glazing is an innovative and promising solution to meet these requirements in the new building developments or refurbishment projects. As proved in the above sections of this report, the developed product offers the added advantage of providing a return of investment from the building envelope. Architectural and structural factors, as well as economic considerations should be taken into account at an early stage in any building projects to integrate renewable systems through a more satisfactory approach.
(2) Environmental variables
When designing a BIPV system, a compromise must be reached between the requirements of energy yield optimisation and those of the architectural environment. Therefore, the orientation, lighting performance, shading and temperature are the four mainly concerned issues in BIPV design. According to simulation and experimental results presented in the above sections, the optimal orientation of the installed PV glazing should be south for maximizing the annual power generation, while cooling load reduction is more conspicuous when the product is applied on the west and east facades. Therefore, it is preferable to install the product on all three facades for an optimal overall building energy-saving performance. The visible light transmittance is only 12% in the developed prototype, which might cause slightly more lighting power consumption compared to traditional double-pane clear glazing. However, the transmittance can be easily adjusted to higher than 20% in the manufacture process depending on the effective area of PV materials. There will always be a trade-off between power generation and permeable light, whereas this research has proved that the combined power generation and cooling load reduction can be more than the increased lighting energy use. Power generation performance of the a-Si PV is less sensitive to shadings, so that the prototype is subject to less influence from peripheral shadings. However, if we change the PV material to c-Si for higher conversion efficiency, a shading calculation should be conducted before allocating the BIPV glazing. Lastly, the conversion efficiency of a-Si glazing is also less sensitive to the increase of the panel temperature. The temperature coefficient must be considered if changing the PV material to c-Si.
The vacuum PV glazing was made by sandwiching a layer of PVB between an external PV laminated glass with a visible light transmittance of 12% and an internal vacuum glass. A low-e coating was also adopted to enhance its thermal performance. The structure of the vacuum PV glazing is shown in Figure 5. The dimension of the vacuum PV glazing is 1300 mm (width) × 1100 mm (height) × 20.87 mm (thickness), thinner than commonly used PV double glazed insulating glass units. Figure 6 presents the pictures of the sample of vacuum PV glazing.
This section presents the main findings and outcomes of the research project and indicates their potential impacts on the local energy use and construction industry. Achievements of the specified research objectives are illustrated, and limitations of the project are also mentioned for the reference of future studies.
3.1 Design and production of the prototype productInitially, we proposed a prototype design as specified by Figure 2, where the vacuum layer was directly coupled with the laminated PV panel. However, during initial manufacture trials, the air pressure difference between internal and external spaces of the vacuum glass samples produced by the laminating machine caused the breakage of the vacuum glass samples. Then, we followed an alternative approach using pre-pressure furnace, whereas the molten state of the polyvinyl butyral (PVB) could not meet the expected requirements and the bubbles greatly impacted the appearance and performance of PV module. Finally, we proposed the current product design based on the experience acquired from previous failures (See Figure 5).
The electrical specifications of the vacuum PV glazing under standard test conditions (STC: air mass 1.5, solar irradiation 1000 W/m2 and cell temperature 25°C) are shown in Table 2. Table 3 presents the given thermal and optical properties of the PV laminated glass and vacuum glass, respectively.
(3) Multi-functionality
Due to their mechanical structures, the PV vacuum glazing can perform the functions of the building envelope in addition to generating emission-free energy, and can thus substitute for conventional construction windows or curtain walls. Apart from power generation and architectural function, the product can provide solar shading with its low SHGC value. It can also act as thermal and sound insulation due to its low U-value and acoustic resistance caused by the vacuum chamber between glazing layers. If applied with special coatings/films on top of PV glazing, it can also provide weather protection.
(4) Mounting system and installation
Based on specific requirements of each project in each region, safety, loading capacity and PV installation specifications can have a decisive impact on the method of fixing/mounting the vacuum. We have in this guide attempted to provide a range of options, highlighting what is possible in current design. The product can be installed with a linear mounting system as mullion-transom facades or structural sealant glazing. It can also be mounted with point-fixing systems including clamp fixings and undercut anchor fixings or mounted into standard curtain walling, rain screen cladding and window systems.
(5) Electrical system
In the curtain wall system, several PV glazing with standard size are usually connected together in a string to form the power generator. The generated direct current is usually fed to an inverter where the direct current is converted to alternating current. If on-site storage is not available, which is the common case in urban areas, the electrical power is registered via an electricity meter and connected to the public supply grid, which will require special permissions from the power grid companies (e.g. CLP in Hong Kong). Therefore, the application of the product will require a full set of electrical systems including cables and connections for parallel or series arrays, direct current load-break switches, inverters and generation meters.
(6) Economic considerations
The economic benefits of the product mainly lie in the following aspects: the substitute for original construction component, CO2 emission reduction and corresponding electricity fee waving, compliance with relevant building regulations (i.e. BEAM Plus in Hong Kong) and application of the feed-in-tariff policy (remuneration for electricity generation from PV).
temperature measurements were conducted through the centre of the vacuum PV sample to calculate the U-value. Secondly, the solar heat gains coefficient (SHGC) of the vacuum PV glazing sample was obtained and compared with three other advanced glazing types in an indoor solar irradiation test. Lastly, an outdoor test was conducted on the platform of Block Z in The Hong Kong Polytechnic University to evaluate the overall thermal performance of vacuum PV glazing. A conventional double clear pane glazing was used as a baseline in the outdoor test.
surfaces shows a similar trend in the three directions. Summing up electricity generation in all floors, the integrated PV modules in Model 2 and 3 can provide 285074.72 kWh/year and 355226.3 kWh/year, which accounts for 13.27% and 16.54% of the total building energy consumption of Model 1. Therefore, given the energy use reduction due to less external heat gain, using the vacuum BIPV glazing can save 27.74% (Model 3) electricity compared to a reference building.
Due to the significant cost reduction of solar photovoltaic (PV) modules and aggravating environmental problems in the urban environment, more and more solar PV curtain walls, especially in commercial buildings, have been developed throughout the world. However, the poor thermal and sound insulation performances are usually observed in traditional solar PV curtain walls, which in turn seriously hinder their large-scale use. Although solar PV curtain walls can generate electrical power in situ, they also increase the cooling load and heating load of buildings significantly due to their high solar heat gain coefficient (SHGC) and U-Value. However, vacuum glazing, which has excellent thermal and sound insulation performance, can effectively solve the above issues for PV curtain walls. In this project, a novel high-efficient energy-saving vacuum BIPV (building integrated photovoltaic) curtain wall, which combines photovoltaic curtain wall and vacuum glazing technologies, is developed and investigated. This vacuum BIPV curtain wall cannot only generate electricity in situ, but also significantly reduce the heat transfer through the building envelope due to its improved thermal insulation performance. The vacuum PV glazing was fabricated by sandwiching a layer of polyvinyl butyral (PVB) between an external PV laminated glass and an internal vacuum glass. A low-e coating was also applied to enhance its thermal performance. The thermal and power performance of the vacuum PV glazing were investigated by experiments and numerical simulations. A prototype of the vacuum BIPV curtain wall was set up for a short-term outdoor testing campaign to demonstrate its thermal and power performance under typical weather conditions of Hong Kong. A comparative experimental study was also carried out to compare the overall energy performance of the developed vacuum PV glazing with other advanced window or facade technologies, such as the Double-pane low-e, Double-pane PV and Vacuum clear glazing. A comprehensive energy model was then developed to predict the dynamic power and thermal performance of the vacuum BIPV curtain wall to evaluate its annual energy saving potential compared to other advanced window technologies used in buildings in Hong Kong and Beijing. Based on the simulation model, an optimum design of the vacuum BIPV curtain wall was proposed. In addition, the annual energy-saving potential for a typical high-rise commercial building with the application of miscellaneous BIPV products was estimated using the typical meteorological year (TMY) weather data. Based on the simulation results, a cost effectiveness analysis was conducted to compare the vacuum PV glazing with widely available Single PV glazing and Double PV glazing in the construction industry. Finally, a design guideline of the advanced BIPV technology was proposed to guide its future large-scale application and commercialization.
RESEARCH HIGHLIGHTS
The comparison of building energy between Model 1, Model 2 and Model 3 is summarized in Table 6, which includes energy use of lighting, equipment, district cooling and district heating. Although Model 2 and Model 3 consume slightly more lighting energy due to the reduced visible transmittance of the PV glazing, the great energy saving in cooling and heating leads to the net reduction in the total building energy consumption. The total energy consumption of the Model 2 and 3 declines by 20.77 and 22.37 kWh/m2, accounting for 10.44% and 11.20% of Model 1 respectively. Generated electricity of windows and walls in three directions is also presented in Table 7. The south window produced the most electricity, 1527.13 kWh for Model 2 and 3203.76 kWh for Model 3 in a year, taking up nearly 47.80% the total electricity generated by windows. As for the west window, the electricity generated in a year is close to that of east window. Electricity generated by wall
3.2 Experimental study of the vacuum PV glazingOutdoor experimental test was first conducted on the developed prototype vacuum PV (VPV) glazing with the standard size (1.1m × 1.3m), whose various parameters including the ambient air temperature, incident solar irradiation, surface temperatures of the vacuum PV glazing as well as the I-V curves and the power generation were measured and recorded. The power generation and thermal performances of the prototype were also analysed during the test. To further justify the advantage of the vacuum PV glazing, experimental studies were carried out to compare the thermal performance of scaled-down samples (0.3m × 0.3m) with other advanced windows.
(1) Energy performance of the prototypeIn order to evaluate the energy performance of the vacuum PV glazing, an outdoor field measurement was conducted on the platform of Block Z in The Hong Kong Polytechnic University. The vacuum PV glazing was set up horizontally 0.4m above the floor on stilts so that the external temperatures of both sides of the vacuum PV glazing were approximately equal. Various parameters were measured during this test, including the ambient air temperature, the exterior and transmitted horizontal incident solar irradiation, the outer and inner surface temperatures of the vacuum PV glazing as well as the I-V curves and the power generation from the vacuum PV glazing. All the data was logged at an interval of 1 minute. Power generation and thermal performances of the vacuum PV glazing were analyzed based on the outdoor tests. Figure 7 shows the exterior and transmitted incident solar irradiation. It can be seen that the average solar irradiation transmittance during the period is approximately 0.08. Such low transmittance means that vast majority of solar irradiation is blocked by the vacuum PV glazing. Figure 8 presents the outer and inner surface temperature of the vacuum PV glazing. It can be seen that the outer surface temperature is much higher than the inner surface temperature at daytime. The maximum outer surface temperature is 75.3°C, 30°C higher than the inner surface temperature, which indicates that most of the waste heat is dissipated from the outside surface of the vacuum PV glazing, and the heat transfer to the inside space by convection is mitigated. Thus, compared with the conventional single-glazed PV glazing, the structure of the vacuum PV glazing can help reduce the cooling load and improve the indoor thermal comfort.
Then the vacuum PV glazing was mounted on the front side of an experimental test chamber as shown in Figure 9. Clear glass was also adopted in this study for comparison. Figure 10 presents the instantaneous power output of the vacuum PV glazing in 2 sunny days. It can be seen that the power generation from the vacuum PV glazing is consistent with incident solar radiation. A comparative study in terms of internal air temperature of the chamber between the vacuum PV glazing and the clear glass was conducted in a day of June.
As shown in Figure 11, the internal air temperature in the chamber with the vacuum PV glazing is much lower than that with a clear glass. The measured average and maximum internal air temperature for the vacuum PV glazing is 39.6°C and 40.3°C, respectively, while the corresponding average and maximum internal air temperature of the clear glass are 43.6°C and 44.7°C. The maximum internal air temperature difference between the vacuum PV glazing and the clear glass is 4.4°C, occurring in the morning. There are three temperature peaks of internal air temperature. Since the ambient temperature was relatively stable, the main heat gain of the internal air temperature was from incident solar irradiation. The internal air temperature for vacuum PV glazing is much more stable compared with that for the clear glass. The reason is that the vacuum PV glazing has better heat insulation performance so that the internal air temperature is not affected by the external environment significantly. It can also be seen in this figure that the internal air temperature of the chamber drops continuously at 15:00, which shows that the incident solar irradiation on the façade decreases so that the heat gains of the internal air from the sun also drops.
(2) Comparison with other advanced windows
To further justify the advantage of the vacuum PV glazing, experimental studies were carried out to compare it with other advanced windows. Samples of different types of glazing were mounted on the top of two hotboxes (i.e. test rigs) with the uniform dimension of 300 mm (L) × 300 mm (W) × 450mm (H) to implement both indoor and outdoor tests. Firstly, a co-heating test methodology was adopted for the thermal analysis of the vacuum PV glazing. The test rig was filled with the ice-water mixture to ensure the temperature difference between the inside and outside glazing surfaces larger than 5°C. Heat flux and
Figure 12 shows the internal and external temperatures of the vacuum PV glazing sample. The presented data were selected after the hotbox achieved the steady-state condition, when the temperature difference was around 8°C. Heat flux though the glazing sample and the U-value were then determined as illustrated in Figure 13. The average heat flux from the vacuum glazing was measured to be 15.4 W/m2. And the average U-value was calculated as 1.5 W/m2 × K which is much lower than a regular double pane window with the U-value of 2.5W/m2 × K. Considering the edge heat transfer which would strongly affect the heat flux measurement when the sample is small, it can be expected that the centre U-valve of the vacuum PV glazing should be lower than 1.5 W/m2 × K for a larger scale application (e.g. 1.1m × 1.3m).
(3) Cost effective analysis based on simulation
To address the economic benefits of the developed product, the simple payback period of the vacuum PV glazing is calculated with reference to available PV glazing on the market in both Hong Kong and Beijing’s scenarios.
Based on an average electricity price of 1.25 HKD/kWh from HK Electric, the simple payback period (See Figure 26) when applying the product to the west and east façade is calculated to be 7.5 and 8.0 years compared to the single-pane PV glazing. The payback periods are increased to 8.6 and 8.8 years when compared with double-pane PV glazing as shown in Figure 27. However, when applied to the south façade, the extra initial cost of the product cannot be recovered within 10 years.
The solar simulator in the laboratory can provide relatively steady horizontal incident solar irradiation, so that test rigs were located at the same spot to ensure each window sample exposed to the same radiation level. As shown in Figure 14, SHGCs of the vacuum PV glazing and double-pane PV glazing are much smaller than those of the vacuum glazing and double clear glazing, because the coupled PV module can absorb most of the solar irradiation. The vacuum PV glazing has the lowest SHGC of 0.10 which can act as the excellent thermal insulation.
The outdoor test lasted four days from September 26th to September 30th. As shown in Figure 15, September 26th, 27th and 30th were cloudy days and September 28th could be considered as a sunny day. It can be found that the vacuum PV glazing blocks most solar irradiation compared with the double-pane glazing. Figure 16 presents the temperature profile of the vacuum PV glazing and double-pane glazing in the sunny day. The internal surface temperature of both glazing was much higher than the ambient temperature when the outside incident solar radiation is strong. The internal glazing surface and air temperatures of the test rig with the vacuum PV glazing are lower than those of the test rig with the double-pane glazing. The difference between the internal air temperatures of test rigs is much smaller than that of internal glazing surface temperatures. Therefore, the application of vacuum PV glazing can achieve better indoor environment by reducing the solar heat gain.
3.3 Simulation study of the vacuum PV glazing(1) Simulation of a generic building model
Although a series of field tests have been conducted in the outdoor test bed to study the power and thermal performances of the vacuum BIPV glazing, the experimental scenarios are impossible to represent all the situations and variables. Thus, the numerical study was conducted to comprehensively investigate and compare the energy performance of the vacuum PV glazing and other commonly used energy-efficient glazing. As detailed in the research methodology, a comprehensive simulation model based on EnergyPlus and WINDOW has been developed to simulate the overall energy performance of different windows taking into account of their thermal and power output performance. This model is used to simulate the overall energy performance of the vacuum BIPV curtain wall in comparison with other commonly used windows. The key properties of different types of glazing are shown in Table 4 and the electrical specifications of the PV glazing under standard test conditions are referenced to Table 2.
In order to simulate the annual thermal performance and power performance of these types of glazing in Hong Kong for comparison purpose, a typical office room model has been created for simulation, as shown in Figure 17. The dimension of the office model was 2.5m × 2.3m × 2.5m (L × W × H). This room has only one external wall with three identical windows exposed to the outdoor environment. Simulations were conducted for different orientations, i.e. south (S), east (E), west (W) and north (N). A heat transfer model and PV performance model in EnergyPlus are adopted to investigate
the thermal and power performance of different glazing. The heat transfer model is used to calculate the cooling loads of the office room. The cooling loads are then converted to electricity use of air-conditioning system with a presumed coefficient of performance (COP) of 2.78. The equivalent one-diode model is selected to simulate the annual electricity generation from PV elements. The typical meteorological year (TMY) in Hong Kong is selected a reasonable representation of local climates.
The annual cooling electricity use of different types of glazing in different orientations in Hong Kong are shown in Figure 18. It can be observed that the room using vacuum PV glazing consumes the least cooling electricity for all orientations. The south facing room with vacuum PV glazing consumes about 705.56 kWh per year, which was approximately 14.2%, 9.8%, 8.4%, 7.1% and 4.1% less than the corresponding room with single-pane clear glazing, double-pane clear glazing, vacuum glazing, single-pane PV glazing and double-pane PV glazing, respectively. This is because the vacuum PV glazing have the lowest U-value and SHGC among all types of glazing, as shown in Table 4.3. A lower U-value indicates a higher level of heat insulation performance of the glazing, and a lower SHGC means less solar radiation will pass through the windows. Therefore, the vacuum PV glazing performs the best in the area with big temperature difference between indoor and outdoor environment. In addition, the most cooling electricity use of the office room occurs at the west orientation, followed by east, south and north. Therefore, east and west facing windows should have better solar heat insulation performance, to reduce heat gains from outside environment.
In addition to reduce the cooling load of the office room, the PV glazing can also generate electricity in situ. The annual electricity generation of the three types of PV glazing are shown in Figure 19. It can be seen that the annual electricity generation of the three types of PV glazing is similar to each other. The electricity generation from the vacuum PV glazing is a little less than the single-pane PV glazing due to increased solar cell temperature. However, since the temperature coefficient of the thin-film a-Si solar cells is small, the PV conversion efficiency is not reduced significantly. The annual electricity generation from a-Si PV glazing with 12.0% transmittance is around 113.81 kWh per year. Among all orientations, it is better to install PV glazing on the south facade in order to maximize the electricity output in Hong Kong. And it is not recommended to apply PV glazing on north façade due to limited solar radiation available.
Based on the results above, the vacuum PV glazing not only has the best thermal performance among all types of widely used glazing, but also produces a considerable amount of electricity per year. It is recommended to install vacuum PV glazing on south facade to perform the best overall energy performance.
(2) Simulation of the whole building
Apart from modelling studies conducted under the hot and humid climate of Hong Kong, the annual energy performance of different types of glazing in a cold region (i.e. Beijing) was also simulated for comparison. Simulation results are shown in Figure 20 and Figure 21. It can be observed that the room using the vacuum PV glazing achieves the lowest cooling consumption in both climates. In Beijing, the consumed cooling energy with the vacuum PV glazing is much smaller and is 30.2%, 20.8%, 17.0%, 13.8%, 4.4% less than that of the room with other types of glazing. It can be concluded that the energy saving potential of the vacuum PV glazing is much larger in a cold climate while the electricity generation is much higher during the summer time of Beijing due to the smaller solar incidence angle.
The developed simulation model was further applied to a 20-floor prototype office building. Typical floors of the building are divided into 5 conditioned zones, with a total floor area of 540 m2 (as shown in Figure 22). The reference case – Model 1 keeps all windows as the commonly used double-pane clear glazing, while the design cases include Model 2 and Model 3. Model 2 keeps the north-facing window as the conventional double-pane glazing while changes windows orientated to the other three directions to the developed vacuum PV glazing. The opaque part of all building facades is assumed to be covered with traditional crystalline BIPV with a power conversion efficiency of 15% to maximize the power generation potential of the building envelope. Model 3 shares similar settings with Model 2, except that the window transparency is tuned to 20% with a crystalline silicon (c-Si) as shown in Figure 23. Table 5 shows detailed settings of window properties for the three models respectively. The U-value and SHGC of a-Si vacuum PV glazing are obtained from previous experiments and those of double-pane clear glazing are calculated by the simulation software WINDOW. Thermal and power generation properties of c-Si vacuum PV glazing are obtained from existing literatures.
The simulation results of the total heat gain and loss through all windows are presented in Figure 24 and Figure 25. The heat gain and loss both decrease sharply when traditional double-pane clear glazing is replaced by the PV vacuum glazing. The obvious differences between these three models can be identified from the figures. Compared with the performance of Model 1, the heat gain through windows of Model 2 and Model 3 drops up to 77.89% and 77.97% (south-facing windows), while the heat loss of the two models declines up to 79.28% and 79.32% (south-facing windows), respectively.
On the other side, based on the peak office hour electricity price of 1.4 CNY/kWh for cooling and 0.25 CNY/kWh for heating from the Beijing authority, the simple payback period (See Figure 28) when applying the product to the west, east, and south façade is calculated to be 3.8, 4.6 and 5.3 years compared to the single-pane PV glazing. The payback periods are increased to 4.5, 5.4 and 6.5 years when compared with double-pane PV glazing as shown in Figure 29.
As a result, the product can be considered as a cost-effective application in building facades when considering its tremendous saving of air-conditioning energy and corresponding annual expenses. In addition, the property developer could also benefit from a potential increment in renting rates and popularity, if the building gets certified under a green building scheme by claiming credits in CO2 reduction and renewable application assessment criteria. All the abovementioned potential benefits with the application of the vacuum PV glazing would attract more attention from the construction industry.
3.4 Brief technical guideline for the vacuum PV glazingDesigning the vacuum PV glazing (i.e. vacuum BIPV curtain wall) system is a more complex process than a standard added-on PV system. The architectural context, structural requirements, economic considerations and building regulation requirements should all be considered, so that this brief guidance mainly focuses on the below aspects: design strategy, environmental variables, multifunctionality, installation situation, electrical components, and economic aspects (Polysolar Limited, 2015).
(1) Design strategy
Architects, property developers and building users become more inclined to consider renewable and energy efficient applications to meet building and planning regulations due to rising energy bills and awareness of environmental sustainability. The combination of PV and vacuum glazing is an innovative and promising solution to meet these requirements in the new building developments or refurbishment projects. As proved in the above sections of this report, the developed product offers the added advantage of providing a return of investment from the building envelope. Architectural and structural factors, as well as economic considerations should be taken into account at an early stage in any building projects to integrate renewable systems through a more satisfactory approach.
(2) Environmental variables
When designing a BIPV system, a compromise must be reached between the requirements of energy yield optimisation and those of the architectural environment. Therefore, the orientation, lighting performance, shading and temperature are the four mainly concerned issues in BIPV design. According to simulation and experimental results presented in the above sections, the optimal orientation of the installed PV glazing should be south for maximizing the annual power generation, while cooling load reduction is more conspicuous when the product is applied on the west and east facades. Therefore, it is preferable to install the product on all three facades for an optimal overall building energy-saving performance. The visible light transmittance is only 12% in the developed prototype, which might cause slightly more lighting power consumption compared to traditional double-pane clear glazing. However, the transmittance can be easily adjusted to higher than 20% in the manufacture process depending on the effective area of PV materials. There will always be a trade-off between power generation and permeable light, whereas this research has proved that the combined power generation and cooling load reduction can be more than the increased lighting energy use. Power generation performance of the a-Si PV is less sensitive to shadings, so that the prototype is subject to less influence from peripheral shadings. However, if we change the PV material to c-Si for higher conversion efficiency, a shading calculation should be conducted before allocating the BIPV glazing. Lastly, the conversion efficiency of a-Si glazing is also less sensitive to the increase of the panel temperature. The temperature coefficient must be considered if changing the PV material to c-Si.
The vacuum PV glazing was made by sandwiching a layer of PVB between an external PV laminated glass with a visible light transmittance of 12% and an internal vacuum glass. A low-e coating was also adopted to enhance its thermal performance. The structure of the vacuum PV glazing is shown in Figure 5. The dimension of the vacuum PV glazing is 1300 mm (width) × 1100 mm (height) × 20.87 mm (thickness), thinner than commonly used PV double glazed insulating glass units. Figure 6 presents the pictures of the sample of vacuum PV glazing.
This section presents the main findings and outcomes of the research project and indicates their potential impacts on the local energy use and construction industry. Achievements of the specified research objectives are illustrated, and limitations of the project are also mentioned for the reference of future studies.
3.1 Design and production of the prototype productInitially, we proposed a prototype design as specified by Figure 2, where the vacuum layer was directly coupled with the laminated PV panel. However, during initial manufacture trials, the air pressure difference between internal and external spaces of the vacuum glass samples produced by the laminating machine caused the breakage of the vacuum glass samples. Then, we followed an alternative approach using pre-pressure furnace, whereas the molten state of the polyvinyl butyral (PVB) could not meet the expected requirements and the bubbles greatly impacted the appearance and performance of PV module. Finally, we proposed the current product design based on the experience acquired from previous failures (See Figure 5).
The electrical specifications of the vacuum PV glazing under standard test conditions (STC: air mass 1.5, solar irradiation 1000 W/m2 and cell temperature 25°C) are shown in Table 2. Table 3 presents the given thermal and optical properties of the PV laminated glass and vacuum glass, respectively.
(3) Multi-functionality
Due to their mechanical structures, the PV vacuum glazing can perform the functions of the building envelope in addition to generating emission-free energy, and can thus substitute for conventional construction windows or curtain walls. Apart from power generation and architectural function, the product can provide solar shading with its low SHGC value. It can also act as thermal and sound insulation due to its low U-value and acoustic resistance caused by the vacuum chamber between glazing layers. If applied with special coatings/films on top of PV glazing, it can also provide weather protection.
(4) Mounting system and installation
Based on specific requirements of each project in each region, safety, loading capacity and PV installation specifications can have a decisive impact on the method of fixing/mounting the vacuum. We have in this guide attempted to provide a range of options, highlighting what is possible in current design. The product can be installed with a linear mounting system as mullion-transom facades or structural sealant glazing. It can also be mounted with point-fixing systems including clamp fixings and undercut anchor fixings or mounted into standard curtain walling, rain screen cladding and window systems.
(5) Electrical system
In the curtain wall system, several PV glazing with standard size are usually connected together in a string to form the power generator. The generated direct current is usually fed to an inverter where the direct current is converted to alternating current. If on-site storage is not available, which is the common case in urban areas, the electrical power is registered via an electricity meter and connected to the public supply grid, which will require special permissions from the power grid companies (e.g. CLP in Hong Kong). Therefore, the application of the product will require a full set of electrical systems including cables and connections for parallel or series arrays, direct current load-break switches, inverters and generation meters.
(6) Economic considerations
The economic benefits of the product mainly lie in the following aspects: the substitute for original construction component, CO2 emission reduction and corresponding electricity fee waving, compliance with relevant building regulations (i.e. BEAM Plus in Hong Kong) and application of the feed-in-tariff policy (remuneration for electricity generation from PV).
temperature measurements were conducted through the centre of the vacuum PV sample to calculate the U-value. Secondly, the solar heat gains coefficient (SHGC) of the vacuum PV glazing sample was obtained and compared with three other advanced glazing types in an indoor solar irradiation test. Lastly, an outdoor test was conducted on the platform of Block Z in The Hong Kong Polytechnic University to evaluate the overall thermal performance of vacuum PV glazing. A conventional double clear pane glazing was used as a baseline in the outdoor test.
surfaces shows a similar trend in the three directions. Summing up electricity generation in all floors, the integrated PV modules in Model 2 and 3 can provide 285074.72 kWh/year and 355226.3 kWh/year, which accounts for 13.27% and 16.54% of the total building energy consumption of Model 1. Therefore, given the energy use reduction due to less external heat gain, using the vacuum BIPV glazing can save 27.74% (Model 3) electricity compared to a reference building.

1 INTRODUCTION 1
1.1 Background 1
1.2 Aims and Objectives 3
1.3 Scope 42 RESEARCH METHODOLOGY 5
2.1 Power output modelling 6
2.2 Thermal performance modelling 6
2.3 Building performance modelling 7
2.4 Experiment test of power and thermal performance 83 RESEARCH FINDINGS AND DISCUSSION 9 3.1 Design and production of the prototype product 9
3.2 Experimental study of the vacuum PV glazing 11
3.3 Simulation study of the vaccum PV glazing 21
3.4 Brief technical guidelines for the vacuum glazing 344 RECOMMENDATIONS 36
4.1 Conclusion 36
4.2 Recommendation for future work 375 REFERENCES 39
CONTENTS
The comparison of building energy between Model 1, Model 2 and Model 3 is summarized in Table 6, which includes energy use of lighting, equipment, district cooling and district heating. Although Model 2 and Model 3 consume slightly more lighting energy due to the reduced visible transmittance of the PV glazing, the great energy saving in cooling and heating leads to the net reduction in the total building energy consumption. The total energy consumption of the Model 2 and 3 declines by 20.77 and 22.37 kWh/m2, accounting for 10.44% and 11.20% of Model 1 respectively. Generated electricity of windows and walls in three directions is also presented in Table 7. The south window produced the most electricity, 1527.13 kWh for Model 2 and 3203.76 kWh for Model 3 in a year, taking up nearly 47.80% the total electricity generated by windows. As for the west window, the electricity generated in a year is close to that of east window. Electricity generated by wall
3.2 Experimental study of the vacuum PV glazingOutdoor experimental test was first conducted on the developed prototype vacuum PV (VPV) glazing with the standard size (1.1m × 1.3m), whose various parameters including the ambient air temperature, incident solar irradiation, surface temperatures of the vacuum PV glazing as well as the I-V curves and the power generation were measured and recorded. The power generation and thermal performances of the prototype were also analysed during the test. To further justify the advantage of the vacuum PV glazing, experimental studies were carried out to compare the thermal performance of scaled-down samples (0.3m × 0.3m) with other advanced windows.
(1) Energy performance of the prototypeIn order to evaluate the energy performance of the vacuum PV glazing, an outdoor field measurement was conducted on the platform of Block Z in The Hong Kong Polytechnic University. The vacuum PV glazing was set up horizontally 0.4m above the floor on stilts so that the external temperatures of both sides of the vacuum PV glazing were approximately equal. Various parameters were measured during this test, including the ambient air temperature, the exterior and transmitted horizontal incident solar irradiation, the outer and inner surface temperatures of the vacuum PV glazing as well as the I-V curves and the power generation from the vacuum PV glazing. All the data was logged at an interval of 1 minute. Power generation and thermal performances of the vacuum PV glazing were analyzed based on the outdoor tests. Figure 7 shows the exterior and transmitted incident solar irradiation. It can be seen that the average solar irradiation transmittance during the period is approximately 0.08. Such low transmittance means that vast majority of solar irradiation is blocked by the vacuum PV glazing. Figure 8 presents the outer and inner surface temperature of the vacuum PV glazing. It can be seen that the outer surface temperature is much higher than the inner surface temperature at daytime. The maximum outer surface temperature is 75.3°C, 30°C higher than the inner surface temperature, which indicates that most of the waste heat is dissipated from the outside surface of the vacuum PV glazing, and the heat transfer to the inside space by convection is mitigated. Thus, compared with the conventional single-glazed PV glazing, the structure of the vacuum PV glazing can help reduce the cooling load and improve the indoor thermal comfort.
Then the vacuum PV glazing was mounted on the front side of an experimental test chamber as shown in Figure 9. Clear glass was also adopted in this study for comparison. Figure 10 presents the instantaneous power output of the vacuum PV glazing in 2 sunny days. It can be seen that the power generation from the vacuum PV glazing is consistent with incident solar radiation. A comparative study in terms of internal air temperature of the chamber between the vacuum PV glazing and the clear glass was conducted in a day of June.
As shown in Figure 11, the internal air temperature in the chamber with the vacuum PV glazing is much lower than that with a clear glass. The measured average and maximum internal air temperature for the vacuum PV glazing is 39.6°C and 40.3°C, respectively, while the corresponding average and maximum internal air temperature of the clear glass are 43.6°C and 44.7°C. The maximum internal air temperature difference between the vacuum PV glazing and the clear glass is 4.4°C, occurring in the morning. There are three temperature peaks of internal air temperature. Since the ambient temperature was relatively stable, the main heat gain of the internal air temperature was from incident solar irradiation. The internal air temperature for vacuum PV glazing is much more stable compared with that for the clear glass. The reason is that the vacuum PV glazing has better heat insulation performance so that the internal air temperature is not affected by the external environment significantly. It can also be seen in this figure that the internal air temperature of the chamber drops continuously at 15:00, which shows that the incident solar irradiation on the façade decreases so that the heat gains of the internal air from the sun also drops.
(2) Comparison with other advanced windows
To further justify the advantage of the vacuum PV glazing, experimental studies were carried out to compare it with other advanced windows. Samples of different types of glazing were mounted on the top of two hotboxes (i.e. test rigs) with the uniform dimension of 300 mm (L) × 300 mm (W) × 450mm (H) to implement both indoor and outdoor tests. Firstly, a co-heating test methodology was adopted for the thermal analysis of the vacuum PV glazing. The test rig was filled with the ice-water mixture to ensure the temperature difference between the inside and outside glazing surfaces larger than 5°C. Heat flux and
Figure 12 shows the internal and external temperatures of the vacuum PV glazing sample. The presented data were selected after the hotbox achieved the steady-state condition, when the temperature difference was around 8°C. Heat flux though the glazing sample and the U-value were then determined as illustrated in Figure 13. The average heat flux from the vacuum glazing was measured to be 15.4 W/m2. And the average U-value was calculated as 1.5 W/m2 × K which is much lower than a regular double pane window with the U-value of 2.5W/m2 × K. Considering the edge heat transfer which would strongly affect the heat flux measurement when the sample is small, it can be expected that the centre U-valve of the vacuum PV glazing should be lower than 1.5 W/m2 × K for a larger scale application (e.g. 1.1m × 1.3m).
(3) Cost effective analysis based on simulation
To address the economic benefits of the developed product, the simple payback period of the vacuum PV glazing is calculated with reference to available PV glazing on the market in both Hong Kong and Beijing’s scenarios.
Based on an average electricity price of 1.25 HKD/kWh from HK Electric, the simple payback period (See Figure 26) when applying the product to the west and east façade is calculated to be 7.5 and 8.0 years compared to the single-pane PV glazing. The payback periods are increased to 8.6 and 8.8 years when compared with double-pane PV glazing as shown in Figure 27. However, when applied to the south façade, the extra initial cost of the product cannot be recovered within 10 years.
The solar simulator in the laboratory can provide relatively steady horizontal incident solar irradiation, so that test rigs were located at the same spot to ensure each window sample exposed to the same radiation level. As shown in Figure 14, SHGCs of the vacuum PV glazing and double-pane PV glazing are much smaller than those of the vacuum glazing and double clear glazing, because the coupled PV module can absorb most of the solar irradiation. The vacuum PV glazing has the lowest SHGC of 0.10 which can act as the excellent thermal insulation.
The outdoor test lasted four days from September 26th to September 30th. As shown in Figure 15, September 26th, 27th and 30th were cloudy days and September 28th could be considered as a sunny day. It can be found that the vacuum PV glazing blocks most solar irradiation compared with the double-pane glazing. Figure 16 presents the temperature profile of the vacuum PV glazing and double-pane glazing in the sunny day. The internal surface temperature of both glazing was much higher than the ambient temperature when the outside incident solar radiation is strong. The internal glazing surface and air temperatures of the test rig with the vacuum PV glazing are lower than those of the test rig with the double-pane glazing. The difference between the internal air temperatures of test rigs is much smaller than that of internal glazing surface temperatures. Therefore, the application of vacuum PV glazing can achieve better indoor environment by reducing the solar heat gain.
3.3 Simulation study of the vacuum PV glazing(1) Simulation of a generic building model
Although a series of field tests have been conducted in the outdoor test bed to study the power and thermal performances of the vacuum BIPV glazing, the experimental scenarios are impossible to represent all the situations and variables. Thus, the numerical study was conducted to comprehensively investigate and compare the energy performance of the vacuum PV glazing and other commonly used energy-efficient glazing. As detailed in the research methodology, a comprehensive simulation model based on EnergyPlus and WINDOW has been developed to simulate the overall energy performance of different windows taking into account of their thermal and power output performance. This model is used to simulate the overall energy performance of the vacuum BIPV curtain wall in comparison with other commonly used windows. The key properties of different types of glazing are shown in Table 4 and the electrical specifications of the PV glazing under standard test conditions are referenced to Table 2.
In order to simulate the annual thermal performance and power performance of these types of glazing in Hong Kong for comparison purpose, a typical office room model has been created for simulation, as shown in Figure 17. The dimension of the office model was 2.5m × 2.3m × 2.5m (L × W × H). This room has only one external wall with three identical windows exposed to the outdoor environment. Simulations were conducted for different orientations, i.e. south (S), east (E), west (W) and north (N). A heat transfer model and PV performance model in EnergyPlus are adopted to investigate
the thermal and power performance of different glazing. The heat transfer model is used to calculate the cooling loads of the office room. The cooling loads are then converted to electricity use of air-conditioning system with a presumed coefficient of performance (COP) of 2.78. The equivalent one-diode model is selected to simulate the annual electricity generation from PV elements. The typical meteorological year (TMY) in Hong Kong is selected a reasonable representation of local climates.
The annual cooling electricity use of different types of glazing in different orientations in Hong Kong are shown in Figure 18. It can be observed that the room using vacuum PV glazing consumes the least cooling electricity for all orientations. The south facing room with vacuum PV glazing consumes about 705.56 kWh per year, which was approximately 14.2%, 9.8%, 8.4%, 7.1% and 4.1% less than the corresponding room with single-pane clear glazing, double-pane clear glazing, vacuum glazing, single-pane PV glazing and double-pane PV glazing, respectively. This is because the vacuum PV glazing have the lowest U-value and SHGC among all types of glazing, as shown in Table 4.3. A lower U-value indicates a higher level of heat insulation performance of the glazing, and a lower SHGC means less solar radiation will pass through the windows. Therefore, the vacuum PV glazing performs the best in the area with big temperature difference between indoor and outdoor environment. In addition, the most cooling electricity use of the office room occurs at the west orientation, followed by east, south and north. Therefore, east and west facing windows should have better solar heat insulation performance, to reduce heat gains from outside environment.
In addition to reduce the cooling load of the office room, the PV glazing can also generate electricity in situ. The annual electricity generation of the three types of PV glazing are shown in Figure 19. It can be seen that the annual electricity generation of the three types of PV glazing is similar to each other. The electricity generation from the vacuum PV glazing is a little less than the single-pane PV glazing due to increased solar cell temperature. However, since the temperature coefficient of the thin-film a-Si solar cells is small, the PV conversion efficiency is not reduced significantly. The annual electricity generation from a-Si PV glazing with 12.0% transmittance is around 113.81 kWh per year. Among all orientations, it is better to install PV glazing on the south facade in order to maximize the electricity output in Hong Kong. And it is not recommended to apply PV glazing on north façade due to limited solar radiation available.
Based on the results above, the vacuum PV glazing not only has the best thermal performance among all types of widely used glazing, but also produces a considerable amount of electricity per year. It is recommended to install vacuum PV glazing on south facade to perform the best overall energy performance.
(2) Simulation of the whole building
Apart from modelling studies conducted under the hot and humid climate of Hong Kong, the annual energy performance of different types of glazing in a cold region (i.e. Beijing) was also simulated for comparison. Simulation results are shown in Figure 20 and Figure 21. It can be observed that the room using the vacuum PV glazing achieves the lowest cooling consumption in both climates. In Beijing, the consumed cooling energy with the vacuum PV glazing is much smaller and is 30.2%, 20.8%, 17.0%, 13.8%, 4.4% less than that of the room with other types of glazing. It can be concluded that the energy saving potential of the vacuum PV glazing is much larger in a cold climate while the electricity generation is much higher during the summer time of Beijing due to the smaller solar incidence angle.
The developed simulation model was further applied to a 20-floor prototype office building. Typical floors of the building are divided into 5 conditioned zones, with a total floor area of 540 m2 (as shown in Figure 22). The reference case – Model 1 keeps all windows as the commonly used double-pane clear glazing, while the design cases include Model 2 and Model 3. Model 2 keeps the north-facing window as the conventional double-pane glazing while changes windows orientated to the other three directions to the developed vacuum PV glazing. The opaque part of all building facades is assumed to be covered with traditional crystalline BIPV with a power conversion efficiency of 15% to maximize the power generation potential of the building envelope. Model 3 shares similar settings with Model 2, except that the window transparency is tuned to 20% with a crystalline silicon (c-Si) as shown in Figure 23. Table 5 shows detailed settings of window properties for the three models respectively. The U-value and SHGC of a-Si vacuum PV glazing are obtained from previous experiments and those of double-pane clear glazing are calculated by the simulation software WINDOW. Thermal and power generation properties of c-Si vacuum PV glazing are obtained from existing literatures.
The simulation results of the total heat gain and loss through all windows are presented in Figure 24 and Figure 25. The heat gain and loss both decrease sharply when traditional double-pane clear glazing is replaced by the PV vacuum glazing. The obvious differences between these three models can be identified from the figures. Compared with the performance of Model 1, the heat gain through windows of Model 2 and Model 3 drops up to 77.89% and 77.97% (south-facing windows), while the heat loss of the two models declines up to 79.28% and 79.32% (south-facing windows), respectively.
On the other side, based on the peak office hour electricity price of 1.4 CNY/kWh for cooling and 0.25 CNY/kWh for heating from the Beijing authority, the simple payback period (See Figure 28) when applying the product to the west, east, and south façade is calculated to be 3.8, 4.6 and 5.3 years compared to the single-pane PV glazing. The payback periods are increased to 4.5, 5.4 and 6.5 years when compared with double-pane PV glazing as shown in Figure 29.
As a result, the product can be considered as a cost-effective application in building facades when considering its tremendous saving of air-conditioning energy and corresponding annual expenses. In addition, the property developer could also benefit from a potential increment in renting rates and popularity, if the building gets certified under a green building scheme by claiming credits in CO2 reduction and renewable application assessment criteria. All the abovementioned potential benefits with the application of the vacuum PV glazing would attract more attention from the construction industry.
3.4 Brief technical guideline for the vacuum PV glazingDesigning the vacuum PV glazing (i.e. vacuum BIPV curtain wall) system is a more complex process than a standard added-on PV system. The architectural context, structural requirements, economic considerations and building regulation requirements should all be considered, so that this brief guidance mainly focuses on the below aspects: design strategy, environmental variables, multifunctionality, installation situation, electrical components, and economic aspects (Polysolar Limited, 2015).
(1) Design strategy
Architects, property developers and building users become more inclined to consider renewable and energy efficient applications to meet building and planning regulations due to rising energy bills and awareness of environmental sustainability. The combination of PV and vacuum glazing is an innovative and promising solution to meet these requirements in the new building developments or refurbishment projects. As proved in the above sections of this report, the developed product offers the added advantage of providing a return of investment from the building envelope. Architectural and structural factors, as well as economic considerations should be taken into account at an early stage in any building projects to integrate renewable systems through a more satisfactory approach.
(2) Environmental variables
When designing a BIPV system, a compromise must be reached between the requirements of energy yield optimisation and those of the architectural environment. Therefore, the orientation, lighting performance, shading and temperature are the four mainly concerned issues in BIPV design. According to simulation and experimental results presented in the above sections, the optimal orientation of the installed PV glazing should be south for maximizing the annual power generation, while cooling load reduction is more conspicuous when the product is applied on the west and east facades. Therefore, it is preferable to install the product on all three facades for an optimal overall building energy-saving performance. The visible light transmittance is only 12% in the developed prototype, which might cause slightly more lighting power consumption compared to traditional double-pane clear glazing. However, the transmittance can be easily adjusted to higher than 20% in the manufacture process depending on the effective area of PV materials. There will always be a trade-off between power generation and permeable light, whereas this research has proved that the combined power generation and cooling load reduction can be more than the increased lighting energy use. Power generation performance of the a-Si PV is less sensitive to shadings, so that the prototype is subject to less influence from peripheral shadings. However, if we change the PV material to c-Si for higher conversion efficiency, a shading calculation should be conducted before allocating the BIPV glazing. Lastly, the conversion efficiency of a-Si glazing is also less sensitive to the increase of the panel temperature. The temperature coefficient must be considered if changing the PV material to c-Si.
The vacuum PV glazing was made by sandwiching a layer of PVB between an external PV laminated glass with a visible light transmittance of 12% and an internal vacuum glass. A low-e coating was also adopted to enhance its thermal performance. The structure of the vacuum PV glazing is shown in Figure 5. The dimension of the vacuum PV glazing is 1300 mm (width) × 1100 mm (height) × 20.87 mm (thickness), thinner than commonly used PV double glazed insulating glass units. Figure 6 presents the pictures of the sample of vacuum PV glazing.
This section presents the main findings and outcomes of the research project and indicates their potential impacts on the local energy use and construction industry. Achievements of the specified research objectives are illustrated, and limitations of the project are also mentioned for the reference of future studies.
3.1 Design and production of the prototype productInitially, we proposed a prototype design as specified by Figure 2, where the vacuum layer was directly coupled with the laminated PV panel. However, during initial manufacture trials, the air pressure difference between internal and external spaces of the vacuum glass samples produced by the laminating machine caused the breakage of the vacuum glass samples. Then, we followed an alternative approach using pre-pressure furnace, whereas the molten state of the polyvinyl butyral (PVB) could not meet the expected requirements and the bubbles greatly impacted the appearance and performance of PV module. Finally, we proposed the current product design based on the experience acquired from previous failures (See Figure 5).
The electrical specifications of the vacuum PV glazing under standard test conditions (STC: air mass 1.5, solar irradiation 1000 W/m2 and cell temperature 25°C) are shown in Table 2. Table 3 presents the given thermal and optical properties of the PV laminated glass and vacuum glass, respectively.
(3) Multi-functionality
Due to their mechanical structures, the PV vacuum glazing can perform the functions of the building envelope in addition to generating emission-free energy, and can thus substitute for conventional construction windows or curtain walls. Apart from power generation and architectural function, the product can provide solar shading with its low SHGC value. It can also act as thermal and sound insulation due to its low U-value and acoustic resistance caused by the vacuum chamber between glazing layers. If applied with special coatings/films on top of PV glazing, it can also provide weather protection.
(4) Mounting system and installation
Based on specific requirements of each project in each region, safety, loading capacity and PV installation specifications can have a decisive impact on the method of fixing/mounting the vacuum. We have in this guide attempted to provide a range of options, highlighting what is possible in current design. The product can be installed with a linear mounting system as mullion-transom facades or structural sealant glazing. It can also be mounted with point-fixing systems including clamp fixings and undercut anchor fixings or mounted into standard curtain walling, rain screen cladding and window systems.
(5) Electrical system
In the curtain wall system, several PV glazing with standard size are usually connected together in a string to form the power generator. The generated direct current is usually fed to an inverter where the direct current is converted to alternating current. If on-site storage is not available, which is the common case in urban areas, the electrical power is registered via an electricity meter and connected to the public supply grid, which will require special permissions from the power grid companies (e.g. CLP in Hong Kong). Therefore, the application of the product will require a full set of electrical systems including cables and connections for parallel or series arrays, direct current load-break switches, inverters and generation meters.
(6) Economic considerations
The economic benefits of the product mainly lie in the following aspects: the substitute for original construction component, CO2 emission reduction and corresponding electricity fee waving, compliance with relevant building regulations (i.e. BEAM Plus in Hong Kong) and application of the feed-in-tariff policy (remuneration for electricity generation from PV).
temperature measurements were conducted through the centre of the vacuum PV sample to calculate the U-value. Secondly, the solar heat gains coefficient (SHGC) of the vacuum PV glazing sample was obtained and compared with three other advanced glazing types in an indoor solar irradiation test. Lastly, an outdoor test was conducted on the platform of Block Z in The Hong Kong Polytechnic University to evaluate the overall thermal performance of vacuum PV glazing. A conventional double clear pane glazing was used as a baseline in the outdoor test.
surfaces shows a similar trend in the three directions. Summing up electricity generation in all floors, the integrated PV modules in Model 2 and 3 can provide 285074.72 kWh/year and 355226.3 kWh/year, which accounts for 13.27% and 16.54% of the total building energy consumption of Model 1. Therefore, given the energy use reduction due to less external heat gain, using the vacuum BIPV glazing can save 27.74% (Model 3) electricity compared to a reference building.

01 Construction Industry Council
1.1 BackgroundAs a new functional curtain wall, the solar PV glazing has attracted a great deal of attention from the construction industry in recent years due to its novel integral function of power generation, decoration and simultaneously serving as building envelope materials. Briefly, it combines the PV and curtain wall technology, representing a new direction of the development and application in the future building industry. Integrated with solar cells, the curtain wall can convert sunlight into electricity and become an architectural solar power supply system. In this sense, the technology can provide electrical power for buildings from a renewable energy resource for the energy saving and CO2 (Carbon Dioxide) emission reduction. However, a shortcoming of the current PV curtain wall with common double-glazed PV modules lies in the poor thermal insulation performance due to the high solar heat gain coefficient (SHGC) and U-Value. It is reported that the BIPV module has a thermal conductivity of 1.1 W/mK, even after inert gas is used to fill the gap between the double-glazing units (Anatol, Francesco, & Nagel, 2011, October).
The vacuum glazing technology, which was initially proposed by Zoller in 1913 (Zoller, 1924), could minimize conductive and convective heat transfer through the glazing unit by introducing a vacuum chamber in it. The schematic diagram of a vacuum glazing is shown in Figure 1. Compared with a normal double glazing, the vacuum glazing exhibits superior heat insulation performance, which is identified by its U-values. The U-value of the vacuum glazing is about 0.86 W/m2K, which is much lower than that of a double-glazing (Griffiths et al., 1998). Therefore, if the vacuum glazing could be applied in solar PV curtain walls in buildings, the heat gain and heat loss could be further reduced. Moreover, due to its vacuum environment, the vacuum glazing has excellent sound insulation performance, which is also significant for its application to buildings in urban areas.
Based on the above discussion and our previous study on PV curtain wall application in Hong Kong (Wang et al., 2016; Zhang, Lu, & Chen, 2017; Zhang, Lu, Peng, & Song, 2016), we would like to propose in this project a novel energy-saving vacuum PV glazing, which combines the current photovoltaic curtain wall and vacuum glazing techniques. A schematic configuration diagram of the proposed vacuum BIPV curtain wall is shown in Figure 2. A systematic study is carried out on the overall energy performance of the developed curtain wall, and its application potential is evaluated for applications in Hong Kong. It is expected that the developed vacuum BIPV curtain wall technology will substantially reduce the heat gain and heat loss of buildings, and the research outputs will provide valuable information and theoretical basis for developing energy-saving solar PV curtain walls in the future for the local industry.
1.2 Aims and ObjectivesThe aims and objectives of the project mainly include:
(1) The vacuum BIPV curtain wall technology will be developed in detail. A small scale demonstration prototype of the proposed vacuum BIPV curtain wall will be set up to investigate the overall energy performance, including power generation and thermal performance under real environmental conditions in Hong Kong. The outdoor test campaign will be lasting for at least two sunny days to assess its annual energy performance.
(2) A comparative experimental study will be conducted to compare the overall energy performance of the vacuum BIPV curtain wall with other advanced window or facade technologies. The annual energy-saving potential of the proposed vacuum BIPV curtain wall will be explored.
(3) To develop a comprehensive simulation model, which combines heat transfer model and power generation model to accurately simulate the dynamic power output and thermal performance of the novel vacuum BIPV curtain wall.
(4) The energy-saving potential as well as economic benefits of applying the vacuum PV curtain wall to high-rise commercial buildings will be explored in comparison with commonly adopted window and facade technologies.
(5) Based on the experimental and simulation results, an optimized vacuum BIPV curtain wall design will be proposed to maximize its overall energy performance, and a comprehensive technical guideline will be proposed for further promotion in local construction industry.
INTRODUCTION1
The comparison of building energy between Model 1, Model 2 and Model 3 is summarized in Table 6, which includes energy use of lighting, equipment, district cooling and district heating. Although Model 2 and Model 3 consume slightly more lighting energy due to the reduced visible transmittance of the PV glazing, the great energy saving in cooling and heating leads to the net reduction in the total building energy consumption. The total energy consumption of the Model 2 and 3 declines by 20.77 and 22.37 kWh/m2, accounting for 10.44% and 11.20% of Model 1 respectively. Generated electricity of windows and walls in three directions is also presented in Table 7. The south window produced the most electricity, 1527.13 kWh for Model 2 and 3203.76 kWh for Model 3 in a year, taking up nearly 47.80% the total electricity generated by windows. As for the west window, the electricity generated in a year is close to that of east window. Electricity generated by wall
1.3 ScopeA brief description of the R&D scopes and the relevant timeframe are specified as below:
(1) Delivery of a sample of the developed vacuum PV module. An outdoor test bed was built to measure the thermal and power performance of the proposed vacuum BIPV curtain wall under the real environmental conditions.
(2) A comprehensive program combining the heat transfer and PV power model was developed to accurately simulate the electricity generation and indoor thermal performance. Annual building simulations were conducted to estimate the overall energy performance of the vacuum BIPV curtain wall facing different directions and under different weather conditions.
(3) Indoor tests under the solar simulator were conducted to compare the thermal and power performance of the developed product with other advanced window technologies. The simulation program is further improved to comprehensively evaluate the application potential of this curtain wall to high-rise commercial buildings in Hong Kong. A cost effectiveness analysis and technical guideline of the product were delivered as well.
3.2 Experimental study of the vacuum PV glazingOutdoor experimental test was first conducted on the developed prototype vacuum PV (VPV) glazing with the standard size (1.1m × 1.3m), whose various parameters including the ambient air temperature, incident solar irradiation, surface temperatures of the vacuum PV glazing as well as the I-V curves and the power generation were measured and recorded. The power generation and thermal performances of the prototype were also analysed during the test. To further justify the advantage of the vacuum PV glazing, experimental studies were carried out to compare the thermal performance of scaled-down samples (0.3m × 0.3m) with other advanced windows.
(1) Energy performance of the prototypeIn order to evaluate the energy performance of the vacuum PV glazing, an outdoor field measurement was conducted on the platform of Block Z in The Hong Kong Polytechnic University. The vacuum PV glazing was set up horizontally 0.4m above the floor on stilts so that the external temperatures of both sides of the vacuum PV glazing were approximately equal. Various parameters were measured during this test, including the ambient air temperature, the exterior and transmitted horizontal incident solar irradiation, the outer and inner surface temperatures of the vacuum PV glazing as well as the I-V curves and the power generation from the vacuum PV glazing. All the data was logged at an interval of 1 minute. Power generation and thermal performances of the vacuum PV glazing were analyzed based on the outdoor tests. Figure 7 shows the exterior and transmitted incident solar irradiation. It can be seen that the average solar irradiation transmittance during the period is approximately 0.08. Such low transmittance means that vast majority of solar irradiation is blocked by the vacuum PV glazing. Figure 8 presents the outer and inner surface temperature of the vacuum PV glazing. It can be seen that the outer surface temperature is much higher than the inner surface temperature at daytime. The maximum outer surface temperature is 75.3°C, 30°C higher than the inner surface temperature, which indicates that most of the waste heat is dissipated from the outside surface of the vacuum PV glazing, and the heat transfer to the inside space by convection is mitigated. Thus, compared with the conventional single-glazed PV glazing, the structure of the vacuum PV glazing can help reduce the cooling load and improve the indoor thermal comfort.
Then the vacuum PV glazing was mounted on the front side of an experimental test chamber as shown in Figure 9. Clear glass was also adopted in this study for comparison. Figure 10 presents the instantaneous power output of the vacuum PV glazing in 2 sunny days. It can be seen that the power generation from the vacuum PV glazing is consistent with incident solar radiation. A comparative study in terms of internal air temperature of the chamber between the vacuum PV glazing and the clear glass was conducted in a day of June.
As shown in Figure 11, the internal air temperature in the chamber with the vacuum PV glazing is much lower than that with a clear glass. The measured average and maximum internal air temperature for the vacuum PV glazing is 39.6°C and 40.3°C, respectively, while the corresponding average and maximum internal air temperature of the clear glass are 43.6°C and 44.7°C. The maximum internal air temperature difference between the vacuum PV glazing and the clear glass is 4.4°C, occurring in the morning. There are three temperature peaks of internal air temperature. Since the ambient temperature was relatively stable, the main heat gain of the internal air temperature was from incident solar irradiation. The internal air temperature for vacuum PV glazing is much more stable compared with that for the clear glass. The reason is that the vacuum PV glazing has better heat insulation performance so that the internal air temperature is not affected by the external environment significantly. It can also be seen in this figure that the internal air temperature of the chamber drops continuously at 15:00, which shows that the incident solar irradiation on the façade decreases so that the heat gains of the internal air from the sun also drops.
(2) Comparison with other advanced windows
To further justify the advantage of the vacuum PV glazing, experimental studies were carried out to compare it with other advanced windows. Samples of different types of glazing were mounted on the top of two hotboxes (i.e. test rigs) with the uniform dimension of 300 mm (L) × 300 mm (W) × 450mm (H) to implement both indoor and outdoor tests. Firstly, a co-heating test methodology was adopted for the thermal analysis of the vacuum PV glazing. The test rig was filled with the ice-water mixture to ensure the temperature difference between the inside and outside glazing surfaces larger than 5°C. Heat flux and
Figure 12 shows the internal and external temperatures of the vacuum PV glazing sample. The presented data were selected after the hotbox achieved the steady-state condition, when the temperature difference was around 8°C. Heat flux though the glazing sample and the U-value were then determined as illustrated in Figure 13. The average heat flux from the vacuum glazing was measured to be 15.4 W/m2. And the average U-value was calculated as 1.5 W/m2 × K which is much lower than a regular double pane window with the U-value of 2.5W/m2 × K. Considering the edge heat transfer which would strongly affect the heat flux measurement when the sample is small, it can be expected that the centre U-valve of the vacuum PV glazing should be lower than 1.5 W/m2 × K for a larger scale application (e.g. 1.1m × 1.3m).
(3) Cost effective analysis based on simulation
To address the economic benefits of the developed product, the simple payback period of the vacuum PV glazing is calculated with reference to available PV glazing on the market in both Hong Kong and Beijing’s scenarios.
Based on an average electricity price of 1.25 HKD/kWh from HK Electric, the simple payback period (See Figure 26) when applying the product to the west and east façade is calculated to be 7.5 and 8.0 years compared to the single-pane PV glazing. The payback periods are increased to 8.6 and 8.8 years when compared with double-pane PV glazing as shown in Figure 27. However, when applied to the south façade, the extra initial cost of the product cannot be recovered within 10 years.
The solar simulator in the laboratory can provide relatively steady horizontal incident solar irradiation, so that test rigs were located at the same spot to ensure each window sample exposed to the same radiation level. As shown in Figure 14, SHGCs of the vacuum PV glazing and double-pane PV glazing are much smaller than those of the vacuum glazing and double clear glazing, because the coupled PV module can absorb most of the solar irradiation. The vacuum PV glazing has the lowest SHGC of 0.10 which can act as the excellent thermal insulation.
The outdoor test lasted four days from September 26th to September 30th. As shown in Figure 15, September 26th, 27th and 30th were cloudy days and September 28th could be considered as a sunny day. It can be found that the vacuum PV glazing blocks most solar irradiation compared with the double-pane glazing. Figure 16 presents the temperature profile of the vacuum PV glazing and double-pane glazing in the sunny day. The internal surface temperature of both glazing was much higher than the ambient temperature when the outside incident solar radiation is strong. The internal glazing surface and air temperatures of the test rig with the vacuum PV glazing are lower than those of the test rig with the double-pane glazing. The difference between the internal air temperatures of test rigs is much smaller than that of internal glazing surface temperatures. Therefore, the application of vacuum PV glazing can achieve better indoor environment by reducing the solar heat gain.
3.3 Simulation study of the vacuum PV glazing(1) Simulation of a generic building model
Although a series of field tests have been conducted in the outdoor test bed to study the power and thermal performances of the vacuum BIPV glazing, the experimental scenarios are impossible to represent all the situations and variables. Thus, the numerical study was conducted to comprehensively investigate and compare the energy performance of the vacuum PV glazing and other commonly used energy-efficient glazing. As detailed in the research methodology, a comprehensive simulation model based on EnergyPlus and WINDOW has been developed to simulate the overall energy performance of different windows taking into account of their thermal and power output performance. This model is used to simulate the overall energy performance of the vacuum BIPV curtain wall in comparison with other commonly used windows. The key properties of different types of glazing are shown in Table 4 and the electrical specifications of the PV glazing under standard test conditions are referenced to Table 2.
In order to simulate the annual thermal performance and power performance of these types of glazing in Hong Kong for comparison purpose, a typical office room model has been created for simulation, as shown in Figure 17. The dimension of the office model was 2.5m × 2.3m × 2.5m (L × W × H). This room has only one external wall with three identical windows exposed to the outdoor environment. Simulations were conducted for different orientations, i.e. south (S), east (E), west (W) and north (N). A heat transfer model and PV performance model in EnergyPlus are adopted to investigate
the thermal and power performance of different glazing. The heat transfer model is used to calculate the cooling loads of the office room. The cooling loads are then converted to electricity use of air-conditioning system with a presumed coefficient of performance (COP) of 2.78. The equivalent one-diode model is selected to simulate the annual electricity generation from PV elements. The typical meteorological year (TMY) in Hong Kong is selected a reasonable representation of local climates.
The annual cooling electricity use of different types of glazing in different orientations in Hong Kong are shown in Figure 18. It can be observed that the room using vacuum PV glazing consumes the least cooling electricity for all orientations. The south facing room with vacuum PV glazing consumes about 705.56 kWh per year, which was approximately 14.2%, 9.8%, 8.4%, 7.1% and 4.1% less than the corresponding room with single-pane clear glazing, double-pane clear glazing, vacuum glazing, single-pane PV glazing and double-pane PV glazing, respectively. This is because the vacuum PV glazing have the lowest U-value and SHGC among all types of glazing, as shown in Table 4.3. A lower U-value indicates a higher level of heat insulation performance of the glazing, and a lower SHGC means less solar radiation will pass through the windows. Therefore, the vacuum PV glazing performs the best in the area with big temperature difference between indoor and outdoor environment. In addition, the most cooling electricity use of the office room occurs at the west orientation, followed by east, south and north. Therefore, east and west facing windows should have better solar heat insulation performance, to reduce heat gains from outside environment.
In addition to reduce the cooling load of the office room, the PV glazing can also generate electricity in situ. The annual electricity generation of the three types of PV glazing are shown in Figure 19. It can be seen that the annual electricity generation of the three types of PV glazing is similar to each other. The electricity generation from the vacuum PV glazing is a little less than the single-pane PV glazing due to increased solar cell temperature. However, since the temperature coefficient of the thin-film a-Si solar cells is small, the PV conversion efficiency is not reduced significantly. The annual electricity generation from a-Si PV glazing with 12.0% transmittance is around 113.81 kWh per year. Among all orientations, it is better to install PV glazing on the south facade in order to maximize the electricity output in Hong Kong. And it is not recommended to apply PV glazing on north façade due to limited solar radiation available.
Based on the results above, the vacuum PV glazing not only has the best thermal performance among all types of widely used glazing, but also produces a considerable amount of electricity per year. It is recommended to install vacuum PV glazing on south facade to perform the best overall energy performance.
(2) Simulation of the whole building
Apart from modelling studies conducted under the hot and humid climate of Hong Kong, the annual energy performance of different types of glazing in a cold region (i.e. Beijing) was also simulated for comparison. Simulation results are shown in Figure 20 and Figure 21. It can be observed that the room using the vacuum PV glazing achieves the lowest cooling consumption in both climates. In Beijing, the consumed cooling energy with the vacuum PV glazing is much smaller and is 30.2%, 20.8%, 17.0%, 13.8%, 4.4% less than that of the room with other types of glazing. It can be concluded that the energy saving potential of the vacuum PV glazing is much larger in a cold climate while the electricity generation is much higher during the summer time of Beijing due to the smaller solar incidence angle.
The developed simulation model was further applied to a 20-floor prototype office building. Typical floors of the building are divided into 5 conditioned zones, with a total floor area of 540 m2 (as shown in Figure 22). The reference case – Model 1 keeps all windows as the commonly used double-pane clear glazing, while the design cases include Model 2 and Model 3. Model 2 keeps the north-facing window as the conventional double-pane glazing while changes windows orientated to the other three directions to the developed vacuum PV glazing. The opaque part of all building facades is assumed to be covered with traditional crystalline BIPV with a power conversion efficiency of 15% to maximize the power generation potential of the building envelope. Model 3 shares similar settings with Model 2, except that the window transparency is tuned to 20% with a crystalline silicon (c-Si) as shown in Figure 23. Table 5 shows detailed settings of window properties for the three models respectively. The U-value and SHGC of a-Si vacuum PV glazing are obtained from previous experiments and those of double-pane clear glazing are calculated by the simulation software WINDOW. Thermal and power generation properties of c-Si vacuum PV glazing are obtained from existing literatures.
The simulation results of the total heat gain and loss through all windows are presented in Figure 24 and Figure 25. The heat gain and loss both decrease sharply when traditional double-pane clear glazing is replaced by the PV vacuum glazing. The obvious differences between these three models can be identified from the figures. Compared with the performance of Model 1, the heat gain through windows of Model 2 and Model 3 drops up to 77.89% and 77.97% (south-facing windows), while the heat loss of the two models declines up to 79.28% and 79.32% (south-facing windows), respectively.
On the other side, based on the peak office hour electricity price of 1.4 CNY/kWh for cooling and 0.25 CNY/kWh for heating from the Beijing authority, the simple payback period (See Figure 28) when applying the product to the west, east, and south façade is calculated to be 3.8, 4.6 and 5.3 years compared to the single-pane PV glazing. The payback periods are increased to 4.5, 5.4 and 6.5 years when compared with double-pane PV glazing as shown in Figure 29.
As a result, the product can be considered as a cost-effective application in building facades when considering its tremendous saving of air-conditioning energy and corresponding annual expenses. In addition, the property developer could also benefit from a potential increment in renting rates and popularity, if the building gets certified under a green building scheme by claiming credits in CO2 reduction and renewable application assessment criteria. All the abovementioned potential benefits with the application of the vacuum PV glazing would attract more attention from the construction industry.
3.4 Brief technical guideline for the vacuum PV glazingDesigning the vacuum PV glazing (i.e. vacuum BIPV curtain wall) system is a more complex process than a standard added-on PV system. The architectural context, structural requirements, economic considerations and building regulation requirements should all be considered, so that this brief guidance mainly focuses on the below aspects: design strategy, environmental variables, multifunctionality, installation situation, electrical components, and economic aspects (Polysolar Limited, 2015).
(1) Design strategy
Architects, property developers and building users become more inclined to consider renewable and energy efficient applications to meet building and planning regulations due to rising energy bills and awareness of environmental sustainability. The combination of PV and vacuum glazing is an innovative and promising solution to meet these requirements in the new building developments or refurbishment projects. As proved in the above sections of this report, the developed product offers the added advantage of providing a return of investment from the building envelope. Architectural and structural factors, as well as economic considerations should be taken into account at an early stage in any building projects to integrate renewable systems through a more satisfactory approach.
(2) Environmental variables
When designing a BIPV system, a compromise must be reached between the requirements of energy yield optimisation and those of the architectural environment. Therefore, the orientation, lighting performance, shading and temperature are the four mainly concerned issues in BIPV design. According to simulation and experimental results presented in the above sections, the optimal orientation of the installed PV glazing should be south for maximizing the annual power generation, while cooling load reduction is more conspicuous when the product is applied on the west and east facades. Therefore, it is preferable to install the product on all three facades for an optimal overall building energy-saving performance. The visible light transmittance is only 12% in the developed prototype, which might cause slightly more lighting power consumption compared to traditional double-pane clear glazing. However, the transmittance can be easily adjusted to higher than 20% in the manufacture process depending on the effective area of PV materials. There will always be a trade-off between power generation and permeable light, whereas this research has proved that the combined power generation and cooling load reduction can be more than the increased lighting energy use. Power generation performance of the a-Si PV is less sensitive to shadings, so that the prototype is subject to less influence from peripheral shadings. However, if we change the PV material to c-Si for higher conversion efficiency, a shading calculation should be conducted before allocating the BIPV glazing. Lastly, the conversion efficiency of a-Si glazing is also less sensitive to the increase of the panel temperature. The temperature coefficient must be considered if changing the PV material to c-Si.
The vacuum PV glazing was made by sandwiching a layer of PVB between an external PV laminated glass with a visible light transmittance of 12% and an internal vacuum glass. A low-e coating was also adopted to enhance its thermal performance. The structure of the vacuum PV glazing is shown in Figure 5. The dimension of the vacuum PV glazing is 1300 mm (width) × 1100 mm (height) × 20.87 mm (thickness), thinner than commonly used PV double glazed insulating glass units. Figure 6 presents the pictures of the sample of vacuum PV glazing.
This section presents the main findings and outcomes of the research project and indicates their potential impacts on the local energy use and construction industry. Achievements of the specified research objectives are illustrated, and limitations of the project are also mentioned for the reference of future studies.
3.1 Design and production of the prototype productInitially, we proposed a prototype design as specified by Figure 2, where the vacuum layer was directly coupled with the laminated PV panel. However, during initial manufacture trials, the air pressure difference between internal and external spaces of the vacuum glass samples produced by the laminating machine caused the breakage of the vacuum glass samples. Then, we followed an alternative approach using pre-pressure furnace, whereas the molten state of the polyvinyl butyral (PVB) could not meet the expected requirements and the bubbles greatly impacted the appearance and performance of PV module. Finally, we proposed the current product design based on the experience acquired from previous failures (See Figure 5).
The electrical specifications of the vacuum PV glazing under standard test conditions (STC: air mass 1.5, solar irradiation 1000 W/m2 and cell temperature 25°C) are shown in Table 2. Table 3 presents the given thermal and optical properties of the PV laminated glass and vacuum glass, respectively.
(3) Multi-functionality
Due to their mechanical structures, the PV vacuum glazing can perform the functions of the building envelope in addition to generating emission-free energy, and can thus substitute for conventional construction windows or curtain walls. Apart from power generation and architectural function, the product can provide solar shading with its low SHGC value. It can also act as thermal and sound insulation due to its low U-value and acoustic resistance caused by the vacuum chamber between glazing layers. If applied with special coatings/films on top of PV glazing, it can also provide weather protection.
(4) Mounting system and installation
Based on specific requirements of each project in each region, safety, loading capacity and PV installation specifications can have a decisive impact on the method of fixing/mounting the vacuum. We have in this guide attempted to provide a range of options, highlighting what is possible in current design. The product can be installed with a linear mounting system as mullion-transom facades or structural sealant glazing. It can also be mounted with point-fixing systems including clamp fixings and undercut anchor fixings or mounted into standard curtain walling, rain screen cladding and window systems.
(5) Electrical system
In the curtain wall system, several PV glazing with standard size are usually connected together in a string to form the power generator. The generated direct current is usually fed to an inverter where the direct current is converted to alternating current. If on-site storage is not available, which is the common case in urban areas, the electrical power is registered via an electricity meter and connected to the public supply grid, which will require special permissions from the power grid companies (e.g. CLP in Hong Kong). Therefore, the application of the product will require a full set of electrical systems including cables and connections for parallel or series arrays, direct current load-break switches, inverters and generation meters.
(6) Economic considerations
The economic benefits of the product mainly lie in the following aspects: the substitute for original construction component, CO2 emission reduction and corresponding electricity fee waving, compliance with relevant building regulations (i.e. BEAM Plus in Hong Kong) and application of the feed-in-tariff policy (remuneration for electricity generation from PV).
temperature measurements were conducted through the centre of the vacuum PV sample to calculate the U-value. Secondly, the solar heat gains coefficient (SHGC) of the vacuum PV glazing sample was obtained and compared with three other advanced glazing types in an indoor solar irradiation test. Lastly, an outdoor test was conducted on the platform of Block Z in The Hong Kong Polytechnic University to evaluate the overall thermal performance of vacuum PV glazing. A conventional double clear pane glazing was used as a baseline in the outdoor test.
surfaces shows a similar trend in the three directions. Summing up electricity generation in all floors, the integrated PV modules in Model 2 and 3 can provide 285074.72 kWh/year and 355226.3 kWh/year, which accounts for 13.27% and 16.54% of the total building energy consumption of Model 1. Therefore, given the energy use reduction due to less external heat gain, using the vacuum BIPV glazing can save 27.74% (Model 3) electricity compared to a reference building.

02Investigation on the Thermal and Power Performance of Vacuum BIPV Curtain Wall Technology and its Application Potential in Buildings in Hong Kong
1.1 BackgroundAs a new functional curtain wall, the solar PV glazing has attracted a great deal of attention from the construction industry in recent years due to its novel integral function of power generation, decoration and simultaneously serving as building envelope materials. Briefly, it combines the PV and curtain wall technology, representing a new direction of the development and application in the future building industry. Integrated with solar cells, the curtain wall can convert sunlight into electricity and become an architectural solar power supply system. In this sense, the technology can provide electrical power for buildings from a renewable energy resource for the energy saving and CO2 (Carbon Dioxide) emission reduction. However, a shortcoming of the current PV curtain wall with common double-glazed PV modules lies in the poor thermal insulation performance due to the high solar heat gain coefficient (SHGC) and U-Value. It is reported that the BIPV module has a thermal conductivity of 1.1 W/mK, even after inert gas is used to fill the gap between the double-glazing units (Anatol, Francesco, & Nagel, 2011, October).
The vacuum glazing technology, which was initially proposed by Zoller in 1913 (Zoller, 1924), could minimize conductive and convective heat transfer through the glazing unit by introducing a vacuum chamber in it. The schematic diagram of a vacuum glazing is shown in Figure 1. Compared with a normal double glazing, the vacuum glazing exhibits superior heat insulation performance, which is identified by its U-values. The U-value of the vacuum glazing is about 0.86 W/m2K, which is much lower than that of a double-glazing (Griffiths et al., 1998). Therefore, if the vacuum glazing could be applied in solar PV curtain walls in buildings, the heat gain and heat loss could be further reduced. Moreover, due to its vacuum environment, the vacuum glazing has excellent sound insulation performance, which is also significant for its application to buildings in urban areas.
Based on the above discussion and our previous study on PV curtain wall application in Hong Kong (Wang et al., 2016; Zhang, Lu, & Chen, 2017; Zhang, Lu, Peng, & Song, 2016), we would like to propose in this project a novel energy-saving vacuum PV glazing, which combines the current photovoltaic curtain wall and vacuum glazing techniques. A schematic configuration diagram of the proposed vacuum BIPV curtain wall is shown in Figure 2. A systematic study is carried out on the overall energy performance of the developed curtain wall, and its application potential is evaluated for applications in Hong Kong. It is expected that the developed vacuum BIPV curtain wall technology will substantially reduce the heat gain and heat loss of buildings, and the research outputs will provide valuable information and theoretical basis for developing energy-saving solar PV curtain walls in the future for the local industry.
1.2 Aims and ObjectivesThe aims and objectives of the project mainly include:
(1) The vacuum BIPV curtain wall technology will be developed in detail. A small scale demonstration prototype of the proposed vacuum BIPV curtain wall will be set up to investigate the overall energy performance, including power generation and thermal performance under real environmental conditions in Hong Kong. The outdoor test campaign will be lasting for at least two sunny days to assess its annual energy performance.
(2) A comparative experimental study will be conducted to compare the overall energy performance of the vacuum BIPV curtain wall with other advanced window or facade technologies. The annual energy-saving potential of the proposed vacuum BIPV curtain wall will be explored.
(3) To develop a comprehensive simulation model, which combines heat transfer model and power generation model to accurately simulate the dynamic power output and thermal performance of the novel vacuum BIPV curtain wall.
(4) The energy-saving potential as well as economic benefits of applying the vacuum PV curtain wall to high-rise commercial buildings will be explored in comparison with commonly adopted window and facade technologies.
(5) Based on the experimental and simulation results, an optimized vacuum BIPV curtain wall design will be proposed to maximize its overall energy performance, and a comprehensive technical guideline will be proposed for further promotion in local construction industry.
The comparison of building energy between Model 1, Model 2 and Model 3 is summarized in Table 6, which includes energy use of lighting, equipment, district cooling and district heating. Although Model 2 and Model 3 consume slightly more lighting energy due to the reduced visible transmittance of the PV glazing, the great energy saving in cooling and heating leads to the net reduction in the total building energy consumption. The total energy consumption of the Model 2 and 3 declines by 20.77 and 22.37 kWh/m2, accounting for 10.44% and 11.20% of Model 1 respectively. Generated electricity of windows and walls in three directions is also presented in Table 7. The south window produced the most electricity, 1527.13 kWh for Model 2 and 3203.76 kWh for Model 3 in a year, taking up nearly 47.80% the total electricity generated by windows. As for the west window, the electricity generated in a year is close to that of east window. Electricity generated by wall
1.3 ScopeA brief description of the R&D scopes and the relevant timeframe are specified as below:
(1) Delivery of a sample of the developed vacuum PV module. An outdoor test bed was built to measure the thermal and power performance of the proposed vacuum BIPV curtain wall under the real environmental conditions.
(2) A comprehensive program combining the heat transfer and PV power model was developed to accurately simulate the electricity generation and indoor thermal performance. Annual building simulations were conducted to estimate the overall energy performance of the vacuum BIPV curtain wall facing different directions and under different weather conditions.
(3) Indoor tests under the solar simulator were conducted to compare the thermal and power performance of the developed product with other advanced window technologies. The simulation program is further improved to comprehensively evaluate the application potential of this curtain wall to high-rise commercial buildings in Hong Kong. A cost effectiveness analysis and technical guideline of the product were delivered as well.
3.2 Experimental study of the vacuum PV glazingOutdoor experimental test was first conducted on the developed prototype vacuum PV (VPV) glazing with the standard size (1.1m × 1.3m), whose various parameters including the ambient air temperature, incident solar irradiation, surface temperatures of the vacuum PV glazing as well as the I-V curves and the power generation were measured and recorded. The power generation and thermal performances of the prototype were also analysed during the test. To further justify the advantage of the vacuum PV glazing, experimental studies were carried out to compare the thermal performance of scaled-down samples (0.3m × 0.3m) with other advanced windows.
(1) Energy performance of the prototypeIn order to evaluate the energy performance of the vacuum PV glazing, an outdoor field measurement was conducted on the platform of Block Z in The Hong Kong Polytechnic University. The vacuum PV glazing was set up horizontally 0.4m above the floor on stilts so that the external temperatures of both sides of the vacuum PV glazing were approximately equal. Various parameters were measured during this test, including the ambient air temperature, the exterior and transmitted horizontal incident solar irradiation, the outer and inner surface temperatures of the vacuum PV glazing as well as the I-V curves and the power generation from the vacuum PV glazing. All the data was logged at an interval of 1 minute. Power generation and thermal performances of the vacuum PV glazing were analyzed based on the outdoor tests. Figure 7 shows the exterior and transmitted incident solar irradiation. It can be seen that the average solar irradiation transmittance during the period is approximately 0.08. Such low transmittance means that vast majority of solar irradiation is blocked by the vacuum PV glazing. Figure 8 presents the outer and inner surface temperature of the vacuum PV glazing. It can be seen that the outer surface temperature is much higher than the inner surface temperature at daytime. The maximum outer surface temperature is 75.3°C, 30°C higher than the inner surface temperature, which indicates that most of the waste heat is dissipated from the outside surface of the vacuum PV glazing, and the heat transfer to the inside space by convection is mitigated. Thus, compared with the conventional single-glazed PV glazing, the structure of the vacuum PV glazing can help reduce the cooling load and improve the indoor thermal comfort.
Then the vacuum PV glazing was mounted on the front side of an experimental test chamber as shown in Figure 9. Clear glass was also adopted in this study for comparison. Figure 10 presents the instantaneous power output of the vacuum PV glazing in 2 sunny days. It can be seen that the power generation from the vacuum PV glazing is consistent with incident solar radiation. A comparative study in terms of internal air temperature of the chamber between the vacuum PV glazing and the clear glass was conducted in a day of June.
As shown in Figure 11, the internal air temperature in the chamber with the vacuum PV glazing is much lower than that with a clear glass. The measured average and maximum internal air temperature for the vacuum PV glazing is 39.6°C and 40.3°C, respectively, while the corresponding average and maximum internal air temperature of the clear glass are 43.6°C and 44.7°C. The maximum internal air temperature difference between the vacuum PV glazing and the clear glass is 4.4°C, occurring in the morning. There are three temperature peaks of internal air temperature. Since the ambient temperature was relatively stable, the main heat gain of the internal air temperature was from incident solar irradiation. The internal air temperature for vacuum PV glazing is much more stable compared with that for the clear glass. The reason is that the vacuum PV glazing has better heat insulation performance so that the internal air temperature is not affected by the external environment significantly. It can also be seen in this figure that the internal air temperature of the chamber drops continuously at 15:00, which shows that the incident solar irradiation on the façade decreases so that the heat gains of the internal air from the sun also drops.
(2) Comparison with other advanced windows
To further justify the advantage of the vacuum PV glazing, experimental studies were carried out to compare it with other advanced windows. Samples of different types of glazing were mounted on the top of two hotboxes (i.e. test rigs) with the uniform dimension of 300 mm (L) × 300 mm (W) × 450mm (H) to implement both indoor and outdoor tests. Firstly, a co-heating test methodology was adopted for the thermal analysis of the vacuum PV glazing. The test rig was filled with the ice-water mixture to ensure the temperature difference between the inside and outside glazing surfaces larger than 5°C. Heat flux and
Figure 12 shows the internal and external temperatures of the vacuum PV glazing sample. The presented data were selected after the hotbox achieved the steady-state condition, when the temperature difference was around 8°C. Heat flux though the glazing sample and the U-value were then determined as illustrated in Figure 13. The average heat flux from the vacuum glazing was measured to be 15.4 W/m2. And the average U-value was calculated as 1.5 W/m2 × K which is much lower than a regular double pane window with the U-value of 2.5W/m2 × K. Considering the edge heat transfer which would strongly affect the heat flux measurement when the sample is small, it can be expected that the centre U-valve of the vacuum PV glazing should be lower than 1.5 W/m2 × K for a larger scale application (e.g. 1.1m × 1.3m).
(3) Cost effective analysis based on simulation
To address the economic benefits of the developed product, the simple payback period of the vacuum PV glazing is calculated with reference to available PV glazing on the market in both Hong Kong and Beijing’s scenarios.
Based on an average electricity price of 1.25 HKD/kWh from HK Electric, the simple payback period (See Figure 26) when applying the product to the west and east façade is calculated to be 7.5 and 8.0 years compared to the single-pane PV glazing. The payback periods are increased to 8.6 and 8.8 years when compared with double-pane PV glazing as shown in Figure 27. However, when applied to the south façade, the extra initial cost of the product cannot be recovered within 10 years.
The solar simulator in the laboratory can provide relatively steady horizontal incident solar irradiation, so that test rigs were located at the same spot to ensure each window sample exposed to the same radiation level. As shown in Figure 14, SHGCs of the vacuum PV glazing and double-pane PV glazing are much smaller than those of the vacuum glazing and double clear glazing, because the coupled PV module can absorb most of the solar irradiation. The vacuum PV glazing has the lowest SHGC of 0.10 which can act as the excellent thermal insulation.
The outdoor test lasted four days from September 26th to September 30th. As shown in Figure 15, September 26th, 27th and 30th were cloudy days and September 28th could be considered as a sunny day. It can be found that the vacuum PV glazing blocks most solar irradiation compared with the double-pane glazing. Figure 16 presents the temperature profile of the vacuum PV glazing and double-pane glazing in the sunny day. The internal surface temperature of both glazing was much higher than the ambient temperature when the outside incident solar radiation is strong. The internal glazing surface and air temperatures of the test rig with the vacuum PV glazing are lower than those of the test rig with the double-pane glazing. The difference between the internal air temperatures of test rigs is much smaller than that of internal glazing surface temperatures. Therefore, the application of vacuum PV glazing can achieve better indoor environment by reducing the solar heat gain.
3.3 Simulation study of the vacuum PV glazing(1) Simulation of a generic building model
Although a series of field tests have been conducted in the outdoor test bed to study the power and thermal performances of the vacuum BIPV glazing, the experimental scenarios are impossible to represent all the situations and variables. Thus, the numerical study was conducted to comprehensively investigate and compare the energy performance of the vacuum PV glazing and other commonly used energy-efficient glazing. As detailed in the research methodology, a comprehensive simulation model based on EnergyPlus and WINDOW has been developed to simulate the overall energy performance of different windows taking into account of their thermal and power output performance. This model is used to simulate the overall energy performance of the vacuum BIPV curtain wall in comparison with other commonly used windows. The key properties of different types of glazing are shown in Table 4 and the electrical specifications of the PV glazing under standard test conditions are referenced to Table 2.
In order to simulate the annual thermal performance and power performance of these types of glazing in Hong Kong for comparison purpose, a typical office room model has been created for simulation, as shown in Figure 17. The dimension of the office model was 2.5m × 2.3m × 2.5m (L × W × H). This room has only one external wall with three identical windows exposed to the outdoor environment. Simulations were conducted for different orientations, i.e. south (S), east (E), west (W) and north (N). A heat transfer model and PV performance model in EnergyPlus are adopted to investigate
the thermal and power performance of different glazing. The heat transfer model is used to calculate the cooling loads of the office room. The cooling loads are then converted to electricity use of air-conditioning system with a presumed coefficient of performance (COP) of 2.78. The equivalent one-diode model is selected to simulate the annual electricity generation from PV elements. The typical meteorological year (TMY) in Hong Kong is selected a reasonable representation of local climates.
The annual cooling electricity use of different types of glazing in different orientations in Hong Kong are shown in Figure 18. It can be observed that the room using vacuum PV glazing consumes the least cooling electricity for all orientations. The south facing room with vacuum PV glazing consumes about 705.56 kWh per year, which was approximately 14.2%, 9.8%, 8.4%, 7.1% and 4.1% less than the corresponding room with single-pane clear glazing, double-pane clear glazing, vacuum glazing, single-pane PV glazing and double-pane PV glazing, respectively. This is because the vacuum PV glazing have the lowest U-value and SHGC among all types of glazing, as shown in Table 4.3. A lower U-value indicates a higher level of heat insulation performance of the glazing, and a lower SHGC means less solar radiation will pass through the windows. Therefore, the vacuum PV glazing performs the best in the area with big temperature difference between indoor and outdoor environment. In addition, the most cooling electricity use of the office room occurs at the west orientation, followed by east, south and north. Therefore, east and west facing windows should have better solar heat insulation performance, to reduce heat gains from outside environment.
In addition to reduce the cooling load of the office room, the PV glazing can also generate electricity in situ. The annual electricity generation of the three types of PV glazing are shown in Figure 19. It can be seen that the annual electricity generation of the three types of PV glazing is similar to each other. The electricity generation from the vacuum PV glazing is a little less than the single-pane PV glazing due to increased solar cell temperature. However, since the temperature coefficient of the thin-film a-Si solar cells is small, the PV conversion efficiency is not reduced significantly. The annual electricity generation from a-Si PV glazing with 12.0% transmittance is around 113.81 kWh per year. Among all orientations, it is better to install PV glazing on the south facade in order to maximize the electricity output in Hong Kong. And it is not recommended to apply PV glazing on north façade due to limited solar radiation available.
Based on the results above, the vacuum PV glazing not only has the best thermal performance among all types of widely used glazing, but also produces a considerable amount of electricity per year. It is recommended to install vacuum PV glazing on south facade to perform the best overall energy performance.
(2) Simulation of the whole building
Apart from modelling studies conducted under the hot and humid climate of Hong Kong, the annual energy performance of different types of glazing in a cold region (i.e. Beijing) was also simulated for comparison. Simulation results are shown in Figure 20 and Figure 21. It can be observed that the room using the vacuum PV glazing achieves the lowest cooling consumption in both climates. In Beijing, the consumed cooling energy with the vacuum PV glazing is much smaller and is 30.2%, 20.8%, 17.0%, 13.8%, 4.4% less than that of the room with other types of glazing. It can be concluded that the energy saving potential of the vacuum PV glazing is much larger in a cold climate while the electricity generation is much higher during the summer time of Beijing due to the smaller solar incidence angle.
The developed simulation model was further applied to a 20-floor prototype office building. Typical floors of the building are divided into 5 conditioned zones, with a total floor area of 540 m2 (as shown in Figure 22). The reference case – Model 1 keeps all windows as the commonly used double-pane clear glazing, while the design cases include Model 2 and Model 3. Model 2 keeps the north-facing window as the conventional double-pane glazing while changes windows orientated to the other three directions to the developed vacuum PV glazing. The opaque part of all building facades is assumed to be covered with traditional crystalline BIPV with a power conversion efficiency of 15% to maximize the power generation potential of the building envelope. Model 3 shares similar settings with Model 2, except that the window transparency is tuned to 20% with a crystalline silicon (c-Si) as shown in Figure 23. Table 5 shows detailed settings of window properties for the three models respectively. The U-value and SHGC of a-Si vacuum PV glazing are obtained from previous experiments and those of double-pane clear glazing are calculated by the simulation software WINDOW. Thermal and power generation properties of c-Si vacuum PV glazing are obtained from existing literatures.
The simulation results of the total heat gain and loss through all windows are presented in Figure 24 and Figure 25. The heat gain and loss both decrease sharply when traditional double-pane clear glazing is replaced by the PV vacuum glazing. The obvious differences between these three models can be identified from the figures. Compared with the performance of Model 1, the heat gain through windows of Model 2 and Model 3 drops up to 77.89% and 77.97% (south-facing windows), while the heat loss of the two models declines up to 79.28% and 79.32% (south-facing windows), respectively.
On the other side, based on the peak office hour electricity price of 1.4 CNY/kWh for cooling and 0.25 CNY/kWh for heating from the Beijing authority, the simple payback period (See Figure 28) when applying the product to the west, east, and south façade is calculated to be 3.8, 4.6 and 5.3 years compared to the single-pane PV glazing. The payback periods are increased to 4.5, 5.4 and 6.5 years when compared with double-pane PV glazing as shown in Figure 29.
As a result, the product can be considered as a cost-effective application in building facades when considering its tremendous saving of air-conditioning energy and corresponding annual expenses. In addition, the property developer could also benefit from a potential increment in renting rates and popularity, if the building gets certified under a green building scheme by claiming credits in CO2 reduction and renewable application assessment criteria. All the abovementioned potential benefits with the application of the vacuum PV glazing would attract more attention from the construction industry.
3.4 Brief technical guideline for the vacuum PV glazingDesigning the vacuum PV glazing (i.e. vacuum BIPV curtain wall) system is a more complex process than a standard added-on PV system. The architectural context, structural requirements, economic considerations and building regulation requirements should all be considered, so that this brief guidance mainly focuses on the below aspects: design strategy, environmental variables, multifunctionality, installation situation, electrical components, and economic aspects (Polysolar Limited, 2015).
(1) Design strategy
Architects, property developers and building users become more inclined to consider renewable and energy efficient applications to meet building and planning regulations due to rising energy bills and awareness of environmental sustainability. The combination of PV and vacuum glazing is an innovative and promising solution to meet these requirements in the new building developments or refurbishment projects. As proved in the above sections of this report, the developed product offers the added advantage of providing a return of investment from the building envelope. Architectural and structural factors, as well as economic considerations should be taken into account at an early stage in any building projects to integrate renewable systems through a more satisfactory approach.
(2) Environmental variables
When designing a BIPV system, a compromise must be reached between the requirements of energy yield optimisation and those of the architectural environment. Therefore, the orientation, lighting performance, shading and temperature are the four mainly concerned issues in BIPV design. According to simulation and experimental results presented in the above sections, the optimal orientation of the installed PV glazing should be south for maximizing the annual power generation, while cooling load reduction is more conspicuous when the product is applied on the west and east facades. Therefore, it is preferable to install the product on all three facades for an optimal overall building energy-saving performance. The visible light transmittance is only 12% in the developed prototype, which might cause slightly more lighting power consumption compared to traditional double-pane clear glazing. However, the transmittance can be easily adjusted to higher than 20% in the manufacture process depending on the effective area of PV materials. There will always be a trade-off between power generation and permeable light, whereas this research has proved that the combined power generation and cooling load reduction can be more than the increased lighting energy use. Power generation performance of the a-Si PV is less sensitive to shadings, so that the prototype is subject to less influence from peripheral shadings. However, if we change the PV material to c-Si for higher conversion efficiency, a shading calculation should be conducted before allocating the BIPV glazing. Lastly, the conversion efficiency of a-Si glazing is also less sensitive to the increase of the panel temperature. The temperature coefficient must be considered if changing the PV material to c-Si.
Heat flow
Glass:4 mm standard
Gas-tightedge joint
Support pillar
Approx. 0.7 mmEvacuated air space
U-value:0.8 W/(m2K)
Figure 1 A schematic diagram of a vacuum glazing
Indoor
Plate glass
Support
Cavity
Amorphous silicon or crystallinesilicon solar cells
Edge joint(sealed by laser)
Figure 2 A schematic configuration of the proposed vacuum BIPV curtain wall panel
The vacuum PV glazing was made by sandwiching a layer of PVB between an external PV laminated glass with a visible light transmittance of 12% and an internal vacuum glass. A low-e coating was also adopted to enhance its thermal performance. The structure of the vacuum PV glazing is shown in Figure 5. The dimension of the vacuum PV glazing is 1300 mm (width) × 1100 mm (height) × 20.87 mm (thickness), thinner than commonly used PV double glazed insulating glass units. Figure 6 presents the pictures of the sample of vacuum PV glazing.
This section presents the main findings and outcomes of the research project and indicates their potential impacts on the local energy use and construction industry. Achievements of the specified research objectives are illustrated, and limitations of the project are also mentioned for the reference of future studies.
3.1 Design and production of the prototype productInitially, we proposed a prototype design as specified by Figure 2, where the vacuum layer was directly coupled with the laminated PV panel. However, during initial manufacture trials, the air pressure difference between internal and external spaces of the vacuum glass samples produced by the laminating machine caused the breakage of the vacuum glass samples. Then, we followed an alternative approach using pre-pressure furnace, whereas the molten state of the polyvinyl butyral (PVB) could not meet the expected requirements and the bubbles greatly impacted the appearance and performance of PV module. Finally, we proposed the current product design based on the experience acquired from previous failures (See Figure 5).
The electrical specifications of the vacuum PV glazing under standard test conditions (STC: air mass 1.5, solar irradiation 1000 W/m2 and cell temperature 25°C) are shown in Table 2. Table 3 presents the given thermal and optical properties of the PV laminated glass and vacuum glass, respectively.
(3) Multi-functionality
Due to their mechanical structures, the PV vacuum glazing can perform the functions of the building envelope in addition to generating emission-free energy, and can thus substitute for conventional construction windows or curtain walls. Apart from power generation and architectural function, the product can provide solar shading with its low SHGC value. It can also act as thermal and sound insulation due to its low U-value and acoustic resistance caused by the vacuum chamber between glazing layers. If applied with special coatings/films on top of PV glazing, it can also provide weather protection.
(4) Mounting system and installation
Based on specific requirements of each project in each region, safety, loading capacity and PV installation specifications can have a decisive impact on the method of fixing/mounting the vacuum. We have in this guide attempted to provide a range of options, highlighting what is possible in current design. The product can be installed with a linear mounting system as mullion-transom facades or structural sealant glazing. It can also be mounted with point-fixing systems including clamp fixings and undercut anchor fixings or mounted into standard curtain walling, rain screen cladding and window systems.
(5) Electrical system
In the curtain wall system, several PV glazing with standard size are usually connected together in a string to form the power generator. The generated direct current is usually fed to an inverter where the direct current is converted to alternating current. If on-site storage is not available, which is the common case in urban areas, the electrical power is registered via an electricity meter and connected to the public supply grid, which will require special permissions from the power grid companies (e.g. CLP in Hong Kong). Therefore, the application of the product will require a full set of electrical systems including cables and connections for parallel or series arrays, direct current load-break switches, inverters and generation meters.
(6) Economic considerations
The economic benefits of the product mainly lie in the following aspects: the substitute for original construction component, CO2 emission reduction and corresponding electricity fee waving, compliance with relevant building regulations (i.e. BEAM Plus in Hong Kong) and application of the feed-in-tariff policy (remuneration for electricity generation from PV).
temperature measurements were conducted through the centre of the vacuum PV sample to calculate the U-value. Secondly, the solar heat gains coefficient (SHGC) of the vacuum PV glazing sample was obtained and compared with three other advanced glazing types in an indoor solar irradiation test. Lastly, an outdoor test was conducted on the platform of Block Z in The Hong Kong Polytechnic University to evaluate the overall thermal performance of vacuum PV glazing. A conventional double clear pane glazing was used as a baseline in the outdoor test.
surfaces shows a similar trend in the three directions. Summing up electricity generation in all floors, the integrated PV modules in Model 2 and 3 can provide 285074.72 kWh/year and 355226.3 kWh/year, which accounts for 13.27% and 16.54% of the total building energy consumption of Model 1. Therefore, given the energy use reduction due to less external heat gain, using the vacuum BIPV glazing can save 27.74% (Model 3) electricity compared to a reference building.

03 Construction Industry Council
1.1 BackgroundAs a new functional curtain wall, the solar PV glazing has attracted a great deal of attention from the construction industry in recent years due to its novel integral function of power generation, decoration and simultaneously serving as building envelope materials. Briefly, it combines the PV and curtain wall technology, representing a new direction of the development and application in the future building industry. Integrated with solar cells, the curtain wall can convert sunlight into electricity and become an architectural solar power supply system. In this sense, the technology can provide electrical power for buildings from a renewable energy resource for the energy saving and CO2 (Carbon Dioxide) emission reduction. However, a shortcoming of the current PV curtain wall with common double-glazed PV modules lies in the poor thermal insulation performance due to the high solar heat gain coefficient (SHGC) and U-Value. It is reported that the BIPV module has a thermal conductivity of 1.1 W/mK, even after inert gas is used to fill the gap between the double-glazing units (Anatol, Francesco, & Nagel, 2011, October).
The vacuum glazing technology, which was initially proposed by Zoller in 1913 (Zoller, 1924), could minimize conductive and convective heat transfer through the glazing unit by introducing a vacuum chamber in it. The schematic diagram of a vacuum glazing is shown in Figure 1. Compared with a normal double glazing, the vacuum glazing exhibits superior heat insulation performance, which is identified by its U-values. The U-value of the vacuum glazing is about 0.86 W/m2K, which is much lower than that of a double-glazing (Griffiths et al., 1998). Therefore, if the vacuum glazing could be applied in solar PV curtain walls in buildings, the heat gain and heat loss could be further reduced. Moreover, due to its vacuum environment, the vacuum glazing has excellent sound insulation performance, which is also significant for its application to buildings in urban areas.
Based on the above discussion and our previous study on PV curtain wall application in Hong Kong (Wang et al., 2016; Zhang, Lu, & Chen, 2017; Zhang, Lu, Peng, & Song, 2016), we would like to propose in this project a novel energy-saving vacuum PV glazing, which combines the current photovoltaic curtain wall and vacuum glazing techniques. A schematic configuration diagram of the proposed vacuum BIPV curtain wall is shown in Figure 2. A systematic study is carried out on the overall energy performance of the developed curtain wall, and its application potential is evaluated for applications in Hong Kong. It is expected that the developed vacuum BIPV curtain wall technology will substantially reduce the heat gain and heat loss of buildings, and the research outputs will provide valuable information and theoretical basis for developing energy-saving solar PV curtain walls in the future for the local industry.
1.2 Aims and ObjectivesThe aims and objectives of the project mainly include:
(1) The vacuum BIPV curtain wall technology will be developed in detail. A small scale demonstration prototype of the proposed vacuum BIPV curtain wall will be set up to investigate the overall energy performance, including power generation and thermal performance under real environmental conditions in Hong Kong. The outdoor test campaign will be lasting for at least two sunny days to assess its annual energy performance.
(2) A comparative experimental study will be conducted to compare the overall energy performance of the vacuum BIPV curtain wall with other advanced window or facade technologies. The annual energy-saving potential of the proposed vacuum BIPV curtain wall will be explored.
(3) To develop a comprehensive simulation model, which combines heat transfer model and power generation model to accurately simulate the dynamic power output and thermal performance of the novel vacuum BIPV curtain wall.
(4) The energy-saving potential as well as economic benefits of applying the vacuum PV curtain wall to high-rise commercial buildings will be explored in comparison with commonly adopted window and facade technologies.
(5) Based on the experimental and simulation results, an optimized vacuum BIPV curtain wall design will be proposed to maximize its overall energy performance, and a comprehensive technical guideline will be proposed for further promotion in local construction industry.
The comparison of building energy between Model 1, Model 2 and Model 3 is summarized in Table 6, which includes energy use of lighting, equipment, district cooling and district heating. Although Model 2 and Model 3 consume slightly more lighting energy due to the reduced visible transmittance of the PV glazing, the great energy saving in cooling and heating leads to the net reduction in the total building energy consumption. The total energy consumption of the Model 2 and 3 declines by 20.77 and 22.37 kWh/m2, accounting for 10.44% and 11.20% of Model 1 respectively. Generated electricity of windows and walls in three directions is also presented in Table 7. The south window produced the most electricity, 1527.13 kWh for Model 2 and 3203.76 kWh for Model 3 in a year, taking up nearly 47.80% the total electricity generated by windows. As for the west window, the electricity generated in a year is close to that of east window. Electricity generated by wall
1.3 ScopeA brief description of the R&D scopes and the relevant timeframe are specified as below:
(1) Delivery of a sample of the developed vacuum PV module. An outdoor test bed was built to measure the thermal and power performance of the proposed vacuum BIPV curtain wall under the real environmental conditions.
(2) A comprehensive program combining the heat transfer and PV power model was developed to accurately simulate the electricity generation and indoor thermal performance. Annual building simulations were conducted to estimate the overall energy performance of the vacuum BIPV curtain wall facing different directions and under different weather conditions.
(3) Indoor tests under the solar simulator were conducted to compare the thermal and power performance of the developed product with other advanced window technologies. The simulation program is further improved to comprehensively evaluate the application potential of this curtain wall to high-rise commercial buildings in Hong Kong. A cost effectiveness analysis and technical guideline of the product were delivered as well.
3.2 Experimental study of the vacuum PV glazingOutdoor experimental test was first conducted on the developed prototype vacuum PV (VPV) glazing with the standard size (1.1m × 1.3m), whose various parameters including the ambient air temperature, incident solar irradiation, surface temperatures of the vacuum PV glazing as well as the I-V curves and the power generation were measured and recorded. The power generation and thermal performances of the prototype were also analysed during the test. To further justify the advantage of the vacuum PV glazing, experimental studies were carried out to compare the thermal performance of scaled-down samples (0.3m × 0.3m) with other advanced windows.
(1) Energy performance of the prototypeIn order to evaluate the energy performance of the vacuum PV glazing, an outdoor field measurement was conducted on the platform of Block Z in The Hong Kong Polytechnic University. The vacuum PV glazing was set up horizontally 0.4m above the floor on stilts so that the external temperatures of both sides of the vacuum PV glazing were approximately equal. Various parameters were measured during this test, including the ambient air temperature, the exterior and transmitted horizontal incident solar irradiation, the outer and inner surface temperatures of the vacuum PV glazing as well as the I-V curves and the power generation from the vacuum PV glazing. All the data was logged at an interval of 1 minute. Power generation and thermal performances of the vacuum PV glazing were analyzed based on the outdoor tests. Figure 7 shows the exterior and transmitted incident solar irradiation. It can be seen that the average solar irradiation transmittance during the period is approximately 0.08. Such low transmittance means that vast majority of solar irradiation is blocked by the vacuum PV glazing. Figure 8 presents the outer and inner surface temperature of the vacuum PV glazing. It can be seen that the outer surface temperature is much higher than the inner surface temperature at daytime. The maximum outer surface temperature is 75.3°C, 30°C higher than the inner surface temperature, which indicates that most of the waste heat is dissipated from the outside surface of the vacuum PV glazing, and the heat transfer to the inside space by convection is mitigated. Thus, compared with the conventional single-glazed PV glazing, the structure of the vacuum PV glazing can help reduce the cooling load and improve the indoor thermal comfort.
Then the vacuum PV glazing was mounted on the front side of an experimental test chamber as shown in Figure 9. Clear glass was also adopted in this study for comparison. Figure 10 presents the instantaneous power output of the vacuum PV glazing in 2 sunny days. It can be seen that the power generation from the vacuum PV glazing is consistent with incident solar radiation. A comparative study in terms of internal air temperature of the chamber between the vacuum PV glazing and the clear glass was conducted in a day of June.
As shown in Figure 11, the internal air temperature in the chamber with the vacuum PV glazing is much lower than that with a clear glass. The measured average and maximum internal air temperature for the vacuum PV glazing is 39.6°C and 40.3°C, respectively, while the corresponding average and maximum internal air temperature of the clear glass are 43.6°C and 44.7°C. The maximum internal air temperature difference between the vacuum PV glazing and the clear glass is 4.4°C, occurring in the morning. There are three temperature peaks of internal air temperature. Since the ambient temperature was relatively stable, the main heat gain of the internal air temperature was from incident solar irradiation. The internal air temperature for vacuum PV glazing is much more stable compared with that for the clear glass. The reason is that the vacuum PV glazing has better heat insulation performance so that the internal air temperature is not affected by the external environment significantly. It can also be seen in this figure that the internal air temperature of the chamber drops continuously at 15:00, which shows that the incident solar irradiation on the façade decreases so that the heat gains of the internal air from the sun also drops.
(2) Comparison with other advanced windows
To further justify the advantage of the vacuum PV glazing, experimental studies were carried out to compare it with other advanced windows. Samples of different types of glazing were mounted on the top of two hotboxes (i.e. test rigs) with the uniform dimension of 300 mm (L) × 300 mm (W) × 450mm (H) to implement both indoor and outdoor tests. Firstly, a co-heating test methodology was adopted for the thermal analysis of the vacuum PV glazing. The test rig was filled with the ice-water mixture to ensure the temperature difference between the inside and outside glazing surfaces larger than 5°C. Heat flux and
Figure 12 shows the internal and external temperatures of the vacuum PV glazing sample. The presented data were selected after the hotbox achieved the steady-state condition, when the temperature difference was around 8°C. Heat flux though the glazing sample and the U-value were then determined as illustrated in Figure 13. The average heat flux from the vacuum glazing was measured to be 15.4 W/m2. And the average U-value was calculated as 1.5 W/m2 × K which is much lower than a regular double pane window with the U-value of 2.5W/m2 × K. Considering the edge heat transfer which would strongly affect the heat flux measurement when the sample is small, it can be expected that the centre U-valve of the vacuum PV glazing should be lower than 1.5 W/m2 × K for a larger scale application (e.g. 1.1m × 1.3m).
(3) Cost effective analysis based on simulation
To address the economic benefits of the developed product, the simple payback period of the vacuum PV glazing is calculated with reference to available PV glazing on the market in both Hong Kong and Beijing’s scenarios.
Based on an average electricity price of 1.25 HKD/kWh from HK Electric, the simple payback period (See Figure 26) when applying the product to the west and east façade is calculated to be 7.5 and 8.0 years compared to the single-pane PV glazing. The payback periods are increased to 8.6 and 8.8 years when compared with double-pane PV glazing as shown in Figure 27. However, when applied to the south façade, the extra initial cost of the product cannot be recovered within 10 years.
The solar simulator in the laboratory can provide relatively steady horizontal incident solar irradiation, so that test rigs were located at the same spot to ensure each window sample exposed to the same radiation level. As shown in Figure 14, SHGCs of the vacuum PV glazing and double-pane PV glazing are much smaller than those of the vacuum glazing and double clear glazing, because the coupled PV module can absorb most of the solar irradiation. The vacuum PV glazing has the lowest SHGC of 0.10 which can act as the excellent thermal insulation.
The outdoor test lasted four days from September 26th to September 30th. As shown in Figure 15, September 26th, 27th and 30th were cloudy days and September 28th could be considered as a sunny day. It can be found that the vacuum PV glazing blocks most solar irradiation compared with the double-pane glazing. Figure 16 presents the temperature profile of the vacuum PV glazing and double-pane glazing in the sunny day. The internal surface temperature of both glazing was much higher than the ambient temperature when the outside incident solar radiation is strong. The internal glazing surface and air temperatures of the test rig with the vacuum PV glazing are lower than those of the test rig with the double-pane glazing. The difference between the internal air temperatures of test rigs is much smaller than that of internal glazing surface temperatures. Therefore, the application of vacuum PV glazing can achieve better indoor environment by reducing the solar heat gain.
3.3 Simulation study of the vacuum PV glazing(1) Simulation of a generic building model
Although a series of field tests have been conducted in the outdoor test bed to study the power and thermal performances of the vacuum BIPV glazing, the experimental scenarios are impossible to represent all the situations and variables. Thus, the numerical study was conducted to comprehensively investigate and compare the energy performance of the vacuum PV glazing and other commonly used energy-efficient glazing. As detailed in the research methodology, a comprehensive simulation model based on EnergyPlus and WINDOW has been developed to simulate the overall energy performance of different windows taking into account of their thermal and power output performance. This model is used to simulate the overall energy performance of the vacuum BIPV curtain wall in comparison with other commonly used windows. The key properties of different types of glazing are shown in Table 4 and the electrical specifications of the PV glazing under standard test conditions are referenced to Table 2.
In order to simulate the annual thermal performance and power performance of these types of glazing in Hong Kong for comparison purpose, a typical office room model has been created for simulation, as shown in Figure 17. The dimension of the office model was 2.5m × 2.3m × 2.5m (L × W × H). This room has only one external wall with three identical windows exposed to the outdoor environment. Simulations were conducted for different orientations, i.e. south (S), east (E), west (W) and north (N). A heat transfer model and PV performance model in EnergyPlus are adopted to investigate
the thermal and power performance of different glazing. The heat transfer model is used to calculate the cooling loads of the office room. The cooling loads are then converted to electricity use of air-conditioning system with a presumed coefficient of performance (COP) of 2.78. The equivalent one-diode model is selected to simulate the annual electricity generation from PV elements. The typical meteorological year (TMY) in Hong Kong is selected a reasonable representation of local climates.
The annual cooling electricity use of different types of glazing in different orientations in Hong Kong are shown in Figure 18. It can be observed that the room using vacuum PV glazing consumes the least cooling electricity for all orientations. The south facing room with vacuum PV glazing consumes about 705.56 kWh per year, which was approximately 14.2%, 9.8%, 8.4%, 7.1% and 4.1% less than the corresponding room with single-pane clear glazing, double-pane clear glazing, vacuum glazing, single-pane PV glazing and double-pane PV glazing, respectively. This is because the vacuum PV glazing have the lowest U-value and SHGC among all types of glazing, as shown in Table 4.3. A lower U-value indicates a higher level of heat insulation performance of the glazing, and a lower SHGC means less solar radiation will pass through the windows. Therefore, the vacuum PV glazing performs the best in the area with big temperature difference between indoor and outdoor environment. In addition, the most cooling electricity use of the office room occurs at the west orientation, followed by east, south and north. Therefore, east and west facing windows should have better solar heat insulation performance, to reduce heat gains from outside environment.
In addition to reduce the cooling load of the office room, the PV glazing can also generate electricity in situ. The annual electricity generation of the three types of PV glazing are shown in Figure 19. It can be seen that the annual electricity generation of the three types of PV glazing is similar to each other. The electricity generation from the vacuum PV glazing is a little less than the single-pane PV glazing due to increased solar cell temperature. However, since the temperature coefficient of the thin-film a-Si solar cells is small, the PV conversion efficiency is not reduced significantly. The annual electricity generation from a-Si PV glazing with 12.0% transmittance is around 113.81 kWh per year. Among all orientations, it is better to install PV glazing on the south facade in order to maximize the electricity output in Hong Kong. And it is not recommended to apply PV glazing on north façade due to limited solar radiation available.
Based on the results above, the vacuum PV glazing not only has the best thermal performance among all types of widely used glazing, but also produces a considerable amount of electricity per year. It is recommended to install vacuum PV glazing on south facade to perform the best overall energy performance.
(2) Simulation of the whole building
Apart from modelling studies conducted under the hot and humid climate of Hong Kong, the annual energy performance of different types of glazing in a cold region (i.e. Beijing) was also simulated for comparison. Simulation results are shown in Figure 20 and Figure 21. It can be observed that the room using the vacuum PV glazing achieves the lowest cooling consumption in both climates. In Beijing, the consumed cooling energy with the vacuum PV glazing is much smaller and is 30.2%, 20.8%, 17.0%, 13.8%, 4.4% less than that of the room with other types of glazing. It can be concluded that the energy saving potential of the vacuum PV glazing is much larger in a cold climate while the electricity generation is much higher during the summer time of Beijing due to the smaller solar incidence angle.
The developed simulation model was further applied to a 20-floor prototype office building. Typical floors of the building are divided into 5 conditioned zones, with a total floor area of 540 m2 (as shown in Figure 22). The reference case – Model 1 keeps all windows as the commonly used double-pane clear glazing, while the design cases include Model 2 and Model 3. Model 2 keeps the north-facing window as the conventional double-pane glazing while changes windows orientated to the other three directions to the developed vacuum PV glazing. The opaque part of all building facades is assumed to be covered with traditional crystalline BIPV with a power conversion efficiency of 15% to maximize the power generation potential of the building envelope. Model 3 shares similar settings with Model 2, except that the window transparency is tuned to 20% with a crystalline silicon (c-Si) as shown in Figure 23. Table 5 shows detailed settings of window properties for the three models respectively. The U-value and SHGC of a-Si vacuum PV glazing are obtained from previous experiments and those of double-pane clear glazing are calculated by the simulation software WINDOW. Thermal and power generation properties of c-Si vacuum PV glazing are obtained from existing literatures.
The simulation results of the total heat gain and loss through all windows are presented in Figure 24 and Figure 25. The heat gain and loss both decrease sharply when traditional double-pane clear glazing is replaced by the PV vacuum glazing. The obvious differences between these three models can be identified from the figures. Compared with the performance of Model 1, the heat gain through windows of Model 2 and Model 3 drops up to 77.89% and 77.97% (south-facing windows), while the heat loss of the two models declines up to 79.28% and 79.32% (south-facing windows), respectively.
On the other side, based on the peak office hour electricity price of 1.4 CNY/kWh for cooling and 0.25 CNY/kWh for heating from the Beijing authority, the simple payback period (See Figure 28) when applying the product to the west, east, and south façade is calculated to be 3.8, 4.6 and 5.3 years compared to the single-pane PV glazing. The payback periods are increased to 4.5, 5.4 and 6.5 years when compared with double-pane PV glazing as shown in Figure 29.
As a result, the product can be considered as a cost-effective application in building facades when considering its tremendous saving of air-conditioning energy and corresponding annual expenses. In addition, the property developer could also benefit from a potential increment in renting rates and popularity, if the building gets certified under a green building scheme by claiming credits in CO2 reduction and renewable application assessment criteria. All the abovementioned potential benefits with the application of the vacuum PV glazing would attract more attention from the construction industry.
3.4 Brief technical guideline for the vacuum PV glazingDesigning the vacuum PV glazing (i.e. vacuum BIPV curtain wall) system is a more complex process than a standard added-on PV system. The architectural context, structural requirements, economic considerations and building regulation requirements should all be considered, so that this brief guidance mainly focuses on the below aspects: design strategy, environmental variables, multifunctionality, installation situation, electrical components, and economic aspects (Polysolar Limited, 2015).
(1) Design strategy
Architects, property developers and building users become more inclined to consider renewable and energy efficient applications to meet building and planning regulations due to rising energy bills and awareness of environmental sustainability. The combination of PV and vacuum glazing is an innovative and promising solution to meet these requirements in the new building developments or refurbishment projects. As proved in the above sections of this report, the developed product offers the added advantage of providing a return of investment from the building envelope. Architectural and structural factors, as well as economic considerations should be taken into account at an early stage in any building projects to integrate renewable systems through a more satisfactory approach.
(2) Environmental variables
When designing a BIPV system, a compromise must be reached between the requirements of energy yield optimisation and those of the architectural environment. Therefore, the orientation, lighting performance, shading and temperature are the four mainly concerned issues in BIPV design. According to simulation and experimental results presented in the above sections, the optimal orientation of the installed PV glazing should be south for maximizing the annual power generation, while cooling load reduction is more conspicuous when the product is applied on the west and east facades. Therefore, it is preferable to install the product on all three facades for an optimal overall building energy-saving performance. The visible light transmittance is only 12% in the developed prototype, which might cause slightly more lighting power consumption compared to traditional double-pane clear glazing. However, the transmittance can be easily adjusted to higher than 20% in the manufacture process depending on the effective area of PV materials. There will always be a trade-off between power generation and permeable light, whereas this research has proved that the combined power generation and cooling load reduction can be more than the increased lighting energy use. Power generation performance of the a-Si PV is less sensitive to shadings, so that the prototype is subject to less influence from peripheral shadings. However, if we change the PV material to c-Si for higher conversion efficiency, a shading calculation should be conducted before allocating the BIPV glazing. Lastly, the conversion efficiency of a-Si glazing is also less sensitive to the increase of the panel temperature. The temperature coefficient must be considered if changing the PV material to c-Si.
The vacuum PV glazing was made by sandwiching a layer of PVB between an external PV laminated glass with a visible light transmittance of 12% and an internal vacuum glass. A low-e coating was also adopted to enhance its thermal performance. The structure of the vacuum PV glazing is shown in Figure 5. The dimension of the vacuum PV glazing is 1300 mm (width) × 1100 mm (height) × 20.87 mm (thickness), thinner than commonly used PV double glazed insulating glass units. Figure 6 presents the pictures of the sample of vacuum PV glazing.
This section presents the main findings and outcomes of the research project and indicates their potential impacts on the local energy use and construction industry. Achievements of the specified research objectives are illustrated, and limitations of the project are also mentioned for the reference of future studies.
3.1 Design and production of the prototype productInitially, we proposed a prototype design as specified by Figure 2, where the vacuum layer was directly coupled with the laminated PV panel. However, during initial manufacture trials, the air pressure difference between internal and external spaces of the vacuum glass samples produced by the laminating machine caused the breakage of the vacuum glass samples. Then, we followed an alternative approach using pre-pressure furnace, whereas the molten state of the polyvinyl butyral (PVB) could not meet the expected requirements and the bubbles greatly impacted the appearance and performance of PV module. Finally, we proposed the current product design based on the experience acquired from previous failures (See Figure 5).
The electrical specifications of the vacuum PV glazing under standard test conditions (STC: air mass 1.5, solar irradiation 1000 W/m2 and cell temperature 25°C) are shown in Table 2. Table 3 presents the given thermal and optical properties of the PV laminated glass and vacuum glass, respectively.
(3) Multi-functionality
Due to their mechanical structures, the PV vacuum glazing can perform the functions of the building envelope in addition to generating emission-free energy, and can thus substitute for conventional construction windows or curtain walls. Apart from power generation and architectural function, the product can provide solar shading with its low SHGC value. It can also act as thermal and sound insulation due to its low U-value and acoustic resistance caused by the vacuum chamber between glazing layers. If applied with special coatings/films on top of PV glazing, it can also provide weather protection.
(4) Mounting system and installation
Based on specific requirements of each project in each region, safety, loading capacity and PV installation specifications can have a decisive impact on the method of fixing/mounting the vacuum. We have in this guide attempted to provide a range of options, highlighting what is possible in current design. The product can be installed with a linear mounting system as mullion-transom facades or structural sealant glazing. It can also be mounted with point-fixing systems including clamp fixings and undercut anchor fixings or mounted into standard curtain walling, rain screen cladding and window systems.
(5) Electrical system
In the curtain wall system, several PV glazing with standard size are usually connected together in a string to form the power generator. The generated direct current is usually fed to an inverter where the direct current is converted to alternating current. If on-site storage is not available, which is the common case in urban areas, the electrical power is registered via an electricity meter and connected to the public supply grid, which will require special permissions from the power grid companies (e.g. CLP in Hong Kong). Therefore, the application of the product will require a full set of electrical systems including cables and connections for parallel or series arrays, direct current load-break switches, inverters and generation meters.
(6) Economic considerations
The economic benefits of the product mainly lie in the following aspects: the substitute for original construction component, CO2 emission reduction and corresponding electricity fee waving, compliance with relevant building regulations (i.e. BEAM Plus in Hong Kong) and application of the feed-in-tariff policy (remuneration for electricity generation from PV).
temperature measurements were conducted through the centre of the vacuum PV sample to calculate the U-value. Secondly, the solar heat gains coefficient (SHGC) of the vacuum PV glazing sample was obtained and compared with three other advanced glazing types in an indoor solar irradiation test. Lastly, an outdoor test was conducted on the platform of Block Z in The Hong Kong Polytechnic University to evaluate the overall thermal performance of vacuum PV glazing. A conventional double clear pane glazing was used as a baseline in the outdoor test.
surfaces shows a similar trend in the three directions. Summing up electricity generation in all floors, the integrated PV modules in Model 2 and 3 can provide 285074.72 kWh/year and 355226.3 kWh/year, which accounts for 13.27% and 16.54% of the total building energy consumption of Model 1. Therefore, given the energy use reduction due to less external heat gain, using the vacuum BIPV glazing can save 27.74% (Model 3) electricity compared to a reference building.

04Investigation on the Thermal and Power Performance of Vacuum BIPV Curtain Wall Technology and its Application Potential in Buildings in Hong Kong
1.1 BackgroundAs a new functional curtain wall, the solar PV glazing has attracted a great deal of attention from the construction industry in recent years due to its novel integral function of power generation, decoration and simultaneously serving as building envelope materials. Briefly, it combines the PV and curtain wall technology, representing a new direction of the development and application in the future building industry. Integrated with solar cells, the curtain wall can convert sunlight into electricity and become an architectural solar power supply system. In this sense, the technology can provide electrical power for buildings from a renewable energy resource for the energy saving and CO2 (Carbon Dioxide) emission reduction. However, a shortcoming of the current PV curtain wall with common double-glazed PV modules lies in the poor thermal insulation performance due to the high solar heat gain coefficient (SHGC) and U-Value. It is reported that the BIPV module has a thermal conductivity of 1.1 W/mK, even after inert gas is used to fill the gap between the double-glazing units (Anatol, Francesco, & Nagel, 2011, October).
The vacuum glazing technology, which was initially proposed by Zoller in 1913 (Zoller, 1924), could minimize conductive and convective heat transfer through the glazing unit by introducing a vacuum chamber in it. The schematic diagram of a vacuum glazing is shown in Figure 1. Compared with a normal double glazing, the vacuum glazing exhibits superior heat insulation performance, which is identified by its U-values. The U-value of the vacuum glazing is about 0.86 W/m2K, which is much lower than that of a double-glazing (Griffiths et al., 1998). Therefore, if the vacuum glazing could be applied in solar PV curtain walls in buildings, the heat gain and heat loss could be further reduced. Moreover, due to its vacuum environment, the vacuum glazing has excellent sound insulation performance, which is also significant for its application to buildings in urban areas.
Based on the above discussion and our previous study on PV curtain wall application in Hong Kong (Wang et al., 2016; Zhang, Lu, & Chen, 2017; Zhang, Lu, Peng, & Song, 2016), we would like to propose in this project a novel energy-saving vacuum PV glazing, which combines the current photovoltaic curtain wall and vacuum glazing techniques. A schematic configuration diagram of the proposed vacuum BIPV curtain wall is shown in Figure 2. A systematic study is carried out on the overall energy performance of the developed curtain wall, and its application potential is evaluated for applications in Hong Kong. It is expected that the developed vacuum BIPV curtain wall technology will substantially reduce the heat gain and heat loss of buildings, and the research outputs will provide valuable information and theoretical basis for developing energy-saving solar PV curtain walls in the future for the local industry.
1.2 Aims and ObjectivesThe aims and objectives of the project mainly include:
(1) The vacuum BIPV curtain wall technology will be developed in detail. A small scale demonstration prototype of the proposed vacuum BIPV curtain wall will be set up to investigate the overall energy performance, including power generation and thermal performance under real environmental conditions in Hong Kong. The outdoor test campaign will be lasting for at least two sunny days to assess its annual energy performance.
(2) A comparative experimental study will be conducted to compare the overall energy performance of the vacuum BIPV curtain wall with other advanced window or facade technologies. The annual energy-saving potential of the proposed vacuum BIPV curtain wall will be explored.
(3) To develop a comprehensive simulation model, which combines heat transfer model and power generation model to accurately simulate the dynamic power output and thermal performance of the novel vacuum BIPV curtain wall.
(4) The energy-saving potential as well as economic benefits of applying the vacuum PV curtain wall to high-rise commercial buildings will be explored in comparison with commonly adopted window and facade technologies.
(5) Based on the experimental and simulation results, an optimized vacuum BIPV curtain wall design will be proposed to maximize its overall energy performance, and a comprehensive technical guideline will be proposed for further promotion in local construction industry.
The comparison of building energy between Model 1, Model 2 and Model 3 is summarized in Table 6, which includes energy use of lighting, equipment, district cooling and district heating. Although Model 2 and Model 3 consume slightly more lighting energy due to the reduced visible transmittance of the PV glazing, the great energy saving in cooling and heating leads to the net reduction in the total building energy consumption. The total energy consumption of the Model 2 and 3 declines by 20.77 and 22.37 kWh/m2, accounting for 10.44% and 11.20% of Model 1 respectively. Generated electricity of windows and walls in three directions is also presented in Table 7. The south window produced the most electricity, 1527.13 kWh for Model 2 and 3203.76 kWh for Model 3 in a year, taking up nearly 47.80% the total electricity generated by windows. As for the west window, the electricity generated in a year is close to that of east window. Electricity generated by wall
1.3 ScopeA brief description of the R&D scopes and the relevant timeframe are specified as below:
(1) Delivery of a sample of the developed vacuum PV module. An outdoor test bed was built to measure the thermal and power performance of the proposed vacuum BIPV curtain wall under the real environmental conditions.
(2) A comprehensive program combining the heat transfer and PV power model was developed to accurately simulate the electricity generation and indoor thermal performance. Annual building simulations were conducted to estimate the overall energy performance of the vacuum BIPV curtain wall facing different directions and under different weather conditions.
(3) Indoor tests under the solar simulator were conducted to compare the thermal and power performance of the developed product with other advanced window technologies. The simulation program is further improved to comprehensively evaluate the application potential of this curtain wall to high-rise commercial buildings in Hong Kong. A cost effectiveness analysis and technical guideline of the product were delivered as well.
3.2 Experimental study of the vacuum PV glazingOutdoor experimental test was first conducted on the developed prototype vacuum PV (VPV) glazing with the standard size (1.1m × 1.3m), whose various parameters including the ambient air temperature, incident solar irradiation, surface temperatures of the vacuum PV glazing as well as the I-V curves and the power generation were measured and recorded. The power generation and thermal performances of the prototype were also analysed during the test. To further justify the advantage of the vacuum PV glazing, experimental studies were carried out to compare the thermal performance of scaled-down samples (0.3m × 0.3m) with other advanced windows.
(1) Energy performance of the prototypeIn order to evaluate the energy performance of the vacuum PV glazing, an outdoor field measurement was conducted on the platform of Block Z in The Hong Kong Polytechnic University. The vacuum PV glazing was set up horizontally 0.4m above the floor on stilts so that the external temperatures of both sides of the vacuum PV glazing were approximately equal. Various parameters were measured during this test, including the ambient air temperature, the exterior and transmitted horizontal incident solar irradiation, the outer and inner surface temperatures of the vacuum PV glazing as well as the I-V curves and the power generation from the vacuum PV glazing. All the data was logged at an interval of 1 minute. Power generation and thermal performances of the vacuum PV glazing were analyzed based on the outdoor tests. Figure 7 shows the exterior and transmitted incident solar irradiation. It can be seen that the average solar irradiation transmittance during the period is approximately 0.08. Such low transmittance means that vast majority of solar irradiation is blocked by the vacuum PV glazing. Figure 8 presents the outer and inner surface temperature of the vacuum PV glazing. It can be seen that the outer surface temperature is much higher than the inner surface temperature at daytime. The maximum outer surface temperature is 75.3°C, 30°C higher than the inner surface temperature, which indicates that most of the waste heat is dissipated from the outside surface of the vacuum PV glazing, and the heat transfer to the inside space by convection is mitigated. Thus, compared with the conventional single-glazed PV glazing, the structure of the vacuum PV glazing can help reduce the cooling load and improve the indoor thermal comfort.
Then the vacuum PV glazing was mounted on the front side of an experimental test chamber as shown in Figure 9. Clear glass was also adopted in this study for comparison. Figure 10 presents the instantaneous power output of the vacuum PV glazing in 2 sunny days. It can be seen that the power generation from the vacuum PV glazing is consistent with incident solar radiation. A comparative study in terms of internal air temperature of the chamber between the vacuum PV glazing and the clear glass was conducted in a day of June.
As shown in Figure 11, the internal air temperature in the chamber with the vacuum PV glazing is much lower than that with a clear glass. The measured average and maximum internal air temperature for the vacuum PV glazing is 39.6°C and 40.3°C, respectively, while the corresponding average and maximum internal air temperature of the clear glass are 43.6°C and 44.7°C. The maximum internal air temperature difference between the vacuum PV glazing and the clear glass is 4.4°C, occurring in the morning. There are three temperature peaks of internal air temperature. Since the ambient temperature was relatively stable, the main heat gain of the internal air temperature was from incident solar irradiation. The internal air temperature for vacuum PV glazing is much more stable compared with that for the clear glass. The reason is that the vacuum PV glazing has better heat insulation performance so that the internal air temperature is not affected by the external environment significantly. It can also be seen in this figure that the internal air temperature of the chamber drops continuously at 15:00, which shows that the incident solar irradiation on the façade decreases so that the heat gains of the internal air from the sun also drops.
(2) Comparison with other advanced windows
To further justify the advantage of the vacuum PV glazing, experimental studies were carried out to compare it with other advanced windows. Samples of different types of glazing were mounted on the top of two hotboxes (i.e. test rigs) with the uniform dimension of 300 mm (L) × 300 mm (W) × 450mm (H) to implement both indoor and outdoor tests. Firstly, a co-heating test methodology was adopted for the thermal analysis of the vacuum PV glazing. The test rig was filled with the ice-water mixture to ensure the temperature difference between the inside and outside glazing surfaces larger than 5°C. Heat flux and
Figure 12 shows the internal and external temperatures of the vacuum PV glazing sample. The presented data were selected after the hotbox achieved the steady-state condition, when the temperature difference was around 8°C. Heat flux though the glazing sample and the U-value were then determined as illustrated in Figure 13. The average heat flux from the vacuum glazing was measured to be 15.4 W/m2. And the average U-value was calculated as 1.5 W/m2 × K which is much lower than a regular double pane window with the U-value of 2.5W/m2 × K. Considering the edge heat transfer which would strongly affect the heat flux measurement when the sample is small, it can be expected that the centre U-valve of the vacuum PV glazing should be lower than 1.5 W/m2 × K for a larger scale application (e.g. 1.1m × 1.3m).
(3) Cost effective analysis based on simulation
To address the economic benefits of the developed product, the simple payback period of the vacuum PV glazing is calculated with reference to available PV glazing on the market in both Hong Kong and Beijing’s scenarios.
Based on an average electricity price of 1.25 HKD/kWh from HK Electric, the simple payback period (See Figure 26) when applying the product to the west and east façade is calculated to be 7.5 and 8.0 years compared to the single-pane PV glazing. The payback periods are increased to 8.6 and 8.8 years when compared with double-pane PV glazing as shown in Figure 27. However, when applied to the south façade, the extra initial cost of the product cannot be recovered within 10 years.
The solar simulator in the laboratory can provide relatively steady horizontal incident solar irradiation, so that test rigs were located at the same spot to ensure each window sample exposed to the same radiation level. As shown in Figure 14, SHGCs of the vacuum PV glazing and double-pane PV glazing are much smaller than those of the vacuum glazing and double clear glazing, because the coupled PV module can absorb most of the solar irradiation. The vacuum PV glazing has the lowest SHGC of 0.10 which can act as the excellent thermal insulation.
The outdoor test lasted four days from September 26th to September 30th. As shown in Figure 15, September 26th, 27th and 30th were cloudy days and September 28th could be considered as a sunny day. It can be found that the vacuum PV glazing blocks most solar irradiation compared with the double-pane glazing. Figure 16 presents the temperature profile of the vacuum PV glazing and double-pane glazing in the sunny day. The internal surface temperature of both glazing was much higher than the ambient temperature when the outside incident solar radiation is strong. The internal glazing surface and air temperatures of the test rig with the vacuum PV glazing are lower than those of the test rig with the double-pane glazing. The difference between the internal air temperatures of test rigs is much smaller than that of internal glazing surface temperatures. Therefore, the application of vacuum PV glazing can achieve better indoor environment by reducing the solar heat gain.
3.3 Simulation study of the vacuum PV glazing(1) Simulation of a generic building model
Although a series of field tests have been conducted in the outdoor test bed to study the power and thermal performances of the vacuum BIPV glazing, the experimental scenarios are impossible to represent all the situations and variables. Thus, the numerical study was conducted to comprehensively investigate and compare the energy performance of the vacuum PV glazing and other commonly used energy-efficient glazing. As detailed in the research methodology, a comprehensive simulation model based on EnergyPlus and WINDOW has been developed to simulate the overall energy performance of different windows taking into account of their thermal and power output performance. This model is used to simulate the overall energy performance of the vacuum BIPV curtain wall in comparison with other commonly used windows. The key properties of different types of glazing are shown in Table 4 and the electrical specifications of the PV glazing under standard test conditions are referenced to Table 2.
In order to simulate the annual thermal performance and power performance of these types of glazing in Hong Kong for comparison purpose, a typical office room model has been created for simulation, as shown in Figure 17. The dimension of the office model was 2.5m × 2.3m × 2.5m (L × W × H). This room has only one external wall with three identical windows exposed to the outdoor environment. Simulations were conducted for different orientations, i.e. south (S), east (E), west (W) and north (N). A heat transfer model and PV performance model in EnergyPlus are adopted to investigate
the thermal and power performance of different glazing. The heat transfer model is used to calculate the cooling loads of the office room. The cooling loads are then converted to electricity use of air-conditioning system with a presumed coefficient of performance (COP) of 2.78. The equivalent one-diode model is selected to simulate the annual electricity generation from PV elements. The typical meteorological year (TMY) in Hong Kong is selected a reasonable representation of local climates.
The annual cooling electricity use of different types of glazing in different orientations in Hong Kong are shown in Figure 18. It can be observed that the room using vacuum PV glazing consumes the least cooling electricity for all orientations. The south facing room with vacuum PV glazing consumes about 705.56 kWh per year, which was approximately 14.2%, 9.8%, 8.4%, 7.1% and 4.1% less than the corresponding room with single-pane clear glazing, double-pane clear glazing, vacuum glazing, single-pane PV glazing and double-pane PV glazing, respectively. This is because the vacuum PV glazing have the lowest U-value and SHGC among all types of glazing, as shown in Table 4.3. A lower U-value indicates a higher level of heat insulation performance of the glazing, and a lower SHGC means less solar radiation will pass through the windows. Therefore, the vacuum PV glazing performs the best in the area with big temperature difference between indoor and outdoor environment. In addition, the most cooling electricity use of the office room occurs at the west orientation, followed by east, south and north. Therefore, east and west facing windows should have better solar heat insulation performance, to reduce heat gains from outside environment.
In addition to reduce the cooling load of the office room, the PV glazing can also generate electricity in situ. The annual electricity generation of the three types of PV glazing are shown in Figure 19. It can be seen that the annual electricity generation of the three types of PV glazing is similar to each other. The electricity generation from the vacuum PV glazing is a little less than the single-pane PV glazing due to increased solar cell temperature. However, since the temperature coefficient of the thin-film a-Si solar cells is small, the PV conversion efficiency is not reduced significantly. The annual electricity generation from a-Si PV glazing with 12.0% transmittance is around 113.81 kWh per year. Among all orientations, it is better to install PV glazing on the south facade in order to maximize the electricity output in Hong Kong. And it is not recommended to apply PV glazing on north façade due to limited solar radiation available.
Based on the results above, the vacuum PV glazing not only has the best thermal performance among all types of widely used glazing, but also produces a considerable amount of electricity per year. It is recommended to install vacuum PV glazing on south facade to perform the best overall energy performance.
(2) Simulation of the whole building
Apart from modelling studies conducted under the hot and humid climate of Hong Kong, the annual energy performance of different types of glazing in a cold region (i.e. Beijing) was also simulated for comparison. Simulation results are shown in Figure 20 and Figure 21. It can be observed that the room using the vacuum PV glazing achieves the lowest cooling consumption in both climates. In Beijing, the consumed cooling energy with the vacuum PV glazing is much smaller and is 30.2%, 20.8%, 17.0%, 13.8%, 4.4% less than that of the room with other types of glazing. It can be concluded that the energy saving potential of the vacuum PV glazing is much larger in a cold climate while the electricity generation is much higher during the summer time of Beijing due to the smaller solar incidence angle.
The developed simulation model was further applied to a 20-floor prototype office building. Typical floors of the building are divided into 5 conditioned zones, with a total floor area of 540 m2 (as shown in Figure 22). The reference case – Model 1 keeps all windows as the commonly used double-pane clear glazing, while the design cases include Model 2 and Model 3. Model 2 keeps the north-facing window as the conventional double-pane glazing while changes windows orientated to the other three directions to the developed vacuum PV glazing. The opaque part of all building facades is assumed to be covered with traditional crystalline BIPV with a power conversion efficiency of 15% to maximize the power generation potential of the building envelope. Model 3 shares similar settings with Model 2, except that the window transparency is tuned to 20% with a crystalline silicon (c-Si) as shown in Figure 23. Table 5 shows detailed settings of window properties for the three models respectively. The U-value and SHGC of a-Si vacuum PV glazing are obtained from previous experiments and those of double-pane clear glazing are calculated by the simulation software WINDOW. Thermal and power generation properties of c-Si vacuum PV glazing are obtained from existing literatures.
The simulation results of the total heat gain and loss through all windows are presented in Figure 24 and Figure 25. The heat gain and loss both decrease sharply when traditional double-pane clear glazing is replaced by the PV vacuum glazing. The obvious differences between these three models can be identified from the figures. Compared with the performance of Model 1, the heat gain through windows of Model 2 and Model 3 drops up to 77.89% and 77.97% (south-facing windows), while the heat loss of the two models declines up to 79.28% and 79.32% (south-facing windows), respectively.
On the other side, based on the peak office hour electricity price of 1.4 CNY/kWh for cooling and 0.25 CNY/kWh for heating from the Beijing authority, the simple payback period (See Figure 28) when applying the product to the west, east, and south façade is calculated to be 3.8, 4.6 and 5.3 years compared to the single-pane PV glazing. The payback periods are increased to 4.5, 5.4 and 6.5 years when compared with double-pane PV glazing as shown in Figure 29.
As a result, the product can be considered as a cost-effective application in building facades when considering its tremendous saving of air-conditioning energy and corresponding annual expenses. In addition, the property developer could also benefit from a potential increment in renting rates and popularity, if the building gets certified under a green building scheme by claiming credits in CO2 reduction and renewable application assessment criteria. All the abovementioned potential benefits with the application of the vacuum PV glazing would attract more attention from the construction industry.
3.4 Brief technical guideline for the vacuum PV glazingDesigning the vacuum PV glazing (i.e. vacuum BIPV curtain wall) system is a more complex process than a standard added-on PV system. The architectural context, structural requirements, economic considerations and building regulation requirements should all be considered, so that this brief guidance mainly focuses on the below aspects: design strategy, environmental variables, multifunctionality, installation situation, electrical components, and economic aspects (Polysolar Limited, 2015).
(1) Design strategy
Architects, property developers and building users become more inclined to consider renewable and energy efficient applications to meet building and planning regulations due to rising energy bills and awareness of environmental sustainability. The combination of PV and vacuum glazing is an innovative and promising solution to meet these requirements in the new building developments or refurbishment projects. As proved in the above sections of this report, the developed product offers the added advantage of providing a return of investment from the building envelope. Architectural and structural factors, as well as economic considerations should be taken into account at an early stage in any building projects to integrate renewable systems through a more satisfactory approach.
(2) Environmental variables
When designing a BIPV system, a compromise must be reached between the requirements of energy yield optimisation and those of the architectural environment. Therefore, the orientation, lighting performance, shading and temperature are the four mainly concerned issues in BIPV design. According to simulation and experimental results presented in the above sections, the optimal orientation of the installed PV glazing should be south for maximizing the annual power generation, while cooling load reduction is more conspicuous when the product is applied on the west and east facades. Therefore, it is preferable to install the product on all three facades for an optimal overall building energy-saving performance. The visible light transmittance is only 12% in the developed prototype, which might cause slightly more lighting power consumption compared to traditional double-pane clear glazing. However, the transmittance can be easily adjusted to higher than 20% in the manufacture process depending on the effective area of PV materials. There will always be a trade-off between power generation and permeable light, whereas this research has proved that the combined power generation and cooling load reduction can be more than the increased lighting energy use. Power generation performance of the a-Si PV is less sensitive to shadings, so that the prototype is subject to less influence from peripheral shadings. However, if we change the PV material to c-Si for higher conversion efficiency, a shading calculation should be conducted before allocating the BIPV glazing. Lastly, the conversion efficiency of a-Si glazing is also less sensitive to the increase of the panel temperature. The temperature coefficient must be considered if changing the PV material to c-Si.
The vacuum PV glazing was made by sandwiching a layer of PVB between an external PV laminated glass with a visible light transmittance of 12% and an internal vacuum glass. A low-e coating was also adopted to enhance its thermal performance. The structure of the vacuum PV glazing is shown in Figure 5. The dimension of the vacuum PV glazing is 1300 mm (width) × 1100 mm (height) × 20.87 mm (thickness), thinner than commonly used PV double glazed insulating glass units. Figure 6 presents the pictures of the sample of vacuum PV glazing.
This section presents the main findings and outcomes of the research project and indicates their potential impacts on the local energy use and construction industry. Achievements of the specified research objectives are illustrated, and limitations of the project are also mentioned for the reference of future studies.
3.1 Design and production of the prototype productInitially, we proposed a prototype design as specified by Figure 2, where the vacuum layer was directly coupled with the laminated PV panel. However, during initial manufacture trials, the air pressure difference between internal and external spaces of the vacuum glass samples produced by the laminating machine caused the breakage of the vacuum glass samples. Then, we followed an alternative approach using pre-pressure furnace, whereas the molten state of the polyvinyl butyral (PVB) could not meet the expected requirements and the bubbles greatly impacted the appearance and performance of PV module. Finally, we proposed the current product design based on the experience acquired from previous failures (See Figure 5).
The electrical specifications of the vacuum PV glazing under standard test conditions (STC: air mass 1.5, solar irradiation 1000 W/m2 and cell temperature 25°C) are shown in Table 2. Table 3 presents the given thermal and optical properties of the PV laminated glass and vacuum glass, respectively.
(3) Multi-functionality
Due to their mechanical structures, the PV vacuum glazing can perform the functions of the building envelope in addition to generating emission-free energy, and can thus substitute for conventional construction windows or curtain walls. Apart from power generation and architectural function, the product can provide solar shading with its low SHGC value. It can also act as thermal and sound insulation due to its low U-value and acoustic resistance caused by the vacuum chamber between glazing layers. If applied with special coatings/films on top of PV glazing, it can also provide weather protection.
(4) Mounting system and installation
Based on specific requirements of each project in each region, safety, loading capacity and PV installation specifications can have a decisive impact on the method of fixing/mounting the vacuum. We have in this guide attempted to provide a range of options, highlighting what is possible in current design. The product can be installed with a linear mounting system as mullion-transom facades or structural sealant glazing. It can also be mounted with point-fixing systems including clamp fixings and undercut anchor fixings or mounted into standard curtain walling, rain screen cladding and window systems.
(5) Electrical system
In the curtain wall system, several PV glazing with standard size are usually connected together in a string to form the power generator. The generated direct current is usually fed to an inverter where the direct current is converted to alternating current. If on-site storage is not available, which is the common case in urban areas, the electrical power is registered via an electricity meter and connected to the public supply grid, which will require special permissions from the power grid companies (e.g. CLP in Hong Kong). Therefore, the application of the product will require a full set of electrical systems including cables and connections for parallel or series arrays, direct current load-break switches, inverters and generation meters.
(6) Economic considerations
The economic benefits of the product mainly lie in the following aspects: the substitute for original construction component, CO2 emission reduction and corresponding electricity fee waving, compliance with relevant building regulations (i.e. BEAM Plus in Hong Kong) and application of the feed-in-tariff policy (remuneration for electricity generation from PV).
temperature measurements were conducted through the centre of the vacuum PV sample to calculate the U-value. Secondly, the solar heat gains coefficient (SHGC) of the vacuum PV glazing sample was obtained and compared with three other advanced glazing types in an indoor solar irradiation test. Lastly, an outdoor test was conducted on the platform of Block Z in The Hong Kong Polytechnic University to evaluate the overall thermal performance of vacuum PV glazing. A conventional double clear pane glazing was used as a baseline in the outdoor test.
surfaces shows a similar trend in the three directions. Summing up electricity generation in all floors, the integrated PV modules in Model 2 and 3 can provide 285074.72 kWh/year and 355226.3 kWh/year, which accounts for 13.27% and 16.54% of the total building energy consumption of Model 1. Therefore, given the energy use reduction due to less external heat gain, using the vacuum BIPV glazing can save 27.74% (Model 3) electricity compared to a reference building.

05 Construction Industry Council
A combined laminated PV and vacuum glazing is first manufactured according to the schematic diagram illustrated in Figure 2. Then, a small-scale demonstration prototype of the proposed vacuum BIPV curtain wall is set up on the campus of The Hong Kong Polytechnic University for conducting experimental study. The dynamic thermal and power performance of the vacuum BIPV curtain wall is measured for at least two continuous sunny days to demonstrate its energy performance under real local environmental conditions. Some commonly used advanced windows such as the double-pane low-e, double-pane PV and vacuum clear glazing are also chosen for a comparative study to justify the advantage of the vacuum PV glazing in terms of the energy performance by measuring the solar heat gain coefficient (SHGC) and U-value. Based on the comparison results, the optimum type of window or curtain wall adapted to the local climate conditions is identified and recommended to the construction industry. The overall framework of the methodology is illustrated in Figure 3.
2.1 Power output modellingThe power output performance of this vacuum BIPV curtain wall is investigated experimentally and theoretically. The theoretical study on the power performance of the PV system mainly focuses on using a 5-parameter model to simulate the dynamic power performance of PV modules. Firstly, an algorithm developed by De Soto et al. (2006) can be used to calculate the five parameters at STC (standard test condition) based on the test results provided by the PV module manufacturer. Then the five parameters at arbitrary operating temperature and solar radiation can be respectively calculated. The simulation results are validated against the experimental data for further improving the accuracy of the model.
2.2 Thermal performance modellingThe thermal performance of the vacuum BIPV curtain wall is another very important scope of this research. The vacuum BIPV curtain wall is expected to be characterized by perfect thermal performance, which can significantly reduce the energy loss in winter and heat gain in summer. The modelling mainly involves the annual thermal performance of this vacuum BIPV curtain wall as well as the impact of the vacuum BIPV curtain wall on the air-conditioning load reduction. The thermal equilibrium equation for each component of the vacuum BIPV curtain wall is first established in accordance with the energy conversion law, and the finite difference method is then applied to discretize the partial differential heat transfer equations with given parameters such as the solar radiation, ambient temperature, wind speed, composition and dimensions of PV modules (Peng, Lu, Yang, & Han, 2013). Lastly, a computer program coupling the above procedures is developed to numerically simulate the real-time operating temperature of the PV modules as well as the heat flux transferring from exterior to indoor environment. With the above heat transfer models, not only the operating temperature can be simulated, the dynamic heat transfers between the vacuum BIPV modules and the interior can also be calculated. The numerical simulation results can also be compared with the experimental data measured by the heat flux sensors to verify the numerical models and improve their accuracy. Lastly, with the improved heat transfer models, it is possible to study the impact of the vacuum BIPV modules on the annual air conditioning load reduction.
2.3 Building performance modellingTwo types of professional software Berkeley Lab WINDOW and EnergyPlus are used in combination to investigate the overall performance of different windows in a typical office building. Berkeley Lab WINDOW is a software for analyzing the thermal and optical performance of windows made from any combination of glazing layers and gas layers and it also provides a directly accessible glazing system library. EnergyPlus is a building energy simulation software, which can simulate transient heat conduction, daylighting controls, on-site renewable power system and so on (ENERGYPLUS™, 2013). The results of EnergyPlus have been validated by previous studies (Peng et al., 2016; Tabares-Velasco, Christensen, & Bianchi, 2012; Zhou, Wu, Wang, Shiochi, & Li, 2008). Berkeley Lab WINDOW offers a link to EnergyPlus so that the spectral data files of different glazing from Berkeley Lab WINDOW could be imported directly into EnergyPlus for simulation. A comprehensive simulation model is developed to simulate the electricity consumption of the office room that is equipped with different types of windows. The sub-models include thermal balance model, daylighting model and power generation model. After obtaining the simulation results of each model, the overall energy performance of different windows can be investigated. The flowchart of modeling approach is shown in Figure 4.
RESEARCH METHODOLOGY2
The comparison of building energy between Model 1, Model 2 and Model 3 is summarized in Table 6, which includes energy use of lighting, equipment, district cooling and district heating. Although Model 2 and Model 3 consume slightly more lighting energy due to the reduced visible transmittance of the PV glazing, the great energy saving in cooling and heating leads to the net reduction in the total building energy consumption. The total energy consumption of the Model 2 and 3 declines by 20.77 and 22.37 kWh/m2, accounting for 10.44% and 11.20% of Model 1 respectively. Generated electricity of windows and walls in three directions is also presented in Table 7. The south window produced the most electricity, 1527.13 kWh for Model 2 and 3203.76 kWh for Model 3 in a year, taking up nearly 47.80% the total electricity generated by windows. As for the west window, the electricity generated in a year is close to that of east window. Electricity generated by wall
3.2 Experimental study of the vacuum PV glazingOutdoor experimental test was first conducted on the developed prototype vacuum PV (VPV) glazing with the standard size (1.1m × 1.3m), whose various parameters including the ambient air temperature, incident solar irradiation, surface temperatures of the vacuum PV glazing as well as the I-V curves and the power generation were measured and recorded. The power generation and thermal performances of the prototype were also analysed during the test. To further justify the advantage of the vacuum PV glazing, experimental studies were carried out to compare the thermal performance of scaled-down samples (0.3m × 0.3m) with other advanced windows.
(1) Energy performance of the prototypeIn order to evaluate the energy performance of the vacuum PV glazing, an outdoor field measurement was conducted on the platform of Block Z in The Hong Kong Polytechnic University. The vacuum PV glazing was set up horizontally 0.4m above the floor on stilts so that the external temperatures of both sides of the vacuum PV glazing were approximately equal. Various parameters were measured during this test, including the ambient air temperature, the exterior and transmitted horizontal incident solar irradiation, the outer and inner surface temperatures of the vacuum PV glazing as well as the I-V curves and the power generation from the vacuum PV glazing. All the data was logged at an interval of 1 minute. Power generation and thermal performances of the vacuum PV glazing were analyzed based on the outdoor tests. Figure 7 shows the exterior and transmitted incident solar irradiation. It can be seen that the average solar irradiation transmittance during the period is approximately 0.08. Such low transmittance means that vast majority of solar irradiation is blocked by the vacuum PV glazing. Figure 8 presents the outer and inner surface temperature of the vacuum PV glazing. It can be seen that the outer surface temperature is much higher than the inner surface temperature at daytime. The maximum outer surface temperature is 75.3°C, 30°C higher than the inner surface temperature, which indicates that most of the waste heat is dissipated from the outside surface of the vacuum PV glazing, and the heat transfer to the inside space by convection is mitigated. Thus, compared with the conventional single-glazed PV glazing, the structure of the vacuum PV glazing can help reduce the cooling load and improve the indoor thermal comfort.
Then the vacuum PV glazing was mounted on the front side of an experimental test chamber as shown in Figure 9. Clear glass was also adopted in this study for comparison. Figure 10 presents the instantaneous power output of the vacuum PV glazing in 2 sunny days. It can be seen that the power generation from the vacuum PV glazing is consistent with incident solar radiation. A comparative study in terms of internal air temperature of the chamber between the vacuum PV glazing and the clear glass was conducted in a day of June.
As shown in Figure 11, the internal air temperature in the chamber with the vacuum PV glazing is much lower than that with a clear glass. The measured average and maximum internal air temperature for the vacuum PV glazing is 39.6°C and 40.3°C, respectively, while the corresponding average and maximum internal air temperature of the clear glass are 43.6°C and 44.7°C. The maximum internal air temperature difference between the vacuum PV glazing and the clear glass is 4.4°C, occurring in the morning. There are three temperature peaks of internal air temperature. Since the ambient temperature was relatively stable, the main heat gain of the internal air temperature was from incident solar irradiation. The internal air temperature for vacuum PV glazing is much more stable compared with that for the clear glass. The reason is that the vacuum PV glazing has better heat insulation performance so that the internal air temperature is not affected by the external environment significantly. It can also be seen in this figure that the internal air temperature of the chamber drops continuously at 15:00, which shows that the incident solar irradiation on the façade decreases so that the heat gains of the internal air from the sun also drops.
(2) Comparison with other advanced windows
To further justify the advantage of the vacuum PV glazing, experimental studies were carried out to compare it with other advanced windows. Samples of different types of glazing were mounted on the top of two hotboxes (i.e. test rigs) with the uniform dimension of 300 mm (L) × 300 mm (W) × 450mm (H) to implement both indoor and outdoor tests. Firstly, a co-heating test methodology was adopted for the thermal analysis of the vacuum PV glazing. The test rig was filled with the ice-water mixture to ensure the temperature difference between the inside and outside glazing surfaces larger than 5°C. Heat flux and
Figure 12 shows the internal and external temperatures of the vacuum PV glazing sample. The presented data were selected after the hotbox achieved the steady-state condition, when the temperature difference was around 8°C. Heat flux though the glazing sample and the U-value were then determined as illustrated in Figure 13. The average heat flux from the vacuum glazing was measured to be 15.4 W/m2. And the average U-value was calculated as 1.5 W/m2 × K which is much lower than a regular double pane window with the U-value of 2.5W/m2 × K. Considering the edge heat transfer which would strongly affect the heat flux measurement when the sample is small, it can be expected that the centre U-valve of the vacuum PV glazing should be lower than 1.5 W/m2 × K for a larger scale application (e.g. 1.1m × 1.3m).
(3) Cost effective analysis based on simulation
To address the economic benefits of the developed product, the simple payback period of the vacuum PV glazing is calculated with reference to available PV glazing on the market in both Hong Kong and Beijing’s scenarios.
Based on an average electricity price of 1.25 HKD/kWh from HK Electric, the simple payback period (See Figure 26) when applying the product to the west and east façade is calculated to be 7.5 and 8.0 years compared to the single-pane PV glazing. The payback periods are increased to 8.6 and 8.8 years when compared with double-pane PV glazing as shown in Figure 27. However, when applied to the south façade, the extra initial cost of the product cannot be recovered within 10 years.
The solar simulator in the laboratory can provide relatively steady horizontal incident solar irradiation, so that test rigs were located at the same spot to ensure each window sample exposed to the same radiation level. As shown in Figure 14, SHGCs of the vacuum PV glazing and double-pane PV glazing are much smaller than those of the vacuum glazing and double clear glazing, because the coupled PV module can absorb most of the solar irradiation. The vacuum PV glazing has the lowest SHGC of 0.10 which can act as the excellent thermal insulation.
The outdoor test lasted four days from September 26th to September 30th. As shown in Figure 15, September 26th, 27th and 30th were cloudy days and September 28th could be considered as a sunny day. It can be found that the vacuum PV glazing blocks most solar irradiation compared with the double-pane glazing. Figure 16 presents the temperature profile of the vacuum PV glazing and double-pane glazing in the sunny day. The internal surface temperature of both glazing was much higher than the ambient temperature when the outside incident solar radiation is strong. The internal glazing surface and air temperatures of the test rig with the vacuum PV glazing are lower than those of the test rig with the double-pane glazing. The difference between the internal air temperatures of test rigs is much smaller than that of internal glazing surface temperatures. Therefore, the application of vacuum PV glazing can achieve better indoor environment by reducing the solar heat gain.
3.3 Simulation study of the vacuum PV glazing(1) Simulation of a generic building model
Although a series of field tests have been conducted in the outdoor test bed to study the power and thermal performances of the vacuum BIPV glazing, the experimental scenarios are impossible to represent all the situations and variables. Thus, the numerical study was conducted to comprehensively investigate and compare the energy performance of the vacuum PV glazing and other commonly used energy-efficient glazing. As detailed in the research methodology, a comprehensive simulation model based on EnergyPlus and WINDOW has been developed to simulate the overall energy performance of different windows taking into account of their thermal and power output performance. This model is used to simulate the overall energy performance of the vacuum BIPV curtain wall in comparison with other commonly used windows. The key properties of different types of glazing are shown in Table 4 and the electrical specifications of the PV glazing under standard test conditions are referenced to Table 2.
In order to simulate the annual thermal performance and power performance of these types of glazing in Hong Kong for comparison purpose, a typical office room model has been created for simulation, as shown in Figure 17. The dimension of the office model was 2.5m × 2.3m × 2.5m (L × W × H). This room has only one external wall with three identical windows exposed to the outdoor environment. Simulations were conducted for different orientations, i.e. south (S), east (E), west (W) and north (N). A heat transfer model and PV performance model in EnergyPlus are adopted to investigate
the thermal and power performance of different glazing. The heat transfer model is used to calculate the cooling loads of the office room. The cooling loads are then converted to electricity use of air-conditioning system with a presumed coefficient of performance (COP) of 2.78. The equivalent one-diode model is selected to simulate the annual electricity generation from PV elements. The typical meteorological year (TMY) in Hong Kong is selected a reasonable representation of local climates.
The annual cooling electricity use of different types of glazing in different orientations in Hong Kong are shown in Figure 18. It can be observed that the room using vacuum PV glazing consumes the least cooling electricity for all orientations. The south facing room with vacuum PV glazing consumes about 705.56 kWh per year, which was approximately 14.2%, 9.8%, 8.4%, 7.1% and 4.1% less than the corresponding room with single-pane clear glazing, double-pane clear glazing, vacuum glazing, single-pane PV glazing and double-pane PV glazing, respectively. This is because the vacuum PV glazing have the lowest U-value and SHGC among all types of glazing, as shown in Table 4.3. A lower U-value indicates a higher level of heat insulation performance of the glazing, and a lower SHGC means less solar radiation will pass through the windows. Therefore, the vacuum PV glazing performs the best in the area with big temperature difference between indoor and outdoor environment. In addition, the most cooling electricity use of the office room occurs at the west orientation, followed by east, south and north. Therefore, east and west facing windows should have better solar heat insulation performance, to reduce heat gains from outside environment.
In addition to reduce the cooling load of the office room, the PV glazing can also generate electricity in situ. The annual electricity generation of the three types of PV glazing are shown in Figure 19. It can be seen that the annual electricity generation of the three types of PV glazing is similar to each other. The electricity generation from the vacuum PV glazing is a little less than the single-pane PV glazing due to increased solar cell temperature. However, since the temperature coefficient of the thin-film a-Si solar cells is small, the PV conversion efficiency is not reduced significantly. The annual electricity generation from a-Si PV glazing with 12.0% transmittance is around 113.81 kWh per year. Among all orientations, it is better to install PV glazing on the south facade in order to maximize the electricity output in Hong Kong. And it is not recommended to apply PV glazing on north façade due to limited solar radiation available.
Based on the results above, the vacuum PV glazing not only has the best thermal performance among all types of widely used glazing, but also produces a considerable amount of electricity per year. It is recommended to install vacuum PV glazing on south facade to perform the best overall energy performance.
(2) Simulation of the whole building
Apart from modelling studies conducted under the hot and humid climate of Hong Kong, the annual energy performance of different types of glazing in a cold region (i.e. Beijing) was also simulated for comparison. Simulation results are shown in Figure 20 and Figure 21. It can be observed that the room using the vacuum PV glazing achieves the lowest cooling consumption in both climates. In Beijing, the consumed cooling energy with the vacuum PV glazing is much smaller and is 30.2%, 20.8%, 17.0%, 13.8%, 4.4% less than that of the room with other types of glazing. It can be concluded that the energy saving potential of the vacuum PV glazing is much larger in a cold climate while the electricity generation is much higher during the summer time of Beijing due to the smaller solar incidence angle.
The developed simulation model was further applied to a 20-floor prototype office building. Typical floors of the building are divided into 5 conditioned zones, with a total floor area of 540 m2 (as shown in Figure 22). The reference case – Model 1 keeps all windows as the commonly used double-pane clear glazing, while the design cases include Model 2 and Model 3. Model 2 keeps the north-facing window as the conventional double-pane glazing while changes windows orientated to the other three directions to the developed vacuum PV glazing. The opaque part of all building facades is assumed to be covered with traditional crystalline BIPV with a power conversion efficiency of 15% to maximize the power generation potential of the building envelope. Model 3 shares similar settings with Model 2, except that the window transparency is tuned to 20% with a crystalline silicon (c-Si) as shown in Figure 23. Table 5 shows detailed settings of window properties for the three models respectively. The U-value and SHGC of a-Si vacuum PV glazing are obtained from previous experiments and those of double-pane clear glazing are calculated by the simulation software WINDOW. Thermal and power generation properties of c-Si vacuum PV glazing are obtained from existing literatures.
The simulation results of the total heat gain and loss through all windows are presented in Figure 24 and Figure 25. The heat gain and loss both decrease sharply when traditional double-pane clear glazing is replaced by the PV vacuum glazing. The obvious differences between these three models can be identified from the figures. Compared with the performance of Model 1, the heat gain through windows of Model 2 and Model 3 drops up to 77.89% and 77.97% (south-facing windows), while the heat loss of the two models declines up to 79.28% and 79.32% (south-facing windows), respectively.
On the other side, based on the peak office hour electricity price of 1.4 CNY/kWh for cooling and 0.25 CNY/kWh for heating from the Beijing authority, the simple payback period (See Figure 28) when applying the product to the west, east, and south façade is calculated to be 3.8, 4.6 and 5.3 years compared to the single-pane PV glazing. The payback periods are increased to 4.5, 5.4 and 6.5 years when compared with double-pane PV glazing as shown in Figure 29.
As a result, the product can be considered as a cost-effective application in building facades when considering its tremendous saving of air-conditioning energy and corresponding annual expenses. In addition, the property developer could also benefit from a potential increment in renting rates and popularity, if the building gets certified under a green building scheme by claiming credits in CO2 reduction and renewable application assessment criteria. All the abovementioned potential benefits with the application of the vacuum PV glazing would attract more attention from the construction industry.
3.4 Brief technical guideline for the vacuum PV glazingDesigning the vacuum PV glazing (i.e. vacuum BIPV curtain wall) system is a more complex process than a standard added-on PV system. The architectural context, structural requirements, economic considerations and building regulation requirements should all be considered, so that this brief guidance mainly focuses on the below aspects: design strategy, environmental variables, multifunctionality, installation situation, electrical components, and economic aspects (Polysolar Limited, 2015).
(1) Design strategy
Architects, property developers and building users become more inclined to consider renewable and energy efficient applications to meet building and planning regulations due to rising energy bills and awareness of environmental sustainability. The combination of PV and vacuum glazing is an innovative and promising solution to meet these requirements in the new building developments or refurbishment projects. As proved in the above sections of this report, the developed product offers the added advantage of providing a return of investment from the building envelope. Architectural and structural factors, as well as economic considerations should be taken into account at an early stage in any building projects to integrate renewable systems through a more satisfactory approach.
(2) Environmental variables
When designing a BIPV system, a compromise must be reached between the requirements of energy yield optimisation and those of the architectural environment. Therefore, the orientation, lighting performance, shading and temperature are the four mainly concerned issues in BIPV design. According to simulation and experimental results presented in the above sections, the optimal orientation of the installed PV glazing should be south for maximizing the annual power generation, while cooling load reduction is more conspicuous when the product is applied on the west and east facades. Therefore, it is preferable to install the product on all three facades for an optimal overall building energy-saving performance. The visible light transmittance is only 12% in the developed prototype, which might cause slightly more lighting power consumption compared to traditional double-pane clear glazing. However, the transmittance can be easily adjusted to higher than 20% in the manufacture process depending on the effective area of PV materials. There will always be a trade-off between power generation and permeable light, whereas this research has proved that the combined power generation and cooling load reduction can be more than the increased lighting energy use. Power generation performance of the a-Si PV is less sensitive to shadings, so that the prototype is subject to less influence from peripheral shadings. However, if we change the PV material to c-Si for higher conversion efficiency, a shading calculation should be conducted before allocating the BIPV glazing. Lastly, the conversion efficiency of a-Si glazing is also less sensitive to the increase of the panel temperature. The temperature coefficient must be considered if changing the PV material to c-Si.
Investigation on solar vacuumPV curtain wall
Experimental study
Produce vacuum PVglazing samples
Set up an advancedoutdoor test bed
Simulation study
Develop a comprehensivesimulation model
Modelvalidation
A short-termfield test
Improve thesimulation model
Cost effectivenessanalysis
Obtain the annual energysaving potential of solarvacuum PV curtain wall
Figure 3 Framework of the research methodology
2.4 Experiment test of power and thermal performanceExperimental tests of the thermal and power performance of the developed PV vacuum glazing involve miscellaneous equipment such as pyranometers, I-V curve tracers, spectrometers thermocouples, heat flux meters and data loggers. These devices, whose specifications are summarized in Table 1, are used for measuring and recording the ambient temperature, power generation properties, solar radiation and its spectrum distribution, glazing surface temperatures as well as heat gains and heat losses. All sensor signals are recorded by a GL840 Midi Data Logger at a time interval of 1 min. The GL840 Midi Data Logger can accept voltage (from 20 mV to 100 V), temperature, humidity, pulse and logic signals.
The vacuum PV glazing was made by sandwiching a layer of PVB between an external PV laminated glass with a visible light transmittance of 12% and an internal vacuum glass. A low-e coating was also adopted to enhance its thermal performance. The structure of the vacuum PV glazing is shown in Figure 5. The dimension of the vacuum PV glazing is 1300 mm (width) × 1100 mm (height) × 20.87 mm (thickness), thinner than commonly used PV double glazed insulating glass units. Figure 6 presents the pictures of the sample of vacuum PV glazing.
This section presents the main findings and outcomes of the research project and indicates their potential impacts on the local energy use and construction industry. Achievements of the specified research objectives are illustrated, and limitations of the project are also mentioned for the reference of future studies.
3.1 Design and production of the prototype productInitially, we proposed a prototype design as specified by Figure 2, where the vacuum layer was directly coupled with the laminated PV panel. However, during initial manufacture trials, the air pressure difference between internal and external spaces of the vacuum glass samples produced by the laminating machine caused the breakage of the vacuum glass samples. Then, we followed an alternative approach using pre-pressure furnace, whereas the molten state of the polyvinyl butyral (PVB) could not meet the expected requirements and the bubbles greatly impacted the appearance and performance of PV module. Finally, we proposed the current product design based on the experience acquired from previous failures (See Figure 5).
The electrical specifications of the vacuum PV glazing under standard test conditions (STC: air mass 1.5, solar irradiation 1000 W/m2 and cell temperature 25°C) are shown in Table 2. Table 3 presents the given thermal and optical properties of the PV laminated glass and vacuum glass, respectively.
(3) Multi-functionality
Due to their mechanical structures, the PV vacuum glazing can perform the functions of the building envelope in addition to generating emission-free energy, and can thus substitute for conventional construction windows or curtain walls. Apart from power generation and architectural function, the product can provide solar shading with its low SHGC value. It can also act as thermal and sound insulation due to its low U-value and acoustic resistance caused by the vacuum chamber between glazing layers. If applied with special coatings/films on top of PV glazing, it can also provide weather protection.
(4) Mounting system and installation
Based on specific requirements of each project in each region, safety, loading capacity and PV installation specifications can have a decisive impact on the method of fixing/mounting the vacuum. We have in this guide attempted to provide a range of options, highlighting what is possible in current design. The product can be installed with a linear mounting system as mullion-transom facades or structural sealant glazing. It can also be mounted with point-fixing systems including clamp fixings and undercut anchor fixings or mounted into standard curtain walling, rain screen cladding and window systems.
(5) Electrical system
In the curtain wall system, several PV glazing with standard size are usually connected together in a string to form the power generator. The generated direct current is usually fed to an inverter where the direct current is converted to alternating current. If on-site storage is not available, which is the common case in urban areas, the electrical power is registered via an electricity meter and connected to the public supply grid, which will require special permissions from the power grid companies (e.g. CLP in Hong Kong). Therefore, the application of the product will require a full set of electrical systems including cables and connections for parallel or series arrays, direct current load-break switches, inverters and generation meters.
(6) Economic considerations
The economic benefits of the product mainly lie in the following aspects: the substitute for original construction component, CO2 emission reduction and corresponding electricity fee waving, compliance with relevant building regulations (i.e. BEAM Plus in Hong Kong) and application of the feed-in-tariff policy (remuneration for electricity generation from PV).
temperature measurements were conducted through the centre of the vacuum PV sample to calculate the U-value. Secondly, the solar heat gains coefficient (SHGC) of the vacuum PV glazing sample was obtained and compared with three other advanced glazing types in an indoor solar irradiation test. Lastly, an outdoor test was conducted on the platform of Block Z in The Hong Kong Polytechnic University to evaluate the overall thermal performance of vacuum PV glazing. A conventional double clear pane glazing was used as a baseline in the outdoor test.
surfaces shows a similar trend in the three directions. Summing up electricity generation in all floors, the integrated PV modules in Model 2 and 3 can provide 285074.72 kWh/year and 355226.3 kWh/year, which accounts for 13.27% and 16.54% of the total building energy consumption of Model 1. Therefore, given the energy use reduction due to less external heat gain, using the vacuum BIPV glazing can save 27.74% (Model 3) electricity compared to a reference building.

06Investigation on the Thermal and Power Performance of Vacuum BIPV Curtain Wall Technology and its Application Potential in Buildings in Hong Kong
A combined laminated PV and vacuum glazing is first manufactured according to the schematic diagram illustrated in Figure 2. Then, a small-scale demonstration prototype of the proposed vacuum BIPV curtain wall is set up on the campus of The Hong Kong Polytechnic University for conducting experimental study. The dynamic thermal and power performance of the vacuum BIPV curtain wall is measured for at least two continuous sunny days to demonstrate its energy performance under real local environmental conditions. Some commonly used advanced windows such as the double-pane low-e, double-pane PV and vacuum clear glazing are also chosen for a comparative study to justify the advantage of the vacuum PV glazing in terms of the energy performance by measuring the solar heat gain coefficient (SHGC) and U-value. Based on the comparison results, the optimum type of window or curtain wall adapted to the local climate conditions is identified and recommended to the construction industry. The overall framework of the methodology is illustrated in Figure 3.
2.1 Power output modellingThe power output performance of this vacuum BIPV curtain wall is investigated experimentally and theoretically. The theoretical study on the power performance of the PV system mainly focuses on using a 5-parameter model to simulate the dynamic power performance of PV modules. Firstly, an algorithm developed by De Soto et al. (2006) can be used to calculate the five parameters at STC (standard test condition) based on the test results provided by the PV module manufacturer. Then the five parameters at arbitrary operating temperature and solar radiation can be respectively calculated. The simulation results are validated against the experimental data for further improving the accuracy of the model.
2.2 Thermal performance modellingThe thermal performance of the vacuum BIPV curtain wall is another very important scope of this research. The vacuum BIPV curtain wall is expected to be characterized by perfect thermal performance, which can significantly reduce the energy loss in winter and heat gain in summer. The modelling mainly involves the annual thermal performance of this vacuum BIPV curtain wall as well as the impact of the vacuum BIPV curtain wall on the air-conditioning load reduction. The thermal equilibrium equation for each component of the vacuum BIPV curtain wall is first established in accordance with the energy conversion law, and the finite difference method is then applied to discretize the partial differential heat transfer equations with given parameters such as the solar radiation, ambient temperature, wind speed, composition and dimensions of PV modules (Peng, Lu, Yang, & Han, 2013). Lastly, a computer program coupling the above procedures is developed to numerically simulate the real-time operating temperature of the PV modules as well as the heat flux transferring from exterior to indoor environment. With the above heat transfer models, not only the operating temperature can be simulated, the dynamic heat transfers between the vacuum BIPV modules and the interior can also be calculated. The numerical simulation results can also be compared with the experimental data measured by the heat flux sensors to verify the numerical models and improve their accuracy. Lastly, with the improved heat transfer models, it is possible to study the impact of the vacuum BIPV modules on the annual air conditioning load reduction.
2.3 Building performance modellingTwo types of professional software Berkeley Lab WINDOW and EnergyPlus are used in combination to investigate the overall performance of different windows in a typical office building. Berkeley Lab WINDOW is a software for analyzing the thermal and optical performance of windows made from any combination of glazing layers and gas layers and it also provides a directly accessible glazing system library. EnergyPlus is a building energy simulation software, which can simulate transient heat conduction, daylighting controls, on-site renewable power system and so on (ENERGYPLUS™, 2013). The results of EnergyPlus have been validated by previous studies (Peng et al., 2016; Tabares-Velasco, Christensen, & Bianchi, 2012; Zhou, Wu, Wang, Shiochi, & Li, 2008). Berkeley Lab WINDOW offers a link to EnergyPlus so that the spectral data files of different glazing from Berkeley Lab WINDOW could be imported directly into EnergyPlus for simulation. A comprehensive simulation model is developed to simulate the electricity consumption of the office room that is equipped with different types of windows. The sub-models include thermal balance model, daylighting model and power generation model. After obtaining the simulation results of each model, the overall energy performance of different windows can be investigated. The flowchart of modeling approach is shown in Figure 4.
The comparison of building energy between Model 1, Model 2 and Model 3 is summarized in Table 6, which includes energy use of lighting, equipment, district cooling and district heating. Although Model 2 and Model 3 consume slightly more lighting energy due to the reduced visible transmittance of the PV glazing, the great energy saving in cooling and heating leads to the net reduction in the total building energy consumption. The total energy consumption of the Model 2 and 3 declines by 20.77 and 22.37 kWh/m2, accounting for 10.44% and 11.20% of Model 1 respectively. Generated electricity of windows and walls in three directions is also presented in Table 7. The south window produced the most electricity, 1527.13 kWh for Model 2 and 3203.76 kWh for Model 3 in a year, taking up nearly 47.80% the total electricity generated by windows. As for the west window, the electricity generated in a year is close to that of east window. Electricity generated by wall
3.2 Experimental study of the vacuum PV glazingOutdoor experimental test was first conducted on the developed prototype vacuum PV (VPV) glazing with the standard size (1.1m × 1.3m), whose various parameters including the ambient air temperature, incident solar irradiation, surface temperatures of the vacuum PV glazing as well as the I-V curves and the power generation were measured and recorded. The power generation and thermal performances of the prototype were also analysed during the test. To further justify the advantage of the vacuum PV glazing, experimental studies were carried out to compare the thermal performance of scaled-down samples (0.3m × 0.3m) with other advanced windows.
(1) Energy performance of the prototypeIn order to evaluate the energy performance of the vacuum PV glazing, an outdoor field measurement was conducted on the platform of Block Z in The Hong Kong Polytechnic University. The vacuum PV glazing was set up horizontally 0.4m above the floor on stilts so that the external temperatures of both sides of the vacuum PV glazing were approximately equal. Various parameters were measured during this test, including the ambient air temperature, the exterior and transmitted horizontal incident solar irradiation, the outer and inner surface temperatures of the vacuum PV glazing as well as the I-V curves and the power generation from the vacuum PV glazing. All the data was logged at an interval of 1 minute. Power generation and thermal performances of the vacuum PV glazing were analyzed based on the outdoor tests. Figure 7 shows the exterior and transmitted incident solar irradiation. It can be seen that the average solar irradiation transmittance during the period is approximately 0.08. Such low transmittance means that vast majority of solar irradiation is blocked by the vacuum PV glazing. Figure 8 presents the outer and inner surface temperature of the vacuum PV glazing. It can be seen that the outer surface temperature is much higher than the inner surface temperature at daytime. The maximum outer surface temperature is 75.3°C, 30°C higher than the inner surface temperature, which indicates that most of the waste heat is dissipated from the outside surface of the vacuum PV glazing, and the heat transfer to the inside space by convection is mitigated. Thus, compared with the conventional single-glazed PV glazing, the structure of the vacuum PV glazing can help reduce the cooling load and improve the indoor thermal comfort.
Then the vacuum PV glazing was mounted on the front side of an experimental test chamber as shown in Figure 9. Clear glass was also adopted in this study for comparison. Figure 10 presents the instantaneous power output of the vacuum PV glazing in 2 sunny days. It can be seen that the power generation from the vacuum PV glazing is consistent with incident solar radiation. A comparative study in terms of internal air temperature of the chamber between the vacuum PV glazing and the clear glass was conducted in a day of June.
As shown in Figure 11, the internal air temperature in the chamber with the vacuum PV glazing is much lower than that with a clear glass. The measured average and maximum internal air temperature for the vacuum PV glazing is 39.6°C and 40.3°C, respectively, while the corresponding average and maximum internal air temperature of the clear glass are 43.6°C and 44.7°C. The maximum internal air temperature difference between the vacuum PV glazing and the clear glass is 4.4°C, occurring in the morning. There are three temperature peaks of internal air temperature. Since the ambient temperature was relatively stable, the main heat gain of the internal air temperature was from incident solar irradiation. The internal air temperature for vacuum PV glazing is much more stable compared with that for the clear glass. The reason is that the vacuum PV glazing has better heat insulation performance so that the internal air temperature is not affected by the external environment significantly. It can also be seen in this figure that the internal air temperature of the chamber drops continuously at 15:00, which shows that the incident solar irradiation on the façade decreases so that the heat gains of the internal air from the sun also drops.
(2) Comparison with other advanced windows
To further justify the advantage of the vacuum PV glazing, experimental studies were carried out to compare it with other advanced windows. Samples of different types of glazing were mounted on the top of two hotboxes (i.e. test rigs) with the uniform dimension of 300 mm (L) × 300 mm (W) × 450mm (H) to implement both indoor and outdoor tests. Firstly, a co-heating test methodology was adopted for the thermal analysis of the vacuum PV glazing. The test rig was filled with the ice-water mixture to ensure the temperature difference between the inside and outside glazing surfaces larger than 5°C. Heat flux and
Figure 12 shows the internal and external temperatures of the vacuum PV glazing sample. The presented data were selected after the hotbox achieved the steady-state condition, when the temperature difference was around 8°C. Heat flux though the glazing sample and the U-value were then determined as illustrated in Figure 13. The average heat flux from the vacuum glazing was measured to be 15.4 W/m2. And the average U-value was calculated as 1.5 W/m2 × K which is much lower than a regular double pane window with the U-value of 2.5W/m2 × K. Considering the edge heat transfer which would strongly affect the heat flux measurement when the sample is small, it can be expected that the centre U-valve of the vacuum PV glazing should be lower than 1.5 W/m2 × K for a larger scale application (e.g. 1.1m × 1.3m).
(3) Cost effective analysis based on simulation
To address the economic benefits of the developed product, the simple payback period of the vacuum PV glazing is calculated with reference to available PV glazing on the market in both Hong Kong and Beijing’s scenarios.
Based on an average electricity price of 1.25 HKD/kWh from HK Electric, the simple payback period (See Figure 26) when applying the product to the west and east façade is calculated to be 7.5 and 8.0 years compared to the single-pane PV glazing. The payback periods are increased to 8.6 and 8.8 years when compared with double-pane PV glazing as shown in Figure 27. However, when applied to the south façade, the extra initial cost of the product cannot be recovered within 10 years.
The solar simulator in the laboratory can provide relatively steady horizontal incident solar irradiation, so that test rigs were located at the same spot to ensure each window sample exposed to the same radiation level. As shown in Figure 14, SHGCs of the vacuum PV glazing and double-pane PV glazing are much smaller than those of the vacuum glazing and double clear glazing, because the coupled PV module can absorb most of the solar irradiation. The vacuum PV glazing has the lowest SHGC of 0.10 which can act as the excellent thermal insulation.
The outdoor test lasted four days from September 26th to September 30th. As shown in Figure 15, September 26th, 27th and 30th were cloudy days and September 28th could be considered as a sunny day. It can be found that the vacuum PV glazing blocks most solar irradiation compared with the double-pane glazing. Figure 16 presents the temperature profile of the vacuum PV glazing and double-pane glazing in the sunny day. The internal surface temperature of both glazing was much higher than the ambient temperature when the outside incident solar radiation is strong. The internal glazing surface and air temperatures of the test rig with the vacuum PV glazing are lower than those of the test rig with the double-pane glazing. The difference between the internal air temperatures of test rigs is much smaller than that of internal glazing surface temperatures. Therefore, the application of vacuum PV glazing can achieve better indoor environment by reducing the solar heat gain.
3.3 Simulation study of the vacuum PV glazing(1) Simulation of a generic building model
Although a series of field tests have been conducted in the outdoor test bed to study the power and thermal performances of the vacuum BIPV glazing, the experimental scenarios are impossible to represent all the situations and variables. Thus, the numerical study was conducted to comprehensively investigate and compare the energy performance of the vacuum PV glazing and other commonly used energy-efficient glazing. As detailed in the research methodology, a comprehensive simulation model based on EnergyPlus and WINDOW has been developed to simulate the overall energy performance of different windows taking into account of their thermal and power output performance. This model is used to simulate the overall energy performance of the vacuum BIPV curtain wall in comparison with other commonly used windows. The key properties of different types of glazing are shown in Table 4 and the electrical specifications of the PV glazing under standard test conditions are referenced to Table 2.
In order to simulate the annual thermal performance and power performance of these types of glazing in Hong Kong for comparison purpose, a typical office room model has been created for simulation, as shown in Figure 17. The dimension of the office model was 2.5m × 2.3m × 2.5m (L × W × H). This room has only one external wall with three identical windows exposed to the outdoor environment. Simulations were conducted for different orientations, i.e. south (S), east (E), west (W) and north (N). A heat transfer model and PV performance model in EnergyPlus are adopted to investigate
the thermal and power performance of different glazing. The heat transfer model is used to calculate the cooling loads of the office room. The cooling loads are then converted to electricity use of air-conditioning system with a presumed coefficient of performance (COP) of 2.78. The equivalent one-diode model is selected to simulate the annual electricity generation from PV elements. The typical meteorological year (TMY) in Hong Kong is selected a reasonable representation of local climates.
The annual cooling electricity use of different types of glazing in different orientations in Hong Kong are shown in Figure 18. It can be observed that the room using vacuum PV glazing consumes the least cooling electricity for all orientations. The south facing room with vacuum PV glazing consumes about 705.56 kWh per year, which was approximately 14.2%, 9.8%, 8.4%, 7.1% and 4.1% less than the corresponding room with single-pane clear glazing, double-pane clear glazing, vacuum glazing, single-pane PV glazing and double-pane PV glazing, respectively. This is because the vacuum PV glazing have the lowest U-value and SHGC among all types of glazing, as shown in Table 4.3. A lower U-value indicates a higher level of heat insulation performance of the glazing, and a lower SHGC means less solar radiation will pass through the windows. Therefore, the vacuum PV glazing performs the best in the area with big temperature difference between indoor and outdoor environment. In addition, the most cooling electricity use of the office room occurs at the west orientation, followed by east, south and north. Therefore, east and west facing windows should have better solar heat insulation performance, to reduce heat gains from outside environment.
In addition to reduce the cooling load of the office room, the PV glazing can also generate electricity in situ. The annual electricity generation of the three types of PV glazing are shown in Figure 19. It can be seen that the annual electricity generation of the three types of PV glazing is similar to each other. The electricity generation from the vacuum PV glazing is a little less than the single-pane PV glazing due to increased solar cell temperature. However, since the temperature coefficient of the thin-film a-Si solar cells is small, the PV conversion efficiency is not reduced significantly. The annual electricity generation from a-Si PV glazing with 12.0% transmittance is around 113.81 kWh per year. Among all orientations, it is better to install PV glazing on the south facade in order to maximize the electricity output in Hong Kong. And it is not recommended to apply PV glazing on north façade due to limited solar radiation available.
Based on the results above, the vacuum PV glazing not only has the best thermal performance among all types of widely used glazing, but also produces a considerable amount of electricity per year. It is recommended to install vacuum PV glazing on south facade to perform the best overall energy performance.
(2) Simulation of the whole building
Apart from modelling studies conducted under the hot and humid climate of Hong Kong, the annual energy performance of different types of glazing in a cold region (i.e. Beijing) was also simulated for comparison. Simulation results are shown in Figure 20 and Figure 21. It can be observed that the room using the vacuum PV glazing achieves the lowest cooling consumption in both climates. In Beijing, the consumed cooling energy with the vacuum PV glazing is much smaller and is 30.2%, 20.8%, 17.0%, 13.8%, 4.4% less than that of the room with other types of glazing. It can be concluded that the energy saving potential of the vacuum PV glazing is much larger in a cold climate while the electricity generation is much higher during the summer time of Beijing due to the smaller solar incidence angle.
The developed simulation model was further applied to a 20-floor prototype office building. Typical floors of the building are divided into 5 conditioned zones, with a total floor area of 540 m2 (as shown in Figure 22). The reference case – Model 1 keeps all windows as the commonly used double-pane clear glazing, while the design cases include Model 2 and Model 3. Model 2 keeps the north-facing window as the conventional double-pane glazing while changes windows orientated to the other three directions to the developed vacuum PV glazing. The opaque part of all building facades is assumed to be covered with traditional crystalline BIPV with a power conversion efficiency of 15% to maximize the power generation potential of the building envelope. Model 3 shares similar settings with Model 2, except that the window transparency is tuned to 20% with a crystalline silicon (c-Si) as shown in Figure 23. Table 5 shows detailed settings of window properties for the three models respectively. The U-value and SHGC of a-Si vacuum PV glazing are obtained from previous experiments and those of double-pane clear glazing are calculated by the simulation software WINDOW. Thermal and power generation properties of c-Si vacuum PV glazing are obtained from existing literatures.
The simulation results of the total heat gain and loss through all windows are presented in Figure 24 and Figure 25. The heat gain and loss both decrease sharply when traditional double-pane clear glazing is replaced by the PV vacuum glazing. The obvious differences between these three models can be identified from the figures. Compared with the performance of Model 1, the heat gain through windows of Model 2 and Model 3 drops up to 77.89% and 77.97% (south-facing windows), while the heat loss of the two models declines up to 79.28% and 79.32% (south-facing windows), respectively.
On the other side, based on the peak office hour electricity price of 1.4 CNY/kWh for cooling and 0.25 CNY/kWh for heating from the Beijing authority, the simple payback period (See Figure 28) when applying the product to the west, east, and south façade is calculated to be 3.8, 4.6 and 5.3 years compared to the single-pane PV glazing. The payback periods are increased to 4.5, 5.4 and 6.5 years when compared with double-pane PV glazing as shown in Figure 29.
As a result, the product can be considered as a cost-effective application in building facades when considering its tremendous saving of air-conditioning energy and corresponding annual expenses. In addition, the property developer could also benefit from a potential increment in renting rates and popularity, if the building gets certified under a green building scheme by claiming credits in CO2 reduction and renewable application assessment criteria. All the abovementioned potential benefits with the application of the vacuum PV glazing would attract more attention from the construction industry.
3.4 Brief technical guideline for the vacuum PV glazingDesigning the vacuum PV glazing (i.e. vacuum BIPV curtain wall) system is a more complex process than a standard added-on PV system. The architectural context, structural requirements, economic considerations and building regulation requirements should all be considered, so that this brief guidance mainly focuses on the below aspects: design strategy, environmental variables, multifunctionality, installation situation, electrical components, and economic aspects (Polysolar Limited, 2015).
(1) Design strategy
Architects, property developers and building users become more inclined to consider renewable and energy efficient applications to meet building and planning regulations due to rising energy bills and awareness of environmental sustainability. The combination of PV and vacuum glazing is an innovative and promising solution to meet these requirements in the new building developments or refurbishment projects. As proved in the above sections of this report, the developed product offers the added advantage of providing a return of investment from the building envelope. Architectural and structural factors, as well as economic considerations should be taken into account at an early stage in any building projects to integrate renewable systems through a more satisfactory approach.
(2) Environmental variables
When designing a BIPV system, a compromise must be reached between the requirements of energy yield optimisation and those of the architectural environment. Therefore, the orientation, lighting performance, shading and temperature are the four mainly concerned issues in BIPV design. According to simulation and experimental results presented in the above sections, the optimal orientation of the installed PV glazing should be south for maximizing the annual power generation, while cooling load reduction is more conspicuous when the product is applied on the west and east facades. Therefore, it is preferable to install the product on all three facades for an optimal overall building energy-saving performance. The visible light transmittance is only 12% in the developed prototype, which might cause slightly more lighting power consumption compared to traditional double-pane clear glazing. However, the transmittance can be easily adjusted to higher than 20% in the manufacture process depending on the effective area of PV materials. There will always be a trade-off between power generation and permeable light, whereas this research has proved that the combined power generation and cooling load reduction can be more than the increased lighting energy use. Power generation performance of the a-Si PV is less sensitive to shadings, so that the prototype is subject to less influence from peripheral shadings. However, if we change the PV material to c-Si for higher conversion efficiency, a shading calculation should be conducted before allocating the BIPV glazing. Lastly, the conversion efficiency of a-Si glazing is also less sensitive to the increase of the panel temperature. The temperature coefficient must be considered if changing the PV material to c-Si.
2.4 Experiment test of power and thermal performanceExperimental tests of the thermal and power performance of the developed PV vacuum glazing involve miscellaneous equipment such as pyranometers, I-V curve tracers, spectrometers thermocouples, heat flux meters and data loggers. These devices, whose specifications are summarized in Table 1, are used for measuring and recording the ambient temperature, power generation properties, solar radiation and its spectrum distribution, glazing surface temperatures as well as heat gains and heat losses. All sensor signals are recorded by a GL840 Midi Data Logger at a time interval of 1 min. The GL840 Midi Data Logger can accept voltage (from 20 mV to 100 V), temperature, humidity, pulse and logic signals.
The vacuum PV glazing was made by sandwiching a layer of PVB between an external PV laminated glass with a visible light transmittance of 12% and an internal vacuum glass. A low-e coating was also adopted to enhance its thermal performance. The structure of the vacuum PV glazing is shown in Figure 5. The dimension of the vacuum PV glazing is 1300 mm (width) × 1100 mm (height) × 20.87 mm (thickness), thinner than commonly used PV double glazed insulating glass units. Figure 6 presents the pictures of the sample of vacuum PV glazing.
This section presents the main findings and outcomes of the research project and indicates their potential impacts on the local energy use and construction industry. Achievements of the specified research objectives are illustrated, and limitations of the project are also mentioned for the reference of future studies.
3.1 Design and production of the prototype productInitially, we proposed a prototype design as specified by Figure 2, where the vacuum layer was directly coupled with the laminated PV panel. However, during initial manufacture trials, the air pressure difference between internal and external spaces of the vacuum glass samples produced by the laminating machine caused the breakage of the vacuum glass samples. Then, we followed an alternative approach using pre-pressure furnace, whereas the molten state of the polyvinyl butyral (PVB) could not meet the expected requirements and the bubbles greatly impacted the appearance and performance of PV module. Finally, we proposed the current product design based on the experience acquired from previous failures (See Figure 5).
The electrical specifications of the vacuum PV glazing under standard test conditions (STC: air mass 1.5, solar irradiation 1000 W/m2 and cell temperature 25°C) are shown in Table 2. Table 3 presents the given thermal and optical properties of the PV laminated glass and vacuum glass, respectively.
(3) Multi-functionality
Due to their mechanical structures, the PV vacuum glazing can perform the functions of the building envelope in addition to generating emission-free energy, and can thus substitute for conventional construction windows or curtain walls. Apart from power generation and architectural function, the product can provide solar shading with its low SHGC value. It can also act as thermal and sound insulation due to its low U-value and acoustic resistance caused by the vacuum chamber between glazing layers. If applied with special coatings/films on top of PV glazing, it can also provide weather protection.
(4) Mounting system and installation
Based on specific requirements of each project in each region, safety, loading capacity and PV installation specifications can have a decisive impact on the method of fixing/mounting the vacuum. We have in this guide attempted to provide a range of options, highlighting what is possible in current design. The product can be installed with a linear mounting system as mullion-transom facades or structural sealant glazing. It can also be mounted with point-fixing systems including clamp fixings and undercut anchor fixings or mounted into standard curtain walling, rain screen cladding and window systems.
(5) Electrical system
In the curtain wall system, several PV glazing with standard size are usually connected together in a string to form the power generator. The generated direct current is usually fed to an inverter where the direct current is converted to alternating current. If on-site storage is not available, which is the common case in urban areas, the electrical power is registered via an electricity meter and connected to the public supply grid, which will require special permissions from the power grid companies (e.g. CLP in Hong Kong). Therefore, the application of the product will require a full set of electrical systems including cables and connections for parallel or series arrays, direct current load-break switches, inverters and generation meters.
(6) Economic considerations
The economic benefits of the product mainly lie in the following aspects: the substitute for original construction component, CO2 emission reduction and corresponding electricity fee waving, compliance with relevant building regulations (i.e. BEAM Plus in Hong Kong) and application of the feed-in-tariff policy (remuneration for electricity generation from PV).
temperature measurements were conducted through the centre of the vacuum PV sample to calculate the U-value. Secondly, the solar heat gains coefficient (SHGC) of the vacuum PV glazing sample was obtained and compared with three other advanced glazing types in an indoor solar irradiation test. Lastly, an outdoor test was conducted on the platform of Block Z in The Hong Kong Polytechnic University to evaluate the overall thermal performance of vacuum PV glazing. A conventional double clear pane glazing was used as a baseline in the outdoor test.
surfaces shows a similar trend in the three directions. Summing up electricity generation in all floors, the integrated PV modules in Model 2 and 3 can provide 285074.72 kWh/year and 355226.3 kWh/year, which accounts for 13.27% and 16.54% of the total building energy consumption of Model 1. Therefore, given the energy use reduction due to less external heat gain, using the vacuum BIPV glazing can save 27.74% (Model 3) electricity compared to a reference building.

07 Construction Industry Council
A combined laminated PV and vacuum glazing is first manufactured according to the schematic diagram illustrated in Figure 2. Then, a small-scale demonstration prototype of the proposed vacuum BIPV curtain wall is set up on the campus of The Hong Kong Polytechnic University for conducting experimental study. The dynamic thermal and power performance of the vacuum BIPV curtain wall is measured for at least two continuous sunny days to demonstrate its energy performance under real local environmental conditions. Some commonly used advanced windows such as the double-pane low-e, double-pane PV and vacuum clear glazing are also chosen for a comparative study to justify the advantage of the vacuum PV glazing in terms of the energy performance by measuring the solar heat gain coefficient (SHGC) and U-value. Based on the comparison results, the optimum type of window or curtain wall adapted to the local climate conditions is identified and recommended to the construction industry. The overall framework of the methodology is illustrated in Figure 3.
2.1 Power output modellingThe power output performance of this vacuum BIPV curtain wall is investigated experimentally and theoretically. The theoretical study on the power performance of the PV system mainly focuses on using a 5-parameter model to simulate the dynamic power performance of PV modules. Firstly, an algorithm developed by De Soto et al. (2006) can be used to calculate the five parameters at STC (standard test condition) based on the test results provided by the PV module manufacturer. Then the five parameters at arbitrary operating temperature and solar radiation can be respectively calculated. The simulation results are validated against the experimental data for further improving the accuracy of the model.
2.2 Thermal performance modellingThe thermal performance of the vacuum BIPV curtain wall is another very important scope of this research. The vacuum BIPV curtain wall is expected to be characterized by perfect thermal performance, which can significantly reduce the energy loss in winter and heat gain in summer. The modelling mainly involves the annual thermal performance of this vacuum BIPV curtain wall as well as the impact of the vacuum BIPV curtain wall on the air-conditioning load reduction. The thermal equilibrium equation for each component of the vacuum BIPV curtain wall is first established in accordance with the energy conversion law, and the finite difference method is then applied to discretize the partial differential heat transfer equations with given parameters such as the solar radiation, ambient temperature, wind speed, composition and dimensions of PV modules (Peng, Lu, Yang, & Han, 2013). Lastly, a computer program coupling the above procedures is developed to numerically simulate the real-time operating temperature of the PV modules as well as the heat flux transferring from exterior to indoor environment. With the above heat transfer models, not only the operating temperature can be simulated, the dynamic heat transfers between the vacuum BIPV modules and the interior can also be calculated. The numerical simulation results can also be compared with the experimental data measured by the heat flux sensors to verify the numerical models and improve their accuracy. Lastly, with the improved heat transfer models, it is possible to study the impact of the vacuum BIPV modules on the annual air conditioning load reduction.
2.3 Building performance modellingTwo types of professional software Berkeley Lab WINDOW and EnergyPlus are used in combination to investigate the overall performance of different windows in a typical office building. Berkeley Lab WINDOW is a software for analyzing the thermal and optical performance of windows made from any combination of glazing layers and gas layers and it also provides a directly accessible glazing system library. EnergyPlus is a building energy simulation software, which can simulate transient heat conduction, daylighting controls, on-site renewable power system and so on (ENERGYPLUS™, 2013). The results of EnergyPlus have been validated by previous studies (Peng et al., 2016; Tabares-Velasco, Christensen, & Bianchi, 2012; Zhou, Wu, Wang, Shiochi, & Li, 2008). Berkeley Lab WINDOW offers a link to EnergyPlus so that the spectral data files of different glazing from Berkeley Lab WINDOW could be imported directly into EnergyPlus for simulation. A comprehensive simulation model is developed to simulate the electricity consumption of the office room that is equipped with different types of windows. The sub-models include thermal balance model, daylighting model and power generation model. After obtaining the simulation results of each model, the overall energy performance of different windows can be investigated. The flowchart of modeling approach is shown in Figure 4.
The comparison of building energy between Model 1, Model 2 and Model 3 is summarized in Table 6, which includes energy use of lighting, equipment, district cooling and district heating. Although Model 2 and Model 3 consume slightly more lighting energy due to the reduced visible transmittance of the PV glazing, the great energy saving in cooling and heating leads to the net reduction in the total building energy consumption. The total energy consumption of the Model 2 and 3 declines by 20.77 and 22.37 kWh/m2, accounting for 10.44% and 11.20% of Model 1 respectively. Generated electricity of windows and walls in three directions is also presented in Table 7. The south window produced the most electricity, 1527.13 kWh for Model 2 and 3203.76 kWh for Model 3 in a year, taking up nearly 47.80% the total electricity generated by windows. As for the west window, the electricity generated in a year is close to that of east window. Electricity generated by wall
3.2 Experimental study of the vacuum PV glazingOutdoor experimental test was first conducted on the developed prototype vacuum PV (VPV) glazing with the standard size (1.1m × 1.3m), whose various parameters including the ambient air temperature, incident solar irradiation, surface temperatures of the vacuum PV glazing as well as the I-V curves and the power generation were measured and recorded. The power generation and thermal performances of the prototype were also analysed during the test. To further justify the advantage of the vacuum PV glazing, experimental studies were carried out to compare the thermal performance of scaled-down samples (0.3m × 0.3m) with other advanced windows.
(1) Energy performance of the prototypeIn order to evaluate the energy performance of the vacuum PV glazing, an outdoor field measurement was conducted on the platform of Block Z in The Hong Kong Polytechnic University. The vacuum PV glazing was set up horizontally 0.4m above the floor on stilts so that the external temperatures of both sides of the vacuum PV glazing were approximately equal. Various parameters were measured during this test, including the ambient air temperature, the exterior and transmitted horizontal incident solar irradiation, the outer and inner surface temperatures of the vacuum PV glazing as well as the I-V curves and the power generation from the vacuum PV glazing. All the data was logged at an interval of 1 minute. Power generation and thermal performances of the vacuum PV glazing were analyzed based on the outdoor tests. Figure 7 shows the exterior and transmitted incident solar irradiation. It can be seen that the average solar irradiation transmittance during the period is approximately 0.08. Such low transmittance means that vast majority of solar irradiation is blocked by the vacuum PV glazing. Figure 8 presents the outer and inner surface temperature of the vacuum PV glazing. It can be seen that the outer surface temperature is much higher than the inner surface temperature at daytime. The maximum outer surface temperature is 75.3°C, 30°C higher than the inner surface temperature, which indicates that most of the waste heat is dissipated from the outside surface of the vacuum PV glazing, and the heat transfer to the inside space by convection is mitigated. Thus, compared with the conventional single-glazed PV glazing, the structure of the vacuum PV glazing can help reduce the cooling load and improve the indoor thermal comfort.
Then the vacuum PV glazing was mounted on the front side of an experimental test chamber as shown in Figure 9. Clear glass was also adopted in this study for comparison. Figure 10 presents the instantaneous power output of the vacuum PV glazing in 2 sunny days. It can be seen that the power generation from the vacuum PV glazing is consistent with incident solar radiation. A comparative study in terms of internal air temperature of the chamber between the vacuum PV glazing and the clear glass was conducted in a day of June.
As shown in Figure 11, the internal air temperature in the chamber with the vacuum PV glazing is much lower than that with a clear glass. The measured average and maximum internal air temperature for the vacuum PV glazing is 39.6°C and 40.3°C, respectively, while the corresponding average and maximum internal air temperature of the clear glass are 43.6°C and 44.7°C. The maximum internal air temperature difference between the vacuum PV glazing and the clear glass is 4.4°C, occurring in the morning. There are three temperature peaks of internal air temperature. Since the ambient temperature was relatively stable, the main heat gain of the internal air temperature was from incident solar irradiation. The internal air temperature for vacuum PV glazing is much more stable compared with that for the clear glass. The reason is that the vacuum PV glazing has better heat insulation performance so that the internal air temperature is not affected by the external environment significantly. It can also be seen in this figure that the internal air temperature of the chamber drops continuously at 15:00, which shows that the incident solar irradiation on the façade decreases so that the heat gains of the internal air from the sun also drops.
(2) Comparison with other advanced windows
To further justify the advantage of the vacuum PV glazing, experimental studies were carried out to compare it with other advanced windows. Samples of different types of glazing were mounted on the top of two hotboxes (i.e. test rigs) with the uniform dimension of 300 mm (L) × 300 mm (W) × 450mm (H) to implement both indoor and outdoor tests. Firstly, a co-heating test methodology was adopted for the thermal analysis of the vacuum PV glazing. The test rig was filled with the ice-water mixture to ensure the temperature difference between the inside and outside glazing surfaces larger than 5°C. Heat flux and
Figure 12 shows the internal and external temperatures of the vacuum PV glazing sample. The presented data were selected after the hotbox achieved the steady-state condition, when the temperature difference was around 8°C. Heat flux though the glazing sample and the U-value were then determined as illustrated in Figure 13. The average heat flux from the vacuum glazing was measured to be 15.4 W/m2. And the average U-value was calculated as 1.5 W/m2 × K which is much lower than a regular double pane window with the U-value of 2.5W/m2 × K. Considering the edge heat transfer which would strongly affect the heat flux measurement when the sample is small, it can be expected that the centre U-valve of the vacuum PV glazing should be lower than 1.5 W/m2 × K for a larger scale application (e.g. 1.1m × 1.3m).
(3) Cost effective analysis based on simulation
To address the economic benefits of the developed product, the simple payback period of the vacuum PV glazing is calculated with reference to available PV glazing on the market in both Hong Kong and Beijing’s scenarios.
Based on an average electricity price of 1.25 HKD/kWh from HK Electric, the simple payback period (See Figure 26) when applying the product to the west and east façade is calculated to be 7.5 and 8.0 years compared to the single-pane PV glazing. The payback periods are increased to 8.6 and 8.8 years when compared with double-pane PV glazing as shown in Figure 27. However, when applied to the south façade, the extra initial cost of the product cannot be recovered within 10 years.
The solar simulator in the laboratory can provide relatively steady horizontal incident solar irradiation, so that test rigs were located at the same spot to ensure each window sample exposed to the same radiation level. As shown in Figure 14, SHGCs of the vacuum PV glazing and double-pane PV glazing are much smaller than those of the vacuum glazing and double clear glazing, because the coupled PV module can absorb most of the solar irradiation. The vacuum PV glazing has the lowest SHGC of 0.10 which can act as the excellent thermal insulation.
The outdoor test lasted four days from September 26th to September 30th. As shown in Figure 15, September 26th, 27th and 30th were cloudy days and September 28th could be considered as a sunny day. It can be found that the vacuum PV glazing blocks most solar irradiation compared with the double-pane glazing. Figure 16 presents the temperature profile of the vacuum PV glazing and double-pane glazing in the sunny day. The internal surface temperature of both glazing was much higher than the ambient temperature when the outside incident solar radiation is strong. The internal glazing surface and air temperatures of the test rig with the vacuum PV glazing are lower than those of the test rig with the double-pane glazing. The difference between the internal air temperatures of test rigs is much smaller than that of internal glazing surface temperatures. Therefore, the application of vacuum PV glazing can achieve better indoor environment by reducing the solar heat gain.
3.3 Simulation study of the vacuum PV glazing(1) Simulation of a generic building model
Although a series of field tests have been conducted in the outdoor test bed to study the power and thermal performances of the vacuum BIPV glazing, the experimental scenarios are impossible to represent all the situations and variables. Thus, the numerical study was conducted to comprehensively investigate and compare the energy performance of the vacuum PV glazing and other commonly used energy-efficient glazing. As detailed in the research methodology, a comprehensive simulation model based on EnergyPlus and WINDOW has been developed to simulate the overall energy performance of different windows taking into account of their thermal and power output performance. This model is used to simulate the overall energy performance of the vacuum BIPV curtain wall in comparison with other commonly used windows. The key properties of different types of glazing are shown in Table 4 and the electrical specifications of the PV glazing under standard test conditions are referenced to Table 2.
In order to simulate the annual thermal performance and power performance of these types of glazing in Hong Kong for comparison purpose, a typical office room model has been created for simulation, as shown in Figure 17. The dimension of the office model was 2.5m × 2.3m × 2.5m (L × W × H). This room has only one external wall with three identical windows exposed to the outdoor environment. Simulations were conducted for different orientations, i.e. south (S), east (E), west (W) and north (N). A heat transfer model and PV performance model in EnergyPlus are adopted to investigate
the thermal and power performance of different glazing. The heat transfer model is used to calculate the cooling loads of the office room. The cooling loads are then converted to electricity use of air-conditioning system with a presumed coefficient of performance (COP) of 2.78. The equivalent one-diode model is selected to simulate the annual electricity generation from PV elements. The typical meteorological year (TMY) in Hong Kong is selected a reasonable representation of local climates.
The annual cooling electricity use of different types of glazing in different orientations in Hong Kong are shown in Figure 18. It can be observed that the room using vacuum PV glazing consumes the least cooling electricity for all orientations. The south facing room with vacuum PV glazing consumes about 705.56 kWh per year, which was approximately 14.2%, 9.8%, 8.4%, 7.1% and 4.1% less than the corresponding room with single-pane clear glazing, double-pane clear glazing, vacuum glazing, single-pane PV glazing and double-pane PV glazing, respectively. This is because the vacuum PV glazing have the lowest U-value and SHGC among all types of glazing, as shown in Table 4.3. A lower U-value indicates a higher level of heat insulation performance of the glazing, and a lower SHGC means less solar radiation will pass through the windows. Therefore, the vacuum PV glazing performs the best in the area with big temperature difference between indoor and outdoor environment. In addition, the most cooling electricity use of the office room occurs at the west orientation, followed by east, south and north. Therefore, east and west facing windows should have better solar heat insulation performance, to reduce heat gains from outside environment.
In addition to reduce the cooling load of the office room, the PV glazing can also generate electricity in situ. The annual electricity generation of the three types of PV glazing are shown in Figure 19. It can be seen that the annual electricity generation of the three types of PV glazing is similar to each other. The electricity generation from the vacuum PV glazing is a little less than the single-pane PV glazing due to increased solar cell temperature. However, since the temperature coefficient of the thin-film a-Si solar cells is small, the PV conversion efficiency is not reduced significantly. The annual electricity generation from a-Si PV glazing with 12.0% transmittance is around 113.81 kWh per year. Among all orientations, it is better to install PV glazing on the south facade in order to maximize the electricity output in Hong Kong. And it is not recommended to apply PV glazing on north façade due to limited solar radiation available.
Based on the results above, the vacuum PV glazing not only has the best thermal performance among all types of widely used glazing, but also produces a considerable amount of electricity per year. It is recommended to install vacuum PV glazing on south facade to perform the best overall energy performance.
(2) Simulation of the whole building
Apart from modelling studies conducted under the hot and humid climate of Hong Kong, the annual energy performance of different types of glazing in a cold region (i.e. Beijing) was also simulated for comparison. Simulation results are shown in Figure 20 and Figure 21. It can be observed that the room using the vacuum PV glazing achieves the lowest cooling consumption in both climates. In Beijing, the consumed cooling energy with the vacuum PV glazing is much smaller and is 30.2%, 20.8%, 17.0%, 13.8%, 4.4% less than that of the room with other types of glazing. It can be concluded that the energy saving potential of the vacuum PV glazing is much larger in a cold climate while the electricity generation is much higher during the summer time of Beijing due to the smaller solar incidence angle.
The developed simulation model was further applied to a 20-floor prototype office building. Typical floors of the building are divided into 5 conditioned zones, with a total floor area of 540 m2 (as shown in Figure 22). The reference case – Model 1 keeps all windows as the commonly used double-pane clear glazing, while the design cases include Model 2 and Model 3. Model 2 keeps the north-facing window as the conventional double-pane glazing while changes windows orientated to the other three directions to the developed vacuum PV glazing. The opaque part of all building facades is assumed to be covered with traditional crystalline BIPV with a power conversion efficiency of 15% to maximize the power generation potential of the building envelope. Model 3 shares similar settings with Model 2, except that the window transparency is tuned to 20% with a crystalline silicon (c-Si) as shown in Figure 23. Table 5 shows detailed settings of window properties for the three models respectively. The U-value and SHGC of a-Si vacuum PV glazing are obtained from previous experiments and those of double-pane clear glazing are calculated by the simulation software WINDOW. Thermal and power generation properties of c-Si vacuum PV glazing are obtained from existing literatures.
The simulation results of the total heat gain and loss through all windows are presented in Figure 24 and Figure 25. The heat gain and loss both decrease sharply when traditional double-pane clear glazing is replaced by the PV vacuum glazing. The obvious differences between these three models can be identified from the figures. Compared with the performance of Model 1, the heat gain through windows of Model 2 and Model 3 drops up to 77.89% and 77.97% (south-facing windows), while the heat loss of the two models declines up to 79.28% and 79.32% (south-facing windows), respectively.
On the other side, based on the peak office hour electricity price of 1.4 CNY/kWh for cooling and 0.25 CNY/kWh for heating from the Beijing authority, the simple payback period (See Figure 28) when applying the product to the west, east, and south façade is calculated to be 3.8, 4.6 and 5.3 years compared to the single-pane PV glazing. The payback periods are increased to 4.5, 5.4 and 6.5 years when compared with double-pane PV glazing as shown in Figure 29.
As a result, the product can be considered as a cost-effective application in building facades when considering its tremendous saving of air-conditioning energy and corresponding annual expenses. In addition, the property developer could also benefit from a potential increment in renting rates and popularity, if the building gets certified under a green building scheme by claiming credits in CO2 reduction and renewable application assessment criteria. All the abovementioned potential benefits with the application of the vacuum PV glazing would attract more attention from the construction industry.
3.4 Brief technical guideline for the vacuum PV glazingDesigning the vacuum PV glazing (i.e. vacuum BIPV curtain wall) system is a more complex process than a standard added-on PV system. The architectural context, structural requirements, economic considerations and building regulation requirements should all be considered, so that this brief guidance mainly focuses on the below aspects: design strategy, environmental variables, multifunctionality, installation situation, electrical components, and economic aspects (Polysolar Limited, 2015).
(1) Design strategy
Architects, property developers and building users become more inclined to consider renewable and energy efficient applications to meet building and planning regulations due to rising energy bills and awareness of environmental sustainability. The combination of PV and vacuum glazing is an innovative and promising solution to meet these requirements in the new building developments or refurbishment projects. As proved in the above sections of this report, the developed product offers the added advantage of providing a return of investment from the building envelope. Architectural and structural factors, as well as economic considerations should be taken into account at an early stage in any building projects to integrate renewable systems through a more satisfactory approach.
(2) Environmental variables
When designing a BIPV system, a compromise must be reached between the requirements of energy yield optimisation and those of the architectural environment. Therefore, the orientation, lighting performance, shading and temperature are the four mainly concerned issues in BIPV design. According to simulation and experimental results presented in the above sections, the optimal orientation of the installed PV glazing should be south for maximizing the annual power generation, while cooling load reduction is more conspicuous when the product is applied on the west and east facades. Therefore, it is preferable to install the product on all three facades for an optimal overall building energy-saving performance. The visible light transmittance is only 12% in the developed prototype, which might cause slightly more lighting power consumption compared to traditional double-pane clear glazing. However, the transmittance can be easily adjusted to higher than 20% in the manufacture process depending on the effective area of PV materials. There will always be a trade-off between power generation and permeable light, whereas this research has proved that the combined power generation and cooling load reduction can be more than the increased lighting energy use. Power generation performance of the a-Si PV is less sensitive to shadings, so that the prototype is subject to less influence from peripheral shadings. However, if we change the PV material to c-Si for higher conversion efficiency, a shading calculation should be conducted before allocating the BIPV glazing. Lastly, the conversion efficiency of a-Si glazing is also less sensitive to the increase of the panel temperature. The temperature coefficient must be considered if changing the PV material to c-Si.
Energy Plus
Thermal Balance Model Daylighting Model Power Generation Model
Electricity Generationfrom PV windows
Electricity Consumptionfrom Artificial Lighting
Electricity Consumptionfrom Air-conditioning
Electricity Consumption
Overall Energy Performance
Electricity Generation
Figure 4 Flowchart of the modeling approach in EnergyPlus
2.4 Experiment test of power and thermal performanceExperimental tests of the thermal and power performance of the developed PV vacuum glazing involve miscellaneous equipment such as pyranometers, I-V curve tracers, spectrometers thermocouples, heat flux meters and data loggers. These devices, whose specifications are summarized in Table 1, are used for measuring and recording the ambient temperature, power generation properties, solar radiation and its spectrum distribution, glazing surface temperatures as well as heat gains and heat losses. All sensor signals are recorded by a GL840 Midi Data Logger at a time interval of 1 min. The GL840 Midi Data Logger can accept voltage (from 20 mV to 100 V), temperature, humidity, pulse and logic signals.
The vacuum PV glazing was made by sandwiching a layer of PVB between an external PV laminated glass with a visible light transmittance of 12% and an internal vacuum glass. A low-e coating was also adopted to enhance its thermal performance. The structure of the vacuum PV glazing is shown in Figure 5. The dimension of the vacuum PV glazing is 1300 mm (width) × 1100 mm (height) × 20.87 mm (thickness), thinner than commonly used PV double glazed insulating glass units. Figure 6 presents the pictures of the sample of vacuum PV glazing.
This section presents the main findings and outcomes of the research project and indicates their potential impacts on the local energy use and construction industry. Achievements of the specified research objectives are illustrated, and limitations of the project are also mentioned for the reference of future studies.
3.1 Design and production of the prototype productInitially, we proposed a prototype design as specified by Figure 2, where the vacuum layer was directly coupled with the laminated PV panel. However, during initial manufacture trials, the air pressure difference between internal and external spaces of the vacuum glass samples produced by the laminating machine caused the breakage of the vacuum glass samples. Then, we followed an alternative approach using pre-pressure furnace, whereas the molten state of the polyvinyl butyral (PVB) could not meet the expected requirements and the bubbles greatly impacted the appearance and performance of PV module. Finally, we proposed the current product design based on the experience acquired from previous failures (See Figure 5).
The electrical specifications of the vacuum PV glazing under standard test conditions (STC: air mass 1.5, solar irradiation 1000 W/m2 and cell temperature 25°C) are shown in Table 2. Table 3 presents the given thermal and optical properties of the PV laminated glass and vacuum glass, respectively.
(3) Multi-functionality
Due to their mechanical structures, the PV vacuum glazing can perform the functions of the building envelope in addition to generating emission-free energy, and can thus substitute for conventional construction windows or curtain walls. Apart from power generation and architectural function, the product can provide solar shading with its low SHGC value. It can also act as thermal and sound insulation due to its low U-value and acoustic resistance caused by the vacuum chamber between glazing layers. If applied with special coatings/films on top of PV glazing, it can also provide weather protection.
(4) Mounting system and installation
Based on specific requirements of each project in each region, safety, loading capacity and PV installation specifications can have a decisive impact on the method of fixing/mounting the vacuum. We have in this guide attempted to provide a range of options, highlighting what is possible in current design. The product can be installed with a linear mounting system as mullion-transom facades or structural sealant glazing. It can also be mounted with point-fixing systems including clamp fixings and undercut anchor fixings or mounted into standard curtain walling, rain screen cladding and window systems.
(5) Electrical system
In the curtain wall system, several PV glazing with standard size are usually connected together in a string to form the power generator. The generated direct current is usually fed to an inverter where the direct current is converted to alternating current. If on-site storage is not available, which is the common case in urban areas, the electrical power is registered via an electricity meter and connected to the public supply grid, which will require special permissions from the power grid companies (e.g. CLP in Hong Kong). Therefore, the application of the product will require a full set of electrical systems including cables and connections for parallel or series arrays, direct current load-break switches, inverters and generation meters.
(6) Economic considerations
The economic benefits of the product mainly lie in the following aspects: the substitute for original construction component, CO2 emission reduction and corresponding electricity fee waving, compliance with relevant building regulations (i.e. BEAM Plus in Hong Kong) and application of the feed-in-tariff policy (remuneration for electricity generation from PV).
temperature measurements were conducted through the centre of the vacuum PV sample to calculate the U-value. Secondly, the solar heat gains coefficient (SHGC) of the vacuum PV glazing sample was obtained and compared with three other advanced glazing types in an indoor solar irradiation test. Lastly, an outdoor test was conducted on the platform of Block Z in The Hong Kong Polytechnic University to evaluate the overall thermal performance of vacuum PV glazing. A conventional double clear pane glazing was used as a baseline in the outdoor test.
surfaces shows a similar trend in the three directions. Summing up electricity generation in all floors, the integrated PV modules in Model 2 and 3 can provide 285074.72 kWh/year and 355226.3 kWh/year, which accounts for 13.27% and 16.54% of the total building energy consumption of Model 1. Therefore, given the energy use reduction due to less external heat gain, using the vacuum BIPV glazing can save 27.74% (Model 3) electricity compared to a reference building.

08Investigation on the Thermal and Power Performance of Vacuum BIPV Curtain Wall Technology and its Application Potential in Buildings in Hong Kong
A combined laminated PV and vacuum glazing is first manufactured according to the schematic diagram illustrated in Figure 2. Then, a small-scale demonstration prototype of the proposed vacuum BIPV curtain wall is set up on the campus of The Hong Kong Polytechnic University for conducting experimental study. The dynamic thermal and power performance of the vacuum BIPV curtain wall is measured for at least two continuous sunny days to demonstrate its energy performance under real local environmental conditions. Some commonly used advanced windows such as the double-pane low-e, double-pane PV and vacuum clear glazing are also chosen for a comparative study to justify the advantage of the vacuum PV glazing in terms of the energy performance by measuring the solar heat gain coefficient (SHGC) and U-value. Based on the comparison results, the optimum type of window or curtain wall adapted to the local climate conditions is identified and recommended to the construction industry. The overall framework of the methodology is illustrated in Figure 3.
2.1 Power output modellingThe power output performance of this vacuum BIPV curtain wall is investigated experimentally and theoretically. The theoretical study on the power performance of the PV system mainly focuses on using a 5-parameter model to simulate the dynamic power performance of PV modules. Firstly, an algorithm developed by De Soto et al. (2006) can be used to calculate the five parameters at STC (standard test condition) based on the test results provided by the PV module manufacturer. Then the five parameters at arbitrary operating temperature and solar radiation can be respectively calculated. The simulation results are validated against the experimental data for further improving the accuracy of the model.
2.2 Thermal performance modellingThe thermal performance of the vacuum BIPV curtain wall is another very important scope of this research. The vacuum BIPV curtain wall is expected to be characterized by perfect thermal performance, which can significantly reduce the energy loss in winter and heat gain in summer. The modelling mainly involves the annual thermal performance of this vacuum BIPV curtain wall as well as the impact of the vacuum BIPV curtain wall on the air-conditioning load reduction. The thermal equilibrium equation for each component of the vacuum BIPV curtain wall is first established in accordance with the energy conversion law, and the finite difference method is then applied to discretize the partial differential heat transfer equations with given parameters such as the solar radiation, ambient temperature, wind speed, composition and dimensions of PV modules (Peng, Lu, Yang, & Han, 2013). Lastly, a computer program coupling the above procedures is developed to numerically simulate the real-time operating temperature of the PV modules as well as the heat flux transferring from exterior to indoor environment. With the above heat transfer models, not only the operating temperature can be simulated, the dynamic heat transfers between the vacuum BIPV modules and the interior can also be calculated. The numerical simulation results can also be compared with the experimental data measured by the heat flux sensors to verify the numerical models and improve their accuracy. Lastly, with the improved heat transfer models, it is possible to study the impact of the vacuum BIPV modules on the annual air conditioning load reduction.
2.3 Building performance modellingTwo types of professional software Berkeley Lab WINDOW and EnergyPlus are used in combination to investigate the overall performance of different windows in a typical office building. Berkeley Lab WINDOW is a software for analyzing the thermal and optical performance of windows made from any combination of glazing layers and gas layers and it also provides a directly accessible glazing system library. EnergyPlus is a building energy simulation software, which can simulate transient heat conduction, daylighting controls, on-site renewable power system and so on (ENERGYPLUS™, 2013). The results of EnergyPlus have been validated by previous studies (Peng et al., 2016; Tabares-Velasco, Christensen, & Bianchi, 2012; Zhou, Wu, Wang, Shiochi, & Li, 2008). Berkeley Lab WINDOW offers a link to EnergyPlus so that the spectral data files of different glazing from Berkeley Lab WINDOW could be imported directly into EnergyPlus for simulation. A comprehensive simulation model is developed to simulate the electricity consumption of the office room that is equipped with different types of windows. The sub-models include thermal balance model, daylighting model and power generation model. After obtaining the simulation results of each model, the overall energy performance of different windows can be investigated. The flowchart of modeling approach is shown in Figure 4.
The comparison of building energy between Model 1, Model 2 and Model 3 is summarized in Table 6, which includes energy use of lighting, equipment, district cooling and district heating. Although Model 2 and Model 3 consume slightly more lighting energy due to the reduced visible transmittance of the PV glazing, the great energy saving in cooling and heating leads to the net reduction in the total building energy consumption. The total energy consumption of the Model 2 and 3 declines by 20.77 and 22.37 kWh/m2, accounting for 10.44% and 11.20% of Model 1 respectively. Generated electricity of windows and walls in three directions is also presented in Table 7. The south window produced the most electricity, 1527.13 kWh for Model 2 and 3203.76 kWh for Model 3 in a year, taking up nearly 47.80% the total electricity generated by windows. As for the west window, the electricity generated in a year is close to that of east window. Electricity generated by wall
3.2 Experimental study of the vacuum PV glazingOutdoor experimental test was first conducted on the developed prototype vacuum PV (VPV) glazing with the standard size (1.1m × 1.3m), whose various parameters including the ambient air temperature, incident solar irradiation, surface temperatures of the vacuum PV glazing as well as the I-V curves and the power generation were measured and recorded. The power generation and thermal performances of the prototype were also analysed during the test. To further justify the advantage of the vacuum PV glazing, experimental studies were carried out to compare the thermal performance of scaled-down samples (0.3m × 0.3m) with other advanced windows.
(1) Energy performance of the prototypeIn order to evaluate the energy performance of the vacuum PV glazing, an outdoor field measurement was conducted on the platform of Block Z in The Hong Kong Polytechnic University. The vacuum PV glazing was set up horizontally 0.4m above the floor on stilts so that the external temperatures of both sides of the vacuum PV glazing were approximately equal. Various parameters were measured during this test, including the ambient air temperature, the exterior and transmitted horizontal incident solar irradiation, the outer and inner surface temperatures of the vacuum PV glazing as well as the I-V curves and the power generation from the vacuum PV glazing. All the data was logged at an interval of 1 minute. Power generation and thermal performances of the vacuum PV glazing were analyzed based on the outdoor tests. Figure 7 shows the exterior and transmitted incident solar irradiation. It can be seen that the average solar irradiation transmittance during the period is approximately 0.08. Such low transmittance means that vast majority of solar irradiation is blocked by the vacuum PV glazing. Figure 8 presents the outer and inner surface temperature of the vacuum PV glazing. It can be seen that the outer surface temperature is much higher than the inner surface temperature at daytime. The maximum outer surface temperature is 75.3°C, 30°C higher than the inner surface temperature, which indicates that most of the waste heat is dissipated from the outside surface of the vacuum PV glazing, and the heat transfer to the inside space by convection is mitigated. Thus, compared with the conventional single-glazed PV glazing, the structure of the vacuum PV glazing can help reduce the cooling load and improve the indoor thermal comfort.
Then the vacuum PV glazing was mounted on the front side of an experimental test chamber as shown in Figure 9. Clear glass was also adopted in this study for comparison. Figure 10 presents the instantaneous power output of the vacuum PV glazing in 2 sunny days. It can be seen that the power generation from the vacuum PV glazing is consistent with incident solar radiation. A comparative study in terms of internal air temperature of the chamber between the vacuum PV glazing and the clear glass was conducted in a day of June.
As shown in Figure 11, the internal air temperature in the chamber with the vacuum PV glazing is much lower than that with a clear glass. The measured average and maximum internal air temperature for the vacuum PV glazing is 39.6°C and 40.3°C, respectively, while the corresponding average and maximum internal air temperature of the clear glass are 43.6°C and 44.7°C. The maximum internal air temperature difference between the vacuum PV glazing and the clear glass is 4.4°C, occurring in the morning. There are three temperature peaks of internal air temperature. Since the ambient temperature was relatively stable, the main heat gain of the internal air temperature was from incident solar irradiation. The internal air temperature for vacuum PV glazing is much more stable compared with that for the clear glass. The reason is that the vacuum PV glazing has better heat insulation performance so that the internal air temperature is not affected by the external environment significantly. It can also be seen in this figure that the internal air temperature of the chamber drops continuously at 15:00, which shows that the incident solar irradiation on the façade decreases so that the heat gains of the internal air from the sun also drops.
(2) Comparison with other advanced windows
To further justify the advantage of the vacuum PV glazing, experimental studies were carried out to compare it with other advanced windows. Samples of different types of glazing were mounted on the top of two hotboxes (i.e. test rigs) with the uniform dimension of 300 mm (L) × 300 mm (W) × 450mm (H) to implement both indoor and outdoor tests. Firstly, a co-heating test methodology was adopted for the thermal analysis of the vacuum PV glazing. The test rig was filled with the ice-water mixture to ensure the temperature difference between the inside and outside glazing surfaces larger than 5°C. Heat flux and
Figure 12 shows the internal and external temperatures of the vacuum PV glazing sample. The presented data were selected after the hotbox achieved the steady-state condition, when the temperature difference was around 8°C. Heat flux though the glazing sample and the U-value were then determined as illustrated in Figure 13. The average heat flux from the vacuum glazing was measured to be 15.4 W/m2. And the average U-value was calculated as 1.5 W/m2 × K which is much lower than a regular double pane window with the U-value of 2.5W/m2 × K. Considering the edge heat transfer which would strongly affect the heat flux measurement when the sample is small, it can be expected that the centre U-valve of the vacuum PV glazing should be lower than 1.5 W/m2 × K for a larger scale application (e.g. 1.1m × 1.3m).
(3) Cost effective analysis based on simulation
To address the economic benefits of the developed product, the simple payback period of the vacuum PV glazing is calculated with reference to available PV glazing on the market in both Hong Kong and Beijing’s scenarios.
Based on an average electricity price of 1.25 HKD/kWh from HK Electric, the simple payback period (See Figure 26) when applying the product to the west and east façade is calculated to be 7.5 and 8.0 years compared to the single-pane PV glazing. The payback periods are increased to 8.6 and 8.8 years when compared with double-pane PV glazing as shown in Figure 27. However, when applied to the south façade, the extra initial cost of the product cannot be recovered within 10 years.
The solar simulator in the laboratory can provide relatively steady horizontal incident solar irradiation, so that test rigs were located at the same spot to ensure each window sample exposed to the same radiation level. As shown in Figure 14, SHGCs of the vacuum PV glazing and double-pane PV glazing are much smaller than those of the vacuum glazing and double clear glazing, because the coupled PV module can absorb most of the solar irradiation. The vacuum PV glazing has the lowest SHGC of 0.10 which can act as the excellent thermal insulation.
The outdoor test lasted four days from September 26th to September 30th. As shown in Figure 15, September 26th, 27th and 30th were cloudy days and September 28th could be considered as a sunny day. It can be found that the vacuum PV glazing blocks most solar irradiation compared with the double-pane glazing. Figure 16 presents the temperature profile of the vacuum PV glazing and double-pane glazing in the sunny day. The internal surface temperature of both glazing was much higher than the ambient temperature when the outside incident solar radiation is strong. The internal glazing surface and air temperatures of the test rig with the vacuum PV glazing are lower than those of the test rig with the double-pane glazing. The difference between the internal air temperatures of test rigs is much smaller than that of internal glazing surface temperatures. Therefore, the application of vacuum PV glazing can achieve better indoor environment by reducing the solar heat gain.
3.3 Simulation study of the vacuum PV glazing(1) Simulation of a generic building model
Although a series of field tests have been conducted in the outdoor test bed to study the power and thermal performances of the vacuum BIPV glazing, the experimental scenarios are impossible to represent all the situations and variables. Thus, the numerical study was conducted to comprehensively investigate and compare the energy performance of the vacuum PV glazing and other commonly used energy-efficient glazing. As detailed in the research methodology, a comprehensive simulation model based on EnergyPlus and WINDOW has been developed to simulate the overall energy performance of different windows taking into account of their thermal and power output performance. This model is used to simulate the overall energy performance of the vacuum BIPV curtain wall in comparison with other commonly used windows. The key properties of different types of glazing are shown in Table 4 and the electrical specifications of the PV glazing under standard test conditions are referenced to Table 2.
In order to simulate the annual thermal performance and power performance of these types of glazing in Hong Kong for comparison purpose, a typical office room model has been created for simulation, as shown in Figure 17. The dimension of the office model was 2.5m × 2.3m × 2.5m (L × W × H). This room has only one external wall with three identical windows exposed to the outdoor environment. Simulations were conducted for different orientations, i.e. south (S), east (E), west (W) and north (N). A heat transfer model and PV performance model in EnergyPlus are adopted to investigate
the thermal and power performance of different glazing. The heat transfer model is used to calculate the cooling loads of the office room. The cooling loads are then converted to electricity use of air-conditioning system with a presumed coefficient of performance (COP) of 2.78. The equivalent one-diode model is selected to simulate the annual electricity generation from PV elements. The typical meteorological year (TMY) in Hong Kong is selected a reasonable representation of local climates.
The annual cooling electricity use of different types of glazing in different orientations in Hong Kong are shown in Figure 18. It can be observed that the room using vacuum PV glazing consumes the least cooling electricity for all orientations. The south facing room with vacuum PV glazing consumes about 705.56 kWh per year, which was approximately 14.2%, 9.8%, 8.4%, 7.1% and 4.1% less than the corresponding room with single-pane clear glazing, double-pane clear glazing, vacuum glazing, single-pane PV glazing and double-pane PV glazing, respectively. This is because the vacuum PV glazing have the lowest U-value and SHGC among all types of glazing, as shown in Table 4.3. A lower U-value indicates a higher level of heat insulation performance of the glazing, and a lower SHGC means less solar radiation will pass through the windows. Therefore, the vacuum PV glazing performs the best in the area with big temperature difference between indoor and outdoor environment. In addition, the most cooling electricity use of the office room occurs at the west orientation, followed by east, south and north. Therefore, east and west facing windows should have better solar heat insulation performance, to reduce heat gains from outside environment.
In addition to reduce the cooling load of the office room, the PV glazing can also generate electricity in situ. The annual electricity generation of the three types of PV glazing are shown in Figure 19. It can be seen that the annual electricity generation of the three types of PV glazing is similar to each other. The electricity generation from the vacuum PV glazing is a little less than the single-pane PV glazing due to increased solar cell temperature. However, since the temperature coefficient of the thin-film a-Si solar cells is small, the PV conversion efficiency is not reduced significantly. The annual electricity generation from a-Si PV glazing with 12.0% transmittance is around 113.81 kWh per year. Among all orientations, it is better to install PV glazing on the south facade in order to maximize the electricity output in Hong Kong. And it is not recommended to apply PV glazing on north façade due to limited solar radiation available.
Based on the results above, the vacuum PV glazing not only has the best thermal performance among all types of widely used glazing, but also produces a considerable amount of electricity per year. It is recommended to install vacuum PV glazing on south facade to perform the best overall energy performance.
(2) Simulation of the whole building
Apart from modelling studies conducted under the hot and humid climate of Hong Kong, the annual energy performance of different types of glazing in a cold region (i.e. Beijing) was also simulated for comparison. Simulation results are shown in Figure 20 and Figure 21. It can be observed that the room using the vacuum PV glazing achieves the lowest cooling consumption in both climates. In Beijing, the consumed cooling energy with the vacuum PV glazing is much smaller and is 30.2%, 20.8%, 17.0%, 13.8%, 4.4% less than that of the room with other types of glazing. It can be concluded that the energy saving potential of the vacuum PV glazing is much larger in a cold climate while the electricity generation is much higher during the summer time of Beijing due to the smaller solar incidence angle.
The developed simulation model was further applied to a 20-floor prototype office building. Typical floors of the building are divided into 5 conditioned zones, with a total floor area of 540 m2 (as shown in Figure 22). The reference case – Model 1 keeps all windows as the commonly used double-pane clear glazing, while the design cases include Model 2 and Model 3. Model 2 keeps the north-facing window as the conventional double-pane glazing while changes windows orientated to the other three directions to the developed vacuum PV glazing. The opaque part of all building facades is assumed to be covered with traditional crystalline BIPV with a power conversion efficiency of 15% to maximize the power generation potential of the building envelope. Model 3 shares similar settings with Model 2, except that the window transparency is tuned to 20% with a crystalline silicon (c-Si) as shown in Figure 23. Table 5 shows detailed settings of window properties for the three models respectively. The U-value and SHGC of a-Si vacuum PV glazing are obtained from previous experiments and those of double-pane clear glazing are calculated by the simulation software WINDOW. Thermal and power generation properties of c-Si vacuum PV glazing are obtained from existing literatures.
The simulation results of the total heat gain and loss through all windows are presented in Figure 24 and Figure 25. The heat gain and loss both decrease sharply when traditional double-pane clear glazing is replaced by the PV vacuum glazing. The obvious differences between these three models can be identified from the figures. Compared with the performance of Model 1, the heat gain through windows of Model 2 and Model 3 drops up to 77.89% and 77.97% (south-facing windows), while the heat loss of the two models declines up to 79.28% and 79.32% (south-facing windows), respectively.
On the other side, based on the peak office hour electricity price of 1.4 CNY/kWh for cooling and 0.25 CNY/kWh for heating from the Beijing authority, the simple payback period (See Figure 28) when applying the product to the west, east, and south façade is calculated to be 3.8, 4.6 and 5.3 years compared to the single-pane PV glazing. The payback periods are increased to 4.5, 5.4 and 6.5 years when compared with double-pane PV glazing as shown in Figure 29.
As a result, the product can be considered as a cost-effective application in building facades when considering its tremendous saving of air-conditioning energy and corresponding annual expenses. In addition, the property developer could also benefit from a potential increment in renting rates and popularity, if the building gets certified under a green building scheme by claiming credits in CO2 reduction and renewable application assessment criteria. All the abovementioned potential benefits with the application of the vacuum PV glazing would attract more attention from the construction industry.
3.4 Brief technical guideline for the vacuum PV glazingDesigning the vacuum PV glazing (i.e. vacuum BIPV curtain wall) system is a more complex process than a standard added-on PV system. The architectural context, structural requirements, economic considerations and building regulation requirements should all be considered, so that this brief guidance mainly focuses on the below aspects: design strategy, environmental variables, multifunctionality, installation situation, electrical components, and economic aspects (Polysolar Limited, 2015).
(1) Design strategy
Architects, property developers and building users become more inclined to consider renewable and energy efficient applications to meet building and planning regulations due to rising energy bills and awareness of environmental sustainability. The combination of PV and vacuum glazing is an innovative and promising solution to meet these requirements in the new building developments or refurbishment projects. As proved in the above sections of this report, the developed product offers the added advantage of providing a return of investment from the building envelope. Architectural and structural factors, as well as economic considerations should be taken into account at an early stage in any building projects to integrate renewable systems through a more satisfactory approach.
(2) Environmental variables
When designing a BIPV system, a compromise must be reached between the requirements of energy yield optimisation and those of the architectural environment. Therefore, the orientation, lighting performance, shading and temperature are the four mainly concerned issues in BIPV design. According to simulation and experimental results presented in the above sections, the optimal orientation of the installed PV glazing should be south for maximizing the annual power generation, while cooling load reduction is more conspicuous when the product is applied on the west and east facades. Therefore, it is preferable to install the product on all three facades for an optimal overall building energy-saving performance. The visible light transmittance is only 12% in the developed prototype, which might cause slightly more lighting power consumption compared to traditional double-pane clear glazing. However, the transmittance can be easily adjusted to higher than 20% in the manufacture process depending on the effective area of PV materials. There will always be a trade-off between power generation and permeable light, whereas this research has proved that the combined power generation and cooling load reduction can be more than the increased lighting energy use. Power generation performance of the a-Si PV is less sensitive to shadings, so that the prototype is subject to less influence from peripheral shadings. However, if we change the PV material to c-Si for higher conversion efficiency, a shading calculation should be conducted before allocating the BIPV glazing. Lastly, the conversion efficiency of a-Si glazing is also less sensitive to the increase of the panel temperature. The temperature coefficient must be considered if changing the PV material to c-Si.
2.4 Experiment test of power and thermal performanceExperimental tests of the thermal and power performance of the developed PV vacuum glazing involve miscellaneous equipment such as pyranometers, I-V curve tracers, spectrometers thermocouples, heat flux meters and data loggers. These devices, whose specifications are summarized in Table 1, are used for measuring and recording the ambient temperature, power generation properties, solar radiation and its spectrum distribution, glazing surface temperatures as well as heat gains and heat losses. All sensor signals are recorded by a GL840 Midi Data Logger at a time interval of 1 min. The GL840 Midi Data Logger can accept voltage (from 20 mV to 100 V), temperature, humidity, pulse and logic signals.
Table 1 Specifications for experimental equipment
Equipment Manufacture and model Accuracy/sensitivity
Pyranometers EKO instruments (MS-802) Sensitivity: about 7 μV/(W/m²); Non-linearity < 0.2% (at 1000W/m²)
Thermocouples RS Components Temperature range: -50°C to 400°C; (T type thermocouple) Accuracy: ±0.2°C
Heat flux meter Captec Enterprise (RS-30) Sensitivity: about 5 μV/(W/m²); Response time: 0.3s
Accepts voltage (20 mV to 100 V), Data logger Graphtec temperature, humidity, pulse and (GL840 Midi Data Logger) logic signals; Minimum resolution: 1 μV and 0.1°C
I–V curve tracer EKO instruments ±0.5% FS MP-11
Wavelength range: 300–1100 nm; Spectrometer Avantes 2048 Resolution: 0.04–20 nm; Integration time: 1.11 ms–10 min
The vacuum PV glazing was made by sandwiching a layer of PVB between an external PV laminated glass with a visible light transmittance of 12% and an internal vacuum glass. A low-e coating was also adopted to enhance its thermal performance. The structure of the vacuum PV glazing is shown in Figure 5. The dimension of the vacuum PV glazing is 1300 mm (width) × 1100 mm (height) × 20.87 mm (thickness), thinner than commonly used PV double glazed insulating glass units. Figure 6 presents the pictures of the sample of vacuum PV glazing.
This section presents the main findings and outcomes of the research project and indicates their potential impacts on the local energy use and construction industry. Achievements of the specified research objectives are illustrated, and limitations of the project are also mentioned for the reference of future studies.
3.1 Design and production of the prototype productInitially, we proposed a prototype design as specified by Figure 2, where the vacuum layer was directly coupled with the laminated PV panel. However, during initial manufacture trials, the air pressure difference between internal and external spaces of the vacuum glass samples produced by the laminating machine caused the breakage of the vacuum glass samples. Then, we followed an alternative approach using pre-pressure furnace, whereas the molten state of the polyvinyl butyral (PVB) could not meet the expected requirements and the bubbles greatly impacted the appearance and performance of PV module. Finally, we proposed the current product design based on the experience acquired from previous failures (See Figure 5).
The electrical specifications of the vacuum PV glazing under standard test conditions (STC: air mass 1.5, solar irradiation 1000 W/m2 and cell temperature 25°C) are shown in Table 2. Table 3 presents the given thermal and optical properties of the PV laminated glass and vacuum glass, respectively.
(3) Multi-functionality
Due to their mechanical structures, the PV vacuum glazing can perform the functions of the building envelope in addition to generating emission-free energy, and can thus substitute for conventional construction windows or curtain walls. Apart from power generation and architectural function, the product can provide solar shading with its low SHGC value. It can also act as thermal and sound insulation due to its low U-value and acoustic resistance caused by the vacuum chamber between glazing layers. If applied with special coatings/films on top of PV glazing, it can also provide weather protection.
(4) Mounting system and installation
Based on specific requirements of each project in each region, safety, loading capacity and PV installation specifications can have a decisive impact on the method of fixing/mounting the vacuum. We have in this guide attempted to provide a range of options, highlighting what is possible in current design. The product can be installed with a linear mounting system as mullion-transom facades or structural sealant glazing. It can also be mounted with point-fixing systems including clamp fixings and undercut anchor fixings or mounted into standard curtain walling, rain screen cladding and window systems.
(5) Electrical system
In the curtain wall system, several PV glazing with standard size are usually connected together in a string to form the power generator. The generated direct current is usually fed to an inverter where the direct current is converted to alternating current. If on-site storage is not available, which is the common case in urban areas, the electrical power is registered via an electricity meter and connected to the public supply grid, which will require special permissions from the power grid companies (e.g. CLP in Hong Kong). Therefore, the application of the product will require a full set of electrical systems including cables and connections for parallel or series arrays, direct current load-break switches, inverters and generation meters.
(6) Economic considerations
The economic benefits of the product mainly lie in the following aspects: the substitute for original construction component, CO2 emission reduction and corresponding electricity fee waving, compliance with relevant building regulations (i.e. BEAM Plus in Hong Kong) and application of the feed-in-tariff policy (remuneration for electricity generation from PV).
temperature measurements were conducted through the centre of the vacuum PV sample to calculate the U-value. Secondly, the solar heat gains coefficient (SHGC) of the vacuum PV glazing sample was obtained and compared with three other advanced glazing types in an indoor solar irradiation test. Lastly, an outdoor test was conducted on the platform of Block Z in The Hong Kong Polytechnic University to evaluate the overall thermal performance of vacuum PV glazing. A conventional double clear pane glazing was used as a baseline in the outdoor test.
surfaces shows a similar trend in the three directions. Summing up electricity generation in all floors, the integrated PV modules in Model 2 and 3 can provide 285074.72 kWh/year and 355226.3 kWh/year, which accounts for 13.27% and 16.54% of the total building energy consumption of Model 1. Therefore, given the energy use reduction due to less external heat gain, using the vacuum BIPV glazing can save 27.74% (Model 3) electricity compared to a reference building.

09 Construction Industry Council
The comparison of building energy between Model 1, Model 2 and Model 3 is summarized in Table 6, which includes energy use of lighting, equipment, district cooling and district heating. Although Model 2 and Model 3 consume slightly more lighting energy due to the reduced visible transmittance of the PV glazing, the great energy saving in cooling and heating leads to the net reduction in the total building energy consumption. The total energy consumption of the Model 2 and 3 declines by 20.77 and 22.37 kWh/m2, accounting for 10.44% and 11.20% of Model 1 respectively. Generated electricity of windows and walls in three directions is also presented in Table 7. The south window produced the most electricity, 1527.13 kWh for Model 2 and 3203.76 kWh for Model 3 in a year, taking up nearly 47.80% the total electricity generated by windows. As for the west window, the electricity generated in a year is close to that of east window. Electricity generated by wall
3.2 Experimental study of the vacuum PV glazingOutdoor experimental test was first conducted on the developed prototype vacuum PV (VPV) glazing with the standard size (1.1m × 1.3m), whose various parameters including the ambient air temperature, incident solar irradiation, surface temperatures of the vacuum PV glazing as well as the I-V curves and the power generation were measured and recorded. The power generation and thermal performances of the prototype were also analysed during the test. To further justify the advantage of the vacuum PV glazing, experimental studies were carried out to compare the thermal performance of scaled-down samples (0.3m × 0.3m) with other advanced windows.
(1) Energy performance of the prototypeIn order to evaluate the energy performance of the vacuum PV glazing, an outdoor field measurement was conducted on the platform of Block Z in The Hong Kong Polytechnic University. The vacuum PV glazing was set up horizontally 0.4m above the floor on stilts so that the external temperatures of both sides of the vacuum PV glazing were approximately equal. Various parameters were measured during this test, including the ambient air temperature, the exterior and transmitted horizontal incident solar irradiation, the outer and inner surface temperatures of the vacuum PV glazing as well as the I-V curves and the power generation from the vacuum PV glazing. All the data was logged at an interval of 1 minute. Power generation and thermal performances of the vacuum PV glazing were analyzed based on the outdoor tests. Figure 7 shows the exterior and transmitted incident solar irradiation. It can be seen that the average solar irradiation transmittance during the period is approximately 0.08. Such low transmittance means that vast majority of solar irradiation is blocked by the vacuum PV glazing. Figure 8 presents the outer and inner surface temperature of the vacuum PV glazing. It can be seen that the outer surface temperature is much higher than the inner surface temperature at daytime. The maximum outer surface temperature is 75.3°C, 30°C higher than the inner surface temperature, which indicates that most of the waste heat is dissipated from the outside surface of the vacuum PV glazing, and the heat transfer to the inside space by convection is mitigated. Thus, compared with the conventional single-glazed PV glazing, the structure of the vacuum PV glazing can help reduce the cooling load and improve the indoor thermal comfort.
Then the vacuum PV glazing was mounted on the front side of an experimental test chamber as shown in Figure 9. Clear glass was also adopted in this study for comparison. Figure 10 presents the instantaneous power output of the vacuum PV glazing in 2 sunny days. It can be seen that the power generation from the vacuum PV glazing is consistent with incident solar radiation. A comparative study in terms of internal air temperature of the chamber between the vacuum PV glazing and the clear glass was conducted in a day of June.
As shown in Figure 11, the internal air temperature in the chamber with the vacuum PV glazing is much lower than that with a clear glass. The measured average and maximum internal air temperature for the vacuum PV glazing is 39.6°C and 40.3°C, respectively, while the corresponding average and maximum internal air temperature of the clear glass are 43.6°C and 44.7°C. The maximum internal air temperature difference between the vacuum PV glazing and the clear glass is 4.4°C, occurring in the morning. There are three temperature peaks of internal air temperature. Since the ambient temperature was relatively stable, the main heat gain of the internal air temperature was from incident solar irradiation. The internal air temperature for vacuum PV glazing is much more stable compared with that for the clear glass. The reason is that the vacuum PV glazing has better heat insulation performance so that the internal air temperature is not affected by the external environment significantly. It can also be seen in this figure that the internal air temperature of the chamber drops continuously at 15:00, which shows that the incident solar irradiation on the façade decreases so that the heat gains of the internal air from the sun also drops.
(2) Comparison with other advanced windows
To further justify the advantage of the vacuum PV glazing, experimental studies were carried out to compare it with other advanced windows. Samples of different types of glazing were mounted on the top of two hotboxes (i.e. test rigs) with the uniform dimension of 300 mm (L) × 300 mm (W) × 450mm (H) to implement both indoor and outdoor tests. Firstly, a co-heating test methodology was adopted for the thermal analysis of the vacuum PV glazing. The test rig was filled with the ice-water mixture to ensure the temperature difference between the inside and outside glazing surfaces larger than 5°C. Heat flux and
Figure 12 shows the internal and external temperatures of the vacuum PV glazing sample. The presented data were selected after the hotbox achieved the steady-state condition, when the temperature difference was around 8°C. Heat flux though the glazing sample and the U-value were then determined as illustrated in Figure 13. The average heat flux from the vacuum glazing was measured to be 15.4 W/m2. And the average U-value was calculated as 1.5 W/m2 × K which is much lower than a regular double pane window with the U-value of 2.5W/m2 × K. Considering the edge heat transfer which would strongly affect the heat flux measurement when the sample is small, it can be expected that the centre U-valve of the vacuum PV glazing should be lower than 1.5 W/m2 × K for a larger scale application (e.g. 1.1m × 1.3m).
(3) Cost effective analysis based on simulation
To address the economic benefits of the developed product, the simple payback period of the vacuum PV glazing is calculated with reference to available PV glazing on the market in both Hong Kong and Beijing’s scenarios.
Based on an average electricity price of 1.25 HKD/kWh from HK Electric, the simple payback period (See Figure 26) when applying the product to the west and east façade is calculated to be 7.5 and 8.0 years compared to the single-pane PV glazing. The payback periods are increased to 8.6 and 8.8 years when compared with double-pane PV glazing as shown in Figure 27. However, when applied to the south façade, the extra initial cost of the product cannot be recovered within 10 years.
The solar simulator in the laboratory can provide relatively steady horizontal incident solar irradiation, so that test rigs were located at the same spot to ensure each window sample exposed to the same radiation level. As shown in Figure 14, SHGCs of the vacuum PV glazing and double-pane PV glazing are much smaller than those of the vacuum glazing and double clear glazing, because the coupled PV module can absorb most of the solar irradiation. The vacuum PV glazing has the lowest SHGC of 0.10 which can act as the excellent thermal insulation.
The outdoor test lasted four days from September 26th to September 30th. As shown in Figure 15, September 26th, 27th and 30th were cloudy days and September 28th could be considered as a sunny day. It can be found that the vacuum PV glazing blocks most solar irradiation compared with the double-pane glazing. Figure 16 presents the temperature profile of the vacuum PV glazing and double-pane glazing in the sunny day. The internal surface temperature of both glazing was much higher than the ambient temperature when the outside incident solar radiation is strong. The internal glazing surface and air temperatures of the test rig with the vacuum PV glazing are lower than those of the test rig with the double-pane glazing. The difference between the internal air temperatures of test rigs is much smaller than that of internal glazing surface temperatures. Therefore, the application of vacuum PV glazing can achieve better indoor environment by reducing the solar heat gain.
3.3 Simulation study of the vacuum PV glazing(1) Simulation of a generic building model
Although a series of field tests have been conducted in the outdoor test bed to study the power and thermal performances of the vacuum BIPV glazing, the experimental scenarios are impossible to represent all the situations and variables. Thus, the numerical study was conducted to comprehensively investigate and compare the energy performance of the vacuum PV glazing and other commonly used energy-efficient glazing. As detailed in the research methodology, a comprehensive simulation model based on EnergyPlus and WINDOW has been developed to simulate the overall energy performance of different windows taking into account of their thermal and power output performance. This model is used to simulate the overall energy performance of the vacuum BIPV curtain wall in comparison with other commonly used windows. The key properties of different types of glazing are shown in Table 4 and the electrical specifications of the PV glazing under standard test conditions are referenced to Table 2.
In order to simulate the annual thermal performance and power performance of these types of glazing in Hong Kong for comparison purpose, a typical office room model has been created for simulation, as shown in Figure 17. The dimension of the office model was 2.5m × 2.3m × 2.5m (L × W × H). This room has only one external wall with three identical windows exposed to the outdoor environment. Simulations were conducted for different orientations, i.e. south (S), east (E), west (W) and north (N). A heat transfer model and PV performance model in EnergyPlus are adopted to investigate
the thermal and power performance of different glazing. The heat transfer model is used to calculate the cooling loads of the office room. The cooling loads are then converted to electricity use of air-conditioning system with a presumed coefficient of performance (COP) of 2.78. The equivalent one-diode model is selected to simulate the annual electricity generation from PV elements. The typical meteorological year (TMY) in Hong Kong is selected a reasonable representation of local climates.
The annual cooling electricity use of different types of glazing in different orientations in Hong Kong are shown in Figure 18. It can be observed that the room using vacuum PV glazing consumes the least cooling electricity for all orientations. The south facing room with vacuum PV glazing consumes about 705.56 kWh per year, which was approximately 14.2%, 9.8%, 8.4%, 7.1% and 4.1% less than the corresponding room with single-pane clear glazing, double-pane clear glazing, vacuum glazing, single-pane PV glazing and double-pane PV glazing, respectively. This is because the vacuum PV glazing have the lowest U-value and SHGC among all types of glazing, as shown in Table 4.3. A lower U-value indicates a higher level of heat insulation performance of the glazing, and a lower SHGC means less solar radiation will pass through the windows. Therefore, the vacuum PV glazing performs the best in the area with big temperature difference between indoor and outdoor environment. In addition, the most cooling electricity use of the office room occurs at the west orientation, followed by east, south and north. Therefore, east and west facing windows should have better solar heat insulation performance, to reduce heat gains from outside environment.
In addition to reduce the cooling load of the office room, the PV glazing can also generate electricity in situ. The annual electricity generation of the three types of PV glazing are shown in Figure 19. It can be seen that the annual electricity generation of the three types of PV glazing is similar to each other. The electricity generation from the vacuum PV glazing is a little less than the single-pane PV glazing due to increased solar cell temperature. However, since the temperature coefficient of the thin-film a-Si solar cells is small, the PV conversion efficiency is not reduced significantly. The annual electricity generation from a-Si PV glazing with 12.0% transmittance is around 113.81 kWh per year. Among all orientations, it is better to install PV glazing on the south facade in order to maximize the electricity output in Hong Kong. And it is not recommended to apply PV glazing on north façade due to limited solar radiation available.
Based on the results above, the vacuum PV glazing not only has the best thermal performance among all types of widely used glazing, but also produces a considerable amount of electricity per year. It is recommended to install vacuum PV glazing on south facade to perform the best overall energy performance.
(2) Simulation of the whole building
Apart from modelling studies conducted under the hot and humid climate of Hong Kong, the annual energy performance of different types of glazing in a cold region (i.e. Beijing) was also simulated for comparison. Simulation results are shown in Figure 20 and Figure 21. It can be observed that the room using the vacuum PV glazing achieves the lowest cooling consumption in both climates. In Beijing, the consumed cooling energy with the vacuum PV glazing is much smaller and is 30.2%, 20.8%, 17.0%, 13.8%, 4.4% less than that of the room with other types of glazing. It can be concluded that the energy saving potential of the vacuum PV glazing is much larger in a cold climate while the electricity generation is much higher during the summer time of Beijing due to the smaller solar incidence angle.
The developed simulation model was further applied to a 20-floor prototype office building. Typical floors of the building are divided into 5 conditioned zones, with a total floor area of 540 m2 (as shown in Figure 22). The reference case – Model 1 keeps all windows as the commonly used double-pane clear glazing, while the design cases include Model 2 and Model 3. Model 2 keeps the north-facing window as the conventional double-pane glazing while changes windows orientated to the other three directions to the developed vacuum PV glazing. The opaque part of all building facades is assumed to be covered with traditional crystalline BIPV with a power conversion efficiency of 15% to maximize the power generation potential of the building envelope. Model 3 shares similar settings with Model 2, except that the window transparency is tuned to 20% with a crystalline silicon (c-Si) as shown in Figure 23. Table 5 shows detailed settings of window properties for the three models respectively. The U-value and SHGC of a-Si vacuum PV glazing are obtained from previous experiments and those of double-pane clear glazing are calculated by the simulation software WINDOW. Thermal and power generation properties of c-Si vacuum PV glazing are obtained from existing literatures.
The simulation results of the total heat gain and loss through all windows are presented in Figure 24 and Figure 25. The heat gain and loss both decrease sharply when traditional double-pane clear glazing is replaced by the PV vacuum glazing. The obvious differences between these three models can be identified from the figures. Compared with the performance of Model 1, the heat gain through windows of Model 2 and Model 3 drops up to 77.89% and 77.97% (south-facing windows), while the heat loss of the two models declines up to 79.28% and 79.32% (south-facing windows), respectively.
On the other side, based on the peak office hour electricity price of 1.4 CNY/kWh for cooling and 0.25 CNY/kWh for heating from the Beijing authority, the simple payback period (See Figure 28) when applying the product to the west, east, and south façade is calculated to be 3.8, 4.6 and 5.3 years compared to the single-pane PV glazing. The payback periods are increased to 4.5, 5.4 and 6.5 years when compared with double-pane PV glazing as shown in Figure 29.
As a result, the product can be considered as a cost-effective application in building facades when considering its tremendous saving of air-conditioning energy and corresponding annual expenses. In addition, the property developer could also benefit from a potential increment in renting rates and popularity, if the building gets certified under a green building scheme by claiming credits in CO2 reduction and renewable application assessment criteria. All the abovementioned potential benefits with the application of the vacuum PV glazing would attract more attention from the construction industry.
3.4 Brief technical guideline for the vacuum PV glazingDesigning the vacuum PV glazing (i.e. vacuum BIPV curtain wall) system is a more complex process than a standard added-on PV system. The architectural context, structural requirements, economic considerations and building regulation requirements should all be considered, so that this brief guidance mainly focuses on the below aspects: design strategy, environmental variables, multifunctionality, installation situation, electrical components, and economic aspects (Polysolar Limited, 2015).
(1) Design strategy
Architects, property developers and building users become more inclined to consider renewable and energy efficient applications to meet building and planning regulations due to rising energy bills and awareness of environmental sustainability. The combination of PV and vacuum glazing is an innovative and promising solution to meet these requirements in the new building developments or refurbishment projects. As proved in the above sections of this report, the developed product offers the added advantage of providing a return of investment from the building envelope. Architectural and structural factors, as well as economic considerations should be taken into account at an early stage in any building projects to integrate renewable systems through a more satisfactory approach.
(2) Environmental variables
When designing a BIPV system, a compromise must be reached between the requirements of energy yield optimisation and those of the architectural environment. Therefore, the orientation, lighting performance, shading and temperature are the four mainly concerned issues in BIPV design. According to simulation and experimental results presented in the above sections, the optimal orientation of the installed PV glazing should be south for maximizing the annual power generation, while cooling load reduction is more conspicuous when the product is applied on the west and east facades. Therefore, it is preferable to install the product on all three facades for an optimal overall building energy-saving performance. The visible light transmittance is only 12% in the developed prototype, which might cause slightly more lighting power consumption compared to traditional double-pane clear glazing. However, the transmittance can be easily adjusted to higher than 20% in the manufacture process depending on the effective area of PV materials. There will always be a trade-off between power generation and permeable light, whereas this research has proved that the combined power generation and cooling load reduction can be more than the increased lighting energy use. Power generation performance of the a-Si PV is less sensitive to shadings, so that the prototype is subject to less influence from peripheral shadings. However, if we change the PV material to c-Si for higher conversion efficiency, a shading calculation should be conducted before allocating the BIPV glazing. Lastly, the conversion efficiency of a-Si glazing is also less sensitive to the increase of the panel temperature. The temperature coefficient must be considered if changing the PV material to c-Si.
The vacuum PV glazing was made by sandwiching a layer of PVB between an external PV laminated glass with a visible light transmittance of 12% and an internal vacuum glass. A low-e coating was also adopted to enhance its thermal performance. The structure of the vacuum PV glazing is shown in Figure 5. The dimension of the vacuum PV glazing is 1300 mm (width) × 1100 mm (height) × 20.87 mm (thickness), thinner than commonly used PV double glazed insulating glass units. Figure 6 presents the pictures of the sample of vacuum PV glazing.
This section presents the main findings and outcomes of the research project and indicates their potential impacts on the local energy use and construction industry. Achievements of the specified research objectives are illustrated, and limitations of the project are also mentioned for the reference of future studies.
3.1 Design and production of the prototype productInitially, we proposed a prototype design as specified by Figure 2, where the vacuum layer was directly coupled with the laminated PV panel. However, during initial manufacture trials, the air pressure difference between internal and external spaces of the vacuum glass samples produced by the laminating machine caused the breakage of the vacuum glass samples. Then, we followed an alternative approach using pre-pressure furnace, whereas the molten state of the polyvinyl butyral (PVB) could not meet the expected requirements and the bubbles greatly impacted the appearance and performance of PV module. Finally, we proposed the current product design based on the experience acquired from previous failures (See Figure 5).
RESEARCH FINDINGS AND DISCUSSION
3
a-Si or c-SiSolar Cells
Support Pillar Support Pillar
Vacuum Gap Vacuum Gap
Low-E Coating
Iaminate
Low-E Coating
PVB
a-Si Solar Cells
Protection Cap
Figure 5 The structure of the developed vacuum PV glazing
The electrical specifications of the vacuum PV glazing under standard test conditions (STC: air mass 1.5, solar irradiation 1000 W/m2 and cell temperature 25°C) are shown in Table 2. Table 3 presents the given thermal and optical properties of the PV laminated glass and vacuum glass, respectively.
(3) Multi-functionality
Due to their mechanical structures, the PV vacuum glazing can perform the functions of the building envelope in addition to generating emission-free energy, and can thus substitute for conventional construction windows or curtain walls. Apart from power generation and architectural function, the product can provide solar shading with its low SHGC value. It can also act as thermal and sound insulation due to its low U-value and acoustic resistance caused by the vacuum chamber between glazing layers. If applied with special coatings/films on top of PV glazing, it can also provide weather protection.
(4) Mounting system and installation
Based on specific requirements of each project in each region, safety, loading capacity and PV installation specifications can have a decisive impact on the method of fixing/mounting the vacuum. We have in this guide attempted to provide a range of options, highlighting what is possible in current design. The product can be installed with a linear mounting system as mullion-transom facades or structural sealant glazing. It can also be mounted with point-fixing systems including clamp fixings and undercut anchor fixings or mounted into standard curtain walling, rain screen cladding and window systems.
(5) Electrical system
In the curtain wall system, several PV glazing with standard size are usually connected together in a string to form the power generator. The generated direct current is usually fed to an inverter where the direct current is converted to alternating current. If on-site storage is not available, which is the common case in urban areas, the electrical power is registered via an electricity meter and connected to the public supply grid, which will require special permissions from the power grid companies (e.g. CLP in Hong Kong). Therefore, the application of the product will require a full set of electrical systems including cables and connections for parallel or series arrays, direct current load-break switches, inverters and generation meters.
(6) Economic considerations
The economic benefits of the product mainly lie in the following aspects: the substitute for original construction component, CO2 emission reduction and corresponding electricity fee waving, compliance with relevant building regulations (i.e. BEAM Plus in Hong Kong) and application of the feed-in-tariff policy (remuneration for electricity generation from PV).
temperature measurements were conducted through the centre of the vacuum PV sample to calculate the U-value. Secondly, the solar heat gains coefficient (SHGC) of the vacuum PV glazing sample was obtained and compared with three other advanced glazing types in an indoor solar irradiation test. Lastly, an outdoor test was conducted on the platform of Block Z in The Hong Kong Polytechnic University to evaluate the overall thermal performance of vacuum PV glazing. A conventional double clear pane glazing was used as a baseline in the outdoor test.
surfaces shows a similar trend in the three directions. Summing up electricity generation in all floors, the integrated PV modules in Model 2 and 3 can provide 285074.72 kWh/year and 355226.3 kWh/year, which accounts for 13.27% and 16.54% of the total building energy consumption of Model 1. Therefore, given the energy use reduction due to less external heat gain, using the vacuum BIPV glazing can save 27.74% (Model 3) electricity compared to a reference building.

10Investigation on the Thermal and Power Performance of Vacuum BIPV Curtain Wall Technology and its Application Potential in Buildings in Hong Kong
The comparison of building energy between Model 1, Model 2 and Model 3 is summarized in Table 6, which includes energy use of lighting, equipment, district cooling and district heating. Although Model 2 and Model 3 consume slightly more lighting energy due to the reduced visible transmittance of the PV glazing, the great energy saving in cooling and heating leads to the net reduction in the total building energy consumption. The total energy consumption of the Model 2 and 3 declines by 20.77 and 22.37 kWh/m2, accounting for 10.44% and 11.20% of Model 1 respectively. Generated electricity of windows and walls in three directions is also presented in Table 7. The south window produced the most electricity, 1527.13 kWh for Model 2 and 3203.76 kWh for Model 3 in a year, taking up nearly 47.80% the total electricity generated by windows. As for the west window, the electricity generated in a year is close to that of east window. Electricity generated by wall
3.2 Experimental study of the vacuum PV glazingOutdoor experimental test was first conducted on the developed prototype vacuum PV (VPV) glazing with the standard size (1.1m × 1.3m), whose various parameters including the ambient air temperature, incident solar irradiation, surface temperatures of the vacuum PV glazing as well as the I-V curves and the power generation were measured and recorded. The power generation and thermal performances of the prototype were also analysed during the test. To further justify the advantage of the vacuum PV glazing, experimental studies were carried out to compare the thermal performance of scaled-down samples (0.3m × 0.3m) with other advanced windows.
(1) Energy performance of the prototypeIn order to evaluate the energy performance of the vacuum PV glazing, an outdoor field measurement was conducted on the platform of Block Z in The Hong Kong Polytechnic University. The vacuum PV glazing was set up horizontally 0.4m above the floor on stilts so that the external temperatures of both sides of the vacuum PV glazing were approximately equal. Various parameters were measured during this test, including the ambient air temperature, the exterior and transmitted horizontal incident solar irradiation, the outer and inner surface temperatures of the vacuum PV glazing as well as the I-V curves and the power generation from the vacuum PV glazing. All the data was logged at an interval of 1 minute. Power generation and thermal performances of the vacuum PV glazing were analyzed based on the outdoor tests. Figure 7 shows the exterior and transmitted incident solar irradiation. It can be seen that the average solar irradiation transmittance during the period is approximately 0.08. Such low transmittance means that vast majority of solar irradiation is blocked by the vacuum PV glazing. Figure 8 presents the outer and inner surface temperature of the vacuum PV glazing. It can be seen that the outer surface temperature is much higher than the inner surface temperature at daytime. The maximum outer surface temperature is 75.3°C, 30°C higher than the inner surface temperature, which indicates that most of the waste heat is dissipated from the outside surface of the vacuum PV glazing, and the heat transfer to the inside space by convection is mitigated. Thus, compared with the conventional single-glazed PV glazing, the structure of the vacuum PV glazing can help reduce the cooling load and improve the indoor thermal comfort.
Then the vacuum PV glazing was mounted on the front side of an experimental test chamber as shown in Figure 9. Clear glass was also adopted in this study for comparison. Figure 10 presents the instantaneous power output of the vacuum PV glazing in 2 sunny days. It can be seen that the power generation from the vacuum PV glazing is consistent with incident solar radiation. A comparative study in terms of internal air temperature of the chamber between the vacuum PV glazing and the clear glass was conducted in a day of June.
As shown in Figure 11, the internal air temperature in the chamber with the vacuum PV glazing is much lower than that with a clear glass. The measured average and maximum internal air temperature for the vacuum PV glazing is 39.6°C and 40.3°C, respectively, while the corresponding average and maximum internal air temperature of the clear glass are 43.6°C and 44.7°C. The maximum internal air temperature difference between the vacuum PV glazing and the clear glass is 4.4°C, occurring in the morning. There are three temperature peaks of internal air temperature. Since the ambient temperature was relatively stable, the main heat gain of the internal air temperature was from incident solar irradiation. The internal air temperature for vacuum PV glazing is much more stable compared with that for the clear glass. The reason is that the vacuum PV glazing has better heat insulation performance so that the internal air temperature is not affected by the external environment significantly. It can also be seen in this figure that the internal air temperature of the chamber drops continuously at 15:00, which shows that the incident solar irradiation on the façade decreases so that the heat gains of the internal air from the sun also drops.
(2) Comparison with other advanced windows
To further justify the advantage of the vacuum PV glazing, experimental studies were carried out to compare it with other advanced windows. Samples of different types of glazing were mounted on the top of two hotboxes (i.e. test rigs) with the uniform dimension of 300 mm (L) × 300 mm (W) × 450mm (H) to implement both indoor and outdoor tests. Firstly, a co-heating test methodology was adopted for the thermal analysis of the vacuum PV glazing. The test rig was filled with the ice-water mixture to ensure the temperature difference between the inside and outside glazing surfaces larger than 5°C. Heat flux and
Figure 12 shows the internal and external temperatures of the vacuum PV glazing sample. The presented data were selected after the hotbox achieved the steady-state condition, when the temperature difference was around 8°C. Heat flux though the glazing sample and the U-value were then determined as illustrated in Figure 13. The average heat flux from the vacuum glazing was measured to be 15.4 W/m2. And the average U-value was calculated as 1.5 W/m2 × K which is much lower than a regular double pane window with the U-value of 2.5W/m2 × K. Considering the edge heat transfer which would strongly affect the heat flux measurement when the sample is small, it can be expected that the centre U-valve of the vacuum PV glazing should be lower than 1.5 W/m2 × K for a larger scale application (e.g. 1.1m × 1.3m).
(3) Cost effective analysis based on simulation
To address the economic benefits of the developed product, the simple payback period of the vacuum PV glazing is calculated with reference to available PV glazing on the market in both Hong Kong and Beijing’s scenarios.
Based on an average electricity price of 1.25 HKD/kWh from HK Electric, the simple payback period (See Figure 26) when applying the product to the west and east façade is calculated to be 7.5 and 8.0 years compared to the single-pane PV glazing. The payback periods are increased to 8.6 and 8.8 years when compared with double-pane PV glazing as shown in Figure 27. However, when applied to the south façade, the extra initial cost of the product cannot be recovered within 10 years.
The solar simulator in the laboratory can provide relatively steady horizontal incident solar irradiation, so that test rigs were located at the same spot to ensure each window sample exposed to the same radiation level. As shown in Figure 14, SHGCs of the vacuum PV glazing and double-pane PV glazing are much smaller than those of the vacuum glazing and double clear glazing, because the coupled PV module can absorb most of the solar irradiation. The vacuum PV glazing has the lowest SHGC of 0.10 which can act as the excellent thermal insulation.
The outdoor test lasted four days from September 26th to September 30th. As shown in Figure 15, September 26th, 27th and 30th were cloudy days and September 28th could be considered as a sunny day. It can be found that the vacuum PV glazing blocks most solar irradiation compared with the double-pane glazing. Figure 16 presents the temperature profile of the vacuum PV glazing and double-pane glazing in the sunny day. The internal surface temperature of both glazing was much higher than the ambient temperature when the outside incident solar radiation is strong. The internal glazing surface and air temperatures of the test rig with the vacuum PV glazing are lower than those of the test rig with the double-pane glazing. The difference between the internal air temperatures of test rigs is much smaller than that of internal glazing surface temperatures. Therefore, the application of vacuum PV glazing can achieve better indoor environment by reducing the solar heat gain.
3.3 Simulation study of the vacuum PV glazing(1) Simulation of a generic building model
Although a series of field tests have been conducted in the outdoor test bed to study the power and thermal performances of the vacuum BIPV glazing, the experimental scenarios are impossible to represent all the situations and variables. Thus, the numerical study was conducted to comprehensively investigate and compare the energy performance of the vacuum PV glazing and other commonly used energy-efficient glazing. As detailed in the research methodology, a comprehensive simulation model based on EnergyPlus and WINDOW has been developed to simulate the overall energy performance of different windows taking into account of their thermal and power output performance. This model is used to simulate the overall energy performance of the vacuum BIPV curtain wall in comparison with other commonly used windows. The key properties of different types of glazing are shown in Table 4 and the electrical specifications of the PV glazing under standard test conditions are referenced to Table 2.
In order to simulate the annual thermal performance and power performance of these types of glazing in Hong Kong for comparison purpose, a typical office room model has been created for simulation, as shown in Figure 17. The dimension of the office model was 2.5m × 2.3m × 2.5m (L × W × H). This room has only one external wall with three identical windows exposed to the outdoor environment. Simulations were conducted for different orientations, i.e. south (S), east (E), west (W) and north (N). A heat transfer model and PV performance model in EnergyPlus are adopted to investigate
the thermal and power performance of different glazing. The heat transfer model is used to calculate the cooling loads of the office room. The cooling loads are then converted to electricity use of air-conditioning system with a presumed coefficient of performance (COP) of 2.78. The equivalent one-diode model is selected to simulate the annual electricity generation from PV elements. The typical meteorological year (TMY) in Hong Kong is selected a reasonable representation of local climates.
The annual cooling electricity use of different types of glazing in different orientations in Hong Kong are shown in Figure 18. It can be observed that the room using vacuum PV glazing consumes the least cooling electricity for all orientations. The south facing room with vacuum PV glazing consumes about 705.56 kWh per year, which was approximately 14.2%, 9.8%, 8.4%, 7.1% and 4.1% less than the corresponding room with single-pane clear glazing, double-pane clear glazing, vacuum glazing, single-pane PV glazing and double-pane PV glazing, respectively. This is because the vacuum PV glazing have the lowest U-value and SHGC among all types of glazing, as shown in Table 4.3. A lower U-value indicates a higher level of heat insulation performance of the glazing, and a lower SHGC means less solar radiation will pass through the windows. Therefore, the vacuum PV glazing performs the best in the area with big temperature difference between indoor and outdoor environment. In addition, the most cooling electricity use of the office room occurs at the west orientation, followed by east, south and north. Therefore, east and west facing windows should have better solar heat insulation performance, to reduce heat gains from outside environment.
In addition to reduce the cooling load of the office room, the PV glazing can also generate electricity in situ. The annual electricity generation of the three types of PV glazing are shown in Figure 19. It can be seen that the annual electricity generation of the three types of PV glazing is similar to each other. The electricity generation from the vacuum PV glazing is a little less than the single-pane PV glazing due to increased solar cell temperature. However, since the temperature coefficient of the thin-film a-Si solar cells is small, the PV conversion efficiency is not reduced significantly. The annual electricity generation from a-Si PV glazing with 12.0% transmittance is around 113.81 kWh per year. Among all orientations, it is better to install PV glazing on the south facade in order to maximize the electricity output in Hong Kong. And it is not recommended to apply PV glazing on north façade due to limited solar radiation available.
Based on the results above, the vacuum PV glazing not only has the best thermal performance among all types of widely used glazing, but also produces a considerable amount of electricity per year. It is recommended to install vacuum PV glazing on south facade to perform the best overall energy performance.
(2) Simulation of the whole building
Apart from modelling studies conducted under the hot and humid climate of Hong Kong, the annual energy performance of different types of glazing in a cold region (i.e. Beijing) was also simulated for comparison. Simulation results are shown in Figure 20 and Figure 21. It can be observed that the room using the vacuum PV glazing achieves the lowest cooling consumption in both climates. In Beijing, the consumed cooling energy with the vacuum PV glazing is much smaller and is 30.2%, 20.8%, 17.0%, 13.8%, 4.4% less than that of the room with other types of glazing. It can be concluded that the energy saving potential of the vacuum PV glazing is much larger in a cold climate while the electricity generation is much higher during the summer time of Beijing due to the smaller solar incidence angle.
The developed simulation model was further applied to a 20-floor prototype office building. Typical floors of the building are divided into 5 conditioned zones, with a total floor area of 540 m2 (as shown in Figure 22). The reference case – Model 1 keeps all windows as the commonly used double-pane clear glazing, while the design cases include Model 2 and Model 3. Model 2 keeps the north-facing window as the conventional double-pane glazing while changes windows orientated to the other three directions to the developed vacuum PV glazing. The opaque part of all building facades is assumed to be covered with traditional crystalline BIPV with a power conversion efficiency of 15% to maximize the power generation potential of the building envelope. Model 3 shares similar settings with Model 2, except that the window transparency is tuned to 20% with a crystalline silicon (c-Si) as shown in Figure 23. Table 5 shows detailed settings of window properties for the three models respectively. The U-value and SHGC of a-Si vacuum PV glazing are obtained from previous experiments and those of double-pane clear glazing are calculated by the simulation software WINDOW. Thermal and power generation properties of c-Si vacuum PV glazing are obtained from existing literatures.
The simulation results of the total heat gain and loss through all windows are presented in Figure 24 and Figure 25. The heat gain and loss both decrease sharply when traditional double-pane clear glazing is replaced by the PV vacuum glazing. The obvious differences between these three models can be identified from the figures. Compared with the performance of Model 1, the heat gain through windows of Model 2 and Model 3 drops up to 77.89% and 77.97% (south-facing windows), while the heat loss of the two models declines up to 79.28% and 79.32% (south-facing windows), respectively.
On the other side, based on the peak office hour electricity price of 1.4 CNY/kWh for cooling and 0.25 CNY/kWh for heating from the Beijing authority, the simple payback period (See Figure 28) when applying the product to the west, east, and south façade is calculated to be 3.8, 4.6 and 5.3 years compared to the single-pane PV glazing. The payback periods are increased to 4.5, 5.4 and 6.5 years when compared with double-pane PV glazing as shown in Figure 29.
As a result, the product can be considered as a cost-effective application in building facades when considering its tremendous saving of air-conditioning energy and corresponding annual expenses. In addition, the property developer could also benefit from a potential increment in renting rates and popularity, if the building gets certified under a green building scheme by claiming credits in CO2 reduction and renewable application assessment criteria. All the abovementioned potential benefits with the application of the vacuum PV glazing would attract more attention from the construction industry.
3.4 Brief technical guideline for the vacuum PV glazingDesigning the vacuum PV glazing (i.e. vacuum BIPV curtain wall) system is a more complex process than a standard added-on PV system. The architectural context, structural requirements, economic considerations and building regulation requirements should all be considered, so that this brief guidance mainly focuses on the below aspects: design strategy, environmental variables, multifunctionality, installation situation, electrical components, and economic aspects (Polysolar Limited, 2015).
(1) Design strategy
Architects, property developers and building users become more inclined to consider renewable and energy efficient applications to meet building and planning regulations due to rising energy bills and awareness of environmental sustainability. The combination of PV and vacuum glazing is an innovative and promising solution to meet these requirements in the new building developments or refurbishment projects. As proved in the above sections of this report, the developed product offers the added advantage of providing a return of investment from the building envelope. Architectural and structural factors, as well as economic considerations should be taken into account at an early stage in any building projects to integrate renewable systems through a more satisfactory approach.
(2) Environmental variables
When designing a BIPV system, a compromise must be reached between the requirements of energy yield optimisation and those of the architectural environment. Therefore, the orientation, lighting performance, shading and temperature are the four mainly concerned issues in BIPV design. According to simulation and experimental results presented in the above sections, the optimal orientation of the installed PV glazing should be south for maximizing the annual power generation, while cooling load reduction is more conspicuous when the product is applied on the west and east facades. Therefore, it is preferable to install the product on all three facades for an optimal overall building energy-saving performance. The visible light transmittance is only 12% in the developed prototype, which might cause slightly more lighting power consumption compared to traditional double-pane clear glazing. However, the transmittance can be easily adjusted to higher than 20% in the manufacture process depending on the effective area of PV materials. There will always be a trade-off between power generation and permeable light, whereas this research has proved that the combined power generation and cooling load reduction can be more than the increased lighting energy use. Power generation performance of the a-Si PV is less sensitive to shadings, so that the prototype is subject to less influence from peripheral shadings. However, if we change the PV material to c-Si for higher conversion efficiency, a shading calculation should be conducted before allocating the BIPV glazing. Lastly, the conversion efficiency of a-Si glazing is also less sensitive to the increase of the panel temperature. The temperature coefficient must be considered if changing the PV material to c-Si.
The vacuum PV glazing was made by sandwiching a layer of PVB between an external PV laminated glass with a visible light transmittance of 12% and an internal vacuum glass. A low-e coating was also adopted to enhance its thermal performance. The structure of the vacuum PV glazing is shown in Figure 5. The dimension of the vacuum PV glazing is 1300 mm (width) × 1100 mm (height) × 20.87 mm (thickness), thinner than commonly used PV double glazed insulating glass units. Figure 6 presents the pictures of the sample of vacuum PV glazing.
This section presents the main findings and outcomes of the research project and indicates their potential impacts on the local energy use and construction industry. Achievements of the specified research objectives are illustrated, and limitations of the project are also mentioned for the reference of future studies.
3.1 Design and production of the prototype productInitially, we proposed a prototype design as specified by Figure 2, where the vacuum layer was directly coupled with the laminated PV panel. However, during initial manufacture trials, the air pressure difference between internal and external spaces of the vacuum glass samples produced by the laminating machine caused the breakage of the vacuum glass samples. Then, we followed an alternative approach using pre-pressure furnace, whereas the molten state of the polyvinyl butyral (PVB) could not meet the expected requirements and the bubbles greatly impacted the appearance and performance of PV module. Finally, we proposed the current product design based on the experience acquired from previous failures (See Figure 5).
Figure 6 The pictures of vacuum PV glazing
The electrical specifications of the vacuum PV glazing under standard test conditions (STC: air mass 1.5, solar irradiation 1000 W/m2 and cell temperature 25°C) are shown in Table 2. Table 3 presents the given thermal and optical properties of the PV laminated glass and vacuum glass, respectively.
Table 2 Electrical specifications of the vacuum PV glazing under STC Electrical specifications Value
Maximum power output (W) 74
Voltage at the maximum power point (V) 94
Current at the maximum power point (A) 0.78
Open circuit voltage (V) 120
Short circuit current (A) 0.98
Fill factor 0.62
(3) Multi-functionality
Due to their mechanical structures, the PV vacuum glazing can perform the functions of the building envelope in addition to generating emission-free energy, and can thus substitute for conventional construction windows or curtain walls. Apart from power generation and architectural function, the product can provide solar shading with its low SHGC value. It can also act as thermal and sound insulation due to its low U-value and acoustic resistance caused by the vacuum chamber between glazing layers. If applied with special coatings/films on top of PV glazing, it can also provide weather protection.
(4) Mounting system and installation
Based on specific requirements of each project in each region, safety, loading capacity and PV installation specifications can have a decisive impact on the method of fixing/mounting the vacuum. We have in this guide attempted to provide a range of options, highlighting what is possible in current design. The product can be installed with a linear mounting system as mullion-transom facades or structural sealant glazing. It can also be mounted with point-fixing systems including clamp fixings and undercut anchor fixings or mounted into standard curtain walling, rain screen cladding and window systems.
(5) Electrical system
In the curtain wall system, several PV glazing with standard size are usually connected together in a string to form the power generator. The generated direct current is usually fed to an inverter where the direct current is converted to alternating current. If on-site storage is not available, which is the common case in urban areas, the electrical power is registered via an electricity meter and connected to the public supply grid, which will require special permissions from the power grid companies (e.g. CLP in Hong Kong). Therefore, the application of the product will require a full set of electrical systems including cables and connections for parallel or series arrays, direct current load-break switches, inverters and generation meters.
(6) Economic considerations
The economic benefits of the product mainly lie in the following aspects: the substitute for original construction component, CO2 emission reduction and corresponding electricity fee waving, compliance with relevant building regulations (i.e. BEAM Plus in Hong Kong) and application of the feed-in-tariff policy (remuneration for electricity generation from PV).
temperature measurements were conducted through the centre of the vacuum PV sample to calculate the U-value. Secondly, the solar heat gains coefficient (SHGC) of the vacuum PV glazing sample was obtained and compared with three other advanced glazing types in an indoor solar irradiation test. Lastly, an outdoor test was conducted on the platform of Block Z in The Hong Kong Polytechnic University to evaluate the overall thermal performance of vacuum PV glazing. A conventional double clear pane glazing was used as a baseline in the outdoor test.
surfaces shows a similar trend in the three directions. Summing up electricity generation in all floors, the integrated PV modules in Model 2 and 3 can provide 285074.72 kWh/year and 355226.3 kWh/year, which accounts for 13.27% and 16.54% of the total building energy consumption of Model 1. Therefore, given the energy use reduction due to less external heat gain, using the vacuum BIPV glazing can save 27.74% (Model 3) electricity compared to a reference building.

11 Construction Industry Council
The comparison of building energy between Model 1, Model 2 and Model 3 is summarized in Table 6, which includes energy use of lighting, equipment, district cooling and district heating. Although Model 2 and Model 3 consume slightly more lighting energy due to the reduced visible transmittance of the PV glazing, the great energy saving in cooling and heating leads to the net reduction in the total building energy consumption. The total energy consumption of the Model 2 and 3 declines by 20.77 and 22.37 kWh/m2, accounting for 10.44% and 11.20% of Model 1 respectively. Generated electricity of windows and walls in three directions is also presented in Table 7. The south window produced the most electricity, 1527.13 kWh for Model 2 and 3203.76 kWh for Model 3 in a year, taking up nearly 47.80% the total electricity generated by windows. As for the west window, the electricity generated in a year is close to that of east window. Electricity generated by wall
3.2 Experimental study of the vacuum PV glazingOutdoor experimental test was first conducted on the developed prototype vacuum PV (VPV) glazing with the standard size (1.1m × 1.3m), whose various parameters including the ambient air temperature, incident solar irradiation, surface temperatures of the vacuum PV glazing as well as the I-V curves and the power generation were measured and recorded. The power generation and thermal performances of the prototype were also analysed during the test. To further justify the advantage of the vacuum PV glazing, experimental studies were carried out to compare the thermal performance of scaled-down samples (0.3m × 0.3m) with other advanced windows.
(1) Energy performance of the prototypeIn order to evaluate the energy performance of the vacuum PV glazing, an outdoor field measurement was conducted on the platform of Block Z in The Hong Kong Polytechnic University. The vacuum PV glazing was set up horizontally 0.4m above the floor on stilts so that the external temperatures of both sides of the vacuum PV glazing were approximately equal. Various parameters were measured during this test, including the ambient air temperature, the exterior and transmitted horizontal incident solar irradiation, the outer and inner surface temperatures of the vacuum PV glazing as well as the I-V curves and the power generation from the vacuum PV glazing. All the data was logged at an interval of 1 minute. Power generation and thermal performances of the vacuum PV glazing were analyzed based on the outdoor tests. Figure 7 shows the exterior and transmitted incident solar irradiation. It can be seen that the average solar irradiation transmittance during the period is approximately 0.08. Such low transmittance means that vast majority of solar irradiation is blocked by the vacuum PV glazing. Figure 8 presents the outer and inner surface temperature of the vacuum PV glazing. It can be seen that the outer surface temperature is much higher than the inner surface temperature at daytime. The maximum outer surface temperature is 75.3°C, 30°C higher than the inner surface temperature, which indicates that most of the waste heat is dissipated from the outside surface of the vacuum PV glazing, and the heat transfer to the inside space by convection is mitigated. Thus, compared with the conventional single-glazed PV glazing, the structure of the vacuum PV glazing can help reduce the cooling load and improve the indoor thermal comfort.
Then the vacuum PV glazing was mounted on the front side of an experimental test chamber as shown in Figure 9. Clear glass was also adopted in this study for comparison. Figure 10 presents the instantaneous power output of the vacuum PV glazing in 2 sunny days. It can be seen that the power generation from the vacuum PV glazing is consistent with incident solar radiation. A comparative study in terms of internal air temperature of the chamber between the vacuum PV glazing and the clear glass was conducted in a day of June.
As shown in Figure 11, the internal air temperature in the chamber with the vacuum PV glazing is much lower than that with a clear glass. The measured average and maximum internal air temperature for the vacuum PV glazing is 39.6°C and 40.3°C, respectively, while the corresponding average and maximum internal air temperature of the clear glass are 43.6°C and 44.7°C. The maximum internal air temperature difference between the vacuum PV glazing and the clear glass is 4.4°C, occurring in the morning. There are three temperature peaks of internal air temperature. Since the ambient temperature was relatively stable, the main heat gain of the internal air temperature was from incident solar irradiation. The internal air temperature for vacuum PV glazing is much more stable compared with that for the clear glass. The reason is that the vacuum PV glazing has better heat insulation performance so that the internal air temperature is not affected by the external environment significantly. It can also be seen in this figure that the internal air temperature of the chamber drops continuously at 15:00, which shows that the incident solar irradiation on the façade decreases so that the heat gains of the internal air from the sun also drops.
(2) Comparison with other advanced windows
To further justify the advantage of the vacuum PV glazing, experimental studies were carried out to compare it with other advanced windows. Samples of different types of glazing were mounted on the top of two hotboxes (i.e. test rigs) with the uniform dimension of 300 mm (L) × 300 mm (W) × 450mm (H) to implement both indoor and outdoor tests. Firstly, a co-heating test methodology was adopted for the thermal analysis of the vacuum PV glazing. The test rig was filled with the ice-water mixture to ensure the temperature difference between the inside and outside glazing surfaces larger than 5°C. Heat flux and
Figure 12 shows the internal and external temperatures of the vacuum PV glazing sample. The presented data were selected after the hotbox achieved the steady-state condition, when the temperature difference was around 8°C. Heat flux though the glazing sample and the U-value were then determined as illustrated in Figure 13. The average heat flux from the vacuum glazing was measured to be 15.4 W/m2. And the average U-value was calculated as 1.5 W/m2 × K which is much lower than a regular double pane window with the U-value of 2.5W/m2 × K. Considering the edge heat transfer which would strongly affect the heat flux measurement when the sample is small, it can be expected that the centre U-valve of the vacuum PV glazing should be lower than 1.5 W/m2 × K for a larger scale application (e.g. 1.1m × 1.3m).
(3) Cost effective analysis based on simulation
To address the economic benefits of the developed product, the simple payback period of the vacuum PV glazing is calculated with reference to available PV glazing on the market in both Hong Kong and Beijing’s scenarios.
Based on an average electricity price of 1.25 HKD/kWh from HK Electric, the simple payback period (See Figure 26) when applying the product to the west and east façade is calculated to be 7.5 and 8.0 years compared to the single-pane PV glazing. The payback periods are increased to 8.6 and 8.8 years when compared with double-pane PV glazing as shown in Figure 27. However, when applied to the south façade, the extra initial cost of the product cannot be recovered within 10 years.
The solar simulator in the laboratory can provide relatively steady horizontal incident solar irradiation, so that test rigs were located at the same spot to ensure each window sample exposed to the same radiation level. As shown in Figure 14, SHGCs of the vacuum PV glazing and double-pane PV glazing are much smaller than those of the vacuum glazing and double clear glazing, because the coupled PV module can absorb most of the solar irradiation. The vacuum PV glazing has the lowest SHGC of 0.10 which can act as the excellent thermal insulation.
The outdoor test lasted four days from September 26th to September 30th. As shown in Figure 15, September 26th, 27th and 30th were cloudy days and September 28th could be considered as a sunny day. It can be found that the vacuum PV glazing blocks most solar irradiation compared with the double-pane glazing. Figure 16 presents the temperature profile of the vacuum PV glazing and double-pane glazing in the sunny day. The internal surface temperature of both glazing was much higher than the ambient temperature when the outside incident solar radiation is strong. The internal glazing surface and air temperatures of the test rig with the vacuum PV glazing are lower than those of the test rig with the double-pane glazing. The difference between the internal air temperatures of test rigs is much smaller than that of internal glazing surface temperatures. Therefore, the application of vacuum PV glazing can achieve better indoor environment by reducing the solar heat gain.
3.3 Simulation study of the vacuum PV glazing(1) Simulation of a generic building model
Although a series of field tests have been conducted in the outdoor test bed to study the power and thermal performances of the vacuum BIPV glazing, the experimental scenarios are impossible to represent all the situations and variables. Thus, the numerical study was conducted to comprehensively investigate and compare the energy performance of the vacuum PV glazing and other commonly used energy-efficient glazing. As detailed in the research methodology, a comprehensive simulation model based on EnergyPlus and WINDOW has been developed to simulate the overall energy performance of different windows taking into account of their thermal and power output performance. This model is used to simulate the overall energy performance of the vacuum BIPV curtain wall in comparison with other commonly used windows. The key properties of different types of glazing are shown in Table 4 and the electrical specifications of the PV glazing under standard test conditions are referenced to Table 2.
In order to simulate the annual thermal performance and power performance of these types of glazing in Hong Kong for comparison purpose, a typical office room model has been created for simulation, as shown in Figure 17. The dimension of the office model was 2.5m × 2.3m × 2.5m (L × W × H). This room has only one external wall with three identical windows exposed to the outdoor environment. Simulations were conducted for different orientations, i.e. south (S), east (E), west (W) and north (N). A heat transfer model and PV performance model in EnergyPlus are adopted to investigate
the thermal and power performance of different glazing. The heat transfer model is used to calculate the cooling loads of the office room. The cooling loads are then converted to electricity use of air-conditioning system with a presumed coefficient of performance (COP) of 2.78. The equivalent one-diode model is selected to simulate the annual electricity generation from PV elements. The typical meteorological year (TMY) in Hong Kong is selected a reasonable representation of local climates.
The annual cooling electricity use of different types of glazing in different orientations in Hong Kong are shown in Figure 18. It can be observed that the room using vacuum PV glazing consumes the least cooling electricity for all orientations. The south facing room with vacuum PV glazing consumes about 705.56 kWh per year, which was approximately 14.2%, 9.8%, 8.4%, 7.1% and 4.1% less than the corresponding room with single-pane clear glazing, double-pane clear glazing, vacuum glazing, single-pane PV glazing and double-pane PV glazing, respectively. This is because the vacuum PV glazing have the lowest U-value and SHGC among all types of glazing, as shown in Table 4.3. A lower U-value indicates a higher level of heat insulation performance of the glazing, and a lower SHGC means less solar radiation will pass through the windows. Therefore, the vacuum PV glazing performs the best in the area with big temperature difference between indoor and outdoor environment. In addition, the most cooling electricity use of the office room occurs at the west orientation, followed by east, south and north. Therefore, east and west facing windows should have better solar heat insulation performance, to reduce heat gains from outside environment.
In addition to reduce the cooling load of the office room, the PV glazing can also generate electricity in situ. The annual electricity generation of the three types of PV glazing are shown in Figure 19. It can be seen that the annual electricity generation of the three types of PV glazing is similar to each other. The electricity generation from the vacuum PV glazing is a little less than the single-pane PV glazing due to increased solar cell temperature. However, since the temperature coefficient of the thin-film a-Si solar cells is small, the PV conversion efficiency is not reduced significantly. The annual electricity generation from a-Si PV glazing with 12.0% transmittance is around 113.81 kWh per year. Among all orientations, it is better to install PV glazing on the south facade in order to maximize the electricity output in Hong Kong. And it is not recommended to apply PV glazing on north façade due to limited solar radiation available.
Based on the results above, the vacuum PV glazing not only has the best thermal performance among all types of widely used glazing, but also produces a considerable amount of electricity per year. It is recommended to install vacuum PV glazing on south facade to perform the best overall energy performance.
(2) Simulation of the whole building
Apart from modelling studies conducted under the hot and humid climate of Hong Kong, the annual energy performance of different types of glazing in a cold region (i.e. Beijing) was also simulated for comparison. Simulation results are shown in Figure 20 and Figure 21. It can be observed that the room using the vacuum PV glazing achieves the lowest cooling consumption in both climates. In Beijing, the consumed cooling energy with the vacuum PV glazing is much smaller and is 30.2%, 20.8%, 17.0%, 13.8%, 4.4% less than that of the room with other types of glazing. It can be concluded that the energy saving potential of the vacuum PV glazing is much larger in a cold climate while the electricity generation is much higher during the summer time of Beijing due to the smaller solar incidence angle.
The developed simulation model was further applied to a 20-floor prototype office building. Typical floors of the building are divided into 5 conditioned zones, with a total floor area of 540 m2 (as shown in Figure 22). The reference case – Model 1 keeps all windows as the commonly used double-pane clear glazing, while the design cases include Model 2 and Model 3. Model 2 keeps the north-facing window as the conventional double-pane glazing while changes windows orientated to the other three directions to the developed vacuum PV glazing. The opaque part of all building facades is assumed to be covered with traditional crystalline BIPV with a power conversion efficiency of 15% to maximize the power generation potential of the building envelope. Model 3 shares similar settings with Model 2, except that the window transparency is tuned to 20% with a crystalline silicon (c-Si) as shown in Figure 23. Table 5 shows detailed settings of window properties for the three models respectively. The U-value and SHGC of a-Si vacuum PV glazing are obtained from previous experiments and those of double-pane clear glazing are calculated by the simulation software WINDOW. Thermal and power generation properties of c-Si vacuum PV glazing are obtained from existing literatures.
The simulation results of the total heat gain and loss through all windows are presented in Figure 24 and Figure 25. The heat gain and loss both decrease sharply when traditional double-pane clear glazing is replaced by the PV vacuum glazing. The obvious differences between these three models can be identified from the figures. Compared with the performance of Model 1, the heat gain through windows of Model 2 and Model 3 drops up to 77.89% and 77.97% (south-facing windows), while the heat loss of the two models declines up to 79.28% and 79.32% (south-facing windows), respectively.
On the other side, based on the peak office hour electricity price of 1.4 CNY/kWh for cooling and 0.25 CNY/kWh for heating from the Beijing authority, the simple payback period (See Figure 28) when applying the product to the west, east, and south façade is calculated to be 3.8, 4.6 and 5.3 years compared to the single-pane PV glazing. The payback periods are increased to 4.5, 5.4 and 6.5 years when compared with double-pane PV glazing as shown in Figure 29.
As a result, the product can be considered as a cost-effective application in building facades when considering its tremendous saving of air-conditioning energy and corresponding annual expenses. In addition, the property developer could also benefit from a potential increment in renting rates and popularity, if the building gets certified under a green building scheme by claiming credits in CO2 reduction and renewable application assessment criteria. All the abovementioned potential benefits with the application of the vacuum PV glazing would attract more attention from the construction industry.
3.4 Brief technical guideline for the vacuum PV glazingDesigning the vacuum PV glazing (i.e. vacuum BIPV curtain wall) system is a more complex process than a standard added-on PV system. The architectural context, structural requirements, economic considerations and building regulation requirements should all be considered, so that this brief guidance mainly focuses on the below aspects: design strategy, environmental variables, multifunctionality, installation situation, electrical components, and economic aspects (Polysolar Limited, 2015).
(1) Design strategy
Architects, property developers and building users become more inclined to consider renewable and energy efficient applications to meet building and planning regulations due to rising energy bills and awareness of environmental sustainability. The combination of PV and vacuum glazing is an innovative and promising solution to meet these requirements in the new building developments or refurbishment projects. As proved in the above sections of this report, the developed product offers the added advantage of providing a return of investment from the building envelope. Architectural and structural factors, as well as economic considerations should be taken into account at an early stage in any building projects to integrate renewable systems through a more satisfactory approach.
(2) Environmental variables
When designing a BIPV system, a compromise must be reached between the requirements of energy yield optimisation and those of the architectural environment. Therefore, the orientation, lighting performance, shading and temperature are the four mainly concerned issues in BIPV design. According to simulation and experimental results presented in the above sections, the optimal orientation of the installed PV glazing should be south for maximizing the annual power generation, while cooling load reduction is more conspicuous when the product is applied on the west and east facades. Therefore, it is preferable to install the product on all three facades for an optimal overall building energy-saving performance. The visible light transmittance is only 12% in the developed prototype, which might cause slightly more lighting power consumption compared to traditional double-pane clear glazing. However, the transmittance can be easily adjusted to higher than 20% in the manufacture process depending on the effective area of PV materials. There will always be a trade-off between power generation and permeable light, whereas this research has proved that the combined power generation and cooling load reduction can be more than the increased lighting energy use. Power generation performance of the a-Si PV is less sensitive to shadings, so that the prototype is subject to less influence from peripheral shadings. However, if we change the PV material to c-Si for higher conversion efficiency, a shading calculation should be conducted before allocating the BIPV glazing. Lastly, the conversion efficiency of a-Si glazing is also less sensitive to the increase of the panel temperature. The temperature coefficient must be considered if changing the PV material to c-Si.
The vacuum PV glazing was made by sandwiching a layer of PVB between an external PV laminated glass with a visible light transmittance of 12% and an internal vacuum glass. A low-e coating was also adopted to enhance its thermal performance. The structure of the vacuum PV glazing is shown in Figure 5. The dimension of the vacuum PV glazing is 1300 mm (width) × 1100 mm (height) × 20.87 mm (thickness), thinner than commonly used PV double glazed insulating glass units. Figure 6 presents the pictures of the sample of vacuum PV glazing.
This section presents the main findings and outcomes of the research project and indicates their potential impacts on the local energy use and construction industry. Achievements of the specified research objectives are illustrated, and limitations of the project are also mentioned for the reference of future studies.
3.1 Design and production of the prototype productInitially, we proposed a prototype design as specified by Figure 2, where the vacuum layer was directly coupled with the laminated PV panel. However, during initial manufacture trials, the air pressure difference between internal and external spaces of the vacuum glass samples produced by the laminating machine caused the breakage of the vacuum glass samples. Then, we followed an alternative approach using pre-pressure furnace, whereas the molten state of the polyvinyl butyral (PVB) could not meet the expected requirements and the bubbles greatly impacted the appearance and performance of PV module. Finally, we proposed the current product design based on the experience acquired from previous failures (See Figure 5).
The electrical specifications of the vacuum PV glazing under standard test conditions (STC: air mass 1.5, solar irradiation 1000 W/m2 and cell temperature 25°C) are shown in Table 2. Table 3 presents the given thermal and optical properties of the PV laminated glass and vacuum glass, respectively.
Table 3 Thermal and optical properties of the PV laminated glass and vacuum glass
Item PV laminated glass Vacuum glass
Visible light transmittance (%) 13.5 59
Visible light reflectance (%) 9.1 14
Solar radiation transmittance (%) 13.4 39
Solar radiation reflectance (%) 17.0 26
SHGC 0.3 0.58
U-value (W/m2∙K) 5.7 0.8
(3) Multi-functionality
Due to their mechanical structures, the PV vacuum glazing can perform the functions of the building envelope in addition to generating emission-free energy, and can thus substitute for conventional construction windows or curtain walls. Apart from power generation and architectural function, the product can provide solar shading with its low SHGC value. It can also act as thermal and sound insulation due to its low U-value and acoustic resistance caused by the vacuum chamber between glazing layers. If applied with special coatings/films on top of PV glazing, it can also provide weather protection.
(4) Mounting system and installation
Based on specific requirements of each project in each region, safety, loading capacity and PV installation specifications can have a decisive impact on the method of fixing/mounting the vacuum. We have in this guide attempted to provide a range of options, highlighting what is possible in current design. The product can be installed with a linear mounting system as mullion-transom facades or structural sealant glazing. It can also be mounted with point-fixing systems including clamp fixings and undercut anchor fixings or mounted into standard curtain walling, rain screen cladding and window systems.
(5) Electrical system
In the curtain wall system, several PV glazing with standard size are usually connected together in a string to form the power generator. The generated direct current is usually fed to an inverter where the direct current is converted to alternating current. If on-site storage is not available, which is the common case in urban areas, the electrical power is registered via an electricity meter and connected to the public supply grid, which will require special permissions from the power grid companies (e.g. CLP in Hong Kong). Therefore, the application of the product will require a full set of electrical systems including cables and connections for parallel or series arrays, direct current load-break switches, inverters and generation meters.
(6) Economic considerations
The economic benefits of the product mainly lie in the following aspects: the substitute for original construction component, CO2 emission reduction and corresponding electricity fee waving, compliance with relevant building regulations (i.e. BEAM Plus in Hong Kong) and application of the feed-in-tariff policy (remuneration for electricity generation from PV).
Figure 7 Exterior and transmitted incident solar irradiation
1200
1000
800
600
400
200
0 0.00
0.03
0.06
0.09
0.12
0.15
0.18
10:30 11:00 11:30 12:00 13:00 14:0012:30 13:30 14:30Time
Inci
dent
sol
ar ir
radi
atio
n (W
/m2 )
Tran
smitt
anceExterior incident solar irradiationTransmitted incident solar irradiationTransmittance
temperature measurements were conducted through the centre of the vacuum PV sample to calculate the U-value. Secondly, the solar heat gains coefficient (SHGC) of the vacuum PV glazing sample was obtained and compared with three other advanced glazing types in an indoor solar irradiation test. Lastly, an outdoor test was conducted on the platform of Block Z in The Hong Kong Polytechnic University to evaluate the overall thermal performance of vacuum PV glazing. A conventional double clear pane glazing was used as a baseline in the outdoor test.
surfaces shows a similar trend in the three directions. Summing up electricity generation in all floors, the integrated PV modules in Model 2 and 3 can provide 285074.72 kWh/year and 355226.3 kWh/year, which accounts for 13.27% and 16.54% of the total building energy consumption of Model 1. Therefore, given the energy use reduction due to less external heat gain, using the vacuum BIPV glazing can save 27.74% (Model 3) electricity compared to a reference building.

Investigation on the Thermal and Power Performance of Vacuum BIPV Curtain Wall Technology and its Application Potential in Buildings in Hong Kong
12
The comparison of building energy between Model 1, Model 2 and Model 3 is summarized in Table 6, which includes energy use of lighting, equipment, district cooling and district heating. Although Model 2 and Model 3 consume slightly more lighting energy due to the reduced visible transmittance of the PV glazing, the great energy saving in cooling and heating leads to the net reduction in the total building energy consumption. The total energy consumption of the Model 2 and 3 declines by 20.77 and 22.37 kWh/m2, accounting for 10.44% and 11.20% of Model 1 respectively. Generated electricity of windows and walls in three directions is also presented in Table 7. The south window produced the most electricity, 1527.13 kWh for Model 2 and 3203.76 kWh for Model 3 in a year, taking up nearly 47.80% the total electricity generated by windows. As for the west window, the electricity generated in a year is close to that of east window. Electricity generated by wall
3.2 Experimental study of the vacuum PV glazingOutdoor experimental test was first conducted on the developed prototype vacuum PV (VPV) glazing with the standard size (1.1m × 1.3m), whose various parameters including the ambient air temperature, incident solar irradiation, surface temperatures of the vacuum PV glazing as well as the I-V curves and the power generation were measured and recorded. The power generation and thermal performances of the prototype were also analysed during the test. To further justify the advantage of the vacuum PV glazing, experimental studies were carried out to compare the thermal performance of scaled-down samples (0.3m × 0.3m) with other advanced windows.
(1) Energy performance of the prototypeIn order to evaluate the energy performance of the vacuum PV glazing, an outdoor field measurement was conducted on the platform of Block Z in The Hong Kong Polytechnic University. The vacuum PV glazing was set up horizontally 0.4m above the floor on stilts so that the external temperatures of both sides of the vacuum PV glazing were approximately equal. Various parameters were measured during this test, including the ambient air temperature, the exterior and transmitted horizontal incident solar irradiation, the outer and inner surface temperatures of the vacuum PV glazing as well as the I-V curves and the power generation from the vacuum PV glazing. All the data was logged at an interval of 1 minute. Power generation and thermal performances of the vacuum PV glazing were analyzed based on the outdoor tests. Figure 7 shows the exterior and transmitted incident solar irradiation. It can be seen that the average solar irradiation transmittance during the period is approximately 0.08. Such low transmittance means that vast majority of solar irradiation is blocked by the vacuum PV glazing. Figure 8 presents the outer and inner surface temperature of the vacuum PV glazing. It can be seen that the outer surface temperature is much higher than the inner surface temperature at daytime. The maximum outer surface temperature is 75.3°C, 30°C higher than the inner surface temperature, which indicates that most of the waste heat is dissipated from the outside surface of the vacuum PV glazing, and the heat transfer to the inside space by convection is mitigated. Thus, compared with the conventional single-glazed PV glazing, the structure of the vacuum PV glazing can help reduce the cooling load and improve the indoor thermal comfort.
Then the vacuum PV glazing was mounted on the front side of an experimental test chamber as shown in Figure 9. Clear glass was also adopted in this study for comparison. Figure 10 presents the instantaneous power output of the vacuum PV glazing in 2 sunny days. It can be seen that the power generation from the vacuum PV glazing is consistent with incident solar radiation. A comparative study in terms of internal air temperature of the chamber between the vacuum PV glazing and the clear glass was conducted in a day of June.
As shown in Figure 11, the internal air temperature in the chamber with the vacuum PV glazing is much lower than that with a clear glass. The measured average and maximum internal air temperature for the vacuum PV glazing is 39.6°C and 40.3°C, respectively, while the corresponding average and maximum internal air temperature of the clear glass are 43.6°C and 44.7°C. The maximum internal air temperature difference between the vacuum PV glazing and the clear glass is 4.4°C, occurring in the morning. There are three temperature peaks of internal air temperature. Since the ambient temperature was relatively stable, the main heat gain of the internal air temperature was from incident solar irradiation. The internal air temperature for vacuum PV glazing is much more stable compared with that for the clear glass. The reason is that the vacuum PV glazing has better heat insulation performance so that the internal air temperature is not affected by the external environment significantly. It can also be seen in this figure that the internal air temperature of the chamber drops continuously at 15:00, which shows that the incident solar irradiation on the façade decreases so that the heat gains of the internal air from the sun also drops.
(2) Comparison with other advanced windows
To further justify the advantage of the vacuum PV glazing, experimental studies were carried out to compare it with other advanced windows. Samples of different types of glazing were mounted on the top of two hotboxes (i.e. test rigs) with the uniform dimension of 300 mm (L) × 300 mm (W) × 450mm (H) to implement both indoor and outdoor tests. Firstly, a co-heating test methodology was adopted for the thermal analysis of the vacuum PV glazing. The test rig was filled with the ice-water mixture to ensure the temperature difference between the inside and outside glazing surfaces larger than 5°C. Heat flux and
Figure 12 shows the internal and external temperatures of the vacuum PV glazing sample. The presented data were selected after the hotbox achieved the steady-state condition, when the temperature difference was around 8°C. Heat flux though the glazing sample and the U-value were then determined as illustrated in Figure 13. The average heat flux from the vacuum glazing was measured to be 15.4 W/m2. And the average U-value was calculated as 1.5 W/m2 × K which is much lower than a regular double pane window with the U-value of 2.5W/m2 × K. Considering the edge heat transfer which would strongly affect the heat flux measurement when the sample is small, it can be expected that the centre U-valve of the vacuum PV glazing should be lower than 1.5 W/m2 × K for a larger scale application (e.g. 1.1m × 1.3m).
(3) Cost effective analysis based on simulation
To address the economic benefits of the developed product, the simple payback period of the vacuum PV glazing is calculated with reference to available PV glazing on the market in both Hong Kong and Beijing’s scenarios.
Based on an average electricity price of 1.25 HKD/kWh from HK Electric, the simple payback period (See Figure 26) when applying the product to the west and east façade is calculated to be 7.5 and 8.0 years compared to the single-pane PV glazing. The payback periods are increased to 8.6 and 8.8 years when compared with double-pane PV glazing as shown in Figure 27. However, when applied to the south façade, the extra initial cost of the product cannot be recovered within 10 years.
The solar simulator in the laboratory can provide relatively steady horizontal incident solar irradiation, so that test rigs were located at the same spot to ensure each window sample exposed to the same radiation level. As shown in Figure 14, SHGCs of the vacuum PV glazing and double-pane PV glazing are much smaller than those of the vacuum glazing and double clear glazing, because the coupled PV module can absorb most of the solar irradiation. The vacuum PV glazing has the lowest SHGC of 0.10 which can act as the excellent thermal insulation.
The outdoor test lasted four days from September 26th to September 30th. As shown in Figure 15, September 26th, 27th and 30th were cloudy days and September 28th could be considered as a sunny day. It can be found that the vacuum PV glazing blocks most solar irradiation compared with the double-pane glazing. Figure 16 presents the temperature profile of the vacuum PV glazing and double-pane glazing in the sunny day. The internal surface temperature of both glazing was much higher than the ambient temperature when the outside incident solar radiation is strong. The internal glazing surface and air temperatures of the test rig with the vacuum PV glazing are lower than those of the test rig with the double-pane glazing. The difference between the internal air temperatures of test rigs is much smaller than that of internal glazing surface temperatures. Therefore, the application of vacuum PV glazing can achieve better indoor environment by reducing the solar heat gain.
3.3 Simulation study of the vacuum PV glazing(1) Simulation of a generic building model
Although a series of field tests have been conducted in the outdoor test bed to study the power and thermal performances of the vacuum BIPV glazing, the experimental scenarios are impossible to represent all the situations and variables. Thus, the numerical study was conducted to comprehensively investigate and compare the energy performance of the vacuum PV glazing and other commonly used energy-efficient glazing. As detailed in the research methodology, a comprehensive simulation model based on EnergyPlus and WINDOW has been developed to simulate the overall energy performance of different windows taking into account of their thermal and power output performance. This model is used to simulate the overall energy performance of the vacuum BIPV curtain wall in comparison with other commonly used windows. The key properties of different types of glazing are shown in Table 4 and the electrical specifications of the PV glazing under standard test conditions are referenced to Table 2.
In order to simulate the annual thermal performance and power performance of these types of glazing in Hong Kong for comparison purpose, a typical office room model has been created for simulation, as shown in Figure 17. The dimension of the office model was 2.5m × 2.3m × 2.5m (L × W × H). This room has only one external wall with three identical windows exposed to the outdoor environment. Simulations were conducted for different orientations, i.e. south (S), east (E), west (W) and north (N). A heat transfer model and PV performance model in EnergyPlus are adopted to investigate
the thermal and power performance of different glazing. The heat transfer model is used to calculate the cooling loads of the office room. The cooling loads are then converted to electricity use of air-conditioning system with a presumed coefficient of performance (COP) of 2.78. The equivalent one-diode model is selected to simulate the annual electricity generation from PV elements. The typical meteorological year (TMY) in Hong Kong is selected a reasonable representation of local climates.
The annual cooling electricity use of different types of glazing in different orientations in Hong Kong are shown in Figure 18. It can be observed that the room using vacuum PV glazing consumes the least cooling electricity for all orientations. The south facing room with vacuum PV glazing consumes about 705.56 kWh per year, which was approximately 14.2%, 9.8%, 8.4%, 7.1% and 4.1% less than the corresponding room with single-pane clear glazing, double-pane clear glazing, vacuum glazing, single-pane PV glazing and double-pane PV glazing, respectively. This is because the vacuum PV glazing have the lowest U-value and SHGC among all types of glazing, as shown in Table 4.3. A lower U-value indicates a higher level of heat insulation performance of the glazing, and a lower SHGC means less solar radiation will pass through the windows. Therefore, the vacuum PV glazing performs the best in the area with big temperature difference between indoor and outdoor environment. In addition, the most cooling electricity use of the office room occurs at the west orientation, followed by east, south and north. Therefore, east and west facing windows should have better solar heat insulation performance, to reduce heat gains from outside environment.
In addition to reduce the cooling load of the office room, the PV glazing can also generate electricity in situ. The annual electricity generation of the three types of PV glazing are shown in Figure 19. It can be seen that the annual electricity generation of the three types of PV glazing is similar to each other. The electricity generation from the vacuum PV glazing is a little less than the single-pane PV glazing due to increased solar cell temperature. However, since the temperature coefficient of the thin-film a-Si solar cells is small, the PV conversion efficiency is not reduced significantly. The annual electricity generation from a-Si PV glazing with 12.0% transmittance is around 113.81 kWh per year. Among all orientations, it is better to install PV glazing on the south facade in order to maximize the electricity output in Hong Kong. And it is not recommended to apply PV glazing on north façade due to limited solar radiation available.
Based on the results above, the vacuum PV glazing not only has the best thermal performance among all types of widely used glazing, but also produces a considerable amount of electricity per year. It is recommended to install vacuum PV glazing on south facade to perform the best overall energy performance.
(2) Simulation of the whole building
Apart from modelling studies conducted under the hot and humid climate of Hong Kong, the annual energy performance of different types of glazing in a cold region (i.e. Beijing) was also simulated for comparison. Simulation results are shown in Figure 20 and Figure 21. It can be observed that the room using the vacuum PV glazing achieves the lowest cooling consumption in both climates. In Beijing, the consumed cooling energy with the vacuum PV glazing is much smaller and is 30.2%, 20.8%, 17.0%, 13.8%, 4.4% less than that of the room with other types of glazing. It can be concluded that the energy saving potential of the vacuum PV glazing is much larger in a cold climate while the electricity generation is much higher during the summer time of Beijing due to the smaller solar incidence angle.
The developed simulation model was further applied to a 20-floor prototype office building. Typical floors of the building are divided into 5 conditioned zones, with a total floor area of 540 m2 (as shown in Figure 22). The reference case – Model 1 keeps all windows as the commonly used double-pane clear glazing, while the design cases include Model 2 and Model 3. Model 2 keeps the north-facing window as the conventional double-pane glazing while changes windows orientated to the other three directions to the developed vacuum PV glazing. The opaque part of all building facades is assumed to be covered with traditional crystalline BIPV with a power conversion efficiency of 15% to maximize the power generation potential of the building envelope. Model 3 shares similar settings with Model 2, except that the window transparency is tuned to 20% with a crystalline silicon (c-Si) as shown in Figure 23. Table 5 shows detailed settings of window properties for the three models respectively. The U-value and SHGC of a-Si vacuum PV glazing are obtained from previous experiments and those of double-pane clear glazing are calculated by the simulation software WINDOW. Thermal and power generation properties of c-Si vacuum PV glazing are obtained from existing literatures.
The simulation results of the total heat gain and loss through all windows are presented in Figure 24 and Figure 25. The heat gain and loss both decrease sharply when traditional double-pane clear glazing is replaced by the PV vacuum glazing. The obvious differences between these three models can be identified from the figures. Compared with the performance of Model 1, the heat gain through windows of Model 2 and Model 3 drops up to 77.89% and 77.97% (south-facing windows), while the heat loss of the two models declines up to 79.28% and 79.32% (south-facing windows), respectively.
On the other side, based on the peak office hour electricity price of 1.4 CNY/kWh for cooling and 0.25 CNY/kWh for heating from the Beijing authority, the simple payback period (See Figure 28) when applying the product to the west, east, and south façade is calculated to be 3.8, 4.6 and 5.3 years compared to the single-pane PV glazing. The payback periods are increased to 4.5, 5.4 and 6.5 years when compared with double-pane PV glazing as shown in Figure 29.
As a result, the product can be considered as a cost-effective application in building facades when considering its tremendous saving of air-conditioning energy and corresponding annual expenses. In addition, the property developer could also benefit from a potential increment in renting rates and popularity, if the building gets certified under a green building scheme by claiming credits in CO2 reduction and renewable application assessment criteria. All the abovementioned potential benefits with the application of the vacuum PV glazing would attract more attention from the construction industry.
3.4 Brief technical guideline for the vacuum PV glazingDesigning the vacuum PV glazing (i.e. vacuum BIPV curtain wall) system is a more complex process than a standard added-on PV system. The architectural context, structural requirements, economic considerations and building regulation requirements should all be considered, so that this brief guidance mainly focuses on the below aspects: design strategy, environmental variables, multifunctionality, installation situation, electrical components, and economic aspects (Polysolar Limited, 2015).
(1) Design strategy
Architects, property developers and building users become more inclined to consider renewable and energy efficient applications to meet building and planning regulations due to rising energy bills and awareness of environmental sustainability. The combination of PV and vacuum glazing is an innovative and promising solution to meet these requirements in the new building developments or refurbishment projects. As proved in the above sections of this report, the developed product offers the added advantage of providing a return of investment from the building envelope. Architectural and structural factors, as well as economic considerations should be taken into account at an early stage in any building projects to integrate renewable systems through a more satisfactory approach.
(2) Environmental variables
When designing a BIPV system, a compromise must be reached between the requirements of energy yield optimisation and those of the architectural environment. Therefore, the orientation, lighting performance, shading and temperature are the four mainly concerned issues in BIPV design. According to simulation and experimental results presented in the above sections, the optimal orientation of the installed PV glazing should be south for maximizing the annual power generation, while cooling load reduction is more conspicuous when the product is applied on the west and east facades. Therefore, it is preferable to install the product on all three facades for an optimal overall building energy-saving performance. The visible light transmittance is only 12% in the developed prototype, which might cause slightly more lighting power consumption compared to traditional double-pane clear glazing. However, the transmittance can be easily adjusted to higher than 20% in the manufacture process depending on the effective area of PV materials. There will always be a trade-off between power generation and permeable light, whereas this research has proved that the combined power generation and cooling load reduction can be more than the increased lighting energy use. Power generation performance of the a-Si PV is less sensitive to shadings, so that the prototype is subject to less influence from peripheral shadings. However, if we change the PV material to c-Si for higher conversion efficiency, a shading calculation should be conducted before allocating the BIPV glazing. Lastly, the conversion efficiency of a-Si glazing is also less sensitive to the increase of the panel temperature. The temperature coefficient must be considered if changing the PV material to c-Si.
The vacuum PV glazing was made by sandwiching a layer of PVB between an external PV laminated glass with a visible light transmittance of 12% and an internal vacuum glass. A low-e coating was also adopted to enhance its thermal performance. The structure of the vacuum PV glazing is shown in Figure 5. The dimension of the vacuum PV glazing is 1300 mm (width) × 1100 mm (height) × 20.87 mm (thickness), thinner than commonly used PV double glazed insulating glass units. Figure 6 presents the pictures of the sample of vacuum PV glazing.
This section presents the main findings and outcomes of the research project and indicates their potential impacts on the local energy use and construction industry. Achievements of the specified research objectives are illustrated, and limitations of the project are also mentioned for the reference of future studies.
3.1 Design and production of the prototype productInitially, we proposed a prototype design as specified by Figure 2, where the vacuum layer was directly coupled with the laminated PV panel. However, during initial manufacture trials, the air pressure difference between internal and external spaces of the vacuum glass samples produced by the laminating machine caused the breakage of the vacuum glass samples. Then, we followed an alternative approach using pre-pressure furnace, whereas the molten state of the polyvinyl butyral (PVB) could not meet the expected requirements and the bubbles greatly impacted the appearance and performance of PV module. Finally, we proposed the current product design based on the experience acquired from previous failures (See Figure 5).
The electrical specifications of the vacuum PV glazing under standard test conditions (STC: air mass 1.5, solar irradiation 1000 W/m2 and cell temperature 25°C) are shown in Table 2. Table 3 presents the given thermal and optical properties of the PV laminated glass and vacuum glass, respectively.
Figure 8 Comparison of outer and inner surface temperature of the vacuum PV glazing
08:00 09:00 10:00 11:00 12:00 13:00 14:00 15:00 16:00 17:00 18:00Time
Tem
pera
ture
(°C
)
20
30
40
50
60
70
80
90Ambient air temperatureOuter surface temperature of VPV IGUInter surface temperature of VPV IGU
(3) Multi-functionality
Due to their mechanical structures, the PV vacuum glazing can perform the functions of the building envelope in addition to generating emission-free energy, and can thus substitute for conventional construction windows or curtain walls. Apart from power generation and architectural function, the product can provide solar shading with its low SHGC value. It can also act as thermal and sound insulation due to its low U-value and acoustic resistance caused by the vacuum chamber between glazing layers. If applied with special coatings/films on top of PV glazing, it can also provide weather protection.
(4) Mounting system and installation
Based on specific requirements of each project in each region, safety, loading capacity and PV installation specifications can have a decisive impact on the method of fixing/mounting the vacuum. We have in this guide attempted to provide a range of options, highlighting what is possible in current design. The product can be installed with a linear mounting system as mullion-transom facades or structural sealant glazing. It can also be mounted with point-fixing systems including clamp fixings and undercut anchor fixings or mounted into standard curtain walling, rain screen cladding and window systems.
(5) Electrical system
In the curtain wall system, several PV glazing with standard size are usually connected together in a string to form the power generator. The generated direct current is usually fed to an inverter where the direct current is converted to alternating current. If on-site storage is not available, which is the common case in urban areas, the electrical power is registered via an electricity meter and connected to the public supply grid, which will require special permissions from the power grid companies (e.g. CLP in Hong Kong). Therefore, the application of the product will require a full set of electrical systems including cables and connections for parallel or series arrays, direct current load-break switches, inverters and generation meters.
(6) Economic considerations
The economic benefits of the product mainly lie in the following aspects: the substitute for original construction component, CO2 emission reduction and corresponding electricity fee waving, compliance with relevant building regulations (i.e. BEAM Plus in Hong Kong) and application of the feed-in-tariff policy (remuneration for electricity generation from PV).
temperature measurements were conducted through the centre of the vacuum PV sample to calculate the U-value. Secondly, the solar heat gains coefficient (SHGC) of the vacuum PV glazing sample was obtained and compared with three other advanced glazing types in an indoor solar irradiation test. Lastly, an outdoor test was conducted on the platform of Block Z in The Hong Kong Polytechnic University to evaluate the overall thermal performance of vacuum PV glazing. A conventional double clear pane glazing was used as a baseline in the outdoor test.
surfaces shows a similar trend in the three directions. Summing up electricity generation in all floors, the integrated PV modules in Model 2 and 3 can provide 285074.72 kWh/year and 355226.3 kWh/year, which accounts for 13.27% and 16.54% of the total building energy consumption of Model 1. Therefore, given the energy use reduction due to less external heat gain, using the vacuum BIPV glazing can save 27.74% (Model 3) electricity compared to a reference building.

13 Construction Industry Council
The comparison of building energy between Model 1, Model 2 and Model 3 is summarized in Table 6, which includes energy use of lighting, equipment, district cooling and district heating. Although Model 2 and Model 3 consume slightly more lighting energy due to the reduced visible transmittance of the PV glazing, the great energy saving in cooling and heating leads to the net reduction in the total building energy consumption. The total energy consumption of the Model 2 and 3 declines by 20.77 and 22.37 kWh/m2, accounting for 10.44% and 11.20% of Model 1 respectively. Generated electricity of windows and walls in three directions is also presented in Table 7. The south window produced the most electricity, 1527.13 kWh for Model 2 and 3203.76 kWh for Model 3 in a year, taking up nearly 47.80% the total electricity generated by windows. As for the west window, the electricity generated in a year is close to that of east window. Electricity generated by wall
3.2 Experimental study of the vacuum PV glazingOutdoor experimental test was first conducted on the developed prototype vacuum PV (VPV) glazing with the standard size (1.1m × 1.3m), whose various parameters including the ambient air temperature, incident solar irradiation, surface temperatures of the vacuum PV glazing as well as the I-V curves and the power generation were measured and recorded. The power generation and thermal performances of the prototype were also analysed during the test. To further justify the advantage of the vacuum PV glazing, experimental studies were carried out to compare the thermal performance of scaled-down samples (0.3m × 0.3m) with other advanced windows.
(1) Energy performance of the prototypeIn order to evaluate the energy performance of the vacuum PV glazing, an outdoor field measurement was conducted on the platform of Block Z in The Hong Kong Polytechnic University. The vacuum PV glazing was set up horizontally 0.4m above the floor on stilts so that the external temperatures of both sides of the vacuum PV glazing were approximately equal. Various parameters were measured during this test, including the ambient air temperature, the exterior and transmitted horizontal incident solar irradiation, the outer and inner surface temperatures of the vacuum PV glazing as well as the I-V curves and the power generation from the vacuum PV glazing. All the data was logged at an interval of 1 minute. Power generation and thermal performances of the vacuum PV glazing were analyzed based on the outdoor tests. Figure 7 shows the exterior and transmitted incident solar irradiation. It can be seen that the average solar irradiation transmittance during the period is approximately 0.08. Such low transmittance means that vast majority of solar irradiation is blocked by the vacuum PV glazing. Figure 8 presents the outer and inner surface temperature of the vacuum PV glazing. It can be seen that the outer surface temperature is much higher than the inner surface temperature at daytime. The maximum outer surface temperature is 75.3°C, 30°C higher than the inner surface temperature, which indicates that most of the waste heat is dissipated from the outside surface of the vacuum PV glazing, and the heat transfer to the inside space by convection is mitigated. Thus, compared with the conventional single-glazed PV glazing, the structure of the vacuum PV glazing can help reduce the cooling load and improve the indoor thermal comfort.
Then the vacuum PV glazing was mounted on the front side of an experimental test chamber as shown in Figure 9. Clear glass was also adopted in this study for comparison. Figure 10 presents the instantaneous power output of the vacuum PV glazing in 2 sunny days. It can be seen that the power generation from the vacuum PV glazing is consistent with incident solar radiation. A comparative study in terms of internal air temperature of the chamber between the vacuum PV glazing and the clear glass was conducted in a day of June.
As shown in Figure 11, the internal air temperature in the chamber with the vacuum PV glazing is much lower than that with a clear glass. The measured average and maximum internal air temperature for the vacuum PV glazing is 39.6°C and 40.3°C, respectively, while the corresponding average and maximum internal air temperature of the clear glass are 43.6°C and 44.7°C. The maximum internal air temperature difference between the vacuum PV glazing and the clear glass is 4.4°C, occurring in the morning. There are three temperature peaks of internal air temperature. Since the ambient temperature was relatively stable, the main heat gain of the internal air temperature was from incident solar irradiation. The internal air temperature for vacuum PV glazing is much more stable compared with that for the clear glass. The reason is that the vacuum PV glazing has better heat insulation performance so that the internal air temperature is not affected by the external environment significantly. It can also be seen in this figure that the internal air temperature of the chamber drops continuously at 15:00, which shows that the incident solar irradiation on the façade decreases so that the heat gains of the internal air from the sun also drops.
(2) Comparison with other advanced windows
To further justify the advantage of the vacuum PV glazing, experimental studies were carried out to compare it with other advanced windows. Samples of different types of glazing were mounted on the top of two hotboxes (i.e. test rigs) with the uniform dimension of 300 mm (L) × 300 mm (W) × 450mm (H) to implement both indoor and outdoor tests. Firstly, a co-heating test methodology was adopted for the thermal analysis of the vacuum PV glazing. The test rig was filled with the ice-water mixture to ensure the temperature difference between the inside and outside glazing surfaces larger than 5°C. Heat flux and
Figure 12 shows the internal and external temperatures of the vacuum PV glazing sample. The presented data were selected after the hotbox achieved the steady-state condition, when the temperature difference was around 8°C. Heat flux though the glazing sample and the U-value were then determined as illustrated in Figure 13. The average heat flux from the vacuum glazing was measured to be 15.4 W/m2. And the average U-value was calculated as 1.5 W/m2 × K which is much lower than a regular double pane window with the U-value of 2.5W/m2 × K. Considering the edge heat transfer which would strongly affect the heat flux measurement when the sample is small, it can be expected that the centre U-valve of the vacuum PV glazing should be lower than 1.5 W/m2 × K for a larger scale application (e.g. 1.1m × 1.3m).
(3) Cost effective analysis based on simulation
To address the economic benefits of the developed product, the simple payback period of the vacuum PV glazing is calculated with reference to available PV glazing on the market in both Hong Kong and Beijing’s scenarios.
Based on an average electricity price of 1.25 HKD/kWh from HK Electric, the simple payback period (See Figure 26) when applying the product to the west and east façade is calculated to be 7.5 and 8.0 years compared to the single-pane PV glazing. The payback periods are increased to 8.6 and 8.8 years when compared with double-pane PV glazing as shown in Figure 27. However, when applied to the south façade, the extra initial cost of the product cannot be recovered within 10 years.
The solar simulator in the laboratory can provide relatively steady horizontal incident solar irradiation, so that test rigs were located at the same spot to ensure each window sample exposed to the same radiation level. As shown in Figure 14, SHGCs of the vacuum PV glazing and double-pane PV glazing are much smaller than those of the vacuum glazing and double clear glazing, because the coupled PV module can absorb most of the solar irradiation. The vacuum PV glazing has the lowest SHGC of 0.10 which can act as the excellent thermal insulation.
The outdoor test lasted four days from September 26th to September 30th. As shown in Figure 15, September 26th, 27th and 30th were cloudy days and September 28th could be considered as a sunny day. It can be found that the vacuum PV glazing blocks most solar irradiation compared with the double-pane glazing. Figure 16 presents the temperature profile of the vacuum PV glazing and double-pane glazing in the sunny day. The internal surface temperature of both glazing was much higher than the ambient temperature when the outside incident solar radiation is strong. The internal glazing surface and air temperatures of the test rig with the vacuum PV glazing are lower than those of the test rig with the double-pane glazing. The difference between the internal air temperatures of test rigs is much smaller than that of internal glazing surface temperatures. Therefore, the application of vacuum PV glazing can achieve better indoor environment by reducing the solar heat gain.
3.3 Simulation study of the vacuum PV glazing(1) Simulation of a generic building model
Although a series of field tests have been conducted in the outdoor test bed to study the power and thermal performances of the vacuum BIPV glazing, the experimental scenarios are impossible to represent all the situations and variables. Thus, the numerical study was conducted to comprehensively investigate and compare the energy performance of the vacuum PV glazing and other commonly used energy-efficient glazing. As detailed in the research methodology, a comprehensive simulation model based on EnergyPlus and WINDOW has been developed to simulate the overall energy performance of different windows taking into account of their thermal and power output performance. This model is used to simulate the overall energy performance of the vacuum BIPV curtain wall in comparison with other commonly used windows. The key properties of different types of glazing are shown in Table 4 and the electrical specifications of the PV glazing under standard test conditions are referenced to Table 2.
In order to simulate the annual thermal performance and power performance of these types of glazing in Hong Kong for comparison purpose, a typical office room model has been created for simulation, as shown in Figure 17. The dimension of the office model was 2.5m × 2.3m × 2.5m (L × W × H). This room has only one external wall with three identical windows exposed to the outdoor environment. Simulations were conducted for different orientations, i.e. south (S), east (E), west (W) and north (N). A heat transfer model and PV performance model in EnergyPlus are adopted to investigate
the thermal and power performance of different glazing. The heat transfer model is used to calculate the cooling loads of the office room. The cooling loads are then converted to electricity use of air-conditioning system with a presumed coefficient of performance (COP) of 2.78. The equivalent one-diode model is selected to simulate the annual electricity generation from PV elements. The typical meteorological year (TMY) in Hong Kong is selected a reasonable representation of local climates.
The annual cooling electricity use of different types of glazing in different orientations in Hong Kong are shown in Figure 18. It can be observed that the room using vacuum PV glazing consumes the least cooling electricity for all orientations. The south facing room with vacuum PV glazing consumes about 705.56 kWh per year, which was approximately 14.2%, 9.8%, 8.4%, 7.1% and 4.1% less than the corresponding room with single-pane clear glazing, double-pane clear glazing, vacuum glazing, single-pane PV glazing and double-pane PV glazing, respectively. This is because the vacuum PV glazing have the lowest U-value and SHGC among all types of glazing, as shown in Table 4.3. A lower U-value indicates a higher level of heat insulation performance of the glazing, and a lower SHGC means less solar radiation will pass through the windows. Therefore, the vacuum PV glazing performs the best in the area with big temperature difference between indoor and outdoor environment. In addition, the most cooling electricity use of the office room occurs at the west orientation, followed by east, south and north. Therefore, east and west facing windows should have better solar heat insulation performance, to reduce heat gains from outside environment.
In addition to reduce the cooling load of the office room, the PV glazing can also generate electricity in situ. The annual electricity generation of the three types of PV glazing are shown in Figure 19. It can be seen that the annual electricity generation of the three types of PV glazing is similar to each other. The electricity generation from the vacuum PV glazing is a little less than the single-pane PV glazing due to increased solar cell temperature. However, since the temperature coefficient of the thin-film a-Si solar cells is small, the PV conversion efficiency is not reduced significantly. The annual electricity generation from a-Si PV glazing with 12.0% transmittance is around 113.81 kWh per year. Among all orientations, it is better to install PV glazing on the south facade in order to maximize the electricity output in Hong Kong. And it is not recommended to apply PV glazing on north façade due to limited solar radiation available.
Based on the results above, the vacuum PV glazing not only has the best thermal performance among all types of widely used glazing, but also produces a considerable amount of electricity per year. It is recommended to install vacuum PV glazing on south facade to perform the best overall energy performance.
(2) Simulation of the whole building
Apart from modelling studies conducted under the hot and humid climate of Hong Kong, the annual energy performance of different types of glazing in a cold region (i.e. Beijing) was also simulated for comparison. Simulation results are shown in Figure 20 and Figure 21. It can be observed that the room using the vacuum PV glazing achieves the lowest cooling consumption in both climates. In Beijing, the consumed cooling energy with the vacuum PV glazing is much smaller and is 30.2%, 20.8%, 17.0%, 13.8%, 4.4% less than that of the room with other types of glazing. It can be concluded that the energy saving potential of the vacuum PV glazing is much larger in a cold climate while the electricity generation is much higher during the summer time of Beijing due to the smaller solar incidence angle.
The developed simulation model was further applied to a 20-floor prototype office building. Typical floors of the building are divided into 5 conditioned zones, with a total floor area of 540 m2 (as shown in Figure 22). The reference case – Model 1 keeps all windows as the commonly used double-pane clear glazing, while the design cases include Model 2 and Model 3. Model 2 keeps the north-facing window as the conventional double-pane glazing while changes windows orientated to the other three directions to the developed vacuum PV glazing. The opaque part of all building facades is assumed to be covered with traditional crystalline BIPV with a power conversion efficiency of 15% to maximize the power generation potential of the building envelope. Model 3 shares similar settings with Model 2, except that the window transparency is tuned to 20% with a crystalline silicon (c-Si) as shown in Figure 23. Table 5 shows detailed settings of window properties for the three models respectively. The U-value and SHGC of a-Si vacuum PV glazing are obtained from previous experiments and those of double-pane clear glazing are calculated by the simulation software WINDOW. Thermal and power generation properties of c-Si vacuum PV glazing are obtained from existing literatures.
The simulation results of the total heat gain and loss through all windows are presented in Figure 24 and Figure 25. The heat gain and loss both decrease sharply when traditional double-pane clear glazing is replaced by the PV vacuum glazing. The obvious differences between these three models can be identified from the figures. Compared with the performance of Model 1, the heat gain through windows of Model 2 and Model 3 drops up to 77.89% and 77.97% (south-facing windows), while the heat loss of the two models declines up to 79.28% and 79.32% (south-facing windows), respectively.
On the other side, based on the peak office hour electricity price of 1.4 CNY/kWh for cooling and 0.25 CNY/kWh for heating from the Beijing authority, the simple payback period (See Figure 28) when applying the product to the west, east, and south façade is calculated to be 3.8, 4.6 and 5.3 years compared to the single-pane PV glazing. The payback periods are increased to 4.5, 5.4 and 6.5 years when compared with double-pane PV glazing as shown in Figure 29.
As a result, the product can be considered as a cost-effective application in building facades when considering its tremendous saving of air-conditioning energy and corresponding annual expenses. In addition, the property developer could also benefit from a potential increment in renting rates and popularity, if the building gets certified under a green building scheme by claiming credits in CO2 reduction and renewable application assessment criteria. All the abovementioned potential benefits with the application of the vacuum PV glazing would attract more attention from the construction industry.
3.4 Brief technical guideline for the vacuum PV glazingDesigning the vacuum PV glazing (i.e. vacuum BIPV curtain wall) system is a more complex process than a standard added-on PV system. The architectural context, structural requirements, economic considerations and building regulation requirements should all be considered, so that this brief guidance mainly focuses on the below aspects: design strategy, environmental variables, multifunctionality, installation situation, electrical components, and economic aspects (Polysolar Limited, 2015).
(1) Design strategy
Architects, property developers and building users become more inclined to consider renewable and energy efficient applications to meet building and planning regulations due to rising energy bills and awareness of environmental sustainability. The combination of PV and vacuum glazing is an innovative and promising solution to meet these requirements in the new building developments or refurbishment projects. As proved in the above sections of this report, the developed product offers the added advantage of providing a return of investment from the building envelope. Architectural and structural factors, as well as economic considerations should be taken into account at an early stage in any building projects to integrate renewable systems through a more satisfactory approach.
(2) Environmental variables
When designing a BIPV system, a compromise must be reached between the requirements of energy yield optimisation and those of the architectural environment. Therefore, the orientation, lighting performance, shading and temperature are the four mainly concerned issues in BIPV design. According to simulation and experimental results presented in the above sections, the optimal orientation of the installed PV glazing should be south for maximizing the annual power generation, while cooling load reduction is more conspicuous when the product is applied on the west and east facades. Therefore, it is preferable to install the product on all three facades for an optimal overall building energy-saving performance. The visible light transmittance is only 12% in the developed prototype, which might cause slightly more lighting power consumption compared to traditional double-pane clear glazing. However, the transmittance can be easily adjusted to higher than 20% in the manufacture process depending on the effective area of PV materials. There will always be a trade-off between power generation and permeable light, whereas this research has proved that the combined power generation and cooling load reduction can be more than the increased lighting energy use. Power generation performance of the a-Si PV is less sensitive to shadings, so that the prototype is subject to less influence from peripheral shadings. However, if we change the PV material to c-Si for higher conversion efficiency, a shading calculation should be conducted before allocating the BIPV glazing. Lastly, the conversion efficiency of a-Si glazing is also less sensitive to the increase of the panel temperature. The temperature coefficient must be considered if changing the PV material to c-Si.
The vacuum PV glazing was made by sandwiching a layer of PVB between an external PV laminated glass with a visible light transmittance of 12% and an internal vacuum glass. A low-e coating was also adopted to enhance its thermal performance. The structure of the vacuum PV glazing is shown in Figure 5. The dimension of the vacuum PV glazing is 1300 mm (width) × 1100 mm (height) × 20.87 mm (thickness), thinner than commonly used PV double glazed insulating glass units. Figure 6 presents the pictures of the sample of vacuum PV glazing.
This section presents the main findings and outcomes of the research project and indicates their potential impacts on the local energy use and construction industry. Achievements of the specified research objectives are illustrated, and limitations of the project are also mentioned for the reference of future studies.
3.1 Design and production of the prototype productInitially, we proposed a prototype design as specified by Figure 2, where the vacuum layer was directly coupled with the laminated PV panel. However, during initial manufacture trials, the air pressure difference between internal and external spaces of the vacuum glass samples produced by the laminating machine caused the breakage of the vacuum glass samples. Then, we followed an alternative approach using pre-pressure furnace, whereas the molten state of the polyvinyl butyral (PVB) could not meet the expected requirements and the bubbles greatly impacted the appearance and performance of PV module. Finally, we proposed the current product design based on the experience acquired from previous failures (See Figure 5).
The electrical specifications of the vacuum PV glazing under standard test conditions (STC: air mass 1.5, solar irradiation 1000 W/m2 and cell temperature 25°C) are shown in Table 2. Table 3 presents the given thermal and optical properties of the PV laminated glass and vacuum glass, respectively.
Figure 9 The test chamber mounted with the vacuum PV glazing on the front side
(3) Multi-functionality
Due to their mechanical structures, the PV vacuum glazing can perform the functions of the building envelope in addition to generating emission-free energy, and can thus substitute for conventional construction windows or curtain walls. Apart from power generation and architectural function, the product can provide solar shading with its low SHGC value. It can also act as thermal and sound insulation due to its low U-value and acoustic resistance caused by the vacuum chamber between glazing layers. If applied with special coatings/films on top of PV glazing, it can also provide weather protection.
(4) Mounting system and installation
Based on specific requirements of each project in each region, safety, loading capacity and PV installation specifications can have a decisive impact on the method of fixing/mounting the vacuum. We have in this guide attempted to provide a range of options, highlighting what is possible in current design. The product can be installed with a linear mounting system as mullion-transom facades or structural sealant glazing. It can also be mounted with point-fixing systems including clamp fixings and undercut anchor fixings or mounted into standard curtain walling, rain screen cladding and window systems.
(5) Electrical system
In the curtain wall system, several PV glazing with standard size are usually connected together in a string to form the power generator. The generated direct current is usually fed to an inverter where the direct current is converted to alternating current. If on-site storage is not available, which is the common case in urban areas, the electrical power is registered via an electricity meter and connected to the public supply grid, which will require special permissions from the power grid companies (e.g. CLP in Hong Kong). Therefore, the application of the product will require a full set of electrical systems including cables and connections for parallel or series arrays, direct current load-break switches, inverters and generation meters.
(6) Economic considerations
The economic benefits of the product mainly lie in the following aspects: the substitute for original construction component, CO2 emission reduction and corresponding electricity fee waving, compliance with relevant building regulations (i.e. BEAM Plus in Hong Kong) and application of the feed-in-tariff policy (remuneration for electricity generation from PV).
temperature measurements were conducted through the centre of the vacuum PV sample to calculate the U-value. Secondly, the solar heat gains coefficient (SHGC) of the vacuum PV glazing sample was obtained and compared with three other advanced glazing types in an indoor solar irradiation test. Lastly, an outdoor test was conducted on the platform of Block Z in The Hong Kong Polytechnic University to evaluate the overall thermal performance of vacuum PV glazing. A conventional double clear pane glazing was used as a baseline in the outdoor test.
surfaces shows a similar trend in the three directions. Summing up electricity generation in all floors, the integrated PV modules in Model 2 and 3 can provide 285074.72 kWh/year and 355226.3 kWh/year, which accounts for 13.27% and 16.54% of the total building energy consumption of Model 1. Therefore, given the energy use reduction due to less external heat gain, using the vacuum BIPV glazing can save 27.74% (Model 3) electricity compared to a reference building.

Investigation on the Thermal and Power Performance of Vacuum BIPV Curtain Wall Technology and its Application Potential in Buildings in Hong Kong
14
The comparison of building energy between Model 1, Model 2 and Model 3 is summarized in Table 6, which includes energy use of lighting, equipment, district cooling and district heating. Although Model 2 and Model 3 consume slightly more lighting energy due to the reduced visible transmittance of the PV glazing, the great energy saving in cooling and heating leads to the net reduction in the total building energy consumption. The total energy consumption of the Model 2 and 3 declines by 20.77 and 22.37 kWh/m2, accounting for 10.44% and 11.20% of Model 1 respectively. Generated electricity of windows and walls in three directions is also presented in Table 7. The south window produced the most electricity, 1527.13 kWh for Model 2 and 3203.76 kWh for Model 3 in a year, taking up nearly 47.80% the total electricity generated by windows. As for the west window, the electricity generated in a year is close to that of east window. Electricity generated by wall
3.2 Experimental study of the vacuum PV glazingOutdoor experimental test was first conducted on the developed prototype vacuum PV (VPV) glazing with the standard size (1.1m × 1.3m), whose various parameters including the ambient air temperature, incident solar irradiation, surface temperatures of the vacuum PV glazing as well as the I-V curves and the power generation were measured and recorded. The power generation and thermal performances of the prototype were also analysed during the test. To further justify the advantage of the vacuum PV glazing, experimental studies were carried out to compare the thermal performance of scaled-down samples (0.3m × 0.3m) with other advanced windows.
(1) Energy performance of the prototypeIn order to evaluate the energy performance of the vacuum PV glazing, an outdoor field measurement was conducted on the platform of Block Z in The Hong Kong Polytechnic University. The vacuum PV glazing was set up horizontally 0.4m above the floor on stilts so that the external temperatures of both sides of the vacuum PV glazing were approximately equal. Various parameters were measured during this test, including the ambient air temperature, the exterior and transmitted horizontal incident solar irradiation, the outer and inner surface temperatures of the vacuum PV glazing as well as the I-V curves and the power generation from the vacuum PV glazing. All the data was logged at an interval of 1 minute. Power generation and thermal performances of the vacuum PV glazing were analyzed based on the outdoor tests. Figure 7 shows the exterior and transmitted incident solar irradiation. It can be seen that the average solar irradiation transmittance during the period is approximately 0.08. Such low transmittance means that vast majority of solar irradiation is blocked by the vacuum PV glazing. Figure 8 presents the outer and inner surface temperature of the vacuum PV glazing. It can be seen that the outer surface temperature is much higher than the inner surface temperature at daytime. The maximum outer surface temperature is 75.3°C, 30°C higher than the inner surface temperature, which indicates that most of the waste heat is dissipated from the outside surface of the vacuum PV glazing, and the heat transfer to the inside space by convection is mitigated. Thus, compared with the conventional single-glazed PV glazing, the structure of the vacuum PV glazing can help reduce the cooling load and improve the indoor thermal comfort.
Then the vacuum PV glazing was mounted on the front side of an experimental test chamber as shown in Figure 9. Clear glass was also adopted in this study for comparison. Figure 10 presents the instantaneous power output of the vacuum PV glazing in 2 sunny days. It can be seen that the power generation from the vacuum PV glazing is consistent with incident solar radiation. A comparative study in terms of internal air temperature of the chamber between the vacuum PV glazing and the clear glass was conducted in a day of June.
As shown in Figure 11, the internal air temperature in the chamber with the vacuum PV glazing is much lower than that with a clear glass. The measured average and maximum internal air temperature for the vacuum PV glazing is 39.6°C and 40.3°C, respectively, while the corresponding average and maximum internal air temperature of the clear glass are 43.6°C and 44.7°C. The maximum internal air temperature difference between the vacuum PV glazing and the clear glass is 4.4°C, occurring in the morning. There are three temperature peaks of internal air temperature. Since the ambient temperature was relatively stable, the main heat gain of the internal air temperature was from incident solar irradiation. The internal air temperature for vacuum PV glazing is much more stable compared with that for the clear glass. The reason is that the vacuum PV glazing has better heat insulation performance so that the internal air temperature is not affected by the external environment significantly. It can also be seen in this figure that the internal air temperature of the chamber drops continuously at 15:00, which shows that the incident solar irradiation on the façade decreases so that the heat gains of the internal air from the sun also drops.
(2) Comparison with other advanced windows
To further justify the advantage of the vacuum PV glazing, experimental studies were carried out to compare it with other advanced windows. Samples of different types of glazing were mounted on the top of two hotboxes (i.e. test rigs) with the uniform dimension of 300 mm (L) × 300 mm (W) × 450mm (H) to implement both indoor and outdoor tests. Firstly, a co-heating test methodology was adopted for the thermal analysis of the vacuum PV glazing. The test rig was filled with the ice-water mixture to ensure the temperature difference between the inside and outside glazing surfaces larger than 5°C. Heat flux and
Figure 12 shows the internal and external temperatures of the vacuum PV glazing sample. The presented data were selected after the hotbox achieved the steady-state condition, when the temperature difference was around 8°C. Heat flux though the glazing sample and the U-value were then determined as illustrated in Figure 13. The average heat flux from the vacuum glazing was measured to be 15.4 W/m2. And the average U-value was calculated as 1.5 W/m2 × K which is much lower than a regular double pane window with the U-value of 2.5W/m2 × K. Considering the edge heat transfer which would strongly affect the heat flux measurement when the sample is small, it can be expected that the centre U-valve of the vacuum PV glazing should be lower than 1.5 W/m2 × K for a larger scale application (e.g. 1.1m × 1.3m).
(3) Cost effective analysis based on simulation
To address the economic benefits of the developed product, the simple payback period of the vacuum PV glazing is calculated with reference to available PV glazing on the market in both Hong Kong and Beijing’s scenarios.
Based on an average electricity price of 1.25 HKD/kWh from HK Electric, the simple payback period (See Figure 26) when applying the product to the west and east façade is calculated to be 7.5 and 8.0 years compared to the single-pane PV glazing. The payback periods are increased to 8.6 and 8.8 years when compared with double-pane PV glazing as shown in Figure 27. However, when applied to the south façade, the extra initial cost of the product cannot be recovered within 10 years.
The solar simulator in the laboratory can provide relatively steady horizontal incident solar irradiation, so that test rigs were located at the same spot to ensure each window sample exposed to the same radiation level. As shown in Figure 14, SHGCs of the vacuum PV glazing and double-pane PV glazing are much smaller than those of the vacuum glazing and double clear glazing, because the coupled PV module can absorb most of the solar irradiation. The vacuum PV glazing has the lowest SHGC of 0.10 which can act as the excellent thermal insulation.
The outdoor test lasted four days from September 26th to September 30th. As shown in Figure 15, September 26th, 27th and 30th were cloudy days and September 28th could be considered as a sunny day. It can be found that the vacuum PV glazing blocks most solar irradiation compared with the double-pane glazing. Figure 16 presents the temperature profile of the vacuum PV glazing and double-pane glazing in the sunny day. The internal surface temperature of both glazing was much higher than the ambient temperature when the outside incident solar radiation is strong. The internal glazing surface and air temperatures of the test rig with the vacuum PV glazing are lower than those of the test rig with the double-pane glazing. The difference between the internal air temperatures of test rigs is much smaller than that of internal glazing surface temperatures. Therefore, the application of vacuum PV glazing can achieve better indoor environment by reducing the solar heat gain.
3.3 Simulation study of the vacuum PV glazing(1) Simulation of a generic building model
Although a series of field tests have been conducted in the outdoor test bed to study the power and thermal performances of the vacuum BIPV glazing, the experimental scenarios are impossible to represent all the situations and variables. Thus, the numerical study was conducted to comprehensively investigate and compare the energy performance of the vacuum PV glazing and other commonly used energy-efficient glazing. As detailed in the research methodology, a comprehensive simulation model based on EnergyPlus and WINDOW has been developed to simulate the overall energy performance of different windows taking into account of their thermal and power output performance. This model is used to simulate the overall energy performance of the vacuum BIPV curtain wall in comparison with other commonly used windows. The key properties of different types of glazing are shown in Table 4 and the electrical specifications of the PV glazing under standard test conditions are referenced to Table 2.
In order to simulate the annual thermal performance and power performance of these types of glazing in Hong Kong for comparison purpose, a typical office room model has been created for simulation, as shown in Figure 17. The dimension of the office model was 2.5m × 2.3m × 2.5m (L × W × H). This room has only one external wall with three identical windows exposed to the outdoor environment. Simulations were conducted for different orientations, i.e. south (S), east (E), west (W) and north (N). A heat transfer model and PV performance model in EnergyPlus are adopted to investigate
the thermal and power performance of different glazing. The heat transfer model is used to calculate the cooling loads of the office room. The cooling loads are then converted to electricity use of air-conditioning system with a presumed coefficient of performance (COP) of 2.78. The equivalent one-diode model is selected to simulate the annual electricity generation from PV elements. The typical meteorological year (TMY) in Hong Kong is selected a reasonable representation of local climates.
The annual cooling electricity use of different types of glazing in different orientations in Hong Kong are shown in Figure 18. It can be observed that the room using vacuum PV glazing consumes the least cooling electricity for all orientations. The south facing room with vacuum PV glazing consumes about 705.56 kWh per year, which was approximately 14.2%, 9.8%, 8.4%, 7.1% and 4.1% less than the corresponding room with single-pane clear glazing, double-pane clear glazing, vacuum glazing, single-pane PV glazing and double-pane PV glazing, respectively. This is because the vacuum PV glazing have the lowest U-value and SHGC among all types of glazing, as shown in Table 4.3. A lower U-value indicates a higher level of heat insulation performance of the glazing, and a lower SHGC means less solar radiation will pass through the windows. Therefore, the vacuum PV glazing performs the best in the area with big temperature difference between indoor and outdoor environment. In addition, the most cooling electricity use of the office room occurs at the west orientation, followed by east, south and north. Therefore, east and west facing windows should have better solar heat insulation performance, to reduce heat gains from outside environment.
In addition to reduce the cooling load of the office room, the PV glazing can also generate electricity in situ. The annual electricity generation of the three types of PV glazing are shown in Figure 19. It can be seen that the annual electricity generation of the three types of PV glazing is similar to each other. The electricity generation from the vacuum PV glazing is a little less than the single-pane PV glazing due to increased solar cell temperature. However, since the temperature coefficient of the thin-film a-Si solar cells is small, the PV conversion efficiency is not reduced significantly. The annual electricity generation from a-Si PV glazing with 12.0% transmittance is around 113.81 kWh per year. Among all orientations, it is better to install PV glazing on the south facade in order to maximize the electricity output in Hong Kong. And it is not recommended to apply PV glazing on north façade due to limited solar radiation available.
Based on the results above, the vacuum PV glazing not only has the best thermal performance among all types of widely used glazing, but also produces a considerable amount of electricity per year. It is recommended to install vacuum PV glazing on south facade to perform the best overall energy performance.
(2) Simulation of the whole building
Apart from modelling studies conducted under the hot and humid climate of Hong Kong, the annual energy performance of different types of glazing in a cold region (i.e. Beijing) was also simulated for comparison. Simulation results are shown in Figure 20 and Figure 21. It can be observed that the room using the vacuum PV glazing achieves the lowest cooling consumption in both climates. In Beijing, the consumed cooling energy with the vacuum PV glazing is much smaller and is 30.2%, 20.8%, 17.0%, 13.8%, 4.4% less than that of the room with other types of glazing. It can be concluded that the energy saving potential of the vacuum PV glazing is much larger in a cold climate while the electricity generation is much higher during the summer time of Beijing due to the smaller solar incidence angle.
The developed simulation model was further applied to a 20-floor prototype office building. Typical floors of the building are divided into 5 conditioned zones, with a total floor area of 540 m2 (as shown in Figure 22). The reference case – Model 1 keeps all windows as the commonly used double-pane clear glazing, while the design cases include Model 2 and Model 3. Model 2 keeps the north-facing window as the conventional double-pane glazing while changes windows orientated to the other three directions to the developed vacuum PV glazing. The opaque part of all building facades is assumed to be covered with traditional crystalline BIPV with a power conversion efficiency of 15% to maximize the power generation potential of the building envelope. Model 3 shares similar settings with Model 2, except that the window transparency is tuned to 20% with a crystalline silicon (c-Si) as shown in Figure 23. Table 5 shows detailed settings of window properties for the three models respectively. The U-value and SHGC of a-Si vacuum PV glazing are obtained from previous experiments and those of double-pane clear glazing are calculated by the simulation software WINDOW. Thermal and power generation properties of c-Si vacuum PV glazing are obtained from existing literatures.
The simulation results of the total heat gain and loss through all windows are presented in Figure 24 and Figure 25. The heat gain and loss both decrease sharply when traditional double-pane clear glazing is replaced by the PV vacuum glazing. The obvious differences between these three models can be identified from the figures. Compared with the performance of Model 1, the heat gain through windows of Model 2 and Model 3 drops up to 77.89% and 77.97% (south-facing windows), while the heat loss of the two models declines up to 79.28% and 79.32% (south-facing windows), respectively.
On the other side, based on the peak office hour electricity price of 1.4 CNY/kWh for cooling and 0.25 CNY/kWh for heating from the Beijing authority, the simple payback period (See Figure 28) when applying the product to the west, east, and south façade is calculated to be 3.8, 4.6 and 5.3 years compared to the single-pane PV glazing. The payback periods are increased to 4.5, 5.4 and 6.5 years when compared with double-pane PV glazing as shown in Figure 29.
As a result, the product can be considered as a cost-effective application in building facades when considering its tremendous saving of air-conditioning energy and corresponding annual expenses. In addition, the property developer could also benefit from a potential increment in renting rates and popularity, if the building gets certified under a green building scheme by claiming credits in CO2 reduction and renewable application assessment criteria. All the abovementioned potential benefits with the application of the vacuum PV glazing would attract more attention from the construction industry.
3.4 Brief technical guideline for the vacuum PV glazingDesigning the vacuum PV glazing (i.e. vacuum BIPV curtain wall) system is a more complex process than a standard added-on PV system. The architectural context, structural requirements, economic considerations and building regulation requirements should all be considered, so that this brief guidance mainly focuses on the below aspects: design strategy, environmental variables, multifunctionality, installation situation, electrical components, and economic aspects (Polysolar Limited, 2015).
(1) Design strategy
Architects, property developers and building users become more inclined to consider renewable and energy efficient applications to meet building and planning regulations due to rising energy bills and awareness of environmental sustainability. The combination of PV and vacuum glazing is an innovative and promising solution to meet these requirements in the new building developments or refurbishment projects. As proved in the above sections of this report, the developed product offers the added advantage of providing a return of investment from the building envelope. Architectural and structural factors, as well as economic considerations should be taken into account at an early stage in any building projects to integrate renewable systems through a more satisfactory approach.
(2) Environmental variables
When designing a BIPV system, a compromise must be reached between the requirements of energy yield optimisation and those of the architectural environment. Therefore, the orientation, lighting performance, shading and temperature are the four mainly concerned issues in BIPV design. According to simulation and experimental results presented in the above sections, the optimal orientation of the installed PV glazing should be south for maximizing the annual power generation, while cooling load reduction is more conspicuous when the product is applied on the west and east facades. Therefore, it is preferable to install the product on all three facades for an optimal overall building energy-saving performance. The visible light transmittance is only 12% in the developed prototype, which might cause slightly more lighting power consumption compared to traditional double-pane clear glazing. However, the transmittance can be easily adjusted to higher than 20% in the manufacture process depending on the effective area of PV materials. There will always be a trade-off between power generation and permeable light, whereas this research has proved that the combined power generation and cooling load reduction can be more than the increased lighting energy use. Power generation performance of the a-Si PV is less sensitive to shadings, so that the prototype is subject to less influence from peripheral shadings. However, if we change the PV material to c-Si for higher conversion efficiency, a shading calculation should be conducted before allocating the BIPV glazing. Lastly, the conversion efficiency of a-Si glazing is also less sensitive to the increase of the panel temperature. The temperature coefficient must be considered if changing the PV material to c-Si.
The vacuum PV glazing was made by sandwiching a layer of PVB between an external PV laminated glass with a visible light transmittance of 12% and an internal vacuum glass. A low-e coating was also adopted to enhance its thermal performance. The structure of the vacuum PV glazing is shown in Figure 5. The dimension of the vacuum PV glazing is 1300 mm (width) × 1100 mm (height) × 20.87 mm (thickness), thinner than commonly used PV double glazed insulating glass units. Figure 6 presents the pictures of the sample of vacuum PV glazing.
This section presents the main findings and outcomes of the research project and indicates their potential impacts on the local energy use and construction industry. Achievements of the specified research objectives are illustrated, and limitations of the project are also mentioned for the reference of future studies.
3.1 Design and production of the prototype productInitially, we proposed a prototype design as specified by Figure 2, where the vacuum layer was directly coupled with the laminated PV panel. However, during initial manufacture trials, the air pressure difference between internal and external spaces of the vacuum glass samples produced by the laminating machine caused the breakage of the vacuum glass samples. Then, we followed an alternative approach using pre-pressure furnace, whereas the molten state of the polyvinyl butyral (PVB) could not meet the expected requirements and the bubbles greatly impacted the appearance and performance of PV module. Finally, we proposed the current product design based on the experience acquired from previous failures (See Figure 5).
The electrical specifications of the vacuum PV glazing under standard test conditions (STC: air mass 1.5, solar irradiation 1000 W/m2 and cell temperature 25°C) are shown in Table 2. Table 3 presents the given thermal and optical properties of the PV laminated glass and vacuum glass, respectively.
(a) Facing south
Pow
er o
utpu
t (W
)
Time
Inci
dent
sol
ar ra
diat
ion
(W/m
2 )
009:00 10:00 11:00 12:00 13:00 14:00 15:00
0
5
10
15
20
25
30
50
100
150
200
250
300
350
400
Incident solar radiationPower output from VPV IGU
(3) Multi-functionality
Due to their mechanical structures, the PV vacuum glazing can perform the functions of the building envelope in addition to generating emission-free energy, and can thus substitute for conventional construction windows or curtain walls. Apart from power generation and architectural function, the product can provide solar shading with its low SHGC value. It can also act as thermal and sound insulation due to its low U-value and acoustic resistance caused by the vacuum chamber between glazing layers. If applied with special coatings/films on top of PV glazing, it can also provide weather protection.
(4) Mounting system and installation
Based on specific requirements of each project in each region, safety, loading capacity and PV installation specifications can have a decisive impact on the method of fixing/mounting the vacuum. We have in this guide attempted to provide a range of options, highlighting what is possible in current design. The product can be installed with a linear mounting system as mullion-transom facades or structural sealant glazing. It can also be mounted with point-fixing systems including clamp fixings and undercut anchor fixings or mounted into standard curtain walling, rain screen cladding and window systems.
(5) Electrical system
In the curtain wall system, several PV glazing with standard size are usually connected together in a string to form the power generator. The generated direct current is usually fed to an inverter where the direct current is converted to alternating current. If on-site storage is not available, which is the common case in urban areas, the electrical power is registered via an electricity meter and connected to the public supply grid, which will require special permissions from the power grid companies (e.g. CLP in Hong Kong). Therefore, the application of the product will require a full set of electrical systems including cables and connections for parallel or series arrays, direct current load-break switches, inverters and generation meters.
(6) Economic considerations
The economic benefits of the product mainly lie in the following aspects: the substitute for original construction component, CO2 emission reduction and corresponding electricity fee waving, compliance with relevant building regulations (i.e. BEAM Plus in Hong Kong) and application of the feed-in-tariff policy (remuneration for electricity generation from PV).
Figure 10 Power output from the vacuum PV glazing for 2 sunny days(b) Facing southwest
Pow
er o
utpu
t (W
)
Time
Inci
dent
sol
ar ra
diat
ion
(W/m
2 )
009:00 10:00 11:00 12:00 13:00 14:00 15:00 16:00 17:00 18:00
0
5
10
15
20
25
30
100
200
300
400
500
600 Incident solar radiationPower output from VPV IGU
temperature measurements were conducted through the centre of the vacuum PV sample to calculate the U-value. Secondly, the solar heat gains coefficient (SHGC) of the vacuum PV glazing sample was obtained and compared with three other advanced glazing types in an indoor solar irradiation test. Lastly, an outdoor test was conducted on the platform of Block Z in The Hong Kong Polytechnic University to evaluate the overall thermal performance of vacuum PV glazing. A conventional double clear pane glazing was used as a baseline in the outdoor test.
surfaces shows a similar trend in the three directions. Summing up electricity generation in all floors, the integrated PV modules in Model 2 and 3 can provide 285074.72 kWh/year and 355226.3 kWh/year, which accounts for 13.27% and 16.54% of the total building energy consumption of Model 1. Therefore, given the energy use reduction due to less external heat gain, using the vacuum BIPV glazing can save 27.74% (Model 3) electricity compared to a reference building.

15 Construction Industry Council
Figure 11 Comparison of internal air temperature between the vacuum PV glazing and clear glass
Time
Inci
dent
sol
ar ir
radi
atio
n (W
/m2 )
010:0008:00 12:00 14:00 16:00 18:00
35
40
45
50
100
200
300
400
500
600
700
800
900
1000
Incident solar irradiation
Internal air temperature for VPV IGUInternal air temperature for clear glass
Tem
pera
ture
(°C
)
The comparison of building energy between Model 1, Model 2 and Model 3 is summarized in Table 6, which includes energy use of lighting, equipment, district cooling and district heating. Although Model 2 and Model 3 consume slightly more lighting energy due to the reduced visible transmittance of the PV glazing, the great energy saving in cooling and heating leads to the net reduction in the total building energy consumption. The total energy consumption of the Model 2 and 3 declines by 20.77 and 22.37 kWh/m2, accounting for 10.44% and 11.20% of Model 1 respectively. Generated electricity of windows and walls in three directions is also presented in Table 7. The south window produced the most electricity, 1527.13 kWh for Model 2 and 3203.76 kWh for Model 3 in a year, taking up nearly 47.80% the total electricity generated by windows. As for the west window, the electricity generated in a year is close to that of east window. Electricity generated by wall
3.2 Experimental study of the vacuum PV glazingOutdoor experimental test was first conducted on the developed prototype vacuum PV (VPV) glazing with the standard size (1.1m × 1.3m), whose various parameters including the ambient air temperature, incident solar irradiation, surface temperatures of the vacuum PV glazing as well as the I-V curves and the power generation were measured and recorded. The power generation and thermal performances of the prototype were also analysed during the test. To further justify the advantage of the vacuum PV glazing, experimental studies were carried out to compare the thermal performance of scaled-down samples (0.3m × 0.3m) with other advanced windows.
(1) Energy performance of the prototypeIn order to evaluate the energy performance of the vacuum PV glazing, an outdoor field measurement was conducted on the platform of Block Z in The Hong Kong Polytechnic University. The vacuum PV glazing was set up horizontally 0.4m above the floor on stilts so that the external temperatures of both sides of the vacuum PV glazing were approximately equal. Various parameters were measured during this test, including the ambient air temperature, the exterior and transmitted horizontal incident solar irradiation, the outer and inner surface temperatures of the vacuum PV glazing as well as the I-V curves and the power generation from the vacuum PV glazing. All the data was logged at an interval of 1 minute. Power generation and thermal performances of the vacuum PV glazing were analyzed based on the outdoor tests. Figure 7 shows the exterior and transmitted incident solar irradiation. It can be seen that the average solar irradiation transmittance during the period is approximately 0.08. Such low transmittance means that vast majority of solar irradiation is blocked by the vacuum PV glazing. Figure 8 presents the outer and inner surface temperature of the vacuum PV glazing. It can be seen that the outer surface temperature is much higher than the inner surface temperature at daytime. The maximum outer surface temperature is 75.3°C, 30°C higher than the inner surface temperature, which indicates that most of the waste heat is dissipated from the outside surface of the vacuum PV glazing, and the heat transfer to the inside space by convection is mitigated. Thus, compared with the conventional single-glazed PV glazing, the structure of the vacuum PV glazing can help reduce the cooling load and improve the indoor thermal comfort.
Then the vacuum PV glazing was mounted on the front side of an experimental test chamber as shown in Figure 9. Clear glass was also adopted in this study for comparison. Figure 10 presents the instantaneous power output of the vacuum PV glazing in 2 sunny days. It can be seen that the power generation from the vacuum PV glazing is consistent with incident solar radiation. A comparative study in terms of internal air temperature of the chamber between the vacuum PV glazing and the clear glass was conducted in a day of June.
As shown in Figure 11, the internal air temperature in the chamber with the vacuum PV glazing is much lower than that with a clear glass. The measured average and maximum internal air temperature for the vacuum PV glazing is 39.6°C and 40.3°C, respectively, while the corresponding average and maximum internal air temperature of the clear glass are 43.6°C and 44.7°C. The maximum internal air temperature difference between the vacuum PV glazing and the clear glass is 4.4°C, occurring in the morning. There are three temperature peaks of internal air temperature. Since the ambient temperature was relatively stable, the main heat gain of the internal air temperature was from incident solar irradiation. The internal air temperature for vacuum PV glazing is much more stable compared with that for the clear glass. The reason is that the vacuum PV glazing has better heat insulation performance so that the internal air temperature is not affected by the external environment significantly. It can also be seen in this figure that the internal air temperature of the chamber drops continuously at 15:00, which shows that the incident solar irradiation on the façade decreases so that the heat gains of the internal air from the sun also drops.
(2) Comparison with other advanced windows
To further justify the advantage of the vacuum PV glazing, experimental studies were carried out to compare it with other advanced windows. Samples of different types of glazing were mounted on the top of two hotboxes (i.e. test rigs) with the uniform dimension of 300 mm (L) × 300 mm (W) × 450mm (H) to implement both indoor and outdoor tests. Firstly, a co-heating test methodology was adopted for the thermal analysis of the vacuum PV glazing. The test rig was filled with the ice-water mixture to ensure the temperature difference between the inside and outside glazing surfaces larger than 5°C. Heat flux and
Figure 12 shows the internal and external temperatures of the vacuum PV glazing sample. The presented data were selected after the hotbox achieved the steady-state condition, when the temperature difference was around 8°C. Heat flux though the glazing sample and the U-value were then determined as illustrated in Figure 13. The average heat flux from the vacuum glazing was measured to be 15.4 W/m2. And the average U-value was calculated as 1.5 W/m2 × K which is much lower than a regular double pane window with the U-value of 2.5W/m2 × K. Considering the edge heat transfer which would strongly affect the heat flux measurement when the sample is small, it can be expected that the centre U-valve of the vacuum PV glazing should be lower than 1.5 W/m2 × K for a larger scale application (e.g. 1.1m × 1.3m).
(3) Cost effective analysis based on simulation
To address the economic benefits of the developed product, the simple payback period of the vacuum PV glazing is calculated with reference to available PV glazing on the market in both Hong Kong and Beijing’s scenarios.
Based on an average electricity price of 1.25 HKD/kWh from HK Electric, the simple payback period (See Figure 26) when applying the product to the west and east façade is calculated to be 7.5 and 8.0 years compared to the single-pane PV glazing. The payback periods are increased to 8.6 and 8.8 years when compared with double-pane PV glazing as shown in Figure 27. However, when applied to the south façade, the extra initial cost of the product cannot be recovered within 10 years.
The solar simulator in the laboratory can provide relatively steady horizontal incident solar irradiation, so that test rigs were located at the same spot to ensure each window sample exposed to the same radiation level. As shown in Figure 14, SHGCs of the vacuum PV glazing and double-pane PV glazing are much smaller than those of the vacuum glazing and double clear glazing, because the coupled PV module can absorb most of the solar irradiation. The vacuum PV glazing has the lowest SHGC of 0.10 which can act as the excellent thermal insulation.
The outdoor test lasted four days from September 26th to September 30th. As shown in Figure 15, September 26th, 27th and 30th were cloudy days and September 28th could be considered as a sunny day. It can be found that the vacuum PV glazing blocks most solar irradiation compared with the double-pane glazing. Figure 16 presents the temperature profile of the vacuum PV glazing and double-pane glazing in the sunny day. The internal surface temperature of both glazing was much higher than the ambient temperature when the outside incident solar radiation is strong. The internal glazing surface and air temperatures of the test rig with the vacuum PV glazing are lower than those of the test rig with the double-pane glazing. The difference between the internal air temperatures of test rigs is much smaller than that of internal glazing surface temperatures. Therefore, the application of vacuum PV glazing can achieve better indoor environment by reducing the solar heat gain.
3.3 Simulation study of the vacuum PV glazing(1) Simulation of a generic building model
Although a series of field tests have been conducted in the outdoor test bed to study the power and thermal performances of the vacuum BIPV glazing, the experimental scenarios are impossible to represent all the situations and variables. Thus, the numerical study was conducted to comprehensively investigate and compare the energy performance of the vacuum PV glazing and other commonly used energy-efficient glazing. As detailed in the research methodology, a comprehensive simulation model based on EnergyPlus and WINDOW has been developed to simulate the overall energy performance of different windows taking into account of their thermal and power output performance. This model is used to simulate the overall energy performance of the vacuum BIPV curtain wall in comparison with other commonly used windows. The key properties of different types of glazing are shown in Table 4 and the electrical specifications of the PV glazing under standard test conditions are referenced to Table 2.
In order to simulate the annual thermal performance and power performance of these types of glazing in Hong Kong for comparison purpose, a typical office room model has been created for simulation, as shown in Figure 17. The dimension of the office model was 2.5m × 2.3m × 2.5m (L × W × H). This room has only one external wall with three identical windows exposed to the outdoor environment. Simulations were conducted for different orientations, i.e. south (S), east (E), west (W) and north (N). A heat transfer model and PV performance model in EnergyPlus are adopted to investigate
the thermal and power performance of different glazing. The heat transfer model is used to calculate the cooling loads of the office room. The cooling loads are then converted to electricity use of air-conditioning system with a presumed coefficient of performance (COP) of 2.78. The equivalent one-diode model is selected to simulate the annual electricity generation from PV elements. The typical meteorological year (TMY) in Hong Kong is selected a reasonable representation of local climates.
The annual cooling electricity use of different types of glazing in different orientations in Hong Kong are shown in Figure 18. It can be observed that the room using vacuum PV glazing consumes the least cooling electricity for all orientations. The south facing room with vacuum PV glazing consumes about 705.56 kWh per year, which was approximately 14.2%, 9.8%, 8.4%, 7.1% and 4.1% less than the corresponding room with single-pane clear glazing, double-pane clear glazing, vacuum glazing, single-pane PV glazing and double-pane PV glazing, respectively. This is because the vacuum PV glazing have the lowest U-value and SHGC among all types of glazing, as shown in Table 4.3. A lower U-value indicates a higher level of heat insulation performance of the glazing, and a lower SHGC means less solar radiation will pass through the windows. Therefore, the vacuum PV glazing performs the best in the area with big temperature difference between indoor and outdoor environment. In addition, the most cooling electricity use of the office room occurs at the west orientation, followed by east, south and north. Therefore, east and west facing windows should have better solar heat insulation performance, to reduce heat gains from outside environment.
In addition to reduce the cooling load of the office room, the PV glazing can also generate electricity in situ. The annual electricity generation of the three types of PV glazing are shown in Figure 19. It can be seen that the annual electricity generation of the three types of PV glazing is similar to each other. The electricity generation from the vacuum PV glazing is a little less than the single-pane PV glazing due to increased solar cell temperature. However, since the temperature coefficient of the thin-film a-Si solar cells is small, the PV conversion efficiency is not reduced significantly. The annual electricity generation from a-Si PV glazing with 12.0% transmittance is around 113.81 kWh per year. Among all orientations, it is better to install PV glazing on the south facade in order to maximize the electricity output in Hong Kong. And it is not recommended to apply PV glazing on north façade due to limited solar radiation available.
Based on the results above, the vacuum PV glazing not only has the best thermal performance among all types of widely used glazing, but also produces a considerable amount of electricity per year. It is recommended to install vacuum PV glazing on south facade to perform the best overall energy performance.
(2) Simulation of the whole building
Apart from modelling studies conducted under the hot and humid climate of Hong Kong, the annual energy performance of different types of glazing in a cold region (i.e. Beijing) was also simulated for comparison. Simulation results are shown in Figure 20 and Figure 21. It can be observed that the room using the vacuum PV glazing achieves the lowest cooling consumption in both climates. In Beijing, the consumed cooling energy with the vacuum PV glazing is much smaller and is 30.2%, 20.8%, 17.0%, 13.8%, 4.4% less than that of the room with other types of glazing. It can be concluded that the energy saving potential of the vacuum PV glazing is much larger in a cold climate while the electricity generation is much higher during the summer time of Beijing due to the smaller solar incidence angle.
The developed simulation model was further applied to a 20-floor prototype office building. Typical floors of the building are divided into 5 conditioned zones, with a total floor area of 540 m2 (as shown in Figure 22). The reference case – Model 1 keeps all windows as the commonly used double-pane clear glazing, while the design cases include Model 2 and Model 3. Model 2 keeps the north-facing window as the conventional double-pane glazing while changes windows orientated to the other three directions to the developed vacuum PV glazing. The opaque part of all building facades is assumed to be covered with traditional crystalline BIPV with a power conversion efficiency of 15% to maximize the power generation potential of the building envelope. Model 3 shares similar settings with Model 2, except that the window transparency is tuned to 20% with a crystalline silicon (c-Si) as shown in Figure 23. Table 5 shows detailed settings of window properties for the three models respectively. The U-value and SHGC of a-Si vacuum PV glazing are obtained from previous experiments and those of double-pane clear glazing are calculated by the simulation software WINDOW. Thermal and power generation properties of c-Si vacuum PV glazing are obtained from existing literatures.
The simulation results of the total heat gain and loss through all windows are presented in Figure 24 and Figure 25. The heat gain and loss both decrease sharply when traditional double-pane clear glazing is replaced by the PV vacuum glazing. The obvious differences between these three models can be identified from the figures. Compared with the performance of Model 1, the heat gain through windows of Model 2 and Model 3 drops up to 77.89% and 77.97% (south-facing windows), while the heat loss of the two models declines up to 79.28% and 79.32% (south-facing windows), respectively.
On the other side, based on the peak office hour electricity price of 1.4 CNY/kWh for cooling and 0.25 CNY/kWh for heating from the Beijing authority, the simple payback period (See Figure 28) when applying the product to the west, east, and south façade is calculated to be 3.8, 4.6 and 5.3 years compared to the single-pane PV glazing. The payback periods are increased to 4.5, 5.4 and 6.5 years when compared with double-pane PV glazing as shown in Figure 29.
As a result, the product can be considered as a cost-effective application in building facades when considering its tremendous saving of air-conditioning energy and corresponding annual expenses. In addition, the property developer could also benefit from a potential increment in renting rates and popularity, if the building gets certified under a green building scheme by claiming credits in CO2 reduction and renewable application assessment criteria. All the abovementioned potential benefits with the application of the vacuum PV glazing would attract more attention from the construction industry.
3.4 Brief technical guideline for the vacuum PV glazingDesigning the vacuum PV glazing (i.e. vacuum BIPV curtain wall) system is a more complex process than a standard added-on PV system. The architectural context, structural requirements, economic considerations and building regulation requirements should all be considered, so that this brief guidance mainly focuses on the below aspects: design strategy, environmental variables, multifunctionality, installation situation, electrical components, and economic aspects (Polysolar Limited, 2015).
(1) Design strategy
Architects, property developers and building users become more inclined to consider renewable and energy efficient applications to meet building and planning regulations due to rising energy bills and awareness of environmental sustainability. The combination of PV and vacuum glazing is an innovative and promising solution to meet these requirements in the new building developments or refurbishment projects. As proved in the above sections of this report, the developed product offers the added advantage of providing a return of investment from the building envelope. Architectural and structural factors, as well as economic considerations should be taken into account at an early stage in any building projects to integrate renewable systems through a more satisfactory approach.
(2) Environmental variables
When designing a BIPV system, a compromise must be reached between the requirements of energy yield optimisation and those of the architectural environment. Therefore, the orientation, lighting performance, shading and temperature are the four mainly concerned issues in BIPV design. According to simulation and experimental results presented in the above sections, the optimal orientation of the installed PV glazing should be south for maximizing the annual power generation, while cooling load reduction is more conspicuous when the product is applied on the west and east facades. Therefore, it is preferable to install the product on all three facades for an optimal overall building energy-saving performance. The visible light transmittance is only 12% in the developed prototype, which might cause slightly more lighting power consumption compared to traditional double-pane clear glazing. However, the transmittance can be easily adjusted to higher than 20% in the manufacture process depending on the effective area of PV materials. There will always be a trade-off between power generation and permeable light, whereas this research has proved that the combined power generation and cooling load reduction can be more than the increased lighting energy use. Power generation performance of the a-Si PV is less sensitive to shadings, so that the prototype is subject to less influence from peripheral shadings. However, if we change the PV material to c-Si for higher conversion efficiency, a shading calculation should be conducted before allocating the BIPV glazing. Lastly, the conversion efficiency of a-Si glazing is also less sensitive to the increase of the panel temperature. The temperature coefficient must be considered if changing the PV material to c-Si.
The vacuum PV glazing was made by sandwiching a layer of PVB between an external PV laminated glass with a visible light transmittance of 12% and an internal vacuum glass. A low-e coating was also adopted to enhance its thermal performance. The structure of the vacuum PV glazing is shown in Figure 5. The dimension of the vacuum PV glazing is 1300 mm (width) × 1100 mm (height) × 20.87 mm (thickness), thinner than commonly used PV double glazed insulating glass units. Figure 6 presents the pictures of the sample of vacuum PV glazing.
This section presents the main findings and outcomes of the research project and indicates their potential impacts on the local energy use and construction industry. Achievements of the specified research objectives are illustrated, and limitations of the project are also mentioned for the reference of future studies.
3.1 Design and production of the prototype productInitially, we proposed a prototype design as specified by Figure 2, where the vacuum layer was directly coupled with the laminated PV panel. However, during initial manufacture trials, the air pressure difference between internal and external spaces of the vacuum glass samples produced by the laminating machine caused the breakage of the vacuum glass samples. Then, we followed an alternative approach using pre-pressure furnace, whereas the molten state of the polyvinyl butyral (PVB) could not meet the expected requirements and the bubbles greatly impacted the appearance and performance of PV module. Finally, we proposed the current product design based on the experience acquired from previous failures (See Figure 5).
The electrical specifications of the vacuum PV glazing under standard test conditions (STC: air mass 1.5, solar irradiation 1000 W/m2 and cell temperature 25°C) are shown in Table 2. Table 3 presents the given thermal and optical properties of the PV laminated glass and vacuum glass, respectively.
(3) Multi-functionality
Due to their mechanical structures, the PV vacuum glazing can perform the functions of the building envelope in addition to generating emission-free energy, and can thus substitute for conventional construction windows or curtain walls. Apart from power generation and architectural function, the product can provide solar shading with its low SHGC value. It can also act as thermal and sound insulation due to its low U-value and acoustic resistance caused by the vacuum chamber between glazing layers. If applied with special coatings/films on top of PV glazing, it can also provide weather protection.
(4) Mounting system and installation
Based on specific requirements of each project in each region, safety, loading capacity and PV installation specifications can have a decisive impact on the method of fixing/mounting the vacuum. We have in this guide attempted to provide a range of options, highlighting what is possible in current design. The product can be installed with a linear mounting system as mullion-transom facades or structural sealant glazing. It can also be mounted with point-fixing systems including clamp fixings and undercut anchor fixings or mounted into standard curtain walling, rain screen cladding and window systems.
(5) Electrical system
In the curtain wall system, several PV glazing with standard size are usually connected together in a string to form the power generator. The generated direct current is usually fed to an inverter where the direct current is converted to alternating current. If on-site storage is not available, which is the common case in urban areas, the electrical power is registered via an electricity meter and connected to the public supply grid, which will require special permissions from the power grid companies (e.g. CLP in Hong Kong). Therefore, the application of the product will require a full set of electrical systems including cables and connections for parallel or series arrays, direct current load-break switches, inverters and generation meters.
(6) Economic considerations
The economic benefits of the product mainly lie in the following aspects: the substitute for original construction component, CO2 emission reduction and corresponding electricity fee waving, compliance with relevant building regulations (i.e. BEAM Plus in Hong Kong) and application of the feed-in-tariff policy (remuneration for electricity generation from PV).
temperature measurements were conducted through the centre of the vacuum PV sample to calculate the U-value. Secondly, the solar heat gains coefficient (SHGC) of the vacuum PV glazing sample was obtained and compared with three other advanced glazing types in an indoor solar irradiation test. Lastly, an outdoor test was conducted on the platform of Block Z in The Hong Kong Polytechnic University to evaluate the overall thermal performance of vacuum PV glazing. A conventional double clear pane glazing was used as a baseline in the outdoor test.
surfaces shows a similar trend in the three directions. Summing up electricity generation in all floors, the integrated PV modules in Model 2 and 3 can provide 285074.72 kWh/year and 355226.3 kWh/year, which accounts for 13.27% and 16.54% of the total building energy consumption of Model 1. Therefore, given the energy use reduction due to less external heat gain, using the vacuum BIPV glazing can save 27.74% (Model 3) electricity compared to a reference building.

Investigation on the Thermal and Power Performance of Vacuum BIPV Curtain Wall Technology and its Application Potential in Buildings in Hong Kong
16
The comparison of building energy between Model 1, Model 2 and Model 3 is summarized in Table 6, which includes energy use of lighting, equipment, district cooling and district heating. Although Model 2 and Model 3 consume slightly more lighting energy due to the reduced visible transmittance of the PV glazing, the great energy saving in cooling and heating leads to the net reduction in the total building energy consumption. The total energy consumption of the Model 2 and 3 declines by 20.77 and 22.37 kWh/m2, accounting for 10.44% and 11.20% of Model 1 respectively. Generated electricity of windows and walls in three directions is also presented in Table 7. The south window produced the most electricity, 1527.13 kWh for Model 2 and 3203.76 kWh for Model 3 in a year, taking up nearly 47.80% the total electricity generated by windows. As for the west window, the electricity generated in a year is close to that of east window. Electricity generated by wall
3.2 Experimental study of the vacuum PV glazingOutdoor experimental test was first conducted on the developed prototype vacuum PV (VPV) glazing with the standard size (1.1m × 1.3m), whose various parameters including the ambient air temperature, incident solar irradiation, surface temperatures of the vacuum PV glazing as well as the I-V curves and the power generation were measured and recorded. The power generation and thermal performances of the prototype were also analysed during the test. To further justify the advantage of the vacuum PV glazing, experimental studies were carried out to compare the thermal performance of scaled-down samples (0.3m × 0.3m) with other advanced windows.
(1) Energy performance of the prototypeIn order to evaluate the energy performance of the vacuum PV glazing, an outdoor field measurement was conducted on the platform of Block Z in The Hong Kong Polytechnic University. The vacuum PV glazing was set up horizontally 0.4m above the floor on stilts so that the external temperatures of both sides of the vacuum PV glazing were approximately equal. Various parameters were measured during this test, including the ambient air temperature, the exterior and transmitted horizontal incident solar irradiation, the outer and inner surface temperatures of the vacuum PV glazing as well as the I-V curves and the power generation from the vacuum PV glazing. All the data was logged at an interval of 1 minute. Power generation and thermal performances of the vacuum PV glazing were analyzed based on the outdoor tests. Figure 7 shows the exterior and transmitted incident solar irradiation. It can be seen that the average solar irradiation transmittance during the period is approximately 0.08. Such low transmittance means that vast majority of solar irradiation is blocked by the vacuum PV glazing. Figure 8 presents the outer and inner surface temperature of the vacuum PV glazing. It can be seen that the outer surface temperature is much higher than the inner surface temperature at daytime. The maximum outer surface temperature is 75.3°C, 30°C higher than the inner surface temperature, which indicates that most of the waste heat is dissipated from the outside surface of the vacuum PV glazing, and the heat transfer to the inside space by convection is mitigated. Thus, compared with the conventional single-glazed PV glazing, the structure of the vacuum PV glazing can help reduce the cooling load and improve the indoor thermal comfort.
Then the vacuum PV glazing was mounted on the front side of an experimental test chamber as shown in Figure 9. Clear glass was also adopted in this study for comparison. Figure 10 presents the instantaneous power output of the vacuum PV glazing in 2 sunny days. It can be seen that the power generation from the vacuum PV glazing is consistent with incident solar radiation. A comparative study in terms of internal air temperature of the chamber between the vacuum PV glazing and the clear glass was conducted in a day of June.
As shown in Figure 11, the internal air temperature in the chamber with the vacuum PV glazing is much lower than that with a clear glass. The measured average and maximum internal air temperature for the vacuum PV glazing is 39.6°C and 40.3°C, respectively, while the corresponding average and maximum internal air temperature of the clear glass are 43.6°C and 44.7°C. The maximum internal air temperature difference between the vacuum PV glazing and the clear glass is 4.4°C, occurring in the morning. There are three temperature peaks of internal air temperature. Since the ambient temperature was relatively stable, the main heat gain of the internal air temperature was from incident solar irradiation. The internal air temperature for vacuum PV glazing is much more stable compared with that for the clear glass. The reason is that the vacuum PV glazing has better heat insulation performance so that the internal air temperature is not affected by the external environment significantly. It can also be seen in this figure that the internal air temperature of the chamber drops continuously at 15:00, which shows that the incident solar irradiation on the façade decreases so that the heat gains of the internal air from the sun also drops.
(2) Comparison with other advanced windows
To further justify the advantage of the vacuum PV glazing, experimental studies were carried out to compare it with other advanced windows. Samples of different types of glazing were mounted on the top of two hotboxes (i.e. test rigs) with the uniform dimension of 300 mm (L) × 300 mm (W) × 450mm (H) to implement both indoor and outdoor tests. Firstly, a co-heating test methodology was adopted for the thermal analysis of the vacuum PV glazing. The test rig was filled with the ice-water mixture to ensure the temperature difference between the inside and outside glazing surfaces larger than 5°C. Heat flux and
Figure 12 shows the internal and external temperatures of the vacuum PV glazing sample. The presented data were selected after the hotbox achieved the steady-state condition, when the temperature difference was around 8°C. Heat flux though the glazing sample and the U-value were then determined as illustrated in Figure 13. The average heat flux from the vacuum glazing was measured to be 15.4 W/m2. And the average U-value was calculated as 1.5 W/m2 × K which is much lower than a regular double pane window with the U-value of 2.5W/m2 × K. Considering the edge heat transfer which would strongly affect the heat flux measurement when the sample is small, it can be expected that the centre U-valve of the vacuum PV glazing should be lower than 1.5 W/m2 × K for a larger scale application (e.g. 1.1m × 1.3m).
(3) Cost effective analysis based on simulation
To address the economic benefits of the developed product, the simple payback period of the vacuum PV glazing is calculated with reference to available PV glazing on the market in both Hong Kong and Beijing’s scenarios.
Based on an average electricity price of 1.25 HKD/kWh from HK Electric, the simple payback period (See Figure 26) when applying the product to the west and east façade is calculated to be 7.5 and 8.0 years compared to the single-pane PV glazing. The payback periods are increased to 8.6 and 8.8 years when compared with double-pane PV glazing as shown in Figure 27. However, when applied to the south façade, the extra initial cost of the product cannot be recovered within 10 years.
The solar simulator in the laboratory can provide relatively steady horizontal incident solar irradiation, so that test rigs were located at the same spot to ensure each window sample exposed to the same radiation level. As shown in Figure 14, SHGCs of the vacuum PV glazing and double-pane PV glazing are much smaller than those of the vacuum glazing and double clear glazing, because the coupled PV module can absorb most of the solar irradiation. The vacuum PV glazing has the lowest SHGC of 0.10 which can act as the excellent thermal insulation.
The outdoor test lasted four days from September 26th to September 30th. As shown in Figure 15, September 26th, 27th and 30th were cloudy days and September 28th could be considered as a sunny day. It can be found that the vacuum PV glazing blocks most solar irradiation compared with the double-pane glazing. Figure 16 presents the temperature profile of the vacuum PV glazing and double-pane glazing in the sunny day. The internal surface temperature of both glazing was much higher than the ambient temperature when the outside incident solar radiation is strong. The internal glazing surface and air temperatures of the test rig with the vacuum PV glazing are lower than those of the test rig with the double-pane glazing. The difference between the internal air temperatures of test rigs is much smaller than that of internal glazing surface temperatures. Therefore, the application of vacuum PV glazing can achieve better indoor environment by reducing the solar heat gain.
3.3 Simulation study of the vacuum PV glazing(1) Simulation of a generic building model
Although a series of field tests have been conducted in the outdoor test bed to study the power and thermal performances of the vacuum BIPV glazing, the experimental scenarios are impossible to represent all the situations and variables. Thus, the numerical study was conducted to comprehensively investigate and compare the energy performance of the vacuum PV glazing and other commonly used energy-efficient glazing. As detailed in the research methodology, a comprehensive simulation model based on EnergyPlus and WINDOW has been developed to simulate the overall energy performance of different windows taking into account of their thermal and power output performance. This model is used to simulate the overall energy performance of the vacuum BIPV curtain wall in comparison with other commonly used windows. The key properties of different types of glazing are shown in Table 4 and the electrical specifications of the PV glazing under standard test conditions are referenced to Table 2.
In order to simulate the annual thermal performance and power performance of these types of glazing in Hong Kong for comparison purpose, a typical office room model has been created for simulation, as shown in Figure 17. The dimension of the office model was 2.5m × 2.3m × 2.5m (L × W × H). This room has only one external wall with three identical windows exposed to the outdoor environment. Simulations were conducted for different orientations, i.e. south (S), east (E), west (W) and north (N). A heat transfer model and PV performance model in EnergyPlus are adopted to investigate
the thermal and power performance of different glazing. The heat transfer model is used to calculate the cooling loads of the office room. The cooling loads are then converted to electricity use of air-conditioning system with a presumed coefficient of performance (COP) of 2.78. The equivalent one-diode model is selected to simulate the annual electricity generation from PV elements. The typical meteorological year (TMY) in Hong Kong is selected a reasonable representation of local climates.
The annual cooling electricity use of different types of glazing in different orientations in Hong Kong are shown in Figure 18. It can be observed that the room using vacuum PV glazing consumes the least cooling electricity for all orientations. The south facing room with vacuum PV glazing consumes about 705.56 kWh per year, which was approximately 14.2%, 9.8%, 8.4%, 7.1% and 4.1% less than the corresponding room with single-pane clear glazing, double-pane clear glazing, vacuum glazing, single-pane PV glazing and double-pane PV glazing, respectively. This is because the vacuum PV glazing have the lowest U-value and SHGC among all types of glazing, as shown in Table 4.3. A lower U-value indicates a higher level of heat insulation performance of the glazing, and a lower SHGC means less solar radiation will pass through the windows. Therefore, the vacuum PV glazing performs the best in the area with big temperature difference between indoor and outdoor environment. In addition, the most cooling electricity use of the office room occurs at the west orientation, followed by east, south and north. Therefore, east and west facing windows should have better solar heat insulation performance, to reduce heat gains from outside environment.
In addition to reduce the cooling load of the office room, the PV glazing can also generate electricity in situ. The annual electricity generation of the three types of PV glazing are shown in Figure 19. It can be seen that the annual electricity generation of the three types of PV glazing is similar to each other. The electricity generation from the vacuum PV glazing is a little less than the single-pane PV glazing due to increased solar cell temperature. However, since the temperature coefficient of the thin-film a-Si solar cells is small, the PV conversion efficiency is not reduced significantly. The annual electricity generation from a-Si PV glazing with 12.0% transmittance is around 113.81 kWh per year. Among all orientations, it is better to install PV glazing on the south facade in order to maximize the electricity output in Hong Kong. And it is not recommended to apply PV glazing on north façade due to limited solar radiation available.
Based on the results above, the vacuum PV glazing not only has the best thermal performance among all types of widely used glazing, but also produces a considerable amount of electricity per year. It is recommended to install vacuum PV glazing on south facade to perform the best overall energy performance.
(2) Simulation of the whole building
Apart from modelling studies conducted under the hot and humid climate of Hong Kong, the annual energy performance of different types of glazing in a cold region (i.e. Beijing) was also simulated for comparison. Simulation results are shown in Figure 20 and Figure 21. It can be observed that the room using the vacuum PV glazing achieves the lowest cooling consumption in both climates. In Beijing, the consumed cooling energy with the vacuum PV glazing is much smaller and is 30.2%, 20.8%, 17.0%, 13.8%, 4.4% less than that of the room with other types of glazing. It can be concluded that the energy saving potential of the vacuum PV glazing is much larger in a cold climate while the electricity generation is much higher during the summer time of Beijing due to the smaller solar incidence angle.
The developed simulation model was further applied to a 20-floor prototype office building. Typical floors of the building are divided into 5 conditioned zones, with a total floor area of 540 m2 (as shown in Figure 22). The reference case – Model 1 keeps all windows as the commonly used double-pane clear glazing, while the design cases include Model 2 and Model 3. Model 2 keeps the north-facing window as the conventional double-pane glazing while changes windows orientated to the other three directions to the developed vacuum PV glazing. The opaque part of all building facades is assumed to be covered with traditional crystalline BIPV with a power conversion efficiency of 15% to maximize the power generation potential of the building envelope. Model 3 shares similar settings with Model 2, except that the window transparency is tuned to 20% with a crystalline silicon (c-Si) as shown in Figure 23. Table 5 shows detailed settings of window properties for the three models respectively. The U-value and SHGC of a-Si vacuum PV glazing are obtained from previous experiments and those of double-pane clear glazing are calculated by the simulation software WINDOW. Thermal and power generation properties of c-Si vacuum PV glazing are obtained from existing literatures.
The simulation results of the total heat gain and loss through all windows are presented in Figure 24 and Figure 25. The heat gain and loss both decrease sharply when traditional double-pane clear glazing is replaced by the PV vacuum glazing. The obvious differences between these three models can be identified from the figures. Compared with the performance of Model 1, the heat gain through windows of Model 2 and Model 3 drops up to 77.89% and 77.97% (south-facing windows), while the heat loss of the two models declines up to 79.28% and 79.32% (south-facing windows), respectively.
On the other side, based on the peak office hour electricity price of 1.4 CNY/kWh for cooling and 0.25 CNY/kWh for heating from the Beijing authority, the simple payback period (See Figure 28) when applying the product to the west, east, and south façade is calculated to be 3.8, 4.6 and 5.3 years compared to the single-pane PV glazing. The payback periods are increased to 4.5, 5.4 and 6.5 years when compared with double-pane PV glazing as shown in Figure 29.
As a result, the product can be considered as a cost-effective application in building facades when considering its tremendous saving of air-conditioning energy and corresponding annual expenses. In addition, the property developer could also benefit from a potential increment in renting rates and popularity, if the building gets certified under a green building scheme by claiming credits in CO2 reduction and renewable application assessment criteria. All the abovementioned potential benefits with the application of the vacuum PV glazing would attract more attention from the construction industry.
3.4 Brief technical guideline for the vacuum PV glazingDesigning the vacuum PV glazing (i.e. vacuum BIPV curtain wall) system is a more complex process than a standard added-on PV system. The architectural context, structural requirements, economic considerations and building regulation requirements should all be considered, so that this brief guidance mainly focuses on the below aspects: design strategy, environmental variables, multifunctionality, installation situation, electrical components, and economic aspects (Polysolar Limited, 2015).
(1) Design strategy
Architects, property developers and building users become more inclined to consider renewable and energy efficient applications to meet building and planning regulations due to rising energy bills and awareness of environmental sustainability. The combination of PV and vacuum glazing is an innovative and promising solution to meet these requirements in the new building developments or refurbishment projects. As proved in the above sections of this report, the developed product offers the added advantage of providing a return of investment from the building envelope. Architectural and structural factors, as well as economic considerations should be taken into account at an early stage in any building projects to integrate renewable systems through a more satisfactory approach.
(2) Environmental variables
When designing a BIPV system, a compromise must be reached between the requirements of energy yield optimisation and those of the architectural environment. Therefore, the orientation, lighting performance, shading and temperature are the four mainly concerned issues in BIPV design. According to simulation and experimental results presented in the above sections, the optimal orientation of the installed PV glazing should be south for maximizing the annual power generation, while cooling load reduction is more conspicuous when the product is applied on the west and east facades. Therefore, it is preferable to install the product on all three facades for an optimal overall building energy-saving performance. The visible light transmittance is only 12% in the developed prototype, which might cause slightly more lighting power consumption compared to traditional double-pane clear glazing. However, the transmittance can be easily adjusted to higher than 20% in the manufacture process depending on the effective area of PV materials. There will always be a trade-off between power generation and permeable light, whereas this research has proved that the combined power generation and cooling load reduction can be more than the increased lighting energy use. Power generation performance of the a-Si PV is less sensitive to shadings, so that the prototype is subject to less influence from peripheral shadings. However, if we change the PV material to c-Si for higher conversion efficiency, a shading calculation should be conducted before allocating the BIPV glazing. Lastly, the conversion efficiency of a-Si glazing is also less sensitive to the increase of the panel temperature. The temperature coefficient must be considered if changing the PV material to c-Si.
The vacuum PV glazing was made by sandwiching a layer of PVB between an external PV laminated glass with a visible light transmittance of 12% and an internal vacuum glass. A low-e coating was also adopted to enhance its thermal performance. The structure of the vacuum PV glazing is shown in Figure 5. The dimension of the vacuum PV glazing is 1300 mm (width) × 1100 mm (height) × 20.87 mm (thickness), thinner than commonly used PV double glazed insulating glass units. Figure 6 presents the pictures of the sample of vacuum PV glazing.
This section presents the main findings and outcomes of the research project and indicates their potential impacts on the local energy use and construction industry. Achievements of the specified research objectives are illustrated, and limitations of the project are also mentioned for the reference of future studies.
3.1 Design and production of the prototype productInitially, we proposed a prototype design as specified by Figure 2, where the vacuum layer was directly coupled with the laminated PV panel. However, during initial manufacture trials, the air pressure difference between internal and external spaces of the vacuum glass samples produced by the laminating machine caused the breakage of the vacuum glass samples. Then, we followed an alternative approach using pre-pressure furnace, whereas the molten state of the polyvinyl butyral (PVB) could not meet the expected requirements and the bubbles greatly impacted the appearance and performance of PV module. Finally, we proposed the current product design based on the experience acquired from previous failures (See Figure 5).
The electrical specifications of the vacuum PV glazing under standard test conditions (STC: air mass 1.5, solar irradiation 1000 W/m2 and cell temperature 25°C) are shown in Table 2. Table 3 presents the given thermal and optical properties of the PV laminated glass and vacuum glass, respectively.
Tem
pera
ture
(°C
)
Time( min )05
10
15
20
25
30
100 200 300
Figure 12 Internal and external glazing temperature of vacuum PV glazing
External glazing Temperature
Internal glazing Temperature
(3) Multi-functionality
Due to their mechanical structures, the PV vacuum glazing can perform the functions of the building envelope in addition to generating emission-free energy, and can thus substitute for conventional construction windows or curtain walls. Apart from power generation and architectural function, the product can provide solar shading with its low SHGC value. It can also act as thermal and sound insulation due to its low U-value and acoustic resistance caused by the vacuum chamber between glazing layers. If applied with special coatings/films on top of PV glazing, it can also provide weather protection.
(4) Mounting system and installation
Based on specific requirements of each project in each region, safety, loading capacity and PV installation specifications can have a decisive impact on the method of fixing/mounting the vacuum. We have in this guide attempted to provide a range of options, highlighting what is possible in current design. The product can be installed with a linear mounting system as mullion-transom facades or structural sealant glazing. It can also be mounted with point-fixing systems including clamp fixings and undercut anchor fixings or mounted into standard curtain walling, rain screen cladding and window systems.
(5) Electrical system
In the curtain wall system, several PV glazing with standard size are usually connected together in a string to form the power generator. The generated direct current is usually fed to an inverter where the direct current is converted to alternating current. If on-site storage is not available, which is the common case in urban areas, the electrical power is registered via an electricity meter and connected to the public supply grid, which will require special permissions from the power grid companies (e.g. CLP in Hong Kong). Therefore, the application of the product will require a full set of electrical systems including cables and connections for parallel or series arrays, direct current load-break switches, inverters and generation meters.
(6) Economic considerations
The economic benefits of the product mainly lie in the following aspects: the substitute for original construction component, CO2 emission reduction and corresponding electricity fee waving, compliance with relevant building regulations (i.e. BEAM Plus in Hong Kong) and application of the feed-in-tariff policy (remuneration for electricity generation from PV).
temperature measurements were conducted through the centre of the vacuum PV sample to calculate the U-value. Secondly, the solar heat gains coefficient (SHGC) of the vacuum PV glazing sample was obtained and compared with three other advanced glazing types in an indoor solar irradiation test. Lastly, an outdoor test was conducted on the platform of Block Z in The Hong Kong Polytechnic University to evaluate the overall thermal performance of vacuum PV glazing. A conventional double clear pane glazing was used as a baseline in the outdoor test.
surfaces shows a similar trend in the three directions. Summing up electricity generation in all floors, the integrated PV modules in Model 2 and 3 can provide 285074.72 kWh/year and 355226.3 kWh/year, which accounts for 13.27% and 16.54% of the total building energy consumption of Model 1. Therefore, given the energy use reduction due to less external heat gain, using the vacuum BIPV glazing can save 27.74% (Model 3) electricity compared to a reference building.

17 Construction Industry Council
U-v
alue
( W/m
2 K )
Hea
t flu
x(W
/m2 )
Time( min )0 50 150 250100 200 300
-30
-20
-10
10
20
30
0
1
2
3
4
5
6
7
0
Heat flux(W/m2)
U-value(W/m2K)
Figure 13 Measured heat flux and calculated U-value of the vacuum PV glazing
The comparison of building energy between Model 1, Model 2 and Model 3 is summarized in Table 6, which includes energy use of lighting, equipment, district cooling and district heating. Although Model 2 and Model 3 consume slightly more lighting energy due to the reduced visible transmittance of the PV glazing, the great energy saving in cooling and heating leads to the net reduction in the total building energy consumption. The total energy consumption of the Model 2 and 3 declines by 20.77 and 22.37 kWh/m2, accounting for 10.44% and 11.20% of Model 1 respectively. Generated electricity of windows and walls in three directions is also presented in Table 7. The south window produced the most electricity, 1527.13 kWh for Model 2 and 3203.76 kWh for Model 3 in a year, taking up nearly 47.80% the total electricity generated by windows. As for the west window, the electricity generated in a year is close to that of east window. Electricity generated by wall
3.2 Experimental study of the vacuum PV glazingOutdoor experimental test was first conducted on the developed prototype vacuum PV (VPV) glazing with the standard size (1.1m × 1.3m), whose various parameters including the ambient air temperature, incident solar irradiation, surface temperatures of the vacuum PV glazing as well as the I-V curves and the power generation were measured and recorded. The power generation and thermal performances of the prototype were also analysed during the test. To further justify the advantage of the vacuum PV glazing, experimental studies were carried out to compare the thermal performance of scaled-down samples (0.3m × 0.3m) with other advanced windows.
(1) Energy performance of the prototypeIn order to evaluate the energy performance of the vacuum PV glazing, an outdoor field measurement was conducted on the platform of Block Z in The Hong Kong Polytechnic University. The vacuum PV glazing was set up horizontally 0.4m above the floor on stilts so that the external temperatures of both sides of the vacuum PV glazing were approximately equal. Various parameters were measured during this test, including the ambient air temperature, the exterior and transmitted horizontal incident solar irradiation, the outer and inner surface temperatures of the vacuum PV glazing as well as the I-V curves and the power generation from the vacuum PV glazing. All the data was logged at an interval of 1 minute. Power generation and thermal performances of the vacuum PV glazing were analyzed based on the outdoor tests. Figure 7 shows the exterior and transmitted incident solar irradiation. It can be seen that the average solar irradiation transmittance during the period is approximately 0.08. Such low transmittance means that vast majority of solar irradiation is blocked by the vacuum PV glazing. Figure 8 presents the outer and inner surface temperature of the vacuum PV glazing. It can be seen that the outer surface temperature is much higher than the inner surface temperature at daytime. The maximum outer surface temperature is 75.3°C, 30°C higher than the inner surface temperature, which indicates that most of the waste heat is dissipated from the outside surface of the vacuum PV glazing, and the heat transfer to the inside space by convection is mitigated. Thus, compared with the conventional single-glazed PV glazing, the structure of the vacuum PV glazing can help reduce the cooling load and improve the indoor thermal comfort.
Then the vacuum PV glazing was mounted on the front side of an experimental test chamber as shown in Figure 9. Clear glass was also adopted in this study for comparison. Figure 10 presents the instantaneous power output of the vacuum PV glazing in 2 sunny days. It can be seen that the power generation from the vacuum PV glazing is consistent with incident solar radiation. A comparative study in terms of internal air temperature of the chamber between the vacuum PV glazing and the clear glass was conducted in a day of June.
As shown in Figure 11, the internal air temperature in the chamber with the vacuum PV glazing is much lower than that with a clear glass. The measured average and maximum internal air temperature for the vacuum PV glazing is 39.6°C and 40.3°C, respectively, while the corresponding average and maximum internal air temperature of the clear glass are 43.6°C and 44.7°C. The maximum internal air temperature difference between the vacuum PV glazing and the clear glass is 4.4°C, occurring in the morning. There are three temperature peaks of internal air temperature. Since the ambient temperature was relatively stable, the main heat gain of the internal air temperature was from incident solar irradiation. The internal air temperature for vacuum PV glazing is much more stable compared with that for the clear glass. The reason is that the vacuum PV glazing has better heat insulation performance so that the internal air temperature is not affected by the external environment significantly. It can also be seen in this figure that the internal air temperature of the chamber drops continuously at 15:00, which shows that the incident solar irradiation on the façade decreases so that the heat gains of the internal air from the sun also drops.
(2) Comparison with other advanced windows
To further justify the advantage of the vacuum PV glazing, experimental studies were carried out to compare it with other advanced windows. Samples of different types of glazing were mounted on the top of two hotboxes (i.e. test rigs) with the uniform dimension of 300 mm (L) × 300 mm (W) × 450mm (H) to implement both indoor and outdoor tests. Firstly, a co-heating test methodology was adopted for the thermal analysis of the vacuum PV glazing. The test rig was filled with the ice-water mixture to ensure the temperature difference between the inside and outside glazing surfaces larger than 5°C. Heat flux and
Figure 12 shows the internal and external temperatures of the vacuum PV glazing sample. The presented data were selected after the hotbox achieved the steady-state condition, when the temperature difference was around 8°C. Heat flux though the glazing sample and the U-value were then determined as illustrated in Figure 13. The average heat flux from the vacuum glazing was measured to be 15.4 W/m2. And the average U-value was calculated as 1.5 W/m2 × K which is much lower than a regular double pane window with the U-value of 2.5W/m2 × K. Considering the edge heat transfer which would strongly affect the heat flux measurement when the sample is small, it can be expected that the centre U-valve of the vacuum PV glazing should be lower than 1.5 W/m2 × K for a larger scale application (e.g. 1.1m × 1.3m).
(3) Cost effective analysis based on simulation
To address the economic benefits of the developed product, the simple payback period of the vacuum PV glazing is calculated with reference to available PV glazing on the market in both Hong Kong and Beijing’s scenarios.
Based on an average electricity price of 1.25 HKD/kWh from HK Electric, the simple payback period (See Figure 26) when applying the product to the west and east façade is calculated to be 7.5 and 8.0 years compared to the single-pane PV glazing. The payback periods are increased to 8.6 and 8.8 years when compared with double-pane PV glazing as shown in Figure 27. However, when applied to the south façade, the extra initial cost of the product cannot be recovered within 10 years.
The solar simulator in the laboratory can provide relatively steady horizontal incident solar irradiation, so that test rigs were located at the same spot to ensure each window sample exposed to the same radiation level. As shown in Figure 14, SHGCs of the vacuum PV glazing and double-pane PV glazing are much smaller than those of the vacuum glazing and double clear glazing, because the coupled PV module can absorb most of the solar irradiation. The vacuum PV glazing has the lowest SHGC of 0.10 which can act as the excellent thermal insulation.
The outdoor test lasted four days from September 26th to September 30th. As shown in Figure 15, September 26th, 27th and 30th were cloudy days and September 28th could be considered as a sunny day. It can be found that the vacuum PV glazing blocks most solar irradiation compared with the double-pane glazing. Figure 16 presents the temperature profile of the vacuum PV glazing and double-pane glazing in the sunny day. The internal surface temperature of both glazing was much higher than the ambient temperature when the outside incident solar radiation is strong. The internal glazing surface and air temperatures of the test rig with the vacuum PV glazing are lower than those of the test rig with the double-pane glazing. The difference between the internal air temperatures of test rigs is much smaller than that of internal glazing surface temperatures. Therefore, the application of vacuum PV glazing can achieve better indoor environment by reducing the solar heat gain.
3.3 Simulation study of the vacuum PV glazing(1) Simulation of a generic building model
Although a series of field tests have been conducted in the outdoor test bed to study the power and thermal performances of the vacuum BIPV glazing, the experimental scenarios are impossible to represent all the situations and variables. Thus, the numerical study was conducted to comprehensively investigate and compare the energy performance of the vacuum PV glazing and other commonly used energy-efficient glazing. As detailed in the research methodology, a comprehensive simulation model based on EnergyPlus and WINDOW has been developed to simulate the overall energy performance of different windows taking into account of their thermal and power output performance. This model is used to simulate the overall energy performance of the vacuum BIPV curtain wall in comparison with other commonly used windows. The key properties of different types of glazing are shown in Table 4 and the electrical specifications of the PV glazing under standard test conditions are referenced to Table 2.
In order to simulate the annual thermal performance and power performance of these types of glazing in Hong Kong for comparison purpose, a typical office room model has been created for simulation, as shown in Figure 17. The dimension of the office model was 2.5m × 2.3m × 2.5m (L × W × H). This room has only one external wall with three identical windows exposed to the outdoor environment. Simulations were conducted for different orientations, i.e. south (S), east (E), west (W) and north (N). A heat transfer model and PV performance model in EnergyPlus are adopted to investigate
the thermal and power performance of different glazing. The heat transfer model is used to calculate the cooling loads of the office room. The cooling loads are then converted to electricity use of air-conditioning system with a presumed coefficient of performance (COP) of 2.78. The equivalent one-diode model is selected to simulate the annual electricity generation from PV elements. The typical meteorological year (TMY) in Hong Kong is selected a reasonable representation of local climates.
The annual cooling electricity use of different types of glazing in different orientations in Hong Kong are shown in Figure 18. It can be observed that the room using vacuum PV glazing consumes the least cooling electricity for all orientations. The south facing room with vacuum PV glazing consumes about 705.56 kWh per year, which was approximately 14.2%, 9.8%, 8.4%, 7.1% and 4.1% less than the corresponding room with single-pane clear glazing, double-pane clear glazing, vacuum glazing, single-pane PV glazing and double-pane PV glazing, respectively. This is because the vacuum PV glazing have the lowest U-value and SHGC among all types of glazing, as shown in Table 4.3. A lower U-value indicates a higher level of heat insulation performance of the glazing, and a lower SHGC means less solar radiation will pass through the windows. Therefore, the vacuum PV glazing performs the best in the area with big temperature difference between indoor and outdoor environment. In addition, the most cooling electricity use of the office room occurs at the west orientation, followed by east, south and north. Therefore, east and west facing windows should have better solar heat insulation performance, to reduce heat gains from outside environment.
In addition to reduce the cooling load of the office room, the PV glazing can also generate electricity in situ. The annual electricity generation of the three types of PV glazing are shown in Figure 19. It can be seen that the annual electricity generation of the three types of PV glazing is similar to each other. The electricity generation from the vacuum PV glazing is a little less than the single-pane PV glazing due to increased solar cell temperature. However, since the temperature coefficient of the thin-film a-Si solar cells is small, the PV conversion efficiency is not reduced significantly. The annual electricity generation from a-Si PV glazing with 12.0% transmittance is around 113.81 kWh per year. Among all orientations, it is better to install PV glazing on the south facade in order to maximize the electricity output in Hong Kong. And it is not recommended to apply PV glazing on north façade due to limited solar radiation available.
Based on the results above, the vacuum PV glazing not only has the best thermal performance among all types of widely used glazing, but also produces a considerable amount of electricity per year. It is recommended to install vacuum PV glazing on south facade to perform the best overall energy performance.
(2) Simulation of the whole building
Apart from modelling studies conducted under the hot and humid climate of Hong Kong, the annual energy performance of different types of glazing in a cold region (i.e. Beijing) was also simulated for comparison. Simulation results are shown in Figure 20 and Figure 21. It can be observed that the room using the vacuum PV glazing achieves the lowest cooling consumption in both climates. In Beijing, the consumed cooling energy with the vacuum PV glazing is much smaller and is 30.2%, 20.8%, 17.0%, 13.8%, 4.4% less than that of the room with other types of glazing. It can be concluded that the energy saving potential of the vacuum PV glazing is much larger in a cold climate while the electricity generation is much higher during the summer time of Beijing due to the smaller solar incidence angle.
The developed simulation model was further applied to a 20-floor prototype office building. Typical floors of the building are divided into 5 conditioned zones, with a total floor area of 540 m2 (as shown in Figure 22). The reference case – Model 1 keeps all windows as the commonly used double-pane clear glazing, while the design cases include Model 2 and Model 3. Model 2 keeps the north-facing window as the conventional double-pane glazing while changes windows orientated to the other three directions to the developed vacuum PV glazing. The opaque part of all building facades is assumed to be covered with traditional crystalline BIPV with a power conversion efficiency of 15% to maximize the power generation potential of the building envelope. Model 3 shares similar settings with Model 2, except that the window transparency is tuned to 20% with a crystalline silicon (c-Si) as shown in Figure 23. Table 5 shows detailed settings of window properties for the three models respectively. The U-value and SHGC of a-Si vacuum PV glazing are obtained from previous experiments and those of double-pane clear glazing are calculated by the simulation software WINDOW. Thermal and power generation properties of c-Si vacuum PV glazing are obtained from existing literatures.
The simulation results of the total heat gain and loss through all windows are presented in Figure 24 and Figure 25. The heat gain and loss both decrease sharply when traditional double-pane clear glazing is replaced by the PV vacuum glazing. The obvious differences between these three models can be identified from the figures. Compared with the performance of Model 1, the heat gain through windows of Model 2 and Model 3 drops up to 77.89% and 77.97% (south-facing windows), while the heat loss of the two models declines up to 79.28% and 79.32% (south-facing windows), respectively.
On the other side, based on the peak office hour electricity price of 1.4 CNY/kWh for cooling and 0.25 CNY/kWh for heating from the Beijing authority, the simple payback period (See Figure 28) when applying the product to the west, east, and south façade is calculated to be 3.8, 4.6 and 5.3 years compared to the single-pane PV glazing. The payback periods are increased to 4.5, 5.4 and 6.5 years when compared with double-pane PV glazing as shown in Figure 29.
As a result, the product can be considered as a cost-effective application in building facades when considering its tremendous saving of air-conditioning energy and corresponding annual expenses. In addition, the property developer could also benefit from a potential increment in renting rates and popularity, if the building gets certified under a green building scheme by claiming credits in CO2 reduction and renewable application assessment criteria. All the abovementioned potential benefits with the application of the vacuum PV glazing would attract more attention from the construction industry.
3.4 Brief technical guideline for the vacuum PV glazingDesigning the vacuum PV glazing (i.e. vacuum BIPV curtain wall) system is a more complex process than a standard added-on PV system. The architectural context, structural requirements, economic considerations and building regulation requirements should all be considered, so that this brief guidance mainly focuses on the below aspects: design strategy, environmental variables, multifunctionality, installation situation, electrical components, and economic aspects (Polysolar Limited, 2015).
(1) Design strategy
Architects, property developers and building users become more inclined to consider renewable and energy efficient applications to meet building and planning regulations due to rising energy bills and awareness of environmental sustainability. The combination of PV and vacuum glazing is an innovative and promising solution to meet these requirements in the new building developments or refurbishment projects. As proved in the above sections of this report, the developed product offers the added advantage of providing a return of investment from the building envelope. Architectural and structural factors, as well as economic considerations should be taken into account at an early stage in any building projects to integrate renewable systems through a more satisfactory approach.
(2) Environmental variables
When designing a BIPV system, a compromise must be reached between the requirements of energy yield optimisation and those of the architectural environment. Therefore, the orientation, lighting performance, shading and temperature are the four mainly concerned issues in BIPV design. According to simulation and experimental results presented in the above sections, the optimal orientation of the installed PV glazing should be south for maximizing the annual power generation, while cooling load reduction is more conspicuous when the product is applied on the west and east facades. Therefore, it is preferable to install the product on all three facades for an optimal overall building energy-saving performance. The visible light transmittance is only 12% in the developed prototype, which might cause slightly more lighting power consumption compared to traditional double-pane clear glazing. However, the transmittance can be easily adjusted to higher than 20% in the manufacture process depending on the effective area of PV materials. There will always be a trade-off between power generation and permeable light, whereas this research has proved that the combined power generation and cooling load reduction can be more than the increased lighting energy use. Power generation performance of the a-Si PV is less sensitive to shadings, so that the prototype is subject to less influence from peripheral shadings. However, if we change the PV material to c-Si for higher conversion efficiency, a shading calculation should be conducted before allocating the BIPV glazing. Lastly, the conversion efficiency of a-Si glazing is also less sensitive to the increase of the panel temperature. The temperature coefficient must be considered if changing the PV material to c-Si.
The vacuum PV glazing was made by sandwiching a layer of PVB between an external PV laminated glass with a visible light transmittance of 12% and an internal vacuum glass. A low-e coating was also adopted to enhance its thermal performance. The structure of the vacuum PV glazing is shown in Figure 5. The dimension of the vacuum PV glazing is 1300 mm (width) × 1100 mm (height) × 20.87 mm (thickness), thinner than commonly used PV double glazed insulating glass units. Figure 6 presents the pictures of the sample of vacuum PV glazing.
This section presents the main findings and outcomes of the research project and indicates their potential impacts on the local energy use and construction industry. Achievements of the specified research objectives are illustrated, and limitations of the project are also mentioned for the reference of future studies.
3.1 Design and production of the prototype productInitially, we proposed a prototype design as specified by Figure 2, where the vacuum layer was directly coupled with the laminated PV panel. However, during initial manufacture trials, the air pressure difference between internal and external spaces of the vacuum glass samples produced by the laminating machine caused the breakage of the vacuum glass samples. Then, we followed an alternative approach using pre-pressure furnace, whereas the molten state of the polyvinyl butyral (PVB) could not meet the expected requirements and the bubbles greatly impacted the appearance and performance of PV module. Finally, we proposed the current product design based on the experience acquired from previous failures (See Figure 5).
The electrical specifications of the vacuum PV glazing under standard test conditions (STC: air mass 1.5, solar irradiation 1000 W/m2 and cell temperature 25°C) are shown in Table 2. Table 3 presents the given thermal and optical properties of the PV laminated glass and vacuum glass, respectively.
(3) Multi-functionality
Due to their mechanical structures, the PV vacuum glazing can perform the functions of the building envelope in addition to generating emission-free energy, and can thus substitute for conventional construction windows or curtain walls. Apart from power generation and architectural function, the product can provide solar shading with its low SHGC value. It can also act as thermal and sound insulation due to its low U-value and acoustic resistance caused by the vacuum chamber between glazing layers. If applied with special coatings/films on top of PV glazing, it can also provide weather protection.
(4) Mounting system and installation
Based on specific requirements of each project in each region, safety, loading capacity and PV installation specifications can have a decisive impact on the method of fixing/mounting the vacuum. We have in this guide attempted to provide a range of options, highlighting what is possible in current design. The product can be installed with a linear mounting system as mullion-transom facades or structural sealant glazing. It can also be mounted with point-fixing systems including clamp fixings and undercut anchor fixings or mounted into standard curtain walling, rain screen cladding and window systems.
(5) Electrical system
In the curtain wall system, several PV glazing with standard size are usually connected together in a string to form the power generator. The generated direct current is usually fed to an inverter where the direct current is converted to alternating current. If on-site storage is not available, which is the common case in urban areas, the electrical power is registered via an electricity meter and connected to the public supply grid, which will require special permissions from the power grid companies (e.g. CLP in Hong Kong). Therefore, the application of the product will require a full set of electrical systems including cables and connections for parallel or series arrays, direct current load-break switches, inverters and generation meters.
(6) Economic considerations
The economic benefits of the product mainly lie in the following aspects: the substitute for original construction component, CO2 emission reduction and corresponding electricity fee waving, compliance with relevant building regulations (i.e. BEAM Plus in Hong Kong) and application of the feed-in-tariff policy (remuneration for electricity generation from PV).
temperature measurements were conducted through the centre of the vacuum PV sample to calculate the U-value. Secondly, the solar heat gains coefficient (SHGC) of the vacuum PV glazing sample was obtained and compared with three other advanced glazing types in an indoor solar irradiation test. Lastly, an outdoor test was conducted on the platform of Block Z in The Hong Kong Polytechnic University to evaluate the overall thermal performance of vacuum PV glazing. A conventional double clear pane glazing was used as a baseline in the outdoor test.
surfaces shows a similar trend in the three directions. Summing up electricity generation in all floors, the integrated PV modules in Model 2 and 3 can provide 285074.72 kWh/year and 355226.3 kWh/year, which accounts for 13.27% and 16.54% of the total building energy consumption of Model 1. Therefore, given the energy use reduction due to less external heat gain, using the vacuum BIPV glazing can save 27.74% (Model 3) electricity compared to a reference building.

Investigation on the Thermal and Power Performance of Vacuum BIPV Curtain Wall Technology and its Application Potential in Buildings in Hong Kong
18
The comparison of building energy between Model 1, Model 2 and Model 3 is summarized in Table 6, which includes energy use of lighting, equipment, district cooling and district heating. Although Model 2 and Model 3 consume slightly more lighting energy due to the reduced visible transmittance of the PV glazing, the great energy saving in cooling and heating leads to the net reduction in the total building energy consumption. The total energy consumption of the Model 2 and 3 declines by 20.77 and 22.37 kWh/m2, accounting for 10.44% and 11.20% of Model 1 respectively. Generated electricity of windows and walls in three directions is also presented in Table 7. The south window produced the most electricity, 1527.13 kWh for Model 2 and 3203.76 kWh for Model 3 in a year, taking up nearly 47.80% the total electricity generated by windows. As for the west window, the electricity generated in a year is close to that of east window. Electricity generated by wall
3.2 Experimental study of the vacuum PV glazingOutdoor experimental test was first conducted on the developed prototype vacuum PV (VPV) glazing with the standard size (1.1m × 1.3m), whose various parameters including the ambient air temperature, incident solar irradiation, surface temperatures of the vacuum PV glazing as well as the I-V curves and the power generation were measured and recorded. The power generation and thermal performances of the prototype were also analysed during the test. To further justify the advantage of the vacuum PV glazing, experimental studies were carried out to compare the thermal performance of scaled-down samples (0.3m × 0.3m) with other advanced windows.
(1) Energy performance of the prototypeIn order to evaluate the energy performance of the vacuum PV glazing, an outdoor field measurement was conducted on the platform of Block Z in The Hong Kong Polytechnic University. The vacuum PV glazing was set up horizontally 0.4m above the floor on stilts so that the external temperatures of both sides of the vacuum PV glazing were approximately equal. Various parameters were measured during this test, including the ambient air temperature, the exterior and transmitted horizontal incident solar irradiation, the outer and inner surface temperatures of the vacuum PV glazing as well as the I-V curves and the power generation from the vacuum PV glazing. All the data was logged at an interval of 1 minute. Power generation and thermal performances of the vacuum PV glazing were analyzed based on the outdoor tests. Figure 7 shows the exterior and transmitted incident solar irradiation. It can be seen that the average solar irradiation transmittance during the period is approximately 0.08. Such low transmittance means that vast majority of solar irradiation is blocked by the vacuum PV glazing. Figure 8 presents the outer and inner surface temperature of the vacuum PV glazing. It can be seen that the outer surface temperature is much higher than the inner surface temperature at daytime. The maximum outer surface temperature is 75.3°C, 30°C higher than the inner surface temperature, which indicates that most of the waste heat is dissipated from the outside surface of the vacuum PV glazing, and the heat transfer to the inside space by convection is mitigated. Thus, compared with the conventional single-glazed PV glazing, the structure of the vacuum PV glazing can help reduce the cooling load and improve the indoor thermal comfort.
Then the vacuum PV glazing was mounted on the front side of an experimental test chamber as shown in Figure 9. Clear glass was also adopted in this study for comparison. Figure 10 presents the instantaneous power output of the vacuum PV glazing in 2 sunny days. It can be seen that the power generation from the vacuum PV glazing is consistent with incident solar radiation. A comparative study in terms of internal air temperature of the chamber between the vacuum PV glazing and the clear glass was conducted in a day of June.
As shown in Figure 11, the internal air temperature in the chamber with the vacuum PV glazing is much lower than that with a clear glass. The measured average and maximum internal air temperature for the vacuum PV glazing is 39.6°C and 40.3°C, respectively, while the corresponding average and maximum internal air temperature of the clear glass are 43.6°C and 44.7°C. The maximum internal air temperature difference between the vacuum PV glazing and the clear glass is 4.4°C, occurring in the morning. There are three temperature peaks of internal air temperature. Since the ambient temperature was relatively stable, the main heat gain of the internal air temperature was from incident solar irradiation. The internal air temperature for vacuum PV glazing is much more stable compared with that for the clear glass. The reason is that the vacuum PV glazing has better heat insulation performance so that the internal air temperature is not affected by the external environment significantly. It can also be seen in this figure that the internal air temperature of the chamber drops continuously at 15:00, which shows that the incident solar irradiation on the façade decreases so that the heat gains of the internal air from the sun also drops.
(2) Comparison with other advanced windows
To further justify the advantage of the vacuum PV glazing, experimental studies were carried out to compare it with other advanced windows. Samples of different types of glazing were mounted on the top of two hotboxes (i.e. test rigs) with the uniform dimension of 300 mm (L) × 300 mm (W) × 450mm (H) to implement both indoor and outdoor tests. Firstly, a co-heating test methodology was adopted for the thermal analysis of the vacuum PV glazing. The test rig was filled with the ice-water mixture to ensure the temperature difference between the inside and outside glazing surfaces larger than 5°C. Heat flux and
Figure 12 shows the internal and external temperatures of the vacuum PV glazing sample. The presented data were selected after the hotbox achieved the steady-state condition, when the temperature difference was around 8°C. Heat flux though the glazing sample and the U-value were then determined as illustrated in Figure 13. The average heat flux from the vacuum glazing was measured to be 15.4 W/m2. And the average U-value was calculated as 1.5 W/m2 × K which is much lower than a regular double pane window with the U-value of 2.5W/m2 × K. Considering the edge heat transfer which would strongly affect the heat flux measurement when the sample is small, it can be expected that the centre U-valve of the vacuum PV glazing should be lower than 1.5 W/m2 × K for a larger scale application (e.g. 1.1m × 1.3m).
(3) Cost effective analysis based on simulation
To address the economic benefits of the developed product, the simple payback period of the vacuum PV glazing is calculated with reference to available PV glazing on the market in both Hong Kong and Beijing’s scenarios.
Based on an average electricity price of 1.25 HKD/kWh from HK Electric, the simple payback period (See Figure 26) when applying the product to the west and east façade is calculated to be 7.5 and 8.0 years compared to the single-pane PV glazing. The payback periods are increased to 8.6 and 8.8 years when compared with double-pane PV glazing as shown in Figure 27. However, when applied to the south façade, the extra initial cost of the product cannot be recovered within 10 years.
The solar simulator in the laboratory can provide relatively steady horizontal incident solar irradiation, so that test rigs were located at the same spot to ensure each window sample exposed to the same radiation level. As shown in Figure 14, SHGCs of the vacuum PV glazing and double-pane PV glazing are much smaller than those of the vacuum glazing and double clear glazing, because the coupled PV module can absorb most of the solar irradiation. The vacuum PV glazing has the lowest SHGC of 0.10 which can act as the excellent thermal insulation.
The outdoor test lasted four days from September 26th to September 30th. As shown in Figure 15, September 26th, 27th and 30th were cloudy days and September 28th could be considered as a sunny day. It can be found that the vacuum PV glazing blocks most solar irradiation compared with the double-pane glazing. Figure 16 presents the temperature profile of the vacuum PV glazing and double-pane glazing in the sunny day. The internal surface temperature of both glazing was much higher than the ambient temperature when the outside incident solar radiation is strong. The internal glazing surface and air temperatures of the test rig with the vacuum PV glazing are lower than those of the test rig with the double-pane glazing. The difference between the internal air temperatures of test rigs is much smaller than that of internal glazing surface temperatures. Therefore, the application of vacuum PV glazing can achieve better indoor environment by reducing the solar heat gain.
3.3 Simulation study of the vacuum PV glazing(1) Simulation of a generic building model
Although a series of field tests have been conducted in the outdoor test bed to study the power and thermal performances of the vacuum BIPV glazing, the experimental scenarios are impossible to represent all the situations and variables. Thus, the numerical study was conducted to comprehensively investigate and compare the energy performance of the vacuum PV glazing and other commonly used energy-efficient glazing. As detailed in the research methodology, a comprehensive simulation model based on EnergyPlus and WINDOW has been developed to simulate the overall energy performance of different windows taking into account of their thermal and power output performance. This model is used to simulate the overall energy performance of the vacuum BIPV curtain wall in comparison with other commonly used windows. The key properties of different types of glazing are shown in Table 4 and the electrical specifications of the PV glazing under standard test conditions are referenced to Table 2.
In order to simulate the annual thermal performance and power performance of these types of glazing in Hong Kong for comparison purpose, a typical office room model has been created for simulation, as shown in Figure 17. The dimension of the office model was 2.5m × 2.3m × 2.5m (L × W × H). This room has only one external wall with three identical windows exposed to the outdoor environment. Simulations were conducted for different orientations, i.e. south (S), east (E), west (W) and north (N). A heat transfer model and PV performance model in EnergyPlus are adopted to investigate
the thermal and power performance of different glazing. The heat transfer model is used to calculate the cooling loads of the office room. The cooling loads are then converted to electricity use of air-conditioning system with a presumed coefficient of performance (COP) of 2.78. The equivalent one-diode model is selected to simulate the annual electricity generation from PV elements. The typical meteorological year (TMY) in Hong Kong is selected a reasonable representation of local climates.
The annual cooling electricity use of different types of glazing in different orientations in Hong Kong are shown in Figure 18. It can be observed that the room using vacuum PV glazing consumes the least cooling electricity for all orientations. The south facing room with vacuum PV glazing consumes about 705.56 kWh per year, which was approximately 14.2%, 9.8%, 8.4%, 7.1% and 4.1% less than the corresponding room with single-pane clear glazing, double-pane clear glazing, vacuum glazing, single-pane PV glazing and double-pane PV glazing, respectively. This is because the vacuum PV glazing have the lowest U-value and SHGC among all types of glazing, as shown in Table 4.3. A lower U-value indicates a higher level of heat insulation performance of the glazing, and a lower SHGC means less solar radiation will pass through the windows. Therefore, the vacuum PV glazing performs the best in the area with big temperature difference between indoor and outdoor environment. In addition, the most cooling electricity use of the office room occurs at the west orientation, followed by east, south and north. Therefore, east and west facing windows should have better solar heat insulation performance, to reduce heat gains from outside environment.
In addition to reduce the cooling load of the office room, the PV glazing can also generate electricity in situ. The annual electricity generation of the three types of PV glazing are shown in Figure 19. It can be seen that the annual electricity generation of the three types of PV glazing is similar to each other. The electricity generation from the vacuum PV glazing is a little less than the single-pane PV glazing due to increased solar cell temperature. However, since the temperature coefficient of the thin-film a-Si solar cells is small, the PV conversion efficiency is not reduced significantly. The annual electricity generation from a-Si PV glazing with 12.0% transmittance is around 113.81 kWh per year. Among all orientations, it is better to install PV glazing on the south facade in order to maximize the electricity output in Hong Kong. And it is not recommended to apply PV glazing on north façade due to limited solar radiation available.
Based on the results above, the vacuum PV glazing not only has the best thermal performance among all types of widely used glazing, but also produces a considerable amount of electricity per year. It is recommended to install vacuum PV glazing on south facade to perform the best overall energy performance.
(2) Simulation of the whole building
Apart from modelling studies conducted under the hot and humid climate of Hong Kong, the annual energy performance of different types of glazing in a cold region (i.e. Beijing) was also simulated for comparison. Simulation results are shown in Figure 20 and Figure 21. It can be observed that the room using the vacuum PV glazing achieves the lowest cooling consumption in both climates. In Beijing, the consumed cooling energy with the vacuum PV glazing is much smaller and is 30.2%, 20.8%, 17.0%, 13.8%, 4.4% less than that of the room with other types of glazing. It can be concluded that the energy saving potential of the vacuum PV glazing is much larger in a cold climate while the electricity generation is much higher during the summer time of Beijing due to the smaller solar incidence angle.
The developed simulation model was further applied to a 20-floor prototype office building. Typical floors of the building are divided into 5 conditioned zones, with a total floor area of 540 m2 (as shown in Figure 22). The reference case – Model 1 keeps all windows as the commonly used double-pane clear glazing, while the design cases include Model 2 and Model 3. Model 2 keeps the north-facing window as the conventional double-pane glazing while changes windows orientated to the other three directions to the developed vacuum PV glazing. The opaque part of all building facades is assumed to be covered with traditional crystalline BIPV with a power conversion efficiency of 15% to maximize the power generation potential of the building envelope. Model 3 shares similar settings with Model 2, except that the window transparency is tuned to 20% with a crystalline silicon (c-Si) as shown in Figure 23. Table 5 shows detailed settings of window properties for the three models respectively. The U-value and SHGC of a-Si vacuum PV glazing are obtained from previous experiments and those of double-pane clear glazing are calculated by the simulation software WINDOW. Thermal and power generation properties of c-Si vacuum PV glazing are obtained from existing literatures.
The simulation results of the total heat gain and loss through all windows are presented in Figure 24 and Figure 25. The heat gain and loss both decrease sharply when traditional double-pane clear glazing is replaced by the PV vacuum glazing. The obvious differences between these three models can be identified from the figures. Compared with the performance of Model 1, the heat gain through windows of Model 2 and Model 3 drops up to 77.89% and 77.97% (south-facing windows), while the heat loss of the two models declines up to 79.28% and 79.32% (south-facing windows), respectively.
On the other side, based on the peak office hour electricity price of 1.4 CNY/kWh for cooling and 0.25 CNY/kWh for heating from the Beijing authority, the simple payback period (See Figure 28) when applying the product to the west, east, and south façade is calculated to be 3.8, 4.6 and 5.3 years compared to the single-pane PV glazing. The payback periods are increased to 4.5, 5.4 and 6.5 years when compared with double-pane PV glazing as shown in Figure 29.
As a result, the product can be considered as a cost-effective application in building facades when considering its tremendous saving of air-conditioning energy and corresponding annual expenses. In addition, the property developer could also benefit from a potential increment in renting rates and popularity, if the building gets certified under a green building scheme by claiming credits in CO2 reduction and renewable application assessment criteria. All the abovementioned potential benefits with the application of the vacuum PV glazing would attract more attention from the construction industry.
3.4 Brief technical guideline for the vacuum PV glazingDesigning the vacuum PV glazing (i.e. vacuum BIPV curtain wall) system is a more complex process than a standard added-on PV system. The architectural context, structural requirements, economic considerations and building regulation requirements should all be considered, so that this brief guidance mainly focuses on the below aspects: design strategy, environmental variables, multifunctionality, installation situation, electrical components, and economic aspects (Polysolar Limited, 2015).
(1) Design strategy
Architects, property developers and building users become more inclined to consider renewable and energy efficient applications to meet building and planning regulations due to rising energy bills and awareness of environmental sustainability. The combination of PV and vacuum glazing is an innovative and promising solution to meet these requirements in the new building developments or refurbishment projects. As proved in the above sections of this report, the developed product offers the added advantage of providing a return of investment from the building envelope. Architectural and structural factors, as well as economic considerations should be taken into account at an early stage in any building projects to integrate renewable systems through a more satisfactory approach.
(2) Environmental variables
When designing a BIPV system, a compromise must be reached between the requirements of energy yield optimisation and those of the architectural environment. Therefore, the orientation, lighting performance, shading and temperature are the four mainly concerned issues in BIPV design. According to simulation and experimental results presented in the above sections, the optimal orientation of the installed PV glazing should be south for maximizing the annual power generation, while cooling load reduction is more conspicuous when the product is applied on the west and east facades. Therefore, it is preferable to install the product on all three facades for an optimal overall building energy-saving performance. The visible light transmittance is only 12% in the developed prototype, which might cause slightly more lighting power consumption compared to traditional double-pane clear glazing. However, the transmittance can be easily adjusted to higher than 20% in the manufacture process depending on the effective area of PV materials. There will always be a trade-off between power generation and permeable light, whereas this research has proved that the combined power generation and cooling load reduction can be more than the increased lighting energy use. Power generation performance of the a-Si PV is less sensitive to shadings, so that the prototype is subject to less influence from peripheral shadings. However, if we change the PV material to c-Si for higher conversion efficiency, a shading calculation should be conducted before allocating the BIPV glazing. Lastly, the conversion efficiency of a-Si glazing is also less sensitive to the increase of the panel temperature. The temperature coefficient must be considered if changing the PV material to c-Si.
The vacuum PV glazing was made by sandwiching a layer of PVB between an external PV laminated glass with a visible light transmittance of 12% and an internal vacuum glass. A low-e coating was also adopted to enhance its thermal performance. The structure of the vacuum PV glazing is shown in Figure 5. The dimension of the vacuum PV glazing is 1300 mm (width) × 1100 mm (height) × 20.87 mm (thickness), thinner than commonly used PV double glazed insulating glass units. Figure 6 presents the pictures of the sample of vacuum PV glazing.
This section presents the main findings and outcomes of the research project and indicates their potential impacts on the local energy use and construction industry. Achievements of the specified research objectives are illustrated, and limitations of the project are also mentioned for the reference of future studies.
3.1 Design and production of the prototype productInitially, we proposed a prototype design as specified by Figure 2, where the vacuum layer was directly coupled with the laminated PV panel. However, during initial manufacture trials, the air pressure difference between internal and external spaces of the vacuum glass samples produced by the laminating machine caused the breakage of the vacuum glass samples. Then, we followed an alternative approach using pre-pressure furnace, whereas the molten state of the polyvinyl butyral (PVB) could not meet the expected requirements and the bubbles greatly impacted the appearance and performance of PV module. Finally, we proposed the current product design based on the experience acquired from previous failures (See Figure 5).
The electrical specifications of the vacuum PV glazing under standard test conditions (STC: air mass 1.5, solar irradiation 1000 W/m2 and cell temperature 25°C) are shown in Table 2. Table 3 presents the given thermal and optical properties of the PV laminated glass and vacuum glass, respectively.
Time (s)
Sol
ar h
eat g
ain
coef
ficie
nt
00.0
0.2
0.4
0.6
0.8
1000 2000 3000 4000
Vacuum PVVacuumDouble clearDouble PV
Figure 14 The solar heat gain coefficient of different types of glazing
(3) Multi-functionality
Due to their mechanical structures, the PV vacuum glazing can perform the functions of the building envelope in addition to generating emission-free energy, and can thus substitute for conventional construction windows or curtain walls. Apart from power generation and architectural function, the product can provide solar shading with its low SHGC value. It can also act as thermal and sound insulation due to its low U-value and acoustic resistance caused by the vacuum chamber between glazing layers. If applied with special coatings/films on top of PV glazing, it can also provide weather protection.
(4) Mounting system and installation
Based on specific requirements of each project in each region, safety, loading capacity and PV installation specifications can have a decisive impact on the method of fixing/mounting the vacuum. We have in this guide attempted to provide a range of options, highlighting what is possible in current design. The product can be installed with a linear mounting system as mullion-transom facades or structural sealant glazing. It can also be mounted with point-fixing systems including clamp fixings and undercut anchor fixings or mounted into standard curtain walling, rain screen cladding and window systems.
(5) Electrical system
In the curtain wall system, several PV glazing with standard size are usually connected together in a string to form the power generator. The generated direct current is usually fed to an inverter where the direct current is converted to alternating current. If on-site storage is not available, which is the common case in urban areas, the electrical power is registered via an electricity meter and connected to the public supply grid, which will require special permissions from the power grid companies (e.g. CLP in Hong Kong). Therefore, the application of the product will require a full set of electrical systems including cables and connections for parallel or series arrays, direct current load-break switches, inverters and generation meters.
(6) Economic considerations
The economic benefits of the product mainly lie in the following aspects: the substitute for original construction component, CO2 emission reduction and corresponding electricity fee waving, compliance with relevant building regulations (i.e. BEAM Plus in Hong Kong) and application of the feed-in-tariff policy (remuneration for electricity generation from PV).
temperature measurements were conducted through the centre of the vacuum PV sample to calculate the U-value. Secondly, the solar heat gains coefficient (SHGC) of the vacuum PV glazing sample was obtained and compared with three other advanced glazing types in an indoor solar irradiation test. Lastly, an outdoor test was conducted on the platform of Block Z in The Hong Kong Polytechnic University to evaluate the overall thermal performance of vacuum PV glazing. A conventional double clear pane glazing was used as a baseline in the outdoor test.
surfaces shows a similar trend in the three directions. Summing up electricity generation in all floors, the integrated PV modules in Model 2 and 3 can provide 285074.72 kWh/year and 355226.3 kWh/year, which accounts for 13.27% and 16.54% of the total building energy consumption of Model 1. Therefore, given the energy use reduction due to less external heat gain, using the vacuum BIPV glazing can save 27.74% (Model 3) electricity compared to a reference building.

19 Construction Industry Council
The comparison of building energy between Model 1, Model 2 and Model 3 is summarized in Table 6, which includes energy use of lighting, equipment, district cooling and district heating. Although Model 2 and Model 3 consume slightly more lighting energy due to the reduced visible transmittance of the PV glazing, the great energy saving in cooling and heating leads to the net reduction in the total building energy consumption. The total energy consumption of the Model 2 and 3 declines by 20.77 and 22.37 kWh/m2, accounting for 10.44% and 11.20% of Model 1 respectively. Generated electricity of windows and walls in three directions is also presented in Table 7. The south window produced the most electricity, 1527.13 kWh for Model 2 and 3203.76 kWh for Model 3 in a year, taking up nearly 47.80% the total electricity generated by windows. As for the west window, the electricity generated in a year is close to that of east window. Electricity generated by wall
3.2 Experimental study of the vacuum PV glazingOutdoor experimental test was first conducted on the developed prototype vacuum PV (VPV) glazing with the standard size (1.1m × 1.3m), whose various parameters including the ambient air temperature, incident solar irradiation, surface temperatures of the vacuum PV glazing as well as the I-V curves and the power generation were measured and recorded. The power generation and thermal performances of the prototype were also analysed during the test. To further justify the advantage of the vacuum PV glazing, experimental studies were carried out to compare the thermal performance of scaled-down samples (0.3m × 0.3m) with other advanced windows.
(1) Energy performance of the prototypeIn order to evaluate the energy performance of the vacuum PV glazing, an outdoor field measurement was conducted on the platform of Block Z in The Hong Kong Polytechnic University. The vacuum PV glazing was set up horizontally 0.4m above the floor on stilts so that the external temperatures of both sides of the vacuum PV glazing were approximately equal. Various parameters were measured during this test, including the ambient air temperature, the exterior and transmitted horizontal incident solar irradiation, the outer and inner surface temperatures of the vacuum PV glazing as well as the I-V curves and the power generation from the vacuum PV glazing. All the data was logged at an interval of 1 minute. Power generation and thermal performances of the vacuum PV glazing were analyzed based on the outdoor tests. Figure 7 shows the exterior and transmitted incident solar irradiation. It can be seen that the average solar irradiation transmittance during the period is approximately 0.08. Such low transmittance means that vast majority of solar irradiation is blocked by the vacuum PV glazing. Figure 8 presents the outer and inner surface temperature of the vacuum PV glazing. It can be seen that the outer surface temperature is much higher than the inner surface temperature at daytime. The maximum outer surface temperature is 75.3°C, 30°C higher than the inner surface temperature, which indicates that most of the waste heat is dissipated from the outside surface of the vacuum PV glazing, and the heat transfer to the inside space by convection is mitigated. Thus, compared with the conventional single-glazed PV glazing, the structure of the vacuum PV glazing can help reduce the cooling load and improve the indoor thermal comfort.
Then the vacuum PV glazing was mounted on the front side of an experimental test chamber as shown in Figure 9. Clear glass was also adopted in this study for comparison. Figure 10 presents the instantaneous power output of the vacuum PV glazing in 2 sunny days. It can be seen that the power generation from the vacuum PV glazing is consistent with incident solar radiation. A comparative study in terms of internal air temperature of the chamber between the vacuum PV glazing and the clear glass was conducted in a day of June.
As shown in Figure 11, the internal air temperature in the chamber with the vacuum PV glazing is much lower than that with a clear glass. The measured average and maximum internal air temperature for the vacuum PV glazing is 39.6°C and 40.3°C, respectively, while the corresponding average and maximum internal air temperature of the clear glass are 43.6°C and 44.7°C. The maximum internal air temperature difference between the vacuum PV glazing and the clear glass is 4.4°C, occurring in the morning. There are three temperature peaks of internal air temperature. Since the ambient temperature was relatively stable, the main heat gain of the internal air temperature was from incident solar irradiation. The internal air temperature for vacuum PV glazing is much more stable compared with that for the clear glass. The reason is that the vacuum PV glazing has better heat insulation performance so that the internal air temperature is not affected by the external environment significantly. It can also be seen in this figure that the internal air temperature of the chamber drops continuously at 15:00, which shows that the incident solar irradiation on the façade decreases so that the heat gains of the internal air from the sun also drops.
(2) Comparison with other advanced windows
To further justify the advantage of the vacuum PV glazing, experimental studies were carried out to compare it with other advanced windows. Samples of different types of glazing were mounted on the top of two hotboxes (i.e. test rigs) with the uniform dimension of 300 mm (L) × 300 mm (W) × 450mm (H) to implement both indoor and outdoor tests. Firstly, a co-heating test methodology was adopted for the thermal analysis of the vacuum PV glazing. The test rig was filled with the ice-water mixture to ensure the temperature difference between the inside and outside glazing surfaces larger than 5°C. Heat flux and
Figure 12 shows the internal and external temperatures of the vacuum PV glazing sample. The presented data were selected after the hotbox achieved the steady-state condition, when the temperature difference was around 8°C. Heat flux though the glazing sample and the U-value were then determined as illustrated in Figure 13. The average heat flux from the vacuum glazing was measured to be 15.4 W/m2. And the average U-value was calculated as 1.5 W/m2 × K which is much lower than a regular double pane window with the U-value of 2.5W/m2 × K. Considering the edge heat transfer which would strongly affect the heat flux measurement when the sample is small, it can be expected that the centre U-valve of the vacuum PV glazing should be lower than 1.5 W/m2 × K for a larger scale application (e.g. 1.1m × 1.3m).
(3) Cost effective analysis based on simulation
To address the economic benefits of the developed product, the simple payback period of the vacuum PV glazing is calculated with reference to available PV glazing on the market in both Hong Kong and Beijing’s scenarios.
Based on an average electricity price of 1.25 HKD/kWh from HK Electric, the simple payback period (See Figure 26) when applying the product to the west and east façade is calculated to be 7.5 and 8.0 years compared to the single-pane PV glazing. The payback periods are increased to 8.6 and 8.8 years when compared with double-pane PV glazing as shown in Figure 27. However, when applied to the south façade, the extra initial cost of the product cannot be recovered within 10 years.
The solar simulator in the laboratory can provide relatively steady horizontal incident solar irradiation, so that test rigs were located at the same spot to ensure each window sample exposed to the same radiation level. As shown in Figure 14, SHGCs of the vacuum PV glazing and double-pane PV glazing are much smaller than those of the vacuum glazing and double clear glazing, because the coupled PV module can absorb most of the solar irradiation. The vacuum PV glazing has the lowest SHGC of 0.10 which can act as the excellent thermal insulation.
The outdoor test lasted four days from September 26th to September 30th. As shown in Figure 15, September 26th, 27th and 30th were cloudy days and September 28th could be considered as a sunny day. It can be found that the vacuum PV glazing blocks most solar irradiation compared with the double-pane glazing. Figure 16 presents the temperature profile of the vacuum PV glazing and double-pane glazing in the sunny day. The internal surface temperature of both glazing was much higher than the ambient temperature when the outside incident solar radiation is strong. The internal glazing surface and air temperatures of the test rig with the vacuum PV glazing are lower than those of the test rig with the double-pane glazing. The difference between the internal air temperatures of test rigs is much smaller than that of internal glazing surface temperatures. Therefore, the application of vacuum PV glazing can achieve better indoor environment by reducing the solar heat gain.
3.3 Simulation study of the vacuum PV glazing(1) Simulation of a generic building model
Although a series of field tests have been conducted in the outdoor test bed to study the power and thermal performances of the vacuum BIPV glazing, the experimental scenarios are impossible to represent all the situations and variables. Thus, the numerical study was conducted to comprehensively investigate and compare the energy performance of the vacuum PV glazing and other commonly used energy-efficient glazing. As detailed in the research methodology, a comprehensive simulation model based on EnergyPlus and WINDOW has been developed to simulate the overall energy performance of different windows taking into account of their thermal and power output performance. This model is used to simulate the overall energy performance of the vacuum BIPV curtain wall in comparison with other commonly used windows. The key properties of different types of glazing are shown in Table 4 and the electrical specifications of the PV glazing under standard test conditions are referenced to Table 2.
In order to simulate the annual thermal performance and power performance of these types of glazing in Hong Kong for comparison purpose, a typical office room model has been created for simulation, as shown in Figure 17. The dimension of the office model was 2.5m × 2.3m × 2.5m (L × W × H). This room has only one external wall with three identical windows exposed to the outdoor environment. Simulations were conducted for different orientations, i.e. south (S), east (E), west (W) and north (N). A heat transfer model and PV performance model in EnergyPlus are adopted to investigate
the thermal and power performance of different glazing. The heat transfer model is used to calculate the cooling loads of the office room. The cooling loads are then converted to electricity use of air-conditioning system with a presumed coefficient of performance (COP) of 2.78. The equivalent one-diode model is selected to simulate the annual electricity generation from PV elements. The typical meteorological year (TMY) in Hong Kong is selected a reasonable representation of local climates.
The annual cooling electricity use of different types of glazing in different orientations in Hong Kong are shown in Figure 18. It can be observed that the room using vacuum PV glazing consumes the least cooling electricity for all orientations. The south facing room with vacuum PV glazing consumes about 705.56 kWh per year, which was approximately 14.2%, 9.8%, 8.4%, 7.1% and 4.1% less than the corresponding room with single-pane clear glazing, double-pane clear glazing, vacuum glazing, single-pane PV glazing and double-pane PV glazing, respectively. This is because the vacuum PV glazing have the lowest U-value and SHGC among all types of glazing, as shown in Table 4.3. A lower U-value indicates a higher level of heat insulation performance of the glazing, and a lower SHGC means less solar radiation will pass through the windows. Therefore, the vacuum PV glazing performs the best in the area with big temperature difference between indoor and outdoor environment. In addition, the most cooling electricity use of the office room occurs at the west orientation, followed by east, south and north. Therefore, east and west facing windows should have better solar heat insulation performance, to reduce heat gains from outside environment.
In addition to reduce the cooling load of the office room, the PV glazing can also generate electricity in situ. The annual electricity generation of the three types of PV glazing are shown in Figure 19. It can be seen that the annual electricity generation of the three types of PV glazing is similar to each other. The electricity generation from the vacuum PV glazing is a little less than the single-pane PV glazing due to increased solar cell temperature. However, since the temperature coefficient of the thin-film a-Si solar cells is small, the PV conversion efficiency is not reduced significantly. The annual electricity generation from a-Si PV glazing with 12.0% transmittance is around 113.81 kWh per year. Among all orientations, it is better to install PV glazing on the south facade in order to maximize the electricity output in Hong Kong. And it is not recommended to apply PV glazing on north façade due to limited solar radiation available.
Based on the results above, the vacuum PV glazing not only has the best thermal performance among all types of widely used glazing, but also produces a considerable amount of electricity per year. It is recommended to install vacuum PV glazing on south facade to perform the best overall energy performance.
(2) Simulation of the whole building
Apart from modelling studies conducted under the hot and humid climate of Hong Kong, the annual energy performance of different types of glazing in a cold region (i.e. Beijing) was also simulated for comparison. Simulation results are shown in Figure 20 and Figure 21. It can be observed that the room using the vacuum PV glazing achieves the lowest cooling consumption in both climates. In Beijing, the consumed cooling energy with the vacuum PV glazing is much smaller and is 30.2%, 20.8%, 17.0%, 13.8%, 4.4% less than that of the room with other types of glazing. It can be concluded that the energy saving potential of the vacuum PV glazing is much larger in a cold climate while the electricity generation is much higher during the summer time of Beijing due to the smaller solar incidence angle.
The developed simulation model was further applied to a 20-floor prototype office building. Typical floors of the building are divided into 5 conditioned zones, with a total floor area of 540 m2 (as shown in Figure 22). The reference case – Model 1 keeps all windows as the commonly used double-pane clear glazing, while the design cases include Model 2 and Model 3. Model 2 keeps the north-facing window as the conventional double-pane glazing while changes windows orientated to the other three directions to the developed vacuum PV glazing. The opaque part of all building facades is assumed to be covered with traditional crystalline BIPV with a power conversion efficiency of 15% to maximize the power generation potential of the building envelope. Model 3 shares similar settings with Model 2, except that the window transparency is tuned to 20% with a crystalline silicon (c-Si) as shown in Figure 23. Table 5 shows detailed settings of window properties for the three models respectively. The U-value and SHGC of a-Si vacuum PV glazing are obtained from previous experiments and those of double-pane clear glazing are calculated by the simulation software WINDOW. Thermal and power generation properties of c-Si vacuum PV glazing are obtained from existing literatures.
The simulation results of the total heat gain and loss through all windows are presented in Figure 24 and Figure 25. The heat gain and loss both decrease sharply when traditional double-pane clear glazing is replaced by the PV vacuum glazing. The obvious differences between these three models can be identified from the figures. Compared with the performance of Model 1, the heat gain through windows of Model 2 and Model 3 drops up to 77.89% and 77.97% (south-facing windows), while the heat loss of the two models declines up to 79.28% and 79.32% (south-facing windows), respectively.
On the other side, based on the peak office hour electricity price of 1.4 CNY/kWh for cooling and 0.25 CNY/kWh for heating from the Beijing authority, the simple payback period (See Figure 28) when applying the product to the west, east, and south façade is calculated to be 3.8, 4.6 and 5.3 years compared to the single-pane PV glazing. The payback periods are increased to 4.5, 5.4 and 6.5 years when compared with double-pane PV glazing as shown in Figure 29.
As a result, the product can be considered as a cost-effective application in building facades when considering its tremendous saving of air-conditioning energy and corresponding annual expenses. In addition, the property developer could also benefit from a potential increment in renting rates and popularity, if the building gets certified under a green building scheme by claiming credits in CO2 reduction and renewable application assessment criteria. All the abovementioned potential benefits with the application of the vacuum PV glazing would attract more attention from the construction industry.
3.4 Brief technical guideline for the vacuum PV glazingDesigning the vacuum PV glazing (i.e. vacuum BIPV curtain wall) system is a more complex process than a standard added-on PV system. The architectural context, structural requirements, economic considerations and building regulation requirements should all be considered, so that this brief guidance mainly focuses on the below aspects: design strategy, environmental variables, multifunctionality, installation situation, electrical components, and economic aspects (Polysolar Limited, 2015).
(1) Design strategy
Architects, property developers and building users become more inclined to consider renewable and energy efficient applications to meet building and planning regulations due to rising energy bills and awareness of environmental sustainability. The combination of PV and vacuum glazing is an innovative and promising solution to meet these requirements in the new building developments or refurbishment projects. As proved in the above sections of this report, the developed product offers the added advantage of providing a return of investment from the building envelope. Architectural and structural factors, as well as economic considerations should be taken into account at an early stage in any building projects to integrate renewable systems through a more satisfactory approach.
(2) Environmental variables
When designing a BIPV system, a compromise must be reached between the requirements of energy yield optimisation and those of the architectural environment. Therefore, the orientation, lighting performance, shading and temperature are the four mainly concerned issues in BIPV design. According to simulation and experimental results presented in the above sections, the optimal orientation of the installed PV glazing should be south for maximizing the annual power generation, while cooling load reduction is more conspicuous when the product is applied on the west and east facades. Therefore, it is preferable to install the product on all three facades for an optimal overall building energy-saving performance. The visible light transmittance is only 12% in the developed prototype, which might cause slightly more lighting power consumption compared to traditional double-pane clear glazing. However, the transmittance can be easily adjusted to higher than 20% in the manufacture process depending on the effective area of PV materials. There will always be a trade-off between power generation and permeable light, whereas this research has proved that the combined power generation and cooling load reduction can be more than the increased lighting energy use. Power generation performance of the a-Si PV is less sensitive to shadings, so that the prototype is subject to less influence from peripheral shadings. However, if we change the PV material to c-Si for higher conversion efficiency, a shading calculation should be conducted before allocating the BIPV glazing. Lastly, the conversion efficiency of a-Si glazing is also less sensitive to the increase of the panel temperature. The temperature coefficient must be considered if changing the PV material to c-Si.
The vacuum PV glazing was made by sandwiching a layer of PVB between an external PV laminated glass with a visible light transmittance of 12% and an internal vacuum glass. A low-e coating was also adopted to enhance its thermal performance. The structure of the vacuum PV glazing is shown in Figure 5. The dimension of the vacuum PV glazing is 1300 mm (width) × 1100 mm (height) × 20.87 mm (thickness), thinner than commonly used PV double glazed insulating glass units. Figure 6 presents the pictures of the sample of vacuum PV glazing.
This section presents the main findings and outcomes of the research project and indicates their potential impacts on the local energy use and construction industry. Achievements of the specified research objectives are illustrated, and limitations of the project are also mentioned for the reference of future studies.
3.1 Design and production of the prototype productInitially, we proposed a prototype design as specified by Figure 2, where the vacuum layer was directly coupled with the laminated PV panel. However, during initial manufacture trials, the air pressure difference between internal and external spaces of the vacuum glass samples produced by the laminating machine caused the breakage of the vacuum glass samples. Then, we followed an alternative approach using pre-pressure furnace, whereas the molten state of the polyvinyl butyral (PVB) could not meet the expected requirements and the bubbles greatly impacted the appearance and performance of PV module. Finally, we proposed the current product design based on the experience acquired from previous failures (See Figure 5).
The electrical specifications of the vacuum PV glazing under standard test conditions (STC: air mass 1.5, solar irradiation 1000 W/m2 and cell temperature 25°C) are shown in Table 2. Table 3 presents the given thermal and optical properties of the PV laminated glass and vacuum glass, respectively.
0
Date
Sola
r rad
iatio
n (W
/m2 )
09/25 06:0009/26 06:00
09/27 06:0009/28 06:00
09/29 06:0009/30 06:00
500
1000
Exterior incident solar irradiationIncident solar irradiation of vacuum PVIncident solar irradiation of double-pane
Figure 15 The incident solar irradiation of vacuum PV glazing and double-pane glass
(3) Multi-functionality
Due to their mechanical structures, the PV vacuum glazing can perform the functions of the building envelope in addition to generating emission-free energy, and can thus substitute for conventional construction windows or curtain walls. Apart from power generation and architectural function, the product can provide solar shading with its low SHGC value. It can also act as thermal and sound insulation due to its low U-value and acoustic resistance caused by the vacuum chamber between glazing layers. If applied with special coatings/films on top of PV glazing, it can also provide weather protection.
(4) Mounting system and installation
Based on specific requirements of each project in each region, safety, loading capacity and PV installation specifications can have a decisive impact on the method of fixing/mounting the vacuum. We have in this guide attempted to provide a range of options, highlighting what is possible in current design. The product can be installed with a linear mounting system as mullion-transom facades or structural sealant glazing. It can also be mounted with point-fixing systems including clamp fixings and undercut anchor fixings or mounted into standard curtain walling, rain screen cladding and window systems.
(5) Electrical system
In the curtain wall system, several PV glazing with standard size are usually connected together in a string to form the power generator. The generated direct current is usually fed to an inverter where the direct current is converted to alternating current. If on-site storage is not available, which is the common case in urban areas, the electrical power is registered via an electricity meter and connected to the public supply grid, which will require special permissions from the power grid companies (e.g. CLP in Hong Kong). Therefore, the application of the product will require a full set of electrical systems including cables and connections for parallel or series arrays, direct current load-break switches, inverters and generation meters.
(6) Economic considerations
The economic benefits of the product mainly lie in the following aspects: the substitute for original construction component, CO2 emission reduction and corresponding electricity fee waving, compliance with relevant building regulations (i.e. BEAM Plus in Hong Kong) and application of the feed-in-tariff policy (remuneration for electricity generation from PV).
temperature measurements were conducted through the centre of the vacuum PV sample to calculate the U-value. Secondly, the solar heat gains coefficient (SHGC) of the vacuum PV glazing sample was obtained and compared with three other advanced glazing types in an indoor solar irradiation test. Lastly, an outdoor test was conducted on the platform of Block Z in The Hong Kong Polytechnic University to evaluate the overall thermal performance of vacuum PV glazing. A conventional double clear pane glazing was used as a baseline in the outdoor test.
surfaces shows a similar trend in the three directions. Summing up electricity generation in all floors, the integrated PV modules in Model 2 and 3 can provide 285074.72 kWh/year and 355226.3 kWh/year, which accounts for 13.27% and 16.54% of the total building energy consumption of Model 1. Therefore, given the energy use reduction due to less external heat gain, using the vacuum BIPV glazing can save 27.74% (Model 3) electricity compared to a reference building.

Investigation on the Thermal and Power Performance of Vacuum BIPV Curtain Wall Technology and its Application Potential in Buildings in Hong Kong
20
The comparison of building energy between Model 1, Model 2 and Model 3 is summarized in Table 6, which includes energy use of lighting, equipment, district cooling and district heating. Although Model 2 and Model 3 consume slightly more lighting energy due to the reduced visible transmittance of the PV glazing, the great energy saving in cooling and heating leads to the net reduction in the total building energy consumption. The total energy consumption of the Model 2 and 3 declines by 20.77 and 22.37 kWh/m2, accounting for 10.44% and 11.20% of Model 1 respectively. Generated electricity of windows and walls in three directions is also presented in Table 7. The south window produced the most electricity, 1527.13 kWh for Model 2 and 3203.76 kWh for Model 3 in a year, taking up nearly 47.80% the total electricity generated by windows. As for the west window, the electricity generated in a year is close to that of east window. Electricity generated by wall
3.2 Experimental study of the vacuum PV glazingOutdoor experimental test was first conducted on the developed prototype vacuum PV (VPV) glazing with the standard size (1.1m × 1.3m), whose various parameters including the ambient air temperature, incident solar irradiation, surface temperatures of the vacuum PV glazing as well as the I-V curves and the power generation were measured and recorded. The power generation and thermal performances of the prototype were also analysed during the test. To further justify the advantage of the vacuum PV glazing, experimental studies were carried out to compare the thermal performance of scaled-down samples (0.3m × 0.3m) with other advanced windows.
(1) Energy performance of the prototypeIn order to evaluate the energy performance of the vacuum PV glazing, an outdoor field measurement was conducted on the platform of Block Z in The Hong Kong Polytechnic University. The vacuum PV glazing was set up horizontally 0.4m above the floor on stilts so that the external temperatures of both sides of the vacuum PV glazing were approximately equal. Various parameters were measured during this test, including the ambient air temperature, the exterior and transmitted horizontal incident solar irradiation, the outer and inner surface temperatures of the vacuum PV glazing as well as the I-V curves and the power generation from the vacuum PV glazing. All the data was logged at an interval of 1 minute. Power generation and thermal performances of the vacuum PV glazing were analyzed based on the outdoor tests. Figure 7 shows the exterior and transmitted incident solar irradiation. It can be seen that the average solar irradiation transmittance during the period is approximately 0.08. Such low transmittance means that vast majority of solar irradiation is blocked by the vacuum PV glazing. Figure 8 presents the outer and inner surface temperature of the vacuum PV glazing. It can be seen that the outer surface temperature is much higher than the inner surface temperature at daytime. The maximum outer surface temperature is 75.3°C, 30°C higher than the inner surface temperature, which indicates that most of the waste heat is dissipated from the outside surface of the vacuum PV glazing, and the heat transfer to the inside space by convection is mitigated. Thus, compared with the conventional single-glazed PV glazing, the structure of the vacuum PV glazing can help reduce the cooling load and improve the indoor thermal comfort.
Then the vacuum PV glazing was mounted on the front side of an experimental test chamber as shown in Figure 9. Clear glass was also adopted in this study for comparison. Figure 10 presents the instantaneous power output of the vacuum PV glazing in 2 sunny days. It can be seen that the power generation from the vacuum PV glazing is consistent with incident solar radiation. A comparative study in terms of internal air temperature of the chamber between the vacuum PV glazing and the clear glass was conducted in a day of June.
As shown in Figure 11, the internal air temperature in the chamber with the vacuum PV glazing is much lower than that with a clear glass. The measured average and maximum internal air temperature for the vacuum PV glazing is 39.6°C and 40.3°C, respectively, while the corresponding average and maximum internal air temperature of the clear glass are 43.6°C and 44.7°C. The maximum internal air temperature difference between the vacuum PV glazing and the clear glass is 4.4°C, occurring in the morning. There are three temperature peaks of internal air temperature. Since the ambient temperature was relatively stable, the main heat gain of the internal air temperature was from incident solar irradiation. The internal air temperature for vacuum PV glazing is much more stable compared with that for the clear glass. The reason is that the vacuum PV glazing has better heat insulation performance so that the internal air temperature is not affected by the external environment significantly. It can also be seen in this figure that the internal air temperature of the chamber drops continuously at 15:00, which shows that the incident solar irradiation on the façade decreases so that the heat gains of the internal air from the sun also drops.
(2) Comparison with other advanced windows
To further justify the advantage of the vacuum PV glazing, experimental studies were carried out to compare it with other advanced windows. Samples of different types of glazing were mounted on the top of two hotboxes (i.e. test rigs) with the uniform dimension of 300 mm (L) × 300 mm (W) × 450mm (H) to implement both indoor and outdoor tests. Firstly, a co-heating test methodology was adopted for the thermal analysis of the vacuum PV glazing. The test rig was filled with the ice-water mixture to ensure the temperature difference between the inside and outside glazing surfaces larger than 5°C. Heat flux and
Figure 12 shows the internal and external temperatures of the vacuum PV glazing sample. The presented data were selected after the hotbox achieved the steady-state condition, when the temperature difference was around 8°C. Heat flux though the glazing sample and the U-value were then determined as illustrated in Figure 13. The average heat flux from the vacuum glazing was measured to be 15.4 W/m2. And the average U-value was calculated as 1.5 W/m2 × K which is much lower than a regular double pane window with the U-value of 2.5W/m2 × K. Considering the edge heat transfer which would strongly affect the heat flux measurement when the sample is small, it can be expected that the centre U-valve of the vacuum PV glazing should be lower than 1.5 W/m2 × K for a larger scale application (e.g. 1.1m × 1.3m).
(3) Cost effective analysis based on simulation
To address the economic benefits of the developed product, the simple payback period of the vacuum PV glazing is calculated with reference to available PV glazing on the market in both Hong Kong and Beijing’s scenarios.
Based on an average electricity price of 1.25 HKD/kWh from HK Electric, the simple payback period (See Figure 26) when applying the product to the west and east façade is calculated to be 7.5 and 8.0 years compared to the single-pane PV glazing. The payback periods are increased to 8.6 and 8.8 years when compared with double-pane PV glazing as shown in Figure 27. However, when applied to the south façade, the extra initial cost of the product cannot be recovered within 10 years.
The solar simulator in the laboratory can provide relatively steady horizontal incident solar irradiation, so that test rigs were located at the same spot to ensure each window sample exposed to the same radiation level. As shown in Figure 14, SHGCs of the vacuum PV glazing and double-pane PV glazing are much smaller than those of the vacuum glazing and double clear glazing, because the coupled PV module can absorb most of the solar irradiation. The vacuum PV glazing has the lowest SHGC of 0.10 which can act as the excellent thermal insulation.
The outdoor test lasted four days from September 26th to September 30th. As shown in Figure 15, September 26th, 27th and 30th were cloudy days and September 28th could be considered as a sunny day. It can be found that the vacuum PV glazing blocks most solar irradiation compared with the double-pane glazing. Figure 16 presents the temperature profile of the vacuum PV glazing and double-pane glazing in the sunny day. The internal surface temperature of both glazing was much higher than the ambient temperature when the outside incident solar radiation is strong. The internal glazing surface and air temperatures of the test rig with the vacuum PV glazing are lower than those of the test rig with the double-pane glazing. The difference between the internal air temperatures of test rigs is much smaller than that of internal glazing surface temperatures. Therefore, the application of vacuum PV glazing can achieve better indoor environment by reducing the solar heat gain.
3.3 Simulation study of the vacuum PV glazing(1) Simulation of a generic building model
Although a series of field tests have been conducted in the outdoor test bed to study the power and thermal performances of the vacuum BIPV glazing, the experimental scenarios are impossible to represent all the situations and variables. Thus, the numerical study was conducted to comprehensively investigate and compare the energy performance of the vacuum PV glazing and other commonly used energy-efficient glazing. As detailed in the research methodology, a comprehensive simulation model based on EnergyPlus and WINDOW has been developed to simulate the overall energy performance of different windows taking into account of their thermal and power output performance. This model is used to simulate the overall energy performance of the vacuum BIPV curtain wall in comparison with other commonly used windows. The key properties of different types of glazing are shown in Table 4 and the electrical specifications of the PV glazing under standard test conditions are referenced to Table 2.
In order to simulate the annual thermal performance and power performance of these types of glazing in Hong Kong for comparison purpose, a typical office room model has been created for simulation, as shown in Figure 17. The dimension of the office model was 2.5m × 2.3m × 2.5m (L × W × H). This room has only one external wall with three identical windows exposed to the outdoor environment. Simulations were conducted for different orientations, i.e. south (S), east (E), west (W) and north (N). A heat transfer model and PV performance model in EnergyPlus are adopted to investigate
the thermal and power performance of different glazing. The heat transfer model is used to calculate the cooling loads of the office room. The cooling loads are then converted to electricity use of air-conditioning system with a presumed coefficient of performance (COP) of 2.78. The equivalent one-diode model is selected to simulate the annual electricity generation from PV elements. The typical meteorological year (TMY) in Hong Kong is selected a reasonable representation of local climates.
The annual cooling electricity use of different types of glazing in different orientations in Hong Kong are shown in Figure 18. It can be observed that the room using vacuum PV glazing consumes the least cooling electricity for all orientations. The south facing room with vacuum PV glazing consumes about 705.56 kWh per year, which was approximately 14.2%, 9.8%, 8.4%, 7.1% and 4.1% less than the corresponding room with single-pane clear glazing, double-pane clear glazing, vacuum glazing, single-pane PV glazing and double-pane PV glazing, respectively. This is because the vacuum PV glazing have the lowest U-value and SHGC among all types of glazing, as shown in Table 4.3. A lower U-value indicates a higher level of heat insulation performance of the glazing, and a lower SHGC means less solar radiation will pass through the windows. Therefore, the vacuum PV glazing performs the best in the area with big temperature difference between indoor and outdoor environment. In addition, the most cooling electricity use of the office room occurs at the west orientation, followed by east, south and north. Therefore, east and west facing windows should have better solar heat insulation performance, to reduce heat gains from outside environment.
In addition to reduce the cooling load of the office room, the PV glazing can also generate electricity in situ. The annual electricity generation of the three types of PV glazing are shown in Figure 19. It can be seen that the annual electricity generation of the three types of PV glazing is similar to each other. The electricity generation from the vacuum PV glazing is a little less than the single-pane PV glazing due to increased solar cell temperature. However, since the temperature coefficient of the thin-film a-Si solar cells is small, the PV conversion efficiency is not reduced significantly. The annual electricity generation from a-Si PV glazing with 12.0% transmittance is around 113.81 kWh per year. Among all orientations, it is better to install PV glazing on the south facade in order to maximize the electricity output in Hong Kong. And it is not recommended to apply PV glazing on north façade due to limited solar radiation available.
Based on the results above, the vacuum PV glazing not only has the best thermal performance among all types of widely used glazing, but also produces a considerable amount of electricity per year. It is recommended to install vacuum PV glazing on south facade to perform the best overall energy performance.
(2) Simulation of the whole building
Apart from modelling studies conducted under the hot and humid climate of Hong Kong, the annual energy performance of different types of glazing in a cold region (i.e. Beijing) was also simulated for comparison. Simulation results are shown in Figure 20 and Figure 21. It can be observed that the room using the vacuum PV glazing achieves the lowest cooling consumption in both climates. In Beijing, the consumed cooling energy with the vacuum PV glazing is much smaller and is 30.2%, 20.8%, 17.0%, 13.8%, 4.4% less than that of the room with other types of glazing. It can be concluded that the energy saving potential of the vacuum PV glazing is much larger in a cold climate while the electricity generation is much higher during the summer time of Beijing due to the smaller solar incidence angle.
The developed simulation model was further applied to a 20-floor prototype office building. Typical floors of the building are divided into 5 conditioned zones, with a total floor area of 540 m2 (as shown in Figure 22). The reference case – Model 1 keeps all windows as the commonly used double-pane clear glazing, while the design cases include Model 2 and Model 3. Model 2 keeps the north-facing window as the conventional double-pane glazing while changes windows orientated to the other three directions to the developed vacuum PV glazing. The opaque part of all building facades is assumed to be covered with traditional crystalline BIPV with a power conversion efficiency of 15% to maximize the power generation potential of the building envelope. Model 3 shares similar settings with Model 2, except that the window transparency is tuned to 20% with a crystalline silicon (c-Si) as shown in Figure 23. Table 5 shows detailed settings of window properties for the three models respectively. The U-value and SHGC of a-Si vacuum PV glazing are obtained from previous experiments and those of double-pane clear glazing are calculated by the simulation software WINDOW. Thermal and power generation properties of c-Si vacuum PV glazing are obtained from existing literatures.
The simulation results of the total heat gain and loss through all windows are presented in Figure 24 and Figure 25. The heat gain and loss both decrease sharply when traditional double-pane clear glazing is replaced by the PV vacuum glazing. The obvious differences between these three models can be identified from the figures. Compared with the performance of Model 1, the heat gain through windows of Model 2 and Model 3 drops up to 77.89% and 77.97% (south-facing windows), while the heat loss of the two models declines up to 79.28% and 79.32% (south-facing windows), respectively.
On the other side, based on the peak office hour electricity price of 1.4 CNY/kWh for cooling and 0.25 CNY/kWh for heating from the Beijing authority, the simple payback period (See Figure 28) when applying the product to the west, east, and south façade is calculated to be 3.8, 4.6 and 5.3 years compared to the single-pane PV glazing. The payback periods are increased to 4.5, 5.4 and 6.5 years when compared with double-pane PV glazing as shown in Figure 29.
As a result, the product can be considered as a cost-effective application in building facades when considering its tremendous saving of air-conditioning energy and corresponding annual expenses. In addition, the property developer could also benefit from a potential increment in renting rates and popularity, if the building gets certified under a green building scheme by claiming credits in CO2 reduction and renewable application assessment criteria. All the abovementioned potential benefits with the application of the vacuum PV glazing would attract more attention from the construction industry.
3.4 Brief technical guideline for the vacuum PV glazingDesigning the vacuum PV glazing (i.e. vacuum BIPV curtain wall) system is a more complex process than a standard added-on PV system. The architectural context, structural requirements, economic considerations and building regulation requirements should all be considered, so that this brief guidance mainly focuses on the below aspects: design strategy, environmental variables, multifunctionality, installation situation, electrical components, and economic aspects (Polysolar Limited, 2015).
(1) Design strategy
Architects, property developers and building users become more inclined to consider renewable and energy efficient applications to meet building and planning regulations due to rising energy bills and awareness of environmental sustainability. The combination of PV and vacuum glazing is an innovative and promising solution to meet these requirements in the new building developments or refurbishment projects. As proved in the above sections of this report, the developed product offers the added advantage of providing a return of investment from the building envelope. Architectural and structural factors, as well as economic considerations should be taken into account at an early stage in any building projects to integrate renewable systems through a more satisfactory approach.
(2) Environmental variables
When designing a BIPV system, a compromise must be reached between the requirements of energy yield optimisation and those of the architectural environment. Therefore, the orientation, lighting performance, shading and temperature are the four mainly concerned issues in BIPV design. According to simulation and experimental results presented in the above sections, the optimal orientation of the installed PV glazing should be south for maximizing the annual power generation, while cooling load reduction is more conspicuous when the product is applied on the west and east facades. Therefore, it is preferable to install the product on all three facades for an optimal overall building energy-saving performance. The visible light transmittance is only 12% in the developed prototype, which might cause slightly more lighting power consumption compared to traditional double-pane clear glazing. However, the transmittance can be easily adjusted to higher than 20% in the manufacture process depending on the effective area of PV materials. There will always be a trade-off between power generation and permeable light, whereas this research has proved that the combined power generation and cooling load reduction can be more than the increased lighting energy use. Power generation performance of the a-Si PV is less sensitive to shadings, so that the prototype is subject to less influence from peripheral shadings. However, if we change the PV material to c-Si for higher conversion efficiency, a shading calculation should be conducted before allocating the BIPV glazing. Lastly, the conversion efficiency of a-Si glazing is also less sensitive to the increase of the panel temperature. The temperature coefficient must be considered if changing the PV material to c-Si.
The vacuum PV glazing was made by sandwiching a layer of PVB between an external PV laminated glass with a visible light transmittance of 12% and an internal vacuum glass. A low-e coating was also adopted to enhance its thermal performance. The structure of the vacuum PV glazing is shown in Figure 5. The dimension of the vacuum PV glazing is 1300 mm (width) × 1100 mm (height) × 20.87 mm (thickness), thinner than commonly used PV double glazed insulating glass units. Figure 6 presents the pictures of the sample of vacuum PV glazing.
This section presents the main findings and outcomes of the research project and indicates their potential impacts on the local energy use and construction industry. Achievements of the specified research objectives are illustrated, and limitations of the project are also mentioned for the reference of future studies.
3.1 Design and production of the prototype productInitially, we proposed a prototype design as specified by Figure 2, where the vacuum layer was directly coupled with the laminated PV panel. However, during initial manufacture trials, the air pressure difference between internal and external spaces of the vacuum glass samples produced by the laminating machine caused the breakage of the vacuum glass samples. Then, we followed an alternative approach using pre-pressure furnace, whereas the molten state of the polyvinyl butyral (PVB) could not meet the expected requirements and the bubbles greatly impacted the appearance and performance of PV module. Finally, we proposed the current product design based on the experience acquired from previous failures (See Figure 5).
The electrical specifications of the vacuum PV glazing under standard test conditions (STC: air mass 1.5, solar irradiation 1000 W/m2 and cell temperature 25°C) are shown in Table 2. Table 3 presents the given thermal and optical properties of the PV laminated glass and vacuum glass, respectively.
25
00:00 12:00 00:00Time
Tem
pera
ture
(°C
)
30
35
40
50
55
60
70
65
45
Temperature of test rig with vacuum PVInternal surface temperature of vacuum PV
Internal surface temperature of double-paneAmbient temperature
Temperature of test rig with double-pane
Figure 16 The sunny day temperature profile of vacuum PV glazing and double-pane glass
(3) Multi-functionality
Due to their mechanical structures, the PV vacuum glazing can perform the functions of the building envelope in addition to generating emission-free energy, and can thus substitute for conventional construction windows or curtain walls. Apart from power generation and architectural function, the product can provide solar shading with its low SHGC value. It can also act as thermal and sound insulation due to its low U-value and acoustic resistance caused by the vacuum chamber between glazing layers. If applied with special coatings/films on top of PV glazing, it can also provide weather protection.
(4) Mounting system and installation
Based on specific requirements of each project in each region, safety, loading capacity and PV installation specifications can have a decisive impact on the method of fixing/mounting the vacuum. We have in this guide attempted to provide a range of options, highlighting what is possible in current design. The product can be installed with a linear mounting system as mullion-transom facades or structural sealant glazing. It can also be mounted with point-fixing systems including clamp fixings and undercut anchor fixings or mounted into standard curtain walling, rain screen cladding and window systems.
(5) Electrical system
In the curtain wall system, several PV glazing with standard size are usually connected together in a string to form the power generator. The generated direct current is usually fed to an inverter where the direct current is converted to alternating current. If on-site storage is not available, which is the common case in urban areas, the electrical power is registered via an electricity meter and connected to the public supply grid, which will require special permissions from the power grid companies (e.g. CLP in Hong Kong). Therefore, the application of the product will require a full set of electrical systems including cables and connections for parallel or series arrays, direct current load-break switches, inverters and generation meters.
(6) Economic considerations
The economic benefits of the product mainly lie in the following aspects: the substitute for original construction component, CO2 emission reduction and corresponding electricity fee waving, compliance with relevant building regulations (i.e. BEAM Plus in Hong Kong) and application of the feed-in-tariff policy (remuneration for electricity generation from PV).
temperature measurements were conducted through the centre of the vacuum PV sample to calculate the U-value. Secondly, the solar heat gains coefficient (SHGC) of the vacuum PV glazing sample was obtained and compared with three other advanced glazing types in an indoor solar irradiation test. Lastly, an outdoor test was conducted on the platform of Block Z in The Hong Kong Polytechnic University to evaluate the overall thermal performance of vacuum PV glazing. A conventional double clear pane glazing was used as a baseline in the outdoor test.
surfaces shows a similar trend in the three directions. Summing up electricity generation in all floors, the integrated PV modules in Model 2 and 3 can provide 285074.72 kWh/year and 355226.3 kWh/year, which accounts for 13.27% and 16.54% of the total building energy consumption of Model 1. Therefore, given the energy use reduction due to less external heat gain, using the vacuum BIPV glazing can save 27.74% (Model 3) electricity compared to a reference building.

21 Construction Industry Council
The comparison of building energy between Model 1, Model 2 and Model 3 is summarized in Table 6, which includes energy use of lighting, equipment, district cooling and district heating. Although Model 2 and Model 3 consume slightly more lighting energy due to the reduced visible transmittance of the PV glazing, the great energy saving in cooling and heating leads to the net reduction in the total building energy consumption. The total energy consumption of the Model 2 and 3 declines by 20.77 and 22.37 kWh/m2, accounting for 10.44% and 11.20% of Model 1 respectively. Generated electricity of windows and walls in three directions is also presented in Table 7. The south window produced the most electricity, 1527.13 kWh for Model 2 and 3203.76 kWh for Model 3 in a year, taking up nearly 47.80% the total electricity generated by windows. As for the west window, the electricity generated in a year is close to that of east window. Electricity generated by wall
3.2 Experimental study of the vacuum PV glazingOutdoor experimental test was first conducted on the developed prototype vacuum PV (VPV) glazing with the standard size (1.1m × 1.3m), whose various parameters including the ambient air temperature, incident solar irradiation, surface temperatures of the vacuum PV glazing as well as the I-V curves and the power generation were measured and recorded. The power generation and thermal performances of the prototype were also analysed during the test. To further justify the advantage of the vacuum PV glazing, experimental studies were carried out to compare the thermal performance of scaled-down samples (0.3m × 0.3m) with other advanced windows.
(1) Energy performance of the prototypeIn order to evaluate the energy performance of the vacuum PV glazing, an outdoor field measurement was conducted on the platform of Block Z in The Hong Kong Polytechnic University. The vacuum PV glazing was set up horizontally 0.4m above the floor on stilts so that the external temperatures of both sides of the vacuum PV glazing were approximately equal. Various parameters were measured during this test, including the ambient air temperature, the exterior and transmitted horizontal incident solar irradiation, the outer and inner surface temperatures of the vacuum PV glazing as well as the I-V curves and the power generation from the vacuum PV glazing. All the data was logged at an interval of 1 minute. Power generation and thermal performances of the vacuum PV glazing were analyzed based on the outdoor tests. Figure 7 shows the exterior and transmitted incident solar irradiation. It can be seen that the average solar irradiation transmittance during the period is approximately 0.08. Such low transmittance means that vast majority of solar irradiation is blocked by the vacuum PV glazing. Figure 8 presents the outer and inner surface temperature of the vacuum PV glazing. It can be seen that the outer surface temperature is much higher than the inner surface temperature at daytime. The maximum outer surface temperature is 75.3°C, 30°C higher than the inner surface temperature, which indicates that most of the waste heat is dissipated from the outside surface of the vacuum PV glazing, and the heat transfer to the inside space by convection is mitigated. Thus, compared with the conventional single-glazed PV glazing, the structure of the vacuum PV glazing can help reduce the cooling load and improve the indoor thermal comfort.
Then the vacuum PV glazing was mounted on the front side of an experimental test chamber as shown in Figure 9. Clear glass was also adopted in this study for comparison. Figure 10 presents the instantaneous power output of the vacuum PV glazing in 2 sunny days. It can be seen that the power generation from the vacuum PV glazing is consistent with incident solar radiation. A comparative study in terms of internal air temperature of the chamber between the vacuum PV glazing and the clear glass was conducted in a day of June.
As shown in Figure 11, the internal air temperature in the chamber with the vacuum PV glazing is much lower than that with a clear glass. The measured average and maximum internal air temperature for the vacuum PV glazing is 39.6°C and 40.3°C, respectively, while the corresponding average and maximum internal air temperature of the clear glass are 43.6°C and 44.7°C. The maximum internal air temperature difference between the vacuum PV glazing and the clear glass is 4.4°C, occurring in the morning. There are three temperature peaks of internal air temperature. Since the ambient temperature was relatively stable, the main heat gain of the internal air temperature was from incident solar irradiation. The internal air temperature for vacuum PV glazing is much more stable compared with that for the clear glass. The reason is that the vacuum PV glazing has better heat insulation performance so that the internal air temperature is not affected by the external environment significantly. It can also be seen in this figure that the internal air temperature of the chamber drops continuously at 15:00, which shows that the incident solar irradiation on the façade decreases so that the heat gains of the internal air from the sun also drops.
(2) Comparison with other advanced windows
To further justify the advantage of the vacuum PV glazing, experimental studies were carried out to compare it with other advanced windows. Samples of different types of glazing were mounted on the top of two hotboxes (i.e. test rigs) with the uniform dimension of 300 mm (L) × 300 mm (W) × 450mm (H) to implement both indoor and outdoor tests. Firstly, a co-heating test methodology was adopted for the thermal analysis of the vacuum PV glazing. The test rig was filled with the ice-water mixture to ensure the temperature difference between the inside and outside glazing surfaces larger than 5°C. Heat flux and
Figure 12 shows the internal and external temperatures of the vacuum PV glazing sample. The presented data were selected after the hotbox achieved the steady-state condition, when the temperature difference was around 8°C. Heat flux though the glazing sample and the U-value were then determined as illustrated in Figure 13. The average heat flux from the vacuum glazing was measured to be 15.4 W/m2. And the average U-value was calculated as 1.5 W/m2 × K which is much lower than a regular double pane window with the U-value of 2.5W/m2 × K. Considering the edge heat transfer which would strongly affect the heat flux measurement when the sample is small, it can be expected that the centre U-valve of the vacuum PV glazing should be lower than 1.5 W/m2 × K for a larger scale application (e.g. 1.1m × 1.3m).
(3) Cost effective analysis based on simulation
To address the economic benefits of the developed product, the simple payback period of the vacuum PV glazing is calculated with reference to available PV glazing on the market in both Hong Kong and Beijing’s scenarios.
Based on an average electricity price of 1.25 HKD/kWh from HK Electric, the simple payback period (See Figure 26) when applying the product to the west and east façade is calculated to be 7.5 and 8.0 years compared to the single-pane PV glazing. The payback periods are increased to 8.6 and 8.8 years when compared with double-pane PV glazing as shown in Figure 27. However, when applied to the south façade, the extra initial cost of the product cannot be recovered within 10 years.
The solar simulator in the laboratory can provide relatively steady horizontal incident solar irradiation, so that test rigs were located at the same spot to ensure each window sample exposed to the same radiation level. As shown in Figure 14, SHGCs of the vacuum PV glazing and double-pane PV glazing are much smaller than those of the vacuum glazing and double clear glazing, because the coupled PV module can absorb most of the solar irradiation. The vacuum PV glazing has the lowest SHGC of 0.10 which can act as the excellent thermal insulation.
The outdoor test lasted four days from September 26th to September 30th. As shown in Figure 15, September 26th, 27th and 30th were cloudy days and September 28th could be considered as a sunny day. It can be found that the vacuum PV glazing blocks most solar irradiation compared with the double-pane glazing. Figure 16 presents the temperature profile of the vacuum PV glazing and double-pane glazing in the sunny day. The internal surface temperature of both glazing was much higher than the ambient temperature when the outside incident solar radiation is strong. The internal glazing surface and air temperatures of the test rig with the vacuum PV glazing are lower than those of the test rig with the double-pane glazing. The difference between the internal air temperatures of test rigs is much smaller than that of internal glazing surface temperatures. Therefore, the application of vacuum PV glazing can achieve better indoor environment by reducing the solar heat gain.
3.3 Simulation study of the vacuum PV glazing(1) Simulation of a generic building model
Although a series of field tests have been conducted in the outdoor test bed to study the power and thermal performances of the vacuum BIPV glazing, the experimental scenarios are impossible to represent all the situations and variables. Thus, the numerical study was conducted to comprehensively investigate and compare the energy performance of the vacuum PV glazing and other commonly used energy-efficient glazing. As detailed in the research methodology, a comprehensive simulation model based on EnergyPlus and WINDOW has been developed to simulate the overall energy performance of different windows taking into account of their thermal and power output performance. This model is used to simulate the overall energy performance of the vacuum BIPV curtain wall in comparison with other commonly used windows. The key properties of different types of glazing are shown in Table 4 and the electrical specifications of the PV glazing under standard test conditions are referenced to Table 2.
In order to simulate the annual thermal performance and power performance of these types of glazing in Hong Kong for comparison purpose, a typical office room model has been created for simulation, as shown in Figure 17. The dimension of the office model was 2.5m × 2.3m × 2.5m (L × W × H). This room has only one external wall with three identical windows exposed to the outdoor environment. Simulations were conducted for different orientations, i.e. south (S), east (E), west (W) and north (N). A heat transfer model and PV performance model in EnergyPlus are adopted to investigate
the thermal and power performance of different glazing. The heat transfer model is used to calculate the cooling loads of the office room. The cooling loads are then converted to electricity use of air-conditioning system with a presumed coefficient of performance (COP) of 2.78. The equivalent one-diode model is selected to simulate the annual electricity generation from PV elements. The typical meteorological year (TMY) in Hong Kong is selected a reasonable representation of local climates.
The annual cooling electricity use of different types of glazing in different orientations in Hong Kong are shown in Figure 18. It can be observed that the room using vacuum PV glazing consumes the least cooling electricity for all orientations. The south facing room with vacuum PV glazing consumes about 705.56 kWh per year, which was approximately 14.2%, 9.8%, 8.4%, 7.1% and 4.1% less than the corresponding room with single-pane clear glazing, double-pane clear glazing, vacuum glazing, single-pane PV glazing and double-pane PV glazing, respectively. This is because the vacuum PV glazing have the lowest U-value and SHGC among all types of glazing, as shown in Table 4.3. A lower U-value indicates a higher level of heat insulation performance of the glazing, and a lower SHGC means less solar radiation will pass through the windows. Therefore, the vacuum PV glazing performs the best in the area with big temperature difference between indoor and outdoor environment. In addition, the most cooling electricity use of the office room occurs at the west orientation, followed by east, south and north. Therefore, east and west facing windows should have better solar heat insulation performance, to reduce heat gains from outside environment.
In addition to reduce the cooling load of the office room, the PV glazing can also generate electricity in situ. The annual electricity generation of the three types of PV glazing are shown in Figure 19. It can be seen that the annual electricity generation of the three types of PV glazing is similar to each other. The electricity generation from the vacuum PV glazing is a little less than the single-pane PV glazing due to increased solar cell temperature. However, since the temperature coefficient of the thin-film a-Si solar cells is small, the PV conversion efficiency is not reduced significantly. The annual electricity generation from a-Si PV glazing with 12.0% transmittance is around 113.81 kWh per year. Among all orientations, it is better to install PV glazing on the south facade in order to maximize the electricity output in Hong Kong. And it is not recommended to apply PV glazing on north façade due to limited solar radiation available.
Based on the results above, the vacuum PV glazing not only has the best thermal performance among all types of widely used glazing, but also produces a considerable amount of electricity per year. It is recommended to install vacuum PV glazing on south facade to perform the best overall energy performance.
(2) Simulation of the whole building
Apart from modelling studies conducted under the hot and humid climate of Hong Kong, the annual energy performance of different types of glazing in a cold region (i.e. Beijing) was also simulated for comparison. Simulation results are shown in Figure 20 and Figure 21. It can be observed that the room using the vacuum PV glazing achieves the lowest cooling consumption in both climates. In Beijing, the consumed cooling energy with the vacuum PV glazing is much smaller and is 30.2%, 20.8%, 17.0%, 13.8%, 4.4% less than that of the room with other types of glazing. It can be concluded that the energy saving potential of the vacuum PV glazing is much larger in a cold climate while the electricity generation is much higher during the summer time of Beijing due to the smaller solar incidence angle.
The developed simulation model was further applied to a 20-floor prototype office building. Typical floors of the building are divided into 5 conditioned zones, with a total floor area of 540 m2 (as shown in Figure 22). The reference case – Model 1 keeps all windows as the commonly used double-pane clear glazing, while the design cases include Model 2 and Model 3. Model 2 keeps the north-facing window as the conventional double-pane glazing while changes windows orientated to the other three directions to the developed vacuum PV glazing. The opaque part of all building facades is assumed to be covered with traditional crystalline BIPV with a power conversion efficiency of 15% to maximize the power generation potential of the building envelope. Model 3 shares similar settings with Model 2, except that the window transparency is tuned to 20% with a crystalline silicon (c-Si) as shown in Figure 23. Table 5 shows detailed settings of window properties for the three models respectively. The U-value and SHGC of a-Si vacuum PV glazing are obtained from previous experiments and those of double-pane clear glazing are calculated by the simulation software WINDOW. Thermal and power generation properties of c-Si vacuum PV glazing are obtained from existing literatures.
The simulation results of the total heat gain and loss through all windows are presented in Figure 24 and Figure 25. The heat gain and loss both decrease sharply when traditional double-pane clear glazing is replaced by the PV vacuum glazing. The obvious differences between these three models can be identified from the figures. Compared with the performance of Model 1, the heat gain through windows of Model 2 and Model 3 drops up to 77.89% and 77.97% (south-facing windows), while the heat loss of the two models declines up to 79.28% and 79.32% (south-facing windows), respectively.
On the other side, based on the peak office hour electricity price of 1.4 CNY/kWh for cooling and 0.25 CNY/kWh for heating from the Beijing authority, the simple payback period (See Figure 28) when applying the product to the west, east, and south façade is calculated to be 3.8, 4.6 and 5.3 years compared to the single-pane PV glazing. The payback periods are increased to 4.5, 5.4 and 6.5 years when compared with double-pane PV glazing as shown in Figure 29.
As a result, the product can be considered as a cost-effective application in building facades when considering its tremendous saving of air-conditioning energy and corresponding annual expenses. In addition, the property developer could also benefit from a potential increment in renting rates and popularity, if the building gets certified under a green building scheme by claiming credits in CO2 reduction and renewable application assessment criteria. All the abovementioned potential benefits with the application of the vacuum PV glazing would attract more attention from the construction industry.
3.4 Brief technical guideline for the vacuum PV glazingDesigning the vacuum PV glazing (i.e. vacuum BIPV curtain wall) system is a more complex process than a standard added-on PV system. The architectural context, structural requirements, economic considerations and building regulation requirements should all be considered, so that this brief guidance mainly focuses on the below aspects: design strategy, environmental variables, multifunctionality, installation situation, electrical components, and economic aspects (Polysolar Limited, 2015).
(1) Design strategy
Architects, property developers and building users become more inclined to consider renewable and energy efficient applications to meet building and planning regulations due to rising energy bills and awareness of environmental sustainability. The combination of PV and vacuum glazing is an innovative and promising solution to meet these requirements in the new building developments or refurbishment projects. As proved in the above sections of this report, the developed product offers the added advantage of providing a return of investment from the building envelope. Architectural and structural factors, as well as economic considerations should be taken into account at an early stage in any building projects to integrate renewable systems through a more satisfactory approach.
(2) Environmental variables
When designing a BIPV system, a compromise must be reached between the requirements of energy yield optimisation and those of the architectural environment. Therefore, the orientation, lighting performance, shading and temperature are the four mainly concerned issues in BIPV design. According to simulation and experimental results presented in the above sections, the optimal orientation of the installed PV glazing should be south for maximizing the annual power generation, while cooling load reduction is more conspicuous when the product is applied on the west and east facades. Therefore, it is preferable to install the product on all three facades for an optimal overall building energy-saving performance. The visible light transmittance is only 12% in the developed prototype, which might cause slightly more lighting power consumption compared to traditional double-pane clear glazing. However, the transmittance can be easily adjusted to higher than 20% in the manufacture process depending on the effective area of PV materials. There will always be a trade-off between power generation and permeable light, whereas this research has proved that the combined power generation and cooling load reduction can be more than the increased lighting energy use. Power generation performance of the a-Si PV is less sensitive to shadings, so that the prototype is subject to less influence from peripheral shadings. However, if we change the PV material to c-Si for higher conversion efficiency, a shading calculation should be conducted before allocating the BIPV glazing. Lastly, the conversion efficiency of a-Si glazing is also less sensitive to the increase of the panel temperature. The temperature coefficient must be considered if changing the PV material to c-Si.
The vacuum PV glazing was made by sandwiching a layer of PVB between an external PV laminated glass with a visible light transmittance of 12% and an internal vacuum glass. A low-e coating was also adopted to enhance its thermal performance. The structure of the vacuum PV glazing is shown in Figure 5. The dimension of the vacuum PV glazing is 1300 mm (width) × 1100 mm (height) × 20.87 mm (thickness), thinner than commonly used PV double glazed insulating glass units. Figure 6 presents the pictures of the sample of vacuum PV glazing.
This section presents the main findings and outcomes of the research project and indicates their potential impacts on the local energy use and construction industry. Achievements of the specified research objectives are illustrated, and limitations of the project are also mentioned for the reference of future studies.
3.1 Design and production of the prototype productInitially, we proposed a prototype design as specified by Figure 2, where the vacuum layer was directly coupled with the laminated PV panel. However, during initial manufacture trials, the air pressure difference between internal and external spaces of the vacuum glass samples produced by the laminating machine caused the breakage of the vacuum glass samples. Then, we followed an alternative approach using pre-pressure furnace, whereas the molten state of the polyvinyl butyral (PVB) could not meet the expected requirements and the bubbles greatly impacted the appearance and performance of PV module. Finally, we proposed the current product design based on the experience acquired from previous failures (See Figure 5).
The electrical specifications of the vacuum PV glazing under standard test conditions (STC: air mass 1.5, solar irradiation 1000 W/m2 and cell temperature 25°C) are shown in Table 2. Table 3 presents the given thermal and optical properties of the PV laminated glass and vacuum glass, respectively.
Table 4 Key properties of different types of glazing Glazing
Glass type Thickness
Tvis Tsol U-value
SHGC no. (mm) (W/m2·K)
I Single-pane clear glazing 5.7 0.884 0.771 5.541 0.817
II Double-pane clear glazing 24.1 0.786 0.607 2.631 0.703
III Vacuum glazing (low-e) 11.5 0.693 0.344 0.648 0.391
IV Single-pane PV glazing 8.0 0.153 0.268 5.254 0.489
V Double-pane PV glazing 25.7 0.136 0.195 2.584 0.354
VI Vacuum PV glazing 13.8 0.120 0.076 0.557 0.143
(3) Multi-functionality
Due to their mechanical structures, the PV vacuum glazing can perform the functions of the building envelope in addition to generating emission-free energy, and can thus substitute for conventional construction windows or curtain walls. Apart from power generation and architectural function, the product can provide solar shading with its low SHGC value. It can also act as thermal and sound insulation due to its low U-value and acoustic resistance caused by the vacuum chamber between glazing layers. If applied with special coatings/films on top of PV glazing, it can also provide weather protection.
(4) Mounting system and installation
Based on specific requirements of each project in each region, safety, loading capacity and PV installation specifications can have a decisive impact on the method of fixing/mounting the vacuum. We have in this guide attempted to provide a range of options, highlighting what is possible in current design. The product can be installed with a linear mounting system as mullion-transom facades or structural sealant glazing. It can also be mounted with point-fixing systems including clamp fixings and undercut anchor fixings or mounted into standard curtain walling, rain screen cladding and window systems.
(5) Electrical system
In the curtain wall system, several PV glazing with standard size are usually connected together in a string to form the power generator. The generated direct current is usually fed to an inverter where the direct current is converted to alternating current. If on-site storage is not available, which is the common case in urban areas, the electrical power is registered via an electricity meter and connected to the public supply grid, which will require special permissions from the power grid companies (e.g. CLP in Hong Kong). Therefore, the application of the product will require a full set of electrical systems including cables and connections for parallel or series arrays, direct current load-break switches, inverters and generation meters.
(6) Economic considerations
The economic benefits of the product mainly lie in the following aspects: the substitute for original construction component, CO2 emission reduction and corresponding electricity fee waving, compliance with relevant building regulations (i.e. BEAM Plus in Hong Kong) and application of the feed-in-tariff policy (remuneration for electricity generation from PV).
temperature measurements were conducted through the centre of the vacuum PV sample to calculate the U-value. Secondly, the solar heat gains coefficient (SHGC) of the vacuum PV glazing sample was obtained and compared with three other advanced glazing types in an indoor solar irradiation test. Lastly, an outdoor test was conducted on the platform of Block Z in The Hong Kong Polytechnic University to evaluate the overall thermal performance of vacuum PV glazing. A conventional double clear pane glazing was used as a baseline in the outdoor test.
surfaces shows a similar trend in the three directions. Summing up electricity generation in all floors, the integrated PV modules in Model 2 and 3 can provide 285074.72 kWh/year and 355226.3 kWh/year, which accounts for 13.27% and 16.54% of the total building energy consumption of Model 1. Therefore, given the energy use reduction due to less external heat gain, using the vacuum BIPV glazing can save 27.74% (Model 3) electricity compared to a reference building.

22Investigation on the Thermal and Power Performance of Vacuum BIPV Curtain Wall Technology and its Application Potential in Buildings in Hong Kong
The comparison of building energy between Model 1, Model 2 and Model 3 is summarized in Table 6, which includes energy use of lighting, equipment, district cooling and district heating. Although Model 2 and Model 3 consume slightly more lighting energy due to the reduced visible transmittance of the PV glazing, the great energy saving in cooling and heating leads to the net reduction in the total building energy consumption. The total energy consumption of the Model 2 and 3 declines by 20.77 and 22.37 kWh/m2, accounting for 10.44% and 11.20% of Model 1 respectively. Generated electricity of windows and walls in three directions is also presented in Table 7. The south window produced the most electricity, 1527.13 kWh for Model 2 and 3203.76 kWh for Model 3 in a year, taking up nearly 47.80% the total electricity generated by windows. As for the west window, the electricity generated in a year is close to that of east window. Electricity generated by wall
3.2 Experimental study of the vacuum PV glazingOutdoor experimental test was first conducted on the developed prototype vacuum PV (VPV) glazing with the standard size (1.1m × 1.3m), whose various parameters including the ambient air temperature, incident solar irradiation, surface temperatures of the vacuum PV glazing as well as the I-V curves and the power generation were measured and recorded. The power generation and thermal performances of the prototype were also analysed during the test. To further justify the advantage of the vacuum PV glazing, experimental studies were carried out to compare the thermal performance of scaled-down samples (0.3m × 0.3m) with other advanced windows.
(1) Energy performance of the prototypeIn order to evaluate the energy performance of the vacuum PV glazing, an outdoor field measurement was conducted on the platform of Block Z in The Hong Kong Polytechnic University. The vacuum PV glazing was set up horizontally 0.4m above the floor on stilts so that the external temperatures of both sides of the vacuum PV glazing were approximately equal. Various parameters were measured during this test, including the ambient air temperature, the exterior and transmitted horizontal incident solar irradiation, the outer and inner surface temperatures of the vacuum PV glazing as well as the I-V curves and the power generation from the vacuum PV glazing. All the data was logged at an interval of 1 minute. Power generation and thermal performances of the vacuum PV glazing were analyzed based on the outdoor tests. Figure 7 shows the exterior and transmitted incident solar irradiation. It can be seen that the average solar irradiation transmittance during the period is approximately 0.08. Such low transmittance means that vast majority of solar irradiation is blocked by the vacuum PV glazing. Figure 8 presents the outer and inner surface temperature of the vacuum PV glazing. It can be seen that the outer surface temperature is much higher than the inner surface temperature at daytime. The maximum outer surface temperature is 75.3°C, 30°C higher than the inner surface temperature, which indicates that most of the waste heat is dissipated from the outside surface of the vacuum PV glazing, and the heat transfer to the inside space by convection is mitigated. Thus, compared with the conventional single-glazed PV glazing, the structure of the vacuum PV glazing can help reduce the cooling load and improve the indoor thermal comfort.
Then the vacuum PV glazing was mounted on the front side of an experimental test chamber as shown in Figure 9. Clear glass was also adopted in this study for comparison. Figure 10 presents the instantaneous power output of the vacuum PV glazing in 2 sunny days. It can be seen that the power generation from the vacuum PV glazing is consistent with incident solar radiation. A comparative study in terms of internal air temperature of the chamber between the vacuum PV glazing and the clear glass was conducted in a day of June.
As shown in Figure 11, the internal air temperature in the chamber with the vacuum PV glazing is much lower than that with a clear glass. The measured average and maximum internal air temperature for the vacuum PV glazing is 39.6°C and 40.3°C, respectively, while the corresponding average and maximum internal air temperature of the clear glass are 43.6°C and 44.7°C. The maximum internal air temperature difference between the vacuum PV glazing and the clear glass is 4.4°C, occurring in the morning. There are three temperature peaks of internal air temperature. Since the ambient temperature was relatively stable, the main heat gain of the internal air temperature was from incident solar irradiation. The internal air temperature for vacuum PV glazing is much more stable compared with that for the clear glass. The reason is that the vacuum PV glazing has better heat insulation performance so that the internal air temperature is not affected by the external environment significantly. It can also be seen in this figure that the internal air temperature of the chamber drops continuously at 15:00, which shows that the incident solar irradiation on the façade decreases so that the heat gains of the internal air from the sun also drops.
(2) Comparison with other advanced windows
To further justify the advantage of the vacuum PV glazing, experimental studies were carried out to compare it with other advanced windows. Samples of different types of glazing were mounted on the top of two hotboxes (i.e. test rigs) with the uniform dimension of 300 mm (L) × 300 mm (W) × 450mm (H) to implement both indoor and outdoor tests. Firstly, a co-heating test methodology was adopted for the thermal analysis of the vacuum PV glazing. The test rig was filled with the ice-water mixture to ensure the temperature difference between the inside and outside glazing surfaces larger than 5°C. Heat flux and
Figure 12 shows the internal and external temperatures of the vacuum PV glazing sample. The presented data were selected after the hotbox achieved the steady-state condition, when the temperature difference was around 8°C. Heat flux though the glazing sample and the U-value were then determined as illustrated in Figure 13. The average heat flux from the vacuum glazing was measured to be 15.4 W/m2. And the average U-value was calculated as 1.5 W/m2 × K which is much lower than a regular double pane window with the U-value of 2.5W/m2 × K. Considering the edge heat transfer which would strongly affect the heat flux measurement when the sample is small, it can be expected that the centre U-valve of the vacuum PV glazing should be lower than 1.5 W/m2 × K for a larger scale application (e.g. 1.1m × 1.3m).
(3) Cost effective analysis based on simulation
To address the economic benefits of the developed product, the simple payback period of the vacuum PV glazing is calculated with reference to available PV glazing on the market in both Hong Kong and Beijing’s scenarios.
Based on an average electricity price of 1.25 HKD/kWh from HK Electric, the simple payback period (See Figure 26) when applying the product to the west and east façade is calculated to be 7.5 and 8.0 years compared to the single-pane PV glazing. The payback periods are increased to 8.6 and 8.8 years when compared with double-pane PV glazing as shown in Figure 27. However, when applied to the south façade, the extra initial cost of the product cannot be recovered within 10 years.
The solar simulator in the laboratory can provide relatively steady horizontal incident solar irradiation, so that test rigs were located at the same spot to ensure each window sample exposed to the same radiation level. As shown in Figure 14, SHGCs of the vacuum PV glazing and double-pane PV glazing are much smaller than those of the vacuum glazing and double clear glazing, because the coupled PV module can absorb most of the solar irradiation. The vacuum PV glazing has the lowest SHGC of 0.10 which can act as the excellent thermal insulation.
The outdoor test lasted four days from September 26th to September 30th. As shown in Figure 15, September 26th, 27th and 30th were cloudy days and September 28th could be considered as a sunny day. It can be found that the vacuum PV glazing blocks most solar irradiation compared with the double-pane glazing. Figure 16 presents the temperature profile of the vacuum PV glazing and double-pane glazing in the sunny day. The internal surface temperature of both glazing was much higher than the ambient temperature when the outside incident solar radiation is strong. The internal glazing surface and air temperatures of the test rig with the vacuum PV glazing are lower than those of the test rig with the double-pane glazing. The difference between the internal air temperatures of test rigs is much smaller than that of internal glazing surface temperatures. Therefore, the application of vacuum PV glazing can achieve better indoor environment by reducing the solar heat gain.
3.3 Simulation study of the vacuum PV glazing(1) Simulation of a generic building model
Although a series of field tests have been conducted in the outdoor test bed to study the power and thermal performances of the vacuum BIPV glazing, the experimental scenarios are impossible to represent all the situations and variables. Thus, the numerical study was conducted to comprehensively investigate and compare the energy performance of the vacuum PV glazing and other commonly used energy-efficient glazing. As detailed in the research methodology, a comprehensive simulation model based on EnergyPlus and WINDOW has been developed to simulate the overall energy performance of different windows taking into account of their thermal and power output performance. This model is used to simulate the overall energy performance of the vacuum BIPV curtain wall in comparison with other commonly used windows. The key properties of different types of glazing are shown in Table 4 and the electrical specifications of the PV glazing under standard test conditions are referenced to Table 2.
In order to simulate the annual thermal performance and power performance of these types of glazing in Hong Kong for comparison purpose, a typical office room model has been created for simulation, as shown in Figure 17. The dimension of the office model was 2.5m × 2.3m × 2.5m (L × W × H). This room has only one external wall with three identical windows exposed to the outdoor environment. Simulations were conducted for different orientations, i.e. south (S), east (E), west (W) and north (N). A heat transfer model and PV performance model in EnergyPlus are adopted to investigate
the thermal and power performance of different glazing. The heat transfer model is used to calculate the cooling loads of the office room. The cooling loads are then converted to electricity use of air-conditioning system with a presumed coefficient of performance (COP) of 2.78. The equivalent one-diode model is selected to simulate the annual electricity generation from PV elements. The typical meteorological year (TMY) in Hong Kong is selected a reasonable representation of local climates.
The annual cooling electricity use of different types of glazing in different orientations in Hong Kong are shown in Figure 18. It can be observed that the room using vacuum PV glazing consumes the least cooling electricity for all orientations. The south facing room with vacuum PV glazing consumes about 705.56 kWh per year, which was approximately 14.2%, 9.8%, 8.4%, 7.1% and 4.1% less than the corresponding room with single-pane clear glazing, double-pane clear glazing, vacuum glazing, single-pane PV glazing and double-pane PV glazing, respectively. This is because the vacuum PV glazing have the lowest U-value and SHGC among all types of glazing, as shown in Table 4.3. A lower U-value indicates a higher level of heat insulation performance of the glazing, and a lower SHGC means less solar radiation will pass through the windows. Therefore, the vacuum PV glazing performs the best in the area with big temperature difference between indoor and outdoor environment. In addition, the most cooling electricity use of the office room occurs at the west orientation, followed by east, south and north. Therefore, east and west facing windows should have better solar heat insulation performance, to reduce heat gains from outside environment.
In addition to reduce the cooling load of the office room, the PV glazing can also generate electricity in situ. The annual electricity generation of the three types of PV glazing are shown in Figure 19. It can be seen that the annual electricity generation of the three types of PV glazing is similar to each other. The electricity generation from the vacuum PV glazing is a little less than the single-pane PV glazing due to increased solar cell temperature. However, since the temperature coefficient of the thin-film a-Si solar cells is small, the PV conversion efficiency is not reduced significantly. The annual electricity generation from a-Si PV glazing with 12.0% transmittance is around 113.81 kWh per year. Among all orientations, it is better to install PV glazing on the south facade in order to maximize the electricity output in Hong Kong. And it is not recommended to apply PV glazing on north façade due to limited solar radiation available.
Based on the results above, the vacuum PV glazing not only has the best thermal performance among all types of widely used glazing, but also produces a considerable amount of electricity per year. It is recommended to install vacuum PV glazing on south facade to perform the best overall energy performance.
(2) Simulation of the whole building
Apart from modelling studies conducted under the hot and humid climate of Hong Kong, the annual energy performance of different types of glazing in a cold region (i.e. Beijing) was also simulated for comparison. Simulation results are shown in Figure 20 and Figure 21. It can be observed that the room using the vacuum PV glazing achieves the lowest cooling consumption in both climates. In Beijing, the consumed cooling energy with the vacuum PV glazing is much smaller and is 30.2%, 20.8%, 17.0%, 13.8%, 4.4% less than that of the room with other types of glazing. It can be concluded that the energy saving potential of the vacuum PV glazing is much larger in a cold climate while the electricity generation is much higher during the summer time of Beijing due to the smaller solar incidence angle.
The developed simulation model was further applied to a 20-floor prototype office building. Typical floors of the building are divided into 5 conditioned zones, with a total floor area of 540 m2 (as shown in Figure 22). The reference case – Model 1 keeps all windows as the commonly used double-pane clear glazing, while the design cases include Model 2 and Model 3. Model 2 keeps the north-facing window as the conventional double-pane glazing while changes windows orientated to the other three directions to the developed vacuum PV glazing. The opaque part of all building facades is assumed to be covered with traditional crystalline BIPV with a power conversion efficiency of 15% to maximize the power generation potential of the building envelope. Model 3 shares similar settings with Model 2, except that the window transparency is tuned to 20% with a crystalline silicon (c-Si) as shown in Figure 23. Table 5 shows detailed settings of window properties for the three models respectively. The U-value and SHGC of a-Si vacuum PV glazing are obtained from previous experiments and those of double-pane clear glazing are calculated by the simulation software WINDOW. Thermal and power generation properties of c-Si vacuum PV glazing are obtained from existing literatures.
The simulation results of the total heat gain and loss through all windows are presented in Figure 24 and Figure 25. The heat gain and loss both decrease sharply when traditional double-pane clear glazing is replaced by the PV vacuum glazing. The obvious differences between these three models can be identified from the figures. Compared with the performance of Model 1, the heat gain through windows of Model 2 and Model 3 drops up to 77.89% and 77.97% (south-facing windows), while the heat loss of the two models declines up to 79.28% and 79.32% (south-facing windows), respectively.
On the other side, based on the peak office hour electricity price of 1.4 CNY/kWh for cooling and 0.25 CNY/kWh for heating from the Beijing authority, the simple payback period (See Figure 28) when applying the product to the west, east, and south façade is calculated to be 3.8, 4.6 and 5.3 years compared to the single-pane PV glazing. The payback periods are increased to 4.5, 5.4 and 6.5 years when compared with double-pane PV glazing as shown in Figure 29.
As a result, the product can be considered as a cost-effective application in building facades when considering its tremendous saving of air-conditioning energy and corresponding annual expenses. In addition, the property developer could also benefit from a potential increment in renting rates and popularity, if the building gets certified under a green building scheme by claiming credits in CO2 reduction and renewable application assessment criteria. All the abovementioned potential benefits with the application of the vacuum PV glazing would attract more attention from the construction industry.
3.4 Brief technical guideline for the vacuum PV glazingDesigning the vacuum PV glazing (i.e. vacuum BIPV curtain wall) system is a more complex process than a standard added-on PV system. The architectural context, structural requirements, economic considerations and building regulation requirements should all be considered, so that this brief guidance mainly focuses on the below aspects: design strategy, environmental variables, multifunctionality, installation situation, electrical components, and economic aspects (Polysolar Limited, 2015).
(1) Design strategy
Architects, property developers and building users become more inclined to consider renewable and energy efficient applications to meet building and planning regulations due to rising energy bills and awareness of environmental sustainability. The combination of PV and vacuum glazing is an innovative and promising solution to meet these requirements in the new building developments or refurbishment projects. As proved in the above sections of this report, the developed product offers the added advantage of providing a return of investment from the building envelope. Architectural and structural factors, as well as economic considerations should be taken into account at an early stage in any building projects to integrate renewable systems through a more satisfactory approach.
(2) Environmental variables
When designing a BIPV system, a compromise must be reached between the requirements of energy yield optimisation and those of the architectural environment. Therefore, the orientation, lighting performance, shading and temperature are the four mainly concerned issues in BIPV design. According to simulation and experimental results presented in the above sections, the optimal orientation of the installed PV glazing should be south for maximizing the annual power generation, while cooling load reduction is more conspicuous when the product is applied on the west and east facades. Therefore, it is preferable to install the product on all three facades for an optimal overall building energy-saving performance. The visible light transmittance is only 12% in the developed prototype, which might cause slightly more lighting power consumption compared to traditional double-pane clear glazing. However, the transmittance can be easily adjusted to higher than 20% in the manufacture process depending on the effective area of PV materials. There will always be a trade-off between power generation and permeable light, whereas this research has proved that the combined power generation and cooling load reduction can be more than the increased lighting energy use. Power generation performance of the a-Si PV is less sensitive to shadings, so that the prototype is subject to less influence from peripheral shadings. However, if we change the PV material to c-Si for higher conversion efficiency, a shading calculation should be conducted before allocating the BIPV glazing. Lastly, the conversion efficiency of a-Si glazing is also less sensitive to the increase of the panel temperature. The temperature coefficient must be considered if changing the PV material to c-Si.
The vacuum PV glazing was made by sandwiching a layer of PVB between an external PV laminated glass with a visible light transmittance of 12% and an internal vacuum glass. A low-e coating was also adopted to enhance its thermal performance. The structure of the vacuum PV glazing is shown in Figure 5. The dimension of the vacuum PV glazing is 1300 mm (width) × 1100 mm (height) × 20.87 mm (thickness), thinner than commonly used PV double glazed insulating glass units. Figure 6 presents the pictures of the sample of vacuum PV glazing.
This section presents the main findings and outcomes of the research project and indicates their potential impacts on the local energy use and construction industry. Achievements of the specified research objectives are illustrated, and limitations of the project are also mentioned for the reference of future studies.
3.1 Design and production of the prototype productInitially, we proposed a prototype design as specified by Figure 2, where the vacuum layer was directly coupled with the laminated PV panel. However, during initial manufacture trials, the air pressure difference between internal and external spaces of the vacuum glass samples produced by the laminating machine caused the breakage of the vacuum glass samples. Then, we followed an alternative approach using pre-pressure furnace, whereas the molten state of the polyvinyl butyral (PVB) could not meet the expected requirements and the bubbles greatly impacted the appearance and performance of PV module. Finally, we proposed the current product design based on the experience acquired from previous failures (See Figure 5).
The electrical specifications of the vacuum PV glazing under standard test conditions (STC: air mass 1.5, solar irradiation 1000 W/m2 and cell temperature 25°C) are shown in Table 2. Table 3 presents the given thermal and optical properties of the PV laminated glass and vacuum glass, respectively.
Figure 17 A generic office room
(3) Multi-functionality
Due to their mechanical structures, the PV vacuum glazing can perform the functions of the building envelope in addition to generating emission-free energy, and can thus substitute for conventional construction windows or curtain walls. Apart from power generation and architectural function, the product can provide solar shading with its low SHGC value. It can also act as thermal and sound insulation due to its low U-value and acoustic resistance caused by the vacuum chamber between glazing layers. If applied with special coatings/films on top of PV glazing, it can also provide weather protection.
(4) Mounting system and installation
Based on specific requirements of each project in each region, safety, loading capacity and PV installation specifications can have a decisive impact on the method of fixing/mounting the vacuum. We have in this guide attempted to provide a range of options, highlighting what is possible in current design. The product can be installed with a linear mounting system as mullion-transom facades or structural sealant glazing. It can also be mounted with point-fixing systems including clamp fixings and undercut anchor fixings or mounted into standard curtain walling, rain screen cladding and window systems.
(5) Electrical system
In the curtain wall system, several PV glazing with standard size are usually connected together in a string to form the power generator. The generated direct current is usually fed to an inverter where the direct current is converted to alternating current. If on-site storage is not available, which is the common case in urban areas, the electrical power is registered via an electricity meter and connected to the public supply grid, which will require special permissions from the power grid companies (e.g. CLP in Hong Kong). Therefore, the application of the product will require a full set of electrical systems including cables and connections for parallel or series arrays, direct current load-break switches, inverters and generation meters.
(6) Economic considerations
The economic benefits of the product mainly lie in the following aspects: the substitute for original construction component, CO2 emission reduction and corresponding electricity fee waving, compliance with relevant building regulations (i.e. BEAM Plus in Hong Kong) and application of the feed-in-tariff policy (remuneration for electricity generation from PV).
temperature measurements were conducted through the centre of the vacuum PV sample to calculate the U-value. Secondly, the solar heat gains coefficient (SHGC) of the vacuum PV glazing sample was obtained and compared with three other advanced glazing types in an indoor solar irradiation test. Lastly, an outdoor test was conducted on the platform of Block Z in The Hong Kong Polytechnic University to evaluate the overall thermal performance of vacuum PV glazing. A conventional double clear pane glazing was used as a baseline in the outdoor test.
surfaces shows a similar trend in the three directions. Summing up electricity generation in all floors, the integrated PV modules in Model 2 and 3 can provide 285074.72 kWh/year and 355226.3 kWh/year, which accounts for 13.27% and 16.54% of the total building energy consumption of Model 1. Therefore, given the energy use reduction due to less external heat gain, using the vacuum BIPV glazing can save 27.74% (Model 3) electricity compared to a reference building.

23 Construction Industry Council
The comparison of building energy between Model 1, Model 2 and Model 3 is summarized in Table 6, which includes energy use of lighting, equipment, district cooling and district heating. Although Model 2 and Model 3 consume slightly more lighting energy due to the reduced visible transmittance of the PV glazing, the great energy saving in cooling and heating leads to the net reduction in the total building energy consumption. The total energy consumption of the Model 2 and 3 declines by 20.77 and 22.37 kWh/m2, accounting for 10.44% and 11.20% of Model 1 respectively. Generated electricity of windows and walls in three directions is also presented in Table 7. The south window produced the most electricity, 1527.13 kWh for Model 2 and 3203.76 kWh for Model 3 in a year, taking up nearly 47.80% the total electricity generated by windows. As for the west window, the electricity generated in a year is close to that of east window. Electricity generated by wall
3.2 Experimental study of the vacuum PV glazingOutdoor experimental test was first conducted on the developed prototype vacuum PV (VPV) glazing with the standard size (1.1m × 1.3m), whose various parameters including the ambient air temperature, incident solar irradiation, surface temperatures of the vacuum PV glazing as well as the I-V curves and the power generation were measured and recorded. The power generation and thermal performances of the prototype were also analysed during the test. To further justify the advantage of the vacuum PV glazing, experimental studies were carried out to compare the thermal performance of scaled-down samples (0.3m × 0.3m) with other advanced windows.
(1) Energy performance of the prototypeIn order to evaluate the energy performance of the vacuum PV glazing, an outdoor field measurement was conducted on the platform of Block Z in The Hong Kong Polytechnic University. The vacuum PV glazing was set up horizontally 0.4m above the floor on stilts so that the external temperatures of both sides of the vacuum PV glazing were approximately equal. Various parameters were measured during this test, including the ambient air temperature, the exterior and transmitted horizontal incident solar irradiation, the outer and inner surface temperatures of the vacuum PV glazing as well as the I-V curves and the power generation from the vacuum PV glazing. All the data was logged at an interval of 1 minute. Power generation and thermal performances of the vacuum PV glazing were analyzed based on the outdoor tests. Figure 7 shows the exterior and transmitted incident solar irradiation. It can be seen that the average solar irradiation transmittance during the period is approximately 0.08. Such low transmittance means that vast majority of solar irradiation is blocked by the vacuum PV glazing. Figure 8 presents the outer and inner surface temperature of the vacuum PV glazing. It can be seen that the outer surface temperature is much higher than the inner surface temperature at daytime. The maximum outer surface temperature is 75.3°C, 30°C higher than the inner surface temperature, which indicates that most of the waste heat is dissipated from the outside surface of the vacuum PV glazing, and the heat transfer to the inside space by convection is mitigated. Thus, compared with the conventional single-glazed PV glazing, the structure of the vacuum PV glazing can help reduce the cooling load and improve the indoor thermal comfort.
Then the vacuum PV glazing was mounted on the front side of an experimental test chamber as shown in Figure 9. Clear glass was also adopted in this study for comparison. Figure 10 presents the instantaneous power output of the vacuum PV glazing in 2 sunny days. It can be seen that the power generation from the vacuum PV glazing is consistent with incident solar radiation. A comparative study in terms of internal air temperature of the chamber between the vacuum PV glazing and the clear glass was conducted in a day of June.
As shown in Figure 11, the internal air temperature in the chamber with the vacuum PV glazing is much lower than that with a clear glass. The measured average and maximum internal air temperature for the vacuum PV glazing is 39.6°C and 40.3°C, respectively, while the corresponding average and maximum internal air temperature of the clear glass are 43.6°C and 44.7°C. The maximum internal air temperature difference between the vacuum PV glazing and the clear glass is 4.4°C, occurring in the morning. There are three temperature peaks of internal air temperature. Since the ambient temperature was relatively stable, the main heat gain of the internal air temperature was from incident solar irradiation. The internal air temperature for vacuum PV glazing is much more stable compared with that for the clear glass. The reason is that the vacuum PV glazing has better heat insulation performance so that the internal air temperature is not affected by the external environment significantly. It can also be seen in this figure that the internal air temperature of the chamber drops continuously at 15:00, which shows that the incident solar irradiation on the façade decreases so that the heat gains of the internal air from the sun also drops.
(2) Comparison with other advanced windows
To further justify the advantage of the vacuum PV glazing, experimental studies were carried out to compare it with other advanced windows. Samples of different types of glazing were mounted on the top of two hotboxes (i.e. test rigs) with the uniform dimension of 300 mm (L) × 300 mm (W) × 450mm (H) to implement both indoor and outdoor tests. Firstly, a co-heating test methodology was adopted for the thermal analysis of the vacuum PV glazing. The test rig was filled with the ice-water mixture to ensure the temperature difference between the inside and outside glazing surfaces larger than 5°C. Heat flux and
Figure 12 shows the internal and external temperatures of the vacuum PV glazing sample. The presented data were selected after the hotbox achieved the steady-state condition, when the temperature difference was around 8°C. Heat flux though the glazing sample and the U-value were then determined as illustrated in Figure 13. The average heat flux from the vacuum glazing was measured to be 15.4 W/m2. And the average U-value was calculated as 1.5 W/m2 × K which is much lower than a regular double pane window with the U-value of 2.5W/m2 × K. Considering the edge heat transfer which would strongly affect the heat flux measurement when the sample is small, it can be expected that the centre U-valve of the vacuum PV glazing should be lower than 1.5 W/m2 × K for a larger scale application (e.g. 1.1m × 1.3m).
(3) Cost effective analysis based on simulation
To address the economic benefits of the developed product, the simple payback period of the vacuum PV glazing is calculated with reference to available PV glazing on the market in both Hong Kong and Beijing’s scenarios.
Based on an average electricity price of 1.25 HKD/kWh from HK Electric, the simple payback period (See Figure 26) when applying the product to the west and east façade is calculated to be 7.5 and 8.0 years compared to the single-pane PV glazing. The payback periods are increased to 8.6 and 8.8 years when compared with double-pane PV glazing as shown in Figure 27. However, when applied to the south façade, the extra initial cost of the product cannot be recovered within 10 years.
The solar simulator in the laboratory can provide relatively steady horizontal incident solar irradiation, so that test rigs were located at the same spot to ensure each window sample exposed to the same radiation level. As shown in Figure 14, SHGCs of the vacuum PV glazing and double-pane PV glazing are much smaller than those of the vacuum glazing and double clear glazing, because the coupled PV module can absorb most of the solar irradiation. The vacuum PV glazing has the lowest SHGC of 0.10 which can act as the excellent thermal insulation.
The outdoor test lasted four days from September 26th to September 30th. As shown in Figure 15, September 26th, 27th and 30th were cloudy days and September 28th could be considered as a sunny day. It can be found that the vacuum PV glazing blocks most solar irradiation compared with the double-pane glazing. Figure 16 presents the temperature profile of the vacuum PV glazing and double-pane glazing in the sunny day. The internal surface temperature of both glazing was much higher than the ambient temperature when the outside incident solar radiation is strong. The internal glazing surface and air temperatures of the test rig with the vacuum PV glazing are lower than those of the test rig with the double-pane glazing. The difference between the internal air temperatures of test rigs is much smaller than that of internal glazing surface temperatures. Therefore, the application of vacuum PV glazing can achieve better indoor environment by reducing the solar heat gain.
3.3 Simulation study of the vacuum PV glazing(1) Simulation of a generic building model
Although a series of field tests have been conducted in the outdoor test bed to study the power and thermal performances of the vacuum BIPV glazing, the experimental scenarios are impossible to represent all the situations and variables. Thus, the numerical study was conducted to comprehensively investigate and compare the energy performance of the vacuum PV glazing and other commonly used energy-efficient glazing. As detailed in the research methodology, a comprehensive simulation model based on EnergyPlus and WINDOW has been developed to simulate the overall energy performance of different windows taking into account of their thermal and power output performance. This model is used to simulate the overall energy performance of the vacuum BIPV curtain wall in comparison with other commonly used windows. The key properties of different types of glazing are shown in Table 4 and the electrical specifications of the PV glazing under standard test conditions are referenced to Table 2.
In order to simulate the annual thermal performance and power performance of these types of glazing in Hong Kong for comparison purpose, a typical office room model has been created for simulation, as shown in Figure 17. The dimension of the office model was 2.5m × 2.3m × 2.5m (L × W × H). This room has only one external wall with three identical windows exposed to the outdoor environment. Simulations were conducted for different orientations, i.e. south (S), east (E), west (W) and north (N). A heat transfer model and PV performance model in EnergyPlus are adopted to investigate
the thermal and power performance of different glazing. The heat transfer model is used to calculate the cooling loads of the office room. The cooling loads are then converted to electricity use of air-conditioning system with a presumed coefficient of performance (COP) of 2.78. The equivalent one-diode model is selected to simulate the annual electricity generation from PV elements. The typical meteorological year (TMY) in Hong Kong is selected a reasonable representation of local climates.
The annual cooling electricity use of different types of glazing in different orientations in Hong Kong are shown in Figure 18. It can be observed that the room using vacuum PV glazing consumes the least cooling electricity for all orientations. The south facing room with vacuum PV glazing consumes about 705.56 kWh per year, which was approximately 14.2%, 9.8%, 8.4%, 7.1% and 4.1% less than the corresponding room with single-pane clear glazing, double-pane clear glazing, vacuum glazing, single-pane PV glazing and double-pane PV glazing, respectively. This is because the vacuum PV glazing have the lowest U-value and SHGC among all types of glazing, as shown in Table 4.3. A lower U-value indicates a higher level of heat insulation performance of the glazing, and a lower SHGC means less solar radiation will pass through the windows. Therefore, the vacuum PV glazing performs the best in the area with big temperature difference between indoor and outdoor environment. In addition, the most cooling electricity use of the office room occurs at the west orientation, followed by east, south and north. Therefore, east and west facing windows should have better solar heat insulation performance, to reduce heat gains from outside environment.
In addition to reduce the cooling load of the office room, the PV glazing can also generate electricity in situ. The annual electricity generation of the three types of PV glazing are shown in Figure 19. It can be seen that the annual electricity generation of the three types of PV glazing is similar to each other. The electricity generation from the vacuum PV glazing is a little less than the single-pane PV glazing due to increased solar cell temperature. However, since the temperature coefficient of the thin-film a-Si solar cells is small, the PV conversion efficiency is not reduced significantly. The annual electricity generation from a-Si PV glazing with 12.0% transmittance is around 113.81 kWh per year. Among all orientations, it is better to install PV glazing on the south facade in order to maximize the electricity output in Hong Kong. And it is not recommended to apply PV glazing on north façade due to limited solar radiation available.
Based on the results above, the vacuum PV glazing not only has the best thermal performance among all types of widely used glazing, but also produces a considerable amount of electricity per year. It is recommended to install vacuum PV glazing on south facade to perform the best overall energy performance.
(2) Simulation of the whole building
Apart from modelling studies conducted under the hot and humid climate of Hong Kong, the annual energy performance of different types of glazing in a cold region (i.e. Beijing) was also simulated for comparison. Simulation results are shown in Figure 20 and Figure 21. It can be observed that the room using the vacuum PV glazing achieves the lowest cooling consumption in both climates. In Beijing, the consumed cooling energy with the vacuum PV glazing is much smaller and is 30.2%, 20.8%, 17.0%, 13.8%, 4.4% less than that of the room with other types of glazing. It can be concluded that the energy saving potential of the vacuum PV glazing is much larger in a cold climate while the electricity generation is much higher during the summer time of Beijing due to the smaller solar incidence angle.
The developed simulation model was further applied to a 20-floor prototype office building. Typical floors of the building are divided into 5 conditioned zones, with a total floor area of 540 m2 (as shown in Figure 22). The reference case – Model 1 keeps all windows as the commonly used double-pane clear glazing, while the design cases include Model 2 and Model 3. Model 2 keeps the north-facing window as the conventional double-pane glazing while changes windows orientated to the other three directions to the developed vacuum PV glazing. The opaque part of all building facades is assumed to be covered with traditional crystalline BIPV with a power conversion efficiency of 15% to maximize the power generation potential of the building envelope. Model 3 shares similar settings with Model 2, except that the window transparency is tuned to 20% with a crystalline silicon (c-Si) as shown in Figure 23. Table 5 shows detailed settings of window properties for the three models respectively. The U-value and SHGC of a-Si vacuum PV glazing are obtained from previous experiments and those of double-pane clear glazing are calculated by the simulation software WINDOW. Thermal and power generation properties of c-Si vacuum PV glazing are obtained from existing literatures.
The simulation results of the total heat gain and loss through all windows are presented in Figure 24 and Figure 25. The heat gain and loss both decrease sharply when traditional double-pane clear glazing is replaced by the PV vacuum glazing. The obvious differences between these three models can be identified from the figures. Compared with the performance of Model 1, the heat gain through windows of Model 2 and Model 3 drops up to 77.89% and 77.97% (south-facing windows), while the heat loss of the two models declines up to 79.28% and 79.32% (south-facing windows), respectively.
On the other side, based on the peak office hour electricity price of 1.4 CNY/kWh for cooling and 0.25 CNY/kWh for heating from the Beijing authority, the simple payback period (See Figure 28) when applying the product to the west, east, and south façade is calculated to be 3.8, 4.6 and 5.3 years compared to the single-pane PV glazing. The payback periods are increased to 4.5, 5.4 and 6.5 years when compared with double-pane PV glazing as shown in Figure 29.
As a result, the product can be considered as a cost-effective application in building facades when considering its tremendous saving of air-conditioning energy and corresponding annual expenses. In addition, the property developer could also benefit from a potential increment in renting rates and popularity, if the building gets certified under a green building scheme by claiming credits in CO2 reduction and renewable application assessment criteria. All the abovementioned potential benefits with the application of the vacuum PV glazing would attract more attention from the construction industry.
3.4 Brief technical guideline for the vacuum PV glazingDesigning the vacuum PV glazing (i.e. vacuum BIPV curtain wall) system is a more complex process than a standard added-on PV system. The architectural context, structural requirements, economic considerations and building regulation requirements should all be considered, so that this brief guidance mainly focuses on the below aspects: design strategy, environmental variables, multifunctionality, installation situation, electrical components, and economic aspects (Polysolar Limited, 2015).
(1) Design strategy
Architects, property developers and building users become more inclined to consider renewable and energy efficient applications to meet building and planning regulations due to rising energy bills and awareness of environmental sustainability. The combination of PV and vacuum glazing is an innovative and promising solution to meet these requirements in the new building developments or refurbishment projects. As proved in the above sections of this report, the developed product offers the added advantage of providing a return of investment from the building envelope. Architectural and structural factors, as well as economic considerations should be taken into account at an early stage in any building projects to integrate renewable systems through a more satisfactory approach.
(2) Environmental variables
When designing a BIPV system, a compromise must be reached between the requirements of energy yield optimisation and those of the architectural environment. Therefore, the orientation, lighting performance, shading and temperature are the four mainly concerned issues in BIPV design. According to simulation and experimental results presented in the above sections, the optimal orientation of the installed PV glazing should be south for maximizing the annual power generation, while cooling load reduction is more conspicuous when the product is applied on the west and east facades. Therefore, it is preferable to install the product on all three facades for an optimal overall building energy-saving performance. The visible light transmittance is only 12% in the developed prototype, which might cause slightly more lighting power consumption compared to traditional double-pane clear glazing. However, the transmittance can be easily adjusted to higher than 20% in the manufacture process depending on the effective area of PV materials. There will always be a trade-off between power generation and permeable light, whereas this research has proved that the combined power generation and cooling load reduction can be more than the increased lighting energy use. Power generation performance of the a-Si PV is less sensitive to shadings, so that the prototype is subject to less influence from peripheral shadings. However, if we change the PV material to c-Si for higher conversion efficiency, a shading calculation should be conducted before allocating the BIPV glazing. Lastly, the conversion efficiency of a-Si glazing is also less sensitive to the increase of the panel temperature. The temperature coefficient must be considered if changing the PV material to c-Si.
The vacuum PV glazing was made by sandwiching a layer of PVB between an external PV laminated glass with a visible light transmittance of 12% and an internal vacuum glass. A low-e coating was also adopted to enhance its thermal performance. The structure of the vacuum PV glazing is shown in Figure 5. The dimension of the vacuum PV glazing is 1300 mm (width) × 1100 mm (height) × 20.87 mm (thickness), thinner than commonly used PV double glazed insulating glass units. Figure 6 presents the pictures of the sample of vacuum PV glazing.
This section presents the main findings and outcomes of the research project and indicates their potential impacts on the local energy use and construction industry. Achievements of the specified research objectives are illustrated, and limitations of the project are also mentioned for the reference of future studies.
3.1 Design and production of the prototype productInitially, we proposed a prototype design as specified by Figure 2, where the vacuum layer was directly coupled with the laminated PV panel. However, during initial manufacture trials, the air pressure difference between internal and external spaces of the vacuum glass samples produced by the laminating machine caused the breakage of the vacuum glass samples. Then, we followed an alternative approach using pre-pressure furnace, whereas the molten state of the polyvinyl butyral (PVB) could not meet the expected requirements and the bubbles greatly impacted the appearance and performance of PV module. Finally, we proposed the current product design based on the experience acquired from previous failures (See Figure 5).
The electrical specifications of the vacuum PV glazing under standard test conditions (STC: air mass 1.5, solar irradiation 1000 W/m2 and cell temperature 25°C) are shown in Table 2. Table 3 presents the given thermal and optical properties of the PV laminated glass and vacuum glass, respectively.
0.00South West
Orientations
Annual electricity use for cooling
North East
Elec
trici
ty u
se fo
r coo
ling
(kW
h)
200.00
400.00
600.00
800.00
1000.00
1200.00
Single clear Double clear VacuumSingle PV Double PV Vacuum PV
Figure 18 Annual cooling electricity consumption with different types of glazing in Hong Kong
Annual electricity generation
South West North EastOrientations
Elec
trici
ty g
ener
atio
n (k
Wh)
0.000
20.000
40.000
60.000
80.000
100.000
120.000
140.000
Single PV Double PV Vacuum PV
Figure 19 Annual power generation of the PV vacuum glazing in Hong Kong
(3) Multi-functionality
Due to their mechanical structures, the PV vacuum glazing can perform the functions of the building envelope in addition to generating emission-free energy, and can thus substitute for conventional construction windows or curtain walls. Apart from power generation and architectural function, the product can provide solar shading with its low SHGC value. It can also act as thermal and sound insulation due to its low U-value and acoustic resistance caused by the vacuum chamber between glazing layers. If applied with special coatings/films on top of PV glazing, it can also provide weather protection.
(4) Mounting system and installation
Based on specific requirements of each project in each region, safety, loading capacity and PV installation specifications can have a decisive impact on the method of fixing/mounting the vacuum. We have in this guide attempted to provide a range of options, highlighting what is possible in current design. The product can be installed with a linear mounting system as mullion-transom facades or structural sealant glazing. It can also be mounted with point-fixing systems including clamp fixings and undercut anchor fixings or mounted into standard curtain walling, rain screen cladding and window systems.
(5) Electrical system
In the curtain wall system, several PV glazing with standard size are usually connected together in a string to form the power generator. The generated direct current is usually fed to an inverter where the direct current is converted to alternating current. If on-site storage is not available, which is the common case in urban areas, the electrical power is registered via an electricity meter and connected to the public supply grid, which will require special permissions from the power grid companies (e.g. CLP in Hong Kong). Therefore, the application of the product will require a full set of electrical systems including cables and connections for parallel or series arrays, direct current load-break switches, inverters and generation meters.
(6) Economic considerations
The economic benefits of the product mainly lie in the following aspects: the substitute for original construction component, CO2 emission reduction and corresponding electricity fee waving, compliance with relevant building regulations (i.e. BEAM Plus in Hong Kong) and application of the feed-in-tariff policy (remuneration for electricity generation from PV).
temperature measurements were conducted through the centre of the vacuum PV sample to calculate the U-value. Secondly, the solar heat gains coefficient (SHGC) of the vacuum PV glazing sample was obtained and compared with three other advanced glazing types in an indoor solar irradiation test. Lastly, an outdoor test was conducted on the platform of Block Z in The Hong Kong Polytechnic University to evaluate the overall thermal performance of vacuum PV glazing. A conventional double clear pane glazing was used as a baseline in the outdoor test.
surfaces shows a similar trend in the three directions. Summing up electricity generation in all floors, the integrated PV modules in Model 2 and 3 can provide 285074.72 kWh/year and 355226.3 kWh/year, which accounts for 13.27% and 16.54% of the total building energy consumption of Model 1. Therefore, given the energy use reduction due to less external heat gain, using the vacuum BIPV glazing can save 27.74% (Model 3) electricity compared to a reference building.

24Investigation on the Thermal and Power Performance of Vacuum BIPV Curtain Wall Technology and its Application Potential in Buildings in Hong Kong
The comparison of building energy between Model 1, Model 2 and Model 3 is summarized in Table 6, which includes energy use of lighting, equipment, district cooling and district heating. Although Model 2 and Model 3 consume slightly more lighting energy due to the reduced visible transmittance of the PV glazing, the great energy saving in cooling and heating leads to the net reduction in the total building energy consumption. The total energy consumption of the Model 2 and 3 declines by 20.77 and 22.37 kWh/m2, accounting for 10.44% and 11.20% of Model 1 respectively. Generated electricity of windows and walls in three directions is also presented in Table 7. The south window produced the most electricity, 1527.13 kWh for Model 2 and 3203.76 kWh for Model 3 in a year, taking up nearly 47.80% the total electricity generated by windows. As for the west window, the electricity generated in a year is close to that of east window. Electricity generated by wall
3.2 Experimental study of the vacuum PV glazingOutdoor experimental test was first conducted on the developed prototype vacuum PV (VPV) glazing with the standard size (1.1m × 1.3m), whose various parameters including the ambient air temperature, incident solar irradiation, surface temperatures of the vacuum PV glazing as well as the I-V curves and the power generation were measured and recorded. The power generation and thermal performances of the prototype were also analysed during the test. To further justify the advantage of the vacuum PV glazing, experimental studies were carried out to compare the thermal performance of scaled-down samples (0.3m × 0.3m) with other advanced windows.
(1) Energy performance of the prototypeIn order to evaluate the energy performance of the vacuum PV glazing, an outdoor field measurement was conducted on the platform of Block Z in The Hong Kong Polytechnic University. The vacuum PV glazing was set up horizontally 0.4m above the floor on stilts so that the external temperatures of both sides of the vacuum PV glazing were approximately equal. Various parameters were measured during this test, including the ambient air temperature, the exterior and transmitted horizontal incident solar irradiation, the outer and inner surface temperatures of the vacuum PV glazing as well as the I-V curves and the power generation from the vacuum PV glazing. All the data was logged at an interval of 1 minute. Power generation and thermal performances of the vacuum PV glazing were analyzed based on the outdoor tests. Figure 7 shows the exterior and transmitted incident solar irradiation. It can be seen that the average solar irradiation transmittance during the period is approximately 0.08. Such low transmittance means that vast majority of solar irradiation is blocked by the vacuum PV glazing. Figure 8 presents the outer and inner surface temperature of the vacuum PV glazing. It can be seen that the outer surface temperature is much higher than the inner surface temperature at daytime. The maximum outer surface temperature is 75.3°C, 30°C higher than the inner surface temperature, which indicates that most of the waste heat is dissipated from the outside surface of the vacuum PV glazing, and the heat transfer to the inside space by convection is mitigated. Thus, compared with the conventional single-glazed PV glazing, the structure of the vacuum PV glazing can help reduce the cooling load and improve the indoor thermal comfort.
Then the vacuum PV glazing was mounted on the front side of an experimental test chamber as shown in Figure 9. Clear glass was also adopted in this study for comparison. Figure 10 presents the instantaneous power output of the vacuum PV glazing in 2 sunny days. It can be seen that the power generation from the vacuum PV glazing is consistent with incident solar radiation. A comparative study in terms of internal air temperature of the chamber between the vacuum PV glazing and the clear glass was conducted in a day of June.
As shown in Figure 11, the internal air temperature in the chamber with the vacuum PV glazing is much lower than that with a clear glass. The measured average and maximum internal air temperature for the vacuum PV glazing is 39.6°C and 40.3°C, respectively, while the corresponding average and maximum internal air temperature of the clear glass are 43.6°C and 44.7°C. The maximum internal air temperature difference between the vacuum PV glazing and the clear glass is 4.4°C, occurring in the morning. There are three temperature peaks of internal air temperature. Since the ambient temperature was relatively stable, the main heat gain of the internal air temperature was from incident solar irradiation. The internal air temperature for vacuum PV glazing is much more stable compared with that for the clear glass. The reason is that the vacuum PV glazing has better heat insulation performance so that the internal air temperature is not affected by the external environment significantly. It can also be seen in this figure that the internal air temperature of the chamber drops continuously at 15:00, which shows that the incident solar irradiation on the façade decreases so that the heat gains of the internal air from the sun also drops.
(2) Comparison with other advanced windows
To further justify the advantage of the vacuum PV glazing, experimental studies were carried out to compare it with other advanced windows. Samples of different types of glazing were mounted on the top of two hotboxes (i.e. test rigs) with the uniform dimension of 300 mm (L) × 300 mm (W) × 450mm (H) to implement both indoor and outdoor tests. Firstly, a co-heating test methodology was adopted for the thermal analysis of the vacuum PV glazing. The test rig was filled with the ice-water mixture to ensure the temperature difference between the inside and outside glazing surfaces larger than 5°C. Heat flux and
Figure 12 shows the internal and external temperatures of the vacuum PV glazing sample. The presented data were selected after the hotbox achieved the steady-state condition, when the temperature difference was around 8°C. Heat flux though the glazing sample and the U-value were then determined as illustrated in Figure 13. The average heat flux from the vacuum glazing was measured to be 15.4 W/m2. And the average U-value was calculated as 1.5 W/m2 × K which is much lower than a regular double pane window with the U-value of 2.5W/m2 × K. Considering the edge heat transfer which would strongly affect the heat flux measurement when the sample is small, it can be expected that the centre U-valve of the vacuum PV glazing should be lower than 1.5 W/m2 × K for a larger scale application (e.g. 1.1m × 1.3m).
(3) Cost effective analysis based on simulation
To address the economic benefits of the developed product, the simple payback period of the vacuum PV glazing is calculated with reference to available PV glazing on the market in both Hong Kong and Beijing’s scenarios.
Based on an average electricity price of 1.25 HKD/kWh from HK Electric, the simple payback period (See Figure 26) when applying the product to the west and east façade is calculated to be 7.5 and 8.0 years compared to the single-pane PV glazing. The payback periods are increased to 8.6 and 8.8 years when compared with double-pane PV glazing as shown in Figure 27. However, when applied to the south façade, the extra initial cost of the product cannot be recovered within 10 years.
The solar simulator in the laboratory can provide relatively steady horizontal incident solar irradiation, so that test rigs were located at the same spot to ensure each window sample exposed to the same radiation level. As shown in Figure 14, SHGCs of the vacuum PV glazing and double-pane PV glazing are much smaller than those of the vacuum glazing and double clear glazing, because the coupled PV module can absorb most of the solar irradiation. The vacuum PV glazing has the lowest SHGC of 0.10 which can act as the excellent thermal insulation.
The outdoor test lasted four days from September 26th to September 30th. As shown in Figure 15, September 26th, 27th and 30th were cloudy days and September 28th could be considered as a sunny day. It can be found that the vacuum PV glazing blocks most solar irradiation compared with the double-pane glazing. Figure 16 presents the temperature profile of the vacuum PV glazing and double-pane glazing in the sunny day. The internal surface temperature of both glazing was much higher than the ambient temperature when the outside incident solar radiation is strong. The internal glazing surface and air temperatures of the test rig with the vacuum PV glazing are lower than those of the test rig with the double-pane glazing. The difference between the internal air temperatures of test rigs is much smaller than that of internal glazing surface temperatures. Therefore, the application of vacuum PV glazing can achieve better indoor environment by reducing the solar heat gain.
3.3 Simulation study of the vacuum PV glazing(1) Simulation of a generic building model
Although a series of field tests have been conducted in the outdoor test bed to study the power and thermal performances of the vacuum BIPV glazing, the experimental scenarios are impossible to represent all the situations and variables. Thus, the numerical study was conducted to comprehensively investigate and compare the energy performance of the vacuum PV glazing and other commonly used energy-efficient glazing. As detailed in the research methodology, a comprehensive simulation model based on EnergyPlus and WINDOW has been developed to simulate the overall energy performance of different windows taking into account of their thermal and power output performance. This model is used to simulate the overall energy performance of the vacuum BIPV curtain wall in comparison with other commonly used windows. The key properties of different types of glazing are shown in Table 4 and the electrical specifications of the PV glazing under standard test conditions are referenced to Table 2.
In order to simulate the annual thermal performance and power performance of these types of glazing in Hong Kong for comparison purpose, a typical office room model has been created for simulation, as shown in Figure 17. The dimension of the office model was 2.5m × 2.3m × 2.5m (L × W × H). This room has only one external wall with three identical windows exposed to the outdoor environment. Simulations were conducted for different orientations, i.e. south (S), east (E), west (W) and north (N). A heat transfer model and PV performance model in EnergyPlus are adopted to investigate
the thermal and power performance of different glazing. The heat transfer model is used to calculate the cooling loads of the office room. The cooling loads are then converted to electricity use of air-conditioning system with a presumed coefficient of performance (COP) of 2.78. The equivalent one-diode model is selected to simulate the annual electricity generation from PV elements. The typical meteorological year (TMY) in Hong Kong is selected a reasonable representation of local climates.
The annual cooling electricity use of different types of glazing in different orientations in Hong Kong are shown in Figure 18. It can be observed that the room using vacuum PV glazing consumes the least cooling electricity for all orientations. The south facing room with vacuum PV glazing consumes about 705.56 kWh per year, which was approximately 14.2%, 9.8%, 8.4%, 7.1% and 4.1% less than the corresponding room with single-pane clear glazing, double-pane clear glazing, vacuum glazing, single-pane PV glazing and double-pane PV glazing, respectively. This is because the vacuum PV glazing have the lowest U-value and SHGC among all types of glazing, as shown in Table 4.3. A lower U-value indicates a higher level of heat insulation performance of the glazing, and a lower SHGC means less solar radiation will pass through the windows. Therefore, the vacuum PV glazing performs the best in the area with big temperature difference between indoor and outdoor environment. In addition, the most cooling electricity use of the office room occurs at the west orientation, followed by east, south and north. Therefore, east and west facing windows should have better solar heat insulation performance, to reduce heat gains from outside environment.
In addition to reduce the cooling load of the office room, the PV glazing can also generate electricity in situ. The annual electricity generation of the three types of PV glazing are shown in Figure 19. It can be seen that the annual electricity generation of the three types of PV glazing is similar to each other. The electricity generation from the vacuum PV glazing is a little less than the single-pane PV glazing due to increased solar cell temperature. However, since the temperature coefficient of the thin-film a-Si solar cells is small, the PV conversion efficiency is not reduced significantly. The annual electricity generation from a-Si PV glazing with 12.0% transmittance is around 113.81 kWh per year. Among all orientations, it is better to install PV glazing on the south facade in order to maximize the electricity output in Hong Kong. And it is not recommended to apply PV glazing on north façade due to limited solar radiation available.
Based on the results above, the vacuum PV glazing not only has the best thermal performance among all types of widely used glazing, but also produces a considerable amount of electricity per year. It is recommended to install vacuum PV glazing on south facade to perform the best overall energy performance.
(2) Simulation of the whole building
Apart from modelling studies conducted under the hot and humid climate of Hong Kong, the annual energy performance of different types of glazing in a cold region (i.e. Beijing) was also simulated for comparison. Simulation results are shown in Figure 20 and Figure 21. It can be observed that the room using the vacuum PV glazing achieves the lowest cooling consumption in both climates. In Beijing, the consumed cooling energy with the vacuum PV glazing is much smaller and is 30.2%, 20.8%, 17.0%, 13.8%, 4.4% less than that of the room with other types of glazing. It can be concluded that the energy saving potential of the vacuum PV glazing is much larger in a cold climate while the electricity generation is much higher during the summer time of Beijing due to the smaller solar incidence angle.
The developed simulation model was further applied to a 20-floor prototype office building. Typical floors of the building are divided into 5 conditioned zones, with a total floor area of 540 m2 (as shown in Figure 22). The reference case – Model 1 keeps all windows as the commonly used double-pane clear glazing, while the design cases include Model 2 and Model 3. Model 2 keeps the north-facing window as the conventional double-pane glazing while changes windows orientated to the other three directions to the developed vacuum PV glazing. The opaque part of all building facades is assumed to be covered with traditional crystalline BIPV with a power conversion efficiency of 15% to maximize the power generation potential of the building envelope. Model 3 shares similar settings with Model 2, except that the window transparency is tuned to 20% with a crystalline silicon (c-Si) as shown in Figure 23. Table 5 shows detailed settings of window properties for the three models respectively. The U-value and SHGC of a-Si vacuum PV glazing are obtained from previous experiments and those of double-pane clear glazing are calculated by the simulation software WINDOW. Thermal and power generation properties of c-Si vacuum PV glazing are obtained from existing literatures.
The simulation results of the total heat gain and loss through all windows are presented in Figure 24 and Figure 25. The heat gain and loss both decrease sharply when traditional double-pane clear glazing is replaced by the PV vacuum glazing. The obvious differences between these three models can be identified from the figures. Compared with the performance of Model 1, the heat gain through windows of Model 2 and Model 3 drops up to 77.89% and 77.97% (south-facing windows), while the heat loss of the two models declines up to 79.28% and 79.32% (south-facing windows), respectively.
On the other side, based on the peak office hour electricity price of 1.4 CNY/kWh for cooling and 0.25 CNY/kWh for heating from the Beijing authority, the simple payback period (See Figure 28) when applying the product to the west, east, and south façade is calculated to be 3.8, 4.6 and 5.3 years compared to the single-pane PV glazing. The payback periods are increased to 4.5, 5.4 and 6.5 years when compared with double-pane PV glazing as shown in Figure 29.
As a result, the product can be considered as a cost-effective application in building facades when considering its tremendous saving of air-conditioning energy and corresponding annual expenses. In addition, the property developer could also benefit from a potential increment in renting rates and popularity, if the building gets certified under a green building scheme by claiming credits in CO2 reduction and renewable application assessment criteria. All the abovementioned potential benefits with the application of the vacuum PV glazing would attract more attention from the construction industry.
3.4 Brief technical guideline for the vacuum PV glazingDesigning the vacuum PV glazing (i.e. vacuum BIPV curtain wall) system is a more complex process than a standard added-on PV system. The architectural context, structural requirements, economic considerations and building regulation requirements should all be considered, so that this brief guidance mainly focuses on the below aspects: design strategy, environmental variables, multifunctionality, installation situation, electrical components, and economic aspects (Polysolar Limited, 2015).
(1) Design strategy
Architects, property developers and building users become more inclined to consider renewable and energy efficient applications to meet building and planning regulations due to rising energy bills and awareness of environmental sustainability. The combination of PV and vacuum glazing is an innovative and promising solution to meet these requirements in the new building developments or refurbishment projects. As proved in the above sections of this report, the developed product offers the added advantage of providing a return of investment from the building envelope. Architectural and structural factors, as well as economic considerations should be taken into account at an early stage in any building projects to integrate renewable systems through a more satisfactory approach.
(2) Environmental variables
When designing a BIPV system, a compromise must be reached between the requirements of energy yield optimisation and those of the architectural environment. Therefore, the orientation, lighting performance, shading and temperature are the four mainly concerned issues in BIPV design. According to simulation and experimental results presented in the above sections, the optimal orientation of the installed PV glazing should be south for maximizing the annual power generation, while cooling load reduction is more conspicuous when the product is applied on the west and east facades. Therefore, it is preferable to install the product on all three facades for an optimal overall building energy-saving performance. The visible light transmittance is only 12% in the developed prototype, which might cause slightly more lighting power consumption compared to traditional double-pane clear glazing. However, the transmittance can be easily adjusted to higher than 20% in the manufacture process depending on the effective area of PV materials. There will always be a trade-off between power generation and permeable light, whereas this research has proved that the combined power generation and cooling load reduction can be more than the increased lighting energy use. Power generation performance of the a-Si PV is less sensitive to shadings, so that the prototype is subject to less influence from peripheral shadings. However, if we change the PV material to c-Si for higher conversion efficiency, a shading calculation should be conducted before allocating the BIPV glazing. Lastly, the conversion efficiency of a-Si glazing is also less sensitive to the increase of the panel temperature. The temperature coefficient must be considered if changing the PV material to c-Si.
The vacuum PV glazing was made by sandwiching a layer of PVB between an external PV laminated glass with a visible light transmittance of 12% and an internal vacuum glass. A low-e coating was also adopted to enhance its thermal performance. The structure of the vacuum PV glazing is shown in Figure 5. The dimension of the vacuum PV glazing is 1300 mm (width) × 1100 mm (height) × 20.87 mm (thickness), thinner than commonly used PV double glazed insulating glass units. Figure 6 presents the pictures of the sample of vacuum PV glazing.
This section presents the main findings and outcomes of the research project and indicates their potential impacts on the local energy use and construction industry. Achievements of the specified research objectives are illustrated, and limitations of the project are also mentioned for the reference of future studies.
3.1 Design and production of the prototype productInitially, we proposed a prototype design as specified by Figure 2, where the vacuum layer was directly coupled with the laminated PV panel. However, during initial manufacture trials, the air pressure difference between internal and external spaces of the vacuum glass samples produced by the laminating machine caused the breakage of the vacuum glass samples. Then, we followed an alternative approach using pre-pressure furnace, whereas the molten state of the polyvinyl butyral (PVB) could not meet the expected requirements and the bubbles greatly impacted the appearance and performance of PV module. Finally, we proposed the current product design based on the experience acquired from previous failures (See Figure 5).
The electrical specifications of the vacuum PV glazing under standard test conditions (STC: air mass 1.5, solar irradiation 1000 W/m2 and cell temperature 25°C) are shown in Table 2. Table 3 presents the given thermal and optical properties of the PV laminated glass and vacuum glass, respectively.
(3) Multi-functionality
Due to their mechanical structures, the PV vacuum glazing can perform the functions of the building envelope in addition to generating emission-free energy, and can thus substitute for conventional construction windows or curtain walls. Apart from power generation and architectural function, the product can provide solar shading with its low SHGC value. It can also act as thermal and sound insulation due to its low U-value and acoustic resistance caused by the vacuum chamber between glazing layers. If applied with special coatings/films on top of PV glazing, it can also provide weather protection.
(4) Mounting system and installation
Based on specific requirements of each project in each region, safety, loading capacity and PV installation specifications can have a decisive impact on the method of fixing/mounting the vacuum. We have in this guide attempted to provide a range of options, highlighting what is possible in current design. The product can be installed with a linear mounting system as mullion-transom facades or structural sealant glazing. It can also be mounted with point-fixing systems including clamp fixings and undercut anchor fixings or mounted into standard curtain walling, rain screen cladding and window systems.
(5) Electrical system
In the curtain wall system, several PV glazing with standard size are usually connected together in a string to form the power generator. The generated direct current is usually fed to an inverter where the direct current is converted to alternating current. If on-site storage is not available, which is the common case in urban areas, the electrical power is registered via an electricity meter and connected to the public supply grid, which will require special permissions from the power grid companies (e.g. CLP in Hong Kong). Therefore, the application of the product will require a full set of electrical systems including cables and connections for parallel or series arrays, direct current load-break switches, inverters and generation meters.
(6) Economic considerations
The economic benefits of the product mainly lie in the following aspects: the substitute for original construction component, CO2 emission reduction and corresponding electricity fee waving, compliance with relevant building regulations (i.e. BEAM Plus in Hong Kong) and application of the feed-in-tariff policy (remuneration for electricity generation from PV).
temperature measurements were conducted through the centre of the vacuum PV sample to calculate the U-value. Secondly, the solar heat gains coefficient (SHGC) of the vacuum PV glazing sample was obtained and compared with three other advanced glazing types in an indoor solar irradiation test. Lastly, an outdoor test was conducted on the platform of Block Z in The Hong Kong Polytechnic University to evaluate the overall thermal performance of vacuum PV glazing. A conventional double clear pane glazing was used as a baseline in the outdoor test.
surfaces shows a similar trend in the three directions. Summing up electricity generation in all floors, the integrated PV modules in Model 2 and 3 can provide 285074.72 kWh/year and 355226.3 kWh/year, which accounts for 13.27% and 16.54% of the total building energy consumption of Model 1. Therefore, given the energy use reduction due to less external heat gain, using the vacuum BIPV glazing can save 27.74% (Model 3) electricity compared to a reference building.

25 Construction Industry Council
The comparison of building energy between Model 1, Model 2 and Model 3 is summarized in Table 6, which includes energy use of lighting, equipment, district cooling and district heating. Although Model 2 and Model 3 consume slightly more lighting energy due to the reduced visible transmittance of the PV glazing, the great energy saving in cooling and heating leads to the net reduction in the total building energy consumption. The total energy consumption of the Model 2 and 3 declines by 20.77 and 22.37 kWh/m2, accounting for 10.44% and 11.20% of Model 1 respectively. Generated electricity of windows and walls in three directions is also presented in Table 7. The south window produced the most electricity, 1527.13 kWh for Model 2 and 3203.76 kWh for Model 3 in a year, taking up nearly 47.80% the total electricity generated by windows. As for the west window, the electricity generated in a year is close to that of east window. Electricity generated by wall
3.2 Experimental study of the vacuum PV glazingOutdoor experimental test was first conducted on the developed prototype vacuum PV (VPV) glazing with the standard size (1.1m × 1.3m), whose various parameters including the ambient air temperature, incident solar irradiation, surface temperatures of the vacuum PV glazing as well as the I-V curves and the power generation were measured and recorded. The power generation and thermal performances of the prototype were also analysed during the test. To further justify the advantage of the vacuum PV glazing, experimental studies were carried out to compare the thermal performance of scaled-down samples (0.3m × 0.3m) with other advanced windows.
(1) Energy performance of the prototypeIn order to evaluate the energy performance of the vacuum PV glazing, an outdoor field measurement was conducted on the platform of Block Z in The Hong Kong Polytechnic University. The vacuum PV glazing was set up horizontally 0.4m above the floor on stilts so that the external temperatures of both sides of the vacuum PV glazing were approximately equal. Various parameters were measured during this test, including the ambient air temperature, the exterior and transmitted horizontal incident solar irradiation, the outer and inner surface temperatures of the vacuum PV glazing as well as the I-V curves and the power generation from the vacuum PV glazing. All the data was logged at an interval of 1 minute. Power generation and thermal performances of the vacuum PV glazing were analyzed based on the outdoor tests. Figure 7 shows the exterior and transmitted incident solar irradiation. It can be seen that the average solar irradiation transmittance during the period is approximately 0.08. Such low transmittance means that vast majority of solar irradiation is blocked by the vacuum PV glazing. Figure 8 presents the outer and inner surface temperature of the vacuum PV glazing. It can be seen that the outer surface temperature is much higher than the inner surface temperature at daytime. The maximum outer surface temperature is 75.3°C, 30°C higher than the inner surface temperature, which indicates that most of the waste heat is dissipated from the outside surface of the vacuum PV glazing, and the heat transfer to the inside space by convection is mitigated. Thus, compared with the conventional single-glazed PV glazing, the structure of the vacuum PV glazing can help reduce the cooling load and improve the indoor thermal comfort.
Then the vacuum PV glazing was mounted on the front side of an experimental test chamber as shown in Figure 9. Clear glass was also adopted in this study for comparison. Figure 10 presents the instantaneous power output of the vacuum PV glazing in 2 sunny days. It can be seen that the power generation from the vacuum PV glazing is consistent with incident solar radiation. A comparative study in terms of internal air temperature of the chamber between the vacuum PV glazing and the clear glass was conducted in a day of June.
As shown in Figure 11, the internal air temperature in the chamber with the vacuum PV glazing is much lower than that with a clear glass. The measured average and maximum internal air temperature for the vacuum PV glazing is 39.6°C and 40.3°C, respectively, while the corresponding average and maximum internal air temperature of the clear glass are 43.6°C and 44.7°C. The maximum internal air temperature difference between the vacuum PV glazing and the clear glass is 4.4°C, occurring in the morning. There are three temperature peaks of internal air temperature. Since the ambient temperature was relatively stable, the main heat gain of the internal air temperature was from incident solar irradiation. The internal air temperature for vacuum PV glazing is much more stable compared with that for the clear glass. The reason is that the vacuum PV glazing has better heat insulation performance so that the internal air temperature is not affected by the external environment significantly. It can also be seen in this figure that the internal air temperature of the chamber drops continuously at 15:00, which shows that the incident solar irradiation on the façade decreases so that the heat gains of the internal air from the sun also drops.
(2) Comparison with other advanced windows
To further justify the advantage of the vacuum PV glazing, experimental studies were carried out to compare it with other advanced windows. Samples of different types of glazing were mounted on the top of two hotboxes (i.e. test rigs) with the uniform dimension of 300 mm (L) × 300 mm (W) × 450mm (H) to implement both indoor and outdoor tests. Firstly, a co-heating test methodology was adopted for the thermal analysis of the vacuum PV glazing. The test rig was filled with the ice-water mixture to ensure the temperature difference between the inside and outside glazing surfaces larger than 5°C. Heat flux and
Figure 12 shows the internal and external temperatures of the vacuum PV glazing sample. The presented data were selected after the hotbox achieved the steady-state condition, when the temperature difference was around 8°C. Heat flux though the glazing sample and the U-value were then determined as illustrated in Figure 13. The average heat flux from the vacuum glazing was measured to be 15.4 W/m2. And the average U-value was calculated as 1.5 W/m2 × K which is much lower than a regular double pane window with the U-value of 2.5W/m2 × K. Considering the edge heat transfer which would strongly affect the heat flux measurement when the sample is small, it can be expected that the centre U-valve of the vacuum PV glazing should be lower than 1.5 W/m2 × K for a larger scale application (e.g. 1.1m × 1.3m).
(3) Cost effective analysis based on simulation
To address the economic benefits of the developed product, the simple payback period of the vacuum PV glazing is calculated with reference to available PV glazing on the market in both Hong Kong and Beijing’s scenarios.
Based on an average electricity price of 1.25 HKD/kWh from HK Electric, the simple payback period (See Figure 26) when applying the product to the west and east façade is calculated to be 7.5 and 8.0 years compared to the single-pane PV glazing. The payback periods are increased to 8.6 and 8.8 years when compared with double-pane PV glazing as shown in Figure 27. However, when applied to the south façade, the extra initial cost of the product cannot be recovered within 10 years.
The solar simulator in the laboratory can provide relatively steady horizontal incident solar irradiation, so that test rigs were located at the same spot to ensure each window sample exposed to the same radiation level. As shown in Figure 14, SHGCs of the vacuum PV glazing and double-pane PV glazing are much smaller than those of the vacuum glazing and double clear glazing, because the coupled PV module can absorb most of the solar irradiation. The vacuum PV glazing has the lowest SHGC of 0.10 which can act as the excellent thermal insulation.
The outdoor test lasted four days from September 26th to September 30th. As shown in Figure 15, September 26th, 27th and 30th were cloudy days and September 28th could be considered as a sunny day. It can be found that the vacuum PV glazing blocks most solar irradiation compared with the double-pane glazing. Figure 16 presents the temperature profile of the vacuum PV glazing and double-pane glazing in the sunny day. The internal surface temperature of both glazing was much higher than the ambient temperature when the outside incident solar radiation is strong. The internal glazing surface and air temperatures of the test rig with the vacuum PV glazing are lower than those of the test rig with the double-pane glazing. The difference between the internal air temperatures of test rigs is much smaller than that of internal glazing surface temperatures. Therefore, the application of vacuum PV glazing can achieve better indoor environment by reducing the solar heat gain.
3.3 Simulation study of the vacuum PV glazing(1) Simulation of a generic building model
Although a series of field tests have been conducted in the outdoor test bed to study the power and thermal performances of the vacuum BIPV glazing, the experimental scenarios are impossible to represent all the situations and variables. Thus, the numerical study was conducted to comprehensively investigate and compare the energy performance of the vacuum PV glazing and other commonly used energy-efficient glazing. As detailed in the research methodology, a comprehensive simulation model based on EnergyPlus and WINDOW has been developed to simulate the overall energy performance of different windows taking into account of their thermal and power output performance. This model is used to simulate the overall energy performance of the vacuum BIPV curtain wall in comparison with other commonly used windows. The key properties of different types of glazing are shown in Table 4 and the electrical specifications of the PV glazing under standard test conditions are referenced to Table 2.
In order to simulate the annual thermal performance and power performance of these types of glazing in Hong Kong for comparison purpose, a typical office room model has been created for simulation, as shown in Figure 17. The dimension of the office model was 2.5m × 2.3m × 2.5m (L × W × H). This room has only one external wall with three identical windows exposed to the outdoor environment. Simulations were conducted for different orientations, i.e. south (S), east (E), west (W) and north (N). A heat transfer model and PV performance model in EnergyPlus are adopted to investigate
the thermal and power performance of different glazing. The heat transfer model is used to calculate the cooling loads of the office room. The cooling loads are then converted to electricity use of air-conditioning system with a presumed coefficient of performance (COP) of 2.78. The equivalent one-diode model is selected to simulate the annual electricity generation from PV elements. The typical meteorological year (TMY) in Hong Kong is selected a reasonable representation of local climates.
The annual cooling electricity use of different types of glazing in different orientations in Hong Kong are shown in Figure 18. It can be observed that the room using vacuum PV glazing consumes the least cooling electricity for all orientations. The south facing room with vacuum PV glazing consumes about 705.56 kWh per year, which was approximately 14.2%, 9.8%, 8.4%, 7.1% and 4.1% less than the corresponding room with single-pane clear glazing, double-pane clear glazing, vacuum glazing, single-pane PV glazing and double-pane PV glazing, respectively. This is because the vacuum PV glazing have the lowest U-value and SHGC among all types of glazing, as shown in Table 4.3. A lower U-value indicates a higher level of heat insulation performance of the glazing, and a lower SHGC means less solar radiation will pass through the windows. Therefore, the vacuum PV glazing performs the best in the area with big temperature difference between indoor and outdoor environment. In addition, the most cooling electricity use of the office room occurs at the west orientation, followed by east, south and north. Therefore, east and west facing windows should have better solar heat insulation performance, to reduce heat gains from outside environment.
In addition to reduce the cooling load of the office room, the PV glazing can also generate electricity in situ. The annual electricity generation of the three types of PV glazing are shown in Figure 19. It can be seen that the annual electricity generation of the three types of PV glazing is similar to each other. The electricity generation from the vacuum PV glazing is a little less than the single-pane PV glazing due to increased solar cell temperature. However, since the temperature coefficient of the thin-film a-Si solar cells is small, the PV conversion efficiency is not reduced significantly. The annual electricity generation from a-Si PV glazing with 12.0% transmittance is around 113.81 kWh per year. Among all orientations, it is better to install PV glazing on the south facade in order to maximize the electricity output in Hong Kong. And it is not recommended to apply PV glazing on north façade due to limited solar radiation available.
Based on the results above, the vacuum PV glazing not only has the best thermal performance among all types of widely used glazing, but also produces a considerable amount of electricity per year. It is recommended to install vacuum PV glazing on south facade to perform the best overall energy performance.
(2) Simulation of the whole building
Apart from modelling studies conducted under the hot and humid climate of Hong Kong, the annual energy performance of different types of glazing in a cold region (i.e. Beijing) was also simulated for comparison. Simulation results are shown in Figure 20 and Figure 21. It can be observed that the room using the vacuum PV glazing achieves the lowest cooling consumption in both climates. In Beijing, the consumed cooling energy with the vacuum PV glazing is much smaller and is 30.2%, 20.8%, 17.0%, 13.8%, 4.4% less than that of the room with other types of glazing. It can be concluded that the energy saving potential of the vacuum PV glazing is much larger in a cold climate while the electricity generation is much higher during the summer time of Beijing due to the smaller solar incidence angle.
The developed simulation model was further applied to a 20-floor prototype office building. Typical floors of the building are divided into 5 conditioned zones, with a total floor area of 540 m2 (as shown in Figure 22). The reference case – Model 1 keeps all windows as the commonly used double-pane clear glazing, while the design cases include Model 2 and Model 3. Model 2 keeps the north-facing window as the conventional double-pane glazing while changes windows orientated to the other three directions to the developed vacuum PV glazing. The opaque part of all building facades is assumed to be covered with traditional crystalline BIPV with a power conversion efficiency of 15% to maximize the power generation potential of the building envelope. Model 3 shares similar settings with Model 2, except that the window transparency is tuned to 20% with a crystalline silicon (c-Si) as shown in Figure 23. Table 5 shows detailed settings of window properties for the three models respectively. The U-value and SHGC of a-Si vacuum PV glazing are obtained from previous experiments and those of double-pane clear glazing are calculated by the simulation software WINDOW. Thermal and power generation properties of c-Si vacuum PV glazing are obtained from existing literatures.
The simulation results of the total heat gain and loss through all windows are presented in Figure 24 and Figure 25. The heat gain and loss both decrease sharply when traditional double-pane clear glazing is replaced by the PV vacuum glazing. The obvious differences between these three models can be identified from the figures. Compared with the performance of Model 1, the heat gain through windows of Model 2 and Model 3 drops up to 77.89% and 77.97% (south-facing windows), while the heat loss of the two models declines up to 79.28% and 79.32% (south-facing windows), respectively.
On the other side, based on the peak office hour electricity price of 1.4 CNY/kWh for cooling and 0.25 CNY/kWh for heating from the Beijing authority, the simple payback period (See Figure 28) when applying the product to the west, east, and south façade is calculated to be 3.8, 4.6 and 5.3 years compared to the single-pane PV glazing. The payback periods are increased to 4.5, 5.4 and 6.5 years when compared with double-pane PV glazing as shown in Figure 29.
As a result, the product can be considered as a cost-effective application in building facades when considering its tremendous saving of air-conditioning energy and corresponding annual expenses. In addition, the property developer could also benefit from a potential increment in renting rates and popularity, if the building gets certified under a green building scheme by claiming credits in CO2 reduction and renewable application assessment criteria. All the abovementioned potential benefits with the application of the vacuum PV glazing would attract more attention from the construction industry.
3.4 Brief technical guideline for the vacuum PV glazingDesigning the vacuum PV glazing (i.e. vacuum BIPV curtain wall) system is a more complex process than a standard added-on PV system. The architectural context, structural requirements, economic considerations and building regulation requirements should all be considered, so that this brief guidance mainly focuses on the below aspects: design strategy, environmental variables, multifunctionality, installation situation, electrical components, and economic aspects (Polysolar Limited, 2015).
(1) Design strategy
Architects, property developers and building users become more inclined to consider renewable and energy efficient applications to meet building and planning regulations due to rising energy bills and awareness of environmental sustainability. The combination of PV and vacuum glazing is an innovative and promising solution to meet these requirements in the new building developments or refurbishment projects. As proved in the above sections of this report, the developed product offers the added advantage of providing a return of investment from the building envelope. Architectural and structural factors, as well as economic considerations should be taken into account at an early stage in any building projects to integrate renewable systems through a more satisfactory approach.
(2) Environmental variables
When designing a BIPV system, a compromise must be reached between the requirements of energy yield optimisation and those of the architectural environment. Therefore, the orientation, lighting performance, shading and temperature are the four mainly concerned issues in BIPV design. According to simulation and experimental results presented in the above sections, the optimal orientation of the installed PV glazing should be south for maximizing the annual power generation, while cooling load reduction is more conspicuous when the product is applied on the west and east facades. Therefore, it is preferable to install the product on all three facades for an optimal overall building energy-saving performance. The visible light transmittance is only 12% in the developed prototype, which might cause slightly more lighting power consumption compared to traditional double-pane clear glazing. However, the transmittance can be easily adjusted to higher than 20% in the manufacture process depending on the effective area of PV materials. There will always be a trade-off between power generation and permeable light, whereas this research has proved that the combined power generation and cooling load reduction can be more than the increased lighting energy use. Power generation performance of the a-Si PV is less sensitive to shadings, so that the prototype is subject to less influence from peripheral shadings. However, if we change the PV material to c-Si for higher conversion efficiency, a shading calculation should be conducted before allocating the BIPV glazing. Lastly, the conversion efficiency of a-Si glazing is also less sensitive to the increase of the panel temperature. The temperature coefficient must be considered if changing the PV material to c-Si.
The vacuum PV glazing was made by sandwiching a layer of PVB between an external PV laminated glass with a visible light transmittance of 12% and an internal vacuum glass. A low-e coating was also adopted to enhance its thermal performance. The structure of the vacuum PV glazing is shown in Figure 5. The dimension of the vacuum PV glazing is 1300 mm (width) × 1100 mm (height) × 20.87 mm (thickness), thinner than commonly used PV double glazed insulating glass units. Figure 6 presents the pictures of the sample of vacuum PV glazing.
This section presents the main findings and outcomes of the research project and indicates their potential impacts on the local energy use and construction industry. Achievements of the specified research objectives are illustrated, and limitations of the project are also mentioned for the reference of future studies.
3.1 Design and production of the prototype productInitially, we proposed a prototype design as specified by Figure 2, where the vacuum layer was directly coupled with the laminated PV panel. However, during initial manufacture trials, the air pressure difference between internal and external spaces of the vacuum glass samples produced by the laminating machine caused the breakage of the vacuum glass samples. Then, we followed an alternative approach using pre-pressure furnace, whereas the molten state of the polyvinyl butyral (PVB) could not meet the expected requirements and the bubbles greatly impacted the appearance and performance of PV module. Finally, we proposed the current product design based on the experience acquired from previous failures (See Figure 5).
The electrical specifications of the vacuum PV glazing under standard test conditions (STC: air mass 1.5, solar irradiation 1000 W/m2 and cell temperature 25°C) are shown in Table 2. Table 3 presents the given thermal and optical properties of the PV laminated glass and vacuum glass, respectively.
Single clear Double clear VacuumSingle PV Double PV Vacuum PV
0.00South West
Orientations
Annual electricity use for cooling
North East
Elec
trici
ty u
se fo
r coo
ling
(kW
h)
100.00
200.00
300.00
400.00
500.00
600.00
Figure 20 Annual cooling electricity consumption with different types of glazing in Beijing
(3) Multi-functionality
Due to their mechanical structures, the PV vacuum glazing can perform the functions of the building envelope in addition to generating emission-free energy, and can thus substitute for conventional construction windows or curtain walls. Apart from power generation and architectural function, the product can provide solar shading with its low SHGC value. It can also act as thermal and sound insulation due to its low U-value and acoustic resistance caused by the vacuum chamber between glazing layers. If applied with special coatings/films on top of PV glazing, it can also provide weather protection.
(4) Mounting system and installation
Based on specific requirements of each project in each region, safety, loading capacity and PV installation specifications can have a decisive impact on the method of fixing/mounting the vacuum. We have in this guide attempted to provide a range of options, highlighting what is possible in current design. The product can be installed with a linear mounting system as mullion-transom facades or structural sealant glazing. It can also be mounted with point-fixing systems including clamp fixings and undercut anchor fixings or mounted into standard curtain walling, rain screen cladding and window systems.
(5) Electrical system
In the curtain wall system, several PV glazing with standard size are usually connected together in a string to form the power generator. The generated direct current is usually fed to an inverter where the direct current is converted to alternating current. If on-site storage is not available, which is the common case in urban areas, the electrical power is registered via an electricity meter and connected to the public supply grid, which will require special permissions from the power grid companies (e.g. CLP in Hong Kong). Therefore, the application of the product will require a full set of electrical systems including cables and connections for parallel or series arrays, direct current load-break switches, inverters and generation meters.
(6) Economic considerations
The economic benefits of the product mainly lie in the following aspects: the substitute for original construction component, CO2 emission reduction and corresponding electricity fee waving, compliance with relevant building regulations (i.e. BEAM Plus in Hong Kong) and application of the feed-in-tariff policy (remuneration for electricity generation from PV).
Figure 21 Annual power generation of the PV vacuum glazing in Beijing
Annual electricity generation
South West North East
Orientations
Elec
trici
ty g
ener
atio
n (k
Wh)
0.000
50.000
100.000
150.000
200.000
250.000
temperature measurements were conducted through the centre of the vacuum PV sample to calculate the U-value. Secondly, the solar heat gains coefficient (SHGC) of the vacuum PV glazing sample was obtained and compared with three other advanced glazing types in an indoor solar irradiation test. Lastly, an outdoor test was conducted on the platform of Block Z in The Hong Kong Polytechnic University to evaluate the overall thermal performance of vacuum PV glazing. A conventional double clear pane glazing was used as a baseline in the outdoor test.
surfaces shows a similar trend in the three directions. Summing up electricity generation in all floors, the integrated PV modules in Model 2 and 3 can provide 285074.72 kWh/year and 355226.3 kWh/year, which accounts for 13.27% and 16.54% of the total building energy consumption of Model 1. Therefore, given the energy use reduction due to less external heat gain, using the vacuum BIPV glazing can save 27.74% (Model 3) electricity compared to a reference building.

26Investigation on the Thermal and Power Performance of Vacuum BIPV Curtain Wall Technology and its Application Potential in Buildings in Hong Kong
The comparison of building energy between Model 1, Model 2 and Model 3 is summarized in Table 6, which includes energy use of lighting, equipment, district cooling and district heating. Although Model 2 and Model 3 consume slightly more lighting energy due to the reduced visible transmittance of the PV glazing, the great energy saving in cooling and heating leads to the net reduction in the total building energy consumption. The total energy consumption of the Model 2 and 3 declines by 20.77 and 22.37 kWh/m2, accounting for 10.44% and 11.20% of Model 1 respectively. Generated electricity of windows and walls in three directions is also presented in Table 7. The south window produced the most electricity, 1527.13 kWh for Model 2 and 3203.76 kWh for Model 3 in a year, taking up nearly 47.80% the total electricity generated by windows. As for the west window, the electricity generated in a year is close to that of east window. Electricity generated by wall
3.2 Experimental study of the vacuum PV glazingOutdoor experimental test was first conducted on the developed prototype vacuum PV (VPV) glazing with the standard size (1.1m × 1.3m), whose various parameters including the ambient air temperature, incident solar irradiation, surface temperatures of the vacuum PV glazing as well as the I-V curves and the power generation were measured and recorded. The power generation and thermal performances of the prototype were also analysed during the test. To further justify the advantage of the vacuum PV glazing, experimental studies were carried out to compare the thermal performance of scaled-down samples (0.3m × 0.3m) with other advanced windows.
(1) Energy performance of the prototypeIn order to evaluate the energy performance of the vacuum PV glazing, an outdoor field measurement was conducted on the platform of Block Z in The Hong Kong Polytechnic University. The vacuum PV glazing was set up horizontally 0.4m above the floor on stilts so that the external temperatures of both sides of the vacuum PV glazing were approximately equal. Various parameters were measured during this test, including the ambient air temperature, the exterior and transmitted horizontal incident solar irradiation, the outer and inner surface temperatures of the vacuum PV glazing as well as the I-V curves and the power generation from the vacuum PV glazing. All the data was logged at an interval of 1 minute. Power generation and thermal performances of the vacuum PV glazing were analyzed based on the outdoor tests. Figure 7 shows the exterior and transmitted incident solar irradiation. It can be seen that the average solar irradiation transmittance during the period is approximately 0.08. Such low transmittance means that vast majority of solar irradiation is blocked by the vacuum PV glazing. Figure 8 presents the outer and inner surface temperature of the vacuum PV glazing. It can be seen that the outer surface temperature is much higher than the inner surface temperature at daytime. The maximum outer surface temperature is 75.3°C, 30°C higher than the inner surface temperature, which indicates that most of the waste heat is dissipated from the outside surface of the vacuum PV glazing, and the heat transfer to the inside space by convection is mitigated. Thus, compared with the conventional single-glazed PV glazing, the structure of the vacuum PV glazing can help reduce the cooling load and improve the indoor thermal comfort.
Then the vacuum PV glazing was mounted on the front side of an experimental test chamber as shown in Figure 9. Clear glass was also adopted in this study for comparison. Figure 10 presents the instantaneous power output of the vacuum PV glazing in 2 sunny days. It can be seen that the power generation from the vacuum PV glazing is consistent with incident solar radiation. A comparative study in terms of internal air temperature of the chamber between the vacuum PV glazing and the clear glass was conducted in a day of June.
As shown in Figure 11, the internal air temperature in the chamber with the vacuum PV glazing is much lower than that with a clear glass. The measured average and maximum internal air temperature for the vacuum PV glazing is 39.6°C and 40.3°C, respectively, while the corresponding average and maximum internal air temperature of the clear glass are 43.6°C and 44.7°C. The maximum internal air temperature difference between the vacuum PV glazing and the clear glass is 4.4°C, occurring in the morning. There are three temperature peaks of internal air temperature. Since the ambient temperature was relatively stable, the main heat gain of the internal air temperature was from incident solar irradiation. The internal air temperature for vacuum PV glazing is much more stable compared with that for the clear glass. The reason is that the vacuum PV glazing has better heat insulation performance so that the internal air temperature is not affected by the external environment significantly. It can also be seen in this figure that the internal air temperature of the chamber drops continuously at 15:00, which shows that the incident solar irradiation on the façade decreases so that the heat gains of the internal air from the sun also drops.
(2) Comparison with other advanced windows
To further justify the advantage of the vacuum PV glazing, experimental studies were carried out to compare it with other advanced windows. Samples of different types of glazing were mounted on the top of two hotboxes (i.e. test rigs) with the uniform dimension of 300 mm (L) × 300 mm (W) × 450mm (H) to implement both indoor and outdoor tests. Firstly, a co-heating test methodology was adopted for the thermal analysis of the vacuum PV glazing. The test rig was filled with the ice-water mixture to ensure the temperature difference between the inside and outside glazing surfaces larger than 5°C. Heat flux and
Figure 12 shows the internal and external temperatures of the vacuum PV glazing sample. The presented data were selected after the hotbox achieved the steady-state condition, when the temperature difference was around 8°C. Heat flux though the glazing sample and the U-value were then determined as illustrated in Figure 13. The average heat flux from the vacuum glazing was measured to be 15.4 W/m2. And the average U-value was calculated as 1.5 W/m2 × K which is much lower than a regular double pane window with the U-value of 2.5W/m2 × K. Considering the edge heat transfer which would strongly affect the heat flux measurement when the sample is small, it can be expected that the centre U-valve of the vacuum PV glazing should be lower than 1.5 W/m2 × K for a larger scale application (e.g. 1.1m × 1.3m).
(3) Cost effective analysis based on simulation
To address the economic benefits of the developed product, the simple payback period of the vacuum PV glazing is calculated with reference to available PV glazing on the market in both Hong Kong and Beijing’s scenarios.
Based on an average electricity price of 1.25 HKD/kWh from HK Electric, the simple payback period (See Figure 26) when applying the product to the west and east façade is calculated to be 7.5 and 8.0 years compared to the single-pane PV glazing. The payback periods are increased to 8.6 and 8.8 years when compared with double-pane PV glazing as shown in Figure 27. However, when applied to the south façade, the extra initial cost of the product cannot be recovered within 10 years.
The solar simulator in the laboratory can provide relatively steady horizontal incident solar irradiation, so that test rigs were located at the same spot to ensure each window sample exposed to the same radiation level. As shown in Figure 14, SHGCs of the vacuum PV glazing and double-pane PV glazing are much smaller than those of the vacuum glazing and double clear glazing, because the coupled PV module can absorb most of the solar irradiation. The vacuum PV glazing has the lowest SHGC of 0.10 which can act as the excellent thermal insulation.
The outdoor test lasted four days from September 26th to September 30th. As shown in Figure 15, September 26th, 27th and 30th were cloudy days and September 28th could be considered as a sunny day. It can be found that the vacuum PV glazing blocks most solar irradiation compared with the double-pane glazing. Figure 16 presents the temperature profile of the vacuum PV glazing and double-pane glazing in the sunny day. The internal surface temperature of both glazing was much higher than the ambient temperature when the outside incident solar radiation is strong. The internal glazing surface and air temperatures of the test rig with the vacuum PV glazing are lower than those of the test rig with the double-pane glazing. The difference between the internal air temperatures of test rigs is much smaller than that of internal glazing surface temperatures. Therefore, the application of vacuum PV glazing can achieve better indoor environment by reducing the solar heat gain.
3.3 Simulation study of the vacuum PV glazing(1) Simulation of a generic building model
Although a series of field tests have been conducted in the outdoor test bed to study the power and thermal performances of the vacuum BIPV glazing, the experimental scenarios are impossible to represent all the situations and variables. Thus, the numerical study was conducted to comprehensively investigate and compare the energy performance of the vacuum PV glazing and other commonly used energy-efficient glazing. As detailed in the research methodology, a comprehensive simulation model based on EnergyPlus and WINDOW has been developed to simulate the overall energy performance of different windows taking into account of their thermal and power output performance. This model is used to simulate the overall energy performance of the vacuum BIPV curtain wall in comparison with other commonly used windows. The key properties of different types of glazing are shown in Table 4 and the electrical specifications of the PV glazing under standard test conditions are referenced to Table 2.
In order to simulate the annual thermal performance and power performance of these types of glazing in Hong Kong for comparison purpose, a typical office room model has been created for simulation, as shown in Figure 17. The dimension of the office model was 2.5m × 2.3m × 2.5m (L × W × H). This room has only one external wall with three identical windows exposed to the outdoor environment. Simulations were conducted for different orientations, i.e. south (S), east (E), west (W) and north (N). A heat transfer model and PV performance model in EnergyPlus are adopted to investigate
the thermal and power performance of different glazing. The heat transfer model is used to calculate the cooling loads of the office room. The cooling loads are then converted to electricity use of air-conditioning system with a presumed coefficient of performance (COP) of 2.78. The equivalent one-diode model is selected to simulate the annual electricity generation from PV elements. The typical meteorological year (TMY) in Hong Kong is selected a reasonable representation of local climates.
The annual cooling electricity use of different types of glazing in different orientations in Hong Kong are shown in Figure 18. It can be observed that the room using vacuum PV glazing consumes the least cooling electricity for all orientations. The south facing room with vacuum PV glazing consumes about 705.56 kWh per year, which was approximately 14.2%, 9.8%, 8.4%, 7.1% and 4.1% less than the corresponding room with single-pane clear glazing, double-pane clear glazing, vacuum glazing, single-pane PV glazing and double-pane PV glazing, respectively. This is because the vacuum PV glazing have the lowest U-value and SHGC among all types of glazing, as shown in Table 4.3. A lower U-value indicates a higher level of heat insulation performance of the glazing, and a lower SHGC means less solar radiation will pass through the windows. Therefore, the vacuum PV glazing performs the best in the area with big temperature difference between indoor and outdoor environment. In addition, the most cooling electricity use of the office room occurs at the west orientation, followed by east, south and north. Therefore, east and west facing windows should have better solar heat insulation performance, to reduce heat gains from outside environment.
In addition to reduce the cooling load of the office room, the PV glazing can also generate electricity in situ. The annual electricity generation of the three types of PV glazing are shown in Figure 19. It can be seen that the annual electricity generation of the three types of PV glazing is similar to each other. The electricity generation from the vacuum PV glazing is a little less than the single-pane PV glazing due to increased solar cell temperature. However, since the temperature coefficient of the thin-film a-Si solar cells is small, the PV conversion efficiency is not reduced significantly. The annual electricity generation from a-Si PV glazing with 12.0% transmittance is around 113.81 kWh per year. Among all orientations, it is better to install PV glazing on the south facade in order to maximize the electricity output in Hong Kong. And it is not recommended to apply PV glazing on north façade due to limited solar radiation available.
Based on the results above, the vacuum PV glazing not only has the best thermal performance among all types of widely used glazing, but also produces a considerable amount of electricity per year. It is recommended to install vacuum PV glazing on south facade to perform the best overall energy performance.
(2) Simulation of the whole building
Apart from modelling studies conducted under the hot and humid climate of Hong Kong, the annual energy performance of different types of glazing in a cold region (i.e. Beijing) was also simulated for comparison. Simulation results are shown in Figure 20 and Figure 21. It can be observed that the room using the vacuum PV glazing achieves the lowest cooling consumption in both climates. In Beijing, the consumed cooling energy with the vacuum PV glazing is much smaller and is 30.2%, 20.8%, 17.0%, 13.8%, 4.4% less than that of the room with other types of glazing. It can be concluded that the energy saving potential of the vacuum PV glazing is much larger in a cold climate while the electricity generation is much higher during the summer time of Beijing due to the smaller solar incidence angle.
The developed simulation model was further applied to a 20-floor prototype office building. Typical floors of the building are divided into 5 conditioned zones, with a total floor area of 540 m2 (as shown in Figure 22). The reference case – Model 1 keeps all windows as the commonly used double-pane clear glazing, while the design cases include Model 2 and Model 3. Model 2 keeps the north-facing window as the conventional double-pane glazing while changes windows orientated to the other three directions to the developed vacuum PV glazing. The opaque part of all building facades is assumed to be covered with traditional crystalline BIPV with a power conversion efficiency of 15% to maximize the power generation potential of the building envelope. Model 3 shares similar settings with Model 2, except that the window transparency is tuned to 20% with a crystalline silicon (c-Si) as shown in Figure 23. Table 5 shows detailed settings of window properties for the three models respectively. The U-value and SHGC of a-Si vacuum PV glazing are obtained from previous experiments and those of double-pane clear glazing are calculated by the simulation software WINDOW. Thermal and power generation properties of c-Si vacuum PV glazing are obtained from existing literatures.
The simulation results of the total heat gain and loss through all windows are presented in Figure 24 and Figure 25. The heat gain and loss both decrease sharply when traditional double-pane clear glazing is replaced by the PV vacuum glazing. The obvious differences between these three models can be identified from the figures. Compared with the performance of Model 1, the heat gain through windows of Model 2 and Model 3 drops up to 77.89% and 77.97% (south-facing windows), while the heat loss of the two models declines up to 79.28% and 79.32% (south-facing windows), respectively.
On the other side, based on the peak office hour electricity price of 1.4 CNY/kWh for cooling and 0.25 CNY/kWh for heating from the Beijing authority, the simple payback period (See Figure 28) when applying the product to the west, east, and south façade is calculated to be 3.8, 4.6 and 5.3 years compared to the single-pane PV glazing. The payback periods are increased to 4.5, 5.4 and 6.5 years when compared with double-pane PV glazing as shown in Figure 29.
As a result, the product can be considered as a cost-effective application in building facades when considering its tremendous saving of air-conditioning energy and corresponding annual expenses. In addition, the property developer could also benefit from a potential increment in renting rates and popularity, if the building gets certified under a green building scheme by claiming credits in CO2 reduction and renewable application assessment criteria. All the abovementioned potential benefits with the application of the vacuum PV glazing would attract more attention from the construction industry.
3.4 Brief technical guideline for the vacuum PV glazingDesigning the vacuum PV glazing (i.e. vacuum BIPV curtain wall) system is a more complex process than a standard added-on PV system. The architectural context, structural requirements, economic considerations and building regulation requirements should all be considered, so that this brief guidance mainly focuses on the below aspects: design strategy, environmental variables, multifunctionality, installation situation, electrical components, and economic aspects (Polysolar Limited, 2015).
(1) Design strategy
Architects, property developers and building users become more inclined to consider renewable and energy efficient applications to meet building and planning regulations due to rising energy bills and awareness of environmental sustainability. The combination of PV and vacuum glazing is an innovative and promising solution to meet these requirements in the new building developments or refurbishment projects. As proved in the above sections of this report, the developed product offers the added advantage of providing a return of investment from the building envelope. Architectural and structural factors, as well as economic considerations should be taken into account at an early stage in any building projects to integrate renewable systems through a more satisfactory approach.
(2) Environmental variables
When designing a BIPV system, a compromise must be reached between the requirements of energy yield optimisation and those of the architectural environment. Therefore, the orientation, lighting performance, shading and temperature are the four mainly concerned issues in BIPV design. According to simulation and experimental results presented in the above sections, the optimal orientation of the installed PV glazing should be south for maximizing the annual power generation, while cooling load reduction is more conspicuous when the product is applied on the west and east facades. Therefore, it is preferable to install the product on all three facades for an optimal overall building energy-saving performance. The visible light transmittance is only 12% in the developed prototype, which might cause slightly more lighting power consumption compared to traditional double-pane clear glazing. However, the transmittance can be easily adjusted to higher than 20% in the manufacture process depending on the effective area of PV materials. There will always be a trade-off between power generation and permeable light, whereas this research has proved that the combined power generation and cooling load reduction can be more than the increased lighting energy use. Power generation performance of the a-Si PV is less sensitive to shadings, so that the prototype is subject to less influence from peripheral shadings. However, if we change the PV material to c-Si for higher conversion efficiency, a shading calculation should be conducted before allocating the BIPV glazing. Lastly, the conversion efficiency of a-Si glazing is also less sensitive to the increase of the panel temperature. The temperature coefficient must be considered if changing the PV material to c-Si.
The vacuum PV glazing was made by sandwiching a layer of PVB between an external PV laminated glass with a visible light transmittance of 12% and an internal vacuum glass. A low-e coating was also adopted to enhance its thermal performance. The structure of the vacuum PV glazing is shown in Figure 5. The dimension of the vacuum PV glazing is 1300 mm (width) × 1100 mm (height) × 20.87 mm (thickness), thinner than commonly used PV double glazed insulating glass units. Figure 6 presents the pictures of the sample of vacuum PV glazing.
This section presents the main findings and outcomes of the research project and indicates their potential impacts on the local energy use and construction industry. Achievements of the specified research objectives are illustrated, and limitations of the project are also mentioned for the reference of future studies.
3.1 Design and production of the prototype productInitially, we proposed a prototype design as specified by Figure 2, where the vacuum layer was directly coupled with the laminated PV panel. However, during initial manufacture trials, the air pressure difference between internal and external spaces of the vacuum glass samples produced by the laminating machine caused the breakage of the vacuum glass samples. Then, we followed an alternative approach using pre-pressure furnace, whereas the molten state of the polyvinyl butyral (PVB) could not meet the expected requirements and the bubbles greatly impacted the appearance and performance of PV module. Finally, we proposed the current product design based on the experience acquired from previous failures (See Figure 5).
The electrical specifications of the vacuum PV glazing under standard test conditions (STC: air mass 1.5, solar irradiation 1000 W/m2 and cell temperature 25°C) are shown in Table 2. Table 3 presents the given thermal and optical properties of the PV laminated glass and vacuum glass, respectively.
Figure 22 Typical floor of the building model
(3) Multi-functionality
Due to their mechanical structures, the PV vacuum glazing can perform the functions of the building envelope in addition to generating emission-free energy, and can thus substitute for conventional construction windows or curtain walls. Apart from power generation and architectural function, the product can provide solar shading with its low SHGC value. It can also act as thermal and sound insulation due to its low U-value and acoustic resistance caused by the vacuum chamber between glazing layers. If applied with special coatings/films on top of PV glazing, it can also provide weather protection.
(4) Mounting system and installation
Based on specific requirements of each project in each region, safety, loading capacity and PV installation specifications can have a decisive impact on the method of fixing/mounting the vacuum. We have in this guide attempted to provide a range of options, highlighting what is possible in current design. The product can be installed with a linear mounting system as mullion-transom facades or structural sealant glazing. It can also be mounted with point-fixing systems including clamp fixings and undercut anchor fixings or mounted into standard curtain walling, rain screen cladding and window systems.
(5) Electrical system
In the curtain wall system, several PV glazing with standard size are usually connected together in a string to form the power generator. The generated direct current is usually fed to an inverter where the direct current is converted to alternating current. If on-site storage is not available, which is the common case in urban areas, the electrical power is registered via an electricity meter and connected to the public supply grid, which will require special permissions from the power grid companies (e.g. CLP in Hong Kong). Therefore, the application of the product will require a full set of electrical systems including cables and connections for parallel or series arrays, direct current load-break switches, inverters and generation meters.
(6) Economic considerations
The economic benefits of the product mainly lie in the following aspects: the substitute for original construction component, CO2 emission reduction and corresponding electricity fee waving, compliance with relevant building regulations (i.e. BEAM Plus in Hong Kong) and application of the feed-in-tariff policy (remuneration for electricity generation from PV).
temperature measurements were conducted through the centre of the vacuum PV sample to calculate the U-value. Secondly, the solar heat gains coefficient (SHGC) of the vacuum PV glazing sample was obtained and compared with three other advanced glazing types in an indoor solar irradiation test. Lastly, an outdoor test was conducted on the platform of Block Z in The Hong Kong Polytechnic University to evaluate the overall thermal performance of vacuum PV glazing. A conventional double clear pane glazing was used as a baseline in the outdoor test.
surfaces shows a similar trend in the three directions. Summing up electricity generation in all floors, the integrated PV modules in Model 2 and 3 can provide 285074.72 kWh/year and 355226.3 kWh/year, which accounts for 13.27% and 16.54% of the total building energy consumption of Model 1. Therefore, given the energy use reduction due to less external heat gain, using the vacuum BIPV glazing can save 27.74% (Model 3) electricity compared to a reference building.

27 Construction Industry Council
The comparison of building energy between Model 1, Model 2 and Model 3 is summarized in Table 6, which includes energy use of lighting, equipment, district cooling and district heating. Although Model 2 and Model 3 consume slightly more lighting energy due to the reduced visible transmittance of the PV glazing, the great energy saving in cooling and heating leads to the net reduction in the total building energy consumption. The total energy consumption of the Model 2 and 3 declines by 20.77 and 22.37 kWh/m2, accounting for 10.44% and 11.20% of Model 1 respectively. Generated electricity of windows and walls in three directions is also presented in Table 7. The south window produced the most electricity, 1527.13 kWh for Model 2 and 3203.76 kWh for Model 3 in a year, taking up nearly 47.80% the total electricity generated by windows. As for the west window, the electricity generated in a year is close to that of east window. Electricity generated by wall
3.2 Experimental study of the vacuum PV glazingOutdoor experimental test was first conducted on the developed prototype vacuum PV (VPV) glazing with the standard size (1.1m × 1.3m), whose various parameters including the ambient air temperature, incident solar irradiation, surface temperatures of the vacuum PV glazing as well as the I-V curves and the power generation were measured and recorded. The power generation and thermal performances of the prototype were also analysed during the test. To further justify the advantage of the vacuum PV glazing, experimental studies were carried out to compare the thermal performance of scaled-down samples (0.3m × 0.3m) with other advanced windows.
(1) Energy performance of the prototypeIn order to evaluate the energy performance of the vacuum PV glazing, an outdoor field measurement was conducted on the platform of Block Z in The Hong Kong Polytechnic University. The vacuum PV glazing was set up horizontally 0.4m above the floor on stilts so that the external temperatures of both sides of the vacuum PV glazing were approximately equal. Various parameters were measured during this test, including the ambient air temperature, the exterior and transmitted horizontal incident solar irradiation, the outer and inner surface temperatures of the vacuum PV glazing as well as the I-V curves and the power generation from the vacuum PV glazing. All the data was logged at an interval of 1 minute. Power generation and thermal performances of the vacuum PV glazing were analyzed based on the outdoor tests. Figure 7 shows the exterior and transmitted incident solar irradiation. It can be seen that the average solar irradiation transmittance during the period is approximately 0.08. Such low transmittance means that vast majority of solar irradiation is blocked by the vacuum PV glazing. Figure 8 presents the outer and inner surface temperature of the vacuum PV glazing. It can be seen that the outer surface temperature is much higher than the inner surface temperature at daytime. The maximum outer surface temperature is 75.3°C, 30°C higher than the inner surface temperature, which indicates that most of the waste heat is dissipated from the outside surface of the vacuum PV glazing, and the heat transfer to the inside space by convection is mitigated. Thus, compared with the conventional single-glazed PV glazing, the structure of the vacuum PV glazing can help reduce the cooling load and improve the indoor thermal comfort.
Then the vacuum PV glazing was mounted on the front side of an experimental test chamber as shown in Figure 9. Clear glass was also adopted in this study for comparison. Figure 10 presents the instantaneous power output of the vacuum PV glazing in 2 sunny days. It can be seen that the power generation from the vacuum PV glazing is consistent with incident solar radiation. A comparative study in terms of internal air temperature of the chamber between the vacuum PV glazing and the clear glass was conducted in a day of June.
As shown in Figure 11, the internal air temperature in the chamber with the vacuum PV glazing is much lower than that with a clear glass. The measured average and maximum internal air temperature for the vacuum PV glazing is 39.6°C and 40.3°C, respectively, while the corresponding average and maximum internal air temperature of the clear glass are 43.6°C and 44.7°C. The maximum internal air temperature difference between the vacuum PV glazing and the clear glass is 4.4°C, occurring in the morning. There are three temperature peaks of internal air temperature. Since the ambient temperature was relatively stable, the main heat gain of the internal air temperature was from incident solar irradiation. The internal air temperature for vacuum PV glazing is much more stable compared with that for the clear glass. The reason is that the vacuum PV glazing has better heat insulation performance so that the internal air temperature is not affected by the external environment significantly. It can also be seen in this figure that the internal air temperature of the chamber drops continuously at 15:00, which shows that the incident solar irradiation on the façade decreases so that the heat gains of the internal air from the sun also drops.
(2) Comparison with other advanced windows
To further justify the advantage of the vacuum PV glazing, experimental studies were carried out to compare it with other advanced windows. Samples of different types of glazing were mounted on the top of two hotboxes (i.e. test rigs) with the uniform dimension of 300 mm (L) × 300 mm (W) × 450mm (H) to implement both indoor and outdoor tests. Firstly, a co-heating test methodology was adopted for the thermal analysis of the vacuum PV glazing. The test rig was filled with the ice-water mixture to ensure the temperature difference between the inside and outside glazing surfaces larger than 5°C. Heat flux and
Figure 12 shows the internal and external temperatures of the vacuum PV glazing sample. The presented data were selected after the hotbox achieved the steady-state condition, when the temperature difference was around 8°C. Heat flux though the glazing sample and the U-value were then determined as illustrated in Figure 13. The average heat flux from the vacuum glazing was measured to be 15.4 W/m2. And the average U-value was calculated as 1.5 W/m2 × K which is much lower than a regular double pane window with the U-value of 2.5W/m2 × K. Considering the edge heat transfer which would strongly affect the heat flux measurement when the sample is small, it can be expected that the centre U-valve of the vacuum PV glazing should be lower than 1.5 W/m2 × K for a larger scale application (e.g. 1.1m × 1.3m).
(3) Cost effective analysis based on simulation
To address the economic benefits of the developed product, the simple payback period of the vacuum PV glazing is calculated with reference to available PV glazing on the market in both Hong Kong and Beijing’s scenarios.
Based on an average electricity price of 1.25 HKD/kWh from HK Electric, the simple payback period (See Figure 26) when applying the product to the west and east façade is calculated to be 7.5 and 8.0 years compared to the single-pane PV glazing. The payback periods are increased to 8.6 and 8.8 years when compared with double-pane PV glazing as shown in Figure 27. However, when applied to the south façade, the extra initial cost of the product cannot be recovered within 10 years.
The solar simulator in the laboratory can provide relatively steady horizontal incident solar irradiation, so that test rigs were located at the same spot to ensure each window sample exposed to the same radiation level. As shown in Figure 14, SHGCs of the vacuum PV glazing and double-pane PV glazing are much smaller than those of the vacuum glazing and double clear glazing, because the coupled PV module can absorb most of the solar irradiation. The vacuum PV glazing has the lowest SHGC of 0.10 which can act as the excellent thermal insulation.
The outdoor test lasted four days from September 26th to September 30th. As shown in Figure 15, September 26th, 27th and 30th were cloudy days and September 28th could be considered as a sunny day. It can be found that the vacuum PV glazing blocks most solar irradiation compared with the double-pane glazing. Figure 16 presents the temperature profile of the vacuum PV glazing and double-pane glazing in the sunny day. The internal surface temperature of both glazing was much higher than the ambient temperature when the outside incident solar radiation is strong. The internal glazing surface and air temperatures of the test rig with the vacuum PV glazing are lower than those of the test rig with the double-pane glazing. The difference between the internal air temperatures of test rigs is much smaller than that of internal glazing surface temperatures. Therefore, the application of vacuum PV glazing can achieve better indoor environment by reducing the solar heat gain.
3.3 Simulation study of the vacuum PV glazing(1) Simulation of a generic building model
Although a series of field tests have been conducted in the outdoor test bed to study the power and thermal performances of the vacuum BIPV glazing, the experimental scenarios are impossible to represent all the situations and variables. Thus, the numerical study was conducted to comprehensively investigate and compare the energy performance of the vacuum PV glazing and other commonly used energy-efficient glazing. As detailed in the research methodology, a comprehensive simulation model based on EnergyPlus and WINDOW has been developed to simulate the overall energy performance of different windows taking into account of their thermal and power output performance. This model is used to simulate the overall energy performance of the vacuum BIPV curtain wall in comparison with other commonly used windows. The key properties of different types of glazing are shown in Table 4 and the electrical specifications of the PV glazing under standard test conditions are referenced to Table 2.
In order to simulate the annual thermal performance and power performance of these types of glazing in Hong Kong for comparison purpose, a typical office room model has been created for simulation, as shown in Figure 17. The dimension of the office model was 2.5m × 2.3m × 2.5m (L × W × H). This room has only one external wall with three identical windows exposed to the outdoor environment. Simulations were conducted for different orientations, i.e. south (S), east (E), west (W) and north (N). A heat transfer model and PV performance model in EnergyPlus are adopted to investigate
the thermal and power performance of different glazing. The heat transfer model is used to calculate the cooling loads of the office room. The cooling loads are then converted to electricity use of air-conditioning system with a presumed coefficient of performance (COP) of 2.78. The equivalent one-diode model is selected to simulate the annual electricity generation from PV elements. The typical meteorological year (TMY) in Hong Kong is selected a reasonable representation of local climates.
The annual cooling electricity use of different types of glazing in different orientations in Hong Kong are shown in Figure 18. It can be observed that the room using vacuum PV glazing consumes the least cooling electricity for all orientations. The south facing room with vacuum PV glazing consumes about 705.56 kWh per year, which was approximately 14.2%, 9.8%, 8.4%, 7.1% and 4.1% less than the corresponding room with single-pane clear glazing, double-pane clear glazing, vacuum glazing, single-pane PV glazing and double-pane PV glazing, respectively. This is because the vacuum PV glazing have the lowest U-value and SHGC among all types of glazing, as shown in Table 4.3. A lower U-value indicates a higher level of heat insulation performance of the glazing, and a lower SHGC means less solar radiation will pass through the windows. Therefore, the vacuum PV glazing performs the best in the area with big temperature difference between indoor and outdoor environment. In addition, the most cooling electricity use of the office room occurs at the west orientation, followed by east, south and north. Therefore, east and west facing windows should have better solar heat insulation performance, to reduce heat gains from outside environment.
In addition to reduce the cooling load of the office room, the PV glazing can also generate electricity in situ. The annual electricity generation of the three types of PV glazing are shown in Figure 19. It can be seen that the annual electricity generation of the three types of PV glazing is similar to each other. The electricity generation from the vacuum PV glazing is a little less than the single-pane PV glazing due to increased solar cell temperature. However, since the temperature coefficient of the thin-film a-Si solar cells is small, the PV conversion efficiency is not reduced significantly. The annual electricity generation from a-Si PV glazing with 12.0% transmittance is around 113.81 kWh per year. Among all orientations, it is better to install PV glazing on the south facade in order to maximize the electricity output in Hong Kong. And it is not recommended to apply PV glazing on north façade due to limited solar radiation available.
Based on the results above, the vacuum PV glazing not only has the best thermal performance among all types of widely used glazing, but also produces a considerable amount of electricity per year. It is recommended to install vacuum PV glazing on south facade to perform the best overall energy performance.
(2) Simulation of the whole building
Apart from modelling studies conducted under the hot and humid climate of Hong Kong, the annual energy performance of different types of glazing in a cold region (i.e. Beijing) was also simulated for comparison. Simulation results are shown in Figure 20 and Figure 21. It can be observed that the room using the vacuum PV glazing achieves the lowest cooling consumption in both climates. In Beijing, the consumed cooling energy with the vacuum PV glazing is much smaller and is 30.2%, 20.8%, 17.0%, 13.8%, 4.4% less than that of the room with other types of glazing. It can be concluded that the energy saving potential of the vacuum PV glazing is much larger in a cold climate while the electricity generation is much higher during the summer time of Beijing due to the smaller solar incidence angle.
The developed simulation model was further applied to a 20-floor prototype office building. Typical floors of the building are divided into 5 conditioned zones, with a total floor area of 540 m2 (as shown in Figure 22). The reference case – Model 1 keeps all windows as the commonly used double-pane clear glazing, while the design cases include Model 2 and Model 3. Model 2 keeps the north-facing window as the conventional double-pane glazing while changes windows orientated to the other three directions to the developed vacuum PV glazing. The opaque part of all building facades is assumed to be covered with traditional crystalline BIPV with a power conversion efficiency of 15% to maximize the power generation potential of the building envelope. Model 3 shares similar settings with Model 2, except that the window transparency is tuned to 20% with a crystalline silicon (c-Si) as shown in Figure 23. Table 5 shows detailed settings of window properties for the three models respectively. The U-value and SHGC of a-Si vacuum PV glazing are obtained from previous experiments and those of double-pane clear glazing are calculated by the simulation software WINDOW. Thermal and power generation properties of c-Si vacuum PV glazing are obtained from existing literatures.
The simulation results of the total heat gain and loss through all windows are presented in Figure 24 and Figure 25. The heat gain and loss both decrease sharply when traditional double-pane clear glazing is replaced by the PV vacuum glazing. The obvious differences between these three models can be identified from the figures. Compared with the performance of Model 1, the heat gain through windows of Model 2 and Model 3 drops up to 77.89% and 77.97% (south-facing windows), while the heat loss of the two models declines up to 79.28% and 79.32% (south-facing windows), respectively.
On the other side, based on the peak office hour electricity price of 1.4 CNY/kWh for cooling and 0.25 CNY/kWh for heating from the Beijing authority, the simple payback period (See Figure 28) when applying the product to the west, east, and south façade is calculated to be 3.8, 4.6 and 5.3 years compared to the single-pane PV glazing. The payback periods are increased to 4.5, 5.4 and 6.5 years when compared with double-pane PV glazing as shown in Figure 29.
As a result, the product can be considered as a cost-effective application in building facades when considering its tremendous saving of air-conditioning energy and corresponding annual expenses. In addition, the property developer could also benefit from a potential increment in renting rates and popularity, if the building gets certified under a green building scheme by claiming credits in CO2 reduction and renewable application assessment criteria. All the abovementioned potential benefits with the application of the vacuum PV glazing would attract more attention from the construction industry.
3.4 Brief technical guideline for the vacuum PV glazingDesigning the vacuum PV glazing (i.e. vacuum BIPV curtain wall) system is a more complex process than a standard added-on PV system. The architectural context, structural requirements, economic considerations and building regulation requirements should all be considered, so that this brief guidance mainly focuses on the below aspects: design strategy, environmental variables, multifunctionality, installation situation, electrical components, and economic aspects (Polysolar Limited, 2015).
(1) Design strategy
Architects, property developers and building users become more inclined to consider renewable and energy efficient applications to meet building and planning regulations due to rising energy bills and awareness of environmental sustainability. The combination of PV and vacuum glazing is an innovative and promising solution to meet these requirements in the new building developments or refurbishment projects. As proved in the above sections of this report, the developed product offers the added advantage of providing a return of investment from the building envelope. Architectural and structural factors, as well as economic considerations should be taken into account at an early stage in any building projects to integrate renewable systems through a more satisfactory approach.
(2) Environmental variables
When designing a BIPV system, a compromise must be reached between the requirements of energy yield optimisation and those of the architectural environment. Therefore, the orientation, lighting performance, shading and temperature are the four mainly concerned issues in BIPV design. According to simulation and experimental results presented in the above sections, the optimal orientation of the installed PV glazing should be south for maximizing the annual power generation, while cooling load reduction is more conspicuous when the product is applied on the west and east facades. Therefore, it is preferable to install the product on all three facades for an optimal overall building energy-saving performance. The visible light transmittance is only 12% in the developed prototype, which might cause slightly more lighting power consumption compared to traditional double-pane clear glazing. However, the transmittance can be easily adjusted to higher than 20% in the manufacture process depending on the effective area of PV materials. There will always be a trade-off between power generation and permeable light, whereas this research has proved that the combined power generation and cooling load reduction can be more than the increased lighting energy use. Power generation performance of the a-Si PV is less sensitive to shadings, so that the prototype is subject to less influence from peripheral shadings. However, if we change the PV material to c-Si for higher conversion efficiency, a shading calculation should be conducted before allocating the BIPV glazing. Lastly, the conversion efficiency of a-Si glazing is also less sensitive to the increase of the panel temperature. The temperature coefficient must be considered if changing the PV material to c-Si.
The vacuum PV glazing was made by sandwiching a layer of PVB between an external PV laminated glass with a visible light transmittance of 12% and an internal vacuum glass. A low-e coating was also adopted to enhance its thermal performance. The structure of the vacuum PV glazing is shown in Figure 5. The dimension of the vacuum PV glazing is 1300 mm (width) × 1100 mm (height) × 20.87 mm (thickness), thinner than commonly used PV double glazed insulating glass units. Figure 6 presents the pictures of the sample of vacuum PV glazing.
This section presents the main findings and outcomes of the research project and indicates their potential impacts on the local energy use and construction industry. Achievements of the specified research objectives are illustrated, and limitations of the project are also mentioned for the reference of future studies.
3.1 Design and production of the prototype productInitially, we proposed a prototype design as specified by Figure 2, where the vacuum layer was directly coupled with the laminated PV panel. However, during initial manufacture trials, the air pressure difference between internal and external spaces of the vacuum glass samples produced by the laminating machine caused the breakage of the vacuum glass samples. Then, we followed an alternative approach using pre-pressure furnace, whereas the molten state of the polyvinyl butyral (PVB) could not meet the expected requirements and the bubbles greatly impacted the appearance and performance of PV module. Finally, we proposed the current product design based on the experience acquired from previous failures (See Figure 5).
The electrical specifications of the vacuum PV glazing under standard test conditions (STC: air mass 1.5, solar irradiation 1000 W/m2 and cell temperature 25°C) are shown in Table 2. Table 3 presents the given thermal and optical properties of the PV laminated glass and vacuum glass, respectively.
Figure 23 Sample of semi-transparent crystalline silicon glazing
Table 5 Settings of all windows using CDG Glazing U-Factor
SHGC Visible
PV Type Conversion
[W/m2K] Transmittance Efficiency
Model 1 2.63 0.703 0.786 - -
Model 2 0.557 0.143 0.120 a-Si 6.5%
Model 3 0.557 0.143 0.200 c-Si 15%
(3) Multi-functionality
Due to their mechanical structures, the PV vacuum glazing can perform the functions of the building envelope in addition to generating emission-free energy, and can thus substitute for conventional construction windows or curtain walls. Apart from power generation and architectural function, the product can provide solar shading with its low SHGC value. It can also act as thermal and sound insulation due to its low U-value and acoustic resistance caused by the vacuum chamber between glazing layers. If applied with special coatings/films on top of PV glazing, it can also provide weather protection.
(4) Mounting system and installation
Based on specific requirements of each project in each region, safety, loading capacity and PV installation specifications can have a decisive impact on the method of fixing/mounting the vacuum. We have in this guide attempted to provide a range of options, highlighting what is possible in current design. The product can be installed with a linear mounting system as mullion-transom facades or structural sealant glazing. It can also be mounted with point-fixing systems including clamp fixings and undercut anchor fixings or mounted into standard curtain walling, rain screen cladding and window systems.
(5) Electrical system
In the curtain wall system, several PV glazing with standard size are usually connected together in a string to form the power generator. The generated direct current is usually fed to an inverter where the direct current is converted to alternating current. If on-site storage is not available, which is the common case in urban areas, the electrical power is registered via an electricity meter and connected to the public supply grid, which will require special permissions from the power grid companies (e.g. CLP in Hong Kong). Therefore, the application of the product will require a full set of electrical systems including cables and connections for parallel or series arrays, direct current load-break switches, inverters and generation meters.
(6) Economic considerations
The economic benefits of the product mainly lie in the following aspects: the substitute for original construction component, CO2 emission reduction and corresponding electricity fee waving, compliance with relevant building regulations (i.e. BEAM Plus in Hong Kong) and application of the feed-in-tariff policy (remuneration for electricity generation from PV).
temperature measurements were conducted through the centre of the vacuum PV sample to calculate the U-value. Secondly, the solar heat gains coefficient (SHGC) of the vacuum PV glazing sample was obtained and compared with three other advanced glazing types in an indoor solar irradiation test. Lastly, an outdoor test was conducted on the platform of Block Z in The Hong Kong Polytechnic University to evaluate the overall thermal performance of vacuum PV glazing. A conventional double clear pane glazing was used as a baseline in the outdoor test.
surfaces shows a similar trend in the three directions. Summing up electricity generation in all floors, the integrated PV modules in Model 2 and 3 can provide 285074.72 kWh/year and 355226.3 kWh/year, which accounts for 13.27% and 16.54% of the total building energy consumption of Model 1. Therefore, given the energy use reduction due to less external heat gain, using the vacuum BIPV glazing can save 27.74% (Model 3) electricity compared to a reference building.

28Investigation on the Thermal and Power Performance of Vacuum BIPV Curtain Wall Technology and its Application Potential in Buildings in Hong Kong
The comparison of building energy between Model 1, Model 2 and Model 3 is summarized in Table 6, which includes energy use of lighting, equipment, district cooling and district heating. Although Model 2 and Model 3 consume slightly more lighting energy due to the reduced visible transmittance of the PV glazing, the great energy saving in cooling and heating leads to the net reduction in the total building energy consumption. The total energy consumption of the Model 2 and 3 declines by 20.77 and 22.37 kWh/m2, accounting for 10.44% and 11.20% of Model 1 respectively. Generated electricity of windows and walls in three directions is also presented in Table 7. The south window produced the most electricity, 1527.13 kWh for Model 2 and 3203.76 kWh for Model 3 in a year, taking up nearly 47.80% the total electricity generated by windows. As for the west window, the electricity generated in a year is close to that of east window. Electricity generated by wall
3.2 Experimental study of the vacuum PV glazingOutdoor experimental test was first conducted on the developed prototype vacuum PV (VPV) glazing with the standard size (1.1m × 1.3m), whose various parameters including the ambient air temperature, incident solar irradiation, surface temperatures of the vacuum PV glazing as well as the I-V curves and the power generation were measured and recorded. The power generation and thermal performances of the prototype were also analysed during the test. To further justify the advantage of the vacuum PV glazing, experimental studies were carried out to compare the thermal performance of scaled-down samples (0.3m × 0.3m) with other advanced windows.
(1) Energy performance of the prototypeIn order to evaluate the energy performance of the vacuum PV glazing, an outdoor field measurement was conducted on the platform of Block Z in The Hong Kong Polytechnic University. The vacuum PV glazing was set up horizontally 0.4m above the floor on stilts so that the external temperatures of both sides of the vacuum PV glazing were approximately equal. Various parameters were measured during this test, including the ambient air temperature, the exterior and transmitted horizontal incident solar irradiation, the outer and inner surface temperatures of the vacuum PV glazing as well as the I-V curves and the power generation from the vacuum PV glazing. All the data was logged at an interval of 1 minute. Power generation and thermal performances of the vacuum PV glazing were analyzed based on the outdoor tests. Figure 7 shows the exterior and transmitted incident solar irradiation. It can be seen that the average solar irradiation transmittance during the period is approximately 0.08. Such low transmittance means that vast majority of solar irradiation is blocked by the vacuum PV glazing. Figure 8 presents the outer and inner surface temperature of the vacuum PV glazing. It can be seen that the outer surface temperature is much higher than the inner surface temperature at daytime. The maximum outer surface temperature is 75.3°C, 30°C higher than the inner surface temperature, which indicates that most of the waste heat is dissipated from the outside surface of the vacuum PV glazing, and the heat transfer to the inside space by convection is mitigated. Thus, compared with the conventional single-glazed PV glazing, the structure of the vacuum PV glazing can help reduce the cooling load and improve the indoor thermal comfort.
Then the vacuum PV glazing was mounted on the front side of an experimental test chamber as shown in Figure 9. Clear glass was also adopted in this study for comparison. Figure 10 presents the instantaneous power output of the vacuum PV glazing in 2 sunny days. It can be seen that the power generation from the vacuum PV glazing is consistent with incident solar radiation. A comparative study in terms of internal air temperature of the chamber between the vacuum PV glazing and the clear glass was conducted in a day of June.
As shown in Figure 11, the internal air temperature in the chamber with the vacuum PV glazing is much lower than that with a clear glass. The measured average and maximum internal air temperature for the vacuum PV glazing is 39.6°C and 40.3°C, respectively, while the corresponding average and maximum internal air temperature of the clear glass are 43.6°C and 44.7°C. The maximum internal air temperature difference between the vacuum PV glazing and the clear glass is 4.4°C, occurring in the morning. There are three temperature peaks of internal air temperature. Since the ambient temperature was relatively stable, the main heat gain of the internal air temperature was from incident solar irradiation. The internal air temperature for vacuum PV glazing is much more stable compared with that for the clear glass. The reason is that the vacuum PV glazing has better heat insulation performance so that the internal air temperature is not affected by the external environment significantly. It can also be seen in this figure that the internal air temperature of the chamber drops continuously at 15:00, which shows that the incident solar irradiation on the façade decreases so that the heat gains of the internal air from the sun also drops.
(2) Comparison with other advanced windows
To further justify the advantage of the vacuum PV glazing, experimental studies were carried out to compare it with other advanced windows. Samples of different types of glazing were mounted on the top of two hotboxes (i.e. test rigs) with the uniform dimension of 300 mm (L) × 300 mm (W) × 450mm (H) to implement both indoor and outdoor tests. Firstly, a co-heating test methodology was adopted for the thermal analysis of the vacuum PV glazing. The test rig was filled with the ice-water mixture to ensure the temperature difference between the inside and outside glazing surfaces larger than 5°C. Heat flux and
Figure 12 shows the internal and external temperatures of the vacuum PV glazing sample. The presented data were selected after the hotbox achieved the steady-state condition, when the temperature difference was around 8°C. Heat flux though the glazing sample and the U-value were then determined as illustrated in Figure 13. The average heat flux from the vacuum glazing was measured to be 15.4 W/m2. And the average U-value was calculated as 1.5 W/m2 × K which is much lower than a regular double pane window with the U-value of 2.5W/m2 × K. Considering the edge heat transfer which would strongly affect the heat flux measurement when the sample is small, it can be expected that the centre U-valve of the vacuum PV glazing should be lower than 1.5 W/m2 × K for a larger scale application (e.g. 1.1m × 1.3m).
(3) Cost effective analysis based on simulation
To address the economic benefits of the developed product, the simple payback period of the vacuum PV glazing is calculated with reference to available PV glazing on the market in both Hong Kong and Beijing’s scenarios.
Based on an average electricity price of 1.25 HKD/kWh from HK Electric, the simple payback period (See Figure 26) when applying the product to the west and east façade is calculated to be 7.5 and 8.0 years compared to the single-pane PV glazing. The payback periods are increased to 8.6 and 8.8 years when compared with double-pane PV glazing as shown in Figure 27. However, when applied to the south façade, the extra initial cost of the product cannot be recovered within 10 years.
The solar simulator in the laboratory can provide relatively steady horizontal incident solar irradiation, so that test rigs were located at the same spot to ensure each window sample exposed to the same radiation level. As shown in Figure 14, SHGCs of the vacuum PV glazing and double-pane PV glazing are much smaller than those of the vacuum glazing and double clear glazing, because the coupled PV module can absorb most of the solar irradiation. The vacuum PV glazing has the lowest SHGC of 0.10 which can act as the excellent thermal insulation.
The outdoor test lasted four days from September 26th to September 30th. As shown in Figure 15, September 26th, 27th and 30th were cloudy days and September 28th could be considered as a sunny day. It can be found that the vacuum PV glazing blocks most solar irradiation compared with the double-pane glazing. Figure 16 presents the temperature profile of the vacuum PV glazing and double-pane glazing in the sunny day. The internal surface temperature of both glazing was much higher than the ambient temperature when the outside incident solar radiation is strong. The internal glazing surface and air temperatures of the test rig with the vacuum PV glazing are lower than those of the test rig with the double-pane glazing. The difference between the internal air temperatures of test rigs is much smaller than that of internal glazing surface temperatures. Therefore, the application of vacuum PV glazing can achieve better indoor environment by reducing the solar heat gain.
3.3 Simulation study of the vacuum PV glazing(1) Simulation of a generic building model
Although a series of field tests have been conducted in the outdoor test bed to study the power and thermal performances of the vacuum BIPV glazing, the experimental scenarios are impossible to represent all the situations and variables. Thus, the numerical study was conducted to comprehensively investigate and compare the energy performance of the vacuum PV glazing and other commonly used energy-efficient glazing. As detailed in the research methodology, a comprehensive simulation model based on EnergyPlus and WINDOW has been developed to simulate the overall energy performance of different windows taking into account of their thermal and power output performance. This model is used to simulate the overall energy performance of the vacuum BIPV curtain wall in comparison with other commonly used windows. The key properties of different types of glazing are shown in Table 4 and the electrical specifications of the PV glazing under standard test conditions are referenced to Table 2.
In order to simulate the annual thermal performance and power performance of these types of glazing in Hong Kong for comparison purpose, a typical office room model has been created for simulation, as shown in Figure 17. The dimension of the office model was 2.5m × 2.3m × 2.5m (L × W × H). This room has only one external wall with three identical windows exposed to the outdoor environment. Simulations were conducted for different orientations, i.e. south (S), east (E), west (W) and north (N). A heat transfer model and PV performance model in EnergyPlus are adopted to investigate
the thermal and power performance of different glazing. The heat transfer model is used to calculate the cooling loads of the office room. The cooling loads are then converted to electricity use of air-conditioning system with a presumed coefficient of performance (COP) of 2.78. The equivalent one-diode model is selected to simulate the annual electricity generation from PV elements. The typical meteorological year (TMY) in Hong Kong is selected a reasonable representation of local climates.
The annual cooling electricity use of different types of glazing in different orientations in Hong Kong are shown in Figure 18. It can be observed that the room using vacuum PV glazing consumes the least cooling electricity for all orientations. The south facing room with vacuum PV glazing consumes about 705.56 kWh per year, which was approximately 14.2%, 9.8%, 8.4%, 7.1% and 4.1% less than the corresponding room with single-pane clear glazing, double-pane clear glazing, vacuum glazing, single-pane PV glazing and double-pane PV glazing, respectively. This is because the vacuum PV glazing have the lowest U-value and SHGC among all types of glazing, as shown in Table 4.3. A lower U-value indicates a higher level of heat insulation performance of the glazing, and a lower SHGC means less solar radiation will pass through the windows. Therefore, the vacuum PV glazing performs the best in the area with big temperature difference between indoor and outdoor environment. In addition, the most cooling electricity use of the office room occurs at the west orientation, followed by east, south and north. Therefore, east and west facing windows should have better solar heat insulation performance, to reduce heat gains from outside environment.
In addition to reduce the cooling load of the office room, the PV glazing can also generate electricity in situ. The annual electricity generation of the three types of PV glazing are shown in Figure 19. It can be seen that the annual electricity generation of the three types of PV glazing is similar to each other. The electricity generation from the vacuum PV glazing is a little less than the single-pane PV glazing due to increased solar cell temperature. However, since the temperature coefficient of the thin-film a-Si solar cells is small, the PV conversion efficiency is not reduced significantly. The annual electricity generation from a-Si PV glazing with 12.0% transmittance is around 113.81 kWh per year. Among all orientations, it is better to install PV glazing on the south facade in order to maximize the electricity output in Hong Kong. And it is not recommended to apply PV glazing on north façade due to limited solar radiation available.
Based on the results above, the vacuum PV glazing not only has the best thermal performance among all types of widely used glazing, but also produces a considerable amount of electricity per year. It is recommended to install vacuum PV glazing on south facade to perform the best overall energy performance.
(2) Simulation of the whole building
Apart from modelling studies conducted under the hot and humid climate of Hong Kong, the annual energy performance of different types of glazing in a cold region (i.e. Beijing) was also simulated for comparison. Simulation results are shown in Figure 20 and Figure 21. It can be observed that the room using the vacuum PV glazing achieves the lowest cooling consumption in both climates. In Beijing, the consumed cooling energy with the vacuum PV glazing is much smaller and is 30.2%, 20.8%, 17.0%, 13.8%, 4.4% less than that of the room with other types of glazing. It can be concluded that the energy saving potential of the vacuum PV glazing is much larger in a cold climate while the electricity generation is much higher during the summer time of Beijing due to the smaller solar incidence angle.
The developed simulation model was further applied to a 20-floor prototype office building. Typical floors of the building are divided into 5 conditioned zones, with a total floor area of 540 m2 (as shown in Figure 22). The reference case – Model 1 keeps all windows as the commonly used double-pane clear glazing, while the design cases include Model 2 and Model 3. Model 2 keeps the north-facing window as the conventional double-pane glazing while changes windows orientated to the other three directions to the developed vacuum PV glazing. The opaque part of all building facades is assumed to be covered with traditional crystalline BIPV with a power conversion efficiency of 15% to maximize the power generation potential of the building envelope. Model 3 shares similar settings with Model 2, except that the window transparency is tuned to 20% with a crystalline silicon (c-Si) as shown in Figure 23. Table 5 shows detailed settings of window properties for the three models respectively. The U-value and SHGC of a-Si vacuum PV glazing are obtained from previous experiments and those of double-pane clear glazing are calculated by the simulation software WINDOW. Thermal and power generation properties of c-Si vacuum PV glazing are obtained from existing literatures.
The simulation results of the total heat gain and loss through all windows are presented in Figure 24 and Figure 25. The heat gain and loss both decrease sharply when traditional double-pane clear glazing is replaced by the PV vacuum glazing. The obvious differences between these three models can be identified from the figures. Compared with the performance of Model 1, the heat gain through windows of Model 2 and Model 3 drops up to 77.89% and 77.97% (south-facing windows), while the heat loss of the two models declines up to 79.28% and 79.32% (south-facing windows), respectively.
On the other side, based on the peak office hour electricity price of 1.4 CNY/kWh for cooling and 0.25 CNY/kWh for heating from the Beijing authority, the simple payback period (See Figure 28) when applying the product to the west, east, and south façade is calculated to be 3.8, 4.6 and 5.3 years compared to the single-pane PV glazing. The payback periods are increased to 4.5, 5.4 and 6.5 years when compared with double-pane PV glazing as shown in Figure 29.
As a result, the product can be considered as a cost-effective application in building facades when considering its tremendous saving of air-conditioning energy and corresponding annual expenses. In addition, the property developer could also benefit from a potential increment in renting rates and popularity, if the building gets certified under a green building scheme by claiming credits in CO2 reduction and renewable application assessment criteria. All the abovementioned potential benefits with the application of the vacuum PV glazing would attract more attention from the construction industry.
3.4 Brief technical guideline for the vacuum PV glazingDesigning the vacuum PV glazing (i.e. vacuum BIPV curtain wall) system is a more complex process than a standard added-on PV system. The architectural context, structural requirements, economic considerations and building regulation requirements should all be considered, so that this brief guidance mainly focuses on the below aspects: design strategy, environmental variables, multifunctionality, installation situation, electrical components, and economic aspects (Polysolar Limited, 2015).
(1) Design strategy
Architects, property developers and building users become more inclined to consider renewable and energy efficient applications to meet building and planning regulations due to rising energy bills and awareness of environmental sustainability. The combination of PV and vacuum glazing is an innovative and promising solution to meet these requirements in the new building developments or refurbishment projects. As proved in the above sections of this report, the developed product offers the added advantage of providing a return of investment from the building envelope. Architectural and structural factors, as well as economic considerations should be taken into account at an early stage in any building projects to integrate renewable systems through a more satisfactory approach.
(2) Environmental variables
When designing a BIPV system, a compromise must be reached between the requirements of energy yield optimisation and those of the architectural environment. Therefore, the orientation, lighting performance, shading and temperature are the four mainly concerned issues in BIPV design. According to simulation and experimental results presented in the above sections, the optimal orientation of the installed PV glazing should be south for maximizing the annual power generation, while cooling load reduction is more conspicuous when the product is applied on the west and east facades. Therefore, it is preferable to install the product on all three facades for an optimal overall building energy-saving performance. The visible light transmittance is only 12% in the developed prototype, which might cause slightly more lighting power consumption compared to traditional double-pane clear glazing. However, the transmittance can be easily adjusted to higher than 20% in the manufacture process depending on the effective area of PV materials. There will always be a trade-off between power generation and permeable light, whereas this research has proved that the combined power generation and cooling load reduction can be more than the increased lighting energy use. Power generation performance of the a-Si PV is less sensitive to shadings, so that the prototype is subject to less influence from peripheral shadings. However, if we change the PV material to c-Si for higher conversion efficiency, a shading calculation should be conducted before allocating the BIPV glazing. Lastly, the conversion efficiency of a-Si glazing is also less sensitive to the increase of the panel temperature. The temperature coefficient must be considered if changing the PV material to c-Si.
The vacuum PV glazing was made by sandwiching a layer of PVB between an external PV laminated glass with a visible light transmittance of 12% and an internal vacuum glass. A low-e coating was also adopted to enhance its thermal performance. The structure of the vacuum PV glazing is shown in Figure 5. The dimension of the vacuum PV glazing is 1300 mm (width) × 1100 mm (height) × 20.87 mm (thickness), thinner than commonly used PV double glazed insulating glass units. Figure 6 presents the pictures of the sample of vacuum PV glazing.
This section presents the main findings and outcomes of the research project and indicates their potential impacts on the local energy use and construction industry. Achievements of the specified research objectives are illustrated, and limitations of the project are also mentioned for the reference of future studies.
3.1 Design and production of the prototype productInitially, we proposed a prototype design as specified by Figure 2, where the vacuum layer was directly coupled with the laminated PV panel. However, during initial manufacture trials, the air pressure difference between internal and external spaces of the vacuum glass samples produced by the laminating machine caused the breakage of the vacuum glass samples. Then, we followed an alternative approach using pre-pressure furnace, whereas the molten state of the polyvinyl butyral (PVB) could not meet the expected requirements and the bubbles greatly impacted the appearance and performance of PV module. Finally, we proposed the current product design based on the experience acquired from previous failures (See Figure 5).
The electrical specifications of the vacuum PV glazing under standard test conditions (STC: air mass 1.5, solar irradiation 1000 W/m2 and cell temperature 25°C) are shown in Table 2. Table 3 presents the given thermal and optical properties of the PV laminated glass and vacuum glass, respectively.
Model 1 Model 2 Model 3
Heat gain energy caused by windows in typical floor [ kWh ]
East Façade0
2000
6000
8000
10000
12000
14000
4000
South Façade West Façade North Façade
Figure 24 Heat gain through windows of three models
(3) Multi-functionality
Due to their mechanical structures, the PV vacuum glazing can perform the functions of the building envelope in addition to generating emission-free energy, and can thus substitute for conventional construction windows or curtain walls. Apart from power generation and architectural function, the product can provide solar shading with its low SHGC value. It can also act as thermal and sound insulation due to its low U-value and acoustic resistance caused by the vacuum chamber between glazing layers. If applied with special coatings/films on top of PV glazing, it can also provide weather protection.
(4) Mounting system and installation
Based on specific requirements of each project in each region, safety, loading capacity and PV installation specifications can have a decisive impact on the method of fixing/mounting the vacuum. We have in this guide attempted to provide a range of options, highlighting what is possible in current design. The product can be installed with a linear mounting system as mullion-transom facades or structural sealant glazing. It can also be mounted with point-fixing systems including clamp fixings and undercut anchor fixings or mounted into standard curtain walling, rain screen cladding and window systems.
(5) Electrical system
In the curtain wall system, several PV glazing with standard size are usually connected together in a string to form the power generator. The generated direct current is usually fed to an inverter where the direct current is converted to alternating current. If on-site storage is not available, which is the common case in urban areas, the electrical power is registered via an electricity meter and connected to the public supply grid, which will require special permissions from the power grid companies (e.g. CLP in Hong Kong). Therefore, the application of the product will require a full set of electrical systems including cables and connections for parallel or series arrays, direct current load-break switches, inverters and generation meters.
(6) Economic considerations
The economic benefits of the product mainly lie in the following aspects: the substitute for original construction component, CO2 emission reduction and corresponding electricity fee waving, compliance with relevant building regulations (i.e. BEAM Plus in Hong Kong) and application of the feed-in-tariff policy (remuneration for electricity generation from PV).
temperature measurements were conducted through the centre of the vacuum PV sample to calculate the U-value. Secondly, the solar heat gains coefficient (SHGC) of the vacuum PV glazing sample was obtained and compared with three other advanced glazing types in an indoor solar irradiation test. Lastly, an outdoor test was conducted on the platform of Block Z in The Hong Kong Polytechnic University to evaluate the overall thermal performance of vacuum PV glazing. A conventional double clear pane glazing was used as a baseline in the outdoor test.
surfaces shows a similar trend in the three directions. Summing up electricity generation in all floors, the integrated PV modules in Model 2 and 3 can provide 285074.72 kWh/year and 355226.3 kWh/year, which accounts for 13.27% and 16.54% of the total building energy consumption of Model 1. Therefore, given the energy use reduction due to less external heat gain, using the vacuum BIPV glazing can save 27.74% (Model 3) electricity compared to a reference building.

29 Construction Industry Council
The comparison of building energy between Model 1, Model 2 and Model 3 is summarized in Table 6, which includes energy use of lighting, equipment, district cooling and district heating. Although Model 2 and Model 3 consume slightly more lighting energy due to the reduced visible transmittance of the PV glazing, the great energy saving in cooling and heating leads to the net reduction in the total building energy consumption. The total energy consumption of the Model 2 and 3 declines by 20.77 and 22.37 kWh/m2, accounting for 10.44% and 11.20% of Model 1 respectively. Generated electricity of windows and walls in three directions is also presented in Table 7. The south window produced the most electricity, 1527.13 kWh for Model 2 and 3203.76 kWh for Model 3 in a year, taking up nearly 47.80% the total electricity generated by windows. As for the west window, the electricity generated in a year is close to that of east window. Electricity generated by wall
3.2 Experimental study of the vacuum PV glazingOutdoor experimental test was first conducted on the developed prototype vacuum PV (VPV) glazing with the standard size (1.1m × 1.3m), whose various parameters including the ambient air temperature, incident solar irradiation, surface temperatures of the vacuum PV glazing as well as the I-V curves and the power generation were measured and recorded. The power generation and thermal performances of the prototype were also analysed during the test. To further justify the advantage of the vacuum PV glazing, experimental studies were carried out to compare the thermal performance of scaled-down samples (0.3m × 0.3m) with other advanced windows.
(1) Energy performance of the prototypeIn order to evaluate the energy performance of the vacuum PV glazing, an outdoor field measurement was conducted on the platform of Block Z in The Hong Kong Polytechnic University. The vacuum PV glazing was set up horizontally 0.4m above the floor on stilts so that the external temperatures of both sides of the vacuum PV glazing were approximately equal. Various parameters were measured during this test, including the ambient air temperature, the exterior and transmitted horizontal incident solar irradiation, the outer and inner surface temperatures of the vacuum PV glazing as well as the I-V curves and the power generation from the vacuum PV glazing. All the data was logged at an interval of 1 minute. Power generation and thermal performances of the vacuum PV glazing were analyzed based on the outdoor tests. Figure 7 shows the exterior and transmitted incident solar irradiation. It can be seen that the average solar irradiation transmittance during the period is approximately 0.08. Such low transmittance means that vast majority of solar irradiation is blocked by the vacuum PV glazing. Figure 8 presents the outer and inner surface temperature of the vacuum PV glazing. It can be seen that the outer surface temperature is much higher than the inner surface temperature at daytime. The maximum outer surface temperature is 75.3°C, 30°C higher than the inner surface temperature, which indicates that most of the waste heat is dissipated from the outside surface of the vacuum PV glazing, and the heat transfer to the inside space by convection is mitigated. Thus, compared with the conventional single-glazed PV glazing, the structure of the vacuum PV glazing can help reduce the cooling load and improve the indoor thermal comfort.
Then the vacuum PV glazing was mounted on the front side of an experimental test chamber as shown in Figure 9. Clear glass was also adopted in this study for comparison. Figure 10 presents the instantaneous power output of the vacuum PV glazing in 2 sunny days. It can be seen that the power generation from the vacuum PV glazing is consistent with incident solar radiation. A comparative study in terms of internal air temperature of the chamber between the vacuum PV glazing and the clear glass was conducted in a day of June.
As shown in Figure 11, the internal air temperature in the chamber with the vacuum PV glazing is much lower than that with a clear glass. The measured average and maximum internal air temperature for the vacuum PV glazing is 39.6°C and 40.3°C, respectively, while the corresponding average and maximum internal air temperature of the clear glass are 43.6°C and 44.7°C. The maximum internal air temperature difference between the vacuum PV glazing and the clear glass is 4.4°C, occurring in the morning. There are three temperature peaks of internal air temperature. Since the ambient temperature was relatively stable, the main heat gain of the internal air temperature was from incident solar irradiation. The internal air temperature for vacuum PV glazing is much more stable compared with that for the clear glass. The reason is that the vacuum PV glazing has better heat insulation performance so that the internal air temperature is not affected by the external environment significantly. It can also be seen in this figure that the internal air temperature of the chamber drops continuously at 15:00, which shows that the incident solar irradiation on the façade decreases so that the heat gains of the internal air from the sun also drops.
(2) Comparison with other advanced windows
To further justify the advantage of the vacuum PV glazing, experimental studies were carried out to compare it with other advanced windows. Samples of different types of glazing were mounted on the top of two hotboxes (i.e. test rigs) with the uniform dimension of 300 mm (L) × 300 mm (W) × 450mm (H) to implement both indoor and outdoor tests. Firstly, a co-heating test methodology was adopted for the thermal analysis of the vacuum PV glazing. The test rig was filled with the ice-water mixture to ensure the temperature difference between the inside and outside glazing surfaces larger than 5°C. Heat flux and
Figure 12 shows the internal and external temperatures of the vacuum PV glazing sample. The presented data were selected after the hotbox achieved the steady-state condition, when the temperature difference was around 8°C. Heat flux though the glazing sample and the U-value were then determined as illustrated in Figure 13. The average heat flux from the vacuum glazing was measured to be 15.4 W/m2. And the average U-value was calculated as 1.5 W/m2 × K which is much lower than a regular double pane window with the U-value of 2.5W/m2 × K. Considering the edge heat transfer which would strongly affect the heat flux measurement when the sample is small, it can be expected that the centre U-valve of the vacuum PV glazing should be lower than 1.5 W/m2 × K for a larger scale application (e.g. 1.1m × 1.3m).
(3) Cost effective analysis based on simulation
To address the economic benefits of the developed product, the simple payback period of the vacuum PV glazing is calculated with reference to available PV glazing on the market in both Hong Kong and Beijing’s scenarios.
Based on an average electricity price of 1.25 HKD/kWh from HK Electric, the simple payback period (See Figure 26) when applying the product to the west and east façade is calculated to be 7.5 and 8.0 years compared to the single-pane PV glazing. The payback periods are increased to 8.6 and 8.8 years when compared with double-pane PV glazing as shown in Figure 27. However, when applied to the south façade, the extra initial cost of the product cannot be recovered within 10 years.
The solar simulator in the laboratory can provide relatively steady horizontal incident solar irradiation, so that test rigs were located at the same spot to ensure each window sample exposed to the same radiation level. As shown in Figure 14, SHGCs of the vacuum PV glazing and double-pane PV glazing are much smaller than those of the vacuum glazing and double clear glazing, because the coupled PV module can absorb most of the solar irradiation. The vacuum PV glazing has the lowest SHGC of 0.10 which can act as the excellent thermal insulation.
The outdoor test lasted four days from September 26th to September 30th. As shown in Figure 15, September 26th, 27th and 30th were cloudy days and September 28th could be considered as a sunny day. It can be found that the vacuum PV glazing blocks most solar irradiation compared with the double-pane glazing. Figure 16 presents the temperature profile of the vacuum PV glazing and double-pane glazing in the sunny day. The internal surface temperature of both glazing was much higher than the ambient temperature when the outside incident solar radiation is strong. The internal glazing surface and air temperatures of the test rig with the vacuum PV glazing are lower than those of the test rig with the double-pane glazing. The difference between the internal air temperatures of test rigs is much smaller than that of internal glazing surface temperatures. Therefore, the application of vacuum PV glazing can achieve better indoor environment by reducing the solar heat gain.
3.3 Simulation study of the vacuum PV glazing(1) Simulation of a generic building model
Although a series of field tests have been conducted in the outdoor test bed to study the power and thermal performances of the vacuum BIPV glazing, the experimental scenarios are impossible to represent all the situations and variables. Thus, the numerical study was conducted to comprehensively investigate and compare the energy performance of the vacuum PV glazing and other commonly used energy-efficient glazing. As detailed in the research methodology, a comprehensive simulation model based on EnergyPlus and WINDOW has been developed to simulate the overall energy performance of different windows taking into account of their thermal and power output performance. This model is used to simulate the overall energy performance of the vacuum BIPV curtain wall in comparison with other commonly used windows. The key properties of different types of glazing are shown in Table 4 and the electrical specifications of the PV glazing under standard test conditions are referenced to Table 2.
In order to simulate the annual thermal performance and power performance of these types of glazing in Hong Kong for comparison purpose, a typical office room model has been created for simulation, as shown in Figure 17. The dimension of the office model was 2.5m × 2.3m × 2.5m (L × W × H). This room has only one external wall with three identical windows exposed to the outdoor environment. Simulations were conducted for different orientations, i.e. south (S), east (E), west (W) and north (N). A heat transfer model and PV performance model in EnergyPlus are adopted to investigate
the thermal and power performance of different glazing. The heat transfer model is used to calculate the cooling loads of the office room. The cooling loads are then converted to electricity use of air-conditioning system with a presumed coefficient of performance (COP) of 2.78. The equivalent one-diode model is selected to simulate the annual electricity generation from PV elements. The typical meteorological year (TMY) in Hong Kong is selected a reasonable representation of local climates.
The annual cooling electricity use of different types of glazing in different orientations in Hong Kong are shown in Figure 18. It can be observed that the room using vacuum PV glazing consumes the least cooling electricity for all orientations. The south facing room with vacuum PV glazing consumes about 705.56 kWh per year, which was approximately 14.2%, 9.8%, 8.4%, 7.1% and 4.1% less than the corresponding room with single-pane clear glazing, double-pane clear glazing, vacuum glazing, single-pane PV glazing and double-pane PV glazing, respectively. This is because the vacuum PV glazing have the lowest U-value and SHGC among all types of glazing, as shown in Table 4.3. A lower U-value indicates a higher level of heat insulation performance of the glazing, and a lower SHGC means less solar radiation will pass through the windows. Therefore, the vacuum PV glazing performs the best in the area with big temperature difference between indoor and outdoor environment. In addition, the most cooling electricity use of the office room occurs at the west orientation, followed by east, south and north. Therefore, east and west facing windows should have better solar heat insulation performance, to reduce heat gains from outside environment.
In addition to reduce the cooling load of the office room, the PV glazing can also generate electricity in situ. The annual electricity generation of the three types of PV glazing are shown in Figure 19. It can be seen that the annual electricity generation of the three types of PV glazing is similar to each other. The electricity generation from the vacuum PV glazing is a little less than the single-pane PV glazing due to increased solar cell temperature. However, since the temperature coefficient of the thin-film a-Si solar cells is small, the PV conversion efficiency is not reduced significantly. The annual electricity generation from a-Si PV glazing with 12.0% transmittance is around 113.81 kWh per year. Among all orientations, it is better to install PV glazing on the south facade in order to maximize the electricity output in Hong Kong. And it is not recommended to apply PV glazing on north façade due to limited solar radiation available.
Based on the results above, the vacuum PV glazing not only has the best thermal performance among all types of widely used glazing, but also produces a considerable amount of electricity per year. It is recommended to install vacuum PV glazing on south facade to perform the best overall energy performance.
(2) Simulation of the whole building
Apart from modelling studies conducted under the hot and humid climate of Hong Kong, the annual energy performance of different types of glazing in a cold region (i.e. Beijing) was also simulated for comparison. Simulation results are shown in Figure 20 and Figure 21. It can be observed that the room using the vacuum PV glazing achieves the lowest cooling consumption in both climates. In Beijing, the consumed cooling energy with the vacuum PV glazing is much smaller and is 30.2%, 20.8%, 17.0%, 13.8%, 4.4% less than that of the room with other types of glazing. It can be concluded that the energy saving potential of the vacuum PV glazing is much larger in a cold climate while the electricity generation is much higher during the summer time of Beijing due to the smaller solar incidence angle.
The developed simulation model was further applied to a 20-floor prototype office building. Typical floors of the building are divided into 5 conditioned zones, with a total floor area of 540 m2 (as shown in Figure 22). The reference case – Model 1 keeps all windows as the commonly used double-pane clear glazing, while the design cases include Model 2 and Model 3. Model 2 keeps the north-facing window as the conventional double-pane glazing while changes windows orientated to the other three directions to the developed vacuum PV glazing. The opaque part of all building facades is assumed to be covered with traditional crystalline BIPV with a power conversion efficiency of 15% to maximize the power generation potential of the building envelope. Model 3 shares similar settings with Model 2, except that the window transparency is tuned to 20% with a crystalline silicon (c-Si) as shown in Figure 23. Table 5 shows detailed settings of window properties for the three models respectively. The U-value and SHGC of a-Si vacuum PV glazing are obtained from previous experiments and those of double-pane clear glazing are calculated by the simulation software WINDOW. Thermal and power generation properties of c-Si vacuum PV glazing are obtained from existing literatures.
The simulation results of the total heat gain and loss through all windows are presented in Figure 24 and Figure 25. The heat gain and loss both decrease sharply when traditional double-pane clear glazing is replaced by the PV vacuum glazing. The obvious differences between these three models can be identified from the figures. Compared with the performance of Model 1, the heat gain through windows of Model 2 and Model 3 drops up to 77.89% and 77.97% (south-facing windows), while the heat loss of the two models declines up to 79.28% and 79.32% (south-facing windows), respectively.
On the other side, based on the peak office hour electricity price of 1.4 CNY/kWh for cooling and 0.25 CNY/kWh for heating from the Beijing authority, the simple payback period (See Figure 28) when applying the product to the west, east, and south façade is calculated to be 3.8, 4.6 and 5.3 years compared to the single-pane PV glazing. The payback periods are increased to 4.5, 5.4 and 6.5 years when compared with double-pane PV glazing as shown in Figure 29.
As a result, the product can be considered as a cost-effective application in building facades when considering its tremendous saving of air-conditioning energy and corresponding annual expenses. In addition, the property developer could also benefit from a potential increment in renting rates and popularity, if the building gets certified under a green building scheme by claiming credits in CO2 reduction and renewable application assessment criteria. All the abovementioned potential benefits with the application of the vacuum PV glazing would attract more attention from the construction industry.
3.4 Brief technical guideline for the vacuum PV glazingDesigning the vacuum PV glazing (i.e. vacuum BIPV curtain wall) system is a more complex process than a standard added-on PV system. The architectural context, structural requirements, economic considerations and building regulation requirements should all be considered, so that this brief guidance mainly focuses on the below aspects: design strategy, environmental variables, multifunctionality, installation situation, electrical components, and economic aspects (Polysolar Limited, 2015).
(1) Design strategy
Architects, property developers and building users become more inclined to consider renewable and energy efficient applications to meet building and planning regulations due to rising energy bills and awareness of environmental sustainability. The combination of PV and vacuum glazing is an innovative and promising solution to meet these requirements in the new building developments or refurbishment projects. As proved in the above sections of this report, the developed product offers the added advantage of providing a return of investment from the building envelope. Architectural and structural factors, as well as economic considerations should be taken into account at an early stage in any building projects to integrate renewable systems through a more satisfactory approach.
(2) Environmental variables
When designing a BIPV system, a compromise must be reached between the requirements of energy yield optimisation and those of the architectural environment. Therefore, the orientation, lighting performance, shading and temperature are the four mainly concerned issues in BIPV design. According to simulation and experimental results presented in the above sections, the optimal orientation of the installed PV glazing should be south for maximizing the annual power generation, while cooling load reduction is more conspicuous when the product is applied on the west and east facades. Therefore, it is preferable to install the product on all three facades for an optimal overall building energy-saving performance. The visible light transmittance is only 12% in the developed prototype, which might cause slightly more lighting power consumption compared to traditional double-pane clear glazing. However, the transmittance can be easily adjusted to higher than 20% in the manufacture process depending on the effective area of PV materials. There will always be a trade-off between power generation and permeable light, whereas this research has proved that the combined power generation and cooling load reduction can be more than the increased lighting energy use. Power generation performance of the a-Si PV is less sensitive to shadings, so that the prototype is subject to less influence from peripheral shadings. However, if we change the PV material to c-Si for higher conversion efficiency, a shading calculation should be conducted before allocating the BIPV glazing. Lastly, the conversion efficiency of a-Si glazing is also less sensitive to the increase of the panel temperature. The temperature coefficient must be considered if changing the PV material to c-Si.
The vacuum PV glazing was made by sandwiching a layer of PVB between an external PV laminated glass with a visible light transmittance of 12% and an internal vacuum glass. A low-e coating was also adopted to enhance its thermal performance. The structure of the vacuum PV glazing is shown in Figure 5. The dimension of the vacuum PV glazing is 1300 mm (width) × 1100 mm (height) × 20.87 mm (thickness), thinner than commonly used PV double glazed insulating glass units. Figure 6 presents the pictures of the sample of vacuum PV glazing.
This section presents the main findings and outcomes of the research project and indicates their potential impacts on the local energy use and construction industry. Achievements of the specified research objectives are illustrated, and limitations of the project are also mentioned for the reference of future studies.
3.1 Design and production of the prototype productInitially, we proposed a prototype design as specified by Figure 2, where the vacuum layer was directly coupled with the laminated PV panel. However, during initial manufacture trials, the air pressure difference between internal and external spaces of the vacuum glass samples produced by the laminating machine caused the breakage of the vacuum glass samples. Then, we followed an alternative approach using pre-pressure furnace, whereas the molten state of the polyvinyl butyral (PVB) could not meet the expected requirements and the bubbles greatly impacted the appearance and performance of PV module. Finally, we proposed the current product design based on the experience acquired from previous failures (See Figure 5).
The electrical specifications of the vacuum PV glazing under standard test conditions (STC: air mass 1.5, solar irradiation 1000 W/m2 and cell temperature 25°C) are shown in Table 2. Table 3 presents the given thermal and optical properties of the PV laminated glass and vacuum glass, respectively.
Model 1 Model 2 Model 3
East Façade0
1000
2000
3000
4000
5000
South Façade West Façade North Façade
Heat loss energy caused by windows in typical floor [ kWh ]
Figure 25 Heat loss through windows of three models
(3) Multi-functionality
Due to their mechanical structures, the PV vacuum glazing can perform the functions of the building envelope in addition to generating emission-free energy, and can thus substitute for conventional construction windows or curtain walls. Apart from power generation and architectural function, the product can provide solar shading with its low SHGC value. It can also act as thermal and sound insulation due to its low U-value and acoustic resistance caused by the vacuum chamber between glazing layers. If applied with special coatings/films on top of PV glazing, it can also provide weather protection.
(4) Mounting system and installation
Based on specific requirements of each project in each region, safety, loading capacity and PV installation specifications can have a decisive impact on the method of fixing/mounting the vacuum. We have in this guide attempted to provide a range of options, highlighting what is possible in current design. The product can be installed with a linear mounting system as mullion-transom facades or structural sealant glazing. It can also be mounted with point-fixing systems including clamp fixings and undercut anchor fixings or mounted into standard curtain walling, rain screen cladding and window systems.
(5) Electrical system
In the curtain wall system, several PV glazing with standard size are usually connected together in a string to form the power generator. The generated direct current is usually fed to an inverter where the direct current is converted to alternating current. If on-site storage is not available, which is the common case in urban areas, the electrical power is registered via an electricity meter and connected to the public supply grid, which will require special permissions from the power grid companies (e.g. CLP in Hong Kong). Therefore, the application of the product will require a full set of electrical systems including cables and connections for parallel or series arrays, direct current load-break switches, inverters and generation meters.
(6) Economic considerations
The economic benefits of the product mainly lie in the following aspects: the substitute for original construction component, CO2 emission reduction and corresponding electricity fee waving, compliance with relevant building regulations (i.e. BEAM Plus in Hong Kong) and application of the feed-in-tariff policy (remuneration for electricity generation from PV).
temperature measurements were conducted through the centre of the vacuum PV sample to calculate the U-value. Secondly, the solar heat gains coefficient (SHGC) of the vacuum PV glazing sample was obtained and compared with three other advanced glazing types in an indoor solar irradiation test. Lastly, an outdoor test was conducted on the platform of Block Z in The Hong Kong Polytechnic University to evaluate the overall thermal performance of vacuum PV glazing. A conventional double clear pane glazing was used as a baseline in the outdoor test.
surfaces shows a similar trend in the three directions. Summing up electricity generation in all floors, the integrated PV modules in Model 2 and 3 can provide 285074.72 kWh/year and 355226.3 kWh/year, which accounts for 13.27% and 16.54% of the total building energy consumption of Model 1. Therefore, given the energy use reduction due to less external heat gain, using the vacuum BIPV glazing can save 27.74% (Model 3) electricity compared to a reference building.
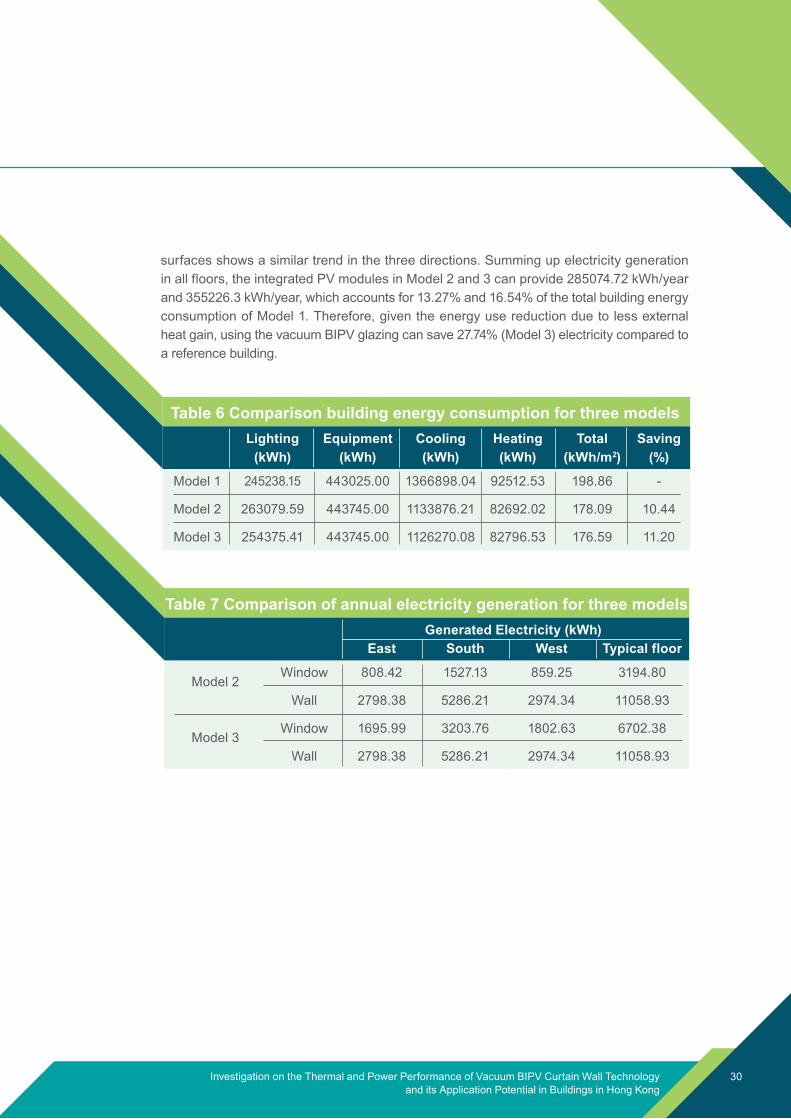
30Investigation on the Thermal and Power Performance of Vacuum BIPV Curtain Wall Technology and its Application Potential in Buildings in Hong Kong
The comparison of building energy between Model 1, Model 2 and Model 3 is summarized in Table 6, which includes energy use of lighting, equipment, district cooling and district heating. Although Model 2 and Model 3 consume slightly more lighting energy due to the reduced visible transmittance of the PV glazing, the great energy saving in cooling and heating leads to the net reduction in the total building energy consumption. The total energy consumption of the Model 2 and 3 declines by 20.77 and 22.37 kWh/m2, accounting for 10.44% and 11.20% of Model 1 respectively. Generated electricity of windows and walls in three directions is also presented in Table 7. The south window produced the most electricity, 1527.13 kWh for Model 2 and 3203.76 kWh for Model 3 in a year, taking up nearly 47.80% the total electricity generated by windows. As for the west window, the electricity generated in a year is close to that of east window. Electricity generated by wall
3.2 Experimental study of the vacuum PV glazingOutdoor experimental test was first conducted on the developed prototype vacuum PV (VPV) glazing with the standard size (1.1m × 1.3m), whose various parameters including the ambient air temperature, incident solar irradiation, surface temperatures of the vacuum PV glazing as well as the I-V curves and the power generation were measured and recorded. The power generation and thermal performances of the prototype were also analysed during the test. To further justify the advantage of the vacuum PV glazing, experimental studies were carried out to compare the thermal performance of scaled-down samples (0.3m × 0.3m) with other advanced windows.
(1) Energy performance of the prototypeIn order to evaluate the energy performance of the vacuum PV glazing, an outdoor field measurement was conducted on the platform of Block Z in The Hong Kong Polytechnic University. The vacuum PV glazing was set up horizontally 0.4m above the floor on stilts so that the external temperatures of both sides of the vacuum PV glazing were approximately equal. Various parameters were measured during this test, including the ambient air temperature, the exterior and transmitted horizontal incident solar irradiation, the outer and inner surface temperatures of the vacuum PV glazing as well as the I-V curves and the power generation from the vacuum PV glazing. All the data was logged at an interval of 1 minute. Power generation and thermal performances of the vacuum PV glazing were analyzed based on the outdoor tests. Figure 7 shows the exterior and transmitted incident solar irradiation. It can be seen that the average solar irradiation transmittance during the period is approximately 0.08. Such low transmittance means that vast majority of solar irradiation is blocked by the vacuum PV glazing. Figure 8 presents the outer and inner surface temperature of the vacuum PV glazing. It can be seen that the outer surface temperature is much higher than the inner surface temperature at daytime. The maximum outer surface temperature is 75.3°C, 30°C higher than the inner surface temperature, which indicates that most of the waste heat is dissipated from the outside surface of the vacuum PV glazing, and the heat transfer to the inside space by convection is mitigated. Thus, compared with the conventional single-glazed PV glazing, the structure of the vacuum PV glazing can help reduce the cooling load and improve the indoor thermal comfort.
Then the vacuum PV glazing was mounted on the front side of an experimental test chamber as shown in Figure 9. Clear glass was also adopted in this study for comparison. Figure 10 presents the instantaneous power output of the vacuum PV glazing in 2 sunny days. It can be seen that the power generation from the vacuum PV glazing is consistent with incident solar radiation. A comparative study in terms of internal air temperature of the chamber between the vacuum PV glazing and the clear glass was conducted in a day of June.
As shown in Figure 11, the internal air temperature in the chamber with the vacuum PV glazing is much lower than that with a clear glass. The measured average and maximum internal air temperature for the vacuum PV glazing is 39.6°C and 40.3°C, respectively, while the corresponding average and maximum internal air temperature of the clear glass are 43.6°C and 44.7°C. The maximum internal air temperature difference between the vacuum PV glazing and the clear glass is 4.4°C, occurring in the morning. There are three temperature peaks of internal air temperature. Since the ambient temperature was relatively stable, the main heat gain of the internal air temperature was from incident solar irradiation. The internal air temperature for vacuum PV glazing is much more stable compared with that for the clear glass. The reason is that the vacuum PV glazing has better heat insulation performance so that the internal air temperature is not affected by the external environment significantly. It can also be seen in this figure that the internal air temperature of the chamber drops continuously at 15:00, which shows that the incident solar irradiation on the façade decreases so that the heat gains of the internal air from the sun also drops.
(2) Comparison with other advanced windows
To further justify the advantage of the vacuum PV glazing, experimental studies were carried out to compare it with other advanced windows. Samples of different types of glazing were mounted on the top of two hotboxes (i.e. test rigs) with the uniform dimension of 300 mm (L) × 300 mm (W) × 450mm (H) to implement both indoor and outdoor tests. Firstly, a co-heating test methodology was adopted for the thermal analysis of the vacuum PV glazing. The test rig was filled with the ice-water mixture to ensure the temperature difference between the inside and outside glazing surfaces larger than 5°C. Heat flux and
Figure 12 shows the internal and external temperatures of the vacuum PV glazing sample. The presented data were selected after the hotbox achieved the steady-state condition, when the temperature difference was around 8°C. Heat flux though the glazing sample and the U-value were then determined as illustrated in Figure 13. The average heat flux from the vacuum glazing was measured to be 15.4 W/m2. And the average U-value was calculated as 1.5 W/m2 × K which is much lower than a regular double pane window with the U-value of 2.5W/m2 × K. Considering the edge heat transfer which would strongly affect the heat flux measurement when the sample is small, it can be expected that the centre U-valve of the vacuum PV glazing should be lower than 1.5 W/m2 × K for a larger scale application (e.g. 1.1m × 1.3m).
(3) Cost effective analysis based on simulation
To address the economic benefits of the developed product, the simple payback period of the vacuum PV glazing is calculated with reference to available PV glazing on the market in both Hong Kong and Beijing’s scenarios.
Based on an average electricity price of 1.25 HKD/kWh from HK Electric, the simple payback period (See Figure 26) when applying the product to the west and east façade is calculated to be 7.5 and 8.0 years compared to the single-pane PV glazing. The payback periods are increased to 8.6 and 8.8 years when compared with double-pane PV glazing as shown in Figure 27. However, when applied to the south façade, the extra initial cost of the product cannot be recovered within 10 years.
The solar simulator in the laboratory can provide relatively steady horizontal incident solar irradiation, so that test rigs were located at the same spot to ensure each window sample exposed to the same radiation level. As shown in Figure 14, SHGCs of the vacuum PV glazing and double-pane PV glazing are much smaller than those of the vacuum glazing and double clear glazing, because the coupled PV module can absorb most of the solar irradiation. The vacuum PV glazing has the lowest SHGC of 0.10 which can act as the excellent thermal insulation.
The outdoor test lasted four days from September 26th to September 30th. As shown in Figure 15, September 26th, 27th and 30th were cloudy days and September 28th could be considered as a sunny day. It can be found that the vacuum PV glazing blocks most solar irradiation compared with the double-pane glazing. Figure 16 presents the temperature profile of the vacuum PV glazing and double-pane glazing in the sunny day. The internal surface temperature of both glazing was much higher than the ambient temperature when the outside incident solar radiation is strong. The internal glazing surface and air temperatures of the test rig with the vacuum PV glazing are lower than those of the test rig with the double-pane glazing. The difference between the internal air temperatures of test rigs is much smaller than that of internal glazing surface temperatures. Therefore, the application of vacuum PV glazing can achieve better indoor environment by reducing the solar heat gain.
3.3 Simulation study of the vacuum PV glazing(1) Simulation of a generic building model
Although a series of field tests have been conducted in the outdoor test bed to study the power and thermal performances of the vacuum BIPV glazing, the experimental scenarios are impossible to represent all the situations and variables. Thus, the numerical study was conducted to comprehensively investigate and compare the energy performance of the vacuum PV glazing and other commonly used energy-efficient glazing. As detailed in the research methodology, a comprehensive simulation model based on EnergyPlus and WINDOW has been developed to simulate the overall energy performance of different windows taking into account of their thermal and power output performance. This model is used to simulate the overall energy performance of the vacuum BIPV curtain wall in comparison with other commonly used windows. The key properties of different types of glazing are shown in Table 4 and the electrical specifications of the PV glazing under standard test conditions are referenced to Table 2.
In order to simulate the annual thermal performance and power performance of these types of glazing in Hong Kong for comparison purpose, a typical office room model has been created for simulation, as shown in Figure 17. The dimension of the office model was 2.5m × 2.3m × 2.5m (L × W × H). This room has only one external wall with three identical windows exposed to the outdoor environment. Simulations were conducted for different orientations, i.e. south (S), east (E), west (W) and north (N). A heat transfer model and PV performance model in EnergyPlus are adopted to investigate
the thermal and power performance of different glazing. The heat transfer model is used to calculate the cooling loads of the office room. The cooling loads are then converted to electricity use of air-conditioning system with a presumed coefficient of performance (COP) of 2.78. The equivalent one-diode model is selected to simulate the annual electricity generation from PV elements. The typical meteorological year (TMY) in Hong Kong is selected a reasonable representation of local climates.
The annual cooling electricity use of different types of glazing in different orientations in Hong Kong are shown in Figure 18. It can be observed that the room using vacuum PV glazing consumes the least cooling electricity for all orientations. The south facing room with vacuum PV glazing consumes about 705.56 kWh per year, which was approximately 14.2%, 9.8%, 8.4%, 7.1% and 4.1% less than the corresponding room with single-pane clear glazing, double-pane clear glazing, vacuum glazing, single-pane PV glazing and double-pane PV glazing, respectively. This is because the vacuum PV glazing have the lowest U-value and SHGC among all types of glazing, as shown in Table 4.3. A lower U-value indicates a higher level of heat insulation performance of the glazing, and a lower SHGC means less solar radiation will pass through the windows. Therefore, the vacuum PV glazing performs the best in the area with big temperature difference between indoor and outdoor environment. In addition, the most cooling electricity use of the office room occurs at the west orientation, followed by east, south and north. Therefore, east and west facing windows should have better solar heat insulation performance, to reduce heat gains from outside environment.
In addition to reduce the cooling load of the office room, the PV glazing can also generate electricity in situ. The annual electricity generation of the three types of PV glazing are shown in Figure 19. It can be seen that the annual electricity generation of the three types of PV glazing is similar to each other. The electricity generation from the vacuum PV glazing is a little less than the single-pane PV glazing due to increased solar cell temperature. However, since the temperature coefficient of the thin-film a-Si solar cells is small, the PV conversion efficiency is not reduced significantly. The annual electricity generation from a-Si PV glazing with 12.0% transmittance is around 113.81 kWh per year. Among all orientations, it is better to install PV glazing on the south facade in order to maximize the electricity output in Hong Kong. And it is not recommended to apply PV glazing on north façade due to limited solar radiation available.
Based on the results above, the vacuum PV glazing not only has the best thermal performance among all types of widely used glazing, but also produces a considerable amount of electricity per year. It is recommended to install vacuum PV glazing on south facade to perform the best overall energy performance.
(2) Simulation of the whole building
Apart from modelling studies conducted under the hot and humid climate of Hong Kong, the annual energy performance of different types of glazing in a cold region (i.e. Beijing) was also simulated for comparison. Simulation results are shown in Figure 20 and Figure 21. It can be observed that the room using the vacuum PV glazing achieves the lowest cooling consumption in both climates. In Beijing, the consumed cooling energy with the vacuum PV glazing is much smaller and is 30.2%, 20.8%, 17.0%, 13.8%, 4.4% less than that of the room with other types of glazing. It can be concluded that the energy saving potential of the vacuum PV glazing is much larger in a cold climate while the electricity generation is much higher during the summer time of Beijing due to the smaller solar incidence angle.
The developed simulation model was further applied to a 20-floor prototype office building. Typical floors of the building are divided into 5 conditioned zones, with a total floor area of 540 m2 (as shown in Figure 22). The reference case – Model 1 keeps all windows as the commonly used double-pane clear glazing, while the design cases include Model 2 and Model 3. Model 2 keeps the north-facing window as the conventional double-pane glazing while changes windows orientated to the other three directions to the developed vacuum PV glazing. The opaque part of all building facades is assumed to be covered with traditional crystalline BIPV with a power conversion efficiency of 15% to maximize the power generation potential of the building envelope. Model 3 shares similar settings with Model 2, except that the window transparency is tuned to 20% with a crystalline silicon (c-Si) as shown in Figure 23. Table 5 shows detailed settings of window properties for the three models respectively. The U-value and SHGC of a-Si vacuum PV glazing are obtained from previous experiments and those of double-pane clear glazing are calculated by the simulation software WINDOW. Thermal and power generation properties of c-Si vacuum PV glazing are obtained from existing literatures.
The simulation results of the total heat gain and loss through all windows are presented in Figure 24 and Figure 25. The heat gain and loss both decrease sharply when traditional double-pane clear glazing is replaced by the PV vacuum glazing. The obvious differences between these three models can be identified from the figures. Compared with the performance of Model 1, the heat gain through windows of Model 2 and Model 3 drops up to 77.89% and 77.97% (south-facing windows), while the heat loss of the two models declines up to 79.28% and 79.32% (south-facing windows), respectively.
On the other side, based on the peak office hour electricity price of 1.4 CNY/kWh for cooling and 0.25 CNY/kWh for heating from the Beijing authority, the simple payback period (See Figure 28) when applying the product to the west, east, and south façade is calculated to be 3.8, 4.6 and 5.3 years compared to the single-pane PV glazing. The payback periods are increased to 4.5, 5.4 and 6.5 years when compared with double-pane PV glazing as shown in Figure 29.
As a result, the product can be considered as a cost-effective application in building facades when considering its tremendous saving of air-conditioning energy and corresponding annual expenses. In addition, the property developer could also benefit from a potential increment in renting rates and popularity, if the building gets certified under a green building scheme by claiming credits in CO2 reduction and renewable application assessment criteria. All the abovementioned potential benefits with the application of the vacuum PV glazing would attract more attention from the construction industry.
3.4 Brief technical guideline for the vacuum PV glazingDesigning the vacuum PV glazing (i.e. vacuum BIPV curtain wall) system is a more complex process than a standard added-on PV system. The architectural context, structural requirements, economic considerations and building regulation requirements should all be considered, so that this brief guidance mainly focuses on the below aspects: design strategy, environmental variables, multifunctionality, installation situation, electrical components, and economic aspects (Polysolar Limited, 2015).
(1) Design strategy
Architects, property developers and building users become more inclined to consider renewable and energy efficient applications to meet building and planning regulations due to rising energy bills and awareness of environmental sustainability. The combination of PV and vacuum glazing is an innovative and promising solution to meet these requirements in the new building developments or refurbishment projects. As proved in the above sections of this report, the developed product offers the added advantage of providing a return of investment from the building envelope. Architectural and structural factors, as well as economic considerations should be taken into account at an early stage in any building projects to integrate renewable systems through a more satisfactory approach.
(2) Environmental variables
When designing a BIPV system, a compromise must be reached between the requirements of energy yield optimisation and those of the architectural environment. Therefore, the orientation, lighting performance, shading and temperature are the four mainly concerned issues in BIPV design. According to simulation and experimental results presented in the above sections, the optimal orientation of the installed PV glazing should be south for maximizing the annual power generation, while cooling load reduction is more conspicuous when the product is applied on the west and east facades. Therefore, it is preferable to install the product on all three facades for an optimal overall building energy-saving performance. The visible light transmittance is only 12% in the developed prototype, which might cause slightly more lighting power consumption compared to traditional double-pane clear glazing. However, the transmittance can be easily adjusted to higher than 20% in the manufacture process depending on the effective area of PV materials. There will always be a trade-off between power generation and permeable light, whereas this research has proved that the combined power generation and cooling load reduction can be more than the increased lighting energy use. Power generation performance of the a-Si PV is less sensitive to shadings, so that the prototype is subject to less influence from peripheral shadings. However, if we change the PV material to c-Si for higher conversion efficiency, a shading calculation should be conducted before allocating the BIPV glazing. Lastly, the conversion efficiency of a-Si glazing is also less sensitive to the increase of the panel temperature. The temperature coefficient must be considered if changing the PV material to c-Si.
The vacuum PV glazing was made by sandwiching a layer of PVB between an external PV laminated glass with a visible light transmittance of 12% and an internal vacuum glass. A low-e coating was also adopted to enhance its thermal performance. The structure of the vacuum PV glazing is shown in Figure 5. The dimension of the vacuum PV glazing is 1300 mm (width) × 1100 mm (height) × 20.87 mm (thickness), thinner than commonly used PV double glazed insulating glass units. Figure 6 presents the pictures of the sample of vacuum PV glazing.
This section presents the main findings and outcomes of the research project and indicates their potential impacts on the local energy use and construction industry. Achievements of the specified research objectives are illustrated, and limitations of the project are also mentioned for the reference of future studies.
3.1 Design and production of the prototype productInitially, we proposed a prototype design as specified by Figure 2, where the vacuum layer was directly coupled with the laminated PV panel. However, during initial manufacture trials, the air pressure difference between internal and external spaces of the vacuum glass samples produced by the laminating machine caused the breakage of the vacuum glass samples. Then, we followed an alternative approach using pre-pressure furnace, whereas the molten state of the polyvinyl butyral (PVB) could not meet the expected requirements and the bubbles greatly impacted the appearance and performance of PV module. Finally, we proposed the current product design based on the experience acquired from previous failures (See Figure 5).
The electrical specifications of the vacuum PV glazing under standard test conditions (STC: air mass 1.5, solar irradiation 1000 W/m2 and cell temperature 25°C) are shown in Table 2. Table 3 presents the given thermal and optical properties of the PV laminated glass and vacuum glass, respectively.
Table 7 Comparison of annual electricity generation for three models Generated Electricity (kWh) East South West Typical floor
Model 2
Window 808.42 1527.13 859.25 3194.80
Wall 2798.38 5286.21 2974.34 11058.93
Model 3 Window 1695.99 3203.76 1802.63 6702.38
Wall 2798.38 5286.21 2974.34 11058.93
Table 6 Comparison building energy consumption for three models Lighting
Equipment
Cooling Heating
Total
Saving
(kWh) (kWh) (kWh) (kWh) (kWh/m2) (%)
Model 1 245238.15 443025.00 1366898.04 92512.53 198.86 -
Model 2 263079.59 443745.00 1133876.21 82692.02 178.09 10.44
Model 3 254375.41 443745.00 1126270.08 82796.53 176.59 11.20
(3) Multi-functionality
Due to their mechanical structures, the PV vacuum glazing can perform the functions of the building envelope in addition to generating emission-free energy, and can thus substitute for conventional construction windows or curtain walls. Apart from power generation and architectural function, the product can provide solar shading with its low SHGC value. It can also act as thermal and sound insulation due to its low U-value and acoustic resistance caused by the vacuum chamber between glazing layers. If applied with special coatings/films on top of PV glazing, it can also provide weather protection.
(4) Mounting system and installation
Based on specific requirements of each project in each region, safety, loading capacity and PV installation specifications can have a decisive impact on the method of fixing/mounting the vacuum. We have in this guide attempted to provide a range of options, highlighting what is possible in current design. The product can be installed with a linear mounting system as mullion-transom facades or structural sealant glazing. It can also be mounted with point-fixing systems including clamp fixings and undercut anchor fixings or mounted into standard curtain walling, rain screen cladding and window systems.
(5) Electrical system
In the curtain wall system, several PV glazing with standard size are usually connected together in a string to form the power generator. The generated direct current is usually fed to an inverter where the direct current is converted to alternating current. If on-site storage is not available, which is the common case in urban areas, the electrical power is registered via an electricity meter and connected to the public supply grid, which will require special permissions from the power grid companies (e.g. CLP in Hong Kong). Therefore, the application of the product will require a full set of electrical systems including cables and connections for parallel or series arrays, direct current load-break switches, inverters and generation meters.
(6) Economic considerations
The economic benefits of the product mainly lie in the following aspects: the substitute for original construction component, CO2 emission reduction and corresponding electricity fee waving, compliance with relevant building regulations (i.e. BEAM Plus in Hong Kong) and application of the feed-in-tariff policy (remuneration for electricity generation from PV).
temperature measurements were conducted through the centre of the vacuum PV sample to calculate the U-value. Secondly, the solar heat gains coefficient (SHGC) of the vacuum PV glazing sample was obtained and compared with three other advanced glazing types in an indoor solar irradiation test. Lastly, an outdoor test was conducted on the platform of Block Z in The Hong Kong Polytechnic University to evaluate the overall thermal performance of vacuum PV glazing. A conventional double clear pane glazing was used as a baseline in the outdoor test.
surfaces shows a similar trend in the three directions. Summing up electricity generation in all floors, the integrated PV modules in Model 2 and 3 can provide 285074.72 kWh/year and 355226.3 kWh/year, which accounts for 13.27% and 16.54% of the total building energy consumption of Model 1. Therefore, given the energy use reduction due to less external heat gain, using the vacuum BIPV glazing can save 27.74% (Model 3) electricity compared to a reference building.

31 Construction Industry Council
The comparison of building energy between Model 1, Model 2 and Model 3 is summarized in Table 6, which includes energy use of lighting, equipment, district cooling and district heating. Although Model 2 and Model 3 consume slightly more lighting energy due to the reduced visible transmittance of the PV glazing, the great energy saving in cooling and heating leads to the net reduction in the total building energy consumption. The total energy consumption of the Model 2 and 3 declines by 20.77 and 22.37 kWh/m2, accounting for 10.44% and 11.20% of Model 1 respectively. Generated electricity of windows and walls in three directions is also presented in Table 7. The south window produced the most electricity, 1527.13 kWh for Model 2 and 3203.76 kWh for Model 3 in a year, taking up nearly 47.80% the total electricity generated by windows. As for the west window, the electricity generated in a year is close to that of east window. Electricity generated by wall
3.2 Experimental study of the vacuum PV glazingOutdoor experimental test was first conducted on the developed prototype vacuum PV (VPV) glazing with the standard size (1.1m × 1.3m), whose various parameters including the ambient air temperature, incident solar irradiation, surface temperatures of the vacuum PV glazing as well as the I-V curves and the power generation were measured and recorded. The power generation and thermal performances of the prototype were also analysed during the test. To further justify the advantage of the vacuum PV glazing, experimental studies were carried out to compare the thermal performance of scaled-down samples (0.3m × 0.3m) with other advanced windows.
(1) Energy performance of the prototypeIn order to evaluate the energy performance of the vacuum PV glazing, an outdoor field measurement was conducted on the platform of Block Z in The Hong Kong Polytechnic University. The vacuum PV glazing was set up horizontally 0.4m above the floor on stilts so that the external temperatures of both sides of the vacuum PV glazing were approximately equal. Various parameters were measured during this test, including the ambient air temperature, the exterior and transmitted horizontal incident solar irradiation, the outer and inner surface temperatures of the vacuum PV glazing as well as the I-V curves and the power generation from the vacuum PV glazing. All the data was logged at an interval of 1 minute. Power generation and thermal performances of the vacuum PV glazing were analyzed based on the outdoor tests. Figure 7 shows the exterior and transmitted incident solar irradiation. It can be seen that the average solar irradiation transmittance during the period is approximately 0.08. Such low transmittance means that vast majority of solar irradiation is blocked by the vacuum PV glazing. Figure 8 presents the outer and inner surface temperature of the vacuum PV glazing. It can be seen that the outer surface temperature is much higher than the inner surface temperature at daytime. The maximum outer surface temperature is 75.3°C, 30°C higher than the inner surface temperature, which indicates that most of the waste heat is dissipated from the outside surface of the vacuum PV glazing, and the heat transfer to the inside space by convection is mitigated. Thus, compared with the conventional single-glazed PV glazing, the structure of the vacuum PV glazing can help reduce the cooling load and improve the indoor thermal comfort.
Then the vacuum PV glazing was mounted on the front side of an experimental test chamber as shown in Figure 9. Clear glass was also adopted in this study for comparison. Figure 10 presents the instantaneous power output of the vacuum PV glazing in 2 sunny days. It can be seen that the power generation from the vacuum PV glazing is consistent with incident solar radiation. A comparative study in terms of internal air temperature of the chamber between the vacuum PV glazing and the clear glass was conducted in a day of June.
As shown in Figure 11, the internal air temperature in the chamber with the vacuum PV glazing is much lower than that with a clear glass. The measured average and maximum internal air temperature for the vacuum PV glazing is 39.6°C and 40.3°C, respectively, while the corresponding average and maximum internal air temperature of the clear glass are 43.6°C and 44.7°C. The maximum internal air temperature difference between the vacuum PV glazing and the clear glass is 4.4°C, occurring in the morning. There are three temperature peaks of internal air temperature. Since the ambient temperature was relatively stable, the main heat gain of the internal air temperature was from incident solar irradiation. The internal air temperature for vacuum PV glazing is much more stable compared with that for the clear glass. The reason is that the vacuum PV glazing has better heat insulation performance so that the internal air temperature is not affected by the external environment significantly. It can also be seen in this figure that the internal air temperature of the chamber drops continuously at 15:00, which shows that the incident solar irradiation on the façade decreases so that the heat gains of the internal air from the sun also drops.
(2) Comparison with other advanced windows
To further justify the advantage of the vacuum PV glazing, experimental studies were carried out to compare it with other advanced windows. Samples of different types of glazing were mounted on the top of two hotboxes (i.e. test rigs) with the uniform dimension of 300 mm (L) × 300 mm (W) × 450mm (H) to implement both indoor and outdoor tests. Firstly, a co-heating test methodology was adopted for the thermal analysis of the vacuum PV glazing. The test rig was filled with the ice-water mixture to ensure the temperature difference between the inside and outside glazing surfaces larger than 5°C. Heat flux and
Figure 12 shows the internal and external temperatures of the vacuum PV glazing sample. The presented data were selected after the hotbox achieved the steady-state condition, when the temperature difference was around 8°C. Heat flux though the glazing sample and the U-value were then determined as illustrated in Figure 13. The average heat flux from the vacuum glazing was measured to be 15.4 W/m2. And the average U-value was calculated as 1.5 W/m2 × K which is much lower than a regular double pane window with the U-value of 2.5W/m2 × K. Considering the edge heat transfer which would strongly affect the heat flux measurement when the sample is small, it can be expected that the centre U-valve of the vacuum PV glazing should be lower than 1.5 W/m2 × K for a larger scale application (e.g. 1.1m × 1.3m).
(3) Cost effective analysis based on simulation
To address the economic benefits of the developed product, the simple payback period of the vacuum PV glazing is calculated with reference to available PV glazing on the market in both Hong Kong and Beijing’s scenarios.
Based on an average electricity price of 1.25 HKD/kWh from HK Electric, the simple payback period (See Figure 26) when applying the product to the west and east façade is calculated to be 7.5 and 8.0 years compared to the single-pane PV glazing. The payback periods are increased to 8.6 and 8.8 years when compared with double-pane PV glazing as shown in Figure 27. However, when applied to the south façade, the extra initial cost of the product cannot be recovered within 10 years.
The solar simulator in the laboratory can provide relatively steady horizontal incident solar irradiation, so that test rigs were located at the same spot to ensure each window sample exposed to the same radiation level. As shown in Figure 14, SHGCs of the vacuum PV glazing and double-pane PV glazing are much smaller than those of the vacuum glazing and double clear glazing, because the coupled PV module can absorb most of the solar irradiation. The vacuum PV glazing has the lowest SHGC of 0.10 which can act as the excellent thermal insulation.
The outdoor test lasted four days from September 26th to September 30th. As shown in Figure 15, September 26th, 27th and 30th were cloudy days and September 28th could be considered as a sunny day. It can be found that the vacuum PV glazing blocks most solar irradiation compared with the double-pane glazing. Figure 16 presents the temperature profile of the vacuum PV glazing and double-pane glazing in the sunny day. The internal surface temperature of both glazing was much higher than the ambient temperature when the outside incident solar radiation is strong. The internal glazing surface and air temperatures of the test rig with the vacuum PV glazing are lower than those of the test rig with the double-pane glazing. The difference between the internal air temperatures of test rigs is much smaller than that of internal glazing surface temperatures. Therefore, the application of vacuum PV glazing can achieve better indoor environment by reducing the solar heat gain.
3.3 Simulation study of the vacuum PV glazing(1) Simulation of a generic building model
Although a series of field tests have been conducted in the outdoor test bed to study the power and thermal performances of the vacuum BIPV glazing, the experimental scenarios are impossible to represent all the situations and variables. Thus, the numerical study was conducted to comprehensively investigate and compare the energy performance of the vacuum PV glazing and other commonly used energy-efficient glazing. As detailed in the research methodology, a comprehensive simulation model based on EnergyPlus and WINDOW has been developed to simulate the overall energy performance of different windows taking into account of their thermal and power output performance. This model is used to simulate the overall energy performance of the vacuum BIPV curtain wall in comparison with other commonly used windows. The key properties of different types of glazing are shown in Table 4 and the electrical specifications of the PV glazing under standard test conditions are referenced to Table 2.
In order to simulate the annual thermal performance and power performance of these types of glazing in Hong Kong for comparison purpose, a typical office room model has been created for simulation, as shown in Figure 17. The dimension of the office model was 2.5m × 2.3m × 2.5m (L × W × H). This room has only one external wall with three identical windows exposed to the outdoor environment. Simulations were conducted for different orientations, i.e. south (S), east (E), west (W) and north (N). A heat transfer model and PV performance model in EnergyPlus are adopted to investigate
the thermal and power performance of different glazing. The heat transfer model is used to calculate the cooling loads of the office room. The cooling loads are then converted to electricity use of air-conditioning system with a presumed coefficient of performance (COP) of 2.78. The equivalent one-diode model is selected to simulate the annual electricity generation from PV elements. The typical meteorological year (TMY) in Hong Kong is selected a reasonable representation of local climates.
The annual cooling electricity use of different types of glazing in different orientations in Hong Kong are shown in Figure 18. It can be observed that the room using vacuum PV glazing consumes the least cooling electricity for all orientations. The south facing room with vacuum PV glazing consumes about 705.56 kWh per year, which was approximately 14.2%, 9.8%, 8.4%, 7.1% and 4.1% less than the corresponding room with single-pane clear glazing, double-pane clear glazing, vacuum glazing, single-pane PV glazing and double-pane PV glazing, respectively. This is because the vacuum PV glazing have the lowest U-value and SHGC among all types of glazing, as shown in Table 4.3. A lower U-value indicates a higher level of heat insulation performance of the glazing, and a lower SHGC means less solar radiation will pass through the windows. Therefore, the vacuum PV glazing performs the best in the area with big temperature difference between indoor and outdoor environment. In addition, the most cooling electricity use of the office room occurs at the west orientation, followed by east, south and north. Therefore, east and west facing windows should have better solar heat insulation performance, to reduce heat gains from outside environment.
In addition to reduce the cooling load of the office room, the PV glazing can also generate electricity in situ. The annual electricity generation of the three types of PV glazing are shown in Figure 19. It can be seen that the annual electricity generation of the three types of PV glazing is similar to each other. The electricity generation from the vacuum PV glazing is a little less than the single-pane PV glazing due to increased solar cell temperature. However, since the temperature coefficient of the thin-film a-Si solar cells is small, the PV conversion efficiency is not reduced significantly. The annual electricity generation from a-Si PV glazing with 12.0% transmittance is around 113.81 kWh per year. Among all orientations, it is better to install PV glazing on the south facade in order to maximize the electricity output in Hong Kong. And it is not recommended to apply PV glazing on north façade due to limited solar radiation available.
Based on the results above, the vacuum PV glazing not only has the best thermal performance among all types of widely used glazing, but also produces a considerable amount of electricity per year. It is recommended to install vacuum PV glazing on south facade to perform the best overall energy performance.
(2) Simulation of the whole building
Apart from modelling studies conducted under the hot and humid climate of Hong Kong, the annual energy performance of different types of glazing in a cold region (i.e. Beijing) was also simulated for comparison. Simulation results are shown in Figure 20 and Figure 21. It can be observed that the room using the vacuum PV glazing achieves the lowest cooling consumption in both climates. In Beijing, the consumed cooling energy with the vacuum PV glazing is much smaller and is 30.2%, 20.8%, 17.0%, 13.8%, 4.4% less than that of the room with other types of glazing. It can be concluded that the energy saving potential of the vacuum PV glazing is much larger in a cold climate while the electricity generation is much higher during the summer time of Beijing due to the smaller solar incidence angle.
The developed simulation model was further applied to a 20-floor prototype office building. Typical floors of the building are divided into 5 conditioned zones, with a total floor area of 540 m2 (as shown in Figure 22). The reference case – Model 1 keeps all windows as the commonly used double-pane clear glazing, while the design cases include Model 2 and Model 3. Model 2 keeps the north-facing window as the conventional double-pane glazing while changes windows orientated to the other three directions to the developed vacuum PV glazing. The opaque part of all building facades is assumed to be covered with traditional crystalline BIPV with a power conversion efficiency of 15% to maximize the power generation potential of the building envelope. Model 3 shares similar settings with Model 2, except that the window transparency is tuned to 20% with a crystalline silicon (c-Si) as shown in Figure 23. Table 5 shows detailed settings of window properties for the three models respectively. The U-value and SHGC of a-Si vacuum PV glazing are obtained from previous experiments and those of double-pane clear glazing are calculated by the simulation software WINDOW. Thermal and power generation properties of c-Si vacuum PV glazing are obtained from existing literatures.
The simulation results of the total heat gain and loss through all windows are presented in Figure 24 and Figure 25. The heat gain and loss both decrease sharply when traditional double-pane clear glazing is replaced by the PV vacuum glazing. The obvious differences between these three models can be identified from the figures. Compared with the performance of Model 1, the heat gain through windows of Model 2 and Model 3 drops up to 77.89% and 77.97% (south-facing windows), while the heat loss of the two models declines up to 79.28% and 79.32% (south-facing windows), respectively.
On the other side, based on the peak office hour electricity price of 1.4 CNY/kWh for cooling and 0.25 CNY/kWh for heating from the Beijing authority, the simple payback period (See Figure 28) when applying the product to the west, east, and south façade is calculated to be 3.8, 4.6 and 5.3 years compared to the single-pane PV glazing. The payback periods are increased to 4.5, 5.4 and 6.5 years when compared with double-pane PV glazing as shown in Figure 29.
As a result, the product can be considered as a cost-effective application in building facades when considering its tremendous saving of air-conditioning energy and corresponding annual expenses. In addition, the property developer could also benefit from a potential increment in renting rates and popularity, if the building gets certified under a green building scheme by claiming credits in CO2 reduction and renewable application assessment criteria. All the abovementioned potential benefits with the application of the vacuum PV glazing would attract more attention from the construction industry.
3.4 Brief technical guideline for the vacuum PV glazingDesigning the vacuum PV glazing (i.e. vacuum BIPV curtain wall) system is a more complex process than a standard added-on PV system. The architectural context, structural requirements, economic considerations and building regulation requirements should all be considered, so that this brief guidance mainly focuses on the below aspects: design strategy, environmental variables, multifunctionality, installation situation, electrical components, and economic aspects (Polysolar Limited, 2015).
(1) Design strategy
Architects, property developers and building users become more inclined to consider renewable and energy efficient applications to meet building and planning regulations due to rising energy bills and awareness of environmental sustainability. The combination of PV and vacuum glazing is an innovative and promising solution to meet these requirements in the new building developments or refurbishment projects. As proved in the above sections of this report, the developed product offers the added advantage of providing a return of investment from the building envelope. Architectural and structural factors, as well as economic considerations should be taken into account at an early stage in any building projects to integrate renewable systems through a more satisfactory approach.
(2) Environmental variables
When designing a BIPV system, a compromise must be reached between the requirements of energy yield optimisation and those of the architectural environment. Therefore, the orientation, lighting performance, shading and temperature are the four mainly concerned issues in BIPV design. According to simulation and experimental results presented in the above sections, the optimal orientation of the installed PV glazing should be south for maximizing the annual power generation, while cooling load reduction is more conspicuous when the product is applied on the west and east facades. Therefore, it is preferable to install the product on all three facades for an optimal overall building energy-saving performance. The visible light transmittance is only 12% in the developed prototype, which might cause slightly more lighting power consumption compared to traditional double-pane clear glazing. However, the transmittance can be easily adjusted to higher than 20% in the manufacture process depending on the effective area of PV materials. There will always be a trade-off between power generation and permeable light, whereas this research has proved that the combined power generation and cooling load reduction can be more than the increased lighting energy use. Power generation performance of the a-Si PV is less sensitive to shadings, so that the prototype is subject to less influence from peripheral shadings. However, if we change the PV material to c-Si for higher conversion efficiency, a shading calculation should be conducted before allocating the BIPV glazing. Lastly, the conversion efficiency of a-Si glazing is also less sensitive to the increase of the panel temperature. The temperature coefficient must be considered if changing the PV material to c-Si.
The vacuum PV glazing was made by sandwiching a layer of PVB between an external PV laminated glass with a visible light transmittance of 12% and an internal vacuum glass. A low-e coating was also adopted to enhance its thermal performance. The structure of the vacuum PV glazing is shown in Figure 5. The dimension of the vacuum PV glazing is 1300 mm (width) × 1100 mm (height) × 20.87 mm (thickness), thinner than commonly used PV double glazed insulating glass units. Figure 6 presents the pictures of the sample of vacuum PV glazing.
This section presents the main findings and outcomes of the research project and indicates their potential impacts on the local energy use and construction industry. Achievements of the specified research objectives are illustrated, and limitations of the project are also mentioned for the reference of future studies.
3.1 Design and production of the prototype productInitially, we proposed a prototype design as specified by Figure 2, where the vacuum layer was directly coupled with the laminated PV panel. However, during initial manufacture trials, the air pressure difference between internal and external spaces of the vacuum glass samples produced by the laminating machine caused the breakage of the vacuum glass samples. Then, we followed an alternative approach using pre-pressure furnace, whereas the molten state of the polyvinyl butyral (PVB) could not meet the expected requirements and the bubbles greatly impacted the appearance and performance of PV module. Finally, we proposed the current product design based on the experience acquired from previous failures (See Figure 5).
The electrical specifications of the vacuum PV glazing under standard test conditions (STC: air mass 1.5, solar irradiation 1000 W/m2 and cell temperature 25°C) are shown in Table 2. Table 3 presents the given thermal and optical properties of the PV laminated glass and vacuum glass, respectively.
Cost and Benefit
Payback period for west facing and east facing windows
7.5 Year 8.0 Year
Year 0
Year 1 Year 2 Year 3 Year 4 Year 5 Year 6 Year 7 Year 8 Year 9Year 10
-1500
-1000
-500
0
500
1000
Initial Cost of Single PV Initial Cost of Vacuum PV West South East
Figure 26 Relative simple payback period compared with single-pane PV glazing in Hong Kong
(3) Multi-functionality
Due to their mechanical structures, the PV vacuum glazing can perform the functions of the building envelope in addition to generating emission-free energy, and can thus substitute for conventional construction windows or curtain walls. Apart from power generation and architectural function, the product can provide solar shading with its low SHGC value. It can also act as thermal and sound insulation due to its low U-value and acoustic resistance caused by the vacuum chamber between glazing layers. If applied with special coatings/films on top of PV glazing, it can also provide weather protection.
(4) Mounting system and installation
Based on specific requirements of each project in each region, safety, loading capacity and PV installation specifications can have a decisive impact on the method of fixing/mounting the vacuum. We have in this guide attempted to provide a range of options, highlighting what is possible in current design. The product can be installed with a linear mounting system as mullion-transom facades or structural sealant glazing. It can also be mounted with point-fixing systems including clamp fixings and undercut anchor fixings or mounted into standard curtain walling, rain screen cladding and window systems.
(5) Electrical system
In the curtain wall system, several PV glazing with standard size are usually connected together in a string to form the power generator. The generated direct current is usually fed to an inverter where the direct current is converted to alternating current. If on-site storage is not available, which is the common case in urban areas, the electrical power is registered via an electricity meter and connected to the public supply grid, which will require special permissions from the power grid companies (e.g. CLP in Hong Kong). Therefore, the application of the product will require a full set of electrical systems including cables and connections for parallel or series arrays, direct current load-break switches, inverters and generation meters.
(6) Economic considerations
The economic benefits of the product mainly lie in the following aspects: the substitute for original construction component, CO2 emission reduction and corresponding electricity fee waving, compliance with relevant building regulations (i.e. BEAM Plus in Hong Kong) and application of the feed-in-tariff policy (remuneration for electricity generation from PV).
temperature measurements were conducted through the centre of the vacuum PV sample to calculate the U-value. Secondly, the solar heat gains coefficient (SHGC) of the vacuum PV glazing sample was obtained and compared with three other advanced glazing types in an indoor solar irradiation test. Lastly, an outdoor test was conducted on the platform of Block Z in The Hong Kong Polytechnic University to evaluate the overall thermal performance of vacuum PV glazing. A conventional double clear pane glazing was used as a baseline in the outdoor test.
surfaces shows a similar trend in the three directions. Summing up electricity generation in all floors, the integrated PV modules in Model 2 and 3 can provide 285074.72 kWh/year and 355226.3 kWh/year, which accounts for 13.27% and 16.54% of the total building energy consumption of Model 1. Therefore, given the energy use reduction due to less external heat gain, using the vacuum BIPV glazing can save 27.74% (Model 3) electricity compared to a reference building.

32Investigation on the Thermal and Power Performance of Vacuum BIPV Curtain Wall Technology and its Application Potential in Buildings in Hong Kong
The comparison of building energy between Model 1, Model 2 and Model 3 is summarized in Table 6, which includes energy use of lighting, equipment, district cooling and district heating. Although Model 2 and Model 3 consume slightly more lighting energy due to the reduced visible transmittance of the PV glazing, the great energy saving in cooling and heating leads to the net reduction in the total building energy consumption. The total energy consumption of the Model 2 and 3 declines by 20.77 and 22.37 kWh/m2, accounting for 10.44% and 11.20% of Model 1 respectively. Generated electricity of windows and walls in three directions is also presented in Table 7. The south window produced the most electricity, 1527.13 kWh for Model 2 and 3203.76 kWh for Model 3 in a year, taking up nearly 47.80% the total electricity generated by windows. As for the west window, the electricity generated in a year is close to that of east window. Electricity generated by wall
3.2 Experimental study of the vacuum PV glazingOutdoor experimental test was first conducted on the developed prototype vacuum PV (VPV) glazing with the standard size (1.1m × 1.3m), whose various parameters including the ambient air temperature, incident solar irradiation, surface temperatures of the vacuum PV glazing as well as the I-V curves and the power generation were measured and recorded. The power generation and thermal performances of the prototype were also analysed during the test. To further justify the advantage of the vacuum PV glazing, experimental studies were carried out to compare the thermal performance of scaled-down samples (0.3m × 0.3m) with other advanced windows.
(1) Energy performance of the prototypeIn order to evaluate the energy performance of the vacuum PV glazing, an outdoor field measurement was conducted on the platform of Block Z in The Hong Kong Polytechnic University. The vacuum PV glazing was set up horizontally 0.4m above the floor on stilts so that the external temperatures of both sides of the vacuum PV glazing were approximately equal. Various parameters were measured during this test, including the ambient air temperature, the exterior and transmitted horizontal incident solar irradiation, the outer and inner surface temperatures of the vacuum PV glazing as well as the I-V curves and the power generation from the vacuum PV glazing. All the data was logged at an interval of 1 minute. Power generation and thermal performances of the vacuum PV glazing were analyzed based on the outdoor tests. Figure 7 shows the exterior and transmitted incident solar irradiation. It can be seen that the average solar irradiation transmittance during the period is approximately 0.08. Such low transmittance means that vast majority of solar irradiation is blocked by the vacuum PV glazing. Figure 8 presents the outer and inner surface temperature of the vacuum PV glazing. It can be seen that the outer surface temperature is much higher than the inner surface temperature at daytime. The maximum outer surface temperature is 75.3°C, 30°C higher than the inner surface temperature, which indicates that most of the waste heat is dissipated from the outside surface of the vacuum PV glazing, and the heat transfer to the inside space by convection is mitigated. Thus, compared with the conventional single-glazed PV glazing, the structure of the vacuum PV glazing can help reduce the cooling load and improve the indoor thermal comfort.
Then the vacuum PV glazing was mounted on the front side of an experimental test chamber as shown in Figure 9. Clear glass was also adopted in this study for comparison. Figure 10 presents the instantaneous power output of the vacuum PV glazing in 2 sunny days. It can be seen that the power generation from the vacuum PV glazing is consistent with incident solar radiation. A comparative study in terms of internal air temperature of the chamber between the vacuum PV glazing and the clear glass was conducted in a day of June.
As shown in Figure 11, the internal air temperature in the chamber with the vacuum PV glazing is much lower than that with a clear glass. The measured average and maximum internal air temperature for the vacuum PV glazing is 39.6°C and 40.3°C, respectively, while the corresponding average and maximum internal air temperature of the clear glass are 43.6°C and 44.7°C. The maximum internal air temperature difference between the vacuum PV glazing and the clear glass is 4.4°C, occurring in the morning. There are three temperature peaks of internal air temperature. Since the ambient temperature was relatively stable, the main heat gain of the internal air temperature was from incident solar irradiation. The internal air temperature for vacuum PV glazing is much more stable compared with that for the clear glass. The reason is that the vacuum PV glazing has better heat insulation performance so that the internal air temperature is not affected by the external environment significantly. It can also be seen in this figure that the internal air temperature of the chamber drops continuously at 15:00, which shows that the incident solar irradiation on the façade decreases so that the heat gains of the internal air from the sun also drops.
(2) Comparison with other advanced windows
To further justify the advantage of the vacuum PV glazing, experimental studies were carried out to compare it with other advanced windows. Samples of different types of glazing were mounted on the top of two hotboxes (i.e. test rigs) with the uniform dimension of 300 mm (L) × 300 mm (W) × 450mm (H) to implement both indoor and outdoor tests. Firstly, a co-heating test methodology was adopted for the thermal analysis of the vacuum PV glazing. The test rig was filled with the ice-water mixture to ensure the temperature difference between the inside and outside glazing surfaces larger than 5°C. Heat flux and
Figure 12 shows the internal and external temperatures of the vacuum PV glazing sample. The presented data were selected after the hotbox achieved the steady-state condition, when the temperature difference was around 8°C. Heat flux though the glazing sample and the U-value were then determined as illustrated in Figure 13. The average heat flux from the vacuum glazing was measured to be 15.4 W/m2. And the average U-value was calculated as 1.5 W/m2 × K which is much lower than a regular double pane window with the U-value of 2.5W/m2 × K. Considering the edge heat transfer which would strongly affect the heat flux measurement when the sample is small, it can be expected that the centre U-valve of the vacuum PV glazing should be lower than 1.5 W/m2 × K for a larger scale application (e.g. 1.1m × 1.3m).
(3) Cost effective analysis based on simulation
To address the economic benefits of the developed product, the simple payback period of the vacuum PV glazing is calculated with reference to available PV glazing on the market in both Hong Kong and Beijing’s scenarios.
Based on an average electricity price of 1.25 HKD/kWh from HK Electric, the simple payback period (See Figure 26) when applying the product to the west and east façade is calculated to be 7.5 and 8.0 years compared to the single-pane PV glazing. The payback periods are increased to 8.6 and 8.8 years when compared with double-pane PV glazing as shown in Figure 27. However, when applied to the south façade, the extra initial cost of the product cannot be recovered within 10 years.
The solar simulator in the laboratory can provide relatively steady horizontal incident solar irradiation, so that test rigs were located at the same spot to ensure each window sample exposed to the same radiation level. As shown in Figure 14, SHGCs of the vacuum PV glazing and double-pane PV glazing are much smaller than those of the vacuum glazing and double clear glazing, because the coupled PV module can absorb most of the solar irradiation. The vacuum PV glazing has the lowest SHGC of 0.10 which can act as the excellent thermal insulation.
The outdoor test lasted four days from September 26th to September 30th. As shown in Figure 15, September 26th, 27th and 30th were cloudy days and September 28th could be considered as a sunny day. It can be found that the vacuum PV glazing blocks most solar irradiation compared with the double-pane glazing. Figure 16 presents the temperature profile of the vacuum PV glazing and double-pane glazing in the sunny day. The internal surface temperature of both glazing was much higher than the ambient temperature when the outside incident solar radiation is strong. The internal glazing surface and air temperatures of the test rig with the vacuum PV glazing are lower than those of the test rig with the double-pane glazing. The difference between the internal air temperatures of test rigs is much smaller than that of internal glazing surface temperatures. Therefore, the application of vacuum PV glazing can achieve better indoor environment by reducing the solar heat gain.
3.3 Simulation study of the vacuum PV glazing(1) Simulation of a generic building model
Although a series of field tests have been conducted in the outdoor test bed to study the power and thermal performances of the vacuum BIPV glazing, the experimental scenarios are impossible to represent all the situations and variables. Thus, the numerical study was conducted to comprehensively investigate and compare the energy performance of the vacuum PV glazing and other commonly used energy-efficient glazing. As detailed in the research methodology, a comprehensive simulation model based on EnergyPlus and WINDOW has been developed to simulate the overall energy performance of different windows taking into account of their thermal and power output performance. This model is used to simulate the overall energy performance of the vacuum BIPV curtain wall in comparison with other commonly used windows. The key properties of different types of glazing are shown in Table 4 and the electrical specifications of the PV glazing under standard test conditions are referenced to Table 2.
In order to simulate the annual thermal performance and power performance of these types of glazing in Hong Kong for comparison purpose, a typical office room model has been created for simulation, as shown in Figure 17. The dimension of the office model was 2.5m × 2.3m × 2.5m (L × W × H). This room has only one external wall with three identical windows exposed to the outdoor environment. Simulations were conducted for different orientations, i.e. south (S), east (E), west (W) and north (N). A heat transfer model and PV performance model in EnergyPlus are adopted to investigate
the thermal and power performance of different glazing. The heat transfer model is used to calculate the cooling loads of the office room. The cooling loads are then converted to electricity use of air-conditioning system with a presumed coefficient of performance (COP) of 2.78. The equivalent one-diode model is selected to simulate the annual electricity generation from PV elements. The typical meteorological year (TMY) in Hong Kong is selected a reasonable representation of local climates.
The annual cooling electricity use of different types of glazing in different orientations in Hong Kong are shown in Figure 18. It can be observed that the room using vacuum PV glazing consumes the least cooling electricity for all orientations. The south facing room with vacuum PV glazing consumes about 705.56 kWh per year, which was approximately 14.2%, 9.8%, 8.4%, 7.1% and 4.1% less than the corresponding room with single-pane clear glazing, double-pane clear glazing, vacuum glazing, single-pane PV glazing and double-pane PV glazing, respectively. This is because the vacuum PV glazing have the lowest U-value and SHGC among all types of glazing, as shown in Table 4.3. A lower U-value indicates a higher level of heat insulation performance of the glazing, and a lower SHGC means less solar radiation will pass through the windows. Therefore, the vacuum PV glazing performs the best in the area with big temperature difference between indoor and outdoor environment. In addition, the most cooling electricity use of the office room occurs at the west orientation, followed by east, south and north. Therefore, east and west facing windows should have better solar heat insulation performance, to reduce heat gains from outside environment.
In addition to reduce the cooling load of the office room, the PV glazing can also generate electricity in situ. The annual electricity generation of the three types of PV glazing are shown in Figure 19. It can be seen that the annual electricity generation of the three types of PV glazing is similar to each other. The electricity generation from the vacuum PV glazing is a little less than the single-pane PV glazing due to increased solar cell temperature. However, since the temperature coefficient of the thin-film a-Si solar cells is small, the PV conversion efficiency is not reduced significantly. The annual electricity generation from a-Si PV glazing with 12.0% transmittance is around 113.81 kWh per year. Among all orientations, it is better to install PV glazing on the south facade in order to maximize the electricity output in Hong Kong. And it is not recommended to apply PV glazing on north façade due to limited solar radiation available.
Based on the results above, the vacuum PV glazing not only has the best thermal performance among all types of widely used glazing, but also produces a considerable amount of electricity per year. It is recommended to install vacuum PV glazing on south facade to perform the best overall energy performance.
(2) Simulation of the whole building
Apart from modelling studies conducted under the hot and humid climate of Hong Kong, the annual energy performance of different types of glazing in a cold region (i.e. Beijing) was also simulated for comparison. Simulation results are shown in Figure 20 and Figure 21. It can be observed that the room using the vacuum PV glazing achieves the lowest cooling consumption in both climates. In Beijing, the consumed cooling energy with the vacuum PV glazing is much smaller and is 30.2%, 20.8%, 17.0%, 13.8%, 4.4% less than that of the room with other types of glazing. It can be concluded that the energy saving potential of the vacuum PV glazing is much larger in a cold climate while the electricity generation is much higher during the summer time of Beijing due to the smaller solar incidence angle.
The developed simulation model was further applied to a 20-floor prototype office building. Typical floors of the building are divided into 5 conditioned zones, with a total floor area of 540 m2 (as shown in Figure 22). The reference case – Model 1 keeps all windows as the commonly used double-pane clear glazing, while the design cases include Model 2 and Model 3. Model 2 keeps the north-facing window as the conventional double-pane glazing while changes windows orientated to the other three directions to the developed vacuum PV glazing. The opaque part of all building facades is assumed to be covered with traditional crystalline BIPV with a power conversion efficiency of 15% to maximize the power generation potential of the building envelope. Model 3 shares similar settings with Model 2, except that the window transparency is tuned to 20% with a crystalline silicon (c-Si) as shown in Figure 23. Table 5 shows detailed settings of window properties for the three models respectively. The U-value and SHGC of a-Si vacuum PV glazing are obtained from previous experiments and those of double-pane clear glazing are calculated by the simulation software WINDOW. Thermal and power generation properties of c-Si vacuum PV glazing are obtained from existing literatures.
The simulation results of the total heat gain and loss through all windows are presented in Figure 24 and Figure 25. The heat gain and loss both decrease sharply when traditional double-pane clear glazing is replaced by the PV vacuum glazing. The obvious differences between these three models can be identified from the figures. Compared with the performance of Model 1, the heat gain through windows of Model 2 and Model 3 drops up to 77.89% and 77.97% (south-facing windows), while the heat loss of the two models declines up to 79.28% and 79.32% (south-facing windows), respectively.
On the other side, based on the peak office hour electricity price of 1.4 CNY/kWh for cooling and 0.25 CNY/kWh for heating from the Beijing authority, the simple payback period (See Figure 28) when applying the product to the west, east, and south façade is calculated to be 3.8, 4.6 and 5.3 years compared to the single-pane PV glazing. The payback periods are increased to 4.5, 5.4 and 6.5 years when compared with double-pane PV glazing as shown in Figure 29.
As a result, the product can be considered as a cost-effective application in building facades when considering its tremendous saving of air-conditioning energy and corresponding annual expenses. In addition, the property developer could also benefit from a potential increment in renting rates and popularity, if the building gets certified under a green building scheme by claiming credits in CO2 reduction and renewable application assessment criteria. All the abovementioned potential benefits with the application of the vacuum PV glazing would attract more attention from the construction industry.
3.4 Brief technical guideline for the vacuum PV glazingDesigning the vacuum PV glazing (i.e. vacuum BIPV curtain wall) system is a more complex process than a standard added-on PV system. The architectural context, structural requirements, economic considerations and building regulation requirements should all be considered, so that this brief guidance mainly focuses on the below aspects: design strategy, environmental variables, multifunctionality, installation situation, electrical components, and economic aspects (Polysolar Limited, 2015).
(1) Design strategy
Architects, property developers and building users become more inclined to consider renewable and energy efficient applications to meet building and planning regulations due to rising energy bills and awareness of environmental sustainability. The combination of PV and vacuum glazing is an innovative and promising solution to meet these requirements in the new building developments or refurbishment projects. As proved in the above sections of this report, the developed product offers the added advantage of providing a return of investment from the building envelope. Architectural and structural factors, as well as economic considerations should be taken into account at an early stage in any building projects to integrate renewable systems through a more satisfactory approach.
(2) Environmental variables
When designing a BIPV system, a compromise must be reached between the requirements of energy yield optimisation and those of the architectural environment. Therefore, the orientation, lighting performance, shading and temperature are the four mainly concerned issues in BIPV design. According to simulation and experimental results presented in the above sections, the optimal orientation of the installed PV glazing should be south for maximizing the annual power generation, while cooling load reduction is more conspicuous when the product is applied on the west and east facades. Therefore, it is preferable to install the product on all three facades for an optimal overall building energy-saving performance. The visible light transmittance is only 12% in the developed prototype, which might cause slightly more lighting power consumption compared to traditional double-pane clear glazing. However, the transmittance can be easily adjusted to higher than 20% in the manufacture process depending on the effective area of PV materials. There will always be a trade-off between power generation and permeable light, whereas this research has proved that the combined power generation and cooling load reduction can be more than the increased lighting energy use. Power generation performance of the a-Si PV is less sensitive to shadings, so that the prototype is subject to less influence from peripheral shadings. However, if we change the PV material to c-Si for higher conversion efficiency, a shading calculation should be conducted before allocating the BIPV glazing. Lastly, the conversion efficiency of a-Si glazing is also less sensitive to the increase of the panel temperature. The temperature coefficient must be considered if changing the PV material to c-Si.
The vacuum PV glazing was made by sandwiching a layer of PVB between an external PV laminated glass with a visible light transmittance of 12% and an internal vacuum glass. A low-e coating was also adopted to enhance its thermal performance. The structure of the vacuum PV glazing is shown in Figure 5. The dimension of the vacuum PV glazing is 1300 mm (width) × 1100 mm (height) × 20.87 mm (thickness), thinner than commonly used PV double glazed insulating glass units. Figure 6 presents the pictures of the sample of vacuum PV glazing.
This section presents the main findings and outcomes of the research project and indicates their potential impacts on the local energy use and construction industry. Achievements of the specified research objectives are illustrated, and limitations of the project are also mentioned for the reference of future studies.
3.1 Design and production of the prototype productInitially, we proposed a prototype design as specified by Figure 2, where the vacuum layer was directly coupled with the laminated PV panel. However, during initial manufacture trials, the air pressure difference between internal and external spaces of the vacuum glass samples produced by the laminating machine caused the breakage of the vacuum glass samples. Then, we followed an alternative approach using pre-pressure furnace, whereas the molten state of the polyvinyl butyral (PVB) could not meet the expected requirements and the bubbles greatly impacted the appearance and performance of PV module. Finally, we proposed the current product design based on the experience acquired from previous failures (See Figure 5).
The electrical specifications of the vacuum PV glazing under standard test conditions (STC: air mass 1.5, solar irradiation 1000 W/m2 and cell temperature 25°C) are shown in Table 2. Table 3 presents the given thermal and optical properties of the PV laminated glass and vacuum glass, respectively.
Figure 27 Relative simple payback period compared with double-pane PV glazing in Hong Kong
Initial Cost of Single PV Initial Cost of Vacuum PV West South East
Cost and Benefit
Payback period for west facing and east facing windows
8.6 Year 8.8 Year
Year 0
Year 1 Year 2 Year 3 Year 4 Year 5 Year 6 Year 7 Year 8Year 10
-1500
-1000
-500
0
500
Year 9
Figure 28 Relative simple payback period compared with single-pane PV glazing in Beijing
Initial Cost of Single PV Initial Cost of Vacuum PV West South East
Cost and Benefit
Payback period for west facing,south and east facing windows
3.8 Year 4.6 Year 5.3 Year
Year 0
Year 1 Year 2 Year 3 Year 4 Year 5 Year 6
-1500
-1000
-500
0
500
1000
(3) Multi-functionality
Due to their mechanical structures, the PV vacuum glazing can perform the functions of the building envelope in addition to generating emission-free energy, and can thus substitute for conventional construction windows or curtain walls. Apart from power generation and architectural function, the product can provide solar shading with its low SHGC value. It can also act as thermal and sound insulation due to its low U-value and acoustic resistance caused by the vacuum chamber between glazing layers. If applied with special coatings/films on top of PV glazing, it can also provide weather protection.
(4) Mounting system and installation
Based on specific requirements of each project in each region, safety, loading capacity and PV installation specifications can have a decisive impact on the method of fixing/mounting the vacuum. We have in this guide attempted to provide a range of options, highlighting what is possible in current design. The product can be installed with a linear mounting system as mullion-transom facades or structural sealant glazing. It can also be mounted with point-fixing systems including clamp fixings and undercut anchor fixings or mounted into standard curtain walling, rain screen cladding and window systems.
(5) Electrical system
In the curtain wall system, several PV glazing with standard size are usually connected together in a string to form the power generator. The generated direct current is usually fed to an inverter where the direct current is converted to alternating current. If on-site storage is not available, which is the common case in urban areas, the electrical power is registered via an electricity meter and connected to the public supply grid, which will require special permissions from the power grid companies (e.g. CLP in Hong Kong). Therefore, the application of the product will require a full set of electrical systems including cables and connections for parallel or series arrays, direct current load-break switches, inverters and generation meters.
(6) Economic considerations
The economic benefits of the product mainly lie in the following aspects: the substitute for original construction component, CO2 emission reduction and corresponding electricity fee waving, compliance with relevant building regulations (i.e. BEAM Plus in Hong Kong) and application of the feed-in-tariff policy (remuneration for electricity generation from PV).
temperature measurements were conducted through the centre of the vacuum PV sample to calculate the U-value. Secondly, the solar heat gains coefficient (SHGC) of the vacuum PV glazing sample was obtained and compared with three other advanced glazing types in an indoor solar irradiation test. Lastly, an outdoor test was conducted on the platform of Block Z in The Hong Kong Polytechnic University to evaluate the overall thermal performance of vacuum PV glazing. A conventional double clear pane glazing was used as a baseline in the outdoor test.
surfaces shows a similar trend in the three directions. Summing up electricity generation in all floors, the integrated PV modules in Model 2 and 3 can provide 285074.72 kWh/year and 355226.3 kWh/year, which accounts for 13.27% and 16.54% of the total building energy consumption of Model 1. Therefore, given the energy use reduction due to less external heat gain, using the vacuum BIPV glazing can save 27.74% (Model 3) electricity compared to a reference building.

33 Construction Industry Council
The comparison of building energy between Model 1, Model 2 and Model 3 is summarized in Table 6, which includes energy use of lighting, equipment, district cooling and district heating. Although Model 2 and Model 3 consume slightly more lighting energy due to the reduced visible transmittance of the PV glazing, the great energy saving in cooling and heating leads to the net reduction in the total building energy consumption. The total energy consumption of the Model 2 and 3 declines by 20.77 and 22.37 kWh/m2, accounting for 10.44% and 11.20% of Model 1 respectively. Generated electricity of windows and walls in three directions is also presented in Table 7. The south window produced the most electricity, 1527.13 kWh for Model 2 and 3203.76 kWh for Model 3 in a year, taking up nearly 47.80% the total electricity generated by windows. As for the west window, the electricity generated in a year is close to that of east window. Electricity generated by wall
3.2 Experimental study of the vacuum PV glazingOutdoor experimental test was first conducted on the developed prototype vacuum PV (VPV) glazing with the standard size (1.1m × 1.3m), whose various parameters including the ambient air temperature, incident solar irradiation, surface temperatures of the vacuum PV glazing as well as the I-V curves and the power generation were measured and recorded. The power generation and thermal performances of the prototype were also analysed during the test. To further justify the advantage of the vacuum PV glazing, experimental studies were carried out to compare the thermal performance of scaled-down samples (0.3m × 0.3m) with other advanced windows.
(1) Energy performance of the prototypeIn order to evaluate the energy performance of the vacuum PV glazing, an outdoor field measurement was conducted on the platform of Block Z in The Hong Kong Polytechnic University. The vacuum PV glazing was set up horizontally 0.4m above the floor on stilts so that the external temperatures of both sides of the vacuum PV glazing were approximately equal. Various parameters were measured during this test, including the ambient air temperature, the exterior and transmitted horizontal incident solar irradiation, the outer and inner surface temperatures of the vacuum PV glazing as well as the I-V curves and the power generation from the vacuum PV glazing. All the data was logged at an interval of 1 minute. Power generation and thermal performances of the vacuum PV glazing were analyzed based on the outdoor tests. Figure 7 shows the exterior and transmitted incident solar irradiation. It can be seen that the average solar irradiation transmittance during the period is approximately 0.08. Such low transmittance means that vast majority of solar irradiation is blocked by the vacuum PV glazing. Figure 8 presents the outer and inner surface temperature of the vacuum PV glazing. It can be seen that the outer surface temperature is much higher than the inner surface temperature at daytime. The maximum outer surface temperature is 75.3°C, 30°C higher than the inner surface temperature, which indicates that most of the waste heat is dissipated from the outside surface of the vacuum PV glazing, and the heat transfer to the inside space by convection is mitigated. Thus, compared with the conventional single-glazed PV glazing, the structure of the vacuum PV glazing can help reduce the cooling load and improve the indoor thermal comfort.
Then the vacuum PV glazing was mounted on the front side of an experimental test chamber as shown in Figure 9. Clear glass was also adopted in this study for comparison. Figure 10 presents the instantaneous power output of the vacuum PV glazing in 2 sunny days. It can be seen that the power generation from the vacuum PV glazing is consistent with incident solar radiation. A comparative study in terms of internal air temperature of the chamber between the vacuum PV glazing and the clear glass was conducted in a day of June.
As shown in Figure 11, the internal air temperature in the chamber with the vacuum PV glazing is much lower than that with a clear glass. The measured average and maximum internal air temperature for the vacuum PV glazing is 39.6°C and 40.3°C, respectively, while the corresponding average and maximum internal air temperature of the clear glass are 43.6°C and 44.7°C. The maximum internal air temperature difference between the vacuum PV glazing and the clear glass is 4.4°C, occurring in the morning. There are three temperature peaks of internal air temperature. Since the ambient temperature was relatively stable, the main heat gain of the internal air temperature was from incident solar irradiation. The internal air temperature for vacuum PV glazing is much more stable compared with that for the clear glass. The reason is that the vacuum PV glazing has better heat insulation performance so that the internal air temperature is not affected by the external environment significantly. It can also be seen in this figure that the internal air temperature of the chamber drops continuously at 15:00, which shows that the incident solar irradiation on the façade decreases so that the heat gains of the internal air from the sun also drops.
(2) Comparison with other advanced windows
To further justify the advantage of the vacuum PV glazing, experimental studies were carried out to compare it with other advanced windows. Samples of different types of glazing were mounted on the top of two hotboxes (i.e. test rigs) with the uniform dimension of 300 mm (L) × 300 mm (W) × 450mm (H) to implement both indoor and outdoor tests. Firstly, a co-heating test methodology was adopted for the thermal analysis of the vacuum PV glazing. The test rig was filled with the ice-water mixture to ensure the temperature difference between the inside and outside glazing surfaces larger than 5°C. Heat flux and
Figure 12 shows the internal and external temperatures of the vacuum PV glazing sample. The presented data were selected after the hotbox achieved the steady-state condition, when the temperature difference was around 8°C. Heat flux though the glazing sample and the U-value were then determined as illustrated in Figure 13. The average heat flux from the vacuum glazing was measured to be 15.4 W/m2. And the average U-value was calculated as 1.5 W/m2 × K which is much lower than a regular double pane window with the U-value of 2.5W/m2 × K. Considering the edge heat transfer which would strongly affect the heat flux measurement when the sample is small, it can be expected that the centre U-valve of the vacuum PV glazing should be lower than 1.5 W/m2 × K for a larger scale application (e.g. 1.1m × 1.3m).
(3) Cost effective analysis based on simulation
To address the economic benefits of the developed product, the simple payback period of the vacuum PV glazing is calculated with reference to available PV glazing on the market in both Hong Kong and Beijing’s scenarios.
Based on an average electricity price of 1.25 HKD/kWh from HK Electric, the simple payback period (See Figure 26) when applying the product to the west and east façade is calculated to be 7.5 and 8.0 years compared to the single-pane PV glazing. The payback periods are increased to 8.6 and 8.8 years when compared with double-pane PV glazing as shown in Figure 27. However, when applied to the south façade, the extra initial cost of the product cannot be recovered within 10 years.
The solar simulator in the laboratory can provide relatively steady horizontal incident solar irradiation, so that test rigs were located at the same spot to ensure each window sample exposed to the same radiation level. As shown in Figure 14, SHGCs of the vacuum PV glazing and double-pane PV glazing are much smaller than those of the vacuum glazing and double clear glazing, because the coupled PV module can absorb most of the solar irradiation. The vacuum PV glazing has the lowest SHGC of 0.10 which can act as the excellent thermal insulation.
The outdoor test lasted four days from September 26th to September 30th. As shown in Figure 15, September 26th, 27th and 30th were cloudy days and September 28th could be considered as a sunny day. It can be found that the vacuum PV glazing blocks most solar irradiation compared with the double-pane glazing. Figure 16 presents the temperature profile of the vacuum PV glazing and double-pane glazing in the sunny day. The internal surface temperature of both glazing was much higher than the ambient temperature when the outside incident solar radiation is strong. The internal glazing surface and air temperatures of the test rig with the vacuum PV glazing are lower than those of the test rig with the double-pane glazing. The difference between the internal air temperatures of test rigs is much smaller than that of internal glazing surface temperatures. Therefore, the application of vacuum PV glazing can achieve better indoor environment by reducing the solar heat gain.
3.3 Simulation study of the vacuum PV glazing(1) Simulation of a generic building model
Although a series of field tests have been conducted in the outdoor test bed to study the power and thermal performances of the vacuum BIPV glazing, the experimental scenarios are impossible to represent all the situations and variables. Thus, the numerical study was conducted to comprehensively investigate and compare the energy performance of the vacuum PV glazing and other commonly used energy-efficient glazing. As detailed in the research methodology, a comprehensive simulation model based on EnergyPlus and WINDOW has been developed to simulate the overall energy performance of different windows taking into account of their thermal and power output performance. This model is used to simulate the overall energy performance of the vacuum BIPV curtain wall in comparison with other commonly used windows. The key properties of different types of glazing are shown in Table 4 and the electrical specifications of the PV glazing under standard test conditions are referenced to Table 2.
In order to simulate the annual thermal performance and power performance of these types of glazing in Hong Kong for comparison purpose, a typical office room model has been created for simulation, as shown in Figure 17. The dimension of the office model was 2.5m × 2.3m × 2.5m (L × W × H). This room has only one external wall with three identical windows exposed to the outdoor environment. Simulations were conducted for different orientations, i.e. south (S), east (E), west (W) and north (N). A heat transfer model and PV performance model in EnergyPlus are adopted to investigate
the thermal and power performance of different glazing. The heat transfer model is used to calculate the cooling loads of the office room. The cooling loads are then converted to electricity use of air-conditioning system with a presumed coefficient of performance (COP) of 2.78. The equivalent one-diode model is selected to simulate the annual electricity generation from PV elements. The typical meteorological year (TMY) in Hong Kong is selected a reasonable representation of local climates.
The annual cooling electricity use of different types of glazing in different orientations in Hong Kong are shown in Figure 18. It can be observed that the room using vacuum PV glazing consumes the least cooling electricity for all orientations. The south facing room with vacuum PV glazing consumes about 705.56 kWh per year, which was approximately 14.2%, 9.8%, 8.4%, 7.1% and 4.1% less than the corresponding room with single-pane clear glazing, double-pane clear glazing, vacuum glazing, single-pane PV glazing and double-pane PV glazing, respectively. This is because the vacuum PV glazing have the lowest U-value and SHGC among all types of glazing, as shown in Table 4.3. A lower U-value indicates a higher level of heat insulation performance of the glazing, and a lower SHGC means less solar radiation will pass through the windows. Therefore, the vacuum PV glazing performs the best in the area with big temperature difference between indoor and outdoor environment. In addition, the most cooling electricity use of the office room occurs at the west orientation, followed by east, south and north. Therefore, east and west facing windows should have better solar heat insulation performance, to reduce heat gains from outside environment.
In addition to reduce the cooling load of the office room, the PV glazing can also generate electricity in situ. The annual electricity generation of the three types of PV glazing are shown in Figure 19. It can be seen that the annual electricity generation of the three types of PV glazing is similar to each other. The electricity generation from the vacuum PV glazing is a little less than the single-pane PV glazing due to increased solar cell temperature. However, since the temperature coefficient of the thin-film a-Si solar cells is small, the PV conversion efficiency is not reduced significantly. The annual electricity generation from a-Si PV glazing with 12.0% transmittance is around 113.81 kWh per year. Among all orientations, it is better to install PV glazing on the south facade in order to maximize the electricity output in Hong Kong. And it is not recommended to apply PV glazing on north façade due to limited solar radiation available.
Based on the results above, the vacuum PV glazing not only has the best thermal performance among all types of widely used glazing, but also produces a considerable amount of electricity per year. It is recommended to install vacuum PV glazing on south facade to perform the best overall energy performance.
(2) Simulation of the whole building
Apart from modelling studies conducted under the hot and humid climate of Hong Kong, the annual energy performance of different types of glazing in a cold region (i.e. Beijing) was also simulated for comparison. Simulation results are shown in Figure 20 and Figure 21. It can be observed that the room using the vacuum PV glazing achieves the lowest cooling consumption in both climates. In Beijing, the consumed cooling energy with the vacuum PV glazing is much smaller and is 30.2%, 20.8%, 17.0%, 13.8%, 4.4% less than that of the room with other types of glazing. It can be concluded that the energy saving potential of the vacuum PV glazing is much larger in a cold climate while the electricity generation is much higher during the summer time of Beijing due to the smaller solar incidence angle.
The developed simulation model was further applied to a 20-floor prototype office building. Typical floors of the building are divided into 5 conditioned zones, with a total floor area of 540 m2 (as shown in Figure 22). The reference case – Model 1 keeps all windows as the commonly used double-pane clear glazing, while the design cases include Model 2 and Model 3. Model 2 keeps the north-facing window as the conventional double-pane glazing while changes windows orientated to the other three directions to the developed vacuum PV glazing. The opaque part of all building facades is assumed to be covered with traditional crystalline BIPV with a power conversion efficiency of 15% to maximize the power generation potential of the building envelope. Model 3 shares similar settings with Model 2, except that the window transparency is tuned to 20% with a crystalline silicon (c-Si) as shown in Figure 23. Table 5 shows detailed settings of window properties for the three models respectively. The U-value and SHGC of a-Si vacuum PV glazing are obtained from previous experiments and those of double-pane clear glazing are calculated by the simulation software WINDOW. Thermal and power generation properties of c-Si vacuum PV glazing are obtained from existing literatures.
The simulation results of the total heat gain and loss through all windows are presented in Figure 24 and Figure 25. The heat gain and loss both decrease sharply when traditional double-pane clear glazing is replaced by the PV vacuum glazing. The obvious differences between these three models can be identified from the figures. Compared with the performance of Model 1, the heat gain through windows of Model 2 and Model 3 drops up to 77.89% and 77.97% (south-facing windows), while the heat loss of the two models declines up to 79.28% and 79.32% (south-facing windows), respectively.
On the other side, based on the peak office hour electricity price of 1.4 CNY/kWh for cooling and 0.25 CNY/kWh for heating from the Beijing authority, the simple payback period (See Figure 28) when applying the product to the west, east, and south façade is calculated to be 3.8, 4.6 and 5.3 years compared to the single-pane PV glazing. The payback periods are increased to 4.5, 5.4 and 6.5 years when compared with double-pane PV glazing as shown in Figure 29.
As a result, the product can be considered as a cost-effective application in building facades when considering its tremendous saving of air-conditioning energy and corresponding annual expenses. In addition, the property developer could also benefit from a potential increment in renting rates and popularity, if the building gets certified under a green building scheme by claiming credits in CO2 reduction and renewable application assessment criteria. All the abovementioned potential benefits with the application of the vacuum PV glazing would attract more attention from the construction industry.
3.4 Brief technical guideline for the vacuum PV glazingDesigning the vacuum PV glazing (i.e. vacuum BIPV curtain wall) system is a more complex process than a standard added-on PV system. The architectural context, structural requirements, economic considerations and building regulation requirements should all be considered, so that this brief guidance mainly focuses on the below aspects: design strategy, environmental variables, multifunctionality, installation situation, electrical components, and economic aspects (Polysolar Limited, 2015).
(1) Design strategy
Architects, property developers and building users become more inclined to consider renewable and energy efficient applications to meet building and planning regulations due to rising energy bills and awareness of environmental sustainability. The combination of PV and vacuum glazing is an innovative and promising solution to meet these requirements in the new building developments or refurbishment projects. As proved in the above sections of this report, the developed product offers the added advantage of providing a return of investment from the building envelope. Architectural and structural factors, as well as economic considerations should be taken into account at an early stage in any building projects to integrate renewable systems through a more satisfactory approach.
(2) Environmental variables
When designing a BIPV system, a compromise must be reached between the requirements of energy yield optimisation and those of the architectural environment. Therefore, the orientation, lighting performance, shading and temperature are the four mainly concerned issues in BIPV design. According to simulation and experimental results presented in the above sections, the optimal orientation of the installed PV glazing should be south for maximizing the annual power generation, while cooling load reduction is more conspicuous when the product is applied on the west and east facades. Therefore, it is preferable to install the product on all three facades for an optimal overall building energy-saving performance. The visible light transmittance is only 12% in the developed prototype, which might cause slightly more lighting power consumption compared to traditional double-pane clear glazing. However, the transmittance can be easily adjusted to higher than 20% in the manufacture process depending on the effective area of PV materials. There will always be a trade-off between power generation and permeable light, whereas this research has proved that the combined power generation and cooling load reduction can be more than the increased lighting energy use. Power generation performance of the a-Si PV is less sensitive to shadings, so that the prototype is subject to less influence from peripheral shadings. However, if we change the PV material to c-Si for higher conversion efficiency, a shading calculation should be conducted before allocating the BIPV glazing. Lastly, the conversion efficiency of a-Si glazing is also less sensitive to the increase of the panel temperature. The temperature coefficient must be considered if changing the PV material to c-Si.
The vacuum PV glazing was made by sandwiching a layer of PVB between an external PV laminated glass with a visible light transmittance of 12% and an internal vacuum glass. A low-e coating was also adopted to enhance its thermal performance. The structure of the vacuum PV glazing is shown in Figure 5. The dimension of the vacuum PV glazing is 1300 mm (width) × 1100 mm (height) × 20.87 mm (thickness), thinner than commonly used PV double glazed insulating glass units. Figure 6 presents the pictures of the sample of vacuum PV glazing.
This section presents the main findings and outcomes of the research project and indicates their potential impacts on the local energy use and construction industry. Achievements of the specified research objectives are illustrated, and limitations of the project are also mentioned for the reference of future studies.
3.1 Design and production of the prototype productInitially, we proposed a prototype design as specified by Figure 2, where the vacuum layer was directly coupled with the laminated PV panel. However, during initial manufacture trials, the air pressure difference between internal and external spaces of the vacuum glass samples produced by the laminating machine caused the breakage of the vacuum glass samples. Then, we followed an alternative approach using pre-pressure furnace, whereas the molten state of the polyvinyl butyral (PVB) could not meet the expected requirements and the bubbles greatly impacted the appearance and performance of PV module. Finally, we proposed the current product design based on the experience acquired from previous failures (See Figure 5).
The electrical specifications of the vacuum PV glazing under standard test conditions (STC: air mass 1.5, solar irradiation 1000 W/m2 and cell temperature 25°C) are shown in Table 2. Table 3 presents the given thermal and optical properties of the PV laminated glass and vacuum glass, respectively.
Figure 29 Relative simple payback period compared with double-pane PV glazing in Beijing
Initial Cost of Single PV Initial Cost of Vacuum PV West South East
Cost and Benefit
Payback period for west facing,south and east facing windows
4.5 Year 5.4 Year 6.5 Year
Year 0
Year 1 Year 2 Year 3 Year 4 Year 5 Year 6
-1500
-1000
-500
0
500
(3) Multi-functionality
Due to their mechanical structures, the PV vacuum glazing can perform the functions of the building envelope in addition to generating emission-free energy, and can thus substitute for conventional construction windows or curtain walls. Apart from power generation and architectural function, the product can provide solar shading with its low SHGC value. It can also act as thermal and sound insulation due to its low U-value and acoustic resistance caused by the vacuum chamber between glazing layers. If applied with special coatings/films on top of PV glazing, it can also provide weather protection.
(4) Mounting system and installation
Based on specific requirements of each project in each region, safety, loading capacity and PV installation specifications can have a decisive impact on the method of fixing/mounting the vacuum. We have in this guide attempted to provide a range of options, highlighting what is possible in current design. The product can be installed with a linear mounting system as mullion-transom facades or structural sealant glazing. It can also be mounted with point-fixing systems including clamp fixings and undercut anchor fixings or mounted into standard curtain walling, rain screen cladding and window systems.
(5) Electrical system
In the curtain wall system, several PV glazing with standard size are usually connected together in a string to form the power generator. The generated direct current is usually fed to an inverter where the direct current is converted to alternating current. If on-site storage is not available, which is the common case in urban areas, the electrical power is registered via an electricity meter and connected to the public supply grid, which will require special permissions from the power grid companies (e.g. CLP in Hong Kong). Therefore, the application of the product will require a full set of electrical systems including cables and connections for parallel or series arrays, direct current load-break switches, inverters and generation meters.
(6) Economic considerations
The economic benefits of the product mainly lie in the following aspects: the substitute for original construction component, CO2 emission reduction and corresponding electricity fee waving, compliance with relevant building regulations (i.e. BEAM Plus in Hong Kong) and application of the feed-in-tariff policy (remuneration for electricity generation from PV).
temperature measurements were conducted through the centre of the vacuum PV sample to calculate the U-value. Secondly, the solar heat gains coefficient (SHGC) of the vacuum PV glazing sample was obtained and compared with three other advanced glazing types in an indoor solar irradiation test. Lastly, an outdoor test was conducted on the platform of Block Z in The Hong Kong Polytechnic University to evaluate the overall thermal performance of vacuum PV glazing. A conventional double clear pane glazing was used as a baseline in the outdoor test.
surfaces shows a similar trend in the three directions. Summing up electricity generation in all floors, the integrated PV modules in Model 2 and 3 can provide 285074.72 kWh/year and 355226.3 kWh/year, which accounts for 13.27% and 16.54% of the total building energy consumption of Model 1. Therefore, given the energy use reduction due to less external heat gain, using the vacuum BIPV glazing can save 27.74% (Model 3) electricity compared to a reference building.

34Investigation on the Thermal and Power Performance of Vacuum BIPV Curtain Wall Technology and its Application Potential in Buildings in Hong Kong
The comparison of building energy between Model 1, Model 2 and Model 3 is summarized in Table 6, which includes energy use of lighting, equipment, district cooling and district heating. Although Model 2 and Model 3 consume slightly more lighting energy due to the reduced visible transmittance of the PV glazing, the great energy saving in cooling and heating leads to the net reduction in the total building energy consumption. The total energy consumption of the Model 2 and 3 declines by 20.77 and 22.37 kWh/m2, accounting for 10.44% and 11.20% of Model 1 respectively. Generated electricity of windows and walls in three directions is also presented in Table 7. The south window produced the most electricity, 1527.13 kWh for Model 2 and 3203.76 kWh for Model 3 in a year, taking up nearly 47.80% the total electricity generated by windows. As for the west window, the electricity generated in a year is close to that of east window. Electricity generated by wall
3.2 Experimental study of the vacuum PV glazingOutdoor experimental test was first conducted on the developed prototype vacuum PV (VPV) glazing with the standard size (1.1m × 1.3m), whose various parameters including the ambient air temperature, incident solar irradiation, surface temperatures of the vacuum PV glazing as well as the I-V curves and the power generation were measured and recorded. The power generation and thermal performances of the prototype were also analysed during the test. To further justify the advantage of the vacuum PV glazing, experimental studies were carried out to compare the thermal performance of scaled-down samples (0.3m × 0.3m) with other advanced windows.
(1) Energy performance of the prototypeIn order to evaluate the energy performance of the vacuum PV glazing, an outdoor field measurement was conducted on the platform of Block Z in The Hong Kong Polytechnic University. The vacuum PV glazing was set up horizontally 0.4m above the floor on stilts so that the external temperatures of both sides of the vacuum PV glazing were approximately equal. Various parameters were measured during this test, including the ambient air temperature, the exterior and transmitted horizontal incident solar irradiation, the outer and inner surface temperatures of the vacuum PV glazing as well as the I-V curves and the power generation from the vacuum PV glazing. All the data was logged at an interval of 1 minute. Power generation and thermal performances of the vacuum PV glazing were analyzed based on the outdoor tests. Figure 7 shows the exterior and transmitted incident solar irradiation. It can be seen that the average solar irradiation transmittance during the period is approximately 0.08. Such low transmittance means that vast majority of solar irradiation is blocked by the vacuum PV glazing. Figure 8 presents the outer and inner surface temperature of the vacuum PV glazing. It can be seen that the outer surface temperature is much higher than the inner surface temperature at daytime. The maximum outer surface temperature is 75.3°C, 30°C higher than the inner surface temperature, which indicates that most of the waste heat is dissipated from the outside surface of the vacuum PV glazing, and the heat transfer to the inside space by convection is mitigated. Thus, compared with the conventional single-glazed PV glazing, the structure of the vacuum PV glazing can help reduce the cooling load and improve the indoor thermal comfort.
Then the vacuum PV glazing was mounted on the front side of an experimental test chamber as shown in Figure 9. Clear glass was also adopted in this study for comparison. Figure 10 presents the instantaneous power output of the vacuum PV glazing in 2 sunny days. It can be seen that the power generation from the vacuum PV glazing is consistent with incident solar radiation. A comparative study in terms of internal air temperature of the chamber between the vacuum PV glazing and the clear glass was conducted in a day of June.
As shown in Figure 11, the internal air temperature in the chamber with the vacuum PV glazing is much lower than that with a clear glass. The measured average and maximum internal air temperature for the vacuum PV glazing is 39.6°C and 40.3°C, respectively, while the corresponding average and maximum internal air temperature of the clear glass are 43.6°C and 44.7°C. The maximum internal air temperature difference between the vacuum PV glazing and the clear glass is 4.4°C, occurring in the morning. There are three temperature peaks of internal air temperature. Since the ambient temperature was relatively stable, the main heat gain of the internal air temperature was from incident solar irradiation. The internal air temperature for vacuum PV glazing is much more stable compared with that for the clear glass. The reason is that the vacuum PV glazing has better heat insulation performance so that the internal air temperature is not affected by the external environment significantly. It can also be seen in this figure that the internal air temperature of the chamber drops continuously at 15:00, which shows that the incident solar irradiation on the façade decreases so that the heat gains of the internal air from the sun also drops.
(2) Comparison with other advanced windows
To further justify the advantage of the vacuum PV glazing, experimental studies were carried out to compare it with other advanced windows. Samples of different types of glazing were mounted on the top of two hotboxes (i.e. test rigs) with the uniform dimension of 300 mm (L) × 300 mm (W) × 450mm (H) to implement both indoor and outdoor tests. Firstly, a co-heating test methodology was adopted for the thermal analysis of the vacuum PV glazing. The test rig was filled with the ice-water mixture to ensure the temperature difference between the inside and outside glazing surfaces larger than 5°C. Heat flux and
Figure 12 shows the internal and external temperatures of the vacuum PV glazing sample. The presented data were selected after the hotbox achieved the steady-state condition, when the temperature difference was around 8°C. Heat flux though the glazing sample and the U-value were then determined as illustrated in Figure 13. The average heat flux from the vacuum glazing was measured to be 15.4 W/m2. And the average U-value was calculated as 1.5 W/m2 × K which is much lower than a regular double pane window with the U-value of 2.5W/m2 × K. Considering the edge heat transfer which would strongly affect the heat flux measurement when the sample is small, it can be expected that the centre U-valve of the vacuum PV glazing should be lower than 1.5 W/m2 × K for a larger scale application (e.g. 1.1m × 1.3m).
(3) Cost effective analysis based on simulation
To address the economic benefits of the developed product, the simple payback period of the vacuum PV glazing is calculated with reference to available PV glazing on the market in both Hong Kong and Beijing’s scenarios.
Based on an average electricity price of 1.25 HKD/kWh from HK Electric, the simple payback period (See Figure 26) when applying the product to the west and east façade is calculated to be 7.5 and 8.0 years compared to the single-pane PV glazing. The payback periods are increased to 8.6 and 8.8 years when compared with double-pane PV glazing as shown in Figure 27. However, when applied to the south façade, the extra initial cost of the product cannot be recovered within 10 years.
The solar simulator in the laboratory can provide relatively steady horizontal incident solar irradiation, so that test rigs were located at the same spot to ensure each window sample exposed to the same radiation level. As shown in Figure 14, SHGCs of the vacuum PV glazing and double-pane PV glazing are much smaller than those of the vacuum glazing and double clear glazing, because the coupled PV module can absorb most of the solar irradiation. The vacuum PV glazing has the lowest SHGC of 0.10 which can act as the excellent thermal insulation.
The outdoor test lasted four days from September 26th to September 30th. As shown in Figure 15, September 26th, 27th and 30th were cloudy days and September 28th could be considered as a sunny day. It can be found that the vacuum PV glazing blocks most solar irradiation compared with the double-pane glazing. Figure 16 presents the temperature profile of the vacuum PV glazing and double-pane glazing in the sunny day. The internal surface temperature of both glazing was much higher than the ambient temperature when the outside incident solar radiation is strong. The internal glazing surface and air temperatures of the test rig with the vacuum PV glazing are lower than those of the test rig with the double-pane glazing. The difference between the internal air temperatures of test rigs is much smaller than that of internal glazing surface temperatures. Therefore, the application of vacuum PV glazing can achieve better indoor environment by reducing the solar heat gain.
3.3 Simulation study of the vacuum PV glazing(1) Simulation of a generic building model
Although a series of field tests have been conducted in the outdoor test bed to study the power and thermal performances of the vacuum BIPV glazing, the experimental scenarios are impossible to represent all the situations and variables. Thus, the numerical study was conducted to comprehensively investigate and compare the energy performance of the vacuum PV glazing and other commonly used energy-efficient glazing. As detailed in the research methodology, a comprehensive simulation model based on EnergyPlus and WINDOW has been developed to simulate the overall energy performance of different windows taking into account of their thermal and power output performance. This model is used to simulate the overall energy performance of the vacuum BIPV curtain wall in comparison with other commonly used windows. The key properties of different types of glazing are shown in Table 4 and the electrical specifications of the PV glazing under standard test conditions are referenced to Table 2.
In order to simulate the annual thermal performance and power performance of these types of glazing in Hong Kong for comparison purpose, a typical office room model has been created for simulation, as shown in Figure 17. The dimension of the office model was 2.5m × 2.3m × 2.5m (L × W × H). This room has only one external wall with three identical windows exposed to the outdoor environment. Simulations were conducted for different orientations, i.e. south (S), east (E), west (W) and north (N). A heat transfer model and PV performance model in EnergyPlus are adopted to investigate
the thermal and power performance of different glazing. The heat transfer model is used to calculate the cooling loads of the office room. The cooling loads are then converted to electricity use of air-conditioning system with a presumed coefficient of performance (COP) of 2.78. The equivalent one-diode model is selected to simulate the annual electricity generation from PV elements. The typical meteorological year (TMY) in Hong Kong is selected a reasonable representation of local climates.
The annual cooling electricity use of different types of glazing in different orientations in Hong Kong are shown in Figure 18. It can be observed that the room using vacuum PV glazing consumes the least cooling electricity for all orientations. The south facing room with vacuum PV glazing consumes about 705.56 kWh per year, which was approximately 14.2%, 9.8%, 8.4%, 7.1% and 4.1% less than the corresponding room with single-pane clear glazing, double-pane clear glazing, vacuum glazing, single-pane PV glazing and double-pane PV glazing, respectively. This is because the vacuum PV glazing have the lowest U-value and SHGC among all types of glazing, as shown in Table 4.3. A lower U-value indicates a higher level of heat insulation performance of the glazing, and a lower SHGC means less solar radiation will pass through the windows. Therefore, the vacuum PV glazing performs the best in the area with big temperature difference between indoor and outdoor environment. In addition, the most cooling electricity use of the office room occurs at the west orientation, followed by east, south and north. Therefore, east and west facing windows should have better solar heat insulation performance, to reduce heat gains from outside environment.
In addition to reduce the cooling load of the office room, the PV glazing can also generate electricity in situ. The annual electricity generation of the three types of PV glazing are shown in Figure 19. It can be seen that the annual electricity generation of the three types of PV glazing is similar to each other. The electricity generation from the vacuum PV glazing is a little less than the single-pane PV glazing due to increased solar cell temperature. However, since the temperature coefficient of the thin-film a-Si solar cells is small, the PV conversion efficiency is not reduced significantly. The annual electricity generation from a-Si PV glazing with 12.0% transmittance is around 113.81 kWh per year. Among all orientations, it is better to install PV glazing on the south facade in order to maximize the electricity output in Hong Kong. And it is not recommended to apply PV glazing on north façade due to limited solar radiation available.
Based on the results above, the vacuum PV glazing not only has the best thermal performance among all types of widely used glazing, but also produces a considerable amount of electricity per year. It is recommended to install vacuum PV glazing on south facade to perform the best overall energy performance.
(2) Simulation of the whole building
Apart from modelling studies conducted under the hot and humid climate of Hong Kong, the annual energy performance of different types of glazing in a cold region (i.e. Beijing) was also simulated for comparison. Simulation results are shown in Figure 20 and Figure 21. It can be observed that the room using the vacuum PV glazing achieves the lowest cooling consumption in both climates. In Beijing, the consumed cooling energy with the vacuum PV glazing is much smaller and is 30.2%, 20.8%, 17.0%, 13.8%, 4.4% less than that of the room with other types of glazing. It can be concluded that the energy saving potential of the vacuum PV glazing is much larger in a cold climate while the electricity generation is much higher during the summer time of Beijing due to the smaller solar incidence angle.
The developed simulation model was further applied to a 20-floor prototype office building. Typical floors of the building are divided into 5 conditioned zones, with a total floor area of 540 m2 (as shown in Figure 22). The reference case – Model 1 keeps all windows as the commonly used double-pane clear glazing, while the design cases include Model 2 and Model 3. Model 2 keeps the north-facing window as the conventional double-pane glazing while changes windows orientated to the other three directions to the developed vacuum PV glazing. The opaque part of all building facades is assumed to be covered with traditional crystalline BIPV with a power conversion efficiency of 15% to maximize the power generation potential of the building envelope. Model 3 shares similar settings with Model 2, except that the window transparency is tuned to 20% with a crystalline silicon (c-Si) as shown in Figure 23. Table 5 shows detailed settings of window properties for the three models respectively. The U-value and SHGC of a-Si vacuum PV glazing are obtained from previous experiments and those of double-pane clear glazing are calculated by the simulation software WINDOW. Thermal and power generation properties of c-Si vacuum PV glazing are obtained from existing literatures.
The simulation results of the total heat gain and loss through all windows are presented in Figure 24 and Figure 25. The heat gain and loss both decrease sharply when traditional double-pane clear glazing is replaced by the PV vacuum glazing. The obvious differences between these three models can be identified from the figures. Compared with the performance of Model 1, the heat gain through windows of Model 2 and Model 3 drops up to 77.89% and 77.97% (south-facing windows), while the heat loss of the two models declines up to 79.28% and 79.32% (south-facing windows), respectively.
On the other side, based on the peak office hour electricity price of 1.4 CNY/kWh for cooling and 0.25 CNY/kWh for heating from the Beijing authority, the simple payback period (See Figure 28) when applying the product to the west, east, and south façade is calculated to be 3.8, 4.6 and 5.3 years compared to the single-pane PV glazing. The payback periods are increased to 4.5, 5.4 and 6.5 years when compared with double-pane PV glazing as shown in Figure 29.
As a result, the product can be considered as a cost-effective application in building facades when considering its tremendous saving of air-conditioning energy and corresponding annual expenses. In addition, the property developer could also benefit from a potential increment in renting rates and popularity, if the building gets certified under a green building scheme by claiming credits in CO2 reduction and renewable application assessment criteria. All the abovementioned potential benefits with the application of the vacuum PV glazing would attract more attention from the construction industry.
3.4 Brief technical guideline for the vacuum PV glazingDesigning the vacuum PV glazing (i.e. vacuum BIPV curtain wall) system is a more complex process than a standard added-on PV system. The architectural context, structural requirements, economic considerations and building regulation requirements should all be considered, so that this brief guidance mainly focuses on the below aspects: design strategy, environmental variables, multifunctionality, installation situation, electrical components, and economic aspects (Polysolar Limited, 2015).
(1) Design strategy
Architects, property developers and building users become more inclined to consider renewable and energy efficient applications to meet building and planning regulations due to rising energy bills and awareness of environmental sustainability. The combination of PV and vacuum glazing is an innovative and promising solution to meet these requirements in the new building developments or refurbishment projects. As proved in the above sections of this report, the developed product offers the added advantage of providing a return of investment from the building envelope. Architectural and structural factors, as well as economic considerations should be taken into account at an early stage in any building projects to integrate renewable systems through a more satisfactory approach.
(2) Environmental variables
When designing a BIPV system, a compromise must be reached between the requirements of energy yield optimisation and those of the architectural environment. Therefore, the orientation, lighting performance, shading and temperature are the four mainly concerned issues in BIPV design. According to simulation and experimental results presented in the above sections, the optimal orientation of the installed PV glazing should be south for maximizing the annual power generation, while cooling load reduction is more conspicuous when the product is applied on the west and east facades. Therefore, it is preferable to install the product on all three facades for an optimal overall building energy-saving performance. The visible light transmittance is only 12% in the developed prototype, which might cause slightly more lighting power consumption compared to traditional double-pane clear glazing. However, the transmittance can be easily adjusted to higher than 20% in the manufacture process depending on the effective area of PV materials. There will always be a trade-off between power generation and permeable light, whereas this research has proved that the combined power generation and cooling load reduction can be more than the increased lighting energy use. Power generation performance of the a-Si PV is less sensitive to shadings, so that the prototype is subject to less influence from peripheral shadings. However, if we change the PV material to c-Si for higher conversion efficiency, a shading calculation should be conducted before allocating the BIPV glazing. Lastly, the conversion efficiency of a-Si glazing is also less sensitive to the increase of the panel temperature. The temperature coefficient must be considered if changing the PV material to c-Si.
The vacuum PV glazing was made by sandwiching a layer of PVB between an external PV laminated glass with a visible light transmittance of 12% and an internal vacuum glass. A low-e coating was also adopted to enhance its thermal performance. The structure of the vacuum PV glazing is shown in Figure 5. The dimension of the vacuum PV glazing is 1300 mm (width) × 1100 mm (height) × 20.87 mm (thickness), thinner than commonly used PV double glazed insulating glass units. Figure 6 presents the pictures of the sample of vacuum PV glazing.
This section presents the main findings and outcomes of the research project and indicates their potential impacts on the local energy use and construction industry. Achievements of the specified research objectives are illustrated, and limitations of the project are also mentioned for the reference of future studies.
3.1 Design and production of the prototype productInitially, we proposed a prototype design as specified by Figure 2, where the vacuum layer was directly coupled with the laminated PV panel. However, during initial manufacture trials, the air pressure difference between internal and external spaces of the vacuum glass samples produced by the laminating machine caused the breakage of the vacuum glass samples. Then, we followed an alternative approach using pre-pressure furnace, whereas the molten state of the polyvinyl butyral (PVB) could not meet the expected requirements and the bubbles greatly impacted the appearance and performance of PV module. Finally, we proposed the current product design based on the experience acquired from previous failures (See Figure 5).
The electrical specifications of the vacuum PV glazing under standard test conditions (STC: air mass 1.5, solar irradiation 1000 W/m2 and cell temperature 25°C) are shown in Table 2. Table 3 presents the given thermal and optical properties of the PV laminated glass and vacuum glass, respectively.
(3) Multi-functionality
Due to their mechanical structures, the PV vacuum glazing can perform the functions of the building envelope in addition to generating emission-free energy, and can thus substitute for conventional construction windows or curtain walls. Apart from power generation and architectural function, the product can provide solar shading with its low SHGC value. It can also act as thermal and sound insulation due to its low U-value and acoustic resistance caused by the vacuum chamber between glazing layers. If applied with special coatings/films on top of PV glazing, it can also provide weather protection.
(4) Mounting system and installation
Based on specific requirements of each project in each region, safety, loading capacity and PV installation specifications can have a decisive impact on the method of fixing/mounting the vacuum. We have in this guide attempted to provide a range of options, highlighting what is possible in current design. The product can be installed with a linear mounting system as mullion-transom facades or structural sealant glazing. It can also be mounted with point-fixing systems including clamp fixings and undercut anchor fixings or mounted into standard curtain walling, rain screen cladding and window systems.
(5) Electrical system
In the curtain wall system, several PV glazing with standard size are usually connected together in a string to form the power generator. The generated direct current is usually fed to an inverter where the direct current is converted to alternating current. If on-site storage is not available, which is the common case in urban areas, the electrical power is registered via an electricity meter and connected to the public supply grid, which will require special permissions from the power grid companies (e.g. CLP in Hong Kong). Therefore, the application of the product will require a full set of electrical systems including cables and connections for parallel or series arrays, direct current load-break switches, inverters and generation meters.
(6) Economic considerations
The economic benefits of the product mainly lie in the following aspects: the substitute for original construction component, CO2 emission reduction and corresponding electricity fee waving, compliance with relevant building regulations (i.e. BEAM Plus in Hong Kong) and application of the feed-in-tariff policy (remuneration for electricity generation from PV).
temperature measurements were conducted through the centre of the vacuum PV sample to calculate the U-value. Secondly, the solar heat gains coefficient (SHGC) of the vacuum PV glazing sample was obtained and compared with three other advanced glazing types in an indoor solar irradiation test. Lastly, an outdoor test was conducted on the platform of Block Z in The Hong Kong Polytechnic University to evaluate the overall thermal performance of vacuum PV glazing. A conventional double clear pane glazing was used as a baseline in the outdoor test.
surfaces shows a similar trend in the three directions. Summing up electricity generation in all floors, the integrated PV modules in Model 2 and 3 can provide 285074.72 kWh/year and 355226.3 kWh/year, which accounts for 13.27% and 16.54% of the total building energy consumption of Model 1. Therefore, given the energy use reduction due to less external heat gain, using the vacuum BIPV glazing can save 27.74% (Model 3) electricity compared to a reference building.

35 Construction Industry Council
The comparison of building energy between Model 1, Model 2 and Model 3 is summarized in Table 6, which includes energy use of lighting, equipment, district cooling and district heating. Although Model 2 and Model 3 consume slightly more lighting energy due to the reduced visible transmittance of the PV glazing, the great energy saving in cooling and heating leads to the net reduction in the total building energy consumption. The total energy consumption of the Model 2 and 3 declines by 20.77 and 22.37 kWh/m2, accounting for 10.44% and 11.20% of Model 1 respectively. Generated electricity of windows and walls in three directions is also presented in Table 7. The south window produced the most electricity, 1527.13 kWh for Model 2 and 3203.76 kWh for Model 3 in a year, taking up nearly 47.80% the total electricity generated by windows. As for the west window, the electricity generated in a year is close to that of east window. Electricity generated by wall
3.2 Experimental study of the vacuum PV glazingOutdoor experimental test was first conducted on the developed prototype vacuum PV (VPV) glazing with the standard size (1.1m × 1.3m), whose various parameters including the ambient air temperature, incident solar irradiation, surface temperatures of the vacuum PV glazing as well as the I-V curves and the power generation were measured and recorded. The power generation and thermal performances of the prototype were also analysed during the test. To further justify the advantage of the vacuum PV glazing, experimental studies were carried out to compare the thermal performance of scaled-down samples (0.3m × 0.3m) with other advanced windows.
(1) Energy performance of the prototypeIn order to evaluate the energy performance of the vacuum PV glazing, an outdoor field measurement was conducted on the platform of Block Z in The Hong Kong Polytechnic University. The vacuum PV glazing was set up horizontally 0.4m above the floor on stilts so that the external temperatures of both sides of the vacuum PV glazing were approximately equal. Various parameters were measured during this test, including the ambient air temperature, the exterior and transmitted horizontal incident solar irradiation, the outer and inner surface temperatures of the vacuum PV glazing as well as the I-V curves and the power generation from the vacuum PV glazing. All the data was logged at an interval of 1 minute. Power generation and thermal performances of the vacuum PV glazing were analyzed based on the outdoor tests. Figure 7 shows the exterior and transmitted incident solar irradiation. It can be seen that the average solar irradiation transmittance during the period is approximately 0.08. Such low transmittance means that vast majority of solar irradiation is blocked by the vacuum PV glazing. Figure 8 presents the outer and inner surface temperature of the vacuum PV glazing. It can be seen that the outer surface temperature is much higher than the inner surface temperature at daytime. The maximum outer surface temperature is 75.3°C, 30°C higher than the inner surface temperature, which indicates that most of the waste heat is dissipated from the outside surface of the vacuum PV glazing, and the heat transfer to the inside space by convection is mitigated. Thus, compared with the conventional single-glazed PV glazing, the structure of the vacuum PV glazing can help reduce the cooling load and improve the indoor thermal comfort.
Then the vacuum PV glazing was mounted on the front side of an experimental test chamber as shown in Figure 9. Clear glass was also adopted in this study for comparison. Figure 10 presents the instantaneous power output of the vacuum PV glazing in 2 sunny days. It can be seen that the power generation from the vacuum PV glazing is consistent with incident solar radiation. A comparative study in terms of internal air temperature of the chamber between the vacuum PV glazing and the clear glass was conducted in a day of June.
As shown in Figure 11, the internal air temperature in the chamber with the vacuum PV glazing is much lower than that with a clear glass. The measured average and maximum internal air temperature for the vacuum PV glazing is 39.6°C and 40.3°C, respectively, while the corresponding average and maximum internal air temperature of the clear glass are 43.6°C and 44.7°C. The maximum internal air temperature difference between the vacuum PV glazing and the clear glass is 4.4°C, occurring in the morning. There are three temperature peaks of internal air temperature. Since the ambient temperature was relatively stable, the main heat gain of the internal air temperature was from incident solar irradiation. The internal air temperature for vacuum PV glazing is much more stable compared with that for the clear glass. The reason is that the vacuum PV glazing has better heat insulation performance so that the internal air temperature is not affected by the external environment significantly. It can also be seen in this figure that the internal air temperature of the chamber drops continuously at 15:00, which shows that the incident solar irradiation on the façade decreases so that the heat gains of the internal air from the sun also drops.
(2) Comparison with other advanced windows
To further justify the advantage of the vacuum PV glazing, experimental studies were carried out to compare it with other advanced windows. Samples of different types of glazing were mounted on the top of two hotboxes (i.e. test rigs) with the uniform dimension of 300 mm (L) × 300 mm (W) × 450mm (H) to implement both indoor and outdoor tests. Firstly, a co-heating test methodology was adopted for the thermal analysis of the vacuum PV glazing. The test rig was filled with the ice-water mixture to ensure the temperature difference between the inside and outside glazing surfaces larger than 5°C. Heat flux and
Figure 12 shows the internal and external temperatures of the vacuum PV glazing sample. The presented data were selected after the hotbox achieved the steady-state condition, when the temperature difference was around 8°C. Heat flux though the glazing sample and the U-value were then determined as illustrated in Figure 13. The average heat flux from the vacuum glazing was measured to be 15.4 W/m2. And the average U-value was calculated as 1.5 W/m2 × K which is much lower than a regular double pane window with the U-value of 2.5W/m2 × K. Considering the edge heat transfer which would strongly affect the heat flux measurement when the sample is small, it can be expected that the centre U-valve of the vacuum PV glazing should be lower than 1.5 W/m2 × K for a larger scale application (e.g. 1.1m × 1.3m).
(3) Cost effective analysis based on simulation
To address the economic benefits of the developed product, the simple payback period of the vacuum PV glazing is calculated with reference to available PV glazing on the market in both Hong Kong and Beijing’s scenarios.
Based on an average electricity price of 1.25 HKD/kWh from HK Electric, the simple payback period (See Figure 26) when applying the product to the west and east façade is calculated to be 7.5 and 8.0 years compared to the single-pane PV glazing. The payback periods are increased to 8.6 and 8.8 years when compared with double-pane PV glazing as shown in Figure 27. However, when applied to the south façade, the extra initial cost of the product cannot be recovered within 10 years.
The solar simulator in the laboratory can provide relatively steady horizontal incident solar irradiation, so that test rigs were located at the same spot to ensure each window sample exposed to the same radiation level. As shown in Figure 14, SHGCs of the vacuum PV glazing and double-pane PV glazing are much smaller than those of the vacuum glazing and double clear glazing, because the coupled PV module can absorb most of the solar irradiation. The vacuum PV glazing has the lowest SHGC of 0.10 which can act as the excellent thermal insulation.
The outdoor test lasted four days from September 26th to September 30th. As shown in Figure 15, September 26th, 27th and 30th were cloudy days and September 28th could be considered as a sunny day. It can be found that the vacuum PV glazing blocks most solar irradiation compared with the double-pane glazing. Figure 16 presents the temperature profile of the vacuum PV glazing and double-pane glazing in the sunny day. The internal surface temperature of both glazing was much higher than the ambient temperature when the outside incident solar radiation is strong. The internal glazing surface and air temperatures of the test rig with the vacuum PV glazing are lower than those of the test rig with the double-pane glazing. The difference between the internal air temperatures of test rigs is much smaller than that of internal glazing surface temperatures. Therefore, the application of vacuum PV glazing can achieve better indoor environment by reducing the solar heat gain.
3.3 Simulation study of the vacuum PV glazing(1) Simulation of a generic building model
Although a series of field tests have been conducted in the outdoor test bed to study the power and thermal performances of the vacuum BIPV glazing, the experimental scenarios are impossible to represent all the situations and variables. Thus, the numerical study was conducted to comprehensively investigate and compare the energy performance of the vacuum PV glazing and other commonly used energy-efficient glazing. As detailed in the research methodology, a comprehensive simulation model based on EnergyPlus and WINDOW has been developed to simulate the overall energy performance of different windows taking into account of their thermal and power output performance. This model is used to simulate the overall energy performance of the vacuum BIPV curtain wall in comparison with other commonly used windows. The key properties of different types of glazing are shown in Table 4 and the electrical specifications of the PV glazing under standard test conditions are referenced to Table 2.
In order to simulate the annual thermal performance and power performance of these types of glazing in Hong Kong for comparison purpose, a typical office room model has been created for simulation, as shown in Figure 17. The dimension of the office model was 2.5m × 2.3m × 2.5m (L × W × H). This room has only one external wall with three identical windows exposed to the outdoor environment. Simulations were conducted for different orientations, i.e. south (S), east (E), west (W) and north (N). A heat transfer model and PV performance model in EnergyPlus are adopted to investigate
the thermal and power performance of different glazing. The heat transfer model is used to calculate the cooling loads of the office room. The cooling loads are then converted to electricity use of air-conditioning system with a presumed coefficient of performance (COP) of 2.78. The equivalent one-diode model is selected to simulate the annual electricity generation from PV elements. The typical meteorological year (TMY) in Hong Kong is selected a reasonable representation of local climates.
The annual cooling electricity use of different types of glazing in different orientations in Hong Kong are shown in Figure 18. It can be observed that the room using vacuum PV glazing consumes the least cooling electricity for all orientations. The south facing room with vacuum PV glazing consumes about 705.56 kWh per year, which was approximately 14.2%, 9.8%, 8.4%, 7.1% and 4.1% less than the corresponding room with single-pane clear glazing, double-pane clear glazing, vacuum glazing, single-pane PV glazing and double-pane PV glazing, respectively. This is because the vacuum PV glazing have the lowest U-value and SHGC among all types of glazing, as shown in Table 4.3. A lower U-value indicates a higher level of heat insulation performance of the glazing, and a lower SHGC means less solar radiation will pass through the windows. Therefore, the vacuum PV glazing performs the best in the area with big temperature difference between indoor and outdoor environment. In addition, the most cooling electricity use of the office room occurs at the west orientation, followed by east, south and north. Therefore, east and west facing windows should have better solar heat insulation performance, to reduce heat gains from outside environment.
In addition to reduce the cooling load of the office room, the PV glazing can also generate electricity in situ. The annual electricity generation of the three types of PV glazing are shown in Figure 19. It can be seen that the annual electricity generation of the three types of PV glazing is similar to each other. The electricity generation from the vacuum PV glazing is a little less than the single-pane PV glazing due to increased solar cell temperature. However, since the temperature coefficient of the thin-film a-Si solar cells is small, the PV conversion efficiency is not reduced significantly. The annual electricity generation from a-Si PV glazing with 12.0% transmittance is around 113.81 kWh per year. Among all orientations, it is better to install PV glazing on the south facade in order to maximize the electricity output in Hong Kong. And it is not recommended to apply PV glazing on north façade due to limited solar radiation available.
Based on the results above, the vacuum PV glazing not only has the best thermal performance among all types of widely used glazing, but also produces a considerable amount of electricity per year. It is recommended to install vacuum PV glazing on south facade to perform the best overall energy performance.
(2) Simulation of the whole building
Apart from modelling studies conducted under the hot and humid climate of Hong Kong, the annual energy performance of different types of glazing in a cold region (i.e. Beijing) was also simulated for comparison. Simulation results are shown in Figure 20 and Figure 21. It can be observed that the room using the vacuum PV glazing achieves the lowest cooling consumption in both climates. In Beijing, the consumed cooling energy with the vacuum PV glazing is much smaller and is 30.2%, 20.8%, 17.0%, 13.8%, 4.4% less than that of the room with other types of glazing. It can be concluded that the energy saving potential of the vacuum PV glazing is much larger in a cold climate while the electricity generation is much higher during the summer time of Beijing due to the smaller solar incidence angle.
The developed simulation model was further applied to a 20-floor prototype office building. Typical floors of the building are divided into 5 conditioned zones, with a total floor area of 540 m2 (as shown in Figure 22). The reference case – Model 1 keeps all windows as the commonly used double-pane clear glazing, while the design cases include Model 2 and Model 3. Model 2 keeps the north-facing window as the conventional double-pane glazing while changes windows orientated to the other three directions to the developed vacuum PV glazing. The opaque part of all building facades is assumed to be covered with traditional crystalline BIPV with a power conversion efficiency of 15% to maximize the power generation potential of the building envelope. Model 3 shares similar settings with Model 2, except that the window transparency is tuned to 20% with a crystalline silicon (c-Si) as shown in Figure 23. Table 5 shows detailed settings of window properties for the three models respectively. The U-value and SHGC of a-Si vacuum PV glazing are obtained from previous experiments and those of double-pane clear glazing are calculated by the simulation software WINDOW. Thermal and power generation properties of c-Si vacuum PV glazing are obtained from existing literatures.
The simulation results of the total heat gain and loss through all windows are presented in Figure 24 and Figure 25. The heat gain and loss both decrease sharply when traditional double-pane clear glazing is replaced by the PV vacuum glazing. The obvious differences between these three models can be identified from the figures. Compared with the performance of Model 1, the heat gain through windows of Model 2 and Model 3 drops up to 77.89% and 77.97% (south-facing windows), while the heat loss of the two models declines up to 79.28% and 79.32% (south-facing windows), respectively.
On the other side, based on the peak office hour electricity price of 1.4 CNY/kWh for cooling and 0.25 CNY/kWh for heating from the Beijing authority, the simple payback period (See Figure 28) when applying the product to the west, east, and south façade is calculated to be 3.8, 4.6 and 5.3 years compared to the single-pane PV glazing. The payback periods are increased to 4.5, 5.4 and 6.5 years when compared with double-pane PV glazing as shown in Figure 29.
As a result, the product can be considered as a cost-effective application in building facades when considering its tremendous saving of air-conditioning energy and corresponding annual expenses. In addition, the property developer could also benefit from a potential increment in renting rates and popularity, if the building gets certified under a green building scheme by claiming credits in CO2 reduction and renewable application assessment criteria. All the abovementioned potential benefits with the application of the vacuum PV glazing would attract more attention from the construction industry.
3.4 Brief technical guideline for the vacuum PV glazingDesigning the vacuum PV glazing (i.e. vacuum BIPV curtain wall) system is a more complex process than a standard added-on PV system. The architectural context, structural requirements, economic considerations and building regulation requirements should all be considered, so that this brief guidance mainly focuses on the below aspects: design strategy, environmental variables, multifunctionality, installation situation, electrical components, and economic aspects (Polysolar Limited, 2015).
(1) Design strategy
Architects, property developers and building users become more inclined to consider renewable and energy efficient applications to meet building and planning regulations due to rising energy bills and awareness of environmental sustainability. The combination of PV and vacuum glazing is an innovative and promising solution to meet these requirements in the new building developments or refurbishment projects. As proved in the above sections of this report, the developed product offers the added advantage of providing a return of investment from the building envelope. Architectural and structural factors, as well as economic considerations should be taken into account at an early stage in any building projects to integrate renewable systems through a more satisfactory approach.
(2) Environmental variables
When designing a BIPV system, a compromise must be reached between the requirements of energy yield optimisation and those of the architectural environment. Therefore, the orientation, lighting performance, shading and temperature are the four mainly concerned issues in BIPV design. According to simulation and experimental results presented in the above sections, the optimal orientation of the installed PV glazing should be south for maximizing the annual power generation, while cooling load reduction is more conspicuous when the product is applied on the west and east facades. Therefore, it is preferable to install the product on all three facades for an optimal overall building energy-saving performance. The visible light transmittance is only 12% in the developed prototype, which might cause slightly more lighting power consumption compared to traditional double-pane clear glazing. However, the transmittance can be easily adjusted to higher than 20% in the manufacture process depending on the effective area of PV materials. There will always be a trade-off between power generation and permeable light, whereas this research has proved that the combined power generation and cooling load reduction can be more than the increased lighting energy use. Power generation performance of the a-Si PV is less sensitive to shadings, so that the prototype is subject to less influence from peripheral shadings. However, if we change the PV material to c-Si for higher conversion efficiency, a shading calculation should be conducted before allocating the BIPV glazing. Lastly, the conversion efficiency of a-Si glazing is also less sensitive to the increase of the panel temperature. The temperature coefficient must be considered if changing the PV material to c-Si.
The vacuum PV glazing was made by sandwiching a layer of PVB between an external PV laminated glass with a visible light transmittance of 12% and an internal vacuum glass. A low-e coating was also adopted to enhance its thermal performance. The structure of the vacuum PV glazing is shown in Figure 5. The dimension of the vacuum PV glazing is 1300 mm (width) × 1100 mm (height) × 20.87 mm (thickness), thinner than commonly used PV double glazed insulating glass units. Figure 6 presents the pictures of the sample of vacuum PV glazing.
This section presents the main findings and outcomes of the research project and indicates their potential impacts on the local energy use and construction industry. Achievements of the specified research objectives are illustrated, and limitations of the project are also mentioned for the reference of future studies.
3.1 Design and production of the prototype productInitially, we proposed a prototype design as specified by Figure 2, where the vacuum layer was directly coupled with the laminated PV panel. However, during initial manufacture trials, the air pressure difference between internal and external spaces of the vacuum glass samples produced by the laminating machine caused the breakage of the vacuum glass samples. Then, we followed an alternative approach using pre-pressure furnace, whereas the molten state of the polyvinyl butyral (PVB) could not meet the expected requirements and the bubbles greatly impacted the appearance and performance of PV module. Finally, we proposed the current product design based on the experience acquired from previous failures (See Figure 5).
The electrical specifications of the vacuum PV glazing under standard test conditions (STC: air mass 1.5, solar irradiation 1000 W/m2 and cell temperature 25°C) are shown in Table 2. Table 3 presents the given thermal and optical properties of the PV laminated glass and vacuum glass, respectively.
(3) Multi-functionality
Due to their mechanical structures, the PV vacuum glazing can perform the functions of the building envelope in addition to generating emission-free energy, and can thus substitute for conventional construction windows or curtain walls. Apart from power generation and architectural function, the product can provide solar shading with its low SHGC value. It can also act as thermal and sound insulation due to its low U-value and acoustic resistance caused by the vacuum chamber between glazing layers. If applied with special coatings/films on top of PV glazing, it can also provide weather protection.
(4) Mounting system and installation
Based on specific requirements of each project in each region, safety, loading capacity and PV installation specifications can have a decisive impact on the method of fixing/mounting the vacuum. We have in this guide attempted to provide a range of options, highlighting what is possible in current design. The product can be installed with a linear mounting system as mullion-transom facades or structural sealant glazing. It can also be mounted with point-fixing systems including clamp fixings and undercut anchor fixings or mounted into standard curtain walling, rain screen cladding and window systems.
(5) Electrical system
In the curtain wall system, several PV glazing with standard size are usually connected together in a string to form the power generator. The generated direct current is usually fed to an inverter where the direct current is converted to alternating current. If on-site storage is not available, which is the common case in urban areas, the electrical power is registered via an electricity meter and connected to the public supply grid, which will require special permissions from the power grid companies (e.g. CLP in Hong Kong). Therefore, the application of the product will require a full set of electrical systems including cables and connections for parallel or series arrays, direct current load-break switches, inverters and generation meters.
(6) Economic considerations
The economic benefits of the product mainly lie in the following aspects: the substitute for original construction component, CO2 emission reduction and corresponding electricity fee waving, compliance with relevant building regulations (i.e. BEAM Plus in Hong Kong) and application of the feed-in-tariff policy (remuneration for electricity generation from PV).
temperature measurements were conducted through the centre of the vacuum PV sample to calculate the U-value. Secondly, the solar heat gains coefficient (SHGC) of the vacuum PV glazing sample was obtained and compared with three other advanced glazing types in an indoor solar irradiation test. Lastly, an outdoor test was conducted on the platform of Block Z in The Hong Kong Polytechnic University to evaluate the overall thermal performance of vacuum PV glazing. A conventional double clear pane glazing was used as a baseline in the outdoor test.
surfaces shows a similar trend in the three directions. Summing up electricity generation in all floors, the integrated PV modules in Model 2 and 3 can provide 285074.72 kWh/year and 355226.3 kWh/year, which accounts for 13.27% and 16.54% of the total building energy consumption of Model 1. Therefore, given the energy use reduction due to less external heat gain, using the vacuum BIPV glazing can save 27.74% (Model 3) electricity compared to a reference building.

36Investigation on the Thermal and Power Performance of Vacuum BIPV Curtain Wall Technology and its Application Potential in Buildings in Hong Kong
4.1 ConclusionThis research project developed an innovative product incorporating the advantages of BIPV and vacuum glazing. Systematic numerical and experimental studies were carried out on the overall energy and economic performance of the developed PV vacuum glazing system, and its application potential was evaluated for the climates of Hong Kong and Beijing. Major findings are concluded as below:
(1) To evaluate the energy performance of the vacuum BIPV glazing, an outdoor field measurement was conducted with the designed prototype. Various parameters including the ambient air temperature, incident solar irradiation, surface temperatures of the vacuum BIPV glazing as well as the I-V curves and the power generation from the vacuum BIPV glazing were measured and recorded. Power generation and thermal performances of the vacuum BIPV glazing were analysed based on the outdoor tests. The prototype achieved excellent solar shading and thermal insulation effects with a low solar transmittance of 8% and large air temperature difference of 4°C between the internal and external ambiance.
(2) To further prove the advantage of the developed product over other advanced windows, indoor comparative test was conducted with scaled-down glazing samples. The product was proved to have a SHGC lower than 0.10 and a U-value smaller than 1.5 W/m2 × K. Its energy performance was apparently better than those of Double-pane clear glazing, Double-pane PV glazing and Vacuum clear glazing.
(3) A comprehensive simulation model coupling EnergyPlus and WINDOW was developed to compare the overall energy performance (i.e. thermal and power generation properties) of the product with other commonly available windows. From a comparison of annual cooling electricity use of different glazing in four major orientations in Hong Kong and Beijing, the optimal installation location for power generation was determined as the south facade, whose cooling electricity reduction ratio could be up to 30.2%.
(4) To explore the maximum energy saving potential for a high-rise commercial building, the product was assumed to be applied to the west, east and south facade of a developed building model. The total energy-saving ratio combining the power generation and air-conditioning load reduction was estimated to be up to 27.74 % depending on the outdoor weather conditions.
(5) Furthermore, a cost-effectiveness analysis was conducted with reference to the available double-pane and single-pane PV glazing on the market. The product installed on the west building facade can recover the extra initial investment within
RECOMMENDATIONS4
The comparison of building energy between Model 1, Model 2 and Model 3 is summarized in Table 6, which includes energy use of lighting, equipment, district cooling and district heating. Although Model 2 and Model 3 consume slightly more lighting energy due to the reduced visible transmittance of the PV glazing, the great energy saving in cooling and heating leads to the net reduction in the total building energy consumption. The total energy consumption of the Model 2 and 3 declines by 20.77 and 22.37 kWh/m2, accounting for 10.44% and 11.20% of Model 1 respectively. Generated electricity of windows and walls in three directions is also presented in Table 7. The south window produced the most electricity, 1527.13 kWh for Model 2 and 3203.76 kWh for Model 3 in a year, taking up nearly 47.80% the total electricity generated by windows. As for the west window, the electricity generated in a year is close to that of east window. Electricity generated by wall
3.2 Experimental study of the vacuum PV glazingOutdoor experimental test was first conducted on the developed prototype vacuum PV (VPV) glazing with the standard size (1.1m × 1.3m), whose various parameters including the ambient air temperature, incident solar irradiation, surface temperatures of the vacuum PV glazing as well as the I-V curves and the power generation were measured and recorded. The power generation and thermal performances of the prototype were also analysed during the test. To further justify the advantage of the vacuum PV glazing, experimental studies were carried out to compare the thermal performance of scaled-down samples (0.3m × 0.3m) with other advanced windows.
(1) Energy performance of the prototypeIn order to evaluate the energy performance of the vacuum PV glazing, an outdoor field measurement was conducted on the platform of Block Z in The Hong Kong Polytechnic University. The vacuum PV glazing was set up horizontally 0.4m above the floor on stilts so that the external temperatures of both sides of the vacuum PV glazing were approximately equal. Various parameters were measured during this test, including the ambient air temperature, the exterior and transmitted horizontal incident solar irradiation, the outer and inner surface temperatures of the vacuum PV glazing as well as the I-V curves and the power generation from the vacuum PV glazing. All the data was logged at an interval of 1 minute. Power generation and thermal performances of the vacuum PV glazing were analyzed based on the outdoor tests. Figure 7 shows the exterior and transmitted incident solar irradiation. It can be seen that the average solar irradiation transmittance during the period is approximately 0.08. Such low transmittance means that vast majority of solar irradiation is blocked by the vacuum PV glazing. Figure 8 presents the outer and inner surface temperature of the vacuum PV glazing. It can be seen that the outer surface temperature is much higher than the inner surface temperature at daytime. The maximum outer surface temperature is 75.3°C, 30°C higher than the inner surface temperature, which indicates that most of the waste heat is dissipated from the outside surface of the vacuum PV glazing, and the heat transfer to the inside space by convection is mitigated. Thus, compared with the conventional single-glazed PV glazing, the structure of the vacuum PV glazing can help reduce the cooling load and improve the indoor thermal comfort.
Then the vacuum PV glazing was mounted on the front side of an experimental test chamber as shown in Figure 9. Clear glass was also adopted in this study for comparison. Figure 10 presents the instantaneous power output of the vacuum PV glazing in 2 sunny days. It can be seen that the power generation from the vacuum PV glazing is consistent with incident solar radiation. A comparative study in terms of internal air temperature of the chamber between the vacuum PV glazing and the clear glass was conducted in a day of June.
As shown in Figure 11, the internal air temperature in the chamber with the vacuum PV glazing is much lower than that with a clear glass. The measured average and maximum internal air temperature for the vacuum PV glazing is 39.6°C and 40.3°C, respectively, while the corresponding average and maximum internal air temperature of the clear glass are 43.6°C and 44.7°C. The maximum internal air temperature difference between the vacuum PV glazing and the clear glass is 4.4°C, occurring in the morning. There are three temperature peaks of internal air temperature. Since the ambient temperature was relatively stable, the main heat gain of the internal air temperature was from incident solar irradiation. The internal air temperature for vacuum PV glazing is much more stable compared with that for the clear glass. The reason is that the vacuum PV glazing has better heat insulation performance so that the internal air temperature is not affected by the external environment significantly. It can also be seen in this figure that the internal air temperature of the chamber drops continuously at 15:00, which shows that the incident solar irradiation on the façade decreases so that the heat gains of the internal air from the sun also drops.
(2) Comparison with other advanced windows
To further justify the advantage of the vacuum PV glazing, experimental studies were carried out to compare it with other advanced windows. Samples of different types of glazing were mounted on the top of two hotboxes (i.e. test rigs) with the uniform dimension of 300 mm (L) × 300 mm (W) × 450mm (H) to implement both indoor and outdoor tests. Firstly, a co-heating test methodology was adopted for the thermal analysis of the vacuum PV glazing. The test rig was filled with the ice-water mixture to ensure the temperature difference between the inside and outside glazing surfaces larger than 5°C. Heat flux and
Figure 12 shows the internal and external temperatures of the vacuum PV glazing sample. The presented data were selected after the hotbox achieved the steady-state condition, when the temperature difference was around 8°C. Heat flux though the glazing sample and the U-value were then determined as illustrated in Figure 13. The average heat flux from the vacuum glazing was measured to be 15.4 W/m2. And the average U-value was calculated as 1.5 W/m2 × K which is much lower than a regular double pane window with the U-value of 2.5W/m2 × K. Considering the edge heat transfer which would strongly affect the heat flux measurement when the sample is small, it can be expected that the centre U-valve of the vacuum PV glazing should be lower than 1.5 W/m2 × K for a larger scale application (e.g. 1.1m × 1.3m).
8.6 years based on the simple payback period calculation in Hong Kong’s scenario. The payback period (for the west facade installation) can be further reduced to less than 4.5 years in Beijing’s scenario.
(6) A brief design guideline covering the design strategy, environmental variables, multifunctionality, installation situation, electrical components, and economic aspects of the developed product was provided for its future large-scale application and commercialization.
4.2 Recommendation for future work In future R&D work, this innovative product should be commercialized by taking the below key actions and involving relevant parties:
(1) Technical issues (R&D institutes and Manufacturers)
The key technical barrier of producing the vacuum PV curtain wall lies in the creation of tempered vacuum glazing. Currently, main manufacturers in the market can only provide tempered vacuum glazing up to around 2 m2. New technologies such as laser sealing should be introduced to facilitate the manufacture of vacuum glazing with larger areas.
(2) Marketing issues (manufacturers and marketing companies)
Detailed marketing surveys should be conducted to locate the interested users as well as drivers and barriers for the potential application of the proposed technology.
(3) Building integration issues (Manufacturers and building companies)
Plug-and-play methods to integrate the proposed product into the building construction should be developed. Surveys on the demands of architects, end users and power suppliers with respect to aesthetics, function of the product and integration with electric grid should be conducted.
(4) Standardization issues (Research institutes, manufacturers and Testing institutes)
Standards for detailed design, performance testing and reliability testing should be developed. Long-term field test on a trial project can provide experience for maintenance and retrofitting.
(5) Financing and subsidy issues (policy makers and banking sector)
Financing schemes to lower the cost of manufacture, installation and maintenance should be recommended to policy makers to lower the market entry threshold for this product.
(6) Training and education (all)
Demonstration projects to show the performance of the vacuum PV curtain wall should be setup to enlighten the public (including policy makers, end-users, installers and architects) on the potential of the product including but not limited to the module performance, systems design and integration issues. Quick and reliable design tools for engineers and installers should be developed and they should be trained with a sufficient level of competence.
(3) Cost effective analysis based on simulation
To address the economic benefits of the developed product, the simple payback period of the vacuum PV glazing is calculated with reference to available PV glazing on the market in both Hong Kong and Beijing’s scenarios.
Based on an average electricity price of 1.25 HKD/kWh from HK Electric, the simple payback period (See Figure 26) when applying the product to the west and east façade is calculated to be 7.5 and 8.0 years compared to the single-pane PV glazing. The payback periods are increased to 8.6 and 8.8 years when compared with double-pane PV glazing as shown in Figure 27. However, when applied to the south façade, the extra initial cost of the product cannot be recovered within 10 years.
The solar simulator in the laboratory can provide relatively steady horizontal incident solar irradiation, so that test rigs were located at the same spot to ensure each window sample exposed to the same radiation level. As shown in Figure 14, SHGCs of the vacuum PV glazing and double-pane PV glazing are much smaller than those of the vacuum glazing and double clear glazing, because the coupled PV module can absorb most of the solar irradiation. The vacuum PV glazing has the lowest SHGC of 0.10 which can act as the excellent thermal insulation.
The outdoor test lasted four days from September 26th to September 30th. As shown in Figure 15, September 26th, 27th and 30th were cloudy days and September 28th could be considered as a sunny day. It can be found that the vacuum PV glazing blocks most solar irradiation compared with the double-pane glazing. Figure 16 presents the temperature profile of the vacuum PV glazing and double-pane glazing in the sunny day. The internal surface temperature of both glazing was much higher than the ambient temperature when the outside incident solar radiation is strong. The internal glazing surface and air temperatures of the test rig with the vacuum PV glazing are lower than those of the test rig with the double-pane glazing. The difference between the internal air temperatures of test rigs is much smaller than that of internal glazing surface temperatures. Therefore, the application of vacuum PV glazing can achieve better indoor environment by reducing the solar heat gain.
3.3 Simulation study of the vacuum PV glazing(1) Simulation of a generic building model
Although a series of field tests have been conducted in the outdoor test bed to study the power and thermal performances of the vacuum BIPV glazing, the experimental scenarios are impossible to represent all the situations and variables. Thus, the numerical study was conducted to comprehensively investigate and compare the energy performance of the vacuum PV glazing and other commonly used energy-efficient glazing. As detailed in the research methodology, a comprehensive simulation model based on EnergyPlus and WINDOW has been developed to simulate the overall energy performance of different windows taking into account of their thermal and power output performance. This model is used to simulate the overall energy performance of the vacuum BIPV curtain wall in comparison with other commonly used windows. The key properties of different types of glazing are shown in Table 4 and the electrical specifications of the PV glazing under standard test conditions are referenced to Table 2.
In order to simulate the annual thermal performance and power performance of these types of glazing in Hong Kong for comparison purpose, a typical office room model has been created for simulation, as shown in Figure 17. The dimension of the office model was 2.5m × 2.3m × 2.5m (L × W × H). This room has only one external wall with three identical windows exposed to the outdoor environment. Simulations were conducted for different orientations, i.e. south (S), east (E), west (W) and north (N). A heat transfer model and PV performance model in EnergyPlus are adopted to investigate
the thermal and power performance of different glazing. The heat transfer model is used to calculate the cooling loads of the office room. The cooling loads are then converted to electricity use of air-conditioning system with a presumed coefficient of performance (COP) of 2.78. The equivalent one-diode model is selected to simulate the annual electricity generation from PV elements. The typical meteorological year (TMY) in Hong Kong is selected a reasonable representation of local climates.
The annual cooling electricity use of different types of glazing in different orientations in Hong Kong are shown in Figure 18. It can be observed that the room using vacuum PV glazing consumes the least cooling electricity for all orientations. The south facing room with vacuum PV glazing consumes about 705.56 kWh per year, which was approximately 14.2%, 9.8%, 8.4%, 7.1% and 4.1% less than the corresponding room with single-pane clear glazing, double-pane clear glazing, vacuum glazing, single-pane PV glazing and double-pane PV glazing, respectively. This is because the vacuum PV glazing have the lowest U-value and SHGC among all types of glazing, as shown in Table 4.3. A lower U-value indicates a higher level of heat insulation performance of the glazing, and a lower SHGC means less solar radiation will pass through the windows. Therefore, the vacuum PV glazing performs the best in the area with big temperature difference between indoor and outdoor environment. In addition, the most cooling electricity use of the office room occurs at the west orientation, followed by east, south and north. Therefore, east and west facing windows should have better solar heat insulation performance, to reduce heat gains from outside environment.
In addition to reduce the cooling load of the office room, the PV glazing can also generate electricity in situ. The annual electricity generation of the three types of PV glazing are shown in Figure 19. It can be seen that the annual electricity generation of the three types of PV glazing is similar to each other. The electricity generation from the vacuum PV glazing is a little less than the single-pane PV glazing due to increased solar cell temperature. However, since the temperature coefficient of the thin-film a-Si solar cells is small, the PV conversion efficiency is not reduced significantly. The annual electricity generation from a-Si PV glazing with 12.0% transmittance is around 113.81 kWh per year. Among all orientations, it is better to install PV glazing on the south facade in order to maximize the electricity output in Hong Kong. And it is not recommended to apply PV glazing on north façade due to limited solar radiation available.
Based on the results above, the vacuum PV glazing not only has the best thermal performance among all types of widely used glazing, but also produces a considerable amount of electricity per year. It is recommended to install vacuum PV glazing on south facade to perform the best overall energy performance.
(2) Simulation of the whole building
Apart from modelling studies conducted under the hot and humid climate of Hong Kong, the annual energy performance of different types of glazing in a cold region (i.e. Beijing) was also simulated for comparison. Simulation results are shown in Figure 20 and Figure 21. It can be observed that the room using the vacuum PV glazing achieves the lowest cooling consumption in both climates. In Beijing, the consumed cooling energy with the vacuum PV glazing is much smaller and is 30.2%, 20.8%, 17.0%, 13.8%, 4.4% less than that of the room with other types of glazing. It can be concluded that the energy saving potential of the vacuum PV glazing is much larger in a cold climate while the electricity generation is much higher during the summer time of Beijing due to the smaller solar incidence angle.
The developed simulation model was further applied to a 20-floor prototype office building. Typical floors of the building are divided into 5 conditioned zones, with a total floor area of 540 m2 (as shown in Figure 22). The reference case – Model 1 keeps all windows as the commonly used double-pane clear glazing, while the design cases include Model 2 and Model 3. Model 2 keeps the north-facing window as the conventional double-pane glazing while changes windows orientated to the other three directions to the developed vacuum PV glazing. The opaque part of all building facades is assumed to be covered with traditional crystalline BIPV with a power conversion efficiency of 15% to maximize the power generation potential of the building envelope. Model 3 shares similar settings with Model 2, except that the window transparency is tuned to 20% with a crystalline silicon (c-Si) as shown in Figure 23. Table 5 shows detailed settings of window properties for the three models respectively. The U-value and SHGC of a-Si vacuum PV glazing are obtained from previous experiments and those of double-pane clear glazing are calculated by the simulation software WINDOW. Thermal and power generation properties of c-Si vacuum PV glazing are obtained from existing literatures.
The simulation results of the total heat gain and loss through all windows are presented in Figure 24 and Figure 25. The heat gain and loss both decrease sharply when traditional double-pane clear glazing is replaced by the PV vacuum glazing. The obvious differences between these three models can be identified from the figures. Compared with the performance of Model 1, the heat gain through windows of Model 2 and Model 3 drops up to 77.89% and 77.97% (south-facing windows), while the heat loss of the two models declines up to 79.28% and 79.32% (south-facing windows), respectively.
On the other side, based on the peak office hour electricity price of 1.4 CNY/kWh for cooling and 0.25 CNY/kWh for heating from the Beijing authority, the simple payback period (See Figure 28) when applying the product to the west, east, and south façade is calculated to be 3.8, 4.6 and 5.3 years compared to the single-pane PV glazing. The payback periods are increased to 4.5, 5.4 and 6.5 years when compared with double-pane PV glazing as shown in Figure 29.
As a result, the product can be considered as a cost-effective application in building facades when considering its tremendous saving of air-conditioning energy and corresponding annual expenses. In addition, the property developer could also benefit from a potential increment in renting rates and popularity, if the building gets certified under a green building scheme by claiming credits in CO2 reduction and renewable application assessment criteria. All the abovementioned potential benefits with the application of the vacuum PV glazing would attract more attention from the construction industry.
3.4 Brief technical guideline for the vacuum PV glazingDesigning the vacuum PV glazing (i.e. vacuum BIPV curtain wall) system is a more complex process than a standard added-on PV system. The architectural context, structural requirements, economic considerations and building regulation requirements should all be considered, so that this brief guidance mainly focuses on the below aspects: design strategy, environmental variables, multifunctionality, installation situation, electrical components, and economic aspects (Polysolar Limited, 2015).
(1) Design strategy
Architects, property developers and building users become more inclined to consider renewable and energy efficient applications to meet building and planning regulations due to rising energy bills and awareness of environmental sustainability. The combination of PV and vacuum glazing is an innovative and promising solution to meet these requirements in the new building developments or refurbishment projects. As proved in the above sections of this report, the developed product offers the added advantage of providing a return of investment from the building envelope. Architectural and structural factors, as well as economic considerations should be taken into account at an early stage in any building projects to integrate renewable systems through a more satisfactory approach.
(2) Environmental variables
When designing a BIPV system, a compromise must be reached between the requirements of energy yield optimisation and those of the architectural environment. Therefore, the orientation, lighting performance, shading and temperature are the four mainly concerned issues in BIPV design. According to simulation and experimental results presented in the above sections, the optimal orientation of the installed PV glazing should be south for maximizing the annual power generation, while cooling load reduction is more conspicuous when the product is applied on the west and east facades. Therefore, it is preferable to install the product on all three facades for an optimal overall building energy-saving performance. The visible light transmittance is only 12% in the developed prototype, which might cause slightly more lighting power consumption compared to traditional double-pane clear glazing. However, the transmittance can be easily adjusted to higher than 20% in the manufacture process depending on the effective area of PV materials. There will always be a trade-off between power generation and permeable light, whereas this research has proved that the combined power generation and cooling load reduction can be more than the increased lighting energy use. Power generation performance of the a-Si PV is less sensitive to shadings, so that the prototype is subject to less influence from peripheral shadings. However, if we change the PV material to c-Si for higher conversion efficiency, a shading calculation should be conducted before allocating the BIPV glazing. Lastly, the conversion efficiency of a-Si glazing is also less sensitive to the increase of the panel temperature. The temperature coefficient must be considered if changing the PV material to c-Si.
The vacuum PV glazing was made by sandwiching a layer of PVB between an external PV laminated glass with a visible light transmittance of 12% and an internal vacuum glass. A low-e coating was also adopted to enhance its thermal performance. The structure of the vacuum PV glazing is shown in Figure 5. The dimension of the vacuum PV glazing is 1300 mm (width) × 1100 mm (height) × 20.87 mm (thickness), thinner than commonly used PV double glazed insulating glass units. Figure 6 presents the pictures of the sample of vacuum PV glazing.
This section presents the main findings and outcomes of the research project and indicates their potential impacts on the local energy use and construction industry. Achievements of the specified research objectives are illustrated, and limitations of the project are also mentioned for the reference of future studies.
3.1 Design and production of the prototype productInitially, we proposed a prototype design as specified by Figure 2, where the vacuum layer was directly coupled with the laminated PV panel. However, during initial manufacture trials, the air pressure difference between internal and external spaces of the vacuum glass samples produced by the laminating machine caused the breakage of the vacuum glass samples. Then, we followed an alternative approach using pre-pressure furnace, whereas the molten state of the polyvinyl butyral (PVB) could not meet the expected requirements and the bubbles greatly impacted the appearance and performance of PV module. Finally, we proposed the current product design based on the experience acquired from previous failures (See Figure 5).
The electrical specifications of the vacuum PV glazing under standard test conditions (STC: air mass 1.5, solar irradiation 1000 W/m2 and cell temperature 25°C) are shown in Table 2. Table 3 presents the given thermal and optical properties of the PV laminated glass and vacuum glass, respectively.
(3) Multi-functionality
Due to their mechanical structures, the PV vacuum glazing can perform the functions of the building envelope in addition to generating emission-free energy, and can thus substitute for conventional construction windows or curtain walls. Apart from power generation and architectural function, the product can provide solar shading with its low SHGC value. It can also act as thermal and sound insulation due to its low U-value and acoustic resistance caused by the vacuum chamber between glazing layers. If applied with special coatings/films on top of PV glazing, it can also provide weather protection.
(4) Mounting system and installation
Based on specific requirements of each project in each region, safety, loading capacity and PV installation specifications can have a decisive impact on the method of fixing/mounting the vacuum. We have in this guide attempted to provide a range of options, highlighting what is possible in current design. The product can be installed with a linear mounting system as mullion-transom facades or structural sealant glazing. It can also be mounted with point-fixing systems including clamp fixings and undercut anchor fixings or mounted into standard curtain walling, rain screen cladding and window systems.
(5) Electrical system
In the curtain wall system, several PV glazing with standard size are usually connected together in a string to form the power generator. The generated direct current is usually fed to an inverter where the direct current is converted to alternating current. If on-site storage is not available, which is the common case in urban areas, the electrical power is registered via an electricity meter and connected to the public supply grid, which will require special permissions from the power grid companies (e.g. CLP in Hong Kong). Therefore, the application of the product will require a full set of electrical systems including cables and connections for parallel or series arrays, direct current load-break switches, inverters and generation meters.
(6) Economic considerations
The economic benefits of the product mainly lie in the following aspects: the substitute for original construction component, CO2 emission reduction and corresponding electricity fee waving, compliance with relevant building regulations (i.e. BEAM Plus in Hong Kong) and application of the feed-in-tariff policy (remuneration for electricity generation from PV).
temperature measurements were conducted through the centre of the vacuum PV sample to calculate the U-value. Secondly, the solar heat gains coefficient (SHGC) of the vacuum PV glazing sample was obtained and compared with three other advanced glazing types in an indoor solar irradiation test. Lastly, an outdoor test was conducted on the platform of Block Z in The Hong Kong Polytechnic University to evaluate the overall thermal performance of vacuum PV glazing. A conventional double clear pane glazing was used as a baseline in the outdoor test.
surfaces shows a similar trend in the three directions. Summing up electricity generation in all floors, the integrated PV modules in Model 2 and 3 can provide 285074.72 kWh/year and 355226.3 kWh/year, which accounts for 13.27% and 16.54% of the total building energy consumption of Model 1. Therefore, given the energy use reduction due to less external heat gain, using the vacuum BIPV glazing can save 27.74% (Model 3) electricity compared to a reference building.

37 Construction Industry Council
4.1 ConclusionThis research project developed an innovative product incorporating the advantages of BIPV and vacuum glazing. Systematic numerical and experimental studies were carried out on the overall energy and economic performance of the developed PV vacuum glazing system, and its application potential was evaluated for the climates of Hong Kong and Beijing. Major findings are concluded as below:
(1) To evaluate the energy performance of the vacuum BIPV glazing, an outdoor field measurement was conducted with the designed prototype. Various parameters including the ambient air temperature, incident solar irradiation, surface temperatures of the vacuum BIPV glazing as well as the I-V curves and the power generation from the vacuum BIPV glazing were measured and recorded. Power generation and thermal performances of the vacuum BIPV glazing were analysed based on the outdoor tests. The prototype achieved excellent solar shading and thermal insulation effects with a low solar transmittance of 8% and large air temperature difference of 4°C between the internal and external ambiance.
(2) To further prove the advantage of the developed product over other advanced windows, indoor comparative test was conducted with scaled-down glazing samples. The product was proved to have a SHGC lower than 0.10 and a U-value smaller than 1.5 W/m2 × K. Its energy performance was apparently better than those of Double-pane clear glazing, Double-pane PV glazing and Vacuum clear glazing.
(3) A comprehensive simulation model coupling EnergyPlus and WINDOW was developed to compare the overall energy performance (i.e. thermal and power generation properties) of the product with other commonly available windows. From a comparison of annual cooling electricity use of different glazing in four major orientations in Hong Kong and Beijing, the optimal installation location for power generation was determined as the south facade, whose cooling electricity reduction ratio could be up to 30.2%.
(4) To explore the maximum energy saving potential for a high-rise commercial building, the product was assumed to be applied to the west, east and south facade of a developed building model. The total energy-saving ratio combining the power generation and air-conditioning load reduction was estimated to be up to 27.74 % depending on the outdoor weather conditions.
(5) Furthermore, a cost-effectiveness analysis was conducted with reference to the available double-pane and single-pane PV glazing on the market. The product installed on the west building facade can recover the extra initial investment within
The comparison of building energy between Model 1, Model 2 and Model 3 is summarized in Table 6, which includes energy use of lighting, equipment, district cooling and district heating. Although Model 2 and Model 3 consume slightly more lighting energy due to the reduced visible transmittance of the PV glazing, the great energy saving in cooling and heating leads to the net reduction in the total building energy consumption. The total energy consumption of the Model 2 and 3 declines by 20.77 and 22.37 kWh/m2, accounting for 10.44% and 11.20% of Model 1 respectively. Generated electricity of windows and walls in three directions is also presented in Table 7. The south window produced the most electricity, 1527.13 kWh for Model 2 and 3203.76 kWh for Model 3 in a year, taking up nearly 47.80% the total electricity generated by windows. As for the west window, the electricity generated in a year is close to that of east window. Electricity generated by wall
3.2 Experimental study of the vacuum PV glazingOutdoor experimental test was first conducted on the developed prototype vacuum PV (VPV) glazing with the standard size (1.1m × 1.3m), whose various parameters including the ambient air temperature, incident solar irradiation, surface temperatures of the vacuum PV glazing as well as the I-V curves and the power generation were measured and recorded. The power generation and thermal performances of the prototype were also analysed during the test. To further justify the advantage of the vacuum PV glazing, experimental studies were carried out to compare the thermal performance of scaled-down samples (0.3m × 0.3m) with other advanced windows.
(1) Energy performance of the prototypeIn order to evaluate the energy performance of the vacuum PV glazing, an outdoor field measurement was conducted on the platform of Block Z in The Hong Kong Polytechnic University. The vacuum PV glazing was set up horizontally 0.4m above the floor on stilts so that the external temperatures of both sides of the vacuum PV glazing were approximately equal. Various parameters were measured during this test, including the ambient air temperature, the exterior and transmitted horizontal incident solar irradiation, the outer and inner surface temperatures of the vacuum PV glazing as well as the I-V curves and the power generation from the vacuum PV glazing. All the data was logged at an interval of 1 minute. Power generation and thermal performances of the vacuum PV glazing were analyzed based on the outdoor tests. Figure 7 shows the exterior and transmitted incident solar irradiation. It can be seen that the average solar irradiation transmittance during the period is approximately 0.08. Such low transmittance means that vast majority of solar irradiation is blocked by the vacuum PV glazing. Figure 8 presents the outer and inner surface temperature of the vacuum PV glazing. It can be seen that the outer surface temperature is much higher than the inner surface temperature at daytime. The maximum outer surface temperature is 75.3°C, 30°C higher than the inner surface temperature, which indicates that most of the waste heat is dissipated from the outside surface of the vacuum PV glazing, and the heat transfer to the inside space by convection is mitigated. Thus, compared with the conventional single-glazed PV glazing, the structure of the vacuum PV glazing can help reduce the cooling load and improve the indoor thermal comfort.
Then the vacuum PV glazing was mounted on the front side of an experimental test chamber as shown in Figure 9. Clear glass was also adopted in this study for comparison. Figure 10 presents the instantaneous power output of the vacuum PV glazing in 2 sunny days. It can be seen that the power generation from the vacuum PV glazing is consistent with incident solar radiation. A comparative study in terms of internal air temperature of the chamber between the vacuum PV glazing and the clear glass was conducted in a day of June.
As shown in Figure 11, the internal air temperature in the chamber with the vacuum PV glazing is much lower than that with a clear glass. The measured average and maximum internal air temperature for the vacuum PV glazing is 39.6°C and 40.3°C, respectively, while the corresponding average and maximum internal air temperature of the clear glass are 43.6°C and 44.7°C. The maximum internal air temperature difference between the vacuum PV glazing and the clear glass is 4.4°C, occurring in the morning. There are three temperature peaks of internal air temperature. Since the ambient temperature was relatively stable, the main heat gain of the internal air temperature was from incident solar irradiation. The internal air temperature for vacuum PV glazing is much more stable compared with that for the clear glass. The reason is that the vacuum PV glazing has better heat insulation performance so that the internal air temperature is not affected by the external environment significantly. It can also be seen in this figure that the internal air temperature of the chamber drops continuously at 15:00, which shows that the incident solar irradiation on the façade decreases so that the heat gains of the internal air from the sun also drops.
(2) Comparison with other advanced windows
To further justify the advantage of the vacuum PV glazing, experimental studies were carried out to compare it with other advanced windows. Samples of different types of glazing were mounted on the top of two hotboxes (i.e. test rigs) with the uniform dimension of 300 mm (L) × 300 mm (W) × 450mm (H) to implement both indoor and outdoor tests. Firstly, a co-heating test methodology was adopted for the thermal analysis of the vacuum PV glazing. The test rig was filled with the ice-water mixture to ensure the temperature difference between the inside and outside glazing surfaces larger than 5°C. Heat flux and
Figure 12 shows the internal and external temperatures of the vacuum PV glazing sample. The presented data were selected after the hotbox achieved the steady-state condition, when the temperature difference was around 8°C. Heat flux though the glazing sample and the U-value were then determined as illustrated in Figure 13. The average heat flux from the vacuum glazing was measured to be 15.4 W/m2. And the average U-value was calculated as 1.5 W/m2 × K which is much lower than a regular double pane window with the U-value of 2.5W/m2 × K. Considering the edge heat transfer which would strongly affect the heat flux measurement when the sample is small, it can be expected that the centre U-valve of the vacuum PV glazing should be lower than 1.5 W/m2 × K for a larger scale application (e.g. 1.1m × 1.3m).
8.6 years based on the simple payback period calculation in Hong Kong’s scenario. The payback period (for the west facade installation) can be further reduced to less than 4.5 years in Beijing’s scenario.
(6) A brief design guideline covering the design strategy, environmental variables, multifunctionality, installation situation, electrical components, and economic aspects of the developed product was provided for its future large-scale application and commercialization.
4.2 Recommendation for future work In future R&D work, this innovative product should be commercialized by taking the below key actions and involving relevant parties:
(1) Technical issues (R&D institutes and Manufacturers)
The key technical barrier of producing the vacuum PV curtain wall lies in the creation of tempered vacuum glazing. Currently, main manufacturers in the market can only provide tempered vacuum glazing up to around 2 m2. New technologies such as laser sealing should be introduced to facilitate the manufacture of vacuum glazing with larger areas.
(2) Marketing issues (manufacturers and marketing companies)
Detailed marketing surveys should be conducted to locate the interested users as well as drivers and barriers for the potential application of the proposed technology.
(3) Building integration issues (Manufacturers and building companies)
Plug-and-play methods to integrate the proposed product into the building construction should be developed. Surveys on the demands of architects, end users and power suppliers with respect to aesthetics, function of the product and integration with electric grid should be conducted.
(4) Standardization issues (Research institutes, manufacturers and Testing institutes)
Standards for detailed design, performance testing and reliability testing should be developed. Long-term field test on a trial project can provide experience for maintenance and retrofitting.
(5) Financing and subsidy issues (policy makers and banking sector)
Financing schemes to lower the cost of manufacture, installation and maintenance should be recommended to policy makers to lower the market entry threshold for this product.
(6) Training and education (all)
Demonstration projects to show the performance of the vacuum PV curtain wall should be setup to enlighten the public (including policy makers, end-users, installers and architects) on the potential of the product including but not limited to the module performance, systems design and integration issues. Quick and reliable design tools for engineers and installers should be developed and they should be trained with a sufficient level of competence.
(3) Cost effective analysis based on simulation
To address the economic benefits of the developed product, the simple payback period of the vacuum PV glazing is calculated with reference to available PV glazing on the market in both Hong Kong and Beijing’s scenarios.
Based on an average electricity price of 1.25 HKD/kWh from HK Electric, the simple payback period (See Figure 26) when applying the product to the west and east façade is calculated to be 7.5 and 8.0 years compared to the single-pane PV glazing. The payback periods are increased to 8.6 and 8.8 years when compared with double-pane PV glazing as shown in Figure 27. However, when applied to the south façade, the extra initial cost of the product cannot be recovered within 10 years.
The solar simulator in the laboratory can provide relatively steady horizontal incident solar irradiation, so that test rigs were located at the same spot to ensure each window sample exposed to the same radiation level. As shown in Figure 14, SHGCs of the vacuum PV glazing and double-pane PV glazing are much smaller than those of the vacuum glazing and double clear glazing, because the coupled PV module can absorb most of the solar irradiation. The vacuum PV glazing has the lowest SHGC of 0.10 which can act as the excellent thermal insulation.
The outdoor test lasted four days from September 26th to September 30th. As shown in Figure 15, September 26th, 27th and 30th were cloudy days and September 28th could be considered as a sunny day. It can be found that the vacuum PV glazing blocks most solar irradiation compared with the double-pane glazing. Figure 16 presents the temperature profile of the vacuum PV glazing and double-pane glazing in the sunny day. The internal surface temperature of both glazing was much higher than the ambient temperature when the outside incident solar radiation is strong. The internal glazing surface and air temperatures of the test rig with the vacuum PV glazing are lower than those of the test rig with the double-pane glazing. The difference between the internal air temperatures of test rigs is much smaller than that of internal glazing surface temperatures. Therefore, the application of vacuum PV glazing can achieve better indoor environment by reducing the solar heat gain.
3.3 Simulation study of the vacuum PV glazing(1) Simulation of a generic building model
Although a series of field tests have been conducted in the outdoor test bed to study the power and thermal performances of the vacuum BIPV glazing, the experimental scenarios are impossible to represent all the situations and variables. Thus, the numerical study was conducted to comprehensively investigate and compare the energy performance of the vacuum PV glazing and other commonly used energy-efficient glazing. As detailed in the research methodology, a comprehensive simulation model based on EnergyPlus and WINDOW has been developed to simulate the overall energy performance of different windows taking into account of their thermal and power output performance. This model is used to simulate the overall energy performance of the vacuum BIPV curtain wall in comparison with other commonly used windows. The key properties of different types of glazing are shown in Table 4 and the electrical specifications of the PV glazing under standard test conditions are referenced to Table 2.
In order to simulate the annual thermal performance and power performance of these types of glazing in Hong Kong for comparison purpose, a typical office room model has been created for simulation, as shown in Figure 17. The dimension of the office model was 2.5m × 2.3m × 2.5m (L × W × H). This room has only one external wall with three identical windows exposed to the outdoor environment. Simulations were conducted for different orientations, i.e. south (S), east (E), west (W) and north (N). A heat transfer model and PV performance model in EnergyPlus are adopted to investigate
the thermal and power performance of different glazing. The heat transfer model is used to calculate the cooling loads of the office room. The cooling loads are then converted to electricity use of air-conditioning system with a presumed coefficient of performance (COP) of 2.78. The equivalent one-diode model is selected to simulate the annual electricity generation from PV elements. The typical meteorological year (TMY) in Hong Kong is selected a reasonable representation of local climates.
The annual cooling electricity use of different types of glazing in different orientations in Hong Kong are shown in Figure 18. It can be observed that the room using vacuum PV glazing consumes the least cooling electricity for all orientations. The south facing room with vacuum PV glazing consumes about 705.56 kWh per year, which was approximately 14.2%, 9.8%, 8.4%, 7.1% and 4.1% less than the corresponding room with single-pane clear glazing, double-pane clear glazing, vacuum glazing, single-pane PV glazing and double-pane PV glazing, respectively. This is because the vacuum PV glazing have the lowest U-value and SHGC among all types of glazing, as shown in Table 4.3. A lower U-value indicates a higher level of heat insulation performance of the glazing, and a lower SHGC means less solar radiation will pass through the windows. Therefore, the vacuum PV glazing performs the best in the area with big temperature difference between indoor and outdoor environment. In addition, the most cooling electricity use of the office room occurs at the west orientation, followed by east, south and north. Therefore, east and west facing windows should have better solar heat insulation performance, to reduce heat gains from outside environment.
In addition to reduce the cooling load of the office room, the PV glazing can also generate electricity in situ. The annual electricity generation of the three types of PV glazing are shown in Figure 19. It can be seen that the annual electricity generation of the three types of PV glazing is similar to each other. The electricity generation from the vacuum PV glazing is a little less than the single-pane PV glazing due to increased solar cell temperature. However, since the temperature coefficient of the thin-film a-Si solar cells is small, the PV conversion efficiency is not reduced significantly. The annual electricity generation from a-Si PV glazing with 12.0% transmittance is around 113.81 kWh per year. Among all orientations, it is better to install PV glazing on the south facade in order to maximize the electricity output in Hong Kong. And it is not recommended to apply PV glazing on north façade due to limited solar radiation available.
Based on the results above, the vacuum PV glazing not only has the best thermal performance among all types of widely used glazing, but also produces a considerable amount of electricity per year. It is recommended to install vacuum PV glazing on south facade to perform the best overall energy performance.
(2) Simulation of the whole building
Apart from modelling studies conducted under the hot and humid climate of Hong Kong, the annual energy performance of different types of glazing in a cold region (i.e. Beijing) was also simulated for comparison. Simulation results are shown in Figure 20 and Figure 21. It can be observed that the room using the vacuum PV glazing achieves the lowest cooling consumption in both climates. In Beijing, the consumed cooling energy with the vacuum PV glazing is much smaller and is 30.2%, 20.8%, 17.0%, 13.8%, 4.4% less than that of the room with other types of glazing. It can be concluded that the energy saving potential of the vacuum PV glazing is much larger in a cold climate while the electricity generation is much higher during the summer time of Beijing due to the smaller solar incidence angle.
The developed simulation model was further applied to a 20-floor prototype office building. Typical floors of the building are divided into 5 conditioned zones, with a total floor area of 540 m2 (as shown in Figure 22). The reference case – Model 1 keeps all windows as the commonly used double-pane clear glazing, while the design cases include Model 2 and Model 3. Model 2 keeps the north-facing window as the conventional double-pane glazing while changes windows orientated to the other three directions to the developed vacuum PV glazing. The opaque part of all building facades is assumed to be covered with traditional crystalline BIPV with a power conversion efficiency of 15% to maximize the power generation potential of the building envelope. Model 3 shares similar settings with Model 2, except that the window transparency is tuned to 20% with a crystalline silicon (c-Si) as shown in Figure 23. Table 5 shows detailed settings of window properties for the three models respectively. The U-value and SHGC of a-Si vacuum PV glazing are obtained from previous experiments and those of double-pane clear glazing are calculated by the simulation software WINDOW. Thermal and power generation properties of c-Si vacuum PV glazing are obtained from existing literatures.
The simulation results of the total heat gain and loss through all windows are presented in Figure 24 and Figure 25. The heat gain and loss both decrease sharply when traditional double-pane clear glazing is replaced by the PV vacuum glazing. The obvious differences between these three models can be identified from the figures. Compared with the performance of Model 1, the heat gain through windows of Model 2 and Model 3 drops up to 77.89% and 77.97% (south-facing windows), while the heat loss of the two models declines up to 79.28% and 79.32% (south-facing windows), respectively.
On the other side, based on the peak office hour electricity price of 1.4 CNY/kWh for cooling and 0.25 CNY/kWh for heating from the Beijing authority, the simple payback period (See Figure 28) when applying the product to the west, east, and south façade is calculated to be 3.8, 4.6 and 5.3 years compared to the single-pane PV glazing. The payback periods are increased to 4.5, 5.4 and 6.5 years when compared with double-pane PV glazing as shown in Figure 29.
As a result, the product can be considered as a cost-effective application in building facades when considering its tremendous saving of air-conditioning energy and corresponding annual expenses. In addition, the property developer could also benefit from a potential increment in renting rates and popularity, if the building gets certified under a green building scheme by claiming credits in CO2 reduction and renewable application assessment criteria. All the abovementioned potential benefits with the application of the vacuum PV glazing would attract more attention from the construction industry.
3.4 Brief technical guideline for the vacuum PV glazingDesigning the vacuum PV glazing (i.e. vacuum BIPV curtain wall) system is a more complex process than a standard added-on PV system. The architectural context, structural requirements, economic considerations and building regulation requirements should all be considered, so that this brief guidance mainly focuses on the below aspects: design strategy, environmental variables, multifunctionality, installation situation, electrical components, and economic aspects (Polysolar Limited, 2015).
(1) Design strategy
Architects, property developers and building users become more inclined to consider renewable and energy efficient applications to meet building and planning regulations due to rising energy bills and awareness of environmental sustainability. The combination of PV and vacuum glazing is an innovative and promising solution to meet these requirements in the new building developments or refurbishment projects. As proved in the above sections of this report, the developed product offers the added advantage of providing a return of investment from the building envelope. Architectural and structural factors, as well as economic considerations should be taken into account at an early stage in any building projects to integrate renewable systems through a more satisfactory approach.
(2) Environmental variables
When designing a BIPV system, a compromise must be reached between the requirements of energy yield optimisation and those of the architectural environment. Therefore, the orientation, lighting performance, shading and temperature are the four mainly concerned issues in BIPV design. According to simulation and experimental results presented in the above sections, the optimal orientation of the installed PV glazing should be south for maximizing the annual power generation, while cooling load reduction is more conspicuous when the product is applied on the west and east facades. Therefore, it is preferable to install the product on all three facades for an optimal overall building energy-saving performance. The visible light transmittance is only 12% in the developed prototype, which might cause slightly more lighting power consumption compared to traditional double-pane clear glazing. However, the transmittance can be easily adjusted to higher than 20% in the manufacture process depending on the effective area of PV materials. There will always be a trade-off between power generation and permeable light, whereas this research has proved that the combined power generation and cooling load reduction can be more than the increased lighting energy use. Power generation performance of the a-Si PV is less sensitive to shadings, so that the prototype is subject to less influence from peripheral shadings. However, if we change the PV material to c-Si for higher conversion efficiency, a shading calculation should be conducted before allocating the BIPV glazing. Lastly, the conversion efficiency of a-Si glazing is also less sensitive to the increase of the panel temperature. The temperature coefficient must be considered if changing the PV material to c-Si.
The vacuum PV glazing was made by sandwiching a layer of PVB between an external PV laminated glass with a visible light transmittance of 12% and an internal vacuum glass. A low-e coating was also adopted to enhance its thermal performance. The structure of the vacuum PV glazing is shown in Figure 5. The dimension of the vacuum PV glazing is 1300 mm (width) × 1100 mm (height) × 20.87 mm (thickness), thinner than commonly used PV double glazed insulating glass units. Figure 6 presents the pictures of the sample of vacuum PV glazing.
This section presents the main findings and outcomes of the research project and indicates their potential impacts on the local energy use and construction industry. Achievements of the specified research objectives are illustrated, and limitations of the project are also mentioned for the reference of future studies.
3.1 Design and production of the prototype productInitially, we proposed a prototype design as specified by Figure 2, where the vacuum layer was directly coupled with the laminated PV panel. However, during initial manufacture trials, the air pressure difference between internal and external spaces of the vacuum glass samples produced by the laminating machine caused the breakage of the vacuum glass samples. Then, we followed an alternative approach using pre-pressure furnace, whereas the molten state of the polyvinyl butyral (PVB) could not meet the expected requirements and the bubbles greatly impacted the appearance and performance of PV module. Finally, we proposed the current product design based on the experience acquired from previous failures (See Figure 5).
The electrical specifications of the vacuum PV glazing under standard test conditions (STC: air mass 1.5, solar irradiation 1000 W/m2 and cell temperature 25°C) are shown in Table 2. Table 3 presents the given thermal and optical properties of the PV laminated glass and vacuum glass, respectively.
(3) Multi-functionality
Due to their mechanical structures, the PV vacuum glazing can perform the functions of the building envelope in addition to generating emission-free energy, and can thus substitute for conventional construction windows or curtain walls. Apart from power generation and architectural function, the product can provide solar shading with its low SHGC value. It can also act as thermal and sound insulation due to its low U-value and acoustic resistance caused by the vacuum chamber between glazing layers. If applied with special coatings/films on top of PV glazing, it can also provide weather protection.
(4) Mounting system and installation
Based on specific requirements of each project in each region, safety, loading capacity and PV installation specifications can have a decisive impact on the method of fixing/mounting the vacuum. We have in this guide attempted to provide a range of options, highlighting what is possible in current design. The product can be installed with a linear mounting system as mullion-transom facades or structural sealant glazing. It can also be mounted with point-fixing systems including clamp fixings and undercut anchor fixings or mounted into standard curtain walling, rain screen cladding and window systems.
(5) Electrical system
In the curtain wall system, several PV glazing with standard size are usually connected together in a string to form the power generator. The generated direct current is usually fed to an inverter where the direct current is converted to alternating current. If on-site storage is not available, which is the common case in urban areas, the electrical power is registered via an electricity meter and connected to the public supply grid, which will require special permissions from the power grid companies (e.g. CLP in Hong Kong). Therefore, the application of the product will require a full set of electrical systems including cables and connections for parallel or series arrays, direct current load-break switches, inverters and generation meters.
(6) Economic considerations
The economic benefits of the product mainly lie in the following aspects: the substitute for original construction component, CO2 emission reduction and corresponding electricity fee waving, compliance with relevant building regulations (i.e. BEAM Plus in Hong Kong) and application of the feed-in-tariff policy (remuneration for electricity generation from PV).
temperature measurements were conducted through the centre of the vacuum PV sample to calculate the U-value. Secondly, the solar heat gains coefficient (SHGC) of the vacuum PV glazing sample was obtained and compared with three other advanced glazing types in an indoor solar irradiation test. Lastly, an outdoor test was conducted on the platform of Block Z in The Hong Kong Polytechnic University to evaluate the overall thermal performance of vacuum PV glazing. A conventional double clear pane glazing was used as a baseline in the outdoor test.
surfaces shows a similar trend in the three directions. Summing up electricity generation in all floors, the integrated PV modules in Model 2 and 3 can provide 285074.72 kWh/year and 355226.3 kWh/year, which accounts for 13.27% and 16.54% of the total building energy consumption of Model 1. Therefore, given the energy use reduction due to less external heat gain, using the vacuum BIPV glazing can save 27.74% (Model 3) electricity compared to a reference building.

38Investigation on the Thermal and Power Performance of Vacuum BIPV Curtain Wall Technology and its Application Potential in Buildings in Hong Kong
4.1 ConclusionThis research project developed an innovative product incorporating the advantages of BIPV and vacuum glazing. Systematic numerical and experimental studies were carried out on the overall energy and economic performance of the developed PV vacuum glazing system, and its application potential was evaluated for the climates of Hong Kong and Beijing. Major findings are concluded as below:
(1) To evaluate the energy performance of the vacuum BIPV glazing, an outdoor field measurement was conducted with the designed prototype. Various parameters including the ambient air temperature, incident solar irradiation, surface temperatures of the vacuum BIPV glazing as well as the I-V curves and the power generation from the vacuum BIPV glazing were measured and recorded. Power generation and thermal performances of the vacuum BIPV glazing were analysed based on the outdoor tests. The prototype achieved excellent solar shading and thermal insulation effects with a low solar transmittance of 8% and large air temperature difference of 4°C between the internal and external ambiance.
(2) To further prove the advantage of the developed product over other advanced windows, indoor comparative test was conducted with scaled-down glazing samples. The product was proved to have a SHGC lower than 0.10 and a U-value smaller than 1.5 W/m2 × K. Its energy performance was apparently better than those of Double-pane clear glazing, Double-pane PV glazing and Vacuum clear glazing.
(3) A comprehensive simulation model coupling EnergyPlus and WINDOW was developed to compare the overall energy performance (i.e. thermal and power generation properties) of the product with other commonly available windows. From a comparison of annual cooling electricity use of different glazing in four major orientations in Hong Kong and Beijing, the optimal installation location for power generation was determined as the south facade, whose cooling electricity reduction ratio could be up to 30.2%.
(4) To explore the maximum energy saving potential for a high-rise commercial building, the product was assumed to be applied to the west, east and south facade of a developed building model. The total energy-saving ratio combining the power generation and air-conditioning load reduction was estimated to be up to 27.74 % depending on the outdoor weather conditions.
(5) Furthermore, a cost-effectiveness analysis was conducted with reference to the available double-pane and single-pane PV glazing on the market. The product installed on the west building facade can recover the extra initial investment within
The comparison of building energy between Model 1, Model 2 and Model 3 is summarized in Table 6, which includes energy use of lighting, equipment, district cooling and district heating. Although Model 2 and Model 3 consume slightly more lighting energy due to the reduced visible transmittance of the PV glazing, the great energy saving in cooling and heating leads to the net reduction in the total building energy consumption. The total energy consumption of the Model 2 and 3 declines by 20.77 and 22.37 kWh/m2, accounting for 10.44% and 11.20% of Model 1 respectively. Generated electricity of windows and walls in three directions is also presented in Table 7. The south window produced the most electricity, 1527.13 kWh for Model 2 and 3203.76 kWh for Model 3 in a year, taking up nearly 47.80% the total electricity generated by windows. As for the west window, the electricity generated in a year is close to that of east window. Electricity generated by wall
3.2 Experimental study of the vacuum PV glazingOutdoor experimental test was first conducted on the developed prototype vacuum PV (VPV) glazing with the standard size (1.1m × 1.3m), whose various parameters including the ambient air temperature, incident solar irradiation, surface temperatures of the vacuum PV glazing as well as the I-V curves and the power generation were measured and recorded. The power generation and thermal performances of the prototype were also analysed during the test. To further justify the advantage of the vacuum PV glazing, experimental studies were carried out to compare the thermal performance of scaled-down samples (0.3m × 0.3m) with other advanced windows.
(1) Energy performance of the prototypeIn order to evaluate the energy performance of the vacuum PV glazing, an outdoor field measurement was conducted on the platform of Block Z in The Hong Kong Polytechnic University. The vacuum PV glazing was set up horizontally 0.4m above the floor on stilts so that the external temperatures of both sides of the vacuum PV glazing were approximately equal. Various parameters were measured during this test, including the ambient air temperature, the exterior and transmitted horizontal incident solar irradiation, the outer and inner surface temperatures of the vacuum PV glazing as well as the I-V curves and the power generation from the vacuum PV glazing. All the data was logged at an interval of 1 minute. Power generation and thermal performances of the vacuum PV glazing were analyzed based on the outdoor tests. Figure 7 shows the exterior and transmitted incident solar irradiation. It can be seen that the average solar irradiation transmittance during the period is approximately 0.08. Such low transmittance means that vast majority of solar irradiation is blocked by the vacuum PV glazing. Figure 8 presents the outer and inner surface temperature of the vacuum PV glazing. It can be seen that the outer surface temperature is much higher than the inner surface temperature at daytime. The maximum outer surface temperature is 75.3°C, 30°C higher than the inner surface temperature, which indicates that most of the waste heat is dissipated from the outside surface of the vacuum PV glazing, and the heat transfer to the inside space by convection is mitigated. Thus, compared with the conventional single-glazed PV glazing, the structure of the vacuum PV glazing can help reduce the cooling load and improve the indoor thermal comfort.
Then the vacuum PV glazing was mounted on the front side of an experimental test chamber as shown in Figure 9. Clear glass was also adopted in this study for comparison. Figure 10 presents the instantaneous power output of the vacuum PV glazing in 2 sunny days. It can be seen that the power generation from the vacuum PV glazing is consistent with incident solar radiation. A comparative study in terms of internal air temperature of the chamber between the vacuum PV glazing and the clear glass was conducted in a day of June.
As shown in Figure 11, the internal air temperature in the chamber with the vacuum PV glazing is much lower than that with a clear glass. The measured average and maximum internal air temperature for the vacuum PV glazing is 39.6°C and 40.3°C, respectively, while the corresponding average and maximum internal air temperature of the clear glass are 43.6°C and 44.7°C. The maximum internal air temperature difference between the vacuum PV glazing and the clear glass is 4.4°C, occurring in the morning. There are three temperature peaks of internal air temperature. Since the ambient temperature was relatively stable, the main heat gain of the internal air temperature was from incident solar irradiation. The internal air temperature for vacuum PV glazing is much more stable compared with that for the clear glass. The reason is that the vacuum PV glazing has better heat insulation performance so that the internal air temperature is not affected by the external environment significantly. It can also be seen in this figure that the internal air temperature of the chamber drops continuously at 15:00, which shows that the incident solar irradiation on the façade decreases so that the heat gains of the internal air from the sun also drops.
(2) Comparison with other advanced windows
To further justify the advantage of the vacuum PV glazing, experimental studies were carried out to compare it with other advanced windows. Samples of different types of glazing were mounted on the top of two hotboxes (i.e. test rigs) with the uniform dimension of 300 mm (L) × 300 mm (W) × 450mm (H) to implement both indoor and outdoor tests. Firstly, a co-heating test methodology was adopted for the thermal analysis of the vacuum PV glazing. The test rig was filled with the ice-water mixture to ensure the temperature difference between the inside and outside glazing surfaces larger than 5°C. Heat flux and
Figure 12 shows the internal and external temperatures of the vacuum PV glazing sample. The presented data were selected after the hotbox achieved the steady-state condition, when the temperature difference was around 8°C. Heat flux though the glazing sample and the U-value were then determined as illustrated in Figure 13. The average heat flux from the vacuum glazing was measured to be 15.4 W/m2. And the average U-value was calculated as 1.5 W/m2 × K which is much lower than a regular double pane window with the U-value of 2.5W/m2 × K. Considering the edge heat transfer which would strongly affect the heat flux measurement when the sample is small, it can be expected that the centre U-valve of the vacuum PV glazing should be lower than 1.5 W/m2 × K for a larger scale application (e.g. 1.1m × 1.3m).
8.6 years based on the simple payback period calculation in Hong Kong’s scenario. The payback period (for the west facade installation) can be further reduced to less than 4.5 years in Beijing’s scenario.
(6) A brief design guideline covering the design strategy, environmental variables, multifunctionality, installation situation, electrical components, and economic aspects of the developed product was provided for its future large-scale application and commercialization.
4.2 Recommendation for future work In future R&D work, this innovative product should be commercialized by taking the below key actions and involving relevant parties:
(1) Technical issues (R&D institutes and Manufacturers)
The key technical barrier of producing the vacuum PV curtain wall lies in the creation of tempered vacuum glazing. Currently, main manufacturers in the market can only provide tempered vacuum glazing up to around 2 m2. New technologies such as laser sealing should be introduced to facilitate the manufacture of vacuum glazing with larger areas.
(2) Marketing issues (manufacturers and marketing companies)
Detailed marketing surveys should be conducted to locate the interested users as well as drivers and barriers for the potential application of the proposed technology.
(3) Building integration issues (Manufacturers and building companies)
Plug-and-play methods to integrate the proposed product into the building construction should be developed. Surveys on the demands of architects, end users and power suppliers with respect to aesthetics, function of the product and integration with electric grid should be conducted.
(4) Standardization issues (Research institutes, manufacturers and Testing institutes)
Standards for detailed design, performance testing and reliability testing should be developed. Long-term field test on a trial project can provide experience for maintenance and retrofitting.
(5) Financing and subsidy issues (policy makers and banking sector)
Financing schemes to lower the cost of manufacture, installation and maintenance should be recommended to policy makers to lower the market entry threshold for this product.
(6) Training and education (all)
Demonstration projects to show the performance of the vacuum PV curtain wall should be setup to enlighten the public (including policy makers, end-users, installers and architects) on the potential of the product including but not limited to the module performance, systems design and integration issues. Quick and reliable design tools for engineers and installers should be developed and they should be trained with a sufficient level of competence.
(3) Cost effective analysis based on simulation
To address the economic benefits of the developed product, the simple payback period of the vacuum PV glazing is calculated with reference to available PV glazing on the market in both Hong Kong and Beijing’s scenarios.
Based on an average electricity price of 1.25 HKD/kWh from HK Electric, the simple payback period (See Figure 26) when applying the product to the west and east façade is calculated to be 7.5 and 8.0 years compared to the single-pane PV glazing. The payback periods are increased to 8.6 and 8.8 years when compared with double-pane PV glazing as shown in Figure 27. However, when applied to the south façade, the extra initial cost of the product cannot be recovered within 10 years.
The solar simulator in the laboratory can provide relatively steady horizontal incident solar irradiation, so that test rigs were located at the same spot to ensure each window sample exposed to the same radiation level. As shown in Figure 14, SHGCs of the vacuum PV glazing and double-pane PV glazing are much smaller than those of the vacuum glazing and double clear glazing, because the coupled PV module can absorb most of the solar irradiation. The vacuum PV glazing has the lowest SHGC of 0.10 which can act as the excellent thermal insulation.
The outdoor test lasted four days from September 26th to September 30th. As shown in Figure 15, September 26th, 27th and 30th were cloudy days and September 28th could be considered as a sunny day. It can be found that the vacuum PV glazing blocks most solar irradiation compared with the double-pane glazing. Figure 16 presents the temperature profile of the vacuum PV glazing and double-pane glazing in the sunny day. The internal surface temperature of both glazing was much higher than the ambient temperature when the outside incident solar radiation is strong. The internal glazing surface and air temperatures of the test rig with the vacuum PV glazing are lower than those of the test rig with the double-pane glazing. The difference between the internal air temperatures of test rigs is much smaller than that of internal glazing surface temperatures. Therefore, the application of vacuum PV glazing can achieve better indoor environment by reducing the solar heat gain.
3.3 Simulation study of the vacuum PV glazing(1) Simulation of a generic building model
Although a series of field tests have been conducted in the outdoor test bed to study the power and thermal performances of the vacuum BIPV glazing, the experimental scenarios are impossible to represent all the situations and variables. Thus, the numerical study was conducted to comprehensively investigate and compare the energy performance of the vacuum PV glazing and other commonly used energy-efficient glazing. As detailed in the research methodology, a comprehensive simulation model based on EnergyPlus and WINDOW has been developed to simulate the overall energy performance of different windows taking into account of their thermal and power output performance. This model is used to simulate the overall energy performance of the vacuum BIPV curtain wall in comparison with other commonly used windows. The key properties of different types of glazing are shown in Table 4 and the electrical specifications of the PV glazing under standard test conditions are referenced to Table 2.
In order to simulate the annual thermal performance and power performance of these types of glazing in Hong Kong for comparison purpose, a typical office room model has been created for simulation, as shown in Figure 17. The dimension of the office model was 2.5m × 2.3m × 2.5m (L × W × H). This room has only one external wall with three identical windows exposed to the outdoor environment. Simulations were conducted for different orientations, i.e. south (S), east (E), west (W) and north (N). A heat transfer model and PV performance model in EnergyPlus are adopted to investigate
the thermal and power performance of different glazing. The heat transfer model is used to calculate the cooling loads of the office room. The cooling loads are then converted to electricity use of air-conditioning system with a presumed coefficient of performance (COP) of 2.78. The equivalent one-diode model is selected to simulate the annual electricity generation from PV elements. The typical meteorological year (TMY) in Hong Kong is selected a reasonable representation of local climates.
The annual cooling electricity use of different types of glazing in different orientations in Hong Kong are shown in Figure 18. It can be observed that the room using vacuum PV glazing consumes the least cooling electricity for all orientations. The south facing room with vacuum PV glazing consumes about 705.56 kWh per year, which was approximately 14.2%, 9.8%, 8.4%, 7.1% and 4.1% less than the corresponding room with single-pane clear glazing, double-pane clear glazing, vacuum glazing, single-pane PV glazing and double-pane PV glazing, respectively. This is because the vacuum PV glazing have the lowest U-value and SHGC among all types of glazing, as shown in Table 4.3. A lower U-value indicates a higher level of heat insulation performance of the glazing, and a lower SHGC means less solar radiation will pass through the windows. Therefore, the vacuum PV glazing performs the best in the area with big temperature difference between indoor and outdoor environment. In addition, the most cooling electricity use of the office room occurs at the west orientation, followed by east, south and north. Therefore, east and west facing windows should have better solar heat insulation performance, to reduce heat gains from outside environment.
In addition to reduce the cooling load of the office room, the PV glazing can also generate electricity in situ. The annual electricity generation of the three types of PV glazing are shown in Figure 19. It can be seen that the annual electricity generation of the three types of PV glazing is similar to each other. The electricity generation from the vacuum PV glazing is a little less than the single-pane PV glazing due to increased solar cell temperature. However, since the temperature coefficient of the thin-film a-Si solar cells is small, the PV conversion efficiency is not reduced significantly. The annual electricity generation from a-Si PV glazing with 12.0% transmittance is around 113.81 kWh per year. Among all orientations, it is better to install PV glazing on the south facade in order to maximize the electricity output in Hong Kong. And it is not recommended to apply PV glazing on north façade due to limited solar radiation available.
Based on the results above, the vacuum PV glazing not only has the best thermal performance among all types of widely used glazing, but also produces a considerable amount of electricity per year. It is recommended to install vacuum PV glazing on south facade to perform the best overall energy performance.
(2) Simulation of the whole building
Apart from modelling studies conducted under the hot and humid climate of Hong Kong, the annual energy performance of different types of glazing in a cold region (i.e. Beijing) was also simulated for comparison. Simulation results are shown in Figure 20 and Figure 21. It can be observed that the room using the vacuum PV glazing achieves the lowest cooling consumption in both climates. In Beijing, the consumed cooling energy with the vacuum PV glazing is much smaller and is 30.2%, 20.8%, 17.0%, 13.8%, 4.4% less than that of the room with other types of glazing. It can be concluded that the energy saving potential of the vacuum PV glazing is much larger in a cold climate while the electricity generation is much higher during the summer time of Beijing due to the smaller solar incidence angle.
The developed simulation model was further applied to a 20-floor prototype office building. Typical floors of the building are divided into 5 conditioned zones, with a total floor area of 540 m2 (as shown in Figure 22). The reference case – Model 1 keeps all windows as the commonly used double-pane clear glazing, while the design cases include Model 2 and Model 3. Model 2 keeps the north-facing window as the conventional double-pane glazing while changes windows orientated to the other three directions to the developed vacuum PV glazing. The opaque part of all building facades is assumed to be covered with traditional crystalline BIPV with a power conversion efficiency of 15% to maximize the power generation potential of the building envelope. Model 3 shares similar settings with Model 2, except that the window transparency is tuned to 20% with a crystalline silicon (c-Si) as shown in Figure 23. Table 5 shows detailed settings of window properties for the three models respectively. The U-value and SHGC of a-Si vacuum PV glazing are obtained from previous experiments and those of double-pane clear glazing are calculated by the simulation software WINDOW. Thermal and power generation properties of c-Si vacuum PV glazing are obtained from existing literatures.
The simulation results of the total heat gain and loss through all windows are presented in Figure 24 and Figure 25. The heat gain and loss both decrease sharply when traditional double-pane clear glazing is replaced by the PV vacuum glazing. The obvious differences between these three models can be identified from the figures. Compared with the performance of Model 1, the heat gain through windows of Model 2 and Model 3 drops up to 77.89% and 77.97% (south-facing windows), while the heat loss of the two models declines up to 79.28% and 79.32% (south-facing windows), respectively.
On the other side, based on the peak office hour electricity price of 1.4 CNY/kWh for cooling and 0.25 CNY/kWh for heating from the Beijing authority, the simple payback period (See Figure 28) when applying the product to the west, east, and south façade is calculated to be 3.8, 4.6 and 5.3 years compared to the single-pane PV glazing. The payback periods are increased to 4.5, 5.4 and 6.5 years when compared with double-pane PV glazing as shown in Figure 29.
As a result, the product can be considered as a cost-effective application in building facades when considering its tremendous saving of air-conditioning energy and corresponding annual expenses. In addition, the property developer could also benefit from a potential increment in renting rates and popularity, if the building gets certified under a green building scheme by claiming credits in CO2 reduction and renewable application assessment criteria. All the abovementioned potential benefits with the application of the vacuum PV glazing would attract more attention from the construction industry.
3.4 Brief technical guideline for the vacuum PV glazingDesigning the vacuum PV glazing (i.e. vacuum BIPV curtain wall) system is a more complex process than a standard added-on PV system. The architectural context, structural requirements, economic considerations and building regulation requirements should all be considered, so that this brief guidance mainly focuses on the below aspects: design strategy, environmental variables, multifunctionality, installation situation, electrical components, and economic aspects (Polysolar Limited, 2015).
(1) Design strategy
Architects, property developers and building users become more inclined to consider renewable and energy efficient applications to meet building and planning regulations due to rising energy bills and awareness of environmental sustainability. The combination of PV and vacuum glazing is an innovative and promising solution to meet these requirements in the new building developments or refurbishment projects. As proved in the above sections of this report, the developed product offers the added advantage of providing a return of investment from the building envelope. Architectural and structural factors, as well as economic considerations should be taken into account at an early stage in any building projects to integrate renewable systems through a more satisfactory approach.
(2) Environmental variables
When designing a BIPV system, a compromise must be reached between the requirements of energy yield optimisation and those of the architectural environment. Therefore, the orientation, lighting performance, shading and temperature are the four mainly concerned issues in BIPV design. According to simulation and experimental results presented in the above sections, the optimal orientation of the installed PV glazing should be south for maximizing the annual power generation, while cooling load reduction is more conspicuous when the product is applied on the west and east facades. Therefore, it is preferable to install the product on all three facades for an optimal overall building energy-saving performance. The visible light transmittance is only 12% in the developed prototype, which might cause slightly more lighting power consumption compared to traditional double-pane clear glazing. However, the transmittance can be easily adjusted to higher than 20% in the manufacture process depending on the effective area of PV materials. There will always be a trade-off between power generation and permeable light, whereas this research has proved that the combined power generation and cooling load reduction can be more than the increased lighting energy use. Power generation performance of the a-Si PV is less sensitive to shadings, so that the prototype is subject to less influence from peripheral shadings. However, if we change the PV material to c-Si for higher conversion efficiency, a shading calculation should be conducted before allocating the BIPV glazing. Lastly, the conversion efficiency of a-Si glazing is also less sensitive to the increase of the panel temperature. The temperature coefficient must be considered if changing the PV material to c-Si.
The vacuum PV glazing was made by sandwiching a layer of PVB between an external PV laminated glass with a visible light transmittance of 12% and an internal vacuum glass. A low-e coating was also adopted to enhance its thermal performance. The structure of the vacuum PV glazing is shown in Figure 5. The dimension of the vacuum PV glazing is 1300 mm (width) × 1100 mm (height) × 20.87 mm (thickness), thinner than commonly used PV double glazed insulating glass units. Figure 6 presents the pictures of the sample of vacuum PV glazing.
This section presents the main findings and outcomes of the research project and indicates their potential impacts on the local energy use and construction industry. Achievements of the specified research objectives are illustrated, and limitations of the project are also mentioned for the reference of future studies.
3.1 Design and production of the prototype productInitially, we proposed a prototype design as specified by Figure 2, where the vacuum layer was directly coupled with the laminated PV panel. However, during initial manufacture trials, the air pressure difference between internal and external spaces of the vacuum glass samples produced by the laminating machine caused the breakage of the vacuum glass samples. Then, we followed an alternative approach using pre-pressure furnace, whereas the molten state of the polyvinyl butyral (PVB) could not meet the expected requirements and the bubbles greatly impacted the appearance and performance of PV module. Finally, we proposed the current product design based on the experience acquired from previous failures (See Figure 5).
The electrical specifications of the vacuum PV glazing under standard test conditions (STC: air mass 1.5, solar irradiation 1000 W/m2 and cell temperature 25°C) are shown in Table 2. Table 3 presents the given thermal and optical properties of the PV laminated glass and vacuum glass, respectively.
(3) Multi-functionality
Due to their mechanical structures, the PV vacuum glazing can perform the functions of the building envelope in addition to generating emission-free energy, and can thus substitute for conventional construction windows or curtain walls. Apart from power generation and architectural function, the product can provide solar shading with its low SHGC value. It can also act as thermal and sound insulation due to its low U-value and acoustic resistance caused by the vacuum chamber between glazing layers. If applied with special coatings/films on top of PV glazing, it can also provide weather protection.
(4) Mounting system and installation
Based on specific requirements of each project in each region, safety, loading capacity and PV installation specifications can have a decisive impact on the method of fixing/mounting the vacuum. We have in this guide attempted to provide a range of options, highlighting what is possible in current design. The product can be installed with a linear mounting system as mullion-transom facades or structural sealant glazing. It can also be mounted with point-fixing systems including clamp fixings and undercut anchor fixings or mounted into standard curtain walling, rain screen cladding and window systems.
(5) Electrical system
In the curtain wall system, several PV glazing with standard size are usually connected together in a string to form the power generator. The generated direct current is usually fed to an inverter where the direct current is converted to alternating current. If on-site storage is not available, which is the common case in urban areas, the electrical power is registered via an electricity meter and connected to the public supply grid, which will require special permissions from the power grid companies (e.g. CLP in Hong Kong). Therefore, the application of the product will require a full set of electrical systems including cables and connections for parallel or series arrays, direct current load-break switches, inverters and generation meters.
(6) Economic considerations
The economic benefits of the product mainly lie in the following aspects: the substitute for original construction component, CO2 emission reduction and corresponding electricity fee waving, compliance with relevant building regulations (i.e. BEAM Plus in Hong Kong) and application of the feed-in-tariff policy (remuneration for electricity generation from PV).
temperature measurements were conducted through the centre of the vacuum PV sample to calculate the U-value. Secondly, the solar heat gains coefficient (SHGC) of the vacuum PV glazing sample was obtained and compared with three other advanced glazing types in an indoor solar irradiation test. Lastly, an outdoor test was conducted on the platform of Block Z in The Hong Kong Polytechnic University to evaluate the overall thermal performance of vacuum PV glazing. A conventional double clear pane glazing was used as a baseline in the outdoor test.
surfaces shows a similar trend in the three directions. Summing up electricity generation in all floors, the integrated PV modules in Model 2 and 3 can provide 285074.72 kWh/year and 355226.3 kWh/year, which accounts for 13.27% and 16.54% of the total building energy consumption of Model 1. Therefore, given the energy use reduction due to less external heat gain, using the vacuum BIPV glazing can save 27.74% (Model 3) electricity compared to a reference building.

39 Construction Industry Council
The comparison of building energy between Model 1, Model 2 and Model 3 is summarized in Table 6, which includes energy use of lighting, equipment, district cooling and district heating. Although Model 2 and Model 3 consume slightly more lighting energy due to the reduced visible transmittance of the PV glazing, the great energy saving in cooling and heating leads to the net reduction in the total building energy consumption. The total energy consumption of the Model 2 and 3 declines by 20.77 and 22.37 kWh/m2, accounting for 10.44% and 11.20% of Model 1 respectively. Generated electricity of windows and walls in three directions is also presented in Table 7. The south window produced the most electricity, 1527.13 kWh for Model 2 and 3203.76 kWh for Model 3 in a year, taking up nearly 47.80% the total electricity generated by windows. As for the west window, the electricity generated in a year is close to that of east window. Electricity generated by wall
3.2 Experimental study of the vacuum PV glazingOutdoor experimental test was first conducted on the developed prototype vacuum PV (VPV) glazing with the standard size (1.1m × 1.3m), whose various parameters including the ambient air temperature, incident solar irradiation, surface temperatures of the vacuum PV glazing as well as the I-V curves and the power generation were measured and recorded. The power generation and thermal performances of the prototype were also analysed during the test. To further justify the advantage of the vacuum PV glazing, experimental studies were carried out to compare the thermal performance of scaled-down samples (0.3m × 0.3m) with other advanced windows.
(1) Energy performance of the prototypeIn order to evaluate the energy performance of the vacuum PV glazing, an outdoor field measurement was conducted on the platform of Block Z in The Hong Kong Polytechnic University. The vacuum PV glazing was set up horizontally 0.4m above the floor on stilts so that the external temperatures of both sides of the vacuum PV glazing were approximately equal. Various parameters were measured during this test, including the ambient air temperature, the exterior and transmitted horizontal incident solar irradiation, the outer and inner surface temperatures of the vacuum PV glazing as well as the I-V curves and the power generation from the vacuum PV glazing. All the data was logged at an interval of 1 minute. Power generation and thermal performances of the vacuum PV glazing were analyzed based on the outdoor tests. Figure 7 shows the exterior and transmitted incident solar irradiation. It can be seen that the average solar irradiation transmittance during the period is approximately 0.08. Such low transmittance means that vast majority of solar irradiation is blocked by the vacuum PV glazing. Figure 8 presents the outer and inner surface temperature of the vacuum PV glazing. It can be seen that the outer surface temperature is much higher than the inner surface temperature at daytime. The maximum outer surface temperature is 75.3°C, 30°C higher than the inner surface temperature, which indicates that most of the waste heat is dissipated from the outside surface of the vacuum PV glazing, and the heat transfer to the inside space by convection is mitigated. Thus, compared with the conventional single-glazed PV glazing, the structure of the vacuum PV glazing can help reduce the cooling load and improve the indoor thermal comfort.
Then the vacuum PV glazing was mounted on the front side of an experimental test chamber as shown in Figure 9. Clear glass was also adopted in this study for comparison. Figure 10 presents the instantaneous power output of the vacuum PV glazing in 2 sunny days. It can be seen that the power generation from the vacuum PV glazing is consistent with incident solar radiation. A comparative study in terms of internal air temperature of the chamber between the vacuum PV glazing and the clear glass was conducted in a day of June.
As shown in Figure 11, the internal air temperature in the chamber with the vacuum PV glazing is much lower than that with a clear glass. The measured average and maximum internal air temperature for the vacuum PV glazing is 39.6°C and 40.3°C, respectively, while the corresponding average and maximum internal air temperature of the clear glass are 43.6°C and 44.7°C. The maximum internal air temperature difference between the vacuum PV glazing and the clear glass is 4.4°C, occurring in the morning. There are three temperature peaks of internal air temperature. Since the ambient temperature was relatively stable, the main heat gain of the internal air temperature was from incident solar irradiation. The internal air temperature for vacuum PV glazing is much more stable compared with that for the clear glass. The reason is that the vacuum PV glazing has better heat insulation performance so that the internal air temperature is not affected by the external environment significantly. It can also be seen in this figure that the internal air temperature of the chamber drops continuously at 15:00, which shows that the incident solar irradiation on the façade decreases so that the heat gains of the internal air from the sun also drops.
(2) Comparison with other advanced windows
To further justify the advantage of the vacuum PV glazing, experimental studies were carried out to compare it with other advanced windows. Samples of different types of glazing were mounted on the top of two hotboxes (i.e. test rigs) with the uniform dimension of 300 mm (L) × 300 mm (W) × 450mm (H) to implement both indoor and outdoor tests. Firstly, a co-heating test methodology was adopted for the thermal analysis of the vacuum PV glazing. The test rig was filled with the ice-water mixture to ensure the temperature difference between the inside and outside glazing surfaces larger than 5°C. Heat flux and
Figure 12 shows the internal and external temperatures of the vacuum PV glazing sample. The presented data were selected after the hotbox achieved the steady-state condition, when the temperature difference was around 8°C. Heat flux though the glazing sample and the U-value were then determined as illustrated in Figure 13. The average heat flux from the vacuum glazing was measured to be 15.4 W/m2. And the average U-value was calculated as 1.5 W/m2 × K which is much lower than a regular double pane window with the U-value of 2.5W/m2 × K. Considering the edge heat transfer which would strongly affect the heat flux measurement when the sample is small, it can be expected that the centre U-valve of the vacuum PV glazing should be lower than 1.5 W/m2 × K for a larger scale application (e.g. 1.1m × 1.3m).
Anatol, C., Francesco, F., & Nagel, K. (2011, October). Building Integrated Photovoltaics - Thermal Aspects - Low Energy House for Testing BIPV Systems.
De Soto, W., Klein, S. A., & Beckman, W. A. (2006). Improvement and validation of a model for photovoltaic array performance. Solar Energy, 80(1), 78-88.
ENERGYPLUS™. (2013). Basic Concepts Manual - Essential Information You Need about Running EnergyPlus: US Department of Energy.
Griffiths, P. W., di Leo, M., Cartwright, P., Eames, P. C., Yianoulis, P., Leftheriotis, G., et al. (1998). Fabrication of evacuated glazing at low temperature. Solar Energy, 63(4), 243-249.
Limited, P. (2015). Guide to Building Integrated Photovoltaics , http://www.polysolar.co.uk. United Kingdom.
Peng, J., Curcija, D. C., Lu, L., Selkowitz, S. E., Yang, H., & Mitchell, R. (2016). Developing a method and simulation model for evaluating the overall energy performance of a ventilated semi-transparent photovoltaic double-skin facade. Progress in Photovoltaics: Research and Applications, 24(6), 781-799.
Peng, J., Lu, L., Yang, H., & Han, J. (2013). Investigation on the annual thermal performance of a photovoltaic wall mounted on a multi-layer façade. Applied Energy, 112(Supplement C), 646-656.
Tabares-Velasco, P. C., Christensen, C., & Bianchi, M. (2012). Verification and validation of EnergyPlus phase change material model for opaque wall assemblies. Building and Environment, 54(Supplement C), 186-196.
Wang, M., Peng, J., Li, N., Lu, L., Ma, T., & Yang, H. (2016). Assessment of energy performance of semi-transparent PV insulating glass units using a validated simulation model. Energy, 112(Supplement C), 538-548.
Zhang, W., Lu, L., & Chen, X. (2017). Performance Evaluation of Vacuum Photovoltaic Insulated Glass Unit. Energy Procedia, 105(Supplement C), 322-326.
Zhang, W., Lu, L., Peng, J., & Song, A. (2016). Comparison of the overall energy performance of semi-transparent photovoltaic windows and common energy-efficient windows in Hong Kong. Energy and Buildings, 128(Supplement C), 511-518.
Zhou, Y. P., Wu, J. Y., Wang, R. Z., Shiochi, S., & Li, Y. M. (2008). Simulation and experimental validation of the variable-refrigerant-volume (VRV) air-conditioning system in EnergyPlus. Energy and Buildings, 40(6), 1041-1047.
Zoller, F. (1924). Hollow pane of glass, German Patent: 387656.
(3) Cost effective analysis based on simulation
To address the economic benefits of the developed product, the simple payback period of the vacuum PV glazing is calculated with reference to available PV glazing on the market in both Hong Kong and Beijing’s scenarios.
Based on an average electricity price of 1.25 HKD/kWh from HK Electric, the simple payback period (See Figure 26) when applying the product to the west and east façade is calculated to be 7.5 and 8.0 years compared to the single-pane PV glazing. The payback periods are increased to 8.6 and 8.8 years when compared with double-pane PV glazing as shown in Figure 27. However, when applied to the south façade, the extra initial cost of the product cannot be recovered within 10 years.
The solar simulator in the laboratory can provide relatively steady horizontal incident solar irradiation, so that test rigs were located at the same spot to ensure each window sample exposed to the same radiation level. As shown in Figure 14, SHGCs of the vacuum PV glazing and double-pane PV glazing are much smaller than those of the vacuum glazing and double clear glazing, because the coupled PV module can absorb most of the solar irradiation. The vacuum PV glazing has the lowest SHGC of 0.10 which can act as the excellent thermal insulation.
The outdoor test lasted four days from September 26th to September 30th. As shown in Figure 15, September 26th, 27th and 30th were cloudy days and September 28th could be considered as a sunny day. It can be found that the vacuum PV glazing blocks most solar irradiation compared with the double-pane glazing. Figure 16 presents the temperature profile of the vacuum PV glazing and double-pane glazing in the sunny day. The internal surface temperature of both glazing was much higher than the ambient temperature when the outside incident solar radiation is strong. The internal glazing surface and air temperatures of the test rig with the vacuum PV glazing are lower than those of the test rig with the double-pane glazing. The difference between the internal air temperatures of test rigs is much smaller than that of internal glazing surface temperatures. Therefore, the application of vacuum PV glazing can achieve better indoor environment by reducing the solar heat gain.
3.3 Simulation study of the vacuum PV glazing(1) Simulation of a generic building model
Although a series of field tests have been conducted in the outdoor test bed to study the power and thermal performances of the vacuum BIPV glazing, the experimental scenarios are impossible to represent all the situations and variables. Thus, the numerical study was conducted to comprehensively investigate and compare the energy performance of the vacuum PV glazing and other commonly used energy-efficient glazing. As detailed in the research methodology, a comprehensive simulation model based on EnergyPlus and WINDOW has been developed to simulate the overall energy performance of different windows taking into account of their thermal and power output performance. This model is used to simulate the overall energy performance of the vacuum BIPV curtain wall in comparison with other commonly used windows. The key properties of different types of glazing are shown in Table 4 and the electrical specifications of the PV glazing under standard test conditions are referenced to Table 2.
In order to simulate the annual thermal performance and power performance of these types of glazing in Hong Kong for comparison purpose, a typical office room model has been created for simulation, as shown in Figure 17. The dimension of the office model was 2.5m × 2.3m × 2.5m (L × W × H). This room has only one external wall with three identical windows exposed to the outdoor environment. Simulations were conducted for different orientations, i.e. south (S), east (E), west (W) and north (N). A heat transfer model and PV performance model in EnergyPlus are adopted to investigate
the thermal and power performance of different glazing. The heat transfer model is used to calculate the cooling loads of the office room. The cooling loads are then converted to electricity use of air-conditioning system with a presumed coefficient of performance (COP) of 2.78. The equivalent one-diode model is selected to simulate the annual electricity generation from PV elements. The typical meteorological year (TMY) in Hong Kong is selected a reasonable representation of local climates.
The annual cooling electricity use of different types of glazing in different orientations in Hong Kong are shown in Figure 18. It can be observed that the room using vacuum PV glazing consumes the least cooling electricity for all orientations. The south facing room with vacuum PV glazing consumes about 705.56 kWh per year, which was approximately 14.2%, 9.8%, 8.4%, 7.1% and 4.1% less than the corresponding room with single-pane clear glazing, double-pane clear glazing, vacuum glazing, single-pane PV glazing and double-pane PV glazing, respectively. This is because the vacuum PV glazing have the lowest U-value and SHGC among all types of glazing, as shown in Table 4.3. A lower U-value indicates a higher level of heat insulation performance of the glazing, and a lower SHGC means less solar radiation will pass through the windows. Therefore, the vacuum PV glazing performs the best in the area with big temperature difference between indoor and outdoor environment. In addition, the most cooling electricity use of the office room occurs at the west orientation, followed by east, south and north. Therefore, east and west facing windows should have better solar heat insulation performance, to reduce heat gains from outside environment.
In addition to reduce the cooling load of the office room, the PV glazing can also generate electricity in situ. The annual electricity generation of the three types of PV glazing are shown in Figure 19. It can be seen that the annual electricity generation of the three types of PV glazing is similar to each other. The electricity generation from the vacuum PV glazing is a little less than the single-pane PV glazing due to increased solar cell temperature. However, since the temperature coefficient of the thin-film a-Si solar cells is small, the PV conversion efficiency is not reduced significantly. The annual electricity generation from a-Si PV glazing with 12.0% transmittance is around 113.81 kWh per year. Among all orientations, it is better to install PV glazing on the south facade in order to maximize the electricity output in Hong Kong. And it is not recommended to apply PV glazing on north façade due to limited solar radiation available.
Based on the results above, the vacuum PV glazing not only has the best thermal performance among all types of widely used glazing, but also produces a considerable amount of electricity per year. It is recommended to install vacuum PV glazing on south facade to perform the best overall energy performance.
(2) Simulation of the whole building
Apart from modelling studies conducted under the hot and humid climate of Hong Kong, the annual energy performance of different types of glazing in a cold region (i.e. Beijing) was also simulated for comparison. Simulation results are shown in Figure 20 and Figure 21. It can be observed that the room using the vacuum PV glazing achieves the lowest cooling consumption in both climates. In Beijing, the consumed cooling energy with the vacuum PV glazing is much smaller and is 30.2%, 20.8%, 17.0%, 13.8%, 4.4% less than that of the room with other types of glazing. It can be concluded that the energy saving potential of the vacuum PV glazing is much larger in a cold climate while the electricity generation is much higher during the summer time of Beijing due to the smaller solar incidence angle.
The developed simulation model was further applied to a 20-floor prototype office building. Typical floors of the building are divided into 5 conditioned zones, with a total floor area of 540 m2 (as shown in Figure 22). The reference case – Model 1 keeps all windows as the commonly used double-pane clear glazing, while the design cases include Model 2 and Model 3. Model 2 keeps the north-facing window as the conventional double-pane glazing while changes windows orientated to the other three directions to the developed vacuum PV glazing. The opaque part of all building facades is assumed to be covered with traditional crystalline BIPV with a power conversion efficiency of 15% to maximize the power generation potential of the building envelope. Model 3 shares similar settings with Model 2, except that the window transparency is tuned to 20% with a crystalline silicon (c-Si) as shown in Figure 23. Table 5 shows detailed settings of window properties for the three models respectively. The U-value and SHGC of a-Si vacuum PV glazing are obtained from previous experiments and those of double-pane clear glazing are calculated by the simulation software WINDOW. Thermal and power generation properties of c-Si vacuum PV glazing are obtained from existing literatures.
The simulation results of the total heat gain and loss through all windows are presented in Figure 24 and Figure 25. The heat gain and loss both decrease sharply when traditional double-pane clear glazing is replaced by the PV vacuum glazing. The obvious differences between these three models can be identified from the figures. Compared with the performance of Model 1, the heat gain through windows of Model 2 and Model 3 drops up to 77.89% and 77.97% (south-facing windows), while the heat loss of the two models declines up to 79.28% and 79.32% (south-facing windows), respectively.
On the other side, based on the peak office hour electricity price of 1.4 CNY/kWh for cooling and 0.25 CNY/kWh for heating from the Beijing authority, the simple payback period (See Figure 28) when applying the product to the west, east, and south façade is calculated to be 3.8, 4.6 and 5.3 years compared to the single-pane PV glazing. The payback periods are increased to 4.5, 5.4 and 6.5 years when compared with double-pane PV glazing as shown in Figure 29.
As a result, the product can be considered as a cost-effective application in building facades when considering its tremendous saving of air-conditioning energy and corresponding annual expenses. In addition, the property developer could also benefit from a potential increment in renting rates and popularity, if the building gets certified under a green building scheme by claiming credits in CO2 reduction and renewable application assessment criteria. All the abovementioned potential benefits with the application of the vacuum PV glazing would attract more attention from the construction industry.
3.4 Brief technical guideline for the vacuum PV glazingDesigning the vacuum PV glazing (i.e. vacuum BIPV curtain wall) system is a more complex process than a standard added-on PV system. The architectural context, structural requirements, economic considerations and building regulation requirements should all be considered, so that this brief guidance mainly focuses on the below aspects: design strategy, environmental variables, multifunctionality, installation situation, electrical components, and economic aspects (Polysolar Limited, 2015).
(1) Design strategy
Architects, property developers and building users become more inclined to consider renewable and energy efficient applications to meet building and planning regulations due to rising energy bills and awareness of environmental sustainability. The combination of PV and vacuum glazing is an innovative and promising solution to meet these requirements in the new building developments or refurbishment projects. As proved in the above sections of this report, the developed product offers the added advantage of providing a return of investment from the building envelope. Architectural and structural factors, as well as economic considerations should be taken into account at an early stage in any building projects to integrate renewable systems through a more satisfactory approach.
(2) Environmental variables
When designing a BIPV system, a compromise must be reached between the requirements of energy yield optimisation and those of the architectural environment. Therefore, the orientation, lighting performance, shading and temperature are the four mainly concerned issues in BIPV design. According to simulation and experimental results presented in the above sections, the optimal orientation of the installed PV glazing should be south for maximizing the annual power generation, while cooling load reduction is more conspicuous when the product is applied on the west and east facades. Therefore, it is preferable to install the product on all three facades for an optimal overall building energy-saving performance. The visible light transmittance is only 12% in the developed prototype, which might cause slightly more lighting power consumption compared to traditional double-pane clear glazing. However, the transmittance can be easily adjusted to higher than 20% in the manufacture process depending on the effective area of PV materials. There will always be a trade-off between power generation and permeable light, whereas this research has proved that the combined power generation and cooling load reduction can be more than the increased lighting energy use. Power generation performance of the a-Si PV is less sensitive to shadings, so that the prototype is subject to less influence from peripheral shadings. However, if we change the PV material to c-Si for higher conversion efficiency, a shading calculation should be conducted before allocating the BIPV glazing. Lastly, the conversion efficiency of a-Si glazing is also less sensitive to the increase of the panel temperature. The temperature coefficient must be considered if changing the PV material to c-Si.
REFERENCES5
The vacuum PV glazing was made by sandwiching a layer of PVB between an external PV laminated glass with a visible light transmittance of 12% and an internal vacuum glass. A low-e coating was also adopted to enhance its thermal performance. The structure of the vacuum PV glazing is shown in Figure 5. The dimension of the vacuum PV glazing is 1300 mm (width) × 1100 mm (height) × 20.87 mm (thickness), thinner than commonly used PV double glazed insulating glass units. Figure 6 presents the pictures of the sample of vacuum PV glazing.
This section presents the main findings and outcomes of the research project and indicates their potential impacts on the local energy use and construction industry. Achievements of the specified research objectives are illustrated, and limitations of the project are also mentioned for the reference of future studies.
3.1 Design and production of the prototype productInitially, we proposed a prototype design as specified by Figure 2, where the vacuum layer was directly coupled with the laminated PV panel. However, during initial manufacture trials, the air pressure difference between internal and external spaces of the vacuum glass samples produced by the laminating machine caused the breakage of the vacuum glass samples. Then, we followed an alternative approach using pre-pressure furnace, whereas the molten state of the polyvinyl butyral (PVB) could not meet the expected requirements and the bubbles greatly impacted the appearance and performance of PV module. Finally, we proposed the current product design based on the experience acquired from previous failures (See Figure 5).
The electrical specifications of the vacuum PV glazing under standard test conditions (STC: air mass 1.5, solar irradiation 1000 W/m2 and cell temperature 25°C) are shown in Table 2. Table 3 presents the given thermal and optical properties of the PV laminated glass and vacuum glass, respectively.
(3) Multi-functionality
Due to their mechanical structures, the PV vacuum glazing can perform the functions of the building envelope in addition to generating emission-free energy, and can thus substitute for conventional construction windows or curtain walls. Apart from power generation and architectural function, the product can provide solar shading with its low SHGC value. It can also act as thermal and sound insulation due to its low U-value and acoustic resistance caused by the vacuum chamber between glazing layers. If applied with special coatings/films on top of PV glazing, it can also provide weather protection.
(4) Mounting system and installation
Based on specific requirements of each project in each region, safety, loading capacity and PV installation specifications can have a decisive impact on the method of fixing/mounting the vacuum. We have in this guide attempted to provide a range of options, highlighting what is possible in current design. The product can be installed with a linear mounting system as mullion-transom facades or structural sealant glazing. It can also be mounted with point-fixing systems including clamp fixings and undercut anchor fixings or mounted into standard curtain walling, rain screen cladding and window systems.
(5) Electrical system
In the curtain wall system, several PV glazing with standard size are usually connected together in a string to form the power generator. The generated direct current is usually fed to an inverter where the direct current is converted to alternating current. If on-site storage is not available, which is the common case in urban areas, the electrical power is registered via an electricity meter and connected to the public supply grid, which will require special permissions from the power grid companies (e.g. CLP in Hong Kong). Therefore, the application of the product will require a full set of electrical systems including cables and connections for parallel or series arrays, direct current load-break switches, inverters and generation meters.
(6) Economic considerations
The economic benefits of the product mainly lie in the following aspects: the substitute for original construction component, CO2 emission reduction and corresponding electricity fee waving, compliance with relevant building regulations (i.e. BEAM Plus in Hong Kong) and application of the feed-in-tariff policy (remuneration for electricity generation from PV).
temperature measurements were conducted through the centre of the vacuum PV sample to calculate the U-value. Secondly, the solar heat gains coefficient (SHGC) of the vacuum PV glazing sample was obtained and compared with three other advanced glazing types in an indoor solar irradiation test. Lastly, an outdoor test was conducted on the platform of Block Z in The Hong Kong Polytechnic University to evaluate the overall thermal performance of vacuum PV glazing. A conventional double clear pane glazing was used as a baseline in the outdoor test.
surfaces shows a similar trend in the three directions. Summing up electricity generation in all floors, the integrated PV modules in Model 2 and 3 can provide 285074.72 kWh/year and 355226.3 kWh/year, which accounts for 13.27% and 16.54% of the total building energy consumption of Model 1. Therefore, given the energy use reduction due to less external heat gain, using the vacuum BIPV glazing can save 27.74% (Model 3) electricity compared to a reference building.

The comparison of building energy between Model 1, Model 2 and Model 3 is summarized in Table 6, which includes energy use of lighting, equipment, district cooling and district heating. Although Model 2 and Model 3 consume slightly more lighting energy due to the reduced visible transmittance of the PV glazing, the great energy saving in cooling and heating leads to the net reduction in the total building energy consumption. The total energy consumption of the Model 2 and 3 declines by 20.77 and 22.37 kWh/m2, accounting for 10.44% and 11.20% of Model 1 respectively. Generated electricity of windows and walls in three directions is also presented in Table 7. The south window produced the most electricity, 1527.13 kWh for Model 2 and 3203.76 kWh for Model 3 in a year, taking up nearly 47.80% the total electricity generated by windows. As for the west window, the electricity generated in a year is close to that of east window. Electricity generated by wall
3.2 Experimental study of the vacuum PV glazingOutdoor experimental test was first conducted on the developed prototype vacuum PV (VPV) glazing with the standard size (1.1m × 1.3m), whose various parameters including the ambient air temperature, incident solar irradiation, surface temperatures of the vacuum PV glazing as well as the I-V curves and the power generation were measured and recorded. The power generation and thermal performances of the prototype were also analysed during the test. To further justify the advantage of the vacuum PV glazing, experimental studies were carried out to compare the thermal performance of scaled-down samples (0.3m × 0.3m) with other advanced windows.
(1) Energy performance of the prototypeIn order to evaluate the energy performance of the vacuum PV glazing, an outdoor field measurement was conducted on the platform of Block Z in The Hong Kong Polytechnic University. The vacuum PV glazing was set up horizontally 0.4m above the floor on stilts so that the external temperatures of both sides of the vacuum PV glazing were approximately equal. Various parameters were measured during this test, including the ambient air temperature, the exterior and transmitted horizontal incident solar irradiation, the outer and inner surface temperatures of the vacuum PV glazing as well as the I-V curves and the power generation from the vacuum PV glazing. All the data was logged at an interval of 1 minute. Power generation and thermal performances of the vacuum PV glazing were analyzed based on the outdoor tests. Figure 7 shows the exterior and transmitted incident solar irradiation. It can be seen that the average solar irradiation transmittance during the period is approximately 0.08. Such low transmittance means that vast majority of solar irradiation is blocked by the vacuum PV glazing. Figure 8 presents the outer and inner surface temperature of the vacuum PV glazing. It can be seen that the outer surface temperature is much higher than the inner surface temperature at daytime. The maximum outer surface temperature is 75.3°C, 30°C higher than the inner surface temperature, which indicates that most of the waste heat is dissipated from the outside surface of the vacuum PV glazing, and the heat transfer to the inside space by convection is mitigated. Thus, compared with the conventional single-glazed PV glazing, the structure of the vacuum PV glazing can help reduce the cooling load and improve the indoor thermal comfort.
Then the vacuum PV glazing was mounted on the front side of an experimental test chamber as shown in Figure 9. Clear glass was also adopted in this study for comparison. Figure 10 presents the instantaneous power output of the vacuum PV glazing in 2 sunny days. It can be seen that the power generation from the vacuum PV glazing is consistent with incident solar radiation. A comparative study in terms of internal air temperature of the chamber between the vacuum PV glazing and the clear glass was conducted in a day of June.
As shown in Figure 11, the internal air temperature in the chamber with the vacuum PV glazing is much lower than that with a clear glass. The measured average and maximum internal air temperature for the vacuum PV glazing is 39.6°C and 40.3°C, respectively, while the corresponding average and maximum internal air temperature of the clear glass are 43.6°C and 44.7°C. The maximum internal air temperature difference between the vacuum PV glazing and the clear glass is 4.4°C, occurring in the morning. There are three temperature peaks of internal air temperature. Since the ambient temperature was relatively stable, the main heat gain of the internal air temperature was from incident solar irradiation. The internal air temperature for vacuum PV glazing is much more stable compared with that for the clear glass. The reason is that the vacuum PV glazing has better heat insulation performance so that the internal air temperature is not affected by the external environment significantly. It can also be seen in this figure that the internal air temperature of the chamber drops continuously at 15:00, which shows that the incident solar irradiation on the façade decreases so that the heat gains of the internal air from the sun also drops.
(2) Comparison with other advanced windows
To further justify the advantage of the vacuum PV glazing, experimental studies were carried out to compare it with other advanced windows. Samples of different types of glazing were mounted on the top of two hotboxes (i.e. test rigs) with the uniform dimension of 300 mm (L) × 300 mm (W) × 450mm (H) to implement both indoor and outdoor tests. Firstly, a co-heating test methodology was adopted for the thermal analysis of the vacuum PV glazing. The test rig was filled with the ice-water mixture to ensure the temperature difference between the inside and outside glazing surfaces larger than 5°C. Heat flux and
Figure 12 shows the internal and external temperatures of the vacuum PV glazing sample. The presented data were selected after the hotbox achieved the steady-state condition, when the temperature difference was around 8°C. Heat flux though the glazing sample and the U-value were then determined as illustrated in Figure 13. The average heat flux from the vacuum glazing was measured to be 15.4 W/m2. And the average U-value was calculated as 1.5 W/m2 × K which is much lower than a regular double pane window with the U-value of 2.5W/m2 × K. Considering the edge heat transfer which would strongly affect the heat flux measurement when the sample is small, it can be expected that the centre U-valve of the vacuum PV glazing should be lower than 1.5 W/m2 × K for a larger scale application (e.g. 1.1m × 1.3m).
(3) Cost effective analysis based on simulation
To address the economic benefits of the developed product, the simple payback period of the vacuum PV glazing is calculated with reference to available PV glazing on the market in both Hong Kong and Beijing’s scenarios.
Based on an average electricity price of 1.25 HKD/kWh from HK Electric, the simple payback period (See Figure 26) when applying the product to the west and east façade is calculated to be 7.5 and 8.0 years compared to the single-pane PV glazing. The payback periods are increased to 8.6 and 8.8 years when compared with double-pane PV glazing as shown in Figure 27. However, when applied to the south façade, the extra initial cost of the product cannot be recovered within 10 years.
The solar simulator in the laboratory can provide relatively steady horizontal incident solar irradiation, so that test rigs were located at the same spot to ensure each window sample exposed to the same radiation level. As shown in Figure 14, SHGCs of the vacuum PV glazing and double-pane PV glazing are much smaller than those of the vacuum glazing and double clear glazing, because the coupled PV module can absorb most of the solar irradiation. The vacuum PV glazing has the lowest SHGC of 0.10 which can act as the excellent thermal insulation.
The outdoor test lasted four days from September 26th to September 30th. As shown in Figure 15, September 26th, 27th and 30th were cloudy days and September 28th could be considered as a sunny day. It can be found that the vacuum PV glazing blocks most solar irradiation compared with the double-pane glazing. Figure 16 presents the temperature profile of the vacuum PV glazing and double-pane glazing in the sunny day. The internal surface temperature of both glazing was much higher than the ambient temperature when the outside incident solar radiation is strong. The internal glazing surface and air temperatures of the test rig with the vacuum PV glazing are lower than those of the test rig with the double-pane glazing. The difference between the internal air temperatures of test rigs is much smaller than that of internal glazing surface temperatures. Therefore, the application of vacuum PV glazing can achieve better indoor environment by reducing the solar heat gain.
3.3 Simulation study of the vacuum PV glazing(1) Simulation of a generic building model
Although a series of field tests have been conducted in the outdoor test bed to study the power and thermal performances of the vacuum BIPV glazing, the experimental scenarios are impossible to represent all the situations and variables. Thus, the numerical study was conducted to comprehensively investigate and compare the energy performance of the vacuum PV glazing and other commonly used energy-efficient glazing. As detailed in the research methodology, a comprehensive simulation model based on EnergyPlus and WINDOW has been developed to simulate the overall energy performance of different windows taking into account of their thermal and power output performance. This model is used to simulate the overall energy performance of the vacuum BIPV curtain wall in comparison with other commonly used windows. The key properties of different types of glazing are shown in Table 4 and the electrical specifications of the PV glazing under standard test conditions are referenced to Table 2.
In order to simulate the annual thermal performance and power performance of these types of glazing in Hong Kong for comparison purpose, a typical office room model has been created for simulation, as shown in Figure 17. The dimension of the office model was 2.5m × 2.3m × 2.5m (L × W × H). This room has only one external wall with three identical windows exposed to the outdoor environment. Simulations were conducted for different orientations, i.e. south (S), east (E), west (W) and north (N). A heat transfer model and PV performance model in EnergyPlus are adopted to investigate
the thermal and power performance of different glazing. The heat transfer model is used to calculate the cooling loads of the office room. The cooling loads are then converted to electricity use of air-conditioning system with a presumed coefficient of performance (COP) of 2.78. The equivalent one-diode model is selected to simulate the annual electricity generation from PV elements. The typical meteorological year (TMY) in Hong Kong is selected a reasonable representation of local climates.
The annual cooling electricity use of different types of glazing in different orientations in Hong Kong are shown in Figure 18. It can be observed that the room using vacuum PV glazing consumes the least cooling electricity for all orientations. The south facing room with vacuum PV glazing consumes about 705.56 kWh per year, which was approximately 14.2%, 9.8%, 8.4%, 7.1% and 4.1% less than the corresponding room with single-pane clear glazing, double-pane clear glazing, vacuum glazing, single-pane PV glazing and double-pane PV glazing, respectively. This is because the vacuum PV glazing have the lowest U-value and SHGC among all types of glazing, as shown in Table 4.3. A lower U-value indicates a higher level of heat insulation performance of the glazing, and a lower SHGC means less solar radiation will pass through the windows. Therefore, the vacuum PV glazing performs the best in the area with big temperature difference between indoor and outdoor environment. In addition, the most cooling electricity use of the office room occurs at the west orientation, followed by east, south and north. Therefore, east and west facing windows should have better solar heat insulation performance, to reduce heat gains from outside environment.
In addition to reduce the cooling load of the office room, the PV glazing can also generate electricity in situ. The annual electricity generation of the three types of PV glazing are shown in Figure 19. It can be seen that the annual electricity generation of the three types of PV glazing is similar to each other. The electricity generation from the vacuum PV glazing is a little less than the single-pane PV glazing due to increased solar cell temperature. However, since the temperature coefficient of the thin-film a-Si solar cells is small, the PV conversion efficiency is not reduced significantly. The annual electricity generation from a-Si PV glazing with 12.0% transmittance is around 113.81 kWh per year. Among all orientations, it is better to install PV glazing on the south facade in order to maximize the electricity output in Hong Kong. And it is not recommended to apply PV glazing on north façade due to limited solar radiation available.
Based on the results above, the vacuum PV glazing not only has the best thermal performance among all types of widely used glazing, but also produces a considerable amount of electricity per year. It is recommended to install vacuum PV glazing on south facade to perform the best overall energy performance.
(2) Simulation of the whole building
Apart from modelling studies conducted under the hot and humid climate of Hong Kong, the annual energy performance of different types of glazing in a cold region (i.e. Beijing) was also simulated for comparison. Simulation results are shown in Figure 20 and Figure 21. It can be observed that the room using the vacuum PV glazing achieves the lowest cooling consumption in both climates. In Beijing, the consumed cooling energy with the vacuum PV glazing is much smaller and is 30.2%, 20.8%, 17.0%, 13.8%, 4.4% less than that of the room with other types of glazing. It can be concluded that the energy saving potential of the vacuum PV glazing is much larger in a cold climate while the electricity generation is much higher during the summer time of Beijing due to the smaller solar incidence angle.
The developed simulation model was further applied to a 20-floor prototype office building. Typical floors of the building are divided into 5 conditioned zones, with a total floor area of 540 m2 (as shown in Figure 22). The reference case – Model 1 keeps all windows as the commonly used double-pane clear glazing, while the design cases include Model 2 and Model 3. Model 2 keeps the north-facing window as the conventional double-pane glazing while changes windows orientated to the other three directions to the developed vacuum PV glazing. The opaque part of all building facades is assumed to be covered with traditional crystalline BIPV with a power conversion efficiency of 15% to maximize the power generation potential of the building envelope. Model 3 shares similar settings with Model 2, except that the window transparency is tuned to 20% with a crystalline silicon (c-Si) as shown in Figure 23. Table 5 shows detailed settings of window properties for the three models respectively. The U-value and SHGC of a-Si vacuum PV glazing are obtained from previous experiments and those of double-pane clear glazing are calculated by the simulation software WINDOW. Thermal and power generation properties of c-Si vacuum PV glazing are obtained from existing literatures.
The simulation results of the total heat gain and loss through all windows are presented in Figure 24 and Figure 25. The heat gain and loss both decrease sharply when traditional double-pane clear glazing is replaced by the PV vacuum glazing. The obvious differences between these three models can be identified from the figures. Compared with the performance of Model 1, the heat gain through windows of Model 2 and Model 3 drops up to 77.89% and 77.97% (south-facing windows), while the heat loss of the two models declines up to 79.28% and 79.32% (south-facing windows), respectively.
On the other side, based on the peak office hour electricity price of 1.4 CNY/kWh for cooling and 0.25 CNY/kWh for heating from the Beijing authority, the simple payback period (See Figure 28) when applying the product to the west, east, and south façade is calculated to be 3.8, 4.6 and 5.3 years compared to the single-pane PV glazing. The payback periods are increased to 4.5, 5.4 and 6.5 years when compared with double-pane PV glazing as shown in Figure 29.
As a result, the product can be considered as a cost-effective application in building facades when considering its tremendous saving of air-conditioning energy and corresponding annual expenses. In addition, the property developer could also benefit from a potential increment in renting rates and popularity, if the building gets certified under a green building scheme by claiming credits in CO2 reduction and renewable application assessment criteria. All the abovementioned potential benefits with the application of the vacuum PV glazing would attract more attention from the construction industry.
3.4 Brief technical guideline for the vacuum PV glazingDesigning the vacuum PV glazing (i.e. vacuum BIPV curtain wall) system is a more complex process than a standard added-on PV system. The architectural context, structural requirements, economic considerations and building regulation requirements should all be considered, so that this brief guidance mainly focuses on the below aspects: design strategy, environmental variables, multifunctionality, installation situation, electrical components, and economic aspects (Polysolar Limited, 2015).
(1) Design strategy
Architects, property developers and building users become more inclined to consider renewable and energy efficient applications to meet building and planning regulations due to rising energy bills and awareness of environmental sustainability. The combination of PV and vacuum glazing is an innovative and promising solution to meet these requirements in the new building developments or refurbishment projects. As proved in the above sections of this report, the developed product offers the added advantage of providing a return of investment from the building envelope. Architectural and structural factors, as well as economic considerations should be taken into account at an early stage in any building projects to integrate renewable systems through a more satisfactory approach.
(2) Environmental variables
When designing a BIPV system, a compromise must be reached between the requirements of energy yield optimisation and those of the architectural environment. Therefore, the orientation, lighting performance, shading and temperature are the four mainly concerned issues in BIPV design. According to simulation and experimental results presented in the above sections, the optimal orientation of the installed PV glazing should be south for maximizing the annual power generation, while cooling load reduction is more conspicuous when the product is applied on the west and east facades. Therefore, it is preferable to install the product on all three facades for an optimal overall building energy-saving performance. The visible light transmittance is only 12% in the developed prototype, which might cause slightly more lighting power consumption compared to traditional double-pane clear glazing. However, the transmittance can be easily adjusted to higher than 20% in the manufacture process depending on the effective area of PV materials. There will always be a trade-off between power generation and permeable light, whereas this research has proved that the combined power generation and cooling load reduction can be more than the increased lighting energy use. Power generation performance of the a-Si PV is less sensitive to shadings, so that the prototype is subject to less influence from peripheral shadings. However, if we change the PV material to c-Si for higher conversion efficiency, a shading calculation should be conducted before allocating the BIPV glazing. Lastly, the conversion efficiency of a-Si glazing is also less sensitive to the increase of the panel temperature. The temperature coefficient must be considered if changing the PV material to c-Si.
The vacuum PV glazing was made by sandwiching a layer of PVB between an external PV laminated glass with a visible light transmittance of 12% and an internal vacuum glass. A low-e coating was also adopted to enhance its thermal performance. The structure of the vacuum PV glazing is shown in Figure 5. The dimension of the vacuum PV glazing is 1300 mm (width) × 1100 mm (height) × 20.87 mm (thickness), thinner than commonly used PV double glazed insulating glass units. Figure 6 presents the pictures of the sample of vacuum PV glazing.
This section presents the main findings and outcomes of the research project and indicates their potential impacts on the local energy use and construction industry. Achievements of the specified research objectives are illustrated, and limitations of the project are also mentioned for the reference of future studies.
3.1 Design and production of the prototype productInitially, we proposed a prototype design as specified by Figure 2, where the vacuum layer was directly coupled with the laminated PV panel. However, during initial manufacture trials, the air pressure difference between internal and external spaces of the vacuum glass samples produced by the laminating machine caused the breakage of the vacuum glass samples. Then, we followed an alternative approach using pre-pressure furnace, whereas the molten state of the polyvinyl butyral (PVB) could not meet the expected requirements and the bubbles greatly impacted the appearance and performance of PV module. Finally, we proposed the current product design based on the experience acquired from previous failures (See Figure 5).
The electrical specifications of the vacuum PV glazing under standard test conditions (STC: air mass 1.5, solar irradiation 1000 W/m2 and cell temperature 25°C) are shown in Table 2. Table 3 presents the given thermal and optical properties of the PV laminated glass and vacuum glass, respectively.
(3) Multi-functionality
Due to their mechanical structures, the PV vacuum glazing can perform the functions of the building envelope in addition to generating emission-free energy, and can thus substitute for conventional construction windows or curtain walls. Apart from power generation and architectural function, the product can provide solar shading with its low SHGC value. It can also act as thermal and sound insulation due to its low U-value and acoustic resistance caused by the vacuum chamber between glazing layers. If applied with special coatings/films on top of PV glazing, it can also provide weather protection.
(4) Mounting system and installation
Based on specific requirements of each project in each region, safety, loading capacity and PV installation specifications can have a decisive impact on the method of fixing/mounting the vacuum. We have in this guide attempted to provide a range of options, highlighting what is possible in current design. The product can be installed with a linear mounting system as mullion-transom facades or structural sealant glazing. It can also be mounted with point-fixing systems including clamp fixings and undercut anchor fixings or mounted into standard curtain walling, rain screen cladding and window systems.
(5) Electrical system
In the curtain wall system, several PV glazing with standard size are usually connected together in a string to form the power generator. The generated direct current is usually fed to an inverter where the direct current is converted to alternating current. If on-site storage is not available, which is the common case in urban areas, the electrical power is registered via an electricity meter and connected to the public supply grid, which will require special permissions from the power grid companies (e.g. CLP in Hong Kong). Therefore, the application of the product will require a full set of electrical systems including cables and connections for parallel or series arrays, direct current load-break switches, inverters and generation meters.
(6) Economic considerations
The economic benefits of the product mainly lie in the following aspects: the substitute for original construction component, CO2 emission reduction and corresponding electricity fee waving, compliance with relevant building regulations (i.e. BEAM Plus in Hong Kong) and application of the feed-in-tariff policy (remuneration for electricity generation from PV).
Members of CIC Task Force on ResearchMr. Jimmy TSEProf. Christopher LEUNGIr Joseph MAKProf. James PONGProf. Sze-chun WONGIr Chi-chiu CHANIr Tommy NGMr. Shu-jie PAN
Research Team Project CoordinatorProf. Yang Hongxing
Deputy Project CoordinatorDr Lu Lin
Project Team MembersDr Wang YuanhaoDr Peng JinqingMr. Zhang Weilong
temperature measurements were conducted through the centre of the vacuum PV sample to calculate the U-value. Secondly, the solar heat gains coefficient (SHGC) of the vacuum PV glazing sample was obtained and compared with three other advanced glazing types in an indoor solar irradiation test. Lastly, an outdoor test was conducted on the platform of Block Z in The Hong Kong Polytechnic University to evaluate the overall thermal performance of vacuum PV glazing. A conventional double clear pane glazing was used as a baseline in the outdoor test.
surfaces shows a similar trend in the three directions. Summing up electricity generation in all floors, the integrated PV modules in Model 2 and 3 can provide 285074.72 kWh/year and 355226.3 kWh/year, which accounts for 13.27% and 16.54% of the total building energy consumption of Model 1. Therefore, given the energy use reduction due to less external heat gain, using the vacuum BIPV glazing can save 27.74% (Model 3) electricity compared to a reference building.
Research ManagerDr Chen Xi
Research PersonnelMr. Qiu ChangyuMr. Huang Junchao

建造業議會Construction Industry CouncilAddress 地址�:��38/F, COS Centre, 56 Tsun Yip Street, Kwun Tong, Kowloon� 九龍觀塘駿業街56號中海日升中心38樓�
Tel 電話�:�� (852) 2100 9000
Fax 傳真�:��(852) 2100 9090
Email 電郵�:��[email protected]
Website 網址�:��www.cic.hk
cic_hk HKCIC Construction Industry Council
CICHK HKCIC VV Construction Industry Council Hong Kong
Copyright © Construction Industry CouncilAll rights reserved. No part of this publication may be reproduced, stored in a retrieval system, or transmitted in any form or by any means, electronic, mechanical, photocopying, recording or otherwise, without the prior written permission of the publisher
2018 CIC Research Report No. CICRS_020
Research S
umm
aryC
onstruction Industry Council
Investigation on the thermal and power performance of vacuum BIPV curtain wall technology and its application potential in buildings in Hong Kong