thermal cracking and the use of disk-shaped compact
TRANSCRIPT

Thermal Cracking and the Use of
Disk-Shaped Compact Tension Test
(DCT) Performance Testing
Chelsea Hanson and John Garrity
OMRR Research Seminar
10/20/2015
1

Why do we need to specify Low Temperature Cracking performance of asphalt mix?
Binder is important, but does not completely control
material behavior:
– Aggregate/mastic effects on mixture creep/fracture properties
– Effects of RAP, RAS, WMA, and other additives
– Mixture volumetrics and aggregate effects – voids, aggregate
size and gradation
– Plant/field aging
2

What is the DCT Test?
Disk-Shaped Compact Tension Test (DCT)
Low-temperature performance test for asphalt
mixtures
Determines fracture energy (Gf), measured in J/m2
– Measure of a mixture’s resistance to cracking
Recommended by low-temperature cracking pooled
fund study to measure thermal fracture resistance
3

Disk-Shaped Compact Tension, DCT Test
ASTM D7313-13
Loading Rate:
– Crack Mouth Opening
Displacement
– CMOD = 0.017mm/s
(~1.0-mm/min)
Measurements:
– CMOD
– Load
4
CMOD, u
P
P
CMOD
Lo
ad
Fracture Work
Gf = Fracture Work
Fracture Area

LTC Performance Specifications
Based on traffic levels
5
Limits
Project Criticality / Traffic Level
High
(> 30M ESALs)
Medium
(10 – 30M ESALs)
Low
(< 10M ESALs)
DCT Fracture Energy
(J/m2) 690 460 400
IlliTC Cracking
Prediction (m/km) < 4 < 64 Not required
Marasteanu et al., 2012

Results for TH371 Sections
6
RP North Bound Crack
Count South Bound Crack
Count Fracture Energy
[J/m2]
6 3 4 453.44
17 12 8 356.18
21.5 10 57 330.59
0
50
100
150
200
250
300
350
400
450
500
RP 6 RP 17 RP 21.5
Frac
ture
En
erg
y [J
/m2]
Field Cores (TH371) RP6: Good performing section (2005 construction) RP17/21.5: Poor performing section (2004 construction)

Field Cracking Performance vs. Fracture Energy
8
0
10
20
30
40
50
60
70
80
90
100
0 1 2 3 4 5 6 7 8Pe
rce
nt
Cra
ck
ing
(M
nD
OT
)
Years in Service
RP 10
RP 5
182
326
0
50
100
150
200
250
300
350
400
450
500
550
Fra
ctu
re E
nerg
y (
J/m
2)
RP 10 (PP)
RP 5 (GP)

9
Refinement and Implementation of Specification
Implementation of
Performance-based
Specification (MnDOT)
Refinement Efforts (Spec. finalization,
conditioning process, training etc.)
Draft Spec. Development
Pilot Implementation

10
Refinement and Implementation of Specification
Implementation of
Performance-based
Specification (MnDOT)
Refinement Efforts (Spec. finalization,
conditioning process, training etc.)
Draft Spec. Development
Pilot Implementation

Projects
Variety of climates,
binders, construction
– D2 – TH 310, FDR +
Overlay, PG 58-34
– D3 – TH 371,
Reconstruct, PG 64-34
– Metro – TH 10, Mill &
Overlay, PG 64-28
– D6 – TH 56, SFDR +
Overlay, PG 58-34
– D6 – TH 69, Mill &
Overlay, PG 58-28
11

12
334 292 310
195
318
257
317
627
444
324
549 543
470
0
100
200
300
400
500
600
700F
ractu
re E
nerg
y (
J/m
2)

Summary
2 projects (TH10 and TH371) passed at mix design
– Both Level 4 designs (Higher amounts of crushed agg.)
– Both polymer modified
3 failed at mix design
– TH 69, 58-28, 30% RAP, 324 J/m2
Adj. 58-34, 20% RAP, 549 J/m2
– TH 56, 58-34, 20 % RAP, 292 J/m2
Adj. + 0.1% new AC, 310 J/m2
– TH 310, 58-34, 20% RAP, 257 J/m2
Adj. 58-34, 0% RAP, 317 J/m2
Old oil in mix design, 195 J/m2
Need to make sure that same materials are used for
mix design and production (esp. binder)
13

Possible Mixture Adjustments
Binder grade
– Reduce low PG (-34 vs -28)
Different modifier or supplier
Aggregate source and crushing
– Granite/taconite instead of
limestone
Aggregate Gradation
– Finer gradation
– Increase binder content
14

15
Refinement and Implementation of Specification
Implementation of
Performance-based
Specification (MnDOT)
Refinement Efforts (Spec. finalization,
conditioning process, training etc.)
Draft Spec. Development
Pilot Implementation

16
Refinement and Implementation of Specification
Implementation of
Performance-based
Specification (MnDOT)
Refinement Efforts (Spec. finalization,
conditioning process, training etc.)
Draft Spec. Development
Pilot Implementation

MnDOT DCT Specifications
“MnDOT Modified”
– Current version used by MnDOT
GOAL: Improve ease, practicality and repeatability of
test procedure
Several changes/additions to ASTM specification
Revisions made to temperature conditioning
of specimens:
– Specimens must reach test temperature within 1.5 hours.
– Specimens must stay in conditioning chamber for a minimum
of 2 hours before testing.
– All testing must be finished within 6 hours of initial placement
into conditioning chamber
17

18
Refinement and Implementation of Specification
Implementation of
Performance-based
Specification (MnDOT)
Refinement Efforts (Spec. finalization,
conditioning process, training etc.)
Draft Spec. Development
Pilot Implementation

19
Refinement and Implementation of Specification
Implementation of
Performance-based
Specification (MnDOT)
Refinement Efforts (Spec. finalization,
conditioning process, training etc.)
Draft Spec. Development
Pilot Implementation

• Inter-laboratory reproducibility study
• Samples collected during Summer/Fall 2014, with
testing completed in Spring of 2015
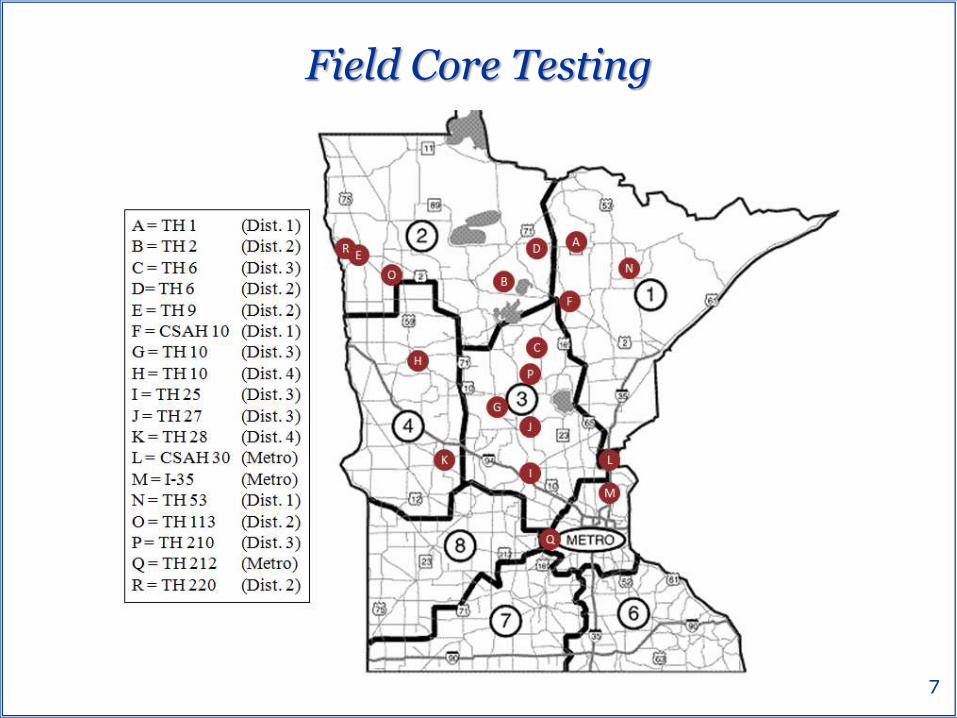
• 16 projects selected from around the state
• Participating labs included AET, Braun, and MnDOT
20
Round Robin Study


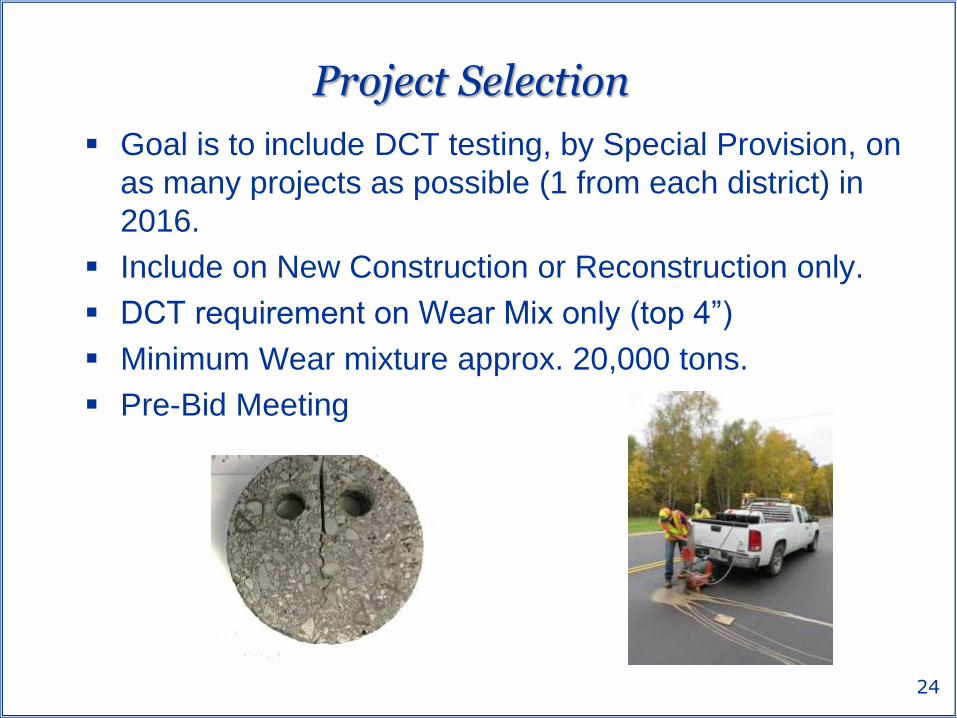
Project Selection
Goal is to include DCT testing, by Special Provision, on
as many projects as possible (1 from each district) in
2016.
Include on New Construction or Reconstruction only.
DCT requirement on Wear Mix only (top 4”)
Minimum Wear mixture approx. 20,000 tons.
Pre-Bid Meeting
24

Overview DCT Pilot Specification
Initial Mixture Design Report
– Preliminary Mixture Design Report (MDR)
Initial DCT Verification
– Verify plant produced mixture meets minimum requirements
Final Mixture Design Report
Additional Sampling
25

Mix Design Requirements Mix design submittal must include fracture energy results for wearing
course mixture.
Wear Course mixture only (Top 4”) PG XX-34
Minimum Design Fracture Energy
– Traffic Level 2 & 3 Fracture Energy 450 J/m2
– Traffic Level 4 & 5 Fracture Energy 500 J/m2
A preliminary MDR will be issued for mix design that meets:
– Standard mix design requirements
– Fracture Energy at optimal AC content
26

Asphalt Binder Ratio Modification
Modified Ratio of Added Asphalt/Total Asphalt from 80% to
75%.
27
Table 2360-8
Requirements for Ratio of Added New Asphalt Binder to Total Asphalt
Binder1 min%:
Specified Asphalt Grade Recycled Material
RAS Only RAS + RAP RAP Only
PG XX-28, PG 52-34, PG 49-
34, PG 64-22
Wear
Non-Wear
70
70
70
70
70
65
PG 58-34, PG 64-34, PG 70-34
Wear & Non-Wear
75
75
75 1 The ratio of added new asphalt binder to total asphalt binder is
calculated as (added binder/total binder) x 100

Initial DCT Verification
Full-scale production of the wearing mixture can’t begin
until fracture energy of plant produced mix has been
verified.
– Verify mixture by placing mix on the project or at an alternate
location.
When wear mixture placed on the project, production mix will be
limited to between 50 and 200 tons.
– Suggestion:
With approval of Engineer substitute Wear mix (with
correct asphalt grade) while placing non-Wear mixture.
No limit to production when wearing course mixture
placed as non-Wear.
28

Final MDR A Final MDR, allowing full-scale production, will be issued
based on successful verification of plant produced mixture.
Allowable Differences of Test Results
29
Table DCT-2
Minimum Average Fracture Energy Mixture
Production Requirements for Wearing Course
Traffic Level/PG Grade Fracture Energy (J/m2)
Traffic Level 2-3/PG XX-34 400
Traffic Level 4-5/PGXX-34 450
Table 2360-9
Allowable Differences between Contractor and Department Test Results
Item Allowable Difference
DCT - Fracture Energy (J/m2) 90

Fracture Energy Testing During Production
Required when:
– An aggregate proportion change for a single stockpile
aggregate greater than 10% from the currently produced
mixture.
– A cumulative change on any one aggregate product exceeds
10% from the original MDR.
– A change in added asphalt that decreases by more than
0.3% below that shown on the MDR.
– An aggregate or RAP source is changed.
– An increase of 5% in RAP content or 1% in RAS content.
– A change in binder suppliers or sources.
*For each day of wear course production obtain at least five (5) full 6” x 12” cylinders
for the Department. These samples will be for information only.
30

Future Efforts
– Implementation of DCT Pilot spec on as many projects as
possible (1 from each district) during the 2016
construction season
– Continue to populate the DCT results database
Test and record results of specimens collected during
2015 construction season
– Hold Pre-Bid Meeting with contractors
31

Thank you for your attention
Questions?
Acknowledgments:
– Bill Buttlar
– Contractors
– Producers
– Dave Van Deusen
– Shongtao Dai
– Joe Voels
– Dave Linell
– Luke Johanneck
32
Sponsoring agencies for present work: US Department of Transportation (FHWA)
Minnesota Department of Transportation
Contact: John Garrity [email protected] 651-366-5577 Chelsea Hanson [email protected] 651-366-5482 Dave Van Deusen [email protected] 651-366-5524


Summary Fracture energy has and is continuing to show high
potential as cracking performance indicator
Stay tuned:
– 2015: Improve breadth of DCT result
database
– 2016: Continue with pilot projects
– 2017: Goal of implementation
Plan to target wear courses
New and re-construction
Possibly on thick overlays
Stand-alone testing equipment
is available
34

Effects of Mix Composition on Fracture Energy
35
0
200
400
600
800
1000
1200
PG 58-28 PG 64-28 PG 58-34 PG 70-34
Fra
ctu
re E
ne
rgy (
J/m
2)
0
100
200
300
400
500
4.3% 4.5% 4.7% 4.9% 5.1% 5.3% 5.5%
Fra
ctu
re E
nerg
y (
J/m
2)
Asphalt Binder (%)
0
200
400
600
800
1000
1200
12.0% 14.0% 16.0% 18.0% 20.0%
Fra
ctu
re E
nerg
y (
J/m
2)
VMA (%)
0
100
200
300
400
500
7.0 8.0 9.0 10.0 11.0
Fra
ctu
re E
nerg
y (
J/m
2)
Adj. Asphalt Film Thickness (micron)


LTC Performance Specifications
Based on traffic levels
38
Limits
Project Criticality / Traffic Level
High
(> 30M ESALs)
Medium
(10 – 30M ESALs)
Low
(< 10M ESALs)
DCT Fracture Energy
(J/m2) 690 460 400
IlliTC Cracking
Prediction (m/km) < 4 < 64 Not required
Marasteanu et al., 2012

• Use of validator to ensure test correctness
• Training of lab staff
• Round robin (inter-laboratory) repeatability study
• Samples collected this fall, with testing to start this
spring
• Participating labs include AET, Braun, MnDOT,
and UMD
39
On-going Work

• Study analyzing source of drop in fracture energy
from mix design to production and placement
• Samples collected from 8 projects throughout the
state
40
On-going Work

41
Average Fracture Energies: All Labs with all Four Specimens “Surviving” Test

Asphalt Binder Ratio Modification
Modified Ratio of Added Asphalt/Total Asphalt from 80% to
75%.
42
Table 2360-8
Requirements for Ratio of Added New Asphalt Binder to Total Asphalt
Binder1 min%:
Specified Asphalt Grade Recycled Material
RAS Only RAS + RAP RAP Only
PG XX-28, PG 52-34, PG 49-
34, PG 64-22
Wear
Non-Wear
70
70
70
70
70
65
PG 58-34, PG 64-34, PG 70-34
Wear & Non-Wear
75
75
75 1 The ratio of added new asphalt binder to total asphalt binder is
calculated as (added binder/total binder) x 100