thermal degradation characteristic of tetra pak panel
TRANSCRIPT

878
†To whom correspondence should be addressed.
E-mail: [email protected], [email protected]
Korean J. Chem. Eng., 30(4), 878-890 (2013)DOI: 10.1007/s11814-012-0185-y
INVITED REVIEW PAPER
Thermal degradation characteristic of Tetra Pak panel boards under inert atmosphere
Aysel Kantürk Figen*, Evren Terzi**, Nural Yilgör***, Saip Nami Kartal**, and Sabriye Pi kin*,†
*Department of Chemical Engineering, Yildiz Technical University, 34210 Davutpasa, Istanbul, TURKEY**Department of Forest Biology and Wood Protection Technology, Forestry Faculty, Istanbul University,
34473 Bahcekoy, Istanbul, TURKEY***Department of Forest Products Chemistry and Technology, Forestry Faculty, Istanbul University,
34473 Bahcekoy, Istanbul, TURKEY(Received 4 June 2012 • accepted 3 November 2012)
Abstract−Thermal degradation characteristics of Tetra Pak panel boards (TPPB) can be useful to improve usage of
such panels as an alternative to wood-based products such as plywood, fiberboard, and particleboard. In the study, sam-
ples from the TPBBs manufactured from waste Tetra Pak packages (WTPP) were heated in a nitrogen atmosphere at
different heating rates (10, 15 and 20 oC/min) using a thermal analysis system. The Coats-Redfern kinetic model was
applied to calculate kinetic parameters. The degradation rate equations were then established. In addition, the kinetic
compensation effect (KCE) was used to correlate the pre-exponential factor (ko) with activation energy (E
a) and the
existence of the KCE was accepted. TG-FT/IR analyses were applied to the TPPB degradation and then the FT-IR stack
plot was used to analyze gas products (CO2, CH4, HCOOH, and CH3OH). Infrared vibrational frequencies and the micro,
crystal structure of the TPPBs were investigated by Fourier transform infrared spectroscopy (FT-IR), Scanning electron
microscope (SEM) and X-Ray diffraction analysis (XRD), respectively.
Key words: Tetra Pak, Panel Board, Thermal Degradation, Coats-Redfern, FT-IR
INTRODUCTION
Tetra Pak packaging is a beverage and liquid food system widely
used all over the world as an aseptic packaging material. Tetra Pak
is currently used for delivery and safe packaging of food products
without any need for refrigeration or preservation. In 2007, more than
137 billion Tetra Pak packages were produced and sent worldwide,
while in 2008 this number increased to 141 billion. In light of these
numbers, recycling of Tetra Pak packaging becomes an important
concern in the control of municipal solid wastes (MSW) [1-6].
Nowadays, waste Tetra Pak (WTP) is recycled by different meth-
ods [1,7-10]:
(1) Recovery of waste cellulose (paper): Tetra Pak is recycled
through a simple, well-established process called hydro-pulping
where thin layers of plastic (low density polyethylene-LDPE) and
aluminum are separated from paper parts (cellulose fibers and high
quality fibers) are then used in the production of paper products.
(2) Recovery of Aluminum (Al): Aluminum in the waste is recov-
ered by applying pyrolysis processes in ovens. The plasma plant is
fed with polyethylene (PE)/Al residues, from which the cellulose
fibers have been previously removed, and PE is transformed into
paraffin and the aluminum is recovered in its pure form. The plasma
process is clean, and there is no need for the addition of any com-
pound, such as salt. In principle, a higher recovery rate of aluminum
is attainable, since no oxidation of the aluminum occurs during the
process.
(3) Recovery of LDPE: The polyethylene/aluminum fraction is first
washed and then sent to a plastic regeneration plant to produce a
new semi-finished product called ecoAllene, a sturdy, versatile plas-
tic that is packaged and sold in granular form.
In addition to these options, WTPP can be used to produce TTPB,
which can be used as construction materials such as separation pan-
els, roof construction panels, construction molds and transportation
containers. Considering the above-mentioned recycling methods,
the production of panel boards from WTPP is a cost-effective ap-
plication for recycling such waste without advance processing such
as hydro-pulping or plasma technology. WTPP can be converted
to such commercial products by performing shredding, scraping
and molding treatments which are not costly compared with other
recycling options. Such panel products produced from WTPP may
help reduce usage of wooden raw materials to produce wood based
panels, thus decreasing the pressure on forests.
To increase the usage and quality of TPPBs, it is necessary to
investigate their thermal properties, which are very important in deter-
mining their possible future usage areas. TPPB is a thermally degrad-
able and combustible material due to its chemical substance. Thermal
degradation characteristic affects the degradation and performance
of TPPB products. Thermal characteristic should be considered in
determining usage area. However, for TPPB requiring stability, the
thermal degradation temperature is an upper limit for practical use.
It is not possible to use the TPPB at temperature below which thermal
decomposition occurs. Also, many materials produce gases on ther-
mal degradation, and gases strongly affect the degradation kinetics.
Therefore, knowledge of the thermal degradation of TPPB can be
critical in many practical applications.
Although pyrolysis of waste Tetra Pak has been studied exten-
sively, there is a lack of study on the thermal degradation behavior
of TPPBs.
In a previous study, pyrolysis experiments were carried out in an
çs

Thermal degradation characteristic of Tetra Pak panel boards under inert atmosphere 879
Korean J. Chem. Eng.(Vol. 30, No. 4)
inert atmosphere in a batch reactor at different temperatures and by
different pyrolysis modes (one- and two-step). The char obtained
from pyrolysis was suitable to use as solid fuel because of its high
calorific value and low ash content. Different types of gas were pro-
duced mostly from the degradation of cardboard and contained a
high proportion of carbon oxides. TGA results showed that pyroly-
sis of Tetra Pak consisted of two distinct stages [1]. The pyrolysis
of Tetra Pak in nitrogen atmosphere was investigated with a ther-
mogravimetric analysis (TGA) reaction system. The pyrolysis kinetic
experiments for the Tetra Pak and its main components (Kraft paper
and LDPE) were carried out at heating rates (β) of 5.2, 12.8, 21.8 K
min−1. The results indicated that the one-reaction model and two-
reaction model could be used to describe the pyrolysis of LDPE
and Kraft paper respectively. The reaction was contributed to mainly
by the pyrolysis reaction of LDPE. In the XRD analysis, the results
indicated that pure aluminum foil could be obtained from the final
residues [4].
In addition, the pyrolysis reactions of Tetra Pak were performed
in four different oxygen concentrations (O2) of 5.4, 10.4, 14.8, and
21.0%. This was done to better analyze the pyrolysis and gaseous
products collected at room temperature (298 K) and analyzed by
gas chromatography (GC). It is suggested that since the synthetic
gases (CO, CO2, H2O, HCs) contained a high calorific value, their
usage as marketable fuels greatly supported the importance of energy
recovery from post-consumer Tetra Pak packages [2].
In the present study, thermal stability of TTPBs produced from
waste Tetra Pak was investigated under a nitrogen atmosphere. Coats-
Redfern, non-isothermal kinetic model, was applied to the calcula-
tions to establish kinetic parameters used in the rate equations. In
addition, evolved gas analysis was examined to characterize the
main compounds released during the thermal degradation by the
TG-FT/IR analysis.
EXPERIMENTAL
1. Material and Characterization
TPPBs were supplied from YEKASAN Converting Factory in
Izmir, Turkey (Fig. 1). For panel production, waste Tetra Pak was
shredded and pressed in a hot press at 180 oC and a pressure of 1.2 N/
mm2 for 12 min to 18 mm of target panel thickness. Physical and
Table 1. Physical and mechanical properties of the tetra pak panel board
Properties Value Standards
Specific gravity, g/cm3 001.09 TS 180
Swelling in thickness (2 hour at 20 oC water), % 001.04 TS180
Swelling in thickness (24 hour at 20 oC water), % 005.04 TS180
Bending Strength, kPa/cm2 186.50 TS180
Tensile strength perpendicular to the surface, kPa/cm2 003.50 TS180
Tensile strength parallel to the surface, kPa/cm2 72.8 ASTM 1037
Screw holding strength (perpendicular to the surface), kPa 87.5 TS10505
Janka hardness, kPa/cm2 681.50 BS 1811
Density, g/cm3 001.10 DIN 52361
Heat insulation coefficient, W/mK 000.13 DIN 52612
Longitudinal bending, N/mm2 019.00 DIN 68761
Transverse deflection, N/mm2 002.25 DIN 68761
Fig. 1. Image of tetra pak panel board.
Table 2. Proximate analyses of the tetra pak panel board
Moisture/
%
Ash/
%
Volatile
mater/%
Fixed
carbon/%
Calorific values/MJkg−1
(on the dry basis)
2.90 6.19 86.00 4.91 30.30
Fig. 2. XRD pattern of tetra pak panel board.

880 A. K. Figen et al.
April, 2013
mechanical properties of TPPBs are listed in Table 1. TPPBs con-
tain 74±1% of Kraft paper, LDPE of 22.5±1.87% and aluminum
of 6±1%. The approximate analyses of the samples were per-
formed in accordance with the ASTM standard (ASTM E1131-03),
and the calorific value was determined in accordance with ASTM
D 5865-04 by a bomb calorimeter (IKA-Calorimeter C400) (Table
2). The average of three samples was used for all below-mentioned
analyses.
Fig. 3. FT-IR spectrum of tetra pak panel board.
Fig. 4. SEM images of tetra pak panel board.
Also, in order to investigate the effect on fabrication process on
degradation behavior of TPPBs, thermal analyses were performed
on WTPP under the same conditions.
Crystal structure, infrared vibrational frequencies and microstruc-
ture of stalks were investigated by X-Ray diffraction analysis (XRD),
Fourier transform infrared spectroscopy (FT-IR), and scanning elec-
tron microscope (SEM), respectively. Characterization techniques
for structural analyses in the present study are listed below:

Thermal degradation characteristic of Tetra Pak panel boards under inert atmosphere 881
Korean J. Chem. Eng.(Vol. 30, No. 4)
1-1. XRD Analysis
Crystal structure of sample was determined by the XRD tech-
nique. XRD analysis was carried out at an ambient temperature using
a Philips Panalytical X’Pert-Pro diffractometer in a range of diffrac-
tion angles from 5o to 40o with CuKα radiation at operating param-
eters of 40 mA and 45 kV. The XRD pattern is given in Fig. 2.
1-2. FT-IR Analysis
Attenuated total reflectance (ATR) of FT-IR spectroscopy (Perkin
Elmer Spectrum One) was used to determine the infrared vibra-
tional frequencies. Before analysis, the crystal area was cleaned and
the background reading collected. The material was then placed
over the small crystal area on a universal diamond ATR top-plate.
Force was then applied to the sample, pushing it onto the diamond
surface. The resulting FT-IR spectrum was recorded in the spectral
range of 4,000 to 650 cm−1 at ambient temperature; the resolution
used was 4 cm−1. The FT-IR spectrum is given in Fig. 3.
1-3. SEM Analysis
The microstructure of the material was investigated by SEM
Fig. 5. Thermal analysis curves of tetra pak panel board components at different heating rates.
882 A. K. Figen et al.
April, 2013
(Chemscan/Apollo300) analysis. The sample was made ready for
analysis by fixing it to the device’s sample holder with the help of
a carbon sticky band and then coating it with a small amount of con-
ductive material (Au). The SEM images are given in Fig. 4.
2. Thermal Degradation Characteristic
Thermal degradation characteristics of the WTPP and its com-
ponents, TPPBs and its components were carried out using the Perkin
Elmer Diamond thermal analysis instrument, which was calibrated us-
ing the melting points of indium (Tm=156.6 oC) and tin (Tm=231.9 oC)
under the same conditions as the sample. The analyses were done
at different heating rates of 10, 15 and 20 oC/min in an atmosphere
of N2 that had a constant flow rate of 100 ml/min. The samples (~5
mg) were allowed to settle in standard alumina crucibles and heated
to 700 oC. In the first step of the thermal analysis, the TPPBs were
separated into layers and LDPE, Kraft paper and aluminum foil were
obtained. Thermal degradation characteristics of LDPE and Kraft
paper were carried out under the same conditions to determine their
thermal degradation behavior. Thermal analysis curves of TPPBs
at different heating rates are given in Fig. 5. In addition, the TG and
DTG curves of the TPPBs, Kraft paper and LDPE were compared
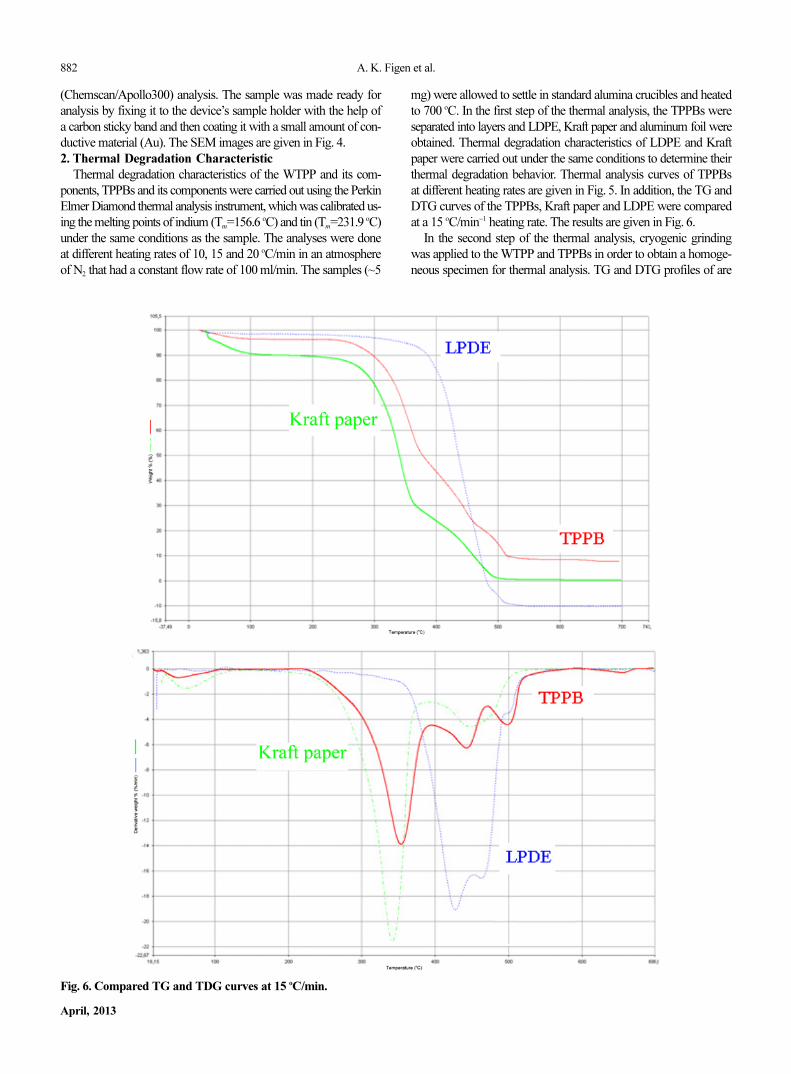
at a 15 oC/min−1 heating rate. The results are given in Fig. 6.
In the second step of the thermal analysis, cryogenic grinding
was applied to the WTPP and TPPBs in order to obtain a homoge-
neous specimen for thermal analysis. TG and DTG profiles of are
Fig. 6. Compared TG and TDG curves at 15 oC/min.
Thermal degradation characteristic of Tetra Pak panel boards under inert atmosphere 883
Korean J. Chem. Eng.(Vol. 30, No. 4)
given WTPP and TPPBs in Fig. 7 and Fig. 8, respectively. Data ob-
tained through interpretation of TPPBs profiles is given in Table 3.
The TG system was coupled with the FT-IR system and a time-
based experiment can thus be performed to analyze the volatiles
during the thermal degradation (CH4, H2O, CO, CO2, etc.). FT-IR
plots of gas evolution determined at different heating rates are given
in Fig. 9. IR absorbance of CH4, CO2, COOH, and CH3OH at maxi-
mum reaction rates of the thermal degradation steps are determined
and listed in Table 4.
In the present study, the thermal degradation reaction of the TPPB
samples can be defined as below:
TPPB(s)→Volatiles(s)+Char(g)+Aluminum Foil(s) (1)
Kinetic analysis of thermal degradation reactions of the TPPB sam-
ples was done by using mathematical equations of Coats-Redfern,
which are non-isothermal kinetic models based on multiple heat-
ing rates.
According to the Coats-Redfern method, values of [log(−log(1−α)/
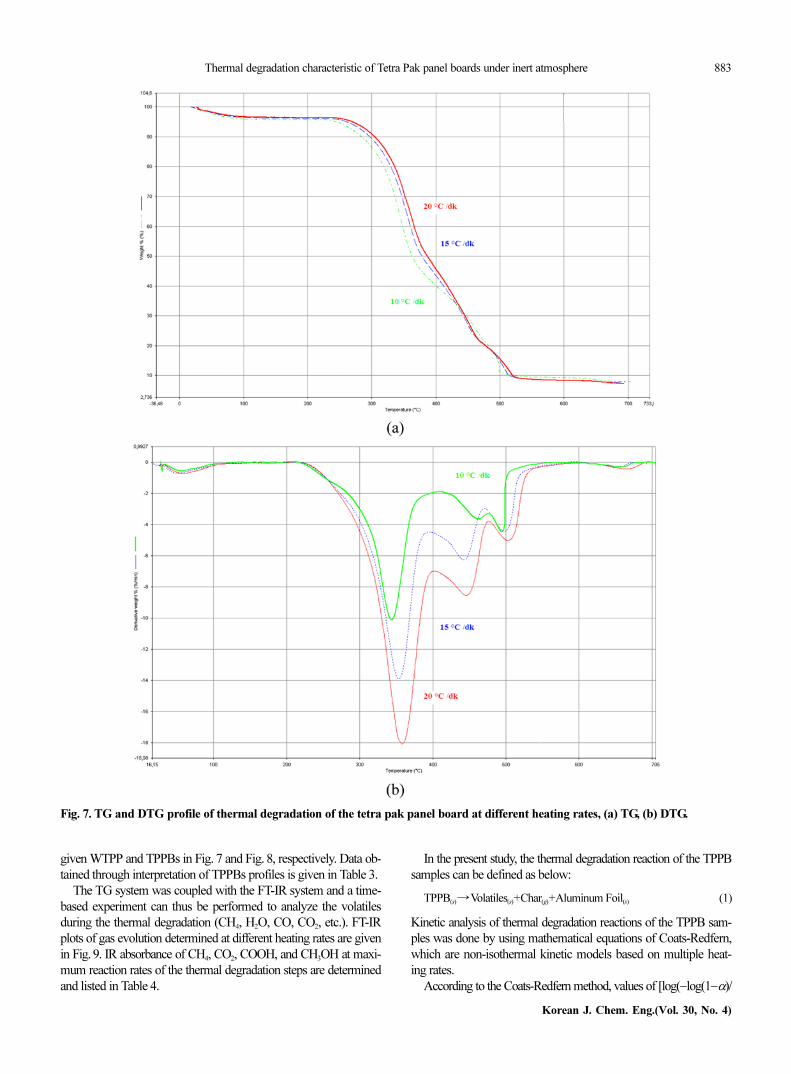
Fig. 7. TG and DTG profile of thermal degradation of the tetra pak panel board at different heating rates, (a) TG, (b) DTG.

884 A. K. Figen et al.
April, 2013
T2)] versus 1/T were plotted. The slope of the line was used to cal-
culate activation energy (Ea) and also the pre-exponential factor (k0)
was determined from the intercept of the line (Eq. (3) and Eq. (4)).
In this method, 1/T should give a straight line with a maximum cor-
relation coefficient (R2) for a corrected value of order of the reaction
(n). In the Coats-Redfern method, reaction orders were assumed to
have the values of 0 to 3 in the decomposition fraction (α) and a
range of 0.1 to 0.9 [11].
for n≠1 (3)
for n=1 (4)
R2 values for all the orders were calculated and plotted against the
n values as shown in Fig. 10. R2−n curves have maximum n values
corresponding to the more appropriate kinetic mechanism, from
which optimal values of the thermal degradation reaction order were
calculated. These n values were put in Eq. (3) to calculate the Ea
and k0 values for each of the heating rates (Table 5).
The literature has indicated that the activation energy depends
on several parameters such as the heating rate, particle size distri-
bution, atmosphere and crucible type. The kinetic compensation
effect (KCE) was evaluated to validate the kinetic data [12-15]. It has
been accepted that under different experimental conditions, between
the logarithm of the pre-exponential factor (ln k0) and the apparent
activation energy (Ea), a linear relationship is observed. KCE plots
of the thermal degradation steps are given in Fig. 11.
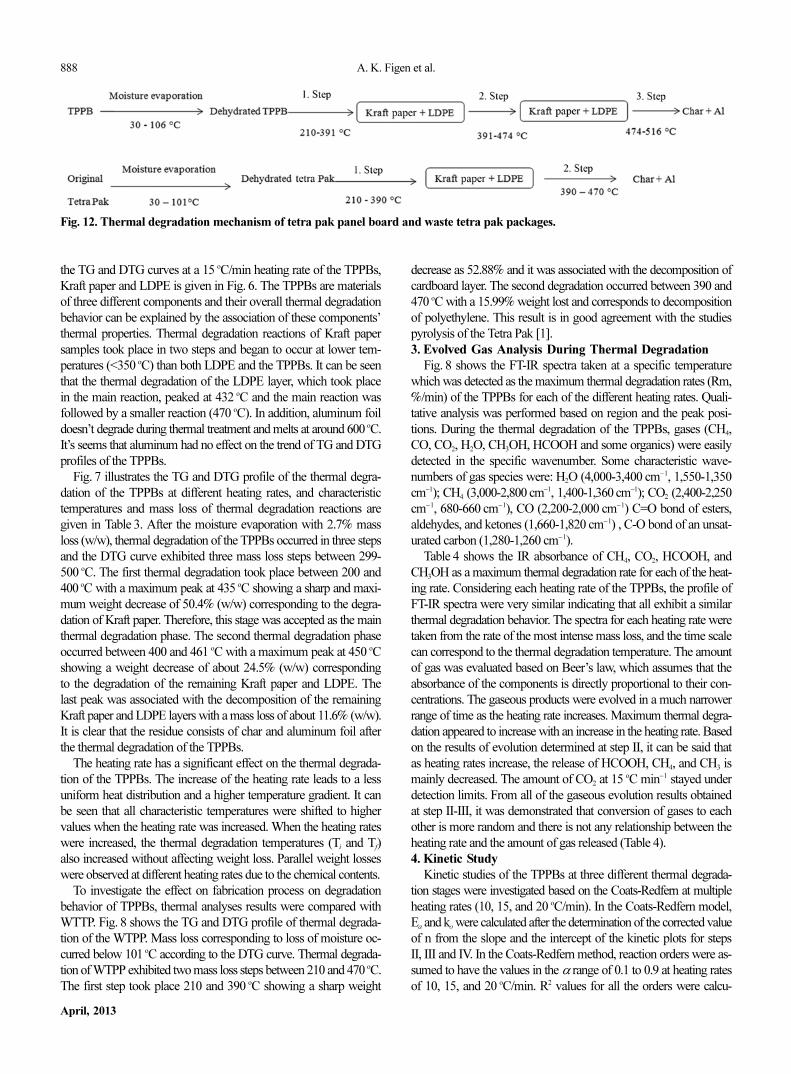
According to the thermal analyses, thermal degradation mecha-
nisms of TPPB and WTPP are illustrated in Fig. 12.
RESULTS AND DISCUSSION
1. Crystal Structure, Infrared Vibrational Frequencies and
Microstructure of TTPBs
Crystal structure, infrared vibrational frequencies and microstruc-
1− 1− α( )1−n
T2
1− n( )---------------------------- =
k0R
βEa
-------- 1−
2RT
Ea
---------- −
Ea
2.303RT---------------------loglog
− log 1− α( )
T2
--------------------------- =
k0R
βEa
-------- 1−
2RT
E---------- −
Ea
2.303RT---------------------loglog
Fig. 8. TG and DTG profile of thermal degradation of the waste tetra pak packages and its components.
Table 3. Characteristic temperatures and mass losses for the thermal degradation reaction of the tetra pak panel board
Reaction steps
Heating rates (oC/min)
10 15 20
Ti -Tf (oC) m % Ti-Tf (oC) m % Ti-Tf (oC) m %
Moisture evaporation 28.56-97.09 03.691 029.08-109.77 02.700 033.30-111.85 02.313
1. Step 204.68-380.52 51.395 207.71-391.88 50.349 219.10-401.26 51.067
2. Step 380.42-476.83 22.780 391.88-471.96 24.544 401.26-473.33 24.917
3. Step 476.83-499.41 10.142 471.96-520.00 11.551 475.94-531.19 11.271
Total mass lost (%) 88.008 90.145 89.568

Thermal degradation characteristic of Tetra Pak panel boards under inert atmosphere 885
Korean J. Chem. Eng.(Vol. 30, No. 4)
Fig. 9. FT-IR stalks plots at different heating rates.

886 A. K. Figen et al.
April, 2013
ture of the TPPBs were investigated by X-Ray diffraction analysis
(XRD), Fourier transform infrared spectroscopy (FT-IR), and a scan-
ning electron microscope (SEM), respectively, in the present study.
The XRD pattern of the TPPBs in the diffraction range 10-80o is
shown in Fig. 2. As can be seen, two phases were detected as n-par-
affin (PDF: 00-040-1995) and aluminum (PDF: 01-088-3657). Peaks
appeared at about 2θ of 38.41o, 44.60o and 65.06o, in the aluminum
phase. In addition, peaks appeared at about 2θ of 21.46o, 23.83o and
36.07o in the n-paraffin phase. The plastic layer in the TPPBs was
transformed into n-paraffin after the temperature and pressure treat-
ment.
Fig. 3 represents the FT-IR spectra and the fundamental peaks
of the TPPBs are marked. The FT-IR spectra of the TPPBs were
used to determine the vibration frequency in the functional groups.
Generally, the peaks observed at about 3,333 cm−1 can be attrib-
uted to the existence of free and intermolecular bonded hydroxyl
groups. The absorption peak of around 2,916 cm−1 and 2,849 cm−1
indicates the stretching vibration of the C-H band. The peak at around
1,639 cm−1 is due to the C-C band stretching vibration, and the peak
at 1,465 cm−1 corresponds to the C-C stretching vibration. The peak
at around 1,158 cm−1 is due to the C-O-C band stretching vibration.
The strong band at around 1,029 cm−1 is due to the C-O group and
confirms the presence of Kraft paper in the sample. Also, the peak
at around 717 cm−1 is attributed to the stretching modes of C-C [16].
SEM is used to visually observe the physical qualities and micro-
structure of the TPPBs and its individual components: (a) TPPB,
(b) kraft paper, (c) LDPE, (d) aluminum. SEM images at 500× mag-
nification of the samples are shown in Fig. 4.
2. Thermal Degradation Behaviors
The TPPBs were separated into layers of LDPE, Kraft paper and
aluminum. Thermal degradation of the TPPBs and their components
was carried out under the same conditions to determine the ther-
mal degradation behaviors.
TG, DTA and DTG profiles of Kraft paper and LDPE at 10, 15
and 20 oC/min are given in Fig. 5. Obviously, there were two princi-
Table 4. IR absorbance at gas evolution determined via TG-FT/IR in degradation at different heating rate
Evolved gas Heating rates (oCmin−1)
Step
H2O
(Absorbance)
10 15 20
1 0,017986 0,017075 0,004864
2 0,018170 0,018117 0,005078
3 0,017650 0,018305 0,005437
Step
CH4
(Absorbance)
10 15 20
1 0,022695 0,012836 0,012944
2 0,018170 0,016580 0,015140
3 0,017650 0,016748 0,016469
Step
CO2
(Absorbance)
10 15 20
1 0,003407 0 0
2 0,003990 0 0,001356
3 0,004213 0 0,001792
Step
HCOOH
(Absorbance)
10 15 20
1 0,14610 0,106050 0,094921
2 0,16220 0,124810 0,108380
3 0,16578 0,125910 0,114520
Step
CH3OH
(Absorbance)
10 15 20
1 0,17900 0,122910 0,103470
2 0,20289 0,144000 0,140900
3 0,20940 0,144350 0,149130
Step
CO2
(Absorbance)
10 15 20
1 0,11195 0,087827 0,081667
2 0,12776 0,103610 0,090124
3 0,13047 0,104600 0,095551
Fig. 10. R2−n values for Coats-Redfern method at different heat-
ing rates.

Thermal degradation characteristic of Tetra Pak panel boards under inert atmosphere 887
Korean J. Chem. Eng.(Vol. 30, No. 4)
pal reactions observed in the two distinct mass changes over the
temperature ranges 200-600 oC for all three heating rates, and a higher
heating rate shifted the curve to a higher temperature range as can
be seen in the TG curve. It is clear that the degradation of Tetra Pak
components was independent of the heating treatment. In addition,
DTA curves of Kraft paper indicated that thermal degradation oc-
curred in two endothermic reactions as expected. Kraft paper con-
sists mainly of cellulose along with the hemicelluloses (nearly 5%)
and lignin (nearly 5%) and some pulping chemicals such as CaCO3.
The first pyrolysis reaction contributed mainly to the degradation
of cellulose, hemicelluloses, and lignin and impurities at temperatures
between 200-350 oC with a peak of about 350 oC, which belongs
to the degradation of cellulose dominantly [17]. The first step is cleav-
age of glucosidic bond and initial products occur at a lower tem-
perature, and levoglucosan is the most significant primary degra-
dation product of cellulose and furan and furan derivatives such as
1,6-anhydroglucofuranose, enones occur following levoglucosane
[18,19]. There is a correlation between increasing temperature and
the occurrence of levoglucosane. It is well known that generation
of levoglucosane occurs in the crystalline areas of cellulose, and
heat treatments lead to increasing of crystallinity of fibrous cellu-
lose [19]. On the other hand, carbonyl groups also were formed in
the nitrogen atmosphere and their concentration reached at a constant
level after a rapid increase [20]. Besides the cleavage of molecular
chains of cellulose, there are also dehydration and oxidation reac-
tions by heat treatment of cellulose [19]. Since pyrolysis in the study
was performed in N2 atmosphere, any possible oxidation reactions
were ignored. Even though the sensibility of the hemicelluloses to
heat treatment is greater than cellulose, the decomposition and de-
polymerization of the hemicelluloses in nitrogen atmosphere occur
at higher temperatures compared to normal atmospheric conditions.
The major decomposition products of the hemicelluloses are meth-
anol, acetic acid, furfural and carbon dioxide, which occurs at ele-
vated temperatures between 200-300 oC [19]. After heating the Kraft
paper to 550 oC, the second pyrolysis reaction was observed due to
decomposition of intermediates and solid residues with a peak of
about 340 oC. This peak can be attributed to the degradation of lignin;
dominantly, pyrolytic degradation of lignin occurs at temperatures be-
tween 300-450 oC and some of the phenolic compounds are con-
verted into vapor phase [20-22].
The trends of the LDPE TG curves were similar to those of the
Kraft paper pyrolysis in the two reaction stages. When the temper-
ature reached about 300 oC, weight loss began and proceeded until
530 oC was reached. Also, higher heating rates shifted the curve to
the higher temperature range. From the TG and DTG analysis re-
sults, there was no solid residue remaining for 15 and 20 oC/min
heating rates while was solid remaining about 20% for 10 oC/min.
On the other hand, DTA curves of LDPE indicated that thermal de-
gradation occurred in two endothermic reactions as expected.
It can be seen that the thermal degradation of the TPPBs can be
divided into three phases after moisture evaporation. A comparison of
Table 5. Kinetic parameters calculated from Coats&Redfern model
Heating rate
(oC/min)Step
Reaction
orderR2
Ea
(kJ/mol)
k0
(min−1)
10
II 0.17 0.9989 074.84 3.32×1050
III 0.35 0.9992 129.14 7.04×1080
IV 0.40 0.9994 573.06 7.29×1038
15
II 1.00 0.9899 080.62 1.35×1060
III 1.30 0.9941 201.87 4.94×10¹¹
IV 1.53 0.9930 399.99 1.06×1027
20
II 0.45 0.9946 085.82 4.82×1060
III 1.02 0.9967 243.84 4.94×10¹¹
IV 1.09 0.9951 375.33 1.85×1025
Fig. 11. Kinetic compensation effect for Coats-Redfern method.
888 A. K. Figen et al.
April, 2013
the TG and DTG curves at a 15 oC/min heating rate of the TPPBs,
Kraft paper and LDPE is given in Fig. 6. The TPPBs are materials
of three different components and their overall thermal degradation
behavior can be explained by the association of these components’
thermal properties. Thermal degradation reactions of Kraft paper
samples took place in two steps and began to occur at lower tem-
peratures (<350 oC) than both LDPE and the TPPBs. It can be seen
that the thermal degradation of the LDPE layer, which took place
in the main reaction, peaked at 432 oC and the main reaction was
followed by a smaller reaction (470 oC). In addition, aluminum foil
doesn’t degrade during thermal treatment and melts at around 600 oC.
It’s seems that aluminum had no effect on the trend of TG and DTG
profiles of the TPPBs.
Fig. 7 illustrates the TG and DTG profile of the thermal degra-
dation of the TPPBs at different heating rates, and characteristic
temperatures and mass loss of thermal degradation reactions are
given in Table 3. After the moisture evaporation with 2.7% mass
loss (w/w), thermal degradation of the TPPBs occurred in three steps
and the DTG curve exhibited three mass loss steps between 299-
500 oC. The first thermal degradation took place between 200 and
400 oC with a maximum peak at 435 oC showing a sharp and maxi-
mum weight decrease of 50.4% (w/w) corresponding to the degra-
dation of Kraft paper. Therefore, this stage was accepted as the main
thermal degradation phase. The second thermal degradation phase
occurred between 400 and 461 oC with a maximum peak at 450 oC
showing a weight decrease of about 24.5% (w/w) corresponding
to the degradation of the remaining Kraft paper and LDPE. The
last peak was associated with the decomposition of the remaining
Kraft paper and LDPE layers with a mass loss of about 11.6% (w/w).
It is clear that the residue consists of char and aluminum foil after
the thermal degradation of the TPPBs.
The heating rate has a significant effect on the thermal degrada-
tion of the TPPBs. The increase of the heating rate leads to a less
uniform heat distribution and a higher temperature gradient. It can
be seen that all characteristic temperatures were shifted to higher
values when the heating rate was increased. When the heating rates
were increased, the thermal degradation temperatures (Ti and Tf)
also increased without affecting weight loss. Parallel weight losses
were observed at different heating rates due to the chemical contents.
To investigate the effect on fabrication process on degradation
behavior of TPPBs, thermal analyses results were compared with
WTTP. Fig. 8 shows the TG and DTG profile of thermal degrada-
tion of the WTPP. Mass loss corresponding to loss of moisture oc-
curred below 101 oC according to the DTG curve. Thermal degrada-
tion of WTPP exhibited two mass loss steps between 210 and 470 oC.
The first step took place 210 and 390 oC showing a sharp weight
decrease as 52.88% and it was associated with the decomposition of
cardboard layer. The second degradation occurred between 390 and
470 oC with a 15.99% weight lost and corresponds to decomposition
of polyethylene. This result is in good agreement with the studies
pyrolysis of the Tetra Pak [1].
3. Evolved Gas Analysis During Thermal Degradation
Fig. 8 shows the FT-IR spectra taken at a specific temperature
which was detected as the maximum thermal degradation rates (Rm,
%/min) of the TPPBs for each of the different heating rates. Quali-
tative analysis was performed based on region and the peak posi-
tions. During the thermal degradation of the TPPBs, gases (CH4,
CO, CO2, H2O, CH3OH, HCOOH and some organics) were easily
detected in the specific wavenumber. Some characteristic wave-
numbers of gas species were: H2O (4,000-3,400 cm−1, 1,550-1,350
cm−1); CH4 (3,000-2,800 cm−1, 1,400-1,360 cm−1); CO2 (2,400-2,250
cm−1, 680-660 cm−1), CO (2,200-2,000 cm−1) C=O bond of esters,
aldehydes, and ketones (1,660-1,820 cm−1) , C-O bond of an unsat-
urated carbon (1,280-1,260 cm−1).
Table 4 shows the IR absorbance of CH4, CO2, HCOOH, and
CH3OH as a maximum thermal degradation rate for each of the heat-
ing rate. Considering each heating rate of the TPPBs, the profile of
FT-IR spectra were very similar indicating that all exhibit a similar
thermal degradation behavior. The spectra for each heating rate were
taken from the rate of the most intense mass loss, and the time scale
can correspond to the thermal degradation temperature. The amount
of gas was evaluated based on Beer’s law, which assumes that the
absorbance of the components is directly proportional to their con-
centrations. The gaseous products were evolved in a much narrower
range of time as the heating rate increases. Maximum thermal degra-
dation appeared to increase with an increase in the heating rate. Based
on the results of evolution determined at step II, it can be said that
as heating rates increase, the release of HCOOH, CH4, and CH3 is
mainly decreased. The amount of CO2 at 15 oC min−1 stayed under
detection limits. From all of the gaseous evolution results obtained
at step II-III, it was demonstrated that conversion of gases to each
other is more random and there is not any relationship between the
heating rate and the amount of gas released (Table 4).
4. Kinetic Study
Kinetic studies of the TPPBs at three different thermal degrada-
tion stages were investigated based on the Coats-Redfern at multiple
heating rates (10, 15, and 20 oC/min). In the Coats-Redfern model,
Ea and ko were calculated after the determination of the corrected value
of n from the slope and the intercept of the kinetic plots for steps
II, III and IV. In the Coats-Redfern method, reaction orders were as-
sumed to have the values in the α range of 0.1 to 0.9 at heating rates
of 10, 15, and 20 oC/min. R2 values for all the orders were calcu-
Fig. 12. Thermal degradation mechanism of tetra pak panel board and waste tetra pak packages.

Thermal degradation characteristic of Tetra Pak panel boards under inert atmosphere 889
Korean J. Chem. Eng.(Vol. 30, No. 4)
lated and plotted against the n values as shown in Fig. 9. R2−n curves
have maximum n values corresponding to the more appropriate kin-
etic mechanism, from which optimal values of thermal degrada-
tion reaction order were calculated. These n values were put in Eq.
(3) to calculate the Ea and k0 values for each heating rate (Table 5).
It was observed that there was no general trend in the Ea values from
the point of the heating rate. According to Table 5, the Ea values
varied from 74-85 kJ/mol for phase II, 129-243 kJ/mol for phase
III and 375-573 kJ/mol for phase IV. The lowest activation energy
was observed in the second phase for all the heating rates, which was
the main thermal degradation step, and also the highest activation
energy was observed during the last phase for all the heating rates.
The reason for the highest activation energy during the last stage
was due to the melting of the aluminum foil in the TPPB structure.
An example of the rate equations of the thermal degradation of
the TPPB reactions can be written for 10 oC/min. Rate equations
can be written for the other heating rates as similar equations in Eq.
(5)-(7).
Step II: (5)
Step III: (6)
Step IV: (7)
As a result of the non-isothermal kinetic analysis, the Coats-Red-
fern method well represents the thermal degradation of the TPPB
reactions. To validate the kinetic data reported in the case of the Coats-
Redfern, KCE was applied. The KCE plots of Ea based on the lnk0
values for each of the heating rates are given in Fig. 10. Kinetic data
from the thermal degradation reaction of TPPB given the KCE a
high correlation coefficient. Thus, pre-exponential factor and activa-
tion energy exhibited the same behavior when the heating rate was
changed.
From the TG/DTG curves, kinetic and evolved gas analysis in
this study, the TBBP degradation under inert atmosphere, there is a
three-reaction model for TBBP degradation as shown in Fig. 12.
Shred and hot press at 180 oC processes are applied to produce the
TBBP from waste Tetra Pak packages. However, chemical modifi-
cation was not applied during the fabrication. Although thermal deg-
radation of TBBP consisted of four steps as moisture evaporation
and following three degradation steps, WTPP was degraded at three
steps which include moisture evaporation and two degradation steps.
Also, fabrication process had not changed the initial and final tem-
peratures of overall degradation reaction of TBBP compared with
waste Tetra Pak packages. Fabrication process only affected the de-
composition steps of Kraft paper and LDPE layers in TBBP. On
the contrary of the waste Tetra Pak packages, decomposition of Kraft
paper and LDPE layers in the TBBP occurred in two consecutive
reactions. From the TG/DTG curves of WTPP degradation in an
inert atmosphere a two-reaction model is proposed and results are
in agreement with study of Wu and Liu, 2001 [2].
CONCLUSION
The recycling of waste Tetra Pak packages composed of paper,
low-density polyethylene, and aluminum is of great recycling sig-
nificance. We investigated the thermal degradation behavior of “Tetra
Pak Panel Boards” produced from waste Tetra Pak packages with-
out any significant recycling process, under inert atmosphere.
Thermal degradation behavior of the TTPBs was studied using
a thermal analysis system in a nitrogen atmosphere at different heat-
ing rates (10, 15 and 20 oC/min). The Coats-Redfern non-isother-
mal kinetic model was applied to calculate the thermal degradation
kinetic parameters. TG results showed that thermal degradation of
TTPB consisted of three distinct steps after the moisture evaporation.
The first step was accepted as the main thermal degradation phase
(200-400 oC) and corresponding to the degradation of Kraft paper.
The second thermal degradation step occurted between 400 and 461 oC
and corresponds to the degradation of Kraft paper and LDPE. The
last step was associated with the decomposition of the remaining Kraft
paper and LDPE layer and it’s clear that the residue consists of char
and aluminum foil after the thermal degradation of the TPPBs.
The effects of fabrication process on the degradation reaction
were investigated and three-reaction model was proposed to illus-
trate the kinetic behavior of the TPPB under inert atmosphere.
Activation energy values varied from 74-85kJ/mol for step II, 129-
243 kJ/mol for step III and 375-573 kJ/mol for step IV. The highest
activation energy was observed during the last phase for all the heat-
ing rates. The reason for the highest activation energy value during
the last stage was dependent on the melting of the aluminum foil
in the TPPB structure. CH4, CO, CO2, H2O, CH3OH, HCOOH and
some organics were detected during the thermal degradation of TPPB.
It was observed that the maximum thermal degradation rate occurred
at the highest heating rate.
ACKNOWLEDGEMENT
Financial support by the Coordination Unit for Scientific Research
Projects of Istanbul University, Turkey is gratefully appreciated (Pro-
ject No: 6408). The authors also acknowledge YEKESAN, Izmir,
Turkey for providing the tetrapak panels.
REFERENCES
1. A. Korkmaz, J. Yanik, M. Brebu and C. Vasile, Pyrolysis of the
Tetra Pak, Waste Manage., 29, 11 (2009).
2. C. H. Wu and Y. F. Liu, Energy Fuel, 15, 4 (2001).
3. E. Boer, A. Jêdrczak, Z. Kowalski, J. Kulczycka and R. Szpadt, Waste
Manage., 30, 3 (2010).
4. C. H. Wu and H. S. Chang, J. Chem. Technol. Biotechnol., 76 (2001).
5. A. V. Shekdar, Waste Manage., 29, 4 (2009).
6. www.tetrapak.com.
7. R. N. Szente, M. G. Schroeter, M. G. Garcia and O. W. Bender, J.
Met., 49, 11 (1997).
8. C. M. A. Lopes and M. I. Felisberti, J. Appl. Polym. Sci., 101 (2006).
9. www.alcoa.com.
10. http://www.ecoallene.com/page.html?id=11.
11. A. W. Coats and J. P. Redfern, Nature, 201 (1964).
12. M. E. Brown, M. Maciejewskib, S. Vyazovkinc, R. Nomend, J. Sem-
pered, A. Burnhame, J. Opfermannf, R. Streyg, H. L. Andersong, A.
Kemmlerg, R. Keuleersh, J. Janssensh, H. O. Desseynh, C. Lii, T.
Tangi, B. Roduitj, J. Malekk and T. Mitsuhashi, Thermochim. Acta,
dα
dt------ = 3.32 10
5
e− 74838/RT( )
1− α( )0.17
×
dα
dt------ = 7.04 10
8
e− 129141/RT( )
1− α( )1.00
×
dα
dt------ = 7.29 10
38
e− 573059/RT( )
1− α( )0.45
×

890 A. K. Figen et al.
April, 2013
355 (2000).
13. M. B. Dantas, A. A. F. Almeida, M. M. Concei, Jr. V. J. Fernandes,
M.G. Santos, F.C. Silva, L.E. B. Soledade and A.G. Souza, J. Therm.
Anal. Calorim., 87, 3 (2007).
14. D.S. Dias, M.S. Crespi, C.A. Ribeiro, J.L.S. Fernandes and H.M.G.
Cerqueira, J. Therm. Anal. Calorim., 91, 2 (2008).
15. S. Vyazovkina, A. K. Burnhamb, J. M. Criadoc, L. A. Pérez-Maque-
dac, C. Popescud and N. Sbirrazzuolie, Thermochim. Acta, 520
(2011).
16. B. S. Souza, A. P. Moreira and A. M. Teixeira, J. Therm. Anal. Cal-
orim., 97 (2009).
17. S. Soares, G. Camino and S. Levchik, Polym. Degrad. Stabil., 49, 2
(1995).
18. M. V. Ramiah, J. Appl. Polym. Sci., 14 (1970).
19. D. Fengel and G. Wegener, Wood-Chemistry, Ultrastructure, Reac-
tions. De Gruyter, Berlin-New York, 319 (1984).
20. F. C. Beall and H. W. Eickner, Madison, Wis., US. Forest Products
Laboratory TS801.U493 No.130 (1970).
21. M. Brebu and C. Vasile, Cell. Chem. Technol., 44, 9 (2010).
22. N. E. Mansouri, Q. Yuan and F. Huang, Bio. Res., 6, 3 (2011).