thermal dehydration kinetics of phosphogypsumdigital.csic.es/bitstream/10261/129013/1/thermal...
TRANSCRIPT
Materiales de ConstruCCión
Vol. 65, Issue 319, July–September 2015, e061ISSN-L: 0465-2746
http://dx.doi.org/10.3989/mc.2015.07214
Thermal dehydration kinetics of phosphogypsum
F.A. López*, H. Tayibi, I. García-Díaz, F.J. Alguacil
Centro Nacional de Investigaciones Metalúrgicas (CENIM-CSIC) (Madrid, Spain)*[email protected]
Received 15 October 2014Accepted 30 January 2015
Available on line 24 June 2015
ABSTRACT: Phsophogypsum is a by-product from the processing phosphate rock. Before the use of it in cement industry such as setting regulator is necessary a study of dehydration reaction of phosphogypsum to avoid the false setting during the milling.
The aim is to study the thermal behavior of two different phosphogypsum sources (Spain and Tunisia) under non-isothermal conditions in argon atmosphere by using Thermo-Gravimetriy, Differential Thermal Analysis (TG-DTA) and Differential Scanning Calorimetry (DSC).
DSC experiments were carried out at temperatures ranging from ambient to 350 °C at different heating rates. The temperatures of conversion from gypsum to hemihydrate and anhydrite states and heat of dehydra-tion were determined. Various methods were used to analyze the DSC data for reaction kinetics determination. The activation energy and frequency factor were calculated for dehydration of phosphogypsum. Activation energy values of the main dehydration reaction of phosphogypsum were calculated to be approximately 61–118 kJ/mol.
KEYWORDS: Phosphogypsum; Kinetics; Dehydration; Thermal behavior; Cement
Citation/Citar como: López, F.A.; Tayibi, H.; García-Díaz, I.; Alguacil, F.J. (2015) Thermal dehydration kinetics of phosphogypsum. Mater. Construcc. 65 [319], e061. http://dx.doi.org/10.3989/mc.2015.07214.
RESUMEN: Estudio cinético de la deshidratación térmica del fosfoyeso. El fosfoyeso es un subproducto proce-dente del procesado de la roca fosfato. Una de las posibles vías de reutilización y revalorización es su uso como regulador del fraguado en la industria cementera. Debido a los posibles problemas de falso fraguado asociado a los procesos de deshidratación que tienen lugar durante la molienda del cemento, esta investigación estudió el comportamiento térmico, bajo condiciones no-isotérmicas en atmósfera de argón, de dos fosfoyesos, mediante TG-DTA y DSC.
Los ensayos de DSC se realizaron hasta los 350 °C a diferentes velocidades de calentamiento. La temperatura de conversión del yeso a las formas de hemihidrato y anhidrita y el calor de hidratación fueron determinados.
Las cinéticas de reacción fueron obtenidas analizando los datos de DSC mediante varios métodos. Se calculó la energía de activación y el factor de frecuencia para las reacciones de deshidratación del subproducto. Los valores de energía de activación de las principales reacciones de deshidratación del fosfoyeso fueron obtenidos, aproximadamente 61-118 kJ/mol.
PALABRAS CLAVE: Fosfoyeso; Cinética; Deshidratación; Comportamiento térmico; Cemento
Copyright: © 2015 CSIC. This is an open-access article distributed under the terms of the Creative Commons Attribution-Non Commercial (by-nc) Spain 3.0 License.

2 • F.A. López et al.
Materiales de Construcción 65 (319), July–September 2015, e061. ISSN-L: 0465-2746. doi: http://dx.doi.org/10.3989/mc.2015.07214
NOMENCLATURE
E = reaction activation energy [kJ/mol]f(α) = differential form of the reaction mechanism functiong(α) = integral form of the reaction mechanism functionR = gas constant , 8.314 [J mol−1 K−1]A = pre-exponential factor [s−1]T = temperature of the reaction [K]t = time [s]
Greek symbolsα = degree of advance of reaction (degree of conversion)β = heating rate [K min−1]
SubscriptsPG = phosphogypsumPGS = phosphogypsum-SpainPGT = phosphogypsum-TunisiaD50 = the size in microns that splits the distribution with half above and half below this diameter.
1. INTRODUCTION
Phosphogypsum (PG) is a by-product from the processing phosphate rock by the wet process to obtain acid phosphoric according to Eq. [1]:
Ca5(PO4)3F+5 H2SO4+10 H2O→ 3H3PO4+5CaSO4∙2H2O+HF [1]
Phosphogypsum consists mainly of calcium sul-fate dihydrate with small amount of silica, usually as quartz. Radium and uranium, as well as minor amounts of toxic metals, arsenic, barium, cadmium, chromium, lead, mercury, selenium and silver and phytotoxic fluoride and aluminum are also present in phosphogypsum and its pore water. The con-centration of heavy metals and radionucleides de -pend on the composition of the phosphate rock feed (1, 2).
For every tone of phosphoric acid produced, about three tones of phosphogypsum are yield. A world PG production is around 200–280 106 t per year (3). Only the 15% of this amount of by-product has commercial uses, in agriculture and in manufacturing gypsum board and Portland cement (4). The remaining 85% is disposed of without any treatment in large stockpiles exposed to weathering processes, occupying considerable land areas and causing serious environmental damage (chemical and radioactive contamination), particularly in coastal areas. The US EPA, United States Environmental Protection Agency classified PG as a “Technologi-cally Enhanced Naturally Occurring Radioactivite
Material”, Thus the valorization and recycling of PG are being now very necessary (5).
Nowadays a number of researches are focused on finding new uses of PG: a) agricultural fertilizer or for soil stabilization amendments (6–8); b) cement industry as a setting regulator in place of natural gypsum (4, 9, 10), in the gypsum industry to make gypsum plaster (4, 11, 12), as mineralizer in the burning Portland cement clinker (PCC) (13), as raw material in the raw mix of cement (14–16) and in other binders materials (17–20).
The cement manufactures add between 3 and 6% gypsum depending on its purity to avoid flash (immediate) setting of cement, also affect strength development and volume stability in the cement (21–24). Gypsum is the most common cement set-ting retarder used in industry. Gypsum is mixtures of mainly calcium sulphate dihydrate, calcium sulphate hemydrate and calcium sulphate anhydrite, similar composition to phosphogypsum. A high hemihy-drate content result in false setting of cement, thus a maximum percentage of hemydrate is requires in gypsum sample (25).
It is well know that during the industrial produc-tion of cement hydrated calcium sulfates undergo partial dehydration at 110–130 °C in the cement mill forming hemihydrates CaSO4 0.5H2O and in some cases the total dehydrated, at 170–190 °C, form-ing anhydrite CaSO4 (26), so it is crucial to cement industry to know the temperature and the kinetic dehydration of different calcium sulphate forms to attempt to control the milling temperature and avoid the formation these damaging gypsum components during the industrial cement production.
So before to use phosphogypsum such as setting regulator it’s necessary to study dehydration reac-tion of PG in the direction to avoid the false setting by the production of hemihydrate and anhydrite during the milling process. The temperature and the kinetic dehydration of hydrated calcium sulfate could be influenced by different parameter such as origin sample, chemical composition and crystalline structure, (27, 28).
In this research was study the kinetic characteris-tics of PG dehydration via differential scanning cal-orimetry (DSC) in argon atmosphere. The objective of this study is to elucidate the reaction mechanisms and reaction kinetics of the dehydration of PG in a solid-state reaction. A kinetic model was proposed.
2. MATERIALS AND METHODS
2.1. Sample preparation and characterization
The PG samples used in this work came from Fertiberia factory of Bahía of Huelva (Spain) in 2009, named PGS and from Chemical Group (GZT) factory of Gulf of Gabès (Sfax, Tunisia) in 2009,

Thermal dehydration kinetics of phosphogypsum • 3
Materiales de Construcción 65 (319), July–September 2015, e061. ISSN-L: 0465-2746. doi: http://dx.doi.org/10.3989/mc.2015.07214
named PGT. In order to obtain a representative sample, the sampling was carried out in situ. 300 kg of each PG sample were mixed and homogenized in a mixer ENRICH, with 200 kg of capacity, then quartered successively up to obtain a representative sample of 1 kg, being subject of our experiments. After filtration and drying at 50 °C during 48 h, the chemical composition of PG, obtained by conven-tional methods, is listed in Table 1. The particles size was obtained by means of laser particle size analyzer Malvern Mastersize 2000 apparatus.
The diffractograms of PG samples were obtained using a X-ray diffractometer (Philips X’Pert PRO MPD) with Kα Cu radiation (40 mA current and 45 kV). The patterns of diffraction were obtained in a 2Θ scanning range from 5° to 80°, with 0.0167° and 0.6 s of scan step and time, respectively.
2.2. Thermal behavior of PG samples
PG samples were subjected to differential thermal and thermogravimetric analysis (DTA and TGA) in an inert atmosphere (argon). Setaram Sensys Evolution 1500 DTA/TGA analyzer was used to measure and record the sample mass change with temperature over the course of the dehydration reaction. Thermogravimetric curves were obtained at heating rate of 10 °C/min between ambient and 650 °C in argon atmosphere (20 ml/ min) and the sample mass was between 45 and 50 mg.
2.3. Kinetic study
The kinetic study of the dehydration of PG was performer with Differential Scanning Calorimetry (DSC) analysis. DSC experiments were performed
on a Setaram Model mod 3D-EVO. Non-isothermal analysis was carried out at four different heating rates (5, 10, 15, and 20 °C/min) between ambient and 350 °C. Temperature calibration was achieved by using the ICTAC-recommended DSC standards. The precision of reported temperatures was esti-mated to be ±2 °C. Sample mass was about 60 mg and was placed in a 175 µl Al crucible sealed. All the experiments were conducted in an inert atmosphere, argon with a flow rate of 20 ml/min.
The reproducibility of the experiments is accept-able and the experiments data presented in this paper corresponding to the different operating con-ditions are the mean values of runs carried out two or three times.
2.4. Theoretical consideration
Generally for PG degradation, it is assumed that the rates of conversion are proportional to the con-centration of reacted material. The rate of conver-sion can be expressed by the following basic rate equation [Eq. 2]:
α β α α= =ddt
ddT
k T f( ). ( ) [2]
Where α is the degree of conversion of reaction, f(α) and k(T ) are functions of conversion and tem-perature. In the DSC experiments, the Eq. [2] can be expressed by the following Eq. [3]:
α =d
dtdHdt Htotal
.1
∆ [3]
Where dHdt
is the heat flow above baseline and ∆Htotal
the peak area of the reaction, expressed in mJ.By combining Eqs. [2] and [3], the rate of conver-
sion can be written in form [4]:
α α= =ddt
dHdt Htotal
k T f.1
∆( ). ( ) [4]
k(T) the temperature dependence of the rate of heat flow, is often modelled successfully by the Arrhenius Eq. [5]:
= −
k T A
ERT
( ) exp [5]
Where E is the activation energy, A the pre- exponential factor and R is the gas constant.
By combining the Eqs. [4] and [5], the reaction rate can be written as follow [6]:
α α= −
ddt
AE
RTfexp . ( ) [6]
Table 1. Chemical composition of phosphogypsum samples
Content (wt. %) PGS PGT
SO3 50.3 44.7
CaO 34.8 30.1
SiO2 2.4 1.4
Total P2O5 0.9 1.2
Al2O3 0.4 0.1
Fe2O3 0.2 0.09
Na2O 0.1 0.6
K2O 0.03 0.01
MgO 0.04 0.02
Total F 3.8 4.9
Total Radionuclides (Bq/kg)a 2441 635
LOI 7.0 16.9
aTotal content of radionuclides (238U,234U,235U,226Ra,210Pb,210Po,40K and 232Th) (Tayibi et al. 2011) [3]

4 • F.A. López et al.
Materiales de Construcción 65 (319), July–September 2015, e061. ISSN-L: 0465-2746. doi: http://dx.doi.org/10.3989/mc.2015.07214
2.4.1. Friedman method (FR)
Friedman analysis (29), based on the Arrhenius equation, applies the logarithm of the conversion
rate αddt
as a function of the reciprocal temperature
at different degrees of the conversion α, according to Eq. [7]:
α α= −αddt
Aif i jEi
R Ti jln ln( ( , ))
. ,i [7]
With i is the index of conversion, j is the index of the curve and f(αi,j) the function dependent on the reaction model that is assumed to be constant for a given reaction progress αi,j for all curves j. As f(α) is constant at each conversion degree αi, the depen-dence of the logarithm of the reaction rate over
T1
is linear with the slope of ER T.
and the intercept A.
2.4.2. Flynn-Wall-Ozawa method (FWO)
The Flynn-Wall-Ozawa method (30, 31) is derived of integral isoconversional method. Using Doyle’s approximation (32) for the integral which allows
=
≈− −
pE
RTE
RTln ln 5.331 1.052 . The reaction rate
in logarithmic form is [8]:
βα
=
− −AERg
ER T
ln ln( )
5.331 1.0521 [8]
Where g(α) is the integral function of conversion. Thus, for α= constant, the plot ln β vs.
T1 , obtained
from thermograms recorded at several heating rates, should be a straight line whose slope can be used to evaluate the activation energy.
2.4.3. ASTM E698
The analysis according to ASTM E698 (33) is based on the assumption that the maximum (for example maximum of the DSC curve) of a single step reaction is reached at the same conversion degree independently of the heating rate. Although this assumption is only partly right, the resulting error is small. In this method, the logarithm of the heating rate is plotted over the reciprocal tem-perature of the maximum. The slope of the yielded straight line is proportional to the activation energy, just as in the Ozawa-Flynn-Wall analysis [9]:
T
AER T
ln ln1
ln(1 )β α
= + + − [9]
2.4.4. Coats-Redfern method
Coats-Redfern method (34) is also an integrated method and it involves the thermal degradation mechanism. Using an asymptotic approximation for the resolution of integral Eq. [10] (2RT/E<1), the following Eq. [11] can be obtained:
∫ ∫α αα β β
= = −
=
α
gd
fA E
RTdT
AER
pE
RT( )
( )exp
To
T
0
[10]
αβ
= −gT
ARE
ERT
ln( )
ln2 [11]
The method by Coats-Redfern is one of the most widely used procedures for the determination of the reaction processes. From Eq. [11], proposed by Coats and Redfern, the activation energy for all g(α) functions listed in Table 2 can be obtained at constant heating rate. Table 2 indicates the algebraic expressions of f(α) and g(α) for the used kinetic model.
3. RESULTS AND DISCUSSIONS
3.1. Phosphogypsum Characterization
Morphologically, both PG samples were yel-lowish brown color and relatively soft grains. The particle size of phosphogypsum were D50=53 µm and D50=83 µm for PGS and PGT, respectively. Chemically, the PG mainly consists of SO3, CaO with low contents of SiO2, Fe2O3, Al2O3 and P2O5 as well as traces of Na2O, K2O, TiO2, F and 12–22% ignition loss (LOI). In addition to radionuclides such as 226Ra, 210Pb, 238U and 40K, the chemical analysis of PG is reported in Table 1.
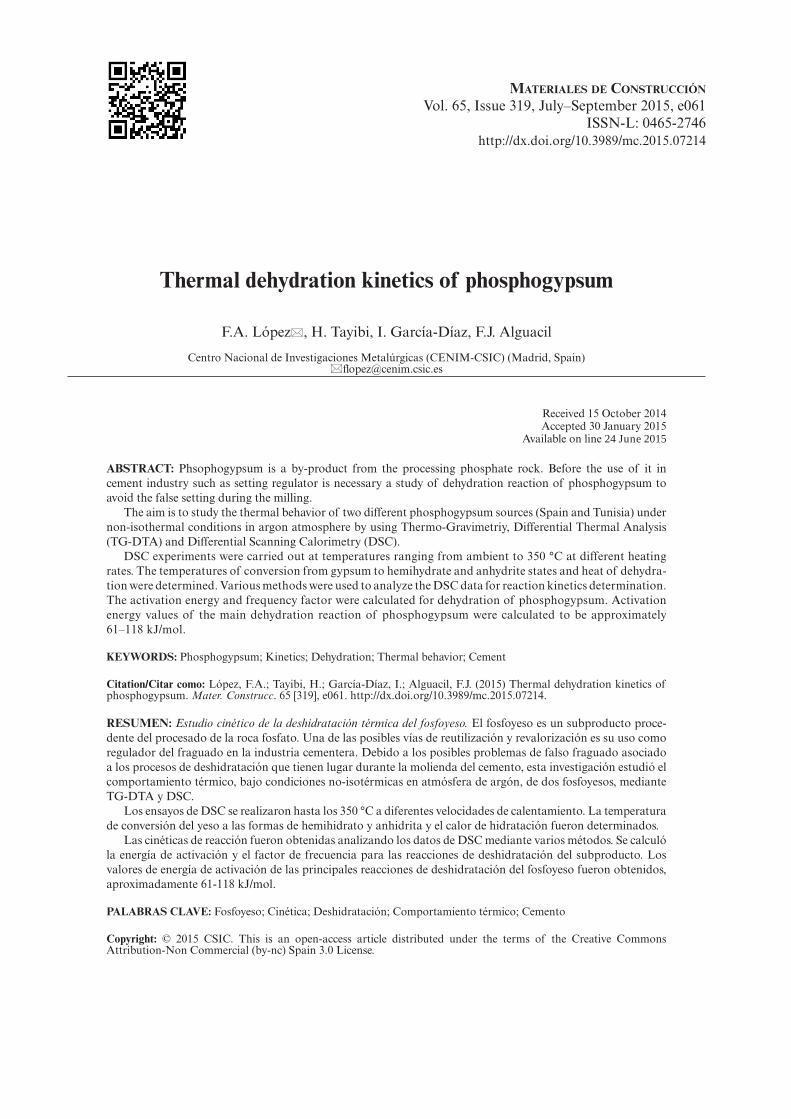
Figure 1 reports the powder X-ray diffraction pattern of PG samples. As shown, PGS presents two maximum intensity diffraction peaks corre-sponding to calcium sulfate dihydrate (CaSO4·2H2O) (JCPDS 74-1433), calcium sulfate hemihydrate (CaSO4·0.5H2O) (JCPDS 81-1848) and anhihidryte (CaSO4) (JCPDS 37-1496). The semi-quantification of the phases by the magnitude of the diffraction line intensity shows the presence of approximately 64% of CaSO4·2H2O; 33% CaSO4·0.5H2O and 3% of CaSO4. These ratios are in accordance with the percent-age of S and Ca obtained by the chemical analysis. The main diffraction peak of the PGT corresponds mainly to calcium sulfate dihydrate (CaSO4·2H2O) (JCPDS 74-1433). The gypsum content in the PGT is 94%, while the remainder is impurities.
The mineralogical composition of the PG depends strongly on its origin, the kind of acid phosphoric process used, environmental conditions of its stor-age and the age of the studied sample. Generally, PG could be composed by different ratios of three
Thermal dehydration kinetics of phosphogypsum • 5
Materiales de Construcción 65 (319), July–September 2015, e061. ISSN-L: 0465-2746. doi: http://dx.doi.org/10.3989/mc.2015.07214
mineralogical phases of calcium sulfate. For example, the presence of these three phases has been described by Ma et al. (2010) (35) in their study of the reac-tion mechanism and the kinetic of the decomposi-tion through a solid state by means of reaction with carbon, of a PG from Yunnan Gas and Chemical Engineering Company. Strydom et al. (1999) (36) establish for a PG from Omma Fertiliser’s plant in Rustenburg, ratios determined through XRD of 16% CaSO4 2H2O, 66% CaSO4 0.5H2O and 15% γ-CaSO4. López et al. (2011) (37), by studding a microencap-sulation of a PG from Huelva Bay found only the
presence of the gypsum and the hemihydrate phases and carbon. Cárdenas-Escudero et al. (2011) (38) reported that for a PG from the same zone, only the dihydrated phase was found.
3.2. Thermal behaviour of phosphogypsum
Figure 2 shows the curves of TG, DTG and DTA obtained from heating the studied PG samples at 10 °C/min in argon atmosphere and open crucible.
The curves show two consecutive and much closed endothermic peaks between 144 °C and 175 °C for PGS sample (Fig. 2a) and 156 °C and 191 °C for PGT sample (Fig. 2b). The proximity of both signals makes difficult the mass loss assignation, reported in the TG curves for each one of the effect area. In the studied temperature range, an exothermic peak appears at a maximum temperature of 433 °C in the PGS sample and 465 °C in PGT sample. In the case of the exothermic peak, no mass loss was observed. The Table 3 reported the characteristic temperatures for each peak and its associated mass loss.
The first endothermic peak observed in the DTA/DTG curves is attributed to the gypsum dehydra-tion reaction and the formation of the hemihydrate, according to the Eq. [12]. The second peak cor-responds to the transformation of hemihydrate to anhydrate, according to the Eq. [13]. At tempera-tures near 400 °C, a slightly exothermic reaction occurs, in which the molecular structure of the sol-uble crystal (anhydrite III) irreversibly reorganizes itself into a lower insoluble energy state (anhydrite II or β-CaSO4) (39–41) [Eq. 14]. On the TG curve, no loss has been noticed at this temperature.
Table 2. Algebraic expressions of functions of the most common reaction mechanisms
Mechanism f(α) g(α)
Autocatalytic (1- α)n. αm –
Avarani-Erofe’ve (A1.5) 1.5(1- α) [-ln(1- α)]1/3 [-ln(1- α)]1/3
Avarani-Erofe’ve (A2) 2(1- α) [-ln(1- α)]1/2 [-ln(1- α)]1/2
Avarani-Erofe’ve (An) n(1- α) [-ln(1- α)](1−1/n) [-ln(1- α)](1-1/n)
First-order (F1) (1- α) -ln(1- α)
Second-order (F2) (1- α)2 (1- α)-1-1
Third-order (F3) (1- α)3 [(1- α)-2-1]/2
Contracting sphere (R2) 2(1- α)1/2 [1- (1-α)1/2]
Contracting Cylinder (R3) 3(1- α)2/3 [1- (1-α)1/3]
Power law (P2) 2α1/2 α1/2
Power law (P3) 3α1/3 α1/3
Power law (P4) 4α1/4 α1/4
One-dimensional diffusion (D1) 1/2α α2
Two-dimensional diffusion (D2) [-ln(1- α)]−1 [(1- α).ln (1- α)]+αThree-dimensional diffusion (D3) 1.5[1-(1-α)(1/3)]−1(1-α)(2/3) [1-(1- α)1/3]2
Giustling-Brounsthein (D4) 1.5 [(1-α)(−1/3) -1]−1 1-(2α/3)-(1- α )2/3
Figure 1. XRD difractograms of PGT and PGS samples.

6 • F.A. López et al.
Materiales de Construcción 65 (319), July–September 2015, e061. ISSN-L: 0465-2746. doi: http://dx.doi.org/10.3989/mc.2015.07214
Figure 2. TG, DTG and DTA curves obtained by heating at 10 °C/min in inert atmosphere (argon): (a) PGS and (b) PGT samples.
Table 3. DTA and TGA results for thermal behavior of phosphogypsum
Peak
PGS PGT
DTA curve TG curve DTA curve TG curve
To (°C) Te (°C) Tp (°C)Interval
temperature (°C)Mass loss (wt, %) To (°C) Te (°C) Tp (°C)
Interval temperature (°C)
Mass loss (wt, %)
1 133 155 144 119–157 4.7 143 173 156 143–176 12.8
2 159 184 176 157–197 4.7 176 201 191 176–233 4.0
3 423 453 433 0 412 464 464 0
Total Mass Loss (40–650 °C)
– – – – 9.4 – – 16.8
(To = initial temperature, Te = final temperature and Tp = maximum temperature peak).

Thermal dehydration kinetics of phosphogypsum • 7
Materiales de Construcción 65 (319), July–September 2015, e061. ISSN-L: 0465-2746. doi: http://dx.doi.org/10.3989/mc.2015.07214
CaSO4 2H2O→CaSO4 0.5H2O+1.5H2O [12]
CaSO4 0.5H2O→γ-CaSO4 (or CaSO4III) +0.5H2O [13]
CaSO4III→CaSO4II [14]
The difference in DTG and DTA profiles, among two PG, indicates the influence of sample origin, chemical composition and traces on dehydration behavior (28). The most obvious discrepancy is the temperature, at which gypsum begins to dehydrate.
PGS begins to dehydrate at lowest temperature, while PGT dehydrate at highest temperature.
The TG curves analysis indicates that for the PGT sample, the mass loss observed between the ambient temperatures up to 500 °C is ≈17 wt%. This result is in accordance with the mass loss (LOI) obtained by the chemical analysis of the PG sam-ple (Table 1), being the 12.8 wt% for the first peak and 4 wt% for the second one. Thus the mass loss is done according to a 3:1 rate. The two “jumps” of a 3:1 mass loss in TG curves are in accordance with
Figure 3. The DSC curves obtained during the thermal dehydration at different heating rates (5, 10, 15 and 20 °C/min) up to 350 °C of the: (a) PGS sample and (b) PGT sample.

8 • F.A. López et al.
Materiales de Construcción 65 (319), July–September 2015, e061. ISSN-L: 0465-2746. doi: http://dx.doi.org/10.3989/mc.2015.07214
the stoichiometry of the dehydration reactions: Eqs. [12] and [13].
For PGS sample, the total mass loss correspond-ing to the hydration reaction is 9.4 wt%, being the 4.7 wt% for the first peak and 4.7 wt% for the second peak, which means a relation of ≈1:1. In this case, it should be noted that in the initial PGS sample coex-ist the dihydrate and hemihydrate phases, which explains the relation of the identified mass loss.
Most literature reported that gypsum dehydra-tion undergoes a two-step process, via hemihydrate (25, 28, 42–44), while some reports showed that γ-CaSO4 is directly produced during gypsum dehy-dration of γ-CaSO4 upon cooling with humidity air (45). Ball et al. (1969) (46) and Badens et al. (1998) (47) pointed out that both temperature and partial water pressure (PH2O) controlled the product of dehydration. Lou et al. (2011) (48) reported that under non-isothermal conditions and in two steps, via hemihydrate in “autogenous PH2O”, the dehy-dration of the gypsum contained in the “flue gas desulfurization gypsum (FGDG) occurs in one step (CaSO4 2H2O→γ-CaSO4), when the PH2O is negligible.
The dehydration behavior may vary significantly among different gypsum types, such as natural gyp-sum and many kinds of chemical gypsum. Differences in crystalline characteristics and impurities appear to be the most important factor resulting in discrepan-cies of dehydration behavior (27).
3.3. Kinetics
Figure 3 shows the DSC curves obtained during the thermal dehydration of both studied PG samples at different heating rates (5, 10, 15 and 20 K/min) up to 350 °C.
The CaSO4 2H2O reaction dehydration takes place into steps according to two endothermic peaks. The first peak is observed (depending on the heating rate) at Tp between 142 and 166 °C, for the PGS (Figure 3a) and between 151 and 163 °C for the PGT sample (Figure 3b). The second peak occurred at higher temperature, between 179 and 215 °C for the PGS sample and 186 and 207 °C for PGT sample. In both case and by increasing the heating rates, an increasing of the maximum of the degradation temperature is observed.
By considering the global dehydration reaction (step 1 and step 2), the Table 4 shows the maximums temperatures and the dehydration heat for each sample according to the heating rates. The dehydra-tion heat was calculated from the integration of the area of the two endothermic peaks. The medium dehydration heats are 240.5 J/g and 535.2 J/g for the PGS and PGT samples, respectively, in accordance with the total mass loss (see section 3.2).
The results of the DSC curves obtained at differ-ent heating rates were used to calculate the activa-tion energy of the dehydration reaction for the both PG samples. The activation energy was determined using Flynn-Wall-Ozawa (FWO), Friedman (FR) and ASTM E698 methods.
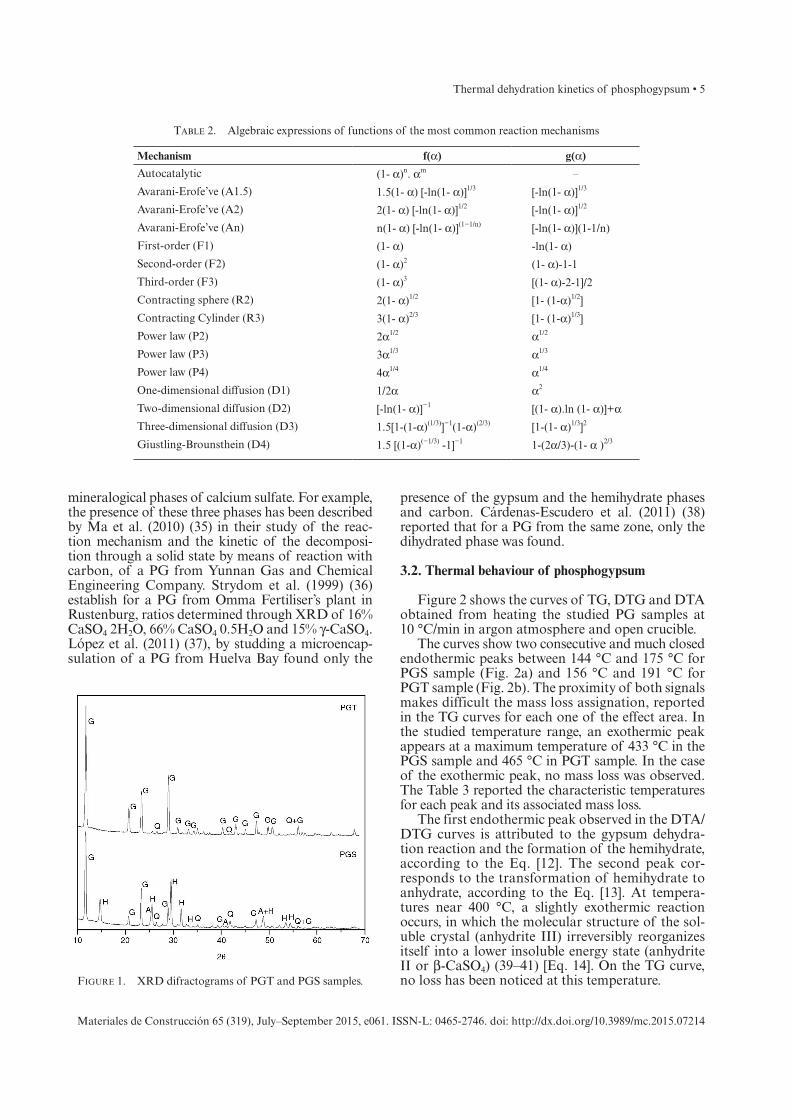
Firstly, the isoconversional Friedman method was used to calculate the activation energy for dif-ferent conversion values. The plot of the variation
of the ln ddtα
in function of 1/T, for a constant
f(α) at each conversion degree, αi, straight lines were obtained for each αi value for the slope (E/R), the activation energy value was obtained for each con-version degree αi (Figure 4).
The results of the activation energy for both PG samples are shown in Table 5 and 6. The means values
Table 4. DSC results for the dehydration of phosphogypsum at different heating values
PGS Peak 1 Peak 2 Peak 1 and Peak 2
Heating Rate (°C min−1) To (°C) Te (°C) Tp (°C) To (°C) Te (°C) Tp (°C) To (°C) Te (°C) Tp (°C) Heat (J/g)
5 123 153 143 153 187 179 120 188 179 249.0
10 136 172 156 180 217 203 134 217 201 237.3
15 141 179 161 187 222 208 139 228 207 248.9
20 147 188 166 194 243 215 187 244 213 235.4
Mean – – – – – – – – – 240.5±7.4
PGT Peak 1 Peak 2 Peak 1 and Peak 2
Heating Rate (°C min−1) To (°C) Te (°C) Tmax (°C) To (°C) Te (°C) Tmax (°C) To (°C) Te (°C) Tmax (°C) Heat (J/g)
5 139 164 151 169 192 186 139 166 152 509.2
10 145 180 158 186 212 202 145 213 159 543.2
15 150 188 163 193 217 207 148 221 163 552.0
20 150 188 163 193 217 207 151 229 167 536.4
Mean – – – – – – – – – 535.2±18.5
(To = initial temperature, Te = final temperature and Tp = maximum temperature peak)
Thermal dehydration kinetics of phosphogypsum • 9
Materiales de Construcción 65 (319), July–September 2015, e061. ISSN-L: 0465-2746. doi: http://dx.doi.org/10.3989/mc.2015.07214
of activation energy were 61.1 and 110.3 KJ/mol for PGS and PGT, respectively.
Secondly, FWO method is an integrated method, which is also independent of the degradation mech-anism. Eq. [7] was used and the activation energy of the PGS and PGT was obtained from plot log(β) against 1/T at a fixed conversion with the slope such a line being 1.052E/R (Figure 5).
The values of activation energy of PGS and PGT are summarized in Table 5 and 6, respectively. The means valued of activation energy were 62.4 KJ/mol for PGS and 107 KJ/mol for PGT.
Finally, ASTM E698 method based on the as -sumption that the maximum of the DSC curves of a reaction is reached at the same conversion degree
independent of the heating rate. The activation energy was obtained from plot of log(β) against 1/T with the slope of such a line being E/R. The values of the obtained activation energy of the both PG sam-ples are summarized in the Table 5 and 6. The values of activation energy were 67.9 and 128.4 KJ/mol, for PGS and PGT, respectively.
Table 7 shows activation energy calculated by Coats-Redfern method for PGS and PGT at con-stant heating rate of 10 K/min. It was found that thermal dehydration mechanism of PGS is likely to be of first-order F1 type, because this mechanism presents the activation energy (62.6 kJ/mol) simi-lar to the value obtained by FR isoconversional method (62.4 kJ/mol). It is clearly shows that the
Figure 4. Isoconversional Friedman results for: (a) PGS and (b) PGT samples.

10 • F.A. López et al.
Materiales de Construcción 65 (319), July–September 2015, e061. ISSN-L: 0465-2746. doi: http://dx.doi.org/10.3989/mc.2015.07214
mechanism for PGT dehydration is proposed to be three- dimensional diffusion (D3) type. The activation energy of this mechanism was around 117.9 kJ/mol, which was similar to activation energy obtained by FR isoconversional method (107 kJ/mol).
The values of the activation energy are similar when calculated using the FR and FWO methods,
while the ones obtained by the ASTM method are higher than the previous ones. Indeed, the ASTM method, using the results of TG curves, provides good kinetics results. However and in this case, it seems that using the results of the DSC curves, the results are very different to the ones obtained by the other calculation methods.
Table 5. Activation energies of PGS obtained by FWO, FR and EASTM E698 methods
FWO FR ASTM E698
α E (kJ/mol) α E (kJ/mol)Heating
Rate (°C/min)Temp.
Max. (°C)1000/T
(1000/K)
0.01 67.4 0.01 70.2 5 453.8 2.20
0.02 68.1 0.02 71.0 10 471.3 2.13
0.05 68.6 0.05 72.8 15 480.8 2.08
0.1 69.7 0.1 72.1 20 488.0 2.05
0.2 68.8 0.2 65.7 E (kJ/mol) 67.9
0.3 67.2 0.3 63.2
0.4 60.4 0.4 64.5
0.5 59.7 0.5 62.2
0.6 58.5 0.6 60.7
0.7 58.6 0.7 59.6
0.8 57.0 0.8 57.4
0.9 55.4 0.9 55.7
0.95 53.8 0.95 53.1
0.98 52.1 0.98 54.5
0.99 51.0 0.99 53.1
Mean 61.1 Mean 62.4
Standard deviation 6.6 Standard deviation 6.9
Table 6. Activation energies of PGT obtained by FWO, FR and EASTM E698 methods
FWO FR ASTM E698
α E (kJ/mol) α E (kJ/mol)Heating Rate
(°C/min)Temp. Max.
(°C)1000/T
(1000/K)
0.01 130.1 0.01 131.5 5 423.81 2.3595
0.02 127.7 0.02 113.0 10 430.78 2.3214
0.05 125.2 0.05 110.6 15 434.31 2.3025
0.1 123.5 0.1 110.0 20 437.66 2.2849
0.2 120.2 0.2 113.0 E (kJ/mol) 128.4
0.3 110.8 0.3 110.9
0.4 105.5 0.4 105.5
0.5 99.0 0.5 100.8
0.6 96.4 0.6 97.7
0.7 93.2 0.7 99.3
0.8 90.8 0.8 99.8
0.9 89.5 0.9 99.1
0.99 89.0 0.99 99.7
Mean 110.3 Mean 107.0
Standard deviation 15.8 Standard deviation 9.4

Thermal dehydration kinetics of phosphogypsum • 11
Materiales de Construcción 65 (319), July–September 2015, e061. ISSN-L: 0465-2746. doi: http://dx.doi.org/10.3989/mc.2015.07214
Thus the activation energy of the PG dehydra-tion reaction, calculated from the global reaction (setp 1 and setp 2) varies depending on the calcu-lation methods used between 61 and 63 kJ/mol for PGS sample and 107–118 kJ/mol for PGT samples.
The kinetics equations for PG dehydration is as follows [15], [16]:
α α= × −− ×ddt
e1.01 10 (1 ) for PGSRT0.5 62.61 10 /3 [15]
α αα
= × −− −
− ×ddt
e5.46 103(1 )
2(1 (1 ) )for PGTRT10 117.9 10 /
2/3
1/3
3 [16]
Figure 6 shows the changes in the activation energy calculated by means of the Friedman method,
according to the conversion degree for the global dehydration reaction of each studied PG sample.
It is clearly shows that the dehydration reaction takes place via a clearly two differentiated steps.
For PGS sample, the first step of the reaction occurs for 0.02≤α≤0.53, with an average value of acti-vation energy of 68±6 kJ/mol and the second step for 0.53≤α≤0.99 with an average value of activation energy of 51±2 kJ/mol.
For PGT sample, the first step of the reaction occurs for 0.02≤α≤0.74, with an average value of activation energy of 110±6 kJ/mol and the second step for 0.74≤α≤0.99 with an average value of acti-vation energy of 77±2 kJ/mol. In both PG samples, the first step of the reaction, corresponding to the formation of the hemihydrate, contributes most to activation energy of the global reaction of the
Figure 5. FWO plots of: (a) PGS and (b) PGT samples.

12 • F.A. López et al.
Materiales de Construcción 65 (319), July–September 2015, e061. ISSN-L: 0465-2746. doi: http://dx.doi.org/10.3989/mc.2015.07214
dehydration than the second step, transformation of hemihydrate to anhydrate.
In the literature, there is a number of studies on kinetics dehydration of gypsum (25, 27, 43–49). In general, all the studies of the CaSO4 2H2O dehydra-tion through DTA or DTG show the presence of two endothermic peaks. However, the dehydration temperatures have been quite varied. This difference
might be explained by the influence of nature as well as by the different origins of the samples. Although many studies about the decomposition of gypsum have been reported, we have not noticed any work about the kinetics of thermal dehydration of PG. The mechanisms involved in the dehydration of the PG are different from that of the natural gypsum, and some impurities in PG could influence the dehydration mechanism.
Comparing the experimental values of the acti-vation energy obtained in this work to others values reported in the literature, we noted that the PGT is composed exclusively of gypsum and presents an activation energy comparable to that obtained by Elbeyli et al. (2004) (50) (95–114 kJ/mol) in their study the kinetic decomposition in non-isothermal conditions of a borogypsum composed by CaSO4 2H2O. The values obtained in this work are also within the range of the values done by Lou et al. (2001) (48) when they study the kinetic dehydration of the flue gas desulphurisation phosphogypusm in variable conditions of partial water pressure (79–136 kJ/mol). Furthermore, Kontogeorgos and Founti (2012) (51) reported that the activation energy for the transformation of the calcium sul-fate dihydrate into soluble calcium sulfate anhydrite III can be assumed to take place in three stages: nucleation (α<0.1 and E≈144 kJ/mol), nuclei growth
Table 7. Activation energies, conversion factor and order of reaction of PGS and PGT obtained by Coats-Redfern method
Model
PGS PGT
A (s−1) E (kJ/mol) n A (s−1) E (kJ/mol) n
Auto catalytic 1.80×10 39.5 0.683 3.01×10³ 45.1 1.11
A1.5 2.49×10² 41.1 1.5 6.58×101 33.8 1.5
A2 1.14×101 30.3 2 9.82×10⁻¹ 19.1 2
An 3.20×10² 41.9 1.47 8.79×101 34.9 1.47
D1 1.24×10⁵ 68.2 – 9.24×10³ 55.9 –
D2 8.14×10⁶ 84.8 – 9.02×10⁶ 82.2 –
D3 1.04×10⁹ 106.6 – 5.64×10¹⁰ 117.9 –
D4 1.67×10⁷ 92.4 – 7.38×10⁷ 94.7 –
F1 1.01×10⁵ 62.6 1 2.49×10⁵ 63.3 1
F2 2.44×10¹⁰ 105.0 2 1.11×10¹⁴ 132.6 2
F3 5.91×10¹⁵ 147.5 3 4.97×10²² 202.0 3
Fn 1.55×10³ 48.3 0.663 1.4×10⁶ 69.3 1.09
P1 4.15×10⁻¹ 20.2 1 5.59×10⁻⁴ −61.0 1
P2 5.36×10⁻⁴ −3.9 2 9.71×10 −8 −37.1 2
P3 4.9×10⁵ −11.9 3 4.55×10⁻⁹ −47.5 3
P4 1.36×10⁻⁵ −15.9 4 9.06×10⁻¹⁰ −52.6 4
Pn 1.15×10⁻¹ 15.4 1.11 9.32×10⁻⁷ −29.2 1.59
R2 1.02×10² 41.4 2 5.9 28.6 2
R3 5.38×10² 48.5 3 1.09×10² 40.1 3
Rn 5.21×10² 48.3 2.97 −1.21×10⁵ 69.3 1.5
Figure 6. The activation energy calculated by means of the Friedman method, according to the conversion degree for
the global dehydration reaction of each PG sample.

Thermal dehydration kinetics of phosphogypsum • 13
Materiales de Construcción 65 (319), July–September 2015, e061. ISSN-L: 0465-2746. doi: http://dx.doi.org/10.3989/mc.2015.07214
(0.1<α<0.7 and E≈100 kJ/mol) and water molecule diffusion (α>0.7 and E≈83 kJ/mol).
The differences between these values and the values found in this paper could be attributed to the different origin of the raw material and/or the impurities.
4. CONCLUSIONS
Therefore the obtained results allow to know the phosphogypsum dehydration temperature. This allows to obtain an adequate desing of indrustrial milling system for the cement production.
Before the use of phosphogypsum in the cement production as setting regulator is necessary to do a thermal study to avoid the false setting by the production of hemihydrate and anhydrate phases.
The mineralogical composition of Spanish phos-phogypsum PGS was approximately of 64% of CaSO4·2H2O; 33% CaSO4·0.5H2O and 3% of CaSO4. The Tunisia phosphogypsum, PGT is only composed by a 94% of CaSO4·2H2O.
The thermal studies, DTG and DTA, show differ-ence in the dehydration temperature, due to the dif-ference in the origin sample, chemical composition. The dehydration of the PGS sample started at lowest temperature (133 °C) than PGT sample (143 °C).
The kinetics of the thermal dehydration of two PG sources (Spain and Tunisia) was accurately deter-mined through a series of experiments at four heating rates (5, 10, 15 and 20 K/min).
The activation energy was calculated by the iso-conversional methods (Friedman, Flyn-Wall-Ozawa and ASTM E986) without previous assumption regarding the conversion fulfilled by the reaction.
Finally, Coats-Redfern method were success-fully utilized to predict the reaction mechanism of thermal dehydration of PG. The dehydration reac-tion model of PGS can be described by “first-order” model, whereas that of PGT by “three-dimensional diffusion” model.
ACKNOWLEDGEMENTS
The authors are grateful to the Spanish National R&D&I Plan and FEDER (Project CTQ200802012/PPQ) for the financial support of this study. Dr. I. García-Díaz expresses her gratitude to the Ministry of Economy and Competitiveness for their Postdoctoral Junior Grants (Ref. FPDI-2013-16391) contracts co-financed by the European Social Fund.
REFERENCES
1. Pérez-López, R.; Nieto, J.M.; López-Coto, I; Aguado, J.L.; Bolivar, J.P.; Santisteban, M. (2010). Dynamics of con-taminants in phophogypsum or the fertilizer industry of Huelva (SW Spain): From phosphate rock ore to the envi-ronment. Appl. Geochem., 25 [5], 705–715. http://dx.doi.org/10.1016/j.apgeochem.2010.02.003.
2. Rutherford, P.M.; Dudas, M.J.; Samek, R.A. (1994) Envi-ronmental impacts of phosphogypsum. Sci. Tot. Environ. 149 [1, 2], 1–38. http://dx.doi.org/10.1016/0048-9697(94) 90002-7.
3. Tayibi, H.; Choura, M.; López, F.A.; Alguacil, F.J.; López-Delgado, A. (2009) Environmental impact and management of phosphogypsum. J. Environ. Manag. 90 [8], 2377–2386. http://dx.doi.org/10.1016/j.jenvman.2009.03.007.
4. Kuryatnyk, T.; Angulski da luz, C.; Ambroise, J.; Pera, J. (2008) Valorization of phosphogypsum as hydraulic binder. J. Hazard. Mat. 160 [2–3], 681–687. http://dx.doi.org/10.1016/j.jhazmat.2008.03.014.
5. Mas, J.L.; San Miguel, E.G.; Bolívar, J.P.; Vaca, F.; Pérez-Moreno, J.P. (2006) An assay on the effect of preliminary restoration tasks applied to a large TENORM wastes dis-posal in the South-West of Spain. Sci Tot. Environ. 364 [1–3], 55–66. http://dx.doi.org/10.1016/j.scitotenv.2005.11.006.
6. Papastefanou, C.; Stoulos, S.; Ioannidou, A.; Manolopoulou, M. (2006) The application of phosphogypsum in agricul-ture and the radiological impact. J. Environ. Radioact. 89 [2], 188–189. http://dx.doi.org/10.1016/j.jenvrad.2006. 05.005.
7. Garrido, F.; Illera, V.; García-Gonzalez, M.T. (2005) Effect of the addition of gypsum and lime rich industrial by-products on Cd, Cu and Pb availability and leachability in metal-spiked acid soils. Appl. Geochem. 20 [2], 397–408.http://dx.doi.org/10.1016/j.apgeochem.2004.08.001.
8. Abril, J.M.; García-Tenorio, R.; Periá-ez, R.; Enamorado, S.M.; Andreu, L.; Delgado, A. (2009) Occupational dosi-metric assessment (inhalation pathway) from the applica-tion of phosphogypsum in agriculture in South West Spain. J. Environ. Radioact. 100, 29–34. http://dx.doi.org/10.1016/j.jenvrad.2008.09.006.
9. Potgieter, J.H.; Potgieter, S.S.; McCrindle, R.I.; Strydom, C.A. (2003) An investigation into the effect of various chemical and physical treatments of a South African phosphogypsum to render a suitable as a set retarder for cement. Cem. Concr. Res. 33 [8], 1223–1227. http://dx.doi.org/10.1016/S0008-8846(03)00036-X.
10. Altun, I.A.; Sert, Y. (2004) Utilization of weathered phos-phogypsum as set retarder in Portland cement. Cem. Concr. Res. 34, 677–680. http://dx.doi.org/10.1016/j.cemconres. 2003.10.017.
11. Garg, M.; Jain, N.; Singh, M. (2009) Development of alfa plaster from phosphogypsum for cementitious materials. Constr. Build. Mater. 23 [10], 3138–3143. http://dx.doi.org/ 10.1016/j.conbuildmat.2009.06.024.
12. Garg, M.; Jain, N. (2010) Waste gypsum from intermediate dye industries for production of building materials. Constr. Build. Mater. 24 [9], 1632–1637. http://dx.doi.org/10.1016/j.conbuildmat.2010.02.029.
13. Kacimi, L.; Simon-Masseron, A.; Ghomari, A.; Derriche, Z. (2006) Reduction of clinkerization temperature by using phosphogypsum. J. Hazard. Mat. 137 [1], 129–13. http://dx.doi.org/10.1016/j.jhazmat.2005.12.053.
14. Elkhadiri, I.; Diouri, A.; Boukhari, A.; Puertas, F.; Vázquez, T. (2003) Obtaining a sulfoaluminate belite cement by indus-trial waste. Mater. Construcc. 53 [270], 57–69. http://dx.doi.org/10.3989/mc.2003.v53.i270.278.
15. El-Alfi, E.-S.A. (2004) Sulfoaluminate-belite cement from limestone, phosphogypsum and other waste product. Stud. Technol. 12, 928–935.
16. Karagöz Öztürk, A.; Oguz, H. (2004) The formation of alite phase by using phosphogypsum and oil shale. Cem. Concr. Res. 34 [11], 2079–2082. http://dx.doi.org/10.1016/j.cemconres.2004.03.013.
17. Taher, M.A. (2007) Influence of thermally treated phospho-gypsum on the properties of Portland slag cement. Resour. Conservat. Recycl. 52 [1], 28–38. http://dx.doi.org/10.1016/j.resconrec.2007.01.008.
18. Coruh, S.; Ergun, N.O. (2010) Use fly ash, phosphogypsum and red mud as a linear material for the disposal of haz-ardous zinc leach residue waste. J. Hazard. Mat. 173 [1–3], 468–473. http://dx.doi.org/10.1016/j.jhazmat.2009.08.108.
19. Shen, W.; Zhou, M.; Ma, W.; Hu, J.; Cai, Z. (2009) Investiga-tion on the application of steel slag-fly ash-phosphogypsum

14 • F.A. López et al.
Materiales de Construcción 65 (319), July–September 2015, e061. ISSN-L: 0465-2746. doi: http://dx.doi.org/10.3989/mc.2015.07214
solidified material as road base material. J. Hazard. Mat. 164 [1], 99–104. http://dx.doi.org/10.1016/j.jhazmat.2008.07.125.
20. Yang, J.; Liu, W.; Zhang, L.; Xiao, B. (2009) Preparation of load-bearing building materials from autoclaved phospho-gypsum. Constr. Build. Mat. 23 [2], 687–693. http://dx.doi.org/10.1016/j.conbuildmat.2008.02.011.
21. Lea’s, (1998) P.C. Hewlett (Ed.), Lea’s Chemistry of Cement and Concrete 4th ed. Arnold, London, 83–85.
22. Cruz, I.; Vázquez, T.; Fernandez-Pe-a, O. (1983) Sulfatos en el cemento Portland y su incidencia sobre el falso fraguado: Estado actual del conocimiento. Mater. Construcc. 192, 43–55. http://dx.doi.org/10.3989/mc.1983.v33.i192.967.
23. Taylor H.F.W.; Cement Chemistry, 2nd ed., Thomas Telford Publishing, (1997), 84. http://dx.doi.org/10.1680/cc.25929.
24. Mantell, D.G. (Ed.), PPC: The Manufacure, Properites and Applicatoins of Portland Cements, Cement Additives and Blended Cements 1991, PPC Johannesburg, pp. 13 and 14.
25. Strydom, C.A.; Hudson-Lamb, D.L.; Potgieter, J.H.; Dagg, E. (1995) The thermal dehydration of synthetic gypsum. Thermochim. Acta. 269/270, 631–638. http://dx.doi.org/10.1016/0040-6031(95)02521-9.
26. Papageorgiou, A.; Tzouvalas, G.; Tsimas, S.; (2005) Use of inorganic setting retarders in cement industry. Cem. Concr. Compos., 27 [2], 183–189. http://dx.doi.org/10.1016/j.cemconcomp.2004.02.005.
27. Charola, A.E.; Puhringer, J.; Steiger, M. (2007) Gypsum: a review of its role in the deterioration of building materi-als. Environ. Geol. 52 [2], 339–52. http://dx.doi.org/10.1007/s00254-006-0566-9.
28. Ballirano, P.; Melis, E. (2009) Thermal behaviour and kinet-ics of dehydration of gypsum in air from in situ real-time laboratory parallel beam X-ray powder diffraction. Phys. Chem. Mineral. 36 [7], 391–402. http://dx.doi.org/10.1007/s00269-008-0285-8.
29. Friedman, H. (1964) Kinetics of thermal degradation of char-forming plastics from thermogravimetry. Application to a phenolic plastic. J Polym Sci Part C. 6,183–195. http://dx.doi.org/10.1002/polc.5070060121.
30. Flynn, J.H.; Wall, L.A. (1966) A quick, direct method for the determination of activation energy from thermogravimetric data. Polym. Lett. 4 [5],323–328. http://dx.doi.org/10.1002/pol.1966.110040504.
31. Ozawa, T. (1965) A new method of analyzing thermogravi-metric data. Bull. Chem. Soc. Jpn. 38, 1881–1886. http://dx.doi.org/10.1246/bcsj.38.1881.
32. Doyle, C.D. (1961) Kinetic analysis of thermogravimetric data. J. Appl. Polym. Sci. 5 [15], 285–292. http://dx.doi.org/10.1002/app.1961.070051506.
33. Standard Test Method for Arrhenius Kinetic Constants for Thermally Unstable Materials Using Differential Scanning Calorimetry and the Flynn/Wall/Ozawa Method, American Society for Testing and Materials (ASTM) E698, 2011.
34. Coats, A.W.; Redfern, J.P. (1964) Kinetic parameters from thermogravimetric data. Nature. 201, 68–6. http://dx.doi.org/ 10.1038/201068a0.
35. Ma, L.; Ning, P.; Zheng, S.; Nui, X.; Zhang, W.; Du, Y. (2010) Reaction mechanism and kinetic analysis of the decom-position of phosphogypsum via solid-state reaction. Ind. Ing. Chem. Res. 49 [8], 3597–3602. http://dx.doi.org/10.1021/ ie901950y.
36. Strydom, C.A.; Potgieter, J.H. (1999) Dehydration behaviour of a natural gypsum and phosphogypsum during milling. Thermochim. Acta. 332 [1], 89–96. http://dx.doi.org/10.1016/S0040-6031(99)00083-0.
37. López, F.A.; Gázquez, M.; Alguacil, F.J.; Bolívar, J.P.; García-Díaz, I.; López-Coto, I. (2011) Microencapsulation of phosphogypsum into a sulfur polymer matrix: Physico-chemical and radiological characterization. J. Hazard. Mat. 192 [1], 234–245. http://dx.doi.org/10.1016/j.jhazmat.2011. 05.010.
38. Cárdenas-Escudero, C.; Morales-Flórez, V.; Pérez-López, R; Santos, A; Esquivias, L. (2011) Procedure to use phos-phogypsum industrial waste for mineral CO2 sequestration. J. Hazard. Mat. 196, 431–435. http://dx.doi.org/10.1016/j.jhazmat.2011.09.039.
39. Sebbahi, S.; Lemine, M.; Sahban, F.; Aride, J.; Benarafa, L.; Belkbir, L. (1997) Thermal behaviour of Moroccan phos-phogypsum. Thermochim. Acta. 302 [1–2], 69–75. http://dx.doi.org/10.1016/s0040-6031(97)00159-7.
40. Manzello, S.L.; Gann, R.G.; Kukuck, S.R.; Prasad, K., Jones, W. (2007) Fire performance of a non-load- bearing steel stud gypsum board wall assembly: experiments and modeling. Fire and Mat. 31, 297–310. http://dx.doi.org/ 10.1002/fam.939.
41. Deutsch, Y.; Nathan, Y.; Sarig, S. (1994) Thermogravimetric evaluation of the kinetics of the gypsum-hemihydrate- soluble anhydrite transition. J. Therm. Anal. Calorim. 42 [1], 159–174. http://dx.doi.org/10.1007/bf02546998.
42. Putnis, A.; Winkler, B.; Fernandez-Diaz, L. (1990) In situ IR spectroscopic and thermogravimetric study of the dehydra-tion of gypsum. Mineral Mag. 54, 123–138. http://dx.doi.org/10.1180/minmag.1990.054.374.14.
43. Dos Santos, V.A.; Pereira, J.A.F.R.; Dantas, C.C. (1997) Kinetics of thermal dehydration of gypsum ore for obtain-ing beta hemihydrate in a fluidized bed. Bull Soc. Chim. Belg. 6, 253–60.
44. Chang, H.; Huang, P.J.; Hou, S.C. (1999) Application of thermo-Raman spectroscopy to study dehydration of CaSO4_2H2O and CaSO4_0.5H2O. Mater. Chem. Phys. 58 [1], 12–9. http://dx.doi.org/10.1016/S0254-0584(98)00239-9.
45. Prasad, P.S.R.; Chaitanya, V.K.; Prasad, K.S.; Rao, D.N. (2005) Direct formation of the c-CaSO4 phase in dehydra-tion process of gypsum: in situ FTIR study. Am. Mineral. 90 [4], 672–678. http://dx.doi.org/10.2138/am.2005.1742.
46. Ball, M.; Norwood, L.S. (1969) Studies in the system calcium sulphate water. Part I. Kinetics of dehydration of calcium sulphate dehydrate. J. Chem. Soc. A. 1633–1637. http://dx.doi.org/10.1039/j19690001633.
47. Badens, E.; Llewellyn, P.; Fulconis, J.M.; Jourdan Veesler, C.S.; Boistelle, R. (1998) Study of gypsum dehydration by controlled transformation rate thermal analysis (CRTA). J. Solid State Chem. 139 [1], 37–44. http://dx.doi.org/10.1006/jssc.1998.7797.
48. Lou, W.; Guan, B.; Wu, Z. (2011) Dehydration behaviour of FGD gypsum by simultaneous TG and DSC analysis. J. Therm. Anal. Calorim. 104 [2], 661–669. http://dx.doi.org/10.1007/s10973-010-1100-6.
49. Hudson-Lamb, D.L.; Strydom, C.A.; Potgieter, J.H. (1996) The thermal dehydration of natural gypsum and pure cal-cium sulphate dehydrate (gypsum). Thermochim. Acta. 282/283 [SPEC. ISS.], 483–492. http://dx.doi.org/10.1016/ 0040-6031(95)02819-6.
50. Elbeyli, I.K.; Piskin, S. (2004) Kinetic study of the thermal dehydration of phosphogypsum. J. Hazard. Mater. 116 [1–2], 111–117. http://dx.doi.org/10.1016/j.jhazmat.2004.08.024.
51. Kontogeorgos, D.A.; Founti, M.A. (2012) Gypsum board reaction kinetics at elevated temperatures. Thermochim. Acta. 529 [10], 6–13. http://dx.doi.org/10.1016/j.tca.2011.11.014.