thermal modeling and experimental analysis of power transformer · pdf filetransformer’s...
TRANSCRIPT

International Journal of Scientific & Engineering Research, Volume 7, Issue 3, March-2016 1198 ISSN 2229-5518
IJSER © 2016 http://www.ijser.org
Thermal Modeling and Experimental Analysis of Power Transformer oils Insulation Level at varied operating
Temperature.
1C.O. Omeje, 2M.A. Ndubisi & 3C.N. Okpo Department of Electrical Engineering, University of Port Harcourt, Rivers State, Nigeria.1
Department of Electrical Engineering, Nnamdi Azikiwe University Anambra State, Nigeria2 Department of Electrical Engineering, Federal Polytechnic Unwana, Ebonyi State, Nigeria.3
Abstract: The incessant failure in the insulation level of power transformers has necessitated a veritable approach in determining factors that impede its life expectancy and its performance efficiency. The Hot Spot Temperature (HST) which is dependent on the ambient temperature has contributed significantly in per unit insulation life of the transformer. Basically, transformers are insulated using a standard insulating oil of high dielectric strength for high voltage applications. In this paper, thermal modeling and simulation of major deterministic factors such as: transformer’s oil viscosity, its specific heat capacity, thermal conductivity, acceleration factor, insulation life and coefficient of thermal expansion were carried out in MATLAB 7.11. A comparative test analysis was done in High Voltage laboratory on three different transformers oil samples using Megger OTS60AF kit to illustrate the interrelatedness in break down voltage and specific resistance of the oil as the operating temperature is varied. The laboratory test showed that Silicon oil exhibited perfect breakdown voltage characteristics over Naphtha and Paraffin oil within the same temperature variation with a breakdown voltage of 48.88Kv and specific resistance of 244.42e−16Ω/cm at optimum temperature of 700C as against 41.77Kv break down voltage, and specific resistance of 208.83e−16Ω/cm for Paraffin oil and 29.08Kv breakdown voltage with specific resistance value of 145.4e−16Ω/cm for Naphtha oil at the same 700C. Simulation results indicate that thermal conductivity of the oil decreased from 0.1360 Ws/Kg0C at 200C to 0.1315Ws/Kg0C at 700C whereas oil density correspondingly decreased from 972 Kg/m3 at 200C to 927 Kg/m3 at 700C Thermal power dissipated in watts also increased from 1478Watts at 200C to 1600Watts at 700C.
Key Words: Hot Spot Temperature, Breakdown Voltage, Aging Acceleration Factor, specific resistance, thermal conductivity and thermal dissipation.
—————————— ——————————
IJSER

International Journal of Scientific & Engineering Research, Volume 7, Issue 3, March-2016 1199 ISSN 2229-5518
IJSER © 2016 http://www.ijser.org
1.0 Introduction Power transformers are the main
components that constitute a large portion of
capital investment in voltage transmission
and distribution processes. When a power
transformer fails, a shut-down in the
operation of voltage transmission and
distribution is inevitable. This obviously
may result to the decrease in the reliability
of the electricity delivery to the consumer’s
load end in due time.
Transformer aging can be evaluated using
the Hot Spot Temperature (HST) and Top
Oil Temperature (TOT). An increase in TOT
and HST has the effect of reducing the
insulation level of the transformer oil [1].
Abnormal conditions such as overloading,
injection of non-sinusoidal loads
(Harmonics) or exposure of the transformer
oil to higher ambient temperature than
normal, can accelerate transformer ageing
and accordingly accelerate the time to end of
the transformers life span [2-3]. Aging or
deterioration of transformer insulation is a
time function of temperature, moisture
content and oxygen content. The moisture
and oxygen contributions to insulation
breakdown can be minimized with modern
oil preservation systems leaving insulation
temperature as the primary parameter [3].
The variation of power transformer loading
beyond its name plate rating in both normal
and emergency cases increase the
temperature inside the transformer tank and
may also cause a rapid thermal deterioration
of the insulation level [4]. Hence, to ensure
that power transformers in terminal stations
operate at full capacity without failures due
to temperature increase, a careful study of
their entire thermal behaviour is needed. In
reference [5], a model oriented to top oil
temperature was discussed but emphasis on
data requirement from design stage and data
from heat run tests of the transformer were
not inclusive. In [6] the change in
parameters of the thermal model when the
cooling system is controlled was presented
with no emphasis to experimental
investigation of the transformer oils
insulation level at varied temperature. The
concept applied in [7], considered the finite
element method in the determination of the
Hot Spot Temperature, insulation level of
the transformer in terms of its winding
temperature and power losses. Though
reference [7] was too analytical but
emphasis on practical determination of the
various oils insulation level in terms of their
break down voltages and specific resistance
values at varied temperature was not
reflected. This paper, therefore, presents an
accurate method on how to determine
IJSER

International Journal of Scientific & Engineering Research, Volume 7, Issue 3, March-2016 1200 ISSN 2229-5518
IJSER © 2016 http://www.ijser.org
transformer’s oil viscosity, specific heat of
the oil, thermal conductivity, acceleration
factor, insulation life and coefficient of
thermal expansion of three selected
transformer oils at varied operating
temperature. It also showed the laboratory
evaluation of the three oil insulation level in
terms of their breakdown voltages as their
temperature values vary when subjected to
high d.c voltage (80kV) within a gap of
2.5mm between two oil test pots.
Crescent O. Omeje is a lecturer in Electrical
Engineering University of Port Harcourt,
Rivers State, Nigeria. He obtained his
B.Eng and M.Eng all in Electrical
Engineering from University of Nigeria
Nsukka in 2004 and 2011 respectively. He
is currently a Ph.D student. His research
interests are on Power Electronics and
Electrical Machine Drives and Control.
Email: [email protected]
Mary A. Ndubisi obtained her B.Eng and
M.Eng all in Electrical Engineering from
Enugu State University of Science and
Technology. She is a Ph.D student in
Nnamdi Azikiwe University Awka in
Anambra State, Nigeria. She has a wealth
of experience in power system transmission
and distribution. Her Research interest is
on Transmission Congestion Management.
Charles N. Okpo obtained his B.Eng in
Electrical Engineering from University of
Port Harcourt, Rivers State, Nigeria. He is
a Technologist in the department of
Electrical Engineering, Akanu-Ibiam
Federal Polytechnic Unwana, Ebonyi
State, Nigeria. He is well versed in high
voltage power equipment insulation testing.
E-mail: [email protected]
2.0 Thermal Modeling of Power
Transformer.
When a transformer is energized and loaded
at ambient temperature θa, dissipation
caused by core losses, winding losses, stray
losses in the tank and metal support
structures are the major sources of heat
which can cause a rise in the transformer oil
and winding temperature. This rise in
transformer oil usually is cooled by the
radiator assembly. Hot spot temperature
usually is the sum of ambient temperature,
top oil temperature rise and the
corresponding bottom oil temperature
gradient [8]. Hot spot temperature real value
is usually imprecise in realization since
transient and thermal processes of the
transformer are always too complicated.
Simple mathematical models with
simulations can present a more precise
result. The IEEE guide for loading mineral
IJSER

International Journal of Scientific & Engineering Research, Volume 7, Issue 3, March-2016 1201 ISSN 2229-5518
IJSER © 2016 http://www.ijser.org
oil immersed transformer as presented in [9]
indicates how oil immersed transformers can
be operated in different ambient temperature
conditions and load levels without
exceeding the acceptable deterioration limit
of insulation due to thermal effects.
According to the loading guides, the Hot
Spot Temperature in a transformer winding
consists of three components: the ambient
temperature rise, the top oil temperature and
the Hot Spot Temperature rise over the top
oil temperature as shown in figure 1.0
Figure 1.0 Thermal Diagram for oil
temperature distribution within the
transformer tank.
During a transient period of operation, the
Hot Spot Temperature rise over the top oil
temperature varies instantaneously with
transformer loading and independently of
the time [10]. The variation of the top oil
temperature is usually expressed by an
exponential equation which is based on a
time constant (oil time constant). The
diagram in figure 1.0 is based on the
underlying assumptions:
The change in the oil temperature
inside and along the winding is
linearly increasing from bottom to
top.
The increase in the winding
temperature from bottom to top is
linear with a constant temperature
difference of “g”.
At the top of the winding, Hot-Spot-
Temperature HST is always higher
than the average temperature rise of
the winding. The difference in the
temperature value is defined by H.g
where H is a Hot Spot Factor which
varies from 1.1 to 1.5 depending on
short circuit impedance, winding
design and transformer size.
Basically, two types of transformer oil exist
which include the mineral oil and the
vegetable oil. Synthetic oil which combines
the characteristics of the vegetable oil and
mineral oil has been developed as silicon.
The major mineral oils discussed in this
paper are the Paraffin based mineral oil,
Naphtha based mineral oil and Silicon. They
differ in physical, chemical and electrical
properties albeit being refined from the same
crude product. The vegetable oil which is a
IJSER

International Journal of Scientific & Engineering Research, Volume 7, Issue 3, March-2016 1202 ISSN 2229-5518
IJSER © 2016 http://www.ijser.org
natural ester is produced from natural animal
and plant material. It is also a good
transformer oil though has the disadvantage
of forming wax and biodegradable clogs at
temperature below room temperature [11].
Naphtha based mineral oil though is more
easily oxidized, the oxidation product or
sludge is soluble and is not precipitated in
the bottom of the transformer, hence does
not obstruct conventional circulation of the
oil. The paraffin based mineral oil has lower
oxidation rate but the oxidation product
(sludge) is insoluble and precipitate at the
bottom of the tank. It obstructs the
transformer cooling system due to poor
conventional circulation of the oil.
3.0 Dynamics of Thermal Modeling of
Power Transformer
The degree to which any electrical device
can withstand impulse voltage before a
break down occurs is an important
parameter in the choice of insulating liquids.
The dielectric strength of an insulating fluid
or transformer oil depends on the shape of
the electrodes and the distance of separation
of the electrode pairs. The wider the gap, the
higher the breakdown voltage since
𝑉 = 𝑄𝐶
(1)
𝐶 = 𝜀𝑟𝜀0𝐴𝑑 (2)
The minimum permissible breakdown
voltage of the transformer oil for an ideal
medium voltage transformer should fall
within the range of 25kV for 11kV and
33kV distribution voltages for most power
equipment [11]. The specific resistance of
transformer oil is a measure of direct current
resistance between two opposite sides of the
terminal for a unit volume of transformer
oil. The rapid increase in temperature of
transformer oil decreases the resistivity
value of the oil. Thus, resistivity value of the
insulating oil is usually high at room
temperature in accordance with thermal and
electrical processes as briefly reviewed in
[12]. The minimum standard value for
specific resistance of transformer oil at room
temperature of 250C to 270C is usually
1500 × 1015Ω/𝑐𝑚3 at a breakdown voltage
value of 30kV and 35 × 1015Ω/𝑐𝑚3for a
temperature of 700C to 900C for Hot Spot
Zones. By proportion, at the same room
temperature, 1kV breakdown voltage will
result to 5 × 10¹⁶Ω/𝑐𝑚3 value. This
specific resistance value of 5 × 10¹⁶Ω/𝑐𝑚3
for 1kV breakdown voltage was applied in
realizing the various values of the three oil
specific resistance as their breakdown
voltage values change with a corresponding
change in temperature.
IJSER

International Journal of Scientific & Engineering Research, Volume 7, Issue 3, March-2016 1203 ISSN 2229-5518
IJSER © 2016 http://www.ijser.org
The IEEE loading guide shows that
insulation life is an exponential function of
Hot Spot Temperature [13]. Thus, the
percentage value of insulation life is
expressed in (3).
% Insulation life
= AeB
θh +273 × 100 (3)
𝜃ℎ is the Hot Spot Temperature in 0C. A and
B are constants that are determined based on
the insulation material. The above
expression can be used for both distribution
and power transformer since both are
manufactured from same cellulose insulation
material. Per unit insulation life and aging
acceleration factor with temperature are
represented by (4) and (5).
Per Unit Insulation Life
= 9.8
× 10−18e15000
θh +273 (4)
Aging Acceleration Factor FAA
= e15000
θamb. +273 − 15000θh +273 (5)
Where: θamb. is the ambient temperature or
Top Oil Temperature in 0C. The thermal
power dissipated to the atmosphere in a unit
time is given by (6).
𝑃𝑇𝐻
= 𝐶𝑜𝑖𝑙 × 𝜌𝑜𝑖𝑙 × ѱ𝑜𝑖𝑙× (𝜃ℎ − 𝜃𝑎𝑚𝑏) (6)
Where: ѱ𝑜𝑖𝑙 = the oil flow rate in m3/s.
𝐶𝑜𝑖𝑙 = Specific heat of the oil in Ws/Kg 0C.
𝜌𝑜𝑖𝑙 = the density of the oil in Kg/m3
The transformer oil viscosity which is
synonymous with (3) is modified and
presented in (7).
𝜇 = 𝐴1 × eA2
θoil +273 (7)
𝐶𝑜𝑖𝑙 = 𝐴3 + 𝐴4𝜃𝑜𝑖𝑙 (8)
𝜌𝑜𝑖𝑙 = 𝐴5 + 𝐴6𝜃𝑜𝑖𝑙 (9)
𝐾 = 𝐴7 + 𝐴8𝜃𝑜𝑖𝑙 (10)
𝛽 = 𝐴9 (11)
Where K = thermal conductivity and
µ = the oil viscosity.
The constants in (7)-(11) as stated in
references [14]-[15] are presented in table
1.0.
Table 1. Insulation oil constants for Mineral
oil and refined Silicone [14]-[15].
Oil constant Mineral oil Silicone
A1 0.13573 × 10⁻⁵ 0.12127 × 10⁻³
A2 2797.3 1782.3
A3 1960 1424
A4 4.005 2.513
A5 887 989
A6 -0.659 -0.8700
A7 0.124 0.138
A8 −1.525 × 10⁻⁴ −9.621 × 10⁻⁵
A9 8.6 × 10⁻⁴ 9.5 × 10⁻⁴
IJSER

International Journal of Scientific & Engineering Research, Volume 7, Issue 3, March-2016 1204 ISSN 2229-5518
IJSER © 2016 http://www.ijser.org
4.0 Experimental Procedure and
Simulation Results
The test kit shown in figure 2 produced by
Megger and IEC 60256 standard was
applied in the experiment. The steps adopted
in the experimental work are as illustrated:
The oil sample was poured into a
cleaned vessel containing a pair of
electrodes fixed at a gap of 2.5mm
between the two electrodes
The applied voltage between the
electrodes was slowly increased to
80kV
The rate of rise in voltage was kept
at 2kV/s and observed closely with
time.
Readings/data were taken at the
exact moment sparking occurred
between the electrodes.
The experiment was carried out for
temperature values ranging from
200C to 700C.
The experiment was repeated six
times for each temperature value in
accordance with the IEC 60156
standard. Figures 12-15 represent the
laboratory results obtained.
The mean value of the three oil
samples in kV was calculated for
their break down voltage and
specific resistance at different
operating temperature as shown in
tables 2-4.
Table 2. Break down Voltage and Specific
Resistance of Paraffin oil at varied
temperature.
Temperature (0C)
Break down Voltage
(kV)
Specific Resistance
Ω/cm3 20 13.37 66.83 × 10¹⁶ 30 14.18 70.92 × 10¹⁶ 40 20.22 101.10 × 10¹⁶ 50 52.02 260.10 × 10¹⁶ 60 50.28 251.42 × 10¹⁶ 70 41.77 208.83 × 10¹⁶
Table 3. Break down Voltage and Specific
Resistance of Naphtha oil at varied
temperature.
Temperature (0C)
Break down Voltage
(kV)
Specific Resistance
Ω/cm3 20 30.10 150.50 × 10¹⁶ 30 35.03 175.20 × 10¹⁶ 40 37.23 186.20 × 10¹⁶ 50 56.47 282.30 × 10¹⁶ 60 36.37 181.80 × 10¹⁶ 70 29.08 141.40 × 10¹⁶
Table 4. Break down Voltage and Specific
Resistance of Silicon oil at varied
temperature.
Temperature (0C)
Break down Voltage
(kV)
Specific Resistance
Ω/cm3 20 27.70 138.50 × 10¹⁶ 30 34.22 171.10 × 10¹⁶ 40 55.58 277.90 × 10¹⁶ 50 54.83 274.17 × 10¹⁶ 60 52.37 261.83 × 10¹⁶ 70 48.88 244.42 × 10¹⁶
IJSER

International Journal of Scientific & Engineering Research, Volume 7, Issue 3, March-2016 1205 ISSN 2229-5518
IJSER © 2016 http://www.ijser.org
Simulation was carried out using the data
presented in tables 2- 4 to determine the
optimal performance of the three oil samples
with pertinent to transformer’s oil viscosity,
specific heat of the oil, thermal conductivity,
acceleration factor, insulation life and
thermal power dissipation.
In Table 2 and Figure 3, it can be observed
that the best operating temperature for
paraffin oil ranged from 200C to 500C after
which an exponential fall in the breakdown
voltage was detected. At a value below the
room temperature, a low breakdown voltage
magnitude occurred. This obviously can lead
to a flashover at the transformer core during
a high voltage application which can also
give rise to the formation of sludge. The rise
in the value of the specific resistance within
the transition period in temperature from
500C to 700C as evidently presented in table
2 indicates that breakdown voltage
proportionately rises with increase in the
value of the specific resistance of the
transformer oil.
Table 3 and Figure 4 indicated that when a
Naphtha based mineral oil was subjected to
the same condition as the paraffin oil, the
best operating temperature was detected to
occur at 500C with an optimum breakdown
voltage of 56.47kV which corresponds to a
specific resistance value of 282.3 ×
1016Ω/𝑐𝑚3 which is comparatively higher
than the value of the paraffin oil. Naphtha
oil therefore has a better viscosity, pour
point at a lower temperature and a good
dielectric strength than the paraffin oil.
In Table 4 and Figure 5, there is a total shift
from the results obtained from Naphtha and
paraffin oil, the best operating temperature
ranged from 200C to 400C. The peak
breakdown voltage of 55.58kV was
achieved at 400C with a specific resistance
value of 277.90 × 10¹⁶Ω/𝑐𝑚3 as shown in
table 4. A display of relative voltage
stability within temperature ranges of 500C
to 700C was obtained which distinguished it
from the two other mineral oils that showed
various instability in their breakdown
voltage values for the same temperature
range. Silicon oil therefore offers a better
thermal stability than other mineral oil
reviewed. It works well for both cold and
extreme temperature condition. Its high
viscosity contributes to its poor heat
transfer.
In Figures 6 and 7, the per unit insulation
life and the viscosity of silicon decreases
proportionately with increase in the load
temperature whereas Figures 8 and 9, the
aging acceleration factor and the specific
heat capacity of the oil increases
appropriately with increase in load
IJSER

International Journal of Scientific & Engineering Research, Volume 7, Issue 3, March-2016 1206 ISSN 2229-5518
IJSER © 2016 http://www.ijser.org
temperature which is in conformity with the
already established rule on transformer
loading guide. At a room temperature range
of 200C-300C, the acceleration factor had a
zero value and increased from 350C to 0.015
at optimum temperature of 700C. In Figures
10 and 11, the inverse relation in density and
thermal conductivity with temperature
indicates that high temperature reduces the
dielectric strength of the oil which
invariably decreases the thermal
conductivity from 0.1360Ws/Kg0C at 200C
to 0.1315Ws/Kg0C at 700C. The density of
the oil also falls sharply from 972Kg/m3 at
ambient temperature of 200C to 927Kg/m3 at
700C rise.
In Figure 12, the thermal power dissipated in
watts rose from 1478watts at 200C to
1600watts at 700C which proved that higher
temperature reduces the breakdown voltage
of the transformer and also increases the rate
of power dissipation on loading.
Figure 2: Test Kits with spherical electrode
(OTS 60AF)
Figure 3: Breakdown Voltage of Paraffin
against Temperature.
Figure 4: Breakdown Voltage of Naphtha
against Temperature.
20 25 30 35 40 45 50 55 60 65 7010
15
20
25
30
35
40
45
50
55A plot of Break Down Voltage against Temperature for Paraffin OIL
Temperature(degree-celsius)
Brea
k dow
n Volt
age(V
olts)
20 25 30 35 40 45 50 55 60 65 7025
30
35
40
45
50
55
60A plot of Break Down Voltage against Temperature for Naphtha OIL
Temperature(degree-celsius)
Brea
k do
wn V
oltag
e(Vo
lts)
IJSER

International Journal of Scientific & Engineering Research, Volume 7, Issue 3, March-2016 1207 ISSN 2229-5518
IJSER © 2016 http://www.ijser.org
Figure 5: Breakdown Voltage of Silicon against Temperature.
Figure 6: Per Unit Insulation of Silicon against
Temperature.
Figure 7: A Plot of Viscosity of Silicon against Temperature.
Figure 8: Plot of acceleration factor of Silicon
against Temperature.
Figure 9: A Plot of Specific heat of Silicon against Temperature.
Figure 10: A Plot of Density of Silicon against
Temperature.
Figure 11: A Plot of Thermal conductivity against Temperature.
Figure 12: A Plot of Power Dissipation against Temperature.
20 25 30 35 40 45 50 55 60 65 7025
30
35
40
45
50
55
60A plot of Break Down Voltage against Temperature for Silicon OIL
Temperature(degree-celsius)
Break
down
Volta
ge(Vo
lts)
20 25 30 35 40 45 50 55 60 65 700
2
4
6
8
10
12
14
16
18x 10
4 Per unit insulation life against Temperature for SILICON OIL
Temperature(degree-celsius)
Per-u
nit In
sulat
ion lif
e
20 25 30 35 40 45 50 55 60 65 705.145
5.15
5.155
5.16
5.165
5.17
5.175
5.18A plot of Insulation life (Viscosity) against Temperature for SILICON OIL
Temperature(degree-celsius)
Insula
tion l
ife
20 25 30 35 40 45 50 55 60 65 700
0.002
0.004
0.006
0.008
0.01
0.012A plot of Aging Acceleration Factor against Temperature for SILICON OIL
Temperature(degree-celsius)
Acce
lerati
on Fa
ctor
20 25 30 35 40 45 50 55 60 65 701460
1480
1500
1520
1540
1560
1580
1600A plot of Specific heat capacity against Temperature for SILICON OIL
Temperature(degree-celsius)
Heat
capa
city i
n Ws/K
g-deg
ree ce
lsius
20 25 30 35 40 45 50 55 60 65 70925
930
935
940
945
950
955
960
965
970
975A plot of oil Density against Temperature for SILICON OIL
Temperature(degree-celsius)
Dens
ity in
Kg/V
olume
20 25 30 35 40 45 50 55 60 65 700.131
0.132
0.133
0.134
0.135
0.136
0.137
0.138A plot of Thermal Conductivity against Temperature for SILICON OIL
Temperature(degree-celsius)
Therm
al Co
nduc
t.(Ws/K
g-deg
ree ce
lsius)
20 25 30 35 40 45 50 55 60 65 701460
1480
1500
1520
1540
1560
1580
1600A plot of Thermal power dissipated in Watts against Temperature for SILICON OIL
Temperature(degree-celsius)
Therm
al Po
wer D
issipa
ted in
Watt
s
IJSER

International Journal of Scientific & Engineering Research, Volume 7, Issue 3, March-2016 1208 ISSN 2229-5518
IJSER © 2016 http://www.ijser.org
200C Test Result for Silicon oil
200C Test Result for Paraffin oil
200C Test Result for Naphtha oil
Figure 12: Laboratory Test Results of Silicon, Paraffin and Naphtha oil break down voltage
at 200C
300C Test Result for Silicon oil
300C Test Result for Paraffin oil
300C Test Result for Naphtha oil
Figure 13: Laboratory Test Results of Silicon, Paraffin and Naphtha oil break down voltage
at 300C
IJSER

International Journal of Scientific & Engineering Research, Volume 7, Issue 3, March-2016 1209 ISSN 2229-5518
IJSER © 2016 http://www.ijser.org
400C Test Result For Silicon oil
400C Test Result for Paraffin oil
400C Test Result for Naphtha oil
Figure 14: Laboratory Test Result of Silicon, Paraffin and Naphtha oil break down voltage
at 400C
500C Test Result for Silicon oil
500C Test Result for Paraffin oil
500C Test Result for Naphtha
Figure 15: Laboratory Test Result of Silicon, Paraffin and Naphtha oil break down voltage
at 500C
IJSER
International Journal of Scientific & Engineering Research, Volume 7, Issue 3, March-2016 1210 ISSN 2229-5518
IJSER © 2016 http://www.ijser.org
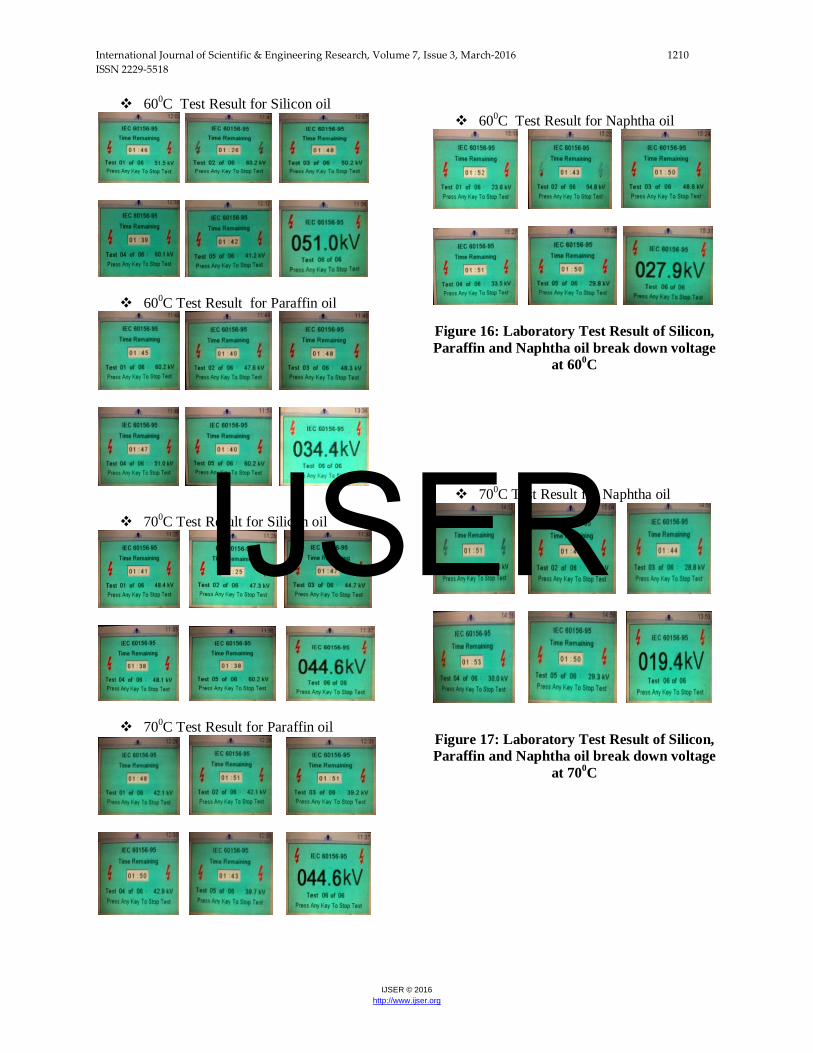
600C Test Result for Silicon oil
600C Test Result for Paraffin oil
600C Test Result for Naphtha oil
Figure 16: Laboratory Test Result of Silicon, Paraffin and Naphtha oil break down voltage
at 600C
700C Test Result for Silicon oil
700C Test Result for Paraffin oil
700C Test Result for Naphtha oil
Figure 17: Laboratory Test Result of Silicon, Paraffin and Naphtha oil break down voltage
at 700C
IJSER
International Journal of Scientific & Engineering Research, Volume 7, Issue 3, March-2016 1211 ISSN 2229-5518
IJSER © 2016 http://www.ijser.org
5.0 Conclusion:
This paper analyzed the thermal model of
three transformer oils and experimentally
assessed the breakdown voltage of the three
oil samples. A detailed simulation results
presented showed that the thermal
conductivity and the density of the oil
samples decreased as the loading
temperature increased. The acceleration
factor with the specific heat capacity and the
thermal power dissipation increased
proportionately with the applied
temperature. The laboratory test results
proved that silicon oil exhibited a perfect
breakdown voltage over Paraffin and
Naphtha oil thus is recommended for its
good dielectric strength. Silicon oil is best
used in both warm and cold climates since
tests conducted on it at varying temperatures
indicates that its breakdown voltage at given
temperature falls within the specified value
for 11kV and 33kV distribution voltage.
IJSER

International Journal of Scientific & Engineering Research, Volume 7, Issue 3, March-2016 1212 ISSN 2229-5518
IJSER © 2016 http://www.ijser.org
[1] A.C. Chakraborti, B. Akik, R. Sudia, “Analysis of Power Transformer Insulation Design
Using FEM Tathagat”. International Journal of Soft Computing and Engineering. Vol.2,
issues 3. pp. 3-6, July 2012.
[2] G. Swift, T.S. Molinski, and W. Lehn, “A Fundamental Approach to Transformer Thermal
Modeling-Part 1: Theory and equivalent Circuit, IEEE Trans. Power Deliv. Vol. 16, No.2,
April 2001, pp. 171-175.
[3] D. Susa, M. Lehtonen, and H. Nordman, “Dynamic Thermal Modeling of Power
Transformers, IEEE Trans. Power Deliv. Vol. 20, No.1 January 2005, pp. 197-204.
[4] M. Watter, The Short Circuit Strength of Power Transformer 2nd edition, Mac Donald and
Co. Publishers Ltd London, U.K. 2006.
[5] L. Jauregui, M. Rivera, and D.J. Tylavsky, “Acceptability of four transformers Top-oil
Thermal Models Part 2: Comparing Metrics, IEEE Trans. Power Del., Vol. 23, No.2 April
2008, pp. 866-872.
[6] Z. Radakovic, K. Feser, “A New Method for the Calculation of the Hot-Spot Temperature in
Power Transformer with ONAN cooling”. IEEE Trans. Power Deliv. 2003; 18 (4): 1284-
1292.
[7] Z. Radakovic, U. Radoman, P. Kostic, “Decomposition of the Hot-Spot-Factor”. IEEE
Trans. Power Del. 2015; 30 (1): 403-411.
[8] T.K. Saha, P. Purkait, “Investigation of Temperature Effects on the Dielectric Response
Measurements of Transformer oil Paper Insulation System, IEEE Trans. on Power Deliv.
Vol.23, No.1, 2008, pp. 252-260.
[9] A.A. Oluwaseun, J. Daniel, G.A. Tylavsky, and A.K. Wesley, “Acceptability of Three
Transformer Hottest Spot Temperature Models, IEEE Trans. Power Deliv. Vol. 27, No.1, Jan.
2012, pp. 13-22.
[10] J.Q. Feng, P. Sun, W.H. Tang, D.P. Buse, Q.H. Wu, Z. Richardson, and J. Fitch,
“Implementation of A Power Transformer Temperature Monitoring System”. International
Conference on Power System Technology”, 2002, Proceedings on Power Conversion
System. Vol. 3, Oct. 13-17, 2002. pp. 1980-1983.
[11] O. Swarm, and H. Sentiko, “Effect of Temperature on the Breakdown Voltage and Partial
discharge pattern of Biodegradable oil”. International Conference on Electrical Engineering
and Informatics Vol.5, Sept. 10-11, 2011, pp. 2-4.
IJSER

International Journal of Scientific & Engineering Research, Volume 7, Issue 3, March-2016 1213 ISSN 2229-5518
IJSER © 2016 http://www.ijser.org
[12] M.J. Heathcote, J&P Transformer Book 12th Edition Elsevier Science Publishers, 2003,
pp.945-950.
[13] IEEE Std C57.119-2001 “IEEE Recommended Practice for performing Temperature rise
Tests on oil-Immersed Power Transformers at Loads beyond Name Plate Ratings”.
[14] IEC.IEC Publication 60076-2ed. 3.0. Power Transformers Part2: Temperature Rise For
Liquid-Immersed Transformer. Geneva, Switzerland: IEC, 2011.
[15] Z. Radakovic, M. Sorgic, Basics of detailed Thermal-hydraulic Model for Thermal design
of oil power transformers. IEEE T. Power Del. 2010; 25(2): 790-802.
IJSER