thermal modeling and testing of the edison demonstration
TRANSCRIPT

44th International Conference on Environmental Systems Paper Number 13-17 July 2014, Tucson, Arizona
Thermal Modeling and Testing of the Edison Demonstration
of Smallsat Networks Project
Robert Coker,
MSFC, NASA, Huntsville, AL 35812
NASA's Edison program is intending to launch the Edison Demonstration of Smallsat
Networks (EDSN) project, a swarm of 8 1.5U cubesats in the fall of 2014 to demonstrate
intra-swarm communications and multi-point in situ space physics data acquisition. Due to
late changes in the duty cycles of various components, potential overheating issues appeared.
In addition, it was determined that capacity loss due to the coldness of the batteries was
unacceptable, so mitigation was required. This paper will discuss the thermal modeling,
testing, and results of the EDSN mission.
Nomenclature
Al = Aluminum
ADCS = Attitude Determination and Control System
ARC = Ames Research Center
BOM = Bill of Materials
BTU = British Thermal Unit
ºC = Degrees Celsius
CAD = Compute Aided Design
CDR = Critical Design Review
CONOPS = Concept of Operations
EDSN = Edison Demonstration of SmallSat Networks
EDU = Engineering Development Unit
EPISEM = Energetic Particle Integrating Space Environment Monitor
EPS = Electrical Power System
FLUINT = Fluid Integrator
GPS = global positioning system
LV = launch vehicle
MAPTIS = Materials and Processing Information System
MC = minor cycle
MEL = master equipment list
MSFC = Marshall Space Flight Center
MT = magnetorquer
NASA = National Aeronautics and Space Administration
NIST = National Institute of Standards and Technology
PCB = Printed Circuit Board
PDR = Preliminary Design Review
RBF = Remove Before Flight
SC = Spacecraft
SINDA = Systems Improved Numerical Differencing Analyzer
SS = Stainless Steel
TD = Thermal Desktop
TM = tape measure
TVAC = thermal vacuum
VR = voltage regulator
W = Watt
WD = Watch Dog
https://ntrs.nasa.gov/search.jsp?R=20140012465 2020-07-28T16:34:57+00:00Z

International Conference on Environmental Systems
2
I. Summary
ASA's Edison program is intending to launch a swarm of at least 8 small satellites the fall of 2014. This swarm
of 1.5U Cubesats, the Edison Demonstration of Smallsat Networks (EDSN) project, will demonstrate intra-
swarm communications and multi-point in-situ space physics data acquisition. In support of the EDSN project, a
geometrically accurate thermal model has been constructed. Due to the low duty cycle of most components, no
significant overheating issues were found for nominal operation and orbital parameters, although there is little
margin. The predicted mininum temperatures of the batteries are low enough, however, that some mitigation may
be in order. The development and application of the model is discussed in detail. Further, if extended (~4 hr)
detumble operations are required, overheating of some components may occur. This report should be considered
supplemental to the CDR thermal analysis1 and addresses changes in the design and operations that have occurred
after CDR.
II. Introduction
The EDSN mission will deploy a swarm of 8 cubesats into a loose formation orbiting more than 400 kilometers
above Earth. EDSN will demonstrate the potential value of multiple small satellites as tools for a wide array of
scientific, commercial, and academic space research. The EDSN mission will demonstrate new communications
capabilities, including satellites sending data, as needed, amongst themselves. Each EDSN satellite is 10x10x17 cm
in size and weighs less than 2 kg. This size is equivalent to 1.5 cubesat units (1.5U). Each satellite carries an
identical sensor to measure space radiation in Earth orbit. Each of the satellites can communicate with a ground
station and can relay all information from the entire network of satellites, so that the sensor data from separate
locations can be collected and combined to provide an extended picture of the space environment as a function of
time. The EDSN swarm is expected to operate for at least 60 days in orbit and will remain in orbit for up to three
years. The present plan is to launch all of the spacecraft together as secondary payloads on a Super Strypi launch
vehicle from Kauai, Hawaii in the fall of 2014. The spacecraft will be placed into nominal 500 km high orbits with
an inclination of 94.8º. Note that the precise launch time determines the orbital sun angle, β, of the final orbit and
N
Figure 1. CAD representation of an individual EDSN Satellite.

International Conference on Environmental Systems
3
this has a significant impact (of up to 15ºC) on nominal EDSN temperatures. With the present launch window of 2
hrs starting at local noon, this results in β=0º for a ‘cold nominal’ orbit and a β=30º for a ‘hot nominal’ orbit.
Figure 1 shows a CAD illustration of a single EDSN satellite. The Pumpkin chassis is made of aluminum
(Al), with the four sides being Al 7075-T7351 and the top and bottom endcaps being Al 5052. Further, the 4
exposed corners are Anodized while the rest of the surfaces are clear Alodined. The inside surfaces of the chassis
are rough while the outer Alodined surfaces are smooth. The exterior is covered with photovoltaic panels
(consisting of cells soldered to a PCB backing) to generate electrical power and magnetorquers are imbedded in the
PCB to help control the attitude of the spacecraft; the PCB is attached to the chassis with clips visible in Fig. 1. The
yellow extensions are self-deployed tape-measure radio antennas. The square patch on the ‘top’ of the spacecraft is
a Taoglas patch GPS antenna; another patch antenna, modified for S-Band, is located on the ‘bottom’ of the
spacecraft. Inside each spacecraft is a Nexus phone for processing and an Energetic Particle Integrating Space
Environment Monitor (EPISEM) as a payload.
The EDSN project is managed and conducted by a team at the NASA Ames Research Center (ARC), Moffett
Field, California, and is funded by the Small Spacecraft Technology Program in NASA’s Office of the Chief
Technologist. The project began in October 2011 and should be completed in about four years from start. Other
team members on the EDSN project are the NASA Marshall Space Flight Center (MSFC), Montana State University
in Bozeman, which is providing the EPISEM radiation sensors under contract to NASA, and Santa Clara University,
California, which is providing the ground tracking station and operations.
In support of the redesign of the EDSN spacecraft, a thorough thermal analysis was conducted as an update
to the PDR and CDR analyses1,2
. Using a Computer Aided Design (CAD) file and a mass and power spreadsheet
provided by ARC, a geometric and thermal model was constructed using Cullimore and Ring Technologies’
Thermal Desktop® (www.crtech.com) code with SINDA/FLUINT (version 5.5) in order to predict minimum and
maximum temperatures and compare them to expected hardware limits.
III. Model Details
Thermal analyses of EDSN were performed to assess component temperatures for the spacecraft (SC) design.
These analyses assumed the EDSN SC houses the following elements:
• Payload:
• Particle detector (EPISEM)
• Power System:
• Battery assembly with 4 Li-ion cells
• 154 2.63 cm2 solar cells mounted on a PCB backing
• Communications System:
• 2 patch Antennas (GPS and S-Band)
• 1 Novatel OEMV-1 GPS Receiver
• MicroHard (MHX) 2420 Ground-link Transceiver
• StenSat Beacon
• 2 Tape Measure Antennas
• Attitude Control System:
• 154 Magnetorquers in the PCB backing under the solar cells
• 3 Reaction Wheels
• Data System:
• Router
• Nexus phone
• Structure:
• 10x10x17 cm solid Al Pumpkin chassis (including endcaps)
• 2 Steel boards bracketing the batteries
• 7 PCB boards (one of which is the EPS)
• 2 Al heat sinks (one each for the MHX 2420 and the GPS)
• 4 threaded SS rods
• Assorted SS screws
On-orbit thermal analyses of the EDSN mission were performed to determine the range of temperatures that are
to be expected during the course of the mission. Hot and cold case simulations were performed, varying the external
environmental parameters and onboard heat dissipation. Specifically, a range of beta angles, β, and attitudes
compatible with bracketing expected mission values were used, while the onboard heat dissipation values due to

International Conference on Environmental Systems
4
on/off duty cycles were
based on representative
‘minor cycles’. Although
not every possible
combination of orbit,
orientation, and power was
explored, the analytical
results presented herein are
expected to bound
conditions experienced
during the actual flight. No
analyses were done for pre-
flight or ascent
environments. The model is
based on a CAD file
received from ARC on
12/20/13, with the caveat
that the solar panels, which
now number 170 and are
2.3cm2 in area each, were
not adjusted from the CDR
CAD; the total solar panel
surface area is different by
less than 5%. Figure 2
shows the components in the
CAD file, excluding the
external chassis, solar
panels, and magnetorquers
(MTs). The solar cells are
mounted to a PCB backing
with the embedded MTs,
which in turn is mounted on
the Al chassis. Those parts
of the backing and chassis
that are exposed to space are
radiative surfaces, while
those that are not are in
contact with adjacent parts.
The tape measure (TM)
antennas extend 12.5cm
from the SC. For the
purposes of thermal
modeling, the SC are greatly simplified: no clips, spacers, standoffs, nuts, pins, or switches were included in the
Thermal Desktop model. Also, the RBF plug is not included. The only screws explicitly included are those that
mount the GPS reciever and the router board assembly. The EPISEM was modeled as various subcomponents: the
UMHV power, the gchip, the 2 coilcrafts, and the Geiger counter housing. The Nexus phone, patch antennas,
StenSat, tape measure antenna holders, backplane holders, and Novatel were modeled as single simple bricks. The
reaction wheel component was split into 6 bricks (3 reaction wheels and their holders), while the MHX2420 was
split into 4 bricks and the Lithium radio into 2 bricks. The batteries were modeled as finely resolved cylinders,
while the battery casing and backplane were imported in detail from the CAD file. The resulting shapes of all these
components are shown in Fig. 3 for comparison to the CAD file; note the boards are not shown in Fig. 3. Some of
the bricks (e.g., the MHX2420) consist of multiple nodes, while the smaller ones that are expected to be isothermal
(e.g., the patch antennas at the top and bottom) are a single node. The TM antennas (not shown in Fig. 3) are
modeled as massless rectangles that are thermally connected to their holders (via contacts with a 0.003
Thickness/Length) and the chassis (via 5678 W/m2/°C conductors). Four Arduino chips (EPS/WD, sensors, GPS,
Figure 2. Display of the recently updated EDSN CAD file.

International Conference on Environmental Systems
5
and ADCS), the parallax chip on the
router board, and five voltage regulators
(Nexus, MHX2420, EPS/WD, Beacon,
and GPS) are also included as bricks. The subsystem surface optical
properties are listed in Table 1, while
the thermophysical properties are listed
in Table 2. Quantities marked with an
asterisk in Table 2 are temperature
dependent. Due to the simplicity of the
Thermal Desktop model, as well as
uncertainty in the composition of
various components, density scaling
factors had to be applied to the densities
listed in Table 2 for some components
to get the expected mass. These factors,
along with the resulting masses, are
listed in Table 3; the actual component
mass is unknown for components with
unity (‘1’) scaling factors. Due to
geometric simplification, some objects
do not match the expected mass. For
example, the modeled mass of the
chassis is 25% too high due to not
including the cutouts in the sides which
were added later in the design process.
However, the total mass in the model is
within 7% of the present predicted
actual SC mass3. The omitted ~100g
from the model is in screws, standoffs,
wires, pins, switches, etc., so that the
thermal capacitances (mass times
specific heat) for each component
should match the final EDSN hardware. The possible exceptions to this are the generic ‘silicon’ components listed
in Table 2: the heat capacity of silicon is relatively low compared to plastic (though high compared to metal), so
this may result in somewhat higher and more rapid temperature excursions for these components in the model than
in reality.
Some exposed interior surfaces (the TM holders) are set to the relatively high (0.87) IR emissivity typical of
white colored objects, while most large electrical components were modeled as bricks of silicon with the optical
properties labeled ‘component’ in Table 1 that has a slightly lower (0.75) emissivity. The optical properties of the
boards (labeled ‘PCB’ in Table 1) were determined by measurements of uncoated white PCB at MSFC using typical
flight methods4; although the properties vary depending on the circuitry extent, a rough average is used for all PCB
in the model. It is assumed there is no conformal coating on the SC; this would not change the optical properties
much, but might impact thermal contact values (see blow). The optical properties of the chassis (excluding the
Anodized corners), endcaps, batteries, and battery plastic coatings were also determined using flight-like hardware
at MSFC. For higher model fidelity, measured values of optical and thermophysical properteis of all as-built
components would be required; note that this is a requirement of APR 8070.29 that the project has chosen to waive
in the face of budget and schedule issues. Optically, since these surfaces are internal and not exposed to sunlight, it
is, strictly speaking, only the IR emissivity which is important, not the solar absorptivity.
Any thermal effects of wiring and cable bundles have been ignored, since their thermal mass is small and their
resulting thermal flux between components is estimated to be negligible for EDSN. However, it was noticed during
assembly of the EDU that will be used in qualification TVAC testing, that there are possible significant heat paths
via cabling from the antennas to internal components that have been ignored. Most of the thermophysical properties
in Table 2 were taken from various sources including MAPTIS-II (Materials and Processes Technical Information
System-II), NIST (National Institute of Standards and Technology) Cryogenics Database, and vendor data. The
optical properties were also taken from various sources, including the Spacecraft Thermal Control Handbook and
Figure 3. EDSN Components in the TD model.

International Conference on Environmental Systems
6
NASA Spacecraft Thermal Coatings Reference. The active solar panel emissivity, used for the cold case, is
angularly dependent with a hemispherical value of 0.726, while the green plastic of the battery wrapping was
deemed to have 5% transmission; these are marked with an asterisk in Table 1. Note the flight batteries will be
wrapped in a salmon-colored plastic; it is assumed the optical properties will be the same as the measured green
plastic.
Table 1. Subsystem Surface Optical Properties
Component Material Absorptivity Emissivity
9 Screws SS machined 0.47 0.14
3 backplane holders SS machined 0.47 0.14
3 backplane holders (inside) Kapton (1 mil) 0.37 0.44
2 Battery heatsinks (B2a,b) SS machined 0.47 0.14
Solar cells (active) Active Panel 0.726* 0.83
Solar cells (inactive) Inactive Panel 0.92 0.83
PCB backing of solar cells PCB 0.49 0.90
wrapped batteries Green plastic 0.93* 0.85
Battery tips Al 0.15 0.11
Battery casing PE black plastic 0.93 0.92
Chassis (external surfaces) Alodined (7075, smooth) 0.35 0.09
Chassis (internal surfaces) Alodined (7075, rough) 0.35 0.22
Chassis Endcaps Alodined (5052) 0.23 0.115
Chassis Corners Anodized (7075) 0.68 0.82
2 patch antennas Component 0.25 0.75
MHX2420 transceiver Component 0.25 0.75
GPS receiver Component 0.25 0.75
Grounding unit Alodined (6061) 0.44 0.14
MHX&GPS heatsinks, GPS housing Alodined (6061) 0.44 0.14
EPISEM payload Component 0.25 0.75
TM antenna holders White plastic 0.25 0.87
Tape measure antenna Yellow Polyester 0.52 0.82
Router board (B6) PCB 0.49 0.90
Backplane PCB 0.49 0.90
GPS Switch PCB 0.49 0.90
Reaction wheels and holders Component 0.25 0.75
Boards (B1,3-5,7-9) PCB 0.49 0.90
Lithium Radio Component 0.25 0.75
Lithium Housing Al (buffed, 30% specular) 0.16 0.03
4 threaded rods Al (buffed, 30% specular) 0.16 0.03
StenSat radio Component 0.25 0.75
Nexus phone Component 0.25 0.75
Arduinos, VRs, parallax Component 0.25 0.75
For simplicity, and in the absence of any other information, most thermal contact conductance values between
most touching components were assumed to be a constant 568 W/m2/ºC (100 BTU/hr/ft
2/ºR). The uncertainty in this
thermal connectivity value, which is a low value for solid (e.g. soldered) metal-metal contacts but a high value for
glued-together plastic components in a vacuum, results in roughly a few ºC uncertainty in most components; this
uncertainty is larger for the chips, since that is where most of the power dissipation is assumed to occur (see below).
Contact values between the VRs and chips and their respective boards were estimated based on the number of pins
and soldered contact area.
Specifically, all chip pins were assumed to have the dimensions of the parallax chip pins: 0.1mm thick, 0.35mm
wide, and 1.0mm long. Since the parallax has 44 pins, the ATMEGA2560 Arduinos (used on the ADCS and
GPS/PL boards) have 100 pins, and the ATMEGA328P Arduinos (used on B3 for the WD/EPS and SI/Sensors)
have 32 pins, this gives Area/Thickness values of 1.54mm, 3.5mm, and 1.12mm, respectively. The 20 pins for the
MHX2420 are 0.025” on a side and 0.215” long, giving an Area/Thickness for that contact of 1.5mm. All pins were

International Conference on Environmental Systems
7
assumed to have the high conductivity of Al 6061-T6. Note that since the pins are soldered, they are not likely to be
made of Al, but this assumption is not critical as long as they are of a highly conductive material. The VRs’
soldered fractional contact area to their boards was estimated to be ~25%, so a low (for soldering) conduction
coefficient of 2839 W/m2/°C was used. Due to expected close contacts, the endcaps to the chassis, the grounding
unit to the chassis, the TM holders to B3, the MHX2420 board to its housing and legs, and the contacts between the
solar panels and their PCBs were set to 5678 W/m2/°C. In contrast, the solar panel PCB to chassis contacts were set
to 57 W/m2/°C, due to only being clipped on. Similarly, the pressure contact between the backplane and the boards
and router is fairly weak, so a conductance per area of 57 W/m2/°C was used there as well. Since the threaded rods
are loose in their holes through the boards, under vacuum they will have a poor thermal contact with all the boards
and chassis. However, they are encased in Al standoffs (not included explicitly in the model, but indirectly included
by using Al optical properties for the rods, as listed in Table 1), so their conductance per area to the boards and
chassis was set to a moderate 57 W/m2/°C. Since the GPS housing is well screwed to the board, and it was modeled
as a 1mm thick shell, a high edge conduction coefficient value of 1 W/m/°C was used there. Since Kapton was
added between the backplane and the backplane holders, that contact was reduced to 6 W/m2/°C. During EDU
assembly, it was observed that the contact between the MHX2420 and its heatsink was only ‘hand tight’, so under
vacuum that will be a very weak contact. However, in the model these surfaces are coincident, so to approximate
radiative transport, a weak contact of 6 W/m2/°C was used. The contact between the phone and its board, B4, was
estimated, based on the results of TVAC testing, to be 284 W/m2/°C. However, that test was not done ‘as flight’ and
indicated the contacts may be very sensitive to thermal cycling effects (to a factor of ~5x). Finally, with the addition
of 3M 2216 "Scotchweld" potting, the thermal contact between the batteries and their casing was changed to the
nominal specified value5 of 1.3 W/m
2/°C. However, the contact between the tips of the batteries and the casing was
reduced to 0.6 W/m2/°C, due to inspection of the flight hardware showing those contacts to be low pressure line
contacts.
Table 2. Subsystem Thermophysical Properties (@25ºC)
Components Material Conductivity
(W/m/C)
Density
(kg/m3)
Heat capacity
(J/kg/C)
9 Screws and 4 long rods Steel AISI 316 13.5* 8027 460*
Solar cells Tedlar 0.2 1390 1010
boards(B1,3-5,7-9), router board,
GPS switch, backplane
PCB (0.2% Cu) 1.12 1952 1598
batteries LiH 100 3085 553
Chassis Al 7075-T7351 180* 2796 1140*
Chassis Endcaps Al 5052 142 2685 921
Grounding unit, GPS heatsink and
housing
Al 6061-T6 150* 2707 870*
MHX heatsink Al 6063 212* 2712 850*
2 patch antennas, MHX, GPS
receiver, Beacon, Nexus, RWs and
holders, VRs, chips, EPISEM,
lithium module and housing
Silicon 125.5 2330 702.9
TM antenna holders DELRIN 500 0.33 1429 1214
TM antenna Steel A286, 33-1033K 12* 7913 460*
Battery casing PP copolymer 0.1255 910 2343
Heatsink Shelves (B2a,2b),
backplane holders
SS 304 704* 8009 480*
The peak power dissipation assumed for each subsystem is listed in Table 4. These heat loads were smeared
equally over the entire volume for each brick or geometric object making up the various components. The battery
dissipation was found via testing to be ~2.5% of the total power being drawn; it is more than this when the draw is
low and the batteries are cold as well as when the batteries are warm and the draw is high, so 2.5% is a slightly
conservative value for both cases. Note however there is considerable uncertainty in this value due to non-
linearities. For the Lithium radio, average values for the modes Crosslink Captain, when a SC is primarily
receiving, and Crosslink Lieutenant, when a SC is primarily sending, are listed. This power is put into B9 and the
Lithium module, but not the Lithium housing. It has been assumed that 1W of radiated radio power is produced by

International Conference on Environmental Systems
8
the StenSat and MHX2420; this is not included in the thermal dissipation values in Table 4. It is assumed that if a
SC is not in one of the operational states (see below), it is in a quiescent state, where the beacon is on for 5 s out of
every 90 s. The average dissipation values for the EPS, the router parallax chip, and VCC5 (the router VR) in this
quiescent state are listed in parentheses in Table 4. Components that are not listed in Table 4 are assumed to have
no dissipation. Note the dissipation values given in Table 4 are in many cases significantly different than was used
in the CDR analysis.
Table 3. EDSN Subsystem Mass Scaling
Component Density Scaling Factor Modeled Mass (kg)
Solar cells 3.072 0.033
SP PCBs (chassis + endcaps - cells) 1.274 0.259
Batteries 1.00 0.182
Battery Casing 0.92 0.028
Battery heatsinks (B2a,b) 1.00 0.128
4 Arduinos (total) 1.532 0.00182
Parallax 1.863 0.00061
2 T/6 VRs 0.644 0.0032
3 T/3 VRs 0.747 0.0048
Backplane 1.44 0.0237
3 backplane holders 1.00 0.0294
Chassis 1.00 0.219
Endcaps 1.00 0.093
2 TM holders 1.18 0.016
2 TMs 1.00 0.0025
GPS heatsink 1.00 0.0104
GPS housing (1mm thick) 1.00 0.021
EPISEM (including B8) 1.00 0.047
MHX2420 transceiver 0.631 0.0438
GPS receiver 0.966 0.0183
MHX heatsink 1.00 0.014
GPS patch antenna 0.686 0.007
Lithium radio (module + housing) 0.734 0.0258
Router board (2mm thick, B6) 1.00 0.019
Reaction wheels and housing 0.831 0.0964
MHX patch antenna 1.103 0.018
StenSat radio 0.471 0.020
Nexus phone 0.8594 0.013
GPS switch 1 0.00126
Grounding unit 1 0.0032
Other PCB boards (B1, 3-5, 7, 9) 1 0.165
9 Screws and 4 rods 1 0.042
Total 1.589
Since the previous power dissipation modeling was deemed overly conservative, it was decided to use actual on-
orbit power profiles. Thus, it was necessary to find the duty cycle of each component during each state. Figure 4
lists the operational states and which components are on during each of them. Also listed is the duration of each
state and the estimated power draw during each state. The latter, taken from the Master Equipment List (MEL), is
then used to estimate the power dissipation in the batteries during each state. For simplicity, this ignores the fact
that at times ~0.2W of the total power draw may be directly delivered by the solar panels to components. Next, a
representative on-orbit sequence was constructed using minor cycle 176 for SC#110
. This minor cycle was picked
since it exercises most of the hardware. Note that to capture an entire minor cycle, 17 orbits were required in the
time dependent model. The start time for each state used for SC1MC176 is listed in Table 5. This then gives the
power dissipation as a function of time for each component. Since it was requested by the project to remove
conservatisms, the hot and cold cases use the same component dissipation values; only the orbital plane, fluxes, and

International Conference on Environmental Systems
9
solar panel behavior are changed (see below). For the cold cases, 0 time refers to near the start of eclipse, while for
the hot cases it refers to just after the beginning of sunlight (see Figs. 5 and 6 below). The results of these analyses
depend somewhat on this choice of phasing.
Table 4. EDSN Subsystem Heat Dissipation (mW)
Component Dissipation (mW)
Batteries 11.5-232.6 (2.5%)
EPISEM Components 131
Lithium (Captain) 381
Lithium (Lieutenant) 540
MHX2420 5190
MHX2420 VR 200
Nexus phone 518
Nexus VR 200
Novatel GPS Receiver 1427
GPS Controller Arduino 124
GPS VR 200
Reaction Wheels 627
Router Parallax chip 294(16)
VCC5 (Router VR on EPS) 162(9)
EPS/WD Arduino 316(201)
Sensors Arduino (on B3) 160
ADCS Arduino (on B5) 414
Magnetorquers 104
StenSat Beacon 122
StenSat VR 200
The hot cases use combined maximum 3.3σ 90 minute environments for high inclination orbits from Table 2.2 in
Reference 6. The solar flux value is thus 1414 W/m2 and the Earth IR flux is 240 W/m
2. The orbit-averaged albedo
Figure 4. Table of EDSN Components and State durations and power draws.

International Conference on Environmental Systems
10
correction for β=30º (the angle between the SC orbital plane and the sun) was found to be 6%, for a total albedo of
32%. Again, at project request, this orbit is the maximum nominal hot orbit and is thus not conservative. The
maximum possible β of 30º assumes the present EDSN launch window of noon to 2pm local time and results in an
orbit that is in eclipse 36% of the time. An orbit of 430x505 km was used for both the hot and cold cases. The
spacecraft are assumed to be either tumbling rapidly in all 3 axes or 3-axis stabilized with the GPS patch antenna
pointing towards earth. For radiation purposes, the solar panels were taken as ‘inactive’, with an angularly constant
high absorptivity, conservatively determining, i.e. overestimating, the amount of heat due to incoming solar
radiation. Two hot cases were run, one with the SC stabilized and one with it tumbling.
Table 5. State start times for SC1MC176
State Start Time (s)
Quiescent 0
EPISEM 4163
Pointing Propagation 6059
Pointing Demonstration 6120
EPISEM 6525
Crosslink Captain 14400
Magnetic Alignment 30195
Alignment Downlink 33796
Crosslink Captain 43200
Crosslink Captain 57600
Magnetic Alignment 73772
Alignment Downlink 77373
Magnetic Alignment 80504
Alignment GPS 84105
Planning 85426
The cold cases use combined minimum 3.3σ 90 minute environments for high inclination orbits from Table 2.1
in Reference 6. This gives a solar flux value of 1322 W/m2 and an Earth IR of 218 W/m
2. The orbit-averaged
albedo correction for a β=0º orbit is 4%, for a total albedo of 23%. This orbit is in eclipse 38% of the time. Models
using a circular orbit of 450x450 km result in less than ~1º C change for all components (hot or cold); such models
are not discussed here any further. The solar panels, for radiation, were taken as ‘active’, conservatively
determining, i.e. underestimating, the amount of radiation captured as heat by the spacecraft solar panels. That is, an
angularly dependent absorptivity is used such that solar radiation perpendicular to the solar panels is less likely to be
‘thermally adsorbed’, and thus converted to thermal energy, but rather is converted directly to electricity and does
not heat the SC. Two cold cases were run, one with the SC stabilized and one with it tumbling. The high and low
solar flux values used here correspond to near northern hemisphere winter (in January) and summer solstice (in
July), respectively. Thus, they should appropriately bracket a launch near the fall equinox, with the hot values
becoming more appropriate late in the mission. Each model was run in steady-state, using orbital averages, to obtain initial conditions. The models were then
run for 17 orbits, using the power dissipation as a function of time discussed above, to determine the thermal
response over an entire minor cycle; as can be seen in Figures 5-7 below, due to the relatively short duty cycles
determined above, in no case do the models obtain a quasi-steady result. Although the SC will be tumbling initially,
the MTs will assist in aligning them with the Earth’s magnetic field. However, here we discuss models that are
either 3-axis stabilized, with the side with the reaction wheels (the top side of Figs. 1 and 2) pointing towards nadir
or rapidly tumbling in all 3 directions; spinning tends to reduce thermal gradients so most temperature extrema occur
when 3-axis stabilized (see Table 7). Various yaw rotations were not explored. The presented chosen orientation
results in enveloping the mininum spacecraft temperatures as a whole, but not for specific subsystems. The hottest
and coldest orbit case for each component depends on its location on the bus and relative area presented to the Sun
or deep space. Thus, a particular spacecraft orientation may result in more extreme temperatures for a specific
component than are given here. Still, the four cases discussed here probably represent component temperature
extremes to within a few degrees C for the most critical components.
The EDSN SC do not have any stand-alone thermal control systems. The thermal control is entirely passive,
relying on structural elements and equipment layout. There are no heaters and no separate radiators; however, the

International Conference on Environmental Systems
11
solar panels are attached to the structure and act as efficient radiators when faced away from the Sun. Internal
components are cooled via radiation and conduction, and mostly have high emissivity exterior surfaces.
Table 6. EDSN Thermal Limits
Component Min/Max Thresholds (ºC)
Nominal Survival
GPS Receiver -30/+85 -30/+85
Backplane -25/+105 -25/+105
GPS patch Antenna -40/+85 -40/+100
S-Band patch Antenna -50/+150 -50/+150
Router board -10/+70 -40/+85
MHX2420 Transeiver -40/+85 -40/+85
Reaction Wheels -25/+80 -25/+80
StenSat Beacon -30/+80 -30/+80
EPISEM -30/+30 -40/+50
PCB Components -40/+85 -55/+85
Nexus Phone -25/+65 -40/+85
Lithium -30/+70 -30/+70
EPS -30/+78 -30/+78
ADCS -30/+85 -30/+85
LEDs -20/+80 -30/+85
Arduinos & VRs -40/+85 -40/+85
Parallax router chip -55/+125 -65/+150
Batteries -20/+60 (discharging)
0/+45 (charging)
-20/+60
IV. Results
The standard thermal limits for industrial electronic parts are -40 ºC to +85 ºC. Most components on the EDSN
spacecraft are expected to have limits better than or equal to these. The significant exceptions are the Nexus phone,
with an upper limit due to an internal thermal reset switch of ~+65 ºC, the router board, due to an oscillator with a
limit of +70°C, and the EPISEM with a tested upper limit of only +30 ºC. The thermal limits expected for various
components, as taken from Ref 7, are listed in Table 6. Some, such as the StenSat Beacon, assume the industry
standard, while others, such as the EPISEM, are based on testing. For the batteries, the ‘charging’ state limits will
likely apply while in full sunlight (i.e., the hot case) while the ‘discharging’ state limits will likely apply in eclipse
(i.e. the cold case). The “PCB Components” include connectors, sensors, resistors, etc. The nominal upper limit for
the Nexus phone is the tested temperature at which the phone begins to reset (which eventually causes performance
problems, so is undesirable).
The model results, listed in Table 7, show there are no overheating issues with any components, neither when the
SC are tumbling for extended periods nor when stabilized. Component cases that may have minor nominal
performance issues are high-lighted in yellow in Table 7. On the cold side, the batteries are cold enough to lose

International Conference on Environmental Systems
12
significant performance and the router board and the GPS patch antenna are close to their lower nominal operating
temperatures. On the hot side, the phone and the router board are within 10°C of their nominal operating limits; any
extended detumbling will further erode this margin at a rough estimate of 5°C/hr of continuous detumbling.
Recently, the temperature limits of the router (B6) were significantly tightened to those listed in Table 6. As a
result, both the cold and hot predicted limits of the router board are now within the ±5 ºC uncertainty band (see
below) of the router nominal operating thresholds. The router board reaches its nominal cold limit when the SC is in
a Quiescent state for more than ~3 orbits, while it reaches its hot limit when the SC is in a Magnetic Alignment state
for more than ~1 hr.
Table 7. EDSN Worst Case Temperature Predictions
Temperature (ºC)
Component Cold Case (minimum) Hot Case (maximum)
Stabilized Tumbling Stabilized Tumbling
Batteries -4 +1 +20 +18
Solar Cells & MTs -37 -32 +34 +26
Shelves (B1-2AB, 4-
5,7,9) & heatsinks
-15 -10 +62 +60
EPS Board (B3) -3 +2 +57 +56
Chassis & Endcaps -35 -30 +25 +21
Router (B6) -7 -2 +69 +68
EPISEM & board -13 -7 +20 +18
Patch Antennas -38 -31 +22 +22
StenSat Beacon -8 -2 +25 +23
Router Parallax -5 0 +69 +68
Nexus S Phone 0 +6 +59 +58
MHX2420 -4 +1 +60 +58
GPS Receiver -10 -5 +41 +39
Reaction Wheels -4 +1 +44 +42
TM Antennas -69 -86 +45 +23
Arduinos -11 -5 +62 +60
VRs -10 -4 +60 +58
Lithium Radio -14 -8 +19 +17
The temperatures of all internal components (plus the external patch antennas) for the stabilized hot case are
shown in Fig. 5. The hottest components are the phone and MHX2420 at ~60 ºC when those components are on for
extended periods and in sunlight. The hot extrema are determined by the modulation of internal heating due to
dissipation when components are on and external heating as the SC comes out of eclipse. It can be deduced from
Fig. 5 near 90k seconds that if the phone were left on for ~4hrs, as would be needed in an extended detumble (which

International Conference on Environmental Systems
13
is a Magnetic Alignment state), then its temperature would continue to climb above 60°C; in addition, the
temperature of the router board (not shown in Fig. 5) would be over 70°C. Similarly, if Alignment Downlink were
significantly longer, the MHX2420 might have overheating issues.
The temperature results for the internal components (plus the external patch antennas) for the stabilized cold case
are shown in Fig. 6. No components ever get colder than -40 ºC, although the patch antenna shielded from the earth
IR flux (the GPS) gets close. Since no internal components operate at less than -20°C, even the LEDs, which are not
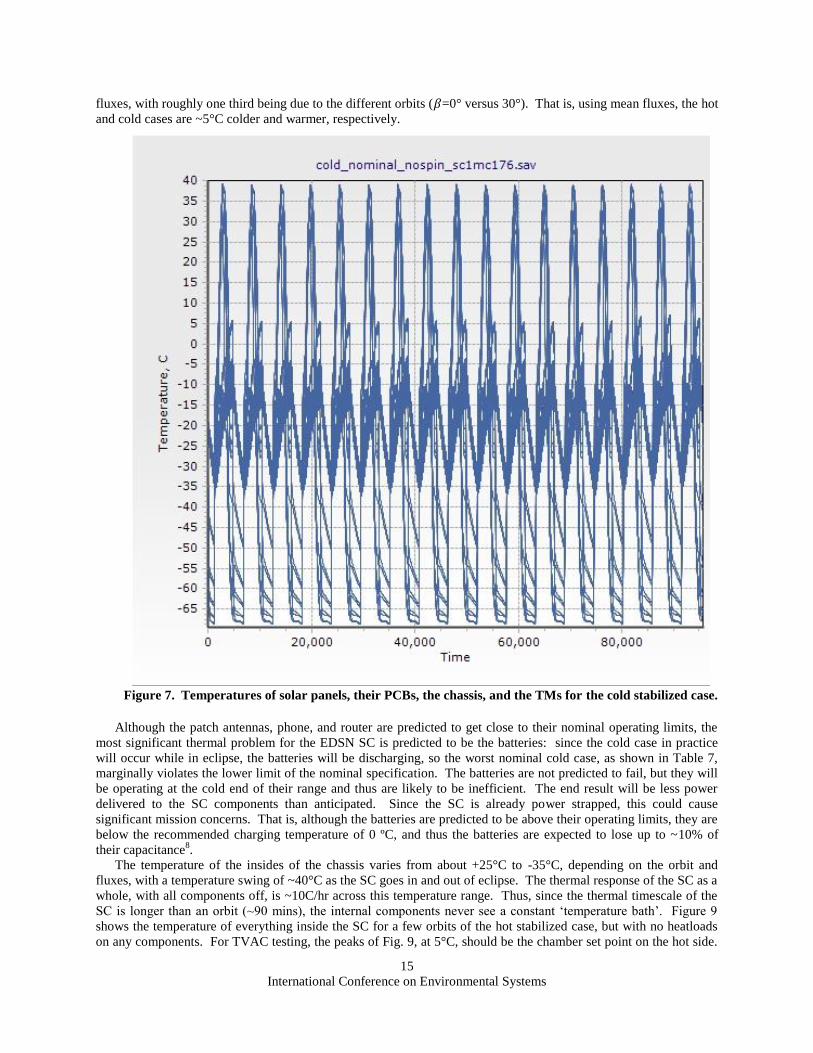
included in the model, with nominal cold limits of -20ºC, should operate nominally. Figure 7 shows the temperature
results for the external components for the cold stabilized case. The TM antennas, due to their very low thermal
mass, swing from nearly +45 ºC hot to -85 ºC cold during an orbit and may thus have thermal cycling lifetime
issues. In addition, when the TM antennas, which are stored bent across the rest of the SC, are released via a burn
wire 30 minutes after SC deployment from the launch vehicle (LV), they may have embrittlement issues related to
bending in cold conditions, although tests for the TM antenna on PhoneSat 1 at -40 ºC showed no issues. The
chassis, MTs, and solar panels on the shielded end of the SC (the bottom edge in Figs. 1 and 2) get as cold as -35 ºC.
However, being designed for space applications, they are expected to not have any issues at those temperatures, with
the possible exception of any thermo-couples on the external SC surfaces (they may have expansion issues related to
thermal cycling).
Figure 5. Temperatures of internal EDSN components (plus the patch antennas) for the stabilized hot case.

International Conference on Environmental Systems
14
An illustration of how the temperature at a single point in time is distributed across the SC for the hot stabilized
case is shown in Fig. 8. The point in time is picked to be near the peak temperature of the phone. The phone and
the MHX2420 are the hottest components, with the StenSat Beacon close behind. Note that +z corresponds to
Earth-pointing in Fig. 8.
No active component gets hotter than +70 ºC or colder than -40 ºC. However, there are a number of
uncertainties in the analysis. The geometry has been greatly simplified, particularly for the StenSat and the phone.
The thermal coupling between components used an assumed nominal value for most connections. Perhaps most
importantly, values for the optical and thermophysical properties for many components had to be assumed; it is
critical that actual values from the as-built components be measured to determine the accuracy of the values used in
this analysis. Due to these assumptions, the estimated 2σ uncertainties in the final temperature extrema are ±5 ºC.
Note this is an uncertainty estimate, not an estimate of margin; no explicit margin is included in these analyses.
That is, the hot and cold cases are ‘nominal’, not conservative. The only inherent ‘conservatism’ is in the assumed
bracketing low and high limits for the solar and earth IR fluxes seen by the SC discussed above. Of the ~15°C
differences seen in the hot and cold results (compare Figs. 5 and 6), the majority is due to the differences in the
Figure 6. Temperatures of internal EDSN components (plus the patch antennas) for the cold stabilized case.
International Conference on Environmental Systems
15
fluxes, with roughly one third being due to the different orbits ( =0° versus 30°). That is, using mean fluxes, the hot
and cold cases are ~5°C colder and warmer, respectively.
Although the patch antennas, phone, and router are predicted to get close to their nominal operating limits, the
most significant thermal problem for the EDSN SC is predicted to be the batteries: since the cold case in practice
will occur while in eclipse, the batteries will be discharging, so the worst nominal cold case, as shown in Table 7,
marginally violates the lower limit of the nominal specification. The batteries are not predicted to fail, but they will
be operating at the cold end of their range and thus are likely to be inefficient. The end result will be less power
delivered to the SC components than anticipated. Since the SC is already power strapped, this could cause
significant mission concerns. That is, although the batteries are predicted to be above their operating limits, they are
below the recommended charging temperature of 0 ºC, and thus the batteries are expected to lose up to ~10% of
their capacitance8.
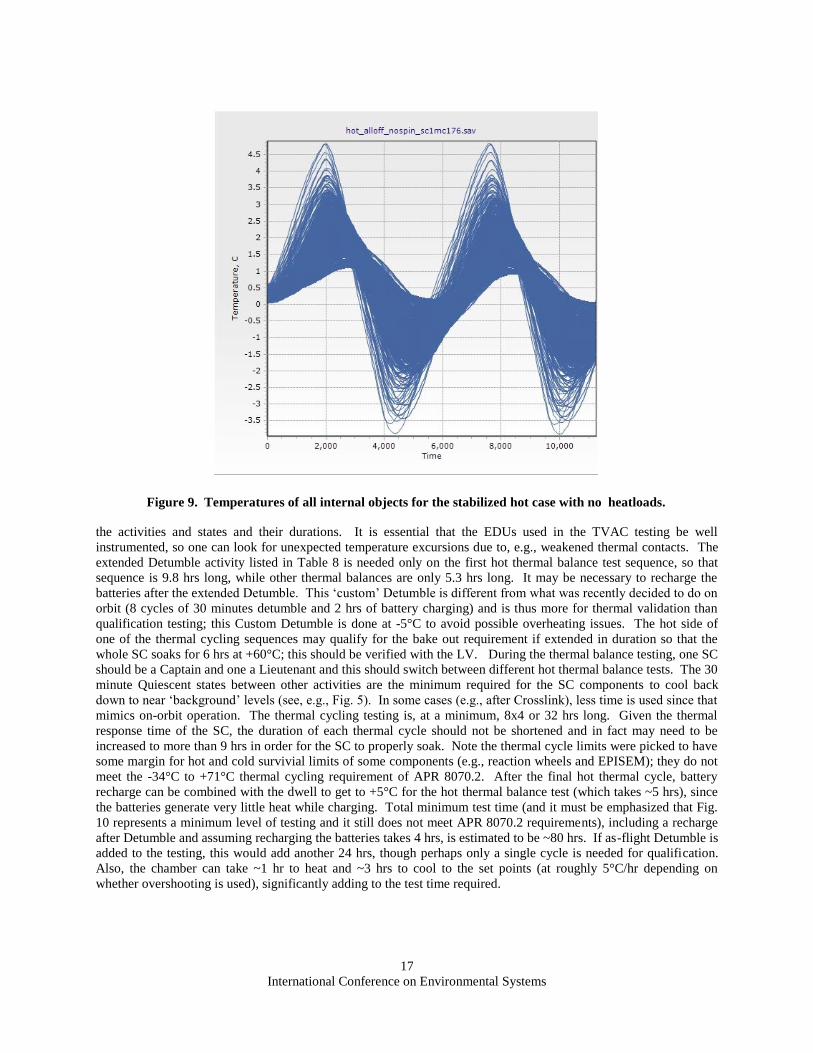
The temperature of the insides of the chassis varies from about +25°C to -35°C, depending on the orbit and
fluxes, with a temperature swing of ~40°C as the SC goes in and out of eclipse. The thermal response of the SC as a
whole, with all components off, is ~10C/hr across this temperature range. Thus, since the thermal timescale of the
SC is longer than an orbit (~90 mins), the internal components never see a constant ‘temperature bath’. Figure 9
shows the temperature of everything inside the SC for a few orbits of the hot stabilized case, but with no heatloads
on any components. For TVAC testing, the peaks of Fig. 9, at 5°C, should be the chamber set point on the hot side.
Figure 7. Temperatures of solar panels, their PCBs, the chassis, and the TMs for the cold stabilized case.

International Conference on Environmental Systems
16
However, when including the additional 5°C model margin and 10°C required by APR 8070.29 for qualification
testing, and if TVAC testing follows ‘test as you fly’ and thus uses the states in Fig. 4, this would result in the router
and phone getting hotter than their nominal operating limits. This would occur during a Planning state that follows
an Alignment GPS state (as occurs during a GPS activity). A set point of 5°C would avoid these overheating issues,
but would not meet testing requirements, so a waiver would be required. Similarly, for the cold side, models suggest
a TVAC set point of -27°C (not including the required APR 8070.2 margin), but that would cause issues for the
router as well as the batteries. The router will only permit a -10°C TVAC set point, so a waiver on the cold side is
also required. It may be possible to test on the cold side at -20°C with the SC always in at least the Quiescent state,
so that the batteries and router board keep themselves sufficiently warm; this is suggested below. Note that when
the SC are jettisoned from the LV, they are inert for 30 minutes with all components off. Over this time period,
particularly if the SC are in eclipse and tumbling, the SC, including the router, will cool. The final minimum
temperature will depend on the initial conditions inside the LV when the SC are jettisoned. If it is less than ~-5°C,
the router will reach -10°C and thus may pose a significant issue for SC start up. For TVAC testing, it is suggested
that the hot nominal threshold values listed in Table 6 be used as redlines and the values in Table 7 plus 5°C be used
as yellow lines. For thermal cycle testing, the requirement is ±10°C of model predictions9. Thus, from Table 7 (and
ignoring external components) a range of -25°C to +80°C would be required. However, this would violate the
survival limits of the batteries and EPISEM. Note that the latter may be +60°C for relatively short durations. Again
a waiver would be required, but set points of -25°C and +60°C are therefore suggested for the thermal cycle testing.
Since EDSN is a cubesat mission, the project has deemed it acceptable to take risks by waiving a number of APR
8070.2 requirements (qualification limits, acceptance limits, margin limits, subsystem testing, number of TVAC
cycles, TVAC duration, chamber heating and cooling rates, and component measurements). In an attempt to
balance those ‘requirements’ with testing cost and schedule, a TVAC test plan that includes some thermal balance
testing as well as thermal cycle testing was developed. Figure 10 is a schematic of the test plan while Table 8 lists
Figure 8. Snapshot of temperatures (in ºC) of EDSN components for the hot stabilized case at the hottest
point for the phone (bottom and sides of chassis not shown).
International Conference on Environmental Systems
17
the activities and states and their durations. It is essential that the EDUs used in the TVAC testing be well
instrumented, so one can look for unexpected temperature excursions due to, e.g., weakened thermal contacts. The
extended Detumble activity listed in Table 8 is needed only on the first hot thermal balance test sequence, so that
sequence is 9.8 hrs long, while other thermal balances are only 5.3 hrs long. It may be necessary to recharge the
batteries after the extended Detumble. This ‘custom’ Detumble is different from what was recently decided to do on
orbit (8 cycles of 30 minutes detumble and 2 hrs of battery charging) and is thus more for thermal validation than
qualification testing; this Custom Detumble is done at -5°C to avoid possible overheating issues. The hot side of
one of the thermal cycling sequences may qualify for the bake out requirement if extended in duration so that the
whole SC soaks for 6 hrs at +60°C; this should be verified with the LV. During the thermal balance testing, one SC
should be a Captain and one a Lieutenant and this should switch between different hot thermal balance tests. The 30
minute Quiescent states between other activities are the minimum required for the SC components to cool back
down to near ‘background’ levels (see, e.g., Fig. 5). In some cases (e.g., after Crosslink), less time is used since that
mimics on-orbit operation. The thermal cycling testing is, at a minimum, 8x4 or 32 hrs long. Given the thermal
response time of the SC, the duration of each thermal cycle should not be shortened and in fact may need to be
increased to more than 9 hrs in order for the SC to properly soak. Note the thermal cycle limits were picked to have
some margin for hot and cold survivial limits of some components (e.g., reaction wheels and EPISEM); they do not
meet the -34°C to +71°C thermal cycling requirement of APR 8070.2. After the final hot thermal cycle, battery
recharge can be combined with the dwell to get to +5°C for the hot thermal balance test (which takes ~5 hrs), since
the batteries generate very little heat while charging. Total minimum test time (and it must be emphasized that Fig.
10 represents a minimum level of testing and it still does not meet APR 8070.2 requirements), including a recharge
after Detumble and assuming recharging the batteries takes 4 hrs, is estimated to be ~80 hrs. If as-flight Detumble is
added to the testing, this would add another 24 hrs, though perhaps only a single cycle is needed for qualification.
Also, the chamber can take ~1 hr to heat and ~3 hrs to cool to the set points (at roughly 5°C/hr depending on
whether overshooting is used), significantly adding to the test time required.
Figure 9. Temperatures of all internal objects for the stabilized hot case with no heatloads.

International Conference on Environmental Systems
18
V. Conclusions
A detailed thermal analysis was conducted for the EDSN Cubesat mission. Although there are many
uncertainties in the analysis (such as unknown thermal contacts, absorptivities and emissivities, and thermal masses)
and a number of components (batteries, phone, router board) are predicted to be close to impacting system
availability, a nominal analysis shows that there are no significant thermal issues that threaten minimum mission
success11
. If the MHX2420 transceiver or the Nexus phone have a significantly longer duty cycle or more power
dissipation than was used in the analysis, they may have overheating issues. However, this is unlikely due to total
power constraints on the small SC. The patch antennas, if shaded for long periods, may have cold issues. The TM
antennae get very cold and cycle over 100 ºC every orbit, so they may have deployment or cycle fatigue issues.
However, they are made of SS, so failure is considered to be unlikely. Of more concern is the router: it has no
margin on either the hot or cold end, particularly considering model uncertainties. The router oscillator loses
stability outside its nominal operating temperature limits; this is deemed by the project to be an acceptable risk. Of
greatest concern are the batteries: depending on their efficiency curves as a function of temperature, they may store
and discharge more than 10% less than is expected due to being too cold. That is, in the cold stabilized case, the
batteries continuously operate at less than 0 ºC and thus will underperform, particularly when charging. Other than
this, the EDSN SC seem very robust to thermal issues, both hot and cold. It must be cautioned, however, that these
final analyses are based on a single nominal minor cycle, SC1MC176. For example, a minor cycle that has a
Planning activity immediately followed by a Downlink activity might result in higher tempreatures (and thus
overheating since they are at their limits) for the phone and/or router board. Any power dissipation or CONOPS
changes or vastly different minor cycles will have a direct impact on temperature extrema. Further, the Nexus
TVAC test results suggest the possibility that EDSN SC thermal contacts – and thus their temperature extrema – are
sensitive to thermal cycling; upcoming full SC TVAC testing should shed light on this. In addition, any change in
the launch window will have a significant impact: a β>30° will result in overheating of the router while a launch
date closer to the summer solstice will result in the batteries getting to colder than -5°C. The results discussed here are significantly different (in general, warmer) than in the CDR report
1. A number of
the assumptions made and enumerated in the CDR analysis turned out to be incorrect due to a combination of last
minute design changes, inaccurate CAD files, unupdated BOM and MEL files, and a lack of communication
between the analyst and the project. For example, it was assumed the interior of the chassis was black coated and
the exterior white coated, as is typical for smallsats. In reality, no color coatings at all were applied and the optical
properties of the Al alloys undetermined. This discrepancy was only caught after the analyst was able to be present
at the assembly of an EDU. These types of issues should be taken as a lessons learned for future smallsat thermal
analysis.
Figure 10. Schematic of suggested TVAC testing plan.

International Conference on Environmental Systems
19
Table 8. Suggested TVAC Thermal Balance Test Plan
Activity STATE Duration
Detumble Detumble 4 hrs
Quiescent 30 minutes
Science EPISEM 600 s
Quiescent 30 minutes
Pointing Pointing Prop 60 s
Quiescent 1 s
Pointing Demo 300 s
Quiescent 30 minutes
Collect/Provide Crosslink Crosslink Captain/Lt 2650 s
Quiescent 10 minutes
Downlink Magnetic Alignment 3600 s
Quiescent 10 s
Alignment Downlink 672 s
Quiescent 30 minutes
GPS Magnetic Alignment 3600 s
Quiescent 10 s
Alignment GPS 1320 s
Quiescent 10 s
Planning 300 s
TOTAL TEST DURATION 9.8(5.3) hrs
References 1Coker, R.F., “EDSN CDR Thermal Analysis, Rev. C”, April 15, 2013. 2Coker, R.F., “EDSN PDR Thermal Analysis, Rev. B”, July 24, 2012. 3CAD BOM Masses 2013-12-16.xlsm. 4Finckenor, M., “Optical Property Measurements of EDSN Printed Circuit Boards”, Work Request 2013-0441, June 6, 2013
(and subsequent documents). 5http://solutions.3m.com/wps/portal/3M/en_US/Adhesives/Tapes/Products/~/3M-Scotch-Weld-Epoxy-Adhesive-EC-
2216?N=5000130+3294255158&rt=rud. 6Anderson, B. J., Justus, C. G., and Batts, G. W., “Guidelines for the Selection of Near-Earth Thermal Environment
Parameters for Spacecraft Design,” NASA TM-2001-211221, Oct. 2001. 7TemperatureRanges_20140102.xlsx from Hugo Sanchez, ARC. 8LG Chemical, Product Specification, Rechargeable Lithium Ion Battery, Model: ICR18650 C1 2800mAh. 9http://server-mpo.arc.nasa.gov/Services/CDMSDocs/Centers/ARC/Dirs/APR/APR8070.2.html. 10EDSN-Ops-Sim-2013-12-10.png from Hugo Sanchez, ARC.

International Conference on Environmental Systems
20
11Paragraph 2.3 Requirements as stated in “P01.BRD.EDSN Baseline”, the EDSN Baseline Requirements Document, August
13, 2013.