thermal, rheological, and mechanical the author(s) 2011
TRANSCRIPT

JOURNAL OFC O M P O S I T EM AT E R I A L SArticle
Thermal, rheological, and mechanicalproperties of a polymer composite curedat different isothermal cure temperatures
S. Alavi-Soltani, S. Sabzevari, H. Koushyar and B. Minaie
Abstract
Thermal, rheological, and mechanical properties of a commercial carbon fiber epoxy prepreg, Cycom 977-2 UD, were
obtained for isothermal cure temperatures ranging from 149�C to 182�C. For each cure profile, an encapsulated-sample
rheometer (ESR) was used to measure the storage modulus. Each ESR cure profile was followed by the glass transition
temperature (Tg) test. The degree of cure (�) during cure and the heat of reaction of the prepreg were obtained using a
differential scanning calorimeter (DSC). Combined loading compression (CLC) and short-beam shear (SBS) tests were
performed to obtain compressive properties and SBS strength, respectively. It was observed that the compressive
properties did not vary significantly for the studied isothermal cure temperatures; likewise, the compressive failure
mode was the same for all the CLC specimens. However, the SBS strength for the specimens cured at 149�C was
approximately 10% less than that of those cured at isothermal cure temperatures ranging from 160�C to 182�C. Further,
the failure mode of the SBS specimens cured at 149�C was also different from other specimens. The storage modulus of
the ESR sample cured at 149�C also showed a 10% decrease compared to other ESR samples. The SBS strength exhibited
a good correlation with the storage modulus and a weak correlation with Tg and �.
Keywords
Epoxy prepreg, cure temperature variation, degree of cure, rheological properties, mechanical properties
Introduction
Obtaining the best material properties is paramount tocomposite manufacturers, as mechanical propertiessuch as tensile, compressive, shear, and flexuralstrength are critical structural design parameters.While many factors affect these properties, a crucialcontributor to composite part efficacy is cure cycle.Therefore, it is important to properly cure compositematerials.
The effect of cure cycle on the mechanical propertiesof thermosetting resins and composites has been previ-ously investigated. Levita et al.1 studied the mechanicalproperties of ATBN resin blends cured at different iso-thermal cure temperatures ranging from 10�C to 160�C.They reported that the samples cured in the range of120�C to 140�C for 15 h had the highest fracture tough-ness. Lee and Springer2 measured the tensile, compres-sive, and shear properties of Fiberite T300/976laminates over a wide range of degrees of cure from0.6 to 0.96. They observed that laminate compressive
strength was gradually reduced by decreasing thedegree of cure and that other mechanical propertiesremained unchanged. The work conducted byAmdouni et al.3 suggested that the elastic modulus ofDGEBA-DDA epoxy resin was not significantlyaffected by the cross-linking density; however, epoxycompressive strength was reduced with decreasingcross-linking density. White and Hahn4 showed thatthe longitudinal and transverse mechanical propertiesof the IM6/3100 graphite/BMI prepreg increased ascure advanced. This increase was attributed to develop-ment of the fiber/resin bond as well as increases in resinstrength and stiffness as cure advanced.
Department of Mechanical Engineering, Wichita State University,
Wichita, KS, USA
Corresponding author:
B Minaie, Department of Mechanical Engineering, Wichita State
University, Wichita, KS 67260, USA
Email: [email protected]
Journal of Composite Materials
46(5) 575–587
! The Author(s) 2011
Reprints and permissions:
sagepub.co.uk/journalsPermissions.nav
DOI: 10.1177/0021998311415443
jcm.sagepub.com
at PENNSYLVANIA STATE UNIV on September 18, 2016jcm.sagepub.comDownloaded from
Ziaee and Palmese5 investigated the fracture tough-ness of vinyl-ester resin samples isothermally cured ateither 30�C for 2.5 h or at 90�C for 2 h and subse-quently postcured at 125�C for 2 h. They found thatthe strength and fracture toughness for the samplescured at 30�C were significantly higher than thosecured at 90�C. Ganglani et al.6 reported an improve-ment in the tensile strength of vinyl-ester resin sampleswhen the isothermal cure temperature was increasedfrom 30�C to 90�C while the isothermal cure time wasdecreased from 15 to 2 h. These samples were postcuredat 135�C for 2 h. Li et al.7 showed that the tensile andflexural strength of vinyl-ester resin samples isother-mally cured at 80�C for 3 h improved after the sampleswere postcured at 135�C for 1 h. Ruiz and Trochu8
developed a numerical cure cycle optimization modelto reduce the residual stresses in thick compositeparts manufactured by resin transfer molding.Gernaat9 observed that the mechanical properties ofthe Cycom 5215 PW prepreg remained unchangedover the isothermal cure temperature range of 93�Cto 127�C; however, a significant reduction in theshort-beam shear (SBS) and combined loading com-pression (CLC) strengths was reported for the samplescured isothermally at 82�C.
It is well-known that cure extent affects resin-domi-nated composite material mechanical properties (com-pressive and interlaminar shear strengths, for example)more than fiber-dominated mechanical properties suchas tensile strength.9 In thermosetting composites, thecure extent governs resin cross-linking density whichaffects the resin yield stress.3,10 The yield stress of ther-mosetting resins at temperatures below Tg is related tothe Tg by the following Equation (10):
�y ¼ �yg þ bðTg � TÞ ð1Þ
where �y is the yield stress, �yg is the yield stress at Tg, Tis the temperature, Tg is the glass transition tempera-ture (Tg), and b is a positive proportionality constantobtained by experiment. The elastic modulus, however,is dominated by inter-chain interactions on a locallength scale at temperatures below Tg and is thereforenot strongly affected by the cross-linking density.3,10
Composite material manufacturers often provide amanufacturer-recommended cure (MRC) cycle for agiven composite material,11 and depending on thedesired material features and applications more thanone cure cycle may be developed. The MRC cycle,which is found empirically, should meet certain require-ments such as consolidating the composite laminate tothe prescribed degree, curing the resin fully, reducingthe porosity to a minimal level,12 and minimizing thecure process cost by optimizing the cure time, temper-ature, and pressure.13
During production curing of composites, deviationsfrom the MRC are inevitable. These deviations, how-ever, do not necessarily alter the material propertiessignificantly.14 If the material properties are monitoredduring cure, corrective action may be taken to preventsignificant deviation from the MRC cycle. Typically,changing the cure temperature or pressure is all thatis required.
The most commonly used methods to determinematerial condition during cure are monitoring thedegree of cure (�) and the viscosity/viscoelastic proper-ties. Investigators have made some effort over the yearsto use ultrasonic-based in-situ sensors to measure com-posite materials mechanical properties, such as elasticmoduli, during cure.15 Establishing a strong correlationbetween the state of the material, as measured by themonitoring sensors, and the mechanical properties canaddress the process engineer’s need for knowledge ofmaterial properties during cure.
This paper reports the effect of cure temperaturevariation on material properties and presents an inves-tigation into the correlation between mechanical prop-erties and the properties measured by the ex-situ curemonitoring sensors (i.e., differential scanning calorime-ter [DSC] and rheometer).
Theory
Thermal analysis
The degree of cure at time t during cure is given by4:
�ðtÞ ¼HðtÞ
HUð2Þ
where �(t) is the degree of cure, and H(t) is the totalamount of heat released from the sample from time 0 totime t during cure (Figure 1) and is defined as:
HðtÞ ¼
Z t
0
dQ
dt
� �dt ð3Þ
HU, the ultimate heat of reaction, is defined as:
HU ¼ HT þHres ð4Þ
where HT is the total heat released during cure and Hres
the area under the heat flow curve determined bydynamic scanning performed immediately after theend of the cure cycle, is defined as:
Hres ¼
Z te
ts
dQ
dt
� �dt ð5Þ
576 Journal of Composite Materials 46(5)
at PENNSYLVANIA STATE UNIV on September 18, 2016jcm.sagepub.comDownloaded from

where ts and te represent the start and end times, respec-tively, of the exothermic reactions during dynamicscanning.
Substituting Equation (4) into Equation (2), thedegree of cure becomes:
�ðtÞ ¼HðtÞ
HT þHresð6Þ
Subsequently, the rate of the degree of cure is:
d�ðtÞ
dt¼
1
HT þHres
dHðtÞ
dtð7Þ
While some investigators assume that HU is a mate-rial property and independent of the cure cycle,16 othersassume that HU depends on the cure cycle.4 The latterassumption was used in this study as it provided abetter description of the subject prepreg. It is importantto note that for a fully cured resin, � is equal to one,whereas for an uncured resin, � equals zero. Since pre-preg resin is partially cured, the initial degree of curefor the prepreg, �0, is greater than zero; however, theexact value of �0 is usually unknown. As such, it istypically assumed that �0 equals zero.4,17 This is whyresearchers may refer to the prepreg � as the relativeconversion or relative a.18
Rheological analysis
In order to obtain viscoelastic properties of the sampleduring cure, the rheometer applies a sinusoidal shearstrain with frequency f to a cylindrical sample. Theapplied shear strain is then19:
� ¼ �0 sinð!tÞ ð8Þ
where � is the sinusoidal strain, ! (¼2�f) is the angularfrequency of the strain, and �0 is the amplitude of thestrain.
If the shear strain amplitude is appropriately small,the relation between the shear strain and stress will belinear.20 Therefore, the shear stress response of the vis-coelastic sample, �, will be sinusoidal with a phase lag �and amplitude �0:
� ¼ �0 sinð!tþ �Þ ð9Þ
where � is the shear stress response of the viscoelasticsample, �0 is the amplitude of the stress, and � is thephase lag of the stress response. It is notable that for apure elastic material, �¼ 0o, whereas for a pure viscousmaterial, �¼ 90o, and for a viscoelastic material,0o<�< 90o. The stress response equation can be rewrit-ten as:
� ¼ ð�0 cos �Þ sinð!tÞ þ ð�0 sin �Þ cosð!tÞ ð10Þ
To express the response of the viscoelastic materialin terms of shear modulus, both sides of Equation (10)are divided by the strain amplitude �0:
�
�0¼�0 cos �
�0sinð!tÞ þ
�0 sin �
�0cosð!tÞ ð11Þ
G ¼ G0 sinð!tÞ þ G00 cosð!tÞ ð12Þ
where G is the shear relaxation modulus, G0 (¼�0 cosd/�0) is the storage modulus representing the energy stor-age (the elastic portion of the viscoelastic material’sbehavior), and G00 (¼�0 sind/�0) is the loss modulusrepresenting the energy loss. The tangent of the phaselag, tan�, is equal to the ratio of the loss modulus to thestorage modulus, G00/G0, and is a measure of energy
Figure 1. Heat flow of thermosetting resin during cure measured by differential scanning calorimeter (DSC) using dynamic scanning
and isothermal scanning.17.
Alavi-Soltani et al. 577
at PENNSYLVANIA STATE UNIV on September 18, 2016jcm.sagepub.comDownloaded from

dissipation. Parameters G0, G00, and tan� are viscoelasticproperties of the material.
Materials and methods
Material
A commercial prepreg manufactured by Cytec, Cycom977-2 UD, was used. This prepreg is a 177�C curing-toughened epoxy resin reinforced by unidirectional(UD) carbon fiber and designed for autoclaving orpress-mold curing. It is mainly used for primary andsecondary aircraft structures, space applications, ballis-tics, cryogenic tanks, and any application where impactresistance and light weight are required. The Cytec-recommended cure cycle for this prepreg is isothermalcure at 177�C for 180 minutes.
Cure cycles
Table 1 shows the isothermal cure cycles used for thisstudy. All cure cycles started and ended at room tem-perature. The cure cycles were designed to evaluate theeffect of isothermal cure temperature variation on pre-preg properties for cure temperatures both above andbelow the manufacturer’s recommended cure tempera-ture (177�C).
DSC testing
Weighing between 10 and 15mg, the prepreg sampleswere encapsulated in Tzero aluminum pans and subse-quently cured in a TA Instruments Q2000 DSC usingthe temperature profiles shown in Table 1.
Rheometry testing
Rheometer samples were cured in an ATD CSS 2000rheometer with 41.3mm diameter serrated parallelplates using the temperature profiles indicated inTable 1. Sample storage modulus was measured inreal-time during cure. To eliminate the effect of aging
on Tg of the samples, the Tg test was performed imme-diately after the cure cycle. The effect of aging on com-posite material properties has been explained in detailelsewhere.21 For the Tg test, a constant heat-up rate of5�C/min, frequency of 1Hz, and rotation angle of 0.05degrees were used in accordance to SACMA SRM18R-94 standard,22 and the same frequency and rotationangle were used for the isothermal cure cycles. Thesamples, taken from a 28-ply symmetric laminate [(0/90/90/0)7], weighed approximately 6.5 g. The nominalcured sample thickness was 3.5mm. It was not possibleto test thicker samples with the rheometer.
Mechanical testing
CLC and SBS tests are commonly used to obtain themechanical properties of aerospace composite mate-rials.23 CLC tests provide compressive modulus,strength, and Poisson’s ratio, while SBS tests provideonly SBS strength. Although the SBS test is used exten-sively to assess the interlaminar (short-beam) shear ofcomposite materials in industry, SBS strength is notrelated to any material property due to the diversityof failure modes that may happen in SBS specimensand the complexity of internal stresses caused by theSBS test itself.24 The CLC test is widely accepted inindustry due to simple and inexpensive sample prepa-ration.25 Moreover, the unique CLC test fixture reducesunacceptable end-crushing failures prevalent in othermethods (i.e., ASTM D695)26 making this test veryreliable.
The CLC and SBS tests were performed at roomtemperature on five specimens cut from five panelscured in an autoclave using the cure cycles shown inTable 1. The obtained mechanical and physical proper-ties are listed in Table 2. Unidirectional tape was usedto lay up the 32-ply symmetric laminate [(0/90/90/0)8].To avoid Euler buckling in the CLC specimens asrequired by ASTM D6641, 32 prepreg layers wereused for panel fabrication. The cure pressure for allpanels was 586 kPa.
Results and discussion
Degree of cure and heat of reaction
The heat released by the prepreg samples during curewas measured using the DSC. The measured heat wasused to calculate �. Degree of cure during cure for thestudied isothermal cure temperatures is shown inFigure 2. The degree of cure increased rapidly at thebeginning of each cure cycle before slowing onapproaching the limit value. The initial rapid increasein the degree of cure indicates a high cross-linking reac-tion rate; as such, the curing reactions were kinetics-
Table 1. Isothermal cure cycles used in this study
Cure temperature
(�C)
Cure time
(min)
Heat-up
(�C/min)
Cool-down
(�C/min)
182 180 2.8 2.8
177a 180 2.8 2.8
171 180 2.8 2.8
160 180 2.8 2.8
149 180 2.8 2.8
aManufacturer’s recommended cure cycle.
578 Journal of Composite Materials 46(5)
at PENNSYLVANIA STATE UNIV on September 18, 2016jcm.sagepub.comDownloaded from

controlled in this region. As the degree of cureapproached its limit, the cross-linking reaction rateslowed significantly indicating diffusion-controlledcuring reactions. The final degree of cure for differentisothermal cure temperatures is shown in Figure 3. Asindicated, � decreased as the isothermal cure tempera-ture decreased.
Table 3 shows HT, Hres, HU, and the final degree ofcure for a wide range of isothermal cure temperatures.As indicated, HU and HT for the studied cure temper-atures varied inconsistently when decreasing the curetemperature. To further investigate the observed incon-sistency, the heat of reaction was measured for addi-tional cure temperatures. As the table shows, noparticular trend was found for HU variation with curetemperature. However, HT decreased as the cure tem-perature decreased from 160�C to 121�C. Moreover, itwas observed that the final degree of cure and Hres,unlike HU and HT, varied consistently with cure tem-perature over the entire range of isothermal cure tem-peratures. Hres increased and the final � decreased withdecreasing isothermal cure temperature. Similar behav-ior was observed by White and Hahn4 for the IM6/3100graphite/BMI prepreg. Fluctuations in HU could berelated to the variation in the fiber and resin content,as the heat of reaction is normalized by the mass of the
prepreg sample consisting of both fiber and resin. Evenfor the samples taken from the same batch of prepreg, aslight increase in the fiber content results in a lower heatof reaction, as the fiber does not contribute to thisvalue.
It is important to note that using the DSC-measureddegree of cure for real-time monitoring of the cure pro-cess is impossible since the ultimate heat of reactionneeded for degree of cure calculations is obtainedonly after the end of the cure cycle.
Storage modulus
The storage modulus, degree of cure, and cure temper-ature measured during cure and subsequent postcurecycle for curing at 177�C are shown in Figure 4. Atthe start of the cure cycle (the first 50 minutes), curetemperature had a dominant effect. At this stage, thedegree of cure was almost zero, indicating occurrence oflittle or no curing reactions. In the temperature-domi-nated region, the storage modulus decreased withincreasing cure temperature. Nevertheless, the effectof cross-linking became more dominant as the cure pro-ceeded. At this stage, cross-linking reactions occurredat an increasing rate, resulting in the rapid climb of thedegree of cure curve. Moreover, the storage modulus
Table 2. Measured mechanical and physical properties
Measured property Test method Standard
Short-beam shear strength Short-beam shear ASTM D2344
Compressive strength Combined loading compression ASTM D6641
Compressive modulus Combined loading compression ASTM D6641
Compressive Poisson’s ratio Combined loading compression ASTM D6641
Void volume content Acid digestion ASTM D3171
Figure 2. Degree of cure during cure. Figure 3. Final degree of cure.
Alavi-Soltani et al. 579
at PENNSYLVANIA STATE UNIV on September 18, 2016jcm.sagepub.comDownloaded from

increased significantly as the mobility of the prepregresin became progressively restricted due to intermole-cular cross-linking.27 The degree of cure approached aplateau value after 200 minutes, which indicated com-pletion of the curing reactions.
Figure 5 shows the real-time measured G0 duringcure for the studied isothermal cure temperatures. Asindicated, G0 graphs represent the cure state of thematerial throughout the cure cycle. In addition, thegelation point (at which the slope of G0 tends to infinity)is visible for all the cure cycles. Thus, G0 appears to bean appropriate option for monitoring material stateduring cure. Note that G0 for the sample cured at149�C was less than that of the other samples through-out the cool-down stage. As explained later, this indi-cates that G0 can be correlated to the SBS strength ofthe material. The storage modulus plateau was notachieved for the samples cured at 160�C and 149�C,which indicates incomplete curing. However, the G0 pla-teau for both cure temperatures was achieved after theisothermal cure time was increased to 400min. When
the storage modulus plateau was achieved, no furtherchange in G’ with time was observed, and G’ did notincrease significantly as the cool-down stage began asindicated in Figure 6.
The final storage modulus for different isothermalcure temperatures is shown in Figure 7. These valueswere obtained by taking the average of G0 during thecool-down stage.
Glass transition temperature
G0 of thermosetting resins and composites decreases sig-nificantly in the glass transition region.28 To obtain Tg,G0 was plotted vs. temperature in a semi-logarithmicscale. As Figure 8 shows, Tg was determined to be thetemperature corresponding to the point of intersectionof two lines. The first line was tangent to the storagemodulus curve before the transition. The second linewas tangent to the storage modulus curve approxi-mately at the midpoint of G0 drop-off.22 Figure 9shows Tg for different isothermal cure temperatures.As indicated, Tg gradually increased in value as theisothermal cure temperature increased. For the samples
Table 3. Heat of reaction and final degree of cure of 977-2 UD for cure at different isothermal cure temperatures for 180 min
Cure temperature (�C) HT (J/g) Hres (J/g) HU (J/g) Final a
188 121.90 4.51 126.42 0.96
182 111.95 8.01 119.96 0.93
177 128.45 10.94 139.39 0.92
171 105.14 16.39 121.53 0.87
160 121.74 27.78 149.52 0.81
149 119.48 52.22 171.70 0.70
135 68.06 71.39 139.45 0.49
121 23.70 113.26 136.96 0.17
Figure 4. Storage modulus, degree of cure, and cure tem-
perature measured during cure and subsequent post-cure cycle
for curing at 177 C.
Figure 5. Storage modulus during cure and cool-down stage.
580 Journal of Composite Materials 46(5)
at PENNSYLVANIA STATE UNIV on September 18, 2016jcm.sagepub.comDownloaded from

cured at 171�C to 182�C, Tg was very close to the iso-thermal cure temperature; however, Tg of the samplescured at 149�C and 160�C was considerably less thanthe isothermal cure temperature. The observed drop inTg was related to incomplete sample cure.
Short-beam shear properties
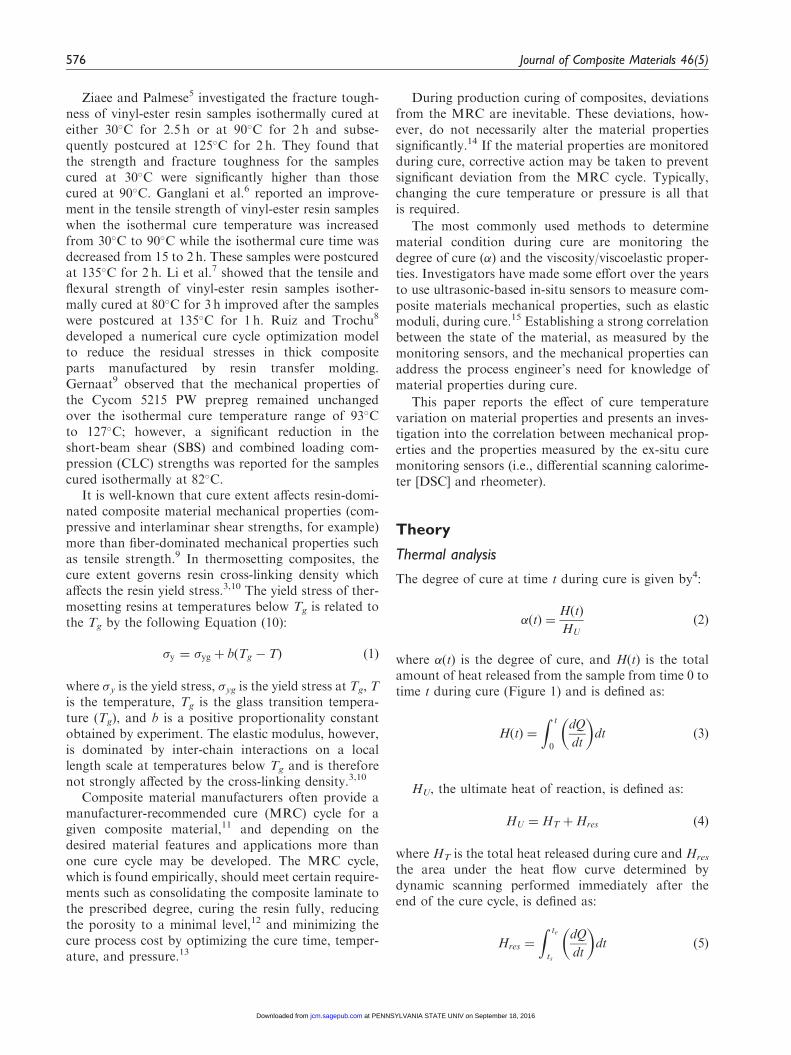
Figure 10 shows average SBS strength and standarddeviation for each of the studied isothermal cure tem-peratures. One-way analysis of variance (ANOVA)with MinitabTM (Figure 11) showed that the averageSBS strength of the specimens cured at 149�C was sig-nificantly less than other specimens. Overlapping con-fidence intervals in ANOVA indicates there is nostatistically significant difference between the datasets. In addition to the average SBS strength, the failuremode for the specimens cured at 149�C was alsodifferent.
To further investigate the failure mode for differentisothermal cure temperatures, the SBS specimens were
Figure 6. Storage modulus during cure for the samples cured
at 160�C and 149�C for 180 and 400 min.
Figure 7. Final storage modulus obtained during cool-down
stage.
Figure 8. Glass transition temperature determination method.
Figure 9. Glass transition temperature measured with encap-
sulated-sample rheometer (ESR).
Figure 10. Average short-beam shear strength with error bars
representing standard deviation.
Alavi-Soltani et al. 581
at PENNSYLVANIA STATE UNIV on September 18, 2016jcm.sagepub.comDownloaded from
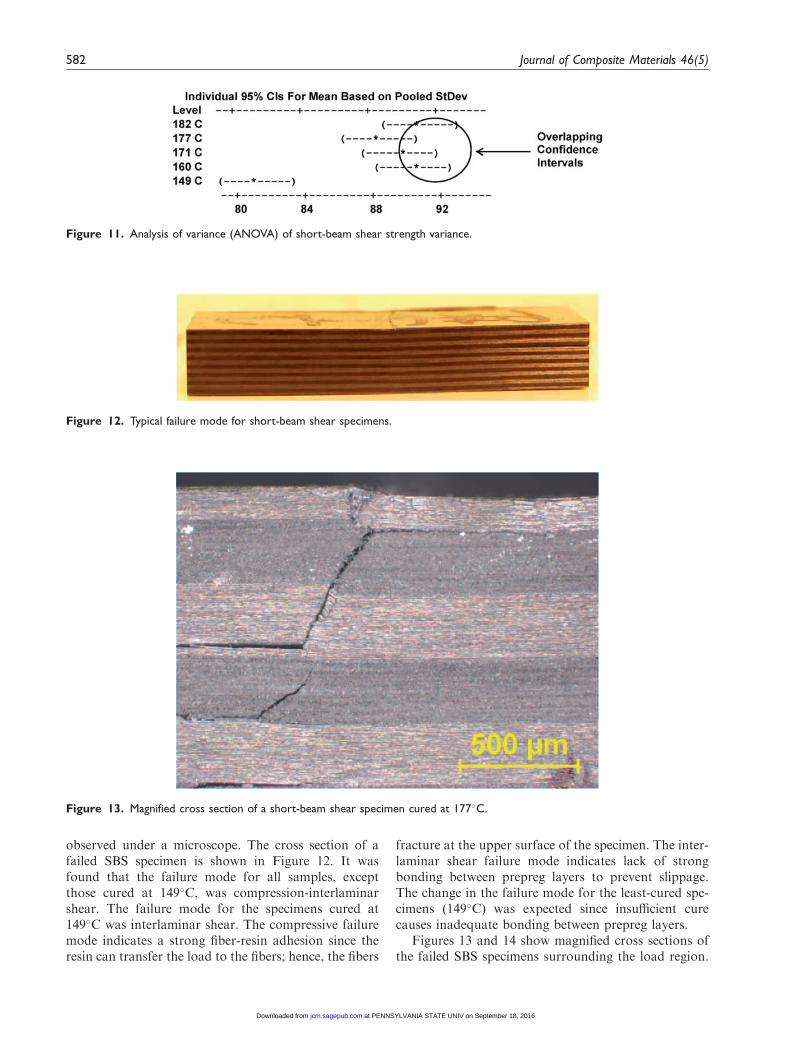
observed under a microscope. The cross section of afailed SBS specimen is shown in Figure 12. It wasfound that the failure mode for all samples, exceptthose cured at 149�C, was compression-interlaminarshear. The failure mode for the specimens cured at149�C was interlaminar shear. The compressive failuremode indicates a strong fiber-resin adhesion since theresin can transfer the load to the fibers; hence, the fibers
fracture at the upper surface of the specimen. The inter-laminar shear failure mode indicates lack of strongbonding between prepreg layers to prevent slippage.The change in the failure mode for the least-cured spe-cimens (149�C) was expected since insufficient curecauses inadequate bonding between prepreg layers.
Figures 13 and 14 show magnified cross sections ofthe failed SBS specimens surrounding the load region.
Figure 11. Analysis of variance (ANOVA) of short-beam shear strength variance.
Figure 12. Typical failure mode for short-beam shear specimens.
Figure 13. Magnified cross section of a short-beam shear specimen cured at 177�C.
582 Journal of Composite Materials 46(5)
at PENNSYLVANIA STATE UNIV on September 18, 2016jcm.sagepub.comDownloaded from

The compressive failure for every specimen except thosecured at 149�C started under the load region, and theresulting crack propagated into different layers of thespecimen, causing delamination (Figure 13). For speci-mens cured at 149�C, failure was due to interlaminarshear at multiple locations (Figure 14). The failuremodes for all the SBS specimens were acceptableaccording to ASTM D2344.24
Compressive properties
Figure 15 illustrates average CLC strength and stan-dard deviation for the studied isothermal cure temper-atures. The overlapping confidence intervals obtainedfrom one-way ANOVA analysis of the CLC strength(Figure 16) indicated that there was no statistically sig-nificant difference between the average CLC strengthvalues. However, the average CLC strength for thesamples cured at temperatures ranging from 149�C to171�C gradually decreased with decreasing cure tem-perature. This could be due to the fact that the yieldstress of thermosetting resins at temperatures below Tg
is influenced by the degree of cure; the lower the degreeof cure, the smaller the compressive yield stress.
Average compressive modulus for the studied iso-thermal cure temperatures is illustrated in Figure 17.The modulus was obtained using the slope of thelinear portion of the stress-strain curve for each speci-men. One-way ANOVA showed that the average valuesof CLC modulus did not vary significantly for differentcure temperatures (Figure 18). As mentioned
Figure 14. Magnified cross section of a short-beam shear specimen cured at 149�C.
Figure 15. Average combined loading compression strength
with error bars representing standard deviation.
Figure 16. Analysis of variance (ANOVA) of combined loading
compression strength variance.
Alavi-Soltani et al. 583
at PENNSYLVANIA STATE UNIV on September 18, 2016jcm.sagepub.comDownloaded from
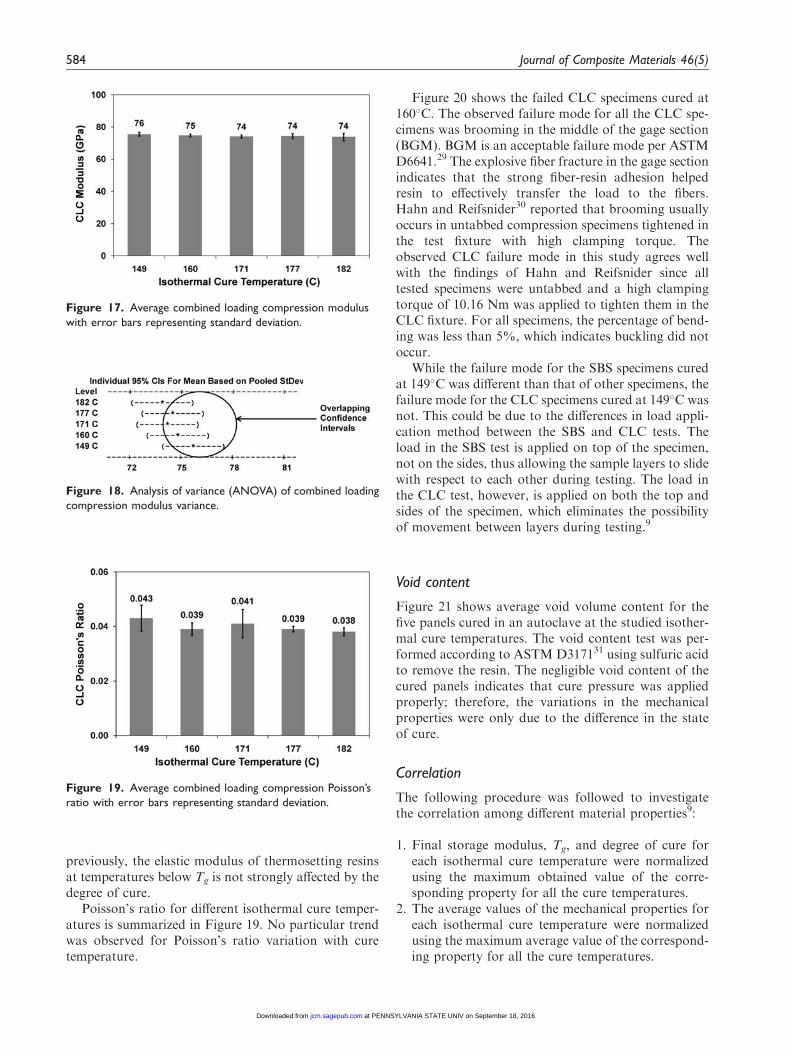
previously, the elastic modulus of thermosetting resinsat temperatures below Tg is not strongly affected by thedegree of cure.
Poisson’s ratio for different isothermal cure temper-atures is summarized in Figure 19. No particular trendwas observed for Poisson’s ratio variation with curetemperature.
Figure 20 shows the failed CLC specimens cured at160�C. The observed failure mode for all the CLC spe-cimens was brooming in the middle of the gage section(BGM). BGM is an acceptable failure mode per ASTMD6641.29 The explosive fiber fracture in the gage sectionindicates that the strong fiber-resin adhesion helpedresin to effectively transfer the load to the fibers.Hahn and Reifsnider30 reported that brooming usuallyoccurs in untabbed compression specimens tightened inthe test fixture with high clamping torque. Theobserved CLC failure mode in this study agrees wellwith the findings of Hahn and Reifsnider since alltested specimens were untabbed and a high clampingtorque of 10.16 Nm was applied to tighten them in theCLC fixture. For all specimens, the percentage of bend-ing was less than 5%, which indicates buckling did notoccur.
While the failure mode for the SBS specimens curedat 149�C was different than that of other specimens, thefailure mode for the CLC specimens cured at 149�C wasnot. This could be due to the differences in load appli-cation method between the SBS and CLC tests. Theload in the SBS test is applied on top of the specimen,not on the sides, thus allowing the sample layers to slidewith respect to each other during testing. The load inthe CLC test, however, is applied on both the top andsides of the specimen, which eliminates the possibilityof movement between layers during testing.9
Void content
Figure 21 shows average void volume content for thefive panels cured in an autoclave at the studied isother-mal cure temperatures. The void content test was per-formed according to ASTMD317131 using sulfuric acidto remove the resin. The negligible void content of thecured panels indicates that cure pressure was appliedproperly; therefore, the variations in the mechanicalproperties were only due to the difference in the stateof cure.
Correlation
The following procedure was followed to investigatethe correlation among different material properties9:
1. Final storage modulus, Tg, and degree of cure foreach isothermal cure temperature were normalizedusing the maximum obtained value of the corre-sponding property for all the cure temperatures.
2. The average values of the mechanical properties foreach isothermal cure temperature were normalizedusing the maximum average value of the correspond-ing property for all the cure temperatures.
Figure 17. Average combined loading compression modulus
with error bars representing standard deviation.
Figure 18. Analysis of variance (ANOVA) of combined loading
compression modulus variance.
Figure 19. Average combined loading compression Poisson’s
ratio with error bars representing standard deviation.
584 Journal of Composite Materials 46(5)
at PENNSYLVANIA STATE UNIV on September 18, 2016jcm.sagepub.comDownloaded from

3. The graphs for different normalized propertieswere overlaid to observe the possible similaritiesin trends.
Normalized properties were used to investigate cor-relation. It is important to note that for the studiedisothermal cure temperatures, the mechanical proper-ties, except SBS strength, showed no statistically signif-icant difference. As such, no correlation between thesemechanical properties and other material propertieswas found.
Figures 22 and 23 show normalized mechanicalproperties, final storage modulus, Tg, and final � for
all cure temperatures. As observed, Tg and final �decreased with decreasing isothermal cure temperature.This is in contrast to final storage modulus, whichremained fairly constant at all the isothermal cure tem-peratures, except for 149�C. The average SBS strengthof the specimens cured at 149�C was 10% less than thatof the specimens cured at 160�C. As Figure 22 shows,the final storage modulus trend was similar for thesetwo cure temperatures. Therefore, the storage modulusis a good candidate for correlation with the SBSstrength. Moreover, the average SBS strength of thespecimens cured at 160�C to 182�C did not show any
Figure 22. Normalized short-beam shear strength, Final G,
Tg, and final degree of cure.
Figure 20. Compressive failure mode for combined loading compression specimens cured at 160�C.
Figure 21. Average void volume content of the panels cured in
an autoclave with error bars representing standard deviation.
Alavi-Soltani et al. 585
at PENNSYLVANIA STATE UNIV on September 18, 2016jcm.sagepub.comDownloaded from

considerable difference. This trend was also similar tothat of the final storage modulus for these isothermalcure temperatures.
Conclusions
Final viscoelastic and mechanical properties of 977-2UD did not vary significantly over isothermal cure tem-peratures ranging from 160�C to 182�C. This suggeststhat composite materials that might otherwise berejected due to cure temperature variation could stillattain acceptable mechanical properties, even if theywere cured at temperatures lower than the vendor’sspecifications. The results also supported the possibilityof correlation between the viscoelastic and mechanicalproperties. The least-cured specimens (those cured at149�C) attained a final degree of cure of 0.7 and theirSBS strength was approximately 10% less than that ofother specimens with � ranging from 0.81 to 0.93. Thestorage modulus for the 149�C cured sample was 10%less than that of other samples during the cool-downstage. As such, the SBS strength showed a good corre-lation with the storage modulus. The SBS strength hada weak correlation with Tg and � for the studied iso-thermal cure temperatures, but Tg had a strong corre-lation with �.
The drop-off in SBS strength for the least-cured spe-cimens was accompanied by a change in failure mode.The failure mode for all the SBS specimens other thanthose cured at 149�C was compression-interlaminarshear. The failure mode for the SBS specimens curedat 149�C was interlaminar shear. The compressiveproperties did not vary significantly for the studied iso-thermal cure temperatures, and the failure mode for all
the CLC specimens was brooming in the middle of thegage section.
The results presented in this paper suggest that anencapsulated-sample rheometer (ESR) can be used asan ex-situ cure-monitoring instrument to monitor auto-clave/oven curing; hence, eliminate the need for multi-ple measurement instruments. Obtained usingthermocouples attached to a composite part in an auto-clave/oven, the cure time-temperature data would bethe only required input to monitor the cure.
Acknowledgements
The authors gratefully acknowledge financial support fromthe National Aeronautics and Space Administration (Grant
No. NNX09AO58A).
References
1. Levita G, Marchetti A and Butta E. Influence of the tem-
perature of cure on the mechanical properties of ATBN/
epoxy blends. Polymer 1985; 26: 1110–1116.2. Lee SY and Springer GS. Effects of cure on the mechan-
ical properties of composites. J Compos Mater 1988; 22:
15–29.3. Amdouni N, Sautereau H, Gerard J and Pascault J.
Epoxy networks based on dicyandiamide: effect of the
cure cycle on viscoelastic and mechanical properties.Polymer 1990; 31: 1245–1253.
4. White SR and Hahn HT. Process modeling of compositematerials: residual stress development during cure. Part
II. Experimental validation. J Compos Mater 1992; 26:2423–2453.
5. Ziaee S and Palmese GR. Effects of temperature on curekinetics and mechanical properties of vinyl-ester resins. J
Polymer Sci Polymer Phys 1999; 37: 725–744.6. Ganglani M, Carr SH and Torkelson JM. Influence of
cure via network structure on mechanical properties of afree-radical polymerizing thermoset. Polymer 2002; 43:
2747–2760.7. Li P, Yang X, Yu Y and Yu D. Cure kinetics, microhe-
terogeneity, and mechanical properties of the high-tem-
perature cure of vinyl ester resins. J Appl Polymer Sci2004; 92: 1124–1133.
8. Ruiz E and Trochu F. Numerical analysis of cure tem-perature and internal stresses in thin and thick RTM
parts. Compos Appl Sci Manuf 2005; 36: 806–826.9. Gernaat CR. Correlation between rheological and
mechanical properties in a low-temperature cure prepregcomposite, MSc Thesis, Wichita State University,
Wichita, KS, 2008.10. Bicerano J. Prediction of polymer properties. New York,
NY: Marcel Dekker Inc., 2002.11. White SR and Kim YK. Effects of staged curing on
mechanical properties of thermosetting matrix compos-ites, In: Proceedings of the 7th Technical Conference of
the American Society for Composites, Lancaster, PA.
1992.12. Mallick PK. Composites engineering handbook. New
York, NY: Marcel Dekker Inc., 1997.
Figure 23. Normalized combined loading compression
strength, combined loading compression, modulus, final G, Tg, and
final degree of cure.
586 Journal of Composite Materials 46(5)
at PENNSYLVANIA STATE UNIV on September 18, 2016jcm.sagepub.comDownloaded from

13. Berenberg B. Improving autoclave performance. High-performance composites, http://www.compositesworld.com/articles/improving-autoclave-performance (2003, accessed
December 2009).14. Gernaat C, Alavi-Soltani S, Guzman M, Rodriguez A,
Minaie B and Welch J. Correlation between viscoelasticand mechanical properties for an out-of-autoclave poly-
mer composite, In: SAMPE Fall Technical Conference,Wichita, KS. 2009.
15. Chen JY, Hoa SV, Jen CK, Viens M and Monchalin JP.
Ultrasonic evaluation of graphite/epoxy composites withdifferent curing conditions. Polymer Compos 1998; 19:225–232.
16. Sun LF. Thermal rheological analysis of cure process ofepoxy prepreg, PhD Thesis, Louisiana State University,Baton Rouge, LA, 2002.
17. Lee W, Loos AC and Springer GS. Heat of reaction,degree of cure, and viscosity of Hercules 3501-6 resin.J Compos Mater 1982; 16: 510–520.
18. Hargis M, Grady BP, Aktas L, Bomireddy KR,
Howsman S, Altan MC, et al. Calorimetric and rheolog-ical measurements of three commercial thermosettingprepreg epoxies. J Compos Mater 2006; 40: 873–897.
19. Kumar A and Gupta RK. Fundamentals of polymer engi-neering. New York, NY: Marcel Dekker Inc., 2003.
20. Brinson HF and Brinson LC. Polymer engineering science
and viscoelasticity: an introduction. New York, NY:Springer, 2007.
21. Miranda Guedes R, Morais J, Marques A and Cardon A.Prediction of long-term behaviour of composite mate-
rials. Comp Struct 2000; 76: 183–194.22. SACMA Recommended Method SRM 18R-94. SACMA
recommended method for glass transition temperature
(Tg) determination by DMA of oriented fiber-resin com-posites, Suppliers of Advanced Composite MaterialsAssociation, Arlington, Virginia, 1994.
23. Baker A, Dutton S and Kelly D. Composite materials foraircraft structures. Reston. VA: AIAA, 2004.
24. ASTM D2344/D2344M-00. Standard test method for short-beam strength of polymer matrix composite materials and
their laminates. Philadelphia, PA: ASTM International,2000.
25. Adams D . Current compression test methods. High
performance composites. http://www.compositesworld.com/articles/current-compression-test-methods (2005,accessed December 2009).
26. ASTM D695-02a. Standard test method for compressiveproperties of rigid plastics. Philadelphia, PA: ASTMInternational, 2002.
27. Lee SM. Handbook of composite reinforcements.Weinheim, Germany: Wiley-VCH, 1992.
28. Menard KP. Dynamic mechanical analysis a practicalintroduction. Boca Raton, FL: Taylor & Francis Group
LLC, 2008.29. ASTM D6641/D6641M-01. Standard test method for
determining the compressive properties of polymer
matrix composite laminates using a combined loadingcompression (CLC) test fixture. Philadelphia, PA:ASTM International, 2001.
30. Hahn S and Reifsnider K. Combined shear and endloaded compression strength testing of advanced compos-ite materials. In: Proceedings of the 6th Japan-U.S.Conference on Composite Materials, Orlando, FL. 1992.
31. ASTM D3171-99. Standard test method for constituentcontent of composite materials. Philadelphia, PA: ASTMInternational, 1999.
Alavi-Soltani et al. 587
at PENNSYLVANIA STATE UNIV on September 18, 2016jcm.sagepub.comDownloaded from