thermodynamic and kinetic studies for the removal of
TRANSCRIPT
1
Thermodynamic and Kinetic Studies for the removal of Safranindye from aqueous solution Using NaP zeolite
synthesized from Coal Fly Ash
Payal Jain,b) Priyanka Shrivastava,c) Vibha Malviyad) Bijendra Raie)and M. K. Dwivedi,5,a)
Department of Chemistry, Govt. Holkar (Model, Autonomous) Science College, Indore, India) a)Corresponding author: [email protected]
b)[email protected] c)[email protected]
d)[email protected] e)[email protected]
Abstract. Zeolite was prepared from coal fly ash with sodium hydroxide in different concentration ratios at 550 °C with activation time of 12 hours by direct hydrothermal method.It was characterized by XRF,SEM, XRD and FTIR.Batch studies were conducted to study the effect of contact time, pH, amount of adsorbent, adsorbate concentration and temperature. The results revealed that the removal of Safranin dye was strongly pH dependent and maximum dye removal was observed at equilibrium pH of 9.0,optimum adsorbent dose and contact time were found to be 5 g/l and 180 minutes respectively. It was found that adsorption increased with increase in temperature thereby showing the process exothermic in nature.The experimental data were analyzed by Langmuir, Freundlich, Temkin and Dubnin isotherm models. The maximum removalof safranindye was found to be 97.14% at25 0C. The mechanism of adsorption was also investigated using kinetic models pseudo-first-order, pseudo-second-order,Elovichand Intra particle diffusion.
Keywords.Zeolite, adsorption, safranin, Langmuir, Freundlich,Temkin isotherm.
INTRODUCTION
A large number of dyes are produced annually and used in various industries liketextiles, cosmetics, paper, leather, pharmaceuticals and food. In textile industry, process of dyeing and printing colored productscontaminated wastewater with dyes. Discharge of contaminated wastewater without further treatment can seriously damage the environment [1].
Possible methods of removal of dyes from wastewaters include chemical oxidation, froth flotation, adsorption, coagulation, electro-dialysis, cloud point extraction etc. Among these, adsorption offers the best potential for overall treatment, and it can be expected to be useful for a wide range of compounds, more so than any of the other listed processes [2,3].
Adsorption process has proved highly effective for organic material like dyes from wastewater, a treatment that can economically meet current effluent standards and water reuse requirements [4].
The adsorbents are mainly derived from sources such as natural zeolite, coal, clay, ores and other waste resources. The adsorbents prepared from the waste resources used include petroleum wastes, sawdust, fertilizer waste, sugar industry wastes, coconut shell tannin-rich materials, blast furnace slag, chitosan and seafood residues, seaweed, algae, scrap tyres, fruit wastes and peat moss [5,6].
Commercial activated carbon is the most widely used as adsorbent material in the dyes removal [7, 8].Many natural materials were used as natural low cost adsorbents for the removal of dyes from wastewater such as orange

2
peel [9], rice husk[10], fly ash[11], papaya leaf[12], natural zeolite[13], chitosan films[14], calotropisgigantea [15], novel nonconventional activated carbon[16], peanut shell powder[17], cow dung ash[18], agricultural waste[19], sugar can stalks[20], modified pumice stone[21] and sugar cane bagasse [22].
Safranin is an azine dye which are amongst the oldest and most commonly known synthetic dyes. It’s water-soluble nature and intense reddish-brown color facilitates its use as food dye in flavoring and coloring cookies and candies. It is also used in dyeing of tannin, cotton, bast fibers, wool, silk, bast fibers, leather and paper. Due to its extensive use as colorant in food and textile industries it has been considered as the bulk dyes that is discarded as effluents from the textile and food industries. An exposure to this, causes irritation to respiratory systems, skin, as well as digestive tract infections when ingested [23, 24].Safranin has been considered as the model compound to speak to the colours that are delivered in effluents from the material and food ventures, it is also used as a colorant. Introduction to these effluents might be disturbing to respiratory frameworks, skin, and stomach related lot contaminations when ingested [25, 26].
There are seven thermal power stations in Madhya Pradesh, India which discharge 11.4186 million tons of fly ash every year. Out of it, only 4.1064 (35.96 %) million tons of fly ash utilized per year. In Madhya Pradesh 64.04 % of fly ash remaining unutilized per year according to Central Electricity Authority Thermal Civil Design Division 2016-17 [27].Fly ash and bottom ash contain silicon in abundance therefore these raw materials have been utilized for the production of mesoporous silica [28]. In spite of the good work, the adsorption ability of fly ash required to be further enhanced for the useful application in industry.
The present investigation has been taken to carry out the hydrothermal synthesis of zeolite from coal fly ash which has many advantages compared with the other methods in order to establish a more effective and environmentally friendly method for the treatment of coal fly ash and see its utility in the removal of Safranin dye from aqueous solution.
FIGURE1. Chemical structure of Safranin
MATERIAL AND METHODS
Materials
Coal fly ash was collected from H.E.G. Thermal Power Station, Mandideep, Bhopal, India. It was in the form of small, spherical greyish black particles. The sample collected was sieved to a desired particle size range (100 mesh size) then it was washed with distilled water to remove the adhering organic materials and finally dried in an oven at 1100C for 24 hours, post that it was stored in vacuum desiccator. Most of the reagents used in investigations were analytical grade chemicals.The stock solution was prepared in doubly distilled water using safranin dye.
Adsorbate
Safranin is one of the most normally utilized azinecolour dye, was used as anadsorbate. Safranin having chemical formula C20H19ClN4, Molecular weight 350.85 gram per mol. IUPAC name- 3, 7-Diamino -2, 8-dimethyl -5- Phenyl Phenazinium Chloride. A stock solution 1000ml was prepared by dissolving a weighed amount (1.0g) of safranin in one-liter distilled water. Different concentrations were prepared by diluting the stock solution with suitable volume of distilled water and the natural pH of the stock solution was around 5.6.

3
Zeolite Synthesis
The direct hydrothermal method was used for the synthesis of zeolites since it is fast, economic and less involving than the other fusion and the microwave methods [29-32].NaOH is added with coal flyash in different ratios of1:2, 1:1.5 and 1:1.2 and kept for fusion at varying temperatures of 350oC,450oC and 550oC for 12 hours. After this fusion mixtures were washed with double distilled water and agitated for 24 hours on magnetic stirrer to wash off excess of alkali, filtered on whatmann filter paper and dried in oven for 12 hours at 110oC and stored in desiccators before use.
Instrumentation
Safranin concentration was determined by UV-Visible spectrophotometer (Systronic, Model No. 104). pH of the solution was measured by a systronic pH meter (Model MK-V). X-ray measurements were done by Philips diffractometer (Philips BW 1710 model) employing nickel filtered Cu-Kα radiations. IR spectra of material was recorded on an infrared spectrophotometer (model perkin Elmer-1600 series).The surface area was measured with a model QS-7 Quantasorb surface area analyzer. The specific gravity was determined using specific gravity bottles. The Scanning Electron Microscopy (SEM) was carried out using model LEO 438 VP, UK to study micro structure and qualitative characteristics of the ash of the fly ash.
Sorption method
Batch experiments were performed for the determination of equilibrium time, pH, temperature, amount of adsorbent and initial adsorbate concentration. Synthetic wastewater sample (20 ml) of known concentration (100 mg/l) and pH with desired adsorbent dosage were agitated until the equilibrium was attained. pH was adjusted by adding either 0.1 M HCl or 0.1 M NaOH solution. After adsorption, all samples were filtered through whatmann filter paper (No. 41).
The equilibrium adsorption uptake and percentage removal of adsorbate from the aqueous solution qe (mg g-1) was determined or calculated using the following relationship:
Amount adsorbed 0( )e
eC C Vq
W
(1)
% Removal 0100( )e
eo
C CqC
(2)
Where, Co is initial adsorbate concentration (mg/l) Ce is equilibrium adsorbate concentration (mg/l) V is the volume of solution (l) W is the mass of adsorbent (g) The fly ash dose was varied from 0.05 to 0.5 g per 20 ml. The effect of pH was studied ranging from 4.0 to 10.0.
After the required contact time, the solution was centrifuged. The residue concentration in centrifuged was determined at the wavelength maxima.
Equilibrium Adsorption Isotherm Models
Adsorption in a solid-liquid phase results in the removal of solutes from solution and their concentration at the surface of the solid. As such, the solute remaining in the solution is in dynamic equilibrium with that at the surface. The preferred form for depicting this distribution is to express the quantity qe as a function of Ce at a fixed temperature. The quantity qe being the amount of solute adsorbed per unit weight of adsorbate and Ce, the concentration of solute remaining in solution at equilibrium.

4
An expression of this type is termed as adsorption isotherm. Several types of isothermal adsorption relations have been proposed, i.e., Langmuir, Freundlich, Dubinin–Radushkevichand Temkin isotherm to find an accurate relationship between dye in the liquid and solid phase.
Langmuir adsorption which was primarily designed to describe gas-solid phase adsorption is also used to quantify and contrast the adsorptive capacity of various adsorbents [33]. The Langmuir equation can be written in the following linear form:
= + (3)
Where Ce is concentration of adsorbate at equilibrium (mg g−1), qm is Langmuir constant related to adsorption
capacity (mg g−1), which can be correlated with the variation of the suitable area and porosity of the adsorbent which implies that large surface area and pore volume will result in higher adsorption capacity.
Freundlich isotherm is applicable to adsorption processes that occur on heterogonous surfaces. This isotherm gives an expression which defines the surface heterogeneity and the exponential distribution of active sites and their energies [34].
The linear form of the Freundlich isotherm is as follows:
logqe = logKF+ log Ce (4)
Where KF is adsorption capacity (mg g-1)Ce is solution concentration equilibrium and 1/n is adsorption intensity; it also indicates the relative distribution of the energy and the heterogeneity of the adsorbate sites.
Dubinin-Radushkevich isotherm model is an empirical adsorption model that is generally applied to express adsorption mechanism with Gaussian energy distribution onto heterogeneous surfaces.The model is a semiempirical equation in which adsorption follows a pore filling mechanism [35]. It presumes a multilayer character involving Vander Waal’s forces, applicable for physical adsorption processes, and is a fundamental equation that qualitatively describes the adsorption of gases and vapours on microporous sorbents. Dubinin-Radushkevich isotherm is expressed as follows:
lnqe = lnqm – βE2 (5)
ɛ =RT ln 1 + (6) E =
√ (7)
Where ɛ is Polanyi potential, β is Dubinin-Radushkevich constant, R is gas constant (8.31 Jmol−1 k−1), T is absolute temperature, and E is mean adsorption energy (KJ mol-1).
Temkin isotherm model takes into account the effects of indirect adsorbate/adsorbate interactions on the adsorption process; it is also assumed that the heat of adsorption of all molecules in the layer decreases linearly as a result of increase surface coverage [36]. The Temkin isotherm is valid only for an intermediate range of ion concentrations [37]. The linear form of Temkin isotherm model is given by the following:
qe = ln(A C ) (8) Where bT is Temkin constant which is related to the heat of sorption (Jmol-1) and AT is Temkin isotherm constant
(l g-1) [38].
5
Adsorption Kinetics
Experiments regarding the adsorption kinetics were performed to determine the rate of adsorption as adsorption is a time dependent process. It is necessary to know the rate of adsorption for the design and evaluation of a treatment system. Kinetic experiments were performed by varying the initial adsorbate concentration, i.e., 25, 75, and 100 mgL−1 over variable time steps.
Specific Rate Constant of Adsorption
The rate constant of adsorption for various adsorbates is determined from the following first order rate expression given by Lagergren.
log (qe-q)= log qe -
2.303adK t (9)
Where q and qe are amounts of metal adsorbed (moles/g) at time‘t’ and at equilibrium respectively and Kad is the rate constant for adsorption (min-1). A straight-line plot of log (qe-q) versus ‘t’ suggested the applicability of Lagergren equation. The rateconstant of adsorption (Kad) was calculated from the slope of the plot.
The pseudo-second-order kinetic equation is described as: =
+ 푡 (10) Where k2 (g/mg
min) is the rate constant and qe and qt (mg/g) are the amount of safranin adsorbed on to the coal fly ash at equilibrium and at time t (min), respectively.
Intra particle diffusionis the diffusion mechanism of adsorption, the kinetic results were evaluated using the
intraparticle diffusion model. During the intraparticle diffusion process, the adsorbate species are most probably transferred from the bulk of the solution into the solid phase. The intraparticle diffusion equation is given as:
qt= Kᵢt1/2 + C (11)
Where Ki (mg/g min1/2) is the intraparticle diffusion rate constant and C is the intercept. The boundary layer
thickness is described by the values of the intercept. The larger the intercept, the greater is the boundary layer effect. From Table 3, it was observed that the intraparticle diffusion rate constant increased with an increase in safranin concentrations.
Elovichmodel is based on a kinetic principle which assumes that adsorption sites increase exponentially with adsorption; this implies a multilayer adsorption [39-40]. The equation was first developed to describe the kinetics of chemisorption of gas onto solids [41-42]. The linear forms of the Elovich model are expressed as follows:
qt = β ln (αβ) + β ln t (12)
whereqt is the amount of adsorbatesorbed by zeolite at time t, α is initial adsorbate sorption rate (mmol g-1 min-1)
and β desorption constant (g mmol-1) during an experiment. Thus, constants can be obtained from the slope and intercept of linear plot of qtversus ln t.
Table 3 lists the kinetic constants obtained from the Elovich equation. It will be seen that applicability of the simple Elovich equation for the present kinetic data indicates that the Elovich equation was able to describe properly the kinetics of safranin adsorption on to coal fly ash.

6
RESULT AND DISCUSSION
Characterization of Fly ash and Zeolite
X Ray Fluorescence
Chemical analysis XRF analysis of untreated Coal fly ash and synthesized Zeolite is shown in Table 1. TABLE1.XRF analysis of Coal Fly Ash and zeolite (CFA: NaOH 1:1.5)
Constituents SiO2 Al2O3 Fe2O3 CaO TiO2 K2O P2O5 SO3 Na2O MgO LOI CFA Wt% 55.26 22.75 7.12 4.1 2.95 2.14 1.65 1.58 1.23 0.63 4.1 CFA:NaOHWt% 49.13 17.43 7.06 3.8 2.89 2.04 1.57 1.53 6.19 0.61 -----
FTIR Analysis
IR spectra of coal fly ash and alkali activated fly ash (AAF) as shown in (Fig. 2a and Fig. 2b)indicated significant changes in the intensities and the width of various bands due to interaction of fly ash with alkali.
It was noticed that there was an increase in intensity and broadness of the stretching frequency OH band at 3452 cm-1 after the treatment. This could be attributed to an increase in hydrated products due to the reaction between amorphous silicate and the alkali. Further the shift in the frequency to lower values indicated change in acidic character of the terminal Si-OH group.
Moreover, asymmetrical stretching of TO4 (SiO4 and AlO4) band corresponding to the variation in frequency from 1076 to 1000 cm-1 and the increase in its sharpness confirmed synthesis of silicates and change in its acidic characteristics (Fig. 2b). This could be attributed to substitution of Si+4 by Al+3 in some of the tetrahedral framework of the primary building units of the aluminosilicates and their external linkage with the Na+ ions due to their interaction with the alkali. The band at 434 cm-1 indicated the increased crystallization of product.
(a) (b)
FIGURE 2.FTIR spectra of (a) Coal fly ash (b) Alkali activated coal fly ash Based on FTIR spectrum, it could be observed that there was presence of pore opening corresponding to
frequency range from 420-400 cm-1 in the AAF which could be attributed to the dissolution of minerals present in the fly ash and precipitation of zeolite [43].
SEM Analysis
The morphological structure of the raw fly ash, treated fly ash and synthesized zeolitic materials were obtained by using scanning electron microscope. The bulk composition was also estimated from SEM/EDXS by indirect method. The elemental composition of the samples was first determined from the SEM/EDXS, and from these data,

7
the percentages of oxides were calculated (Fig. 3) .The results were further verified by X-ray fluorescence (XRF) data.Most of the particles found in the fly ash were sub-angular and spherical in shape. The image also showed that the particles present in the fly ash were covered with relatively smooth grains of quartz, clusters of iron (Fe-oxide). Irregular surface of glass matrix so observed might be due to an increase in adsorbent pore volume (Fig 3a). Figure 4c showed a significant transition in morphology from lumps to crystalline form which is attributed to chemical reaction between Si4+, Al3+and Na+ions and their nucleation and precipitation of zeolite Na-P crystals.
(a) (b)
(C) (d)
FIGURE3.SEManalysis of(a) Untreated CFA, (b) CFA:NaOH (1:1.2),(c) CFA:NaOH (1:1.5) and(d) CFA:NaOH (1:2)
X Ray Diffraction
The X-ray diffraction patterns (XRD) of different fly ash samples and synthetic zeolitic materials were obtained using a Philips diffractometer (Philips BW1710). Operating conditions involved the use of Cu-Kα radiation at 4 kV and 30 mA. The samples were scanned from 10–90° (2θ, where θ is the angle of diffraction). To complement the technique, crystalline phases present in the samples were identified with the help of JCPDS (Joint Committee on Powder Diffraction Standards) files for inorganic compounds. Quantitative measure of the crystallinity of the synthesized zeolite was made by using the summed heights of major peaks in the X-ray diffraction pattern [44]. The major peaks were selected specifically because they are least affected by the degree of hydration of samples and also by others.
The XRD pattern of CFA revealed the presence of crystalline quartz and mullite phases. The pattern hub seen in the background at lower diffraction angles of CFA was attributed to amorphous phases. After CFA treatment sharp edges of diffraction peaks of greater intensity emerges confirmed the formation of zeolite. The peak pattern of zeolite was dominant with higher concentration of NaOH, which showed slight decrease of quartz and mullitephases indicating stable phase generated during hydrothermal treatment (Fig. 4). The results correlate with observation reported by Kiti [45] and Scott et.al.[46].
Data obtained from XRD shows that the quartz andmullitehave changed their mineral phases reflected by their intensity count/seconds. Zeolite from alkali activated flyash(1:1.5) was identified as Na-P type as confirmed by

8
JCPDF software corresponding to maximum peak intensity of 390counts per second and diffraction angle (2 theta) equal to28o
(a) (b)
(c) (d)
FIGURE 4.XRD analysis of (a) Coal fly ash, (b) CFA: NaOH (1:1.2), (c)CFA:NaOH (1:1.5) and (d) CFA:NaOH (1:2) at 550oC
It is observed that due to its alkali activation, there is reduction in the silica and alumina contents associated with the crystalline particles of the fly ash. This can be accredited to the dissolution of the metal oxides and release
ofcorresponding soluble ions Na+. The Si/Al ratio of the zeolite crystals present in alkali activated fly ash is around one which corresponds to a tetrahedral framework structure of the zeolite Na-P where there is presence of the Al3+ which has been replaced equal number of Si4+.
Surface area analysis
Surface area for fly ash and the prepared zeolite material were found to be 2.89m2 /g and 60.36m2/g respectively. The increase in surface area might be attributed to the formation of zeolite structure.
Adsorption studies
Effect of contact time
The effect of contact time was performed at different concentrations of 5, 10 and 20 mg L-1 with a fixed adsorbent dose of 5 g L-1 at 250C and at a natural pH. The contact time was performed from 15 min to 240 min for all three concentrations. The percentage removal of safranin was calculated and plotted in (Fig. 5). An examination of Figure 7 demonstrated that up to 180 min there was increase in adsorption but after that no noticeable increase in adsorption was noticed due to saturation of active sites. It was seen that at higher concentration of Safranin (10 mg L-1) the percentage removal was high (82.4 %) in comparison to lower concentration (5 mg L-1) which was 79.7 %.

9
FIGURE5.Influence of contact time on uptake of Safranin dye FIGURE6.Influence of pH on uptake of Safranin dye
Effect of pH
To decide the optimum pH conditions for the adsorption of Safranin on zeolite material, the effect of pH was performed between 4.0-12.0. The experiment was carried out at 10 mg L-1 concentration of safranin, adsorbent dose of 5 mg L-1 and contact time of 180 min at 25oC. pH of the Safranin solution was adjusted by 0.1 M HCl or 0.1 M NaOH. The result obtained were shown in (Fig. 6) which showed that adsorption of Safranin increased with increase in pH from 4.0 to 9.0 and after that there was slight decrease in adsorption from pH 9.0 to 12.0. Maximum adsorption of Safranin was 90.3 % at an optimum pH of 9.0. At high pH, decrease in adsorption was due to electrostatic repulsion between adsorbent and safranin dye.
Effect of adsorbent dose
To explore the impact of the mass of adsorbent dose on the adsorption of Safranin, experiments were performed with different adsorbent doses of 5 to 30 mg L-1 at initial safranin concentration of 10 mg L-1 at natural pH and contact time of 180 min at 250C. Figure 7showed the impact of adsorbent dose on the adsorption of Safranin dye. It was found that the maximum adsorption occurred at 5 mg L-1 after that adsorption slightly decreased.
FIGURE 7. Influence of adsorbent dose on uptake of Safranin dye
0
20
40
60
80
100
0 5 10 15 20 25 30
% A
dsor
ptio
n
Amount of adsorbent (g/l)
5 ppm
10ppm
15ppm
40
50
60
70
80
90
100
4 5 6 7 8 9 10 11 12
% A
dsor
ptio
n
pH
0
20
40
60
80
0 50 100 150 200 250
% A
dsor
ptio
n
Time (min)
5ppm
10ppm
20 ppm
10
Adsorption Isotherms
Langmuir Isotherm
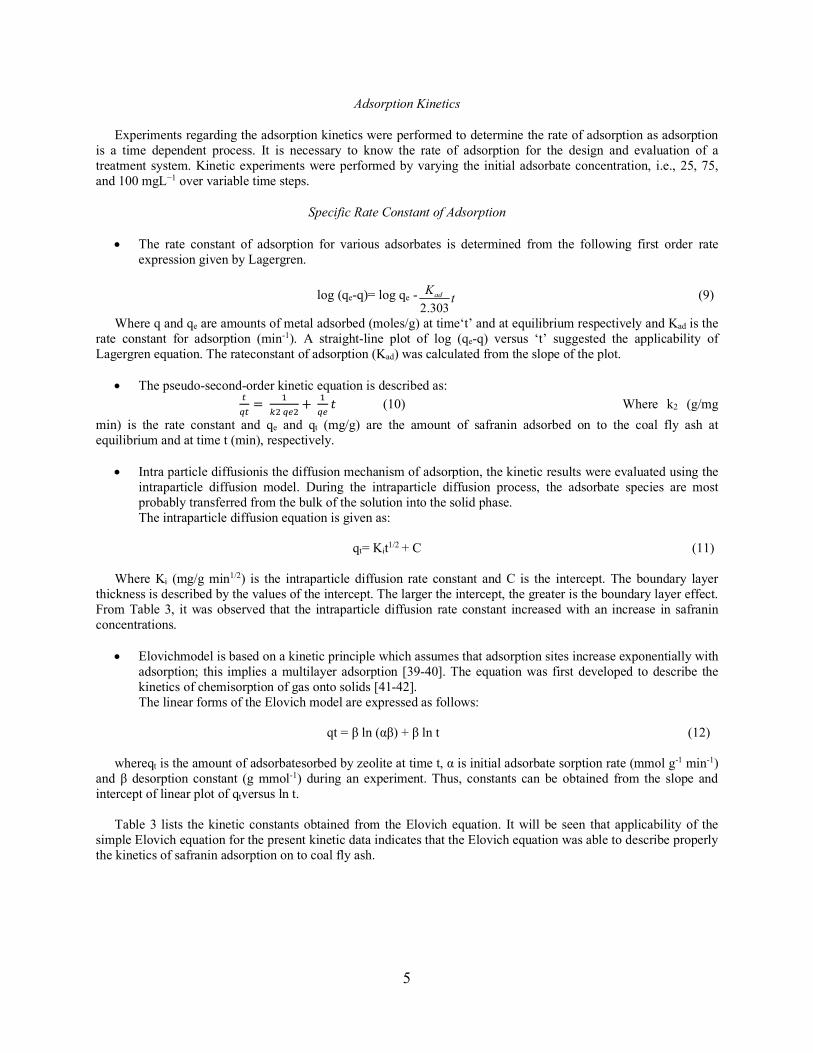
The adsorption of safranin at equilibrium with increase in initial dye concentrations at temperatures of 250Cwas fitted in Langmuir, Freundlich, Temkin and D-R isotherms. In Langmuir isotherm, 1/qe was plotted against 1/Ce and a straight line with slope 1/bQm was obtained as shown in (Fig. 8). Langmuir constants Qm and b were calculated, and the values of these constants along with coefficient of correlation (R2) are given in Table 2.
FIGURE 8.Langmuir isotherm plot of Safranin dyeFIGURE 9.Freundlich isotherm plot of Safranindye
Freundlich Isotherm
In Freundlich isotherm model, the plots of log qeagainst log Ce shown in (Fig. 9) were linear. The values of Kfand 1/n calculated from intercept and slope of the plot respectively, were given in Table 2. The calculated value of 1/n was less than 1, which suggested the favorable adsorption of dye onto the zeolite.
Temkin Isotherm
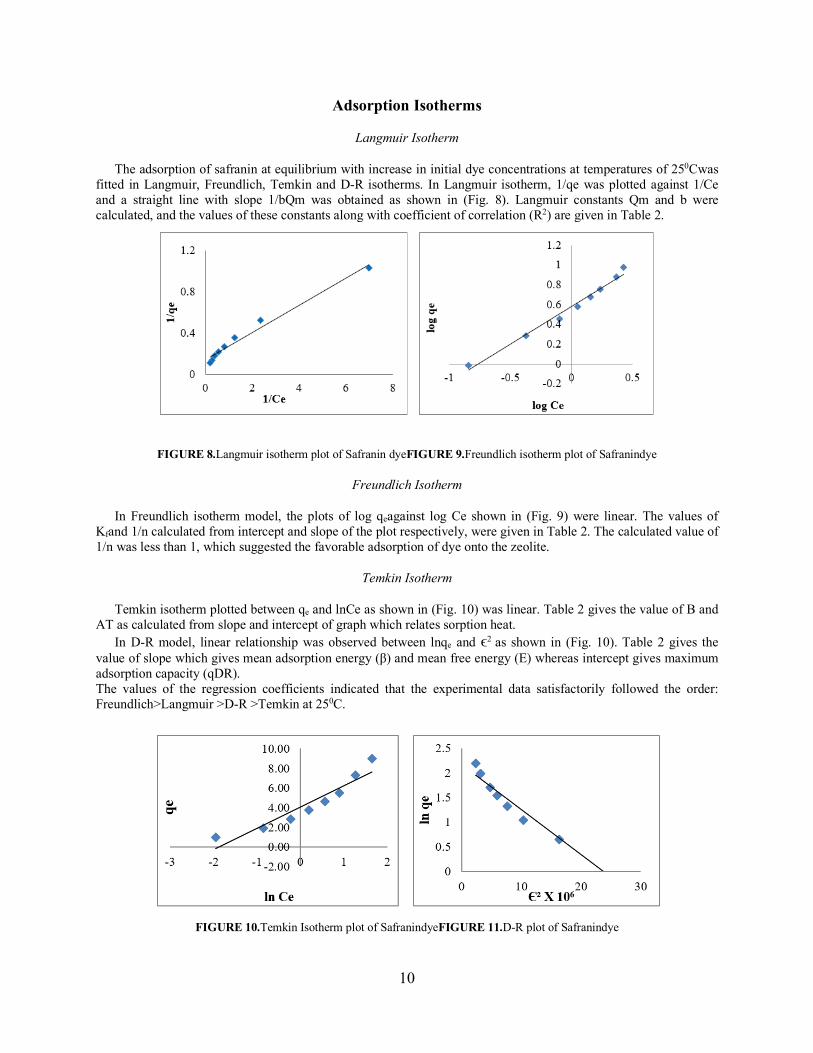
Temkin isotherm plotted between qe and lnCe as shown in (Fig. 10) was linear. Table 2 gives the value of B and AT as calculated from slope and intercept of graph which relates sorption heat.
In D-R model, linear relationship was observed between lnqe and ϵ2 as shown in (Fig. 10). Table 2 gives the value of slope which gives mean adsorption energy (β) and mean free energy (E) whereas intercept gives maximum adsorption capacity (qDR). The values of the regression coefficients indicated that the experimental data satisfactorily followed the order: Freundlich>Langmuir >D-R >Temkin at 250C.
FIGURE 10.Temkin Isotherm plot of SafranindyeFIGURE 11.D-R plot of Safranindye
11
Dubinin-Radushkevich
Values of qmand β were calculated according to DubininRadushkevichmodel (Fig. 11) and the coefficient of determination reflected a poor fit to the experimental equilibrium data compared to the other models used at constant temperature of 25°C.
TABLE 2.Langmuir, Freundlich, Temkin, Dubinin-Radushkevich isotherm parameters at 298K
S. No. Isotherm Model Parameters Value R2
1. Langmuir
b qm (mg/g) RL
1.0687 7.14 0.16
0.9790
2. Freundlich Kf (mg/g) 1/n
3.790 0.758
0.9820
3. 4.
Temkin Dubinin Radushkevich
B (J/mole) AT (L/mg) bt qDR(mg/g) B (mol g-1L)2 E (KJ mol-1)
2.173 6.487 2.173
8.715 9×10⁻⁸ 2.357
0.9000
0.9590
Kinetic Studies
Pseudo First Order
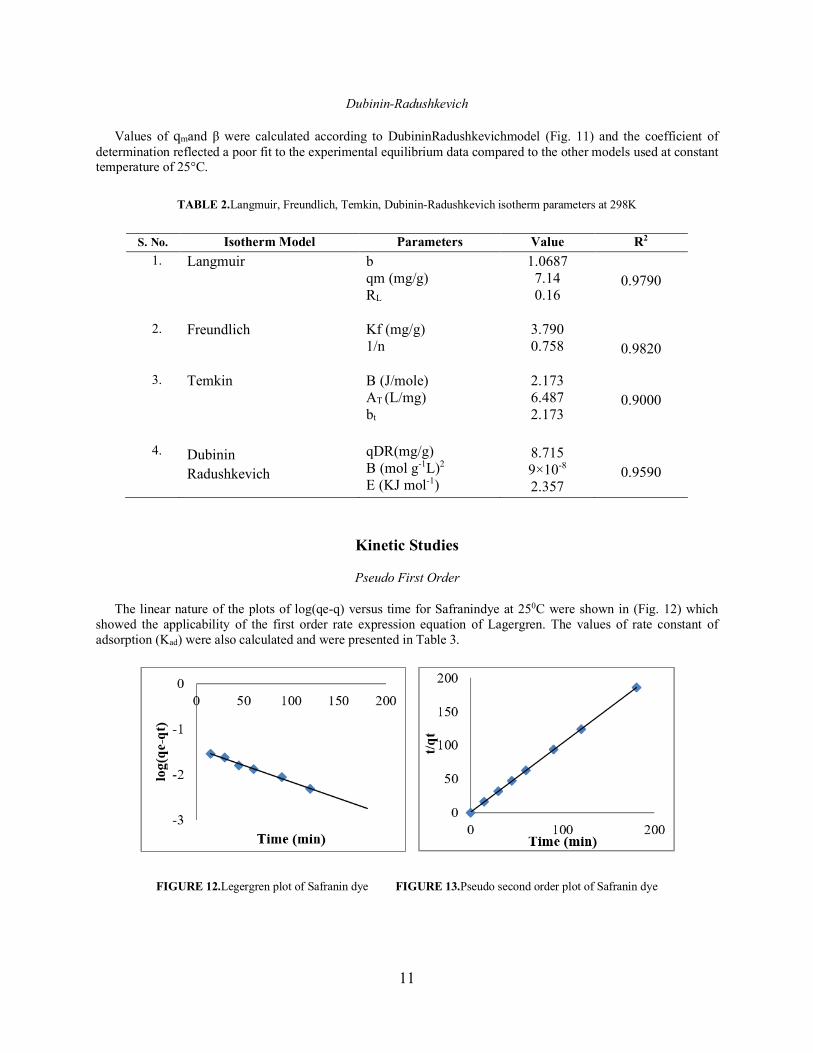
The linear nature of the plots of log(qe-q) versus time for Safranindye at 250C were shown in (Fig. 12) which showed the applicability of the first order rate expression equation of Lagergren. The values of rate constant of adsorption (Kad) were also calculated and were presented in Table 3.
FIGURE 12.Legergren plot of Safranin dye FIGURE 13.Pseudo second order plot of Safranin dye

12
Pseudo second order
The pseudo second order equation was based on adsorption capacity at equilibrium. From the slope and intercept of the (t/qt) as a function of t, the plot provided excellent linearity R2> 0.99. K and qe values for Safranindye at 250C was mentioned in Table 3. Figure13 showed the applicability of the pseudo second order rate expression equation.
Elovich Kinetics
Elovich equation was mainly applicable for chemo adsorption kinetics. The equation was often valid for systems in which the adsorbing surface was heterogenous. Figure 14 showed plot of (qt) vs. (ln t) with a linear slope of 1/β and intercept of 1/β ln (α β). The results of Elovich plot at various concentrations of Safranin was cited in Table 3.
FIGURE 14.Elovich plot of Safranin dye FIGURE 15. Intra particle diffusion plot of Safranin dye
Intra Particle Diffusion
This model was applied to describe the competitive adsorption. The initial rate of diffusion was obtained by linearization of the curve (qt) Vs (t0.5). The plot of (qt) against (t0.5) for Safranindye showed competitive adsorption occurring in solution (Fig. 15). The linear portion of plot for wide range of contact time between adsorbent and adsorbate did not pass through the origin. The variation from the origin or near saturation might be due to the variation of mass transfer in the initial and final stage of adsorption. The values are given in Table 3.
TABLE 3.Kinetic Model Parameters
S. No. Isotherm Model Parameters Value R2 1. Pseudo First Order
kad (min-1) qe (mg/g)
1.6 X 10⁻² 0.037
0.9910
2. Pseudo Second Order K2 (g/mg) qe (mg/g)
1.726 0.973
0.9990
3. 4.
Intra- particle diffusion Elovich Kinetics
Kad
C α (mg/g) β (g/mg)
0.003 0.932
9.45 X 1030
83.33
0.9635
0.9876
13
CONCLUSION
The studies revealed that zeolite synthesized from coal fly ash can be fruitfully employed as adsorbent for the removal of safranin dye. The pH was found to be significant factor which affects the adsorption capacity of dye. The removal of safranin dye is about 97.14 % at 10 mg/l with a dose of adsorbent of 5mg/l and pH 9.0 at 250C. The optimum contact time was found to be 180 min. The adsorption data was analyzed by Langmuir and Freundlich models and fitted well. The fitness of Langmuir’s model indicated the formation of monolayer coverage of the adsorbate on the outer surface of the adsorbent.
The characteristic parameter and mechanism of adsorption were also investigated using isotherms and kinetic
models. The adsorption data reflected best fits in the following order based on coefficient of determination: Freundlich> Langmuir>Dubinin Radushkevich>Temkin. The adsorption data obeyed Pseudo-second order> pseudo first order >Elovich>Intra particle diffusion.The developed adsorbent is quite cheaper than commercially available activated carbon, while their performance is comparable.
ACKNOWLEDGMENTS
The authors (Payal Jain, PriyankaShrivastava andVibhaMalviya) are grateful to Govt. Holkar Science College Indore, for providing all facility to carry out measurements.
REFERENCES
1. A. Taufiq, H. Pratikno and A. Hidayat, MATEC Web of Conferences. 154. 01037. 10.1051/matecconf/201815401037, (2018).
2. N. P. Sh. Elhami, Environ. Chem. Lett. 8, 53 (2010). 3. V. K. Gupta, S. K. Srivastava and D. Mohan, Ind. Eng. Chem. Res. 36, 2207 (1997). 4. S. Dawood and K. T. Sen, J. Chem. Process Eng. 1, 104, 1-11 (2014). 5. R. V. Kandisa, K. V. NarayanaSaibaba, K. B. Shaik and R.Gopinath, J.Bioremediat.Biodegrad. 7 (6), 1-
4s(2016). 6. N. Ouslimani, M. Z. M. Boureghda, Int. J. Waste Resour. 8 (2), 2-8 (2018). 7. S. Sivamani, G. B. Leena, Int. J. BioSci. Technol. 2 (4): 47-51, (2009). 8. M. S. Alam, R. Khanom, M. A. Rahman, Am. J. Environ. Prot.4 (5), 207-213 (2015). 9. F. B. Abdurrahman, M. Akter, M. Zainalabedin, Int. J. Sci. Technol. Res. 2 (9), 47-50 (2013). 10. V. M. Sivakumar, M. Thirumarimurugan, A. M. Xavier, A. Sivalingam, T. Kannadasan, International Journal
of Bioscience. Biochem. Bioinf.2 (6), 377-380 (2012). 11. N. E. Okoronkwo, J. C. Lgwe, H. N.Uruakpa, Terr. Aquatic Environ. Toxicol. 2 (1): 44-48, (2008). 12. M. Z. B. Mukhlish, M. M. R. Khan,A. R.Islam and A. N. M. S. Akanda, J. Mech. Eng. Sci. 10 (1), 1884-1894
(2016). 13. G. Amin, D.Dordević, S. Konstantinović andI.Jordanov, Adv. Technol. 6 (2), 67-71 (2017). 14. G. L. Dotto,J. M.Moura, T. R. S.Cadaval and L. A. A. Pinto, J.Chem.Eng.214, 8-16 (2013). 15. P. Balaji, B. Vignesh, M. Sowmiya, M. Meena andL.Lokesh, Int. J. Innov. Sci. Eng. Technol.5 (4), 265-272
(2015). 16. A. Agalya, N. Palanisamy andP.Sivakumar, Adv. Appl. Sci. Res.3 (3), 1220-1230 (2012). 17. H. Nadi, M. Alizadeh, M. Ahmadabadi, A. R.Yari and S.Hashemi, Arch. Hyg. Sci.2 (2), 41-47 (2012). 18. V.K. Rattan, A. Purai, H. Singh and M.Manoochehri, Waste Biomass Valorization 9 (1), 1-7 (2008). 19. F. S. Abbas, Adv. Environ. Biol. 7 (6), 1019-1026 (2013). 20. G.O. El-Sayed, , T.Y. Mohammed and O.E. El-Sayed, Adv. Appl. Sci. Res.2 (4), 283-290 (2011). 21. Z. Derakhshan, M. A.Baghapour, M.Ranjbar and M.Faramarzian, Health Scope 2 (3), 136-144 (2013). 22. S. Y. Wong, Y. P. Tan, A. H. Abdullah and S. T.Ong, J. Phys. Sci.20 (1), 59-74 (2009). 23. R.S. Lodhi and N.Lal, Int. Res. J. Eng. Technol.4 (12), 121-131 (2017). 24. D. Aherdhiraj and P. Kale Shekhar, Int. J. Mod. Trends Eng. Res.3 (4), 596-600 (2016). 25. S. S. Bayazit, Desalin. Water Treat.57(37-39), 6966-6975 (2014). 26. D. N. Taha, I. S. Samaka and L. A. Mohammed, J. Asian Sci. Res.3 (9), 945-955 (2013).

14
27. CEA Delhi, Report on Fly Ash Generation at Coal/Lignite Based Thermal Power Stations and its Utilization in the Country for the year 2016-17 (2017).
28. S. M. Venkat, D. M.Indra and C. S.Vima, J. Env. Manage.74 (3), 647-652 (2006). 29. T.G.Ryu, J.C.Ryu, C.H. Choi,C.G.Kim, S.J.Yoo, H.S. Yang and Y. H. Kim, J.Ind. Eng. Chem. 2(3), 401-407
(2006). 30. Y.P.Chauhan and M. Taliba, Sci. Revs. Chem. Commun.2(1), 12-19 (2012). 31. K.S. Hui, K.N. Hui and N. Lee, World Acad. Sci. Eng. Technol. (2009). 32. R. Juan, S. Herna´ndez, J. M. Andre’s and C. Ruiz, Fuel86, 1811–1821 (2007). 33. T. M. Elmorsi, J. Environ. Prot. 2 (06), 817, (2011). 34. N. Ayawei, A. T.Ekubo, D. Wankasi and E. D. Dikio, Orient. J. Chem.31 (3), 1307-1318 (2015). 35. C. Nguyen and D. D. Do, Carbon39, 1327-1336 (2001). 36. D. Ringot, B.Lerzy, K. Chaplain, J. P.Bonhoure, E.Auclair and Y.Larondelle, Bioresour. Technol. 98(9), 1812-
1821 (2007). 37. H. Shahbeig, N.Bagheri, S. A.Ghorbanian, A. Hallajisani and S. Poorkarimi,World J. Model. Simul. 9 (4), 243-
254 (2013). 38. M. R. Samarghandi, M.Hadi, S.Moayedi and A. F. Barjesteh, Iran. J. Environ. Health Sci. Eng.6 (4), 285-294
(2009). 39. K. Y. Foo and B. H.Hameed, Chem. Eng. J. 156 (1), 2-10 (2010). 40. M. Gubernak, W. Zapala and K.Kaczmarski, ActaChromatogr. 13, 38-59 (2003). 41. O. Hamdaoui and E.Naffrechoux, J. Hazard. Mater. 147(1-2), 401-411 (2007). 42. A. Achmad, J.Kassim, T. K.Suan, R. C. Amat andT. L. Seey, J. Phys. Sci. 23 (1), 1-13 (2012). 43. K. Ojha, N. C. Pradhan and A. N. Samanta,Bull. Mater. Sci. 27(6), 555-564 (2004). 44. R. Szoastak, Molecular Sieves, (New York, Reinhold, 1989). 45. V. E. Kiti, “Synthesis of zeolites and their application to the desalination of seawater”, Master’s Thesis,
Kwame Nkrumah University of Science and Technology Kumasi, Ghana 2012. 46. J. Scott, D.Guang, K. Naeramitmarnsuk,M. Thabout and A. Rose, J. Chem. Techno.Biotechno. 77 (1), 63-69
(2001).