thermodynamic mechanism for solution phase …special feature chemistry thermodynamic mechanism for...
TRANSCRIPT
SPEC
IAL
FEAT
URE
CHEM
ISTR
Y
Thermodynamic mechanism for solution phase chiralamplification via a lattice modelThomas G. Lombardoa, Frank H. Stillingerb, and Pablo G. Debenedettia,1
Departments of aChemical Engineering and bChemistry, Princeton University, Princeton, NJ 08544b;
Edited by Benjamin Widom, Cornell University, Ithaca, NY, and approved February 24, 2009 (received for review December 18, 2008)
We formulate a two-dimensional lattice model to study the equilib-rium phase behavior of a ternary mixture composed of two enan-tiomeric forms of a chiral molecule and a nonchiral liquid solvent.Numerical solution of the model invoking the mean-field approxi-mation of statistical mechanics allows the calculation of a ternaryphase diagram. A prominent feature of the phase diagram is theappearance of a mirror-image pair of triple points involving coexis-tence of a liquid phase enriched in one of the enantiomers with twosolid phases: a racemic and an enantiopure crystal. Thus, over broadranges of initial composition, including liquid mixtures containingalmost equal amounts of the two enantiomers, the equilibriumstate of the system produces liquid-phase chiral amplification. Thecalculations predict that chiral amplification is favored at low tem-peratures, and by strengthening those molecular interactions thatstabilize the racemic crystal. The phase behavior that we obtainis qualitatively identical to that reported in a recent experimentalstudy of solutions of amino acids, aimed at probing the liquid-phasecontrol of asymmetric catalysis. Those results, and the present cal-culations that provide molecular-level insight into their underlyingcauses, suggest a possible thermodynamic scenario for the liquid-phase emergence of chiral imbalance in a prebiotic and presumablynearly racemic world.
chirality | asymmetric | behavior
C hiral asymmetry choices exhibited by molecules that arepresent in living organisms constitute a vivid and scientifi-
cally challenging set of observations. Such geometric preferencesfavoring one enantiomer over its mirror image are obvious in theobserved structures of amino acids, sugars, and the biopolymersthat they form. The DNA double helix constitutes another meso-scopic example of unvarying chirality. These facts automaticallygenerate fundamental questions about how those chiral asymme-tries in the terrestrial biosphere spontaneously arose, and to whatextent liquid phases were involved in that scenario. It is also impor-tant to know whether the exclusion of the alternate mirror-imageenantiomorphs amounts to a basic prerequisite for the origina-tion, survival, propagation, and evolution of living organisms, orwhether it is an incidental by-product of the appearance of life.
Not surprisingly, these issues have generated an historicallylengthy and diverse literature (e.g., (1, 2)). Several mechanismshave been proposed to explain the spontaneous appearance of chi-ral bias from a presumably unbiased prebiotic terrestrial environ-ment. One intriguing scenario involves chemical reactions subjectto asymmetric autocatalysis, a phenomenon realized experimen-tally by Soai and collaborators (3). Another invokes chiral crystal-lization and Ostwald ripening (4). A third possibility focuses onthe equilibrium phase behavior of enantiomorphs with a nonchi-ral third component that acts as a relatively poor solvent (5, 6).In addition to experimental studies, a number of computationalexaminations of chirality have been published (e.g., (7, 8)). In thisstudy we focus on liquid-phase phenomena and adopt a theoreticalapproach to calculate the phase behavior.
The theoretical investigation reported in this article was stim-ulated by the experimental study reported in ref. 5 concern-ing asymmetric amplification in liquid solutions by amino acidcatalysis. Specifically, that investigation quantitatively probed theliquid-phase control of the enantiomorphic excess of a chiral aldol
reaction product by the catalyzing role of amino acid enantiomor-phic excess present in the solution. A basic conclusion of that studywas that the presence of a symmetrical pair of eutectic points† inthe ternary phase diagram for the enantiomorphic pair of aminoacids and their non-chiral solvent played a key role in the amplifica-tion process. In accord with that conclusion, this article introducesand analyzes a simple lattice model that, as shown below, is capableof reproducing, at least qualitatively, such ternary phase diagrams.Although schematic phase diagrams consistent with the type ofsolid–liquid equilibrium discussed in this work can be found inthe stereochemistry literature (9, 10), our focus is on the micro-scopic origin of such behavior, which has not received comparableattention.
The following section defines the lattice model chosen for study.Although it is conceptually simple, its large-system-limit thermo-dynamic behavior is currently not amenable to a mathematicallyexact solution. Consequently, for its analysis we have invoked astandard mean-field approximation, described in the third section.We believe that this approximation preserves the overall essentialbehavior of the model’s thermodynamics, which can be extractedfrom straightforward numerical calculations. The results of thosecalculations are then presented. Finally, a summary of our conclu-sions and remarks about extensions of our model that we believeare feasible are discussed. The technical details are included insupporting information (SI) Appendix.
Lattice ModelTo demonstrate that an enantiomorph-solution ternary phase dia-gram of the type required for liquid-phase chiral amplification canarise from simple molecular interactions, we have constructed andanalyzed an elementary two-dimensional lattice model. In partic-ular, this involves a simple square lattice on the sites of whichthree species can exist: right- and left-handed enantiomorphs (tobe denoted “D” and “L” for simplicity), and a nonchiral sol-vent species “S”. Fig. 1A illustrates the elements of this model,showing in minimalist fashion how the three species are accom-modated on the lattice. The two distinct enantiomorphs, D andL, appear as bent arrows that conform to the square-latticebond directions, whereas the nonchiral solvent is representedby small open circles at the lattice sites. One and only one ofthese species resides at each lattice site. Although this modelpostulates that molecular occupancy patterns can reconfigurefreely on the lattice, the individual enantiomorphic molecules arenot capable of transforming to their mirror-image forms. Thus,an initially established molecular composition remains invariantthereafter.
Author contributions: F.H.S. and P.G.D. designed research; T.G.L. performed research; T.G.L.analyzed data; and T.G.L., F.H.S., and P.G.D. wrote the paper.
The authors declare no conflict of interest.
This article is a PNAS Direct Submission.1To whom correspondence should be addressed. E-mail: [email protected].
† In this article the term eutectic point refers to the composition of a solution phase thatis in equilibrium with two distinct solid phases. This terminology is adopted from ref. 9.
This article contains supporting information online at www.pnas.org/cgi/content/full/0812867106/DCSupplemental.
www.pnas.org / cgi / doi / 10.1073 / pnas.0812867106 PNAS September 8, 2009 vol. 106 no. 36 15131–15135
Dow
nloa
ded
by g
uest
on
Mar
ch 1
3, 2
020
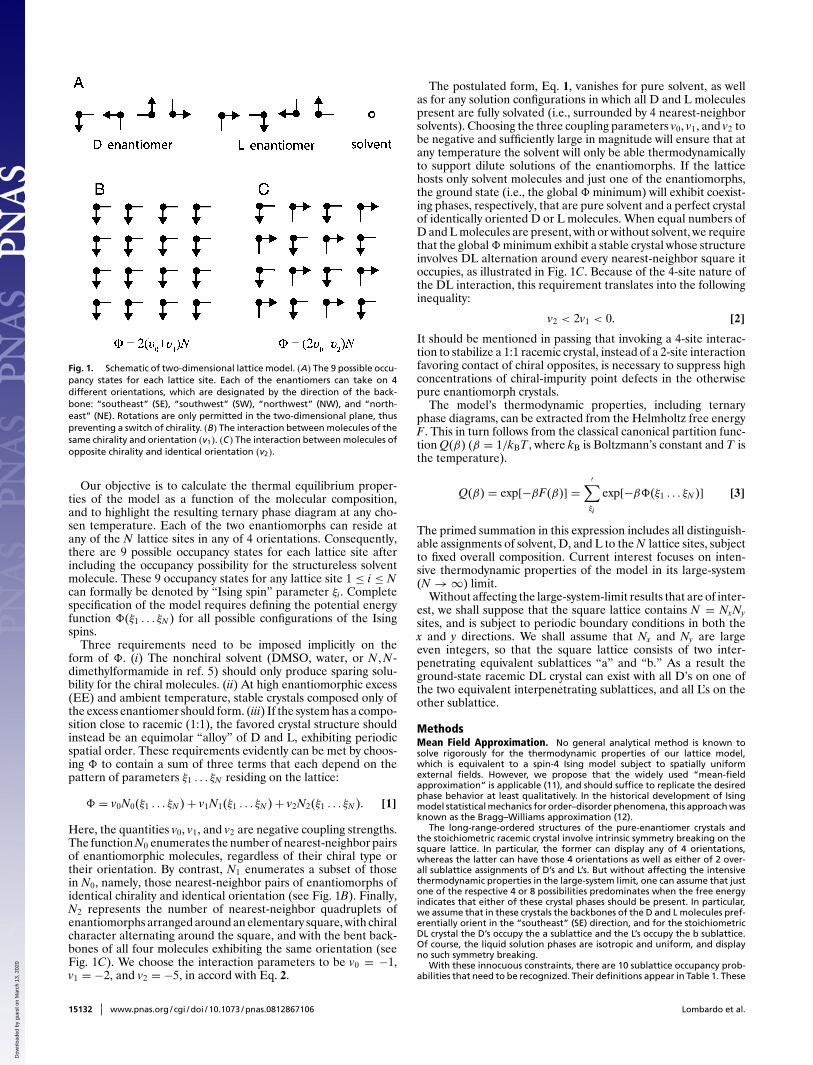
Fig. 1. Schematic of two-dimensional lattice model. (A) The 9 possible occu-pancy states for each lattice site. Each of the enantiomers can take on 4different orientations, which are designated by the direction of the back-bone: “southeast” (SE), “southwest” (SW), “northwest” (NW), and “north-east” (NE). Rotations are only permitted in the two-dimensional plane, thuspreventing a switch of chirality. (B) The interaction between molecules of thesame chirality and orientation (v1). (C) The interaction between molecules ofopposite chirality and identical orientation (v2).
Our objective is to calculate the thermal equilibrium proper-ties of the model as a function of the molecular composition,and to highlight the resulting ternary phase diagram at any cho-sen temperature. Each of the two enantiomorphs can reside atany of the N lattice sites in any of 4 orientations. Consequently,there are 9 possible occupancy states for each lattice site afterincluding the occupancy possibility for the structureless solventmolecule. These 9 occupancy states for any lattice site 1 ≤ i ≤ Ncan formally be denoted by “Ising spin” parameter ξi. Completespecification of the model requires defining the potential energyfunction �(ξ1 . . . ξN ) for all possible configurations of the Isingspins.
Three requirements need to be imposed implicitly on theform of �. (i) The nonchiral solvent (DMSO, water, or N , N-dimethylformamide in ref. 5) should only produce sparing solu-bility for the chiral molecules. (ii) At high enantiomorphic excess(EE) and ambient temperature, stable crystals composed only ofthe excess enantiomer should form. (iii) If the system has a compo-sition close to racemic (1:1), the favored crystal structure shouldinstead be an equimolar “alloy” of D and L, exhibiting periodicspatial order. These requirements evidently can be met by choos-ing � to contain a sum of three terms that each depend on thepattern of parameters ξ1 . . . ξN residing on the lattice:
� = v0N0(ξ1 . . . ξN ) + v1N1(ξ1 . . . ξN ) + v2N2(ξ1 . . . ξN ). [1]
Here, the quantities v0, v1, and v2 are negative coupling strengths.The function N0 enumerates the number of nearest-neighbor pairsof enantiomorphic molecules, regardless of their chiral type ortheir orientation. By contrast, N1 enumerates a subset of thosein N0, namely, those nearest-neighbor pairs of enantiomorphs ofidentical chirality and identical orientation (see Fig. 1B). Finally,N2 represents the number of nearest-neighbor quadruplets ofenantiomorphs arranged around an elementary square, with chiralcharacter alternating around the square, and with the bent back-bones of all four molecules exhibiting the same orientation (seeFig. 1C). We choose the interaction parameters to be v0 = −1,v1 = −2, and v2 = −5, in accord with Eq. 2.
The postulated form, Eq. 1, vanishes for pure solvent, as wellas for any solution configurations in which all D and L moleculespresent are fully solvated (i.e., surrounded by 4 nearest-neighborsolvents). Choosing the three coupling parameters v0, v1, and v2 tobe negative and sufficiently large in magnitude will ensure that atany temperature the solvent will only be able thermodynamicallyto support dilute solutions of the enantiomorphs. If the latticehosts only solvent molecules and just one of the enantiomorphs,the ground state (i.e., the global � minimum) will exhibit coexist-ing phases, respectively, that are pure solvent and a perfect crystalof identically oriented D or L molecules. When equal numbers ofD and L molecules are present, with or without solvent, we requirethat the global � minimum exhibit a stable crystal whose structureinvolves DL alternation around every nearest-neighbor square itoccupies, as illustrated in Fig. 1C. Because of the 4-site nature ofthe DL interaction, this requirement translates into the followinginequality:
v2 < 2v1 < 0. [2]
It should be mentioned in passing that invoking a 4-site interac-tion to stabilize a 1:1 racemic crystal, instead of a 2-site interactionfavoring contact of chiral opposites, is necessary to suppress highconcentrations of chiral-impurity point defects in the otherwisepure enantiomorph crystals.
The model’s thermodynamic properties, including ternaryphase diagrams, can be extracted from the Helmholtz free energyF. This in turn follows from the classical canonical partition func-tion Q(β) (β = 1/kBT , where kB is Boltzmann’s constant and T isthe temperature).
Q(β) = exp[−βF(β)] =′∑
ξi
exp[−β�(ξ1 . . . ξN )] [3]
The primed summation in this expression includes all distinguish-able assignments of solvent, D, and L to the N lattice sites, subjectto fixed overall composition. Current interest focuses on inten-sive thermodynamic properties of the model in its large-system(N → ∞) limit.
Without affecting the large-system-limit results that are of inter-est, we shall suppose that the square lattice contains N = NxNysites, and is subject to periodic boundary conditions in both thex and y directions. We shall assume that Nx and Ny are largeeven integers, so that the square lattice consists of two inter-penetrating equivalent sublattices “a” and “b.” As a result theground-state racemic DL crystal can exist with all D’s on one ofthe two equivalent interpenetrating sublattices, and all L’s on theother sublattice.
MethodsMean Field Approximation. No general analytical method is known tosolve rigorously for the thermodynamic properties of our lattice model,which is equivalent to a spin-4 Ising model subject to spatially uniformexternal fields. However, we propose that the widely used “mean-fieldapproximation” is applicable (11), and should suffice to replicate the desiredphase behavior at least qualitatively. In the historical development of Isingmodel statistical mechanics for order–disorder phenomena, this approach wasknown as the Bragg–Williams approximation (12).
The long-range-ordered structures of the pure-enantiomer crystals andthe stoichiometric racemic crystal involve intrinsic symmetry breaking on thesquare lattice. In particular, the former can display any of 4 orientations,whereas the latter can have those 4 orientations as well as either of 2 over-all sublattice assignments of D’s and L’s. But without affecting the intensivethermodynamic properties in the large-system limit, one can assume that justone of the respective 4 or 8 possibilities predominates when the free energyindicates that either of these crystal phases should be present. In particular,we assume that in these crystals the backbones of the D and L molecules pref-erentially orient in the “southeast” (SE) direction, and for the stoichiometricDL crystal the D’s occupy the a sublattice and the L’s occupy the b sublattice.Of course, the liquid solution phases are isotropic and uniform, and displayno such symmetry breaking.
With these innocuous constraints, there are 10 sublattice occupancy prob-abilities that need to be recognized. Their definitions appear in Table 1. These
15132 www.pnas.org / cgi / doi / 10.1073 / pnas.0812867106 Lombardo et al.
Dow
nloa
ded
by g
uest
on
Mar
ch 1
3, 2
020
SPEC
IAL
FEAT
URE
CHEM
ISTR
Y
Table 1. Definitions of sublattice occupancy probabilities
Occupying species Sublattice a Sublattice b
Solvent P(a)1 P(b)
1
Non-SE D∗ P(a)2 P(b)
2
Non-SE L∗ P(a)3 P(b)
3
SE D∗ P(a)4 P(b)
4
SE L∗ P(a)5 P(b)
5
∗SE indicates “southeast” backbone orientation; non-SE includes “northeast”(NE), “northwest” (NW), and “southwest” (SW) backbone orientations.
probabilities are subject to 4 obvious constraints: they must add to unity foreach sublattice (two constraints) and they must conform to the assigned molefractions for the three species (two constraints). Six parametric degrees offreedom remain to be explored so as to attain free-energy minimization. Thecombination of these 6 parameters describe the overall state of the model(i.e., solution, enantiopure crystal, racemic crystal, etc.).
The mean-field approximation assigns a common value to � for all config-urations consistent with the sublattice probabilities, and this common valueis a � average over all of those configurations. The corresponding entropyis an elementary combinatorial expression involving the sublattice probabil-ities. These assignments straightforwardly generate a simple expression forthe partition function Q(β) and thus the Helmholtz free energy F that areexplicit functions of the sublattice probabilities.
The free energy is a function of composition, temperature, and the 6 mean-field parameters. For a given temperature and composition, the equilibriumstate is found by minimizing the free energy with respect to the mean-field parameters. Additionally, systems that phase separate must also obeythe phase equilibrium conditions of temperature equality and the equal-ity of the chemical potential of each species between all phases present.The chemical potential of each species μi is straightforwardly calculatedfrom
μi = ∂F∂ni
i = D, L, S [4]
where ni is the number of molecules of type i. The conditions of phase equilib-rium provide a system of nonlinear equations that can be solved for a specifiedtemperature to determine the coexistence regions and tie lines of variousphases. Additional details on the techniques used to minimize the free energyand solve the phase equilibrium equations can be found in SI Appendix.
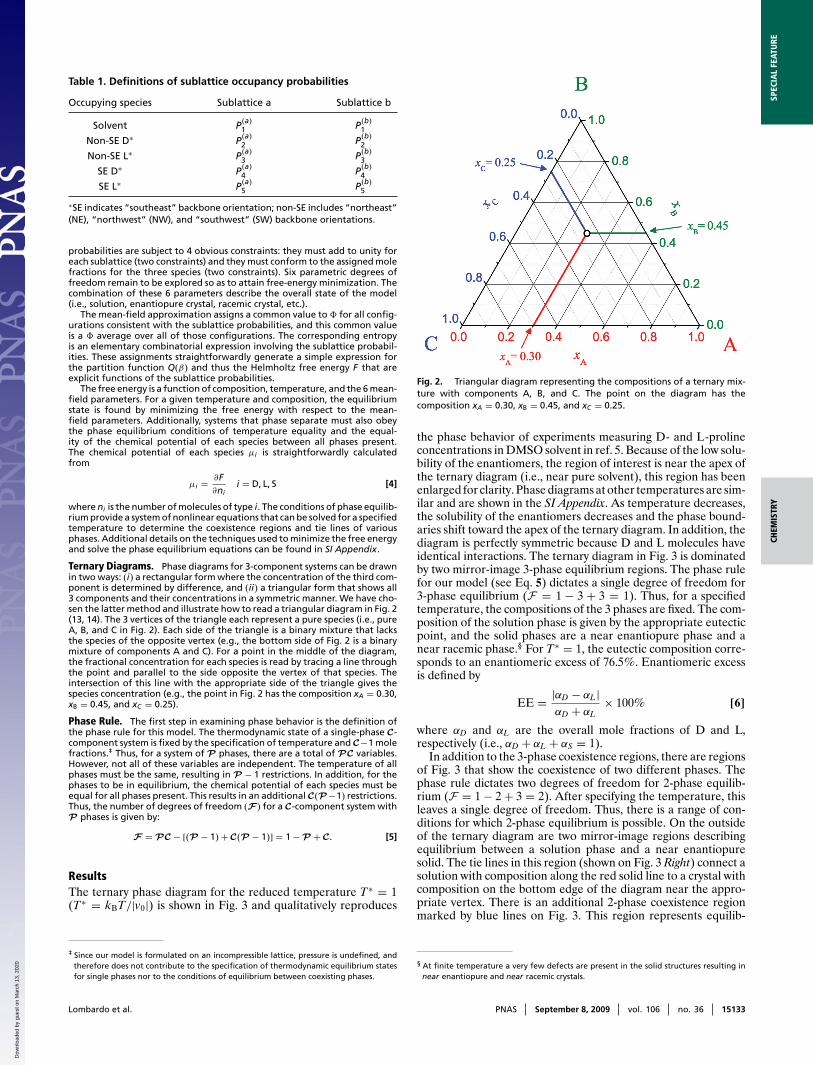
Ternary Diagrams. Phase diagrams for 3-component systems can be drawnin two ways: (i) a rectangular form where the concentration of the third com-ponent is determined by difference, and (ii) a triangular form that shows all3 components and their concentrations in a symmetric manner. We have cho-sen the latter method and illustrate how to read a triangular diagram in Fig. 2(13, 14). The 3 vertices of the triangle each represent a pure species (i.e., pureA, B, and C in Fig. 2). Each side of the triangle is a binary mixture that lacksthe species of the opposite vertex (e.g., the bottom side of Fig. 2 is a binarymixture of components A and C). For a point in the middle of the diagram,the fractional concentration for each species is read by tracing a line throughthe point and parallel to the side opposite the vertex of that species. Theintersection of this line with the appropriate side of the triangle gives thespecies concentration (e.g., the point in Fig. 2 has the composition xA = 0.30,xB = 0.45, and xC = 0.25).
Phase Rule. The first step in examining phase behavior is the definition ofthe phase rule for this model. The thermodynamic state of a single-phase C-component system is fixed by the specification of temperature and C−1 molefractions.‡ Thus, for a system of P phases, there are a total of PC variables.However, not all of these variables are independent. The temperature of allphases must be the same, resulting in P − 1 restrictions. In addition, for thephases to be in equilibrium, the chemical potential of each species must beequal for all phases present. This results in an additional C(P −1) restrictions.Thus, the number of degrees of freedom (F) for a C-component system withP phases is given by:
F = PC − [(P − 1) + C(P − 1)] = 1 − P + C. [5]
ResultsThe ternary phase diagram for the reduced temperature T∗ = 1(T∗ = kBT/|v0|) is shown in Fig. 3 and qualitatively reproduces
‡ Since our model is formulated on an incompressible lattice, pressure is undefined, andtherefore does not contribute to the specification of thermodynamic equilibrium statesfor single phases nor to the conditions of equilibrium between coexisting phases.
Fig. 2. Triangular diagram representing the compositions of a ternary mix-ture with components A, B, and C. The point on the diagram has thecomposition xA = 0.30, xB = 0.45, and xC = 0.25.
the phase behavior of experiments measuring D- and L-prolineconcentrations in DMSO solvent in ref. 5. Because of the low solu-bility of the enantiomers, the region of interest is near the apex ofthe ternary diagram (i.e., near pure solvent), this region has beenenlarged for clarity. Phase diagrams at other temperatures are sim-ilar and are shown in the SI Appendix. As temperature decreases,the solubility of the enantiomers decreases and the phase bound-aries shift toward the apex of the ternary diagram. In addition, thediagram is perfectly symmetric because D and L molecules haveidentical interactions. The ternary diagram in Fig. 3 is dominatedby two mirror-image 3-phase equilibrium regions. The phase rulefor our model (see Eq. 5) dictates a single degree of freedom for3-phase equilibrium (F = 1 − 3 + 3 = 1). Thus, for a specifiedtemperature, the compositions of the 3 phases are fixed. The com-position of the solution phase is given by the appropriate eutecticpoint, and the solid phases are a near enantiopure phase and anear racemic phase.§ For T∗ = 1, the eutectic composition corre-sponds to an enantiomeric excess of 76.5%. Enantiomeric excessis defined by
EE = |αD − αL|αD + αL
× 100% [6]
where αD and αL are the overall mole fractions of D and L,respectively (i.e., αD + αL + αS = 1).
In addition to the 3-phase coexistence regions, there are regionsof Fig. 3 that show the coexistence of two different phases. Thephase rule dictates two degrees of freedom for 2-phase equilib-rium (F = 1 − 2 + 3 = 2). After specifying the temperature, thisleaves a single degree of freedom. Thus, there is a range of con-ditions for which 2-phase equilibrium is possible. On the outsideof the ternary diagram are two mirror-image regions describingequilibrium between a solution phase and a near enantiopuresolid. The tie lines in this region (shown on Fig. 3 Right) connect asolution with composition along the red solid line to a crystal withcomposition on the bottom edge of the diagram near the appro-priate vertex. There is an additional 2-phase coexistence regionmarked by blue lines on Fig. 3. This region represents equilib-
§ At finite temperature a very few defects are present in the solid structures resulting innear enantiopure and near racemic crystals.
Lombardo et al. PNAS September 8, 2009 vol. 106 no. 36 15133
Dow
nloa
ded
by g
uest
on
Mar
ch 1
3, 2
020

Fig. 3. Ternary phase diagram for T ∗ = 1. The apex of the diagram is shown on the Left and Right with an illustration of the full diagram in the Center. Opencircles mark the eutectic points (labeled E and E’), the solid red lines designate the coexistence region of a solution phase in equilibrium with an enantiopuresolid phase, the solid blue lines mark the coexistence region of a solution phase with a racemic solid phase, and the region labeled with green text consists of3-phase equilibrium between a solution at the eutectic point, a near enantiopure solid, and a near racemic solid. Lines of constant enantiomeric excess (seeEq. 6 for definition) are shown on the Left as a guide. Tie lines are shown as dashed lines on Right. These connect the compositions of the coexisting solutionand solid phases.
rium between a solution phase along the top blue line and a solidphase of near racemic composition located in the middle of thebottom axis.
The phase behavior evident in Fig. 3, in conjunction with cer-tain solution phase chemistry, can act as a mechanism for chiralamplification of the solution phase under the following scenario.Imagine a chiral molecule that serves as an asymmetric catalystwith high enantioselectivity for a solution phase reaction (i.e., thechirality of the product of the reaction is determined by the chiral-ity of the catalyst). If a system is prepared with a slight EE of thecatalyst and the overall composition lies within the 3-phase coex-istence region, then a solution phase, with a composition givenby the eutectic point, will coexist with an enantiopure crystal anda racemic crystal. Provided the EE of the eutectic point is suffi-ciently high, then this leads to a large EE of the catalyst in thesolution phase. Thus, a high EE can be achieved for the chiralproduct of the chemical reaction. The D and L forms of the aminoacid serine in water have qualitatively similar phase behavior tothat in Fig. 3 with an EE of the eutectic point >99%. In addi-tion, it is known to act as an enantioselective catalyst in aldolreactions (5).
The EE of the eutectic point is a critical aspect of the mechanismfor chiral amplification of the solution phase. The composition ofthe eutectic was calculated for a range of temperatures to exploreits sensitivity. Fig. 4 plots the EE of the eutectic as a function ofreduced temperature (red line, bottom axis). The ternary diagram(Inset) shows the composition of the eutectic points as a functionof temperature. At a reduced temperature of T∗ = 2.06 the eutec-tic points lie just above the bottom axis and move toward the apexas temperature decreases. Cooling results in decreased solubilityof the D and L enantiomers and shifts the phase boundaries inFig. 3 toward the apex of the ternary diagram. Fig. 4 shows that,as a consequence of decreased solubility, the EE of the eutecticpoints increases. Thus, cooling a system with overall compositioninside the 3-phase region results in asymmetric amplification ofthe solution phase. At the coldest temperature studied the EE ofthe eutectic point reached 83.5%.
The sensitivity of the EE of the eutectic point to the choice ofinteraction parameters was also examined. For these calculationsthe DL interaction strength, v2, was modified. Temperature wasfixed at T∗ = 1 and the v0 and v1 interactions were unchanged (i.e.,v0 = −1 and v1 = −2). With these choices, the range of v2 that is inaccord with Eq. 2 is v2 ∈ (−∞, −4). For v2 ≥ −4 = 2v1 a racemiccrystal phase does not form and the desired phase behavior isnot evident. Fig. 4 plots the EE of the eutectic as a function of v2
Fig. 4. Variation of the EE of the eutectic point with temperature and fixedinteraction parameters (red line, bottom axis) (i.e., v0 = −1, v1 = −2, andv2 = −5). Inset shows the composition of the eutectic points on a ternarydiagram as a function of temperature. At T ∗ = 2.06 the eutectic points arenearly on the bottom axis. Cooling decreases the solubility of the enantiomerscausing the eutectic points to shift toward the apex of the ternary diagram.Variation of the EE of the eutectic point with the interaction parameter v2
(blue line, top axis). Temperature and the other interaction strengths, v0 andv1, are fixed at T ∗ = 1, v0 = −1, and v1 = −2.
15134 www.pnas.org / cgi / doi / 10.1073 / pnas.0812867106 Lombardo et al.
Dow
nloa
ded
by g
uest
on
Mar
ch 1
3, 2
020

SPEC
IAL
FEAT
URE
CHEM
ISTR
Y
(blue line, top axis). Increasing the magnitude of the v2 interactionstrength confers greater stability to the racemic crystal andexpands the 2-phase coexistence region between a solution phaseand the racemic crystal. This pushes the eutectic points towardthe outside of the ternary diagram and results in a larger EE. TheEE of the eutectic point asymptotically approaches 100% as v2 →−∞. In contrast, decreasing the DL interaction strength destabi-lizes the racemic crystal phase and shrinks the coexistence regionbetween solution and racemic crystal. This brings the eutecticpoints closer to the middle of the ternary diagram. Consequently,as v2 → −4 = 2v1 the EE of the eutectic approaches zero.
Concluding RemarksThe liquid-phase chiral amplification observed experimentally andreported in refs. 5 and 6 as due to off-symmetry eutectic pairs inthe phase diagram of amino acid solutions has been qualitativelyreplicated here by an elementary lattice model. The model exam-ined is based on a square lattice each of whose sites hosts anyone of three species: a structureless solvent molecule, or eitherenantiomorph of a chemically stable chiral solute molecule. Inter-actions occur only between nearest neighbors, and have beenchosen so that dilute solutions of the enantiomorphs appear inthe equilibrium phase diagram at ambient conditions, as well asstable crystals of either pure enantiomorph, and a stoichiometricracemic crystal with periodically alternating enantiomorphs fromsite to neighboring site.
The mean-field approximation has been invoked to deducethe main qualitative features of the phase diagram for severaltemperatures and alternative interaction choices. The numericalresults indicate that the equilibrium phase behavior of the ternarysystem can result in chiral amplification of the solution phase, pro-vided the composition lies within one of the 3-phase coexistenceregions. Cooling increases the EE of the eutectic point and permitschiral amplification of the solution phase through temperaturecontrol. Furthermore, the results demonstrate that the attainableextent of chiral amplification (i.e., the off-symmetry position ofthe eutectics) is sensitive to the choice of interaction set.
There is reason to believe that, for lattice models with dimensiontwo or higher, the mean-field approximation correctly representsthe qualitative equilibrium behavior with respect to first-order
phase transitions. Indeed that has been the primary assumptionof the work reported herein, where those first-order transitionsdetermine the key eutectic features of the phase diagram. How-ever, it is desirable to check that presumption by invoking amore accurate approach. The well-established Monte Carlo sim-ulation procedure offers such an alternative. We suggest, there-fore, that such a follow-up investigation utilizing that procedurewould be a natural and desirable addition to our exploratoryanalysis.
To hold the technical complexity of our lattice model to a mini-mum, the treatment of the solvent species has been rudimentary.Specifically the nearest-neighbor pair interactions between a pairof solvents, and between a solvent and an enantiomorph, havebeen set equal (and equal to zero by choice of the energy scale).More generally it would be instructive to determine the extentto which relaxing this simplifying constraint could produce sub-stantial changes in the phase diagram. One possibility might bethe appearance of a pair of coexisting liquid phases, one an enan-tiomorph melt containing a low concentration of solvent, the othera dilute solution of enantiomorphs as described in Results. Thiswould presumably give rise to an upper consolute point uponraising the temperature.
The two-dimensional lattice model possesses a straightforwardextension to three dimensions, based on the simple cubic latticewith 6 nearest neighbors. Solvents can continue to be treated asstructureless particles occupying a single-lattice site. The enan-tiomorphs likewise would occupy single-lattice sites but wouldbe endowed with 3 rather than 2 mutually perpendicular “arms”that would orient toward 3 of the 6 nearest neighbors. Thesearms would be individually distinguishable (“a,” “b,” and “c”),and would be assigned to each molecule in either of 2 ways thatare mirror images of one another. Nearest-neighbor pair interac-tions could be assigned as in the two-dimensional case, includingthose around each elementary square, to ensure the stability of astoichiometric crystal at low temperature.
ACKNOWLEDGMENTS. We thank Prof. Donna Blackmond for backgroundinformation and advice concerning this research project. This work was sup-ported by National Science Foundation Collaborative Research in ChemistryGrant CHE0404699 (to P.G.D.).
1. Weissbuch I, Leiserowitz L, Lahav M (2005) Stochastic “mirror symmetry breaking” viaself-assembly, reactivity and amplification of chirality: Relevance to abiotic conditions.Top Curr Chem 259:123–165.
2. Mislow K (2003) Absolute asymmetric synthesis: A commentary. Collect Czech ChemCommun 68:849–864.
3. Soai K, Shibata T, Morioka H, Choji K (1995) Asymmetric autocatalysis and amplifica-tion of enantiomeric excess of a chiral molecule. Nature 378:767–768.
4. Cartwright JHE, Piro O, Tuval I (2007) Ostwald ripening, chiral crystallization, and thecommon-ancestor effect. Phys Rev Lett 98:165501-1–165501-4.
5. Klussmann M, et al. (2006) Thermodynamic control of asymmetric amplification inamino acid catalysis. Nature 441:621–623.
6. Blackmond DG, Klussmann M (2007) Spoilt for choice: assessing phase behavior modelsfor the evolution of homochirality. Chem Commun 2007:3990–3996.
7. Cao M, Monson PA (2005) A study of the phase behavior of a simple model of chiralmolecules and enantiomeric mixtures. J Chem Phys 122:054505-1–054505-8.
8. Perusquía RA, Peón J, Quintana J (2005) Two-dimensional model for mixturesof enantiomers, bent hard needles: a Monte Carlo simulation. Physica A 345:130–142.
9. Jacques J, Collet A, Wilen SH (1981) Enantiomers, Racemates, and Resolutions (Wiley,New York).
10. Eliel EL, Wilen SH, Mander LN (1994) Stereochemistry of Organic Compounds (Wiley,New York).
11. Stanley HE (1971) Introduction to Phase Transitions and Critical Phenomena (OxfordUniv Press, New York).
12. Williams EJ (1935) The effect of thermal agitation on atomic arrangement in alloys -iii. Proc Roy Soc Lond A 152:231–252.
13. Sandler, SI (2006) Chemical, Biochemical, and Engineering Thermodynamics (Wiley,Hoboken, NJ), 4th Ed.
14. Walas SM (1985) Phase Equilibria in Chemical Engineering (Butterworth,Boston).
Lombardo et al. PNAS September 8, 2009 vol. 106 no. 36 15135
Dow
nloa
ded
by g
uest
on
Mar
ch 1
3, 2
020