thermodynamic modeling of mea -based co2 capture … · thermodynamic modeling of mea -based co2...
TRANSCRIPT
Thermodynamic Modeling of MEA-based CO2 Capture Process with Uncertainty Quantification and Validation with Steady-State Data from a Pilot Plant
Joshua C. Morgana, Anderson Soares Chinena, Benjamin Omella, Debangsu Bhattacharyyaa, Charles Tongb, David C. Millerc, John Wheeldond, Bill Buschlee, Mathieu Lucquiande
a Department of Chemical Engineering, West Virginia University, Morgantown, WV 26506, USAb Lawrence Livermore National Laboratory, Livermore, CA 94550, USAc National Energy Technology Laboratory, 626 Cochrans Mill Rd, Pittsburgh, PA 15236, USAd National Carbon Capture Center, 31800 Highway 25, North Wilsonville, AL, 35186, USAe School of Engineering, University of Edinburgh, Edinburgh, EH9 3JL, UK
AIChE Annual Meeting 2015

2
For Accelerating Technology Development
National Labs Academia Industry
Rapidly synthesize optimized processes to identify promising
concepts
Better understand internal behavior to
reduce time for troubleshooting
Quantify sources and effects of uncertainty to
guide testing & reach larger scales faster
Stabilize the cost during commercial
deployment
2
3
Outline• Scope of Work• Submodel Development
– Thermodynamic and kinetic models– Mass transfer and hydraulic models
• Model Validation• Conclusions
4
Outline• Scope of Work• Submodel Development
– Thermodynamic and kinetic models– Mass transfer and hydraulic models
• Model Validation• Conclusions
5
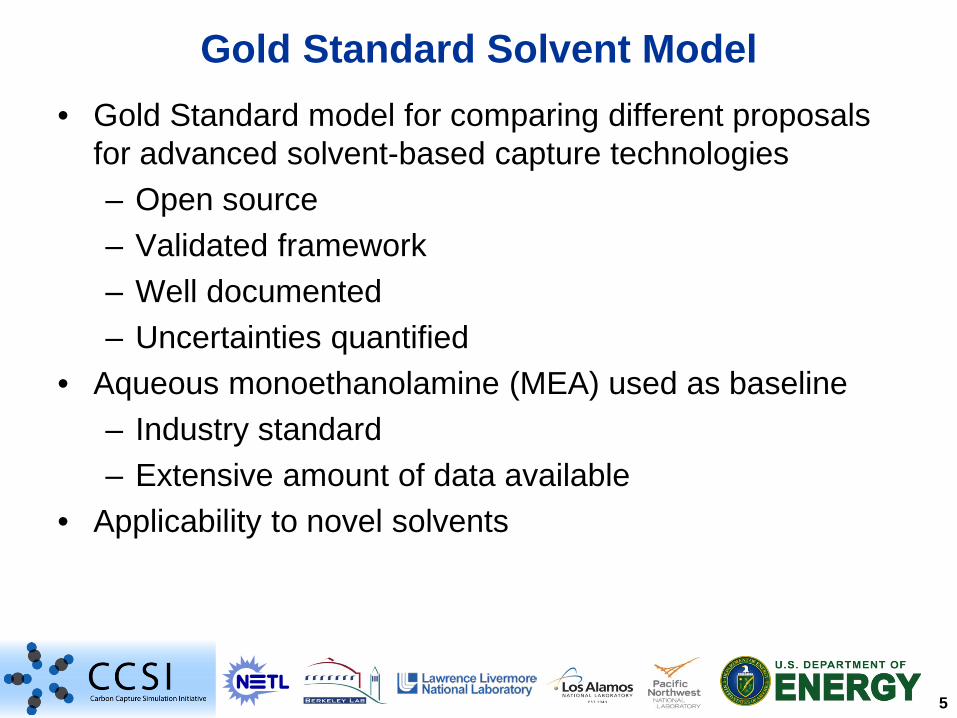
Gold Standard Solvent Model• Gold Standard model for comparing different proposals
for advanced solvent-based capture technologies– Open source– Validated framework– Well documented– Uncertainties quantified
• Aqueous monoethanolamine (MEA) used as baseline– Industry standard– Extensive amount of data available
• Applicability to novel solvents

6
Deficiencies in Existing Absorber Models
ProTreat-Optimized Gas Treating, Inc.; CO2SIM-NTNU/SINTEFCHEMASIM-BASF SE; AspenRatesep-modified by IFP
Zhang, et al., Rate-Based Process Modeling Study of CO2 Capture with Aqueous MonoethanolamineSolution, Ind. Eng. Chem Res., 48, 9233-9246, 2009
Luo et al., “Comparison and validation of simulation codes against sixteen sets of data from four different pilot plants”, Energy Procedia, 1249-1256, 2009
7
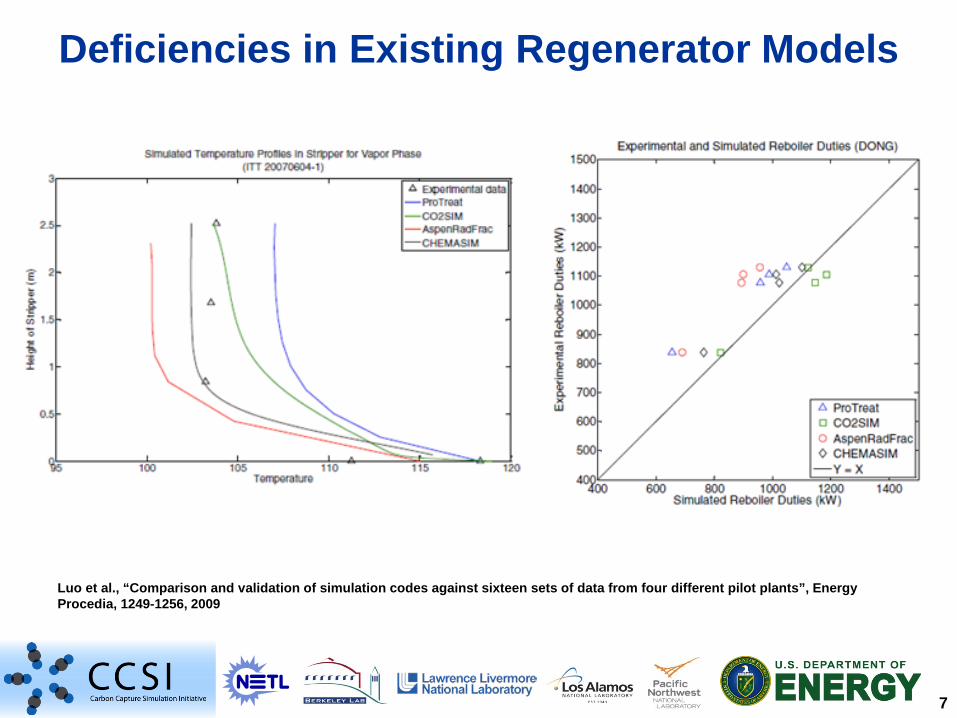
Deficiencies in Existing Regenerator Models
Luo et al., “Comparison and validation of simulation codes against sixteen sets of data from four different pilot plants”, EnergyProcedia, 1249-1256, 2009

8
How to Develop Gold Standard Model• Property models
– Valid for absorber and stripper operating conditions• Hydraulic and mass transfer models
– Developed simultaneously with relevant properties models using both WWC and packing data
• Uncertainty quantification• Steady State Validation• Dynamic Validation*
* Anderson Soares Chinen687g Dynamic Model Development and Validation of a MEA-Based CO2 Capture System11/9/2015 2:36 p.m. Salon D (Marriott)

9
Overall Approach
10
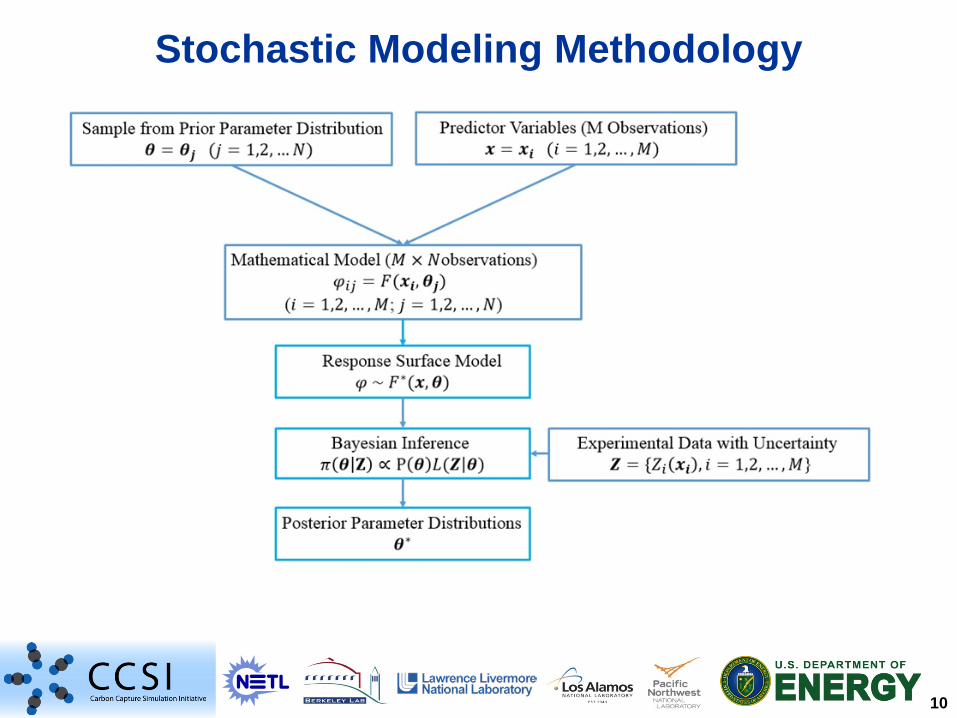
Stochastic Modeling Methodology
11
Outline• Scope of Work• Submodel Development
– Thermodynamic and kinetic models– Mass transfer and hydraulic models
• Model Validation• Conclusions

12
Reactive System Thermodynamic Framework
Vapor-Liquid Equilibrium
𝑓𝑓𝑖𝑖𝑉𝑉 = 𝑓𝑓𝑖𝑖𝐿𝐿 �𝜑𝜑𝑖𝑖𝑦𝑦𝑖𝑖𝑃𝑃 = 𝛾𝛾𝑖𝑖∗𝑥𝑥𝑖𝑖𝐻𝐻𝑖𝑖 (for solutes)
Enthalpy Equations
Excess Enthalpy
𝐻𝐻𝑒𝑒𝑒𝑒 = −𝑅𝑅𝑇𝑇2�𝑖𝑖
𝑥𝑥𝑖𝑖 �𝜕𝜕𝜕𝜕γ𝑖𝑖𝜕𝜕𝑇𝑇
𝑃𝑃,𝑒𝑒
Heat Capacity
𝐻𝐻𝑚𝑚𝑙𝑙 𝑇𝑇 + ∆𝑇𝑇 − 𝐻𝐻𝑚𝑚𝑙𝑙 𝑇𝑇 = �𝑇𝑇
𝑇𝑇+∆𝑇𝑇
𝐶𝐶𝑝𝑝,𝑚𝑚𝑙𝑙𝑑𝑑𝑇𝑇
Heat of Absorption
∆𝐻𝐻𝑎𝑎𝑎𝑎𝑎𝑎 =𝑛𝑛𝑓𝑓𝑖𝑖𝑓𝑓𝑎𝑎𝑙𝑙𝐻𝐻𝑓𝑓𝑖𝑖𝑓𝑓𝑎𝑎𝑙𝑙 − 𝑛𝑛𝑖𝑖𝑓𝑓𝑖𝑖𝑖𝑖𝑖𝑖𝑎𝑎𝑙𝑙𝐻𝐻𝑖𝑖𝑓𝑓𝑖𝑖𝑖𝑖𝑖𝑖𝑎𝑎𝑙𝑙 − 𝑛𝑛𝐶𝐶𝐶𝐶2𝐻𝐻𝐶𝐶𝐶𝐶2
𝑛𝑛𝐶𝐶𝐶𝐶2
Activity Coefficient
𝑙𝑙𝑛𝑛 𝛾𝛾𝑖𝑖 =1𝑅𝑅𝑇𝑇 �
)𝜕𝜕(𝑛𝑛𝐺𝐺𝑒𝑒𝑒𝑒
𝜕𝜕𝑛𝑛𝑖𝑖 𝑇𝑇,𝑃𝑃,𝑓𝑓𝑗𝑗≠𝑖𝑖
𝛾𝛾𝑖𝑖∗ =𝛾𝛾𝑖𝑖
𝜕im𝑒𝑒𝑖𝑖→0
𝛾𝛾𝑖𝑖
Reaction Equilibrium Constant
)∆𝐺𝐺𝑟𝑟𝑒𝑒𝑓𝑓 = −𝑅𝑅𝑇𝑇𝑙𝑙𝑛𝑛(𝐾𝐾

13
MEA System Reaction Kinetics
Reaction 1
Reaction 2
2𝑀𝑀𝑀𝑀𝑀𝑀 + 𝐶𝐶𝐶𝐶2↔𝑀𝑀𝑀𝑀𝑀𝑀+ + 𝑀𝑀𝑀𝑀𝑀𝑀𝐶𝐶𝐶𝐶𝐶𝐶−
𝑀𝑀𝑀𝑀𝑀𝑀 + 𝐻𝐻2𝐶𝐶 + 𝐶𝐶𝐶𝐶2↔𝑀𝑀𝑀𝑀𝑀𝑀+ + 𝐻𝐻𝐶𝐶𝐶𝐶3−
𝑟𝑟1𝑓𝑓 = 8.5616 × 10¹⁰ exp −
3963.98.314
1𝑇𝑇−
1298.15
𝑎𝑎𝑀𝑀𝑀𝑀𝑀𝑀2 𝑎𝑎𝐶𝐶𝐶𝐶2
𝑟𝑟1𝑟𝑟 = 24800 exp −596008.314
1𝑇𝑇 −
1298.15 𝑎𝑎𝑀𝑀𝑀𝑀𝑀𝑀𝐶𝐶𝐶𝐶𝐶𝐶−𝑎𝑎𝑀𝑀𝑀𝑀𝑀𝑀+
𝑟𝑟2𝑓𝑓 = 22991.13 exp −
490008.314
1𝑇𝑇 −
1298.15 𝑎𝑎𝑀𝑀𝑀𝑀𝑀𝑀𝑎𝑎𝐶𝐶𝐶𝐶2
𝑟𝑟2𝑟𝑟 = 18.35 exp −962308.314
1𝑇𝑇 −
1298.15
𝑎𝑎𝐻𝐻𝐶𝐶𝐶𝐶3−𝑎𝑎𝑀𝑀𝑀𝑀𝑀𝑀+𝑎𝑎𝐻𝐻2𝐶𝐶
Model from: Hilliard MD , Ph.D. Dissertation, UT Austin, 2008

14
MEA System Reaction Kinetics - New
Reaction 1
Reaction 2
2𝑀𝑀𝑀𝑀𝑀𝑀 + 𝐶𝐶𝐶𝐶2↔𝑀𝑀𝑀𝑀𝑀𝑀+ + 𝑀𝑀𝑀𝑀𝑀𝑀𝐶𝐶𝐶𝐶𝐶𝐶−
𝑀𝑀𝑀𝑀𝑀𝑀 + 𝐻𝐻2𝐶𝐶 + 𝐶𝐶𝐶𝐶2↔𝑀𝑀𝑀𝑀𝑀𝑀+ + 𝐻𝐻𝐶𝐶𝐶𝐶3−
𝑟𝑟1 = 8.5616 × 10¹⁰ exp −3963.98.314
1𝑇𝑇−
1298.15
𝑎𝑎𝑀𝑀𝑀𝑀𝑀𝑀2 𝑎𝑎𝐶𝐶𝐶𝐶2 1 −𝑎𝑎𝑀𝑀𝑀𝑀𝑀𝑀+𝑎𝑎𝑀𝑀𝑀𝑀𝑀𝑀𝐶𝐶𝐶𝐶𝐶𝐶−𝐾𝐾1𝑎𝑎𝑀𝑀𝑀𝑀𝑀𝑀2 𝑎𝑎𝐶𝐶𝐶𝐶2
𝑟𝑟2 = 22991.13 exp −490008.314
1𝑇𝑇 −
1298.15 𝑎𝑎𝑀𝑀𝑀𝑀𝑀𝑀𝑎𝑎𝐶𝐶𝐶𝐶2 1 −
𝑎𝑎𝑀𝑀𝑀𝑀𝑀𝑀+𝑎𝑎𝐻𝐻𝐶𝐶𝐶𝐶3−𝐾𝐾2𝑎𝑎𝑀𝑀𝑀𝑀𝑀𝑀𝑎𝑎𝐶𝐶𝐶𝐶2𝑎𝑎𝐻𝐻2𝐶𝐶
𝐾𝐾1 = �𝛾𝛾𝑀𝑀𝑀𝑀𝑀𝑀+𝑥𝑥𝑀𝑀𝑀𝑀𝑀𝑀+𝛾𝛾𝑀𝑀𝑀𝑀𝑀𝑀𝐶𝐶𝐶𝐶𝐶𝐶−𝑥𝑥𝑀𝑀𝑀𝑀𝑀𝑀𝐶𝐶𝐶𝐶𝐶𝐶−
(𝛾𝛾𝑀𝑀𝑀𝑀𝑀𝑀∗ 𝑥𝑥𝑀𝑀𝑀𝑀𝑀𝑀)2𝛾𝛾𝐶𝐶𝐶𝐶2∗ 𝑥𝑥𝐶𝐶𝐶𝐶2 𝑒𝑒𝑒𝑒
𝐾𝐾2 = �𝛾𝛾𝑀𝑀𝑀𝑀𝑀𝑀+𝑥𝑥𝑀𝑀𝑀𝑀𝑀𝑀+𝛾𝛾𝐻𝐻𝐶𝐶𝐶𝐶3−𝑥𝑥𝐻𝐻𝐶𝐶𝐶𝐶3−
𝛾𝛾𝑀𝑀𝑀𝑀𝑀𝑀∗ 𝑥𝑥𝑀𝑀𝑀𝑀𝑀𝑀𝛾𝛾𝐶𝐶𝐶𝐶2∗ 𝑥𝑥𝐶𝐶𝐶𝐶2𝛾𝛾𝐻𝐻2𝐶𝐶𝑥𝑥𝐻𝐻2𝐶𝐶 𝑒𝑒𝑒𝑒

15
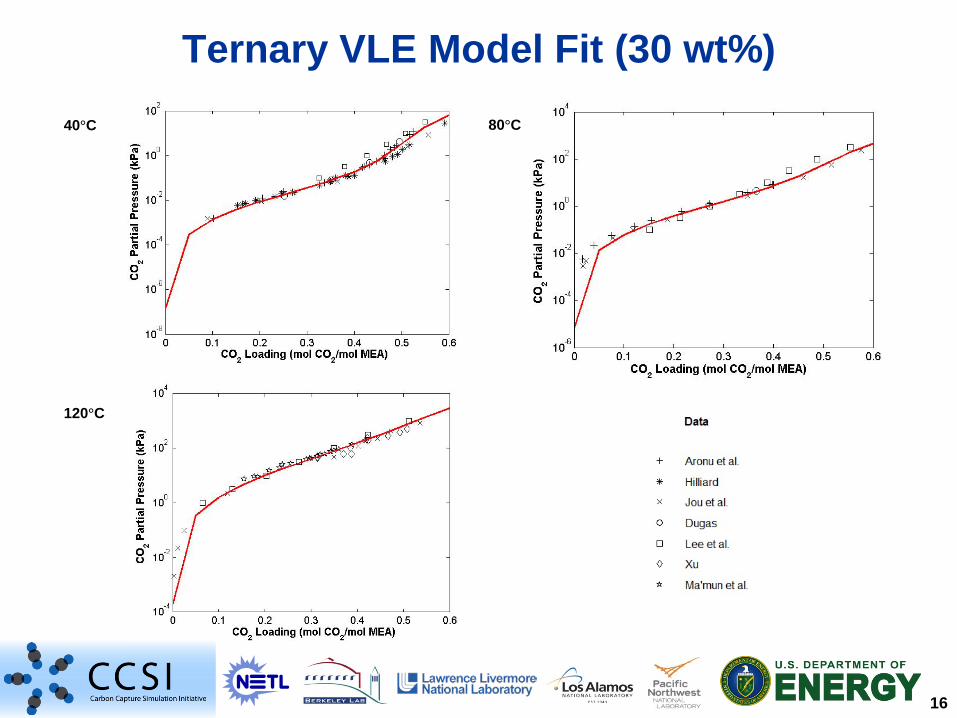
VLE Ternary Data
Aronu et al., Chem Eng Sci,2011;66:6393-6406
Hilliard MD, Ph.D. Dissertation, UT Austin, 2008
Jou et al., Can J Chem Eng, 1995;73:140-147
Dugas RE, Ph.D. Dissertation, UT Austin, 2009
Lee et al., J Appl Chem Biotechn, 1976;26:541-549
Xu Q, Ph.D. Dissertation, UT Austin, 2011
Ma’mun et al.,J Chem Eng Data, 2005;50:630-634
Data Source Number of Data
Temperature (°C) CO2 loading(mol CO2/mol
MEA)
MEA weight percent
CO2 partial pressure
(kPa)
Aronu et al. 138 40-80 0.017-0.565 15-60 0.007-19Hilliard 55 40-60 0.114-0.591 17-40 0.005-50
Jou et al. 46 25-120 0.003-0.589 30 0.0015-822
Dugas 50 40-100 0.231-0.500 30-45 0.01-29Lee et al. 155 25-120 0.065-0.600 6.5-32 0.1-1000
Xu 36 100-130 0.313-0.520 30 12-1000Ma’mun et al. 19 120 0.155-0.418 30 7-192
16
Ternary VLE Model Fit (30 wt%)40°C 80°C
120°C
17
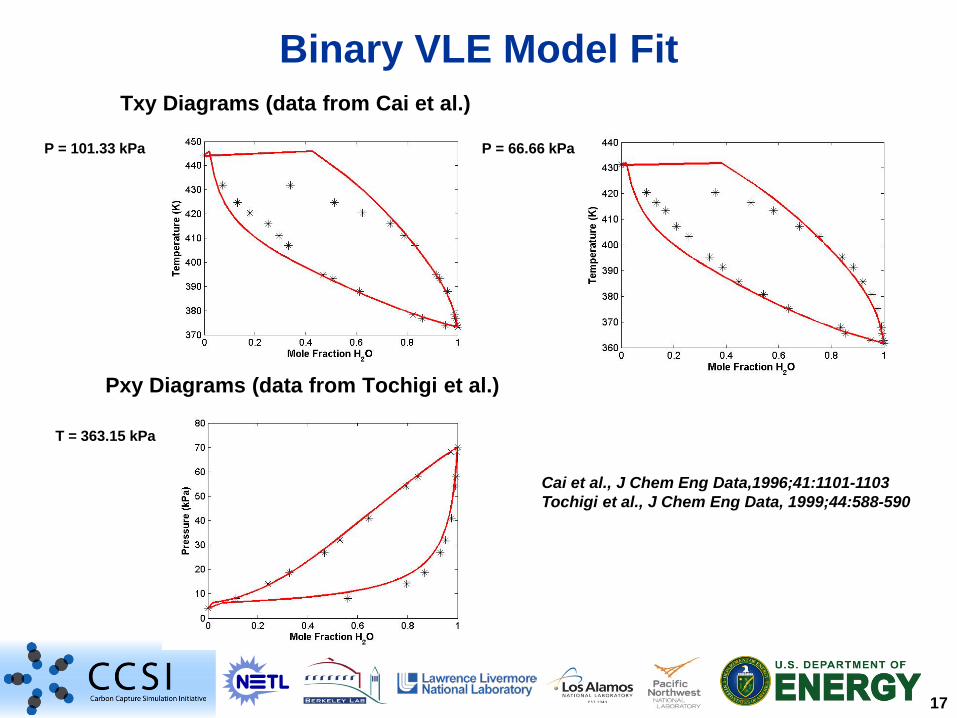
Binary VLE Model FitTxy Diagrams (data from Cai et al.)
Pxy Diagrams (data from Tochigi et al.)
Cai et al., J Chem Eng Data,1996;41:1101-1103Tochigi et al., J Chem Eng Data, 1999;44:588-590
P = 101.33 kPa P = 66.66 kPa
T = 363.15 kPa

18
Heat of Absorption Comparison
Data from: Kim et al., Energy Procedia,2014;63:1446-1455

19
VLE Model Uncertainty Quantification
CO2 Partial Pressure for 80°C and 30 wt% MEA
Prior Distribution Posterior Distribution
Sample of 5000 drawn from each distribution

20
Outline• Scope of Work• Submodel Development
– Thermodynamic and kinetic models– Mass transfer and hydraulic models
• Model Validation• Conclusions

21
Integrated Mass Transfer Model DevelopmentUsual approach: Sequential regression
0
0.3
0.6
0.9
1.2
0 15 30 45 60
Optimized model for wetted wall column
experiments
0
0.3
0.6
0.9
1.2
0 15 30 45 60
Might not exactly predict the data of an
absorber column
FOQUS capability: Simultaneous regression CO2 Weight Fraction in Outlet Flue Gas
0
0.04
0.08
0.12
0.16
0 0.04 0.08 0.12 0.16E
xper
imen
tal d
ata
Integrated mass transfer model
Experimental data from: Tobiesen et al., AIChE Journal, 2007;53:846-865
FOQUS can run multiple simulations and optimize an
unique model for mass transfer and interfacial area
22
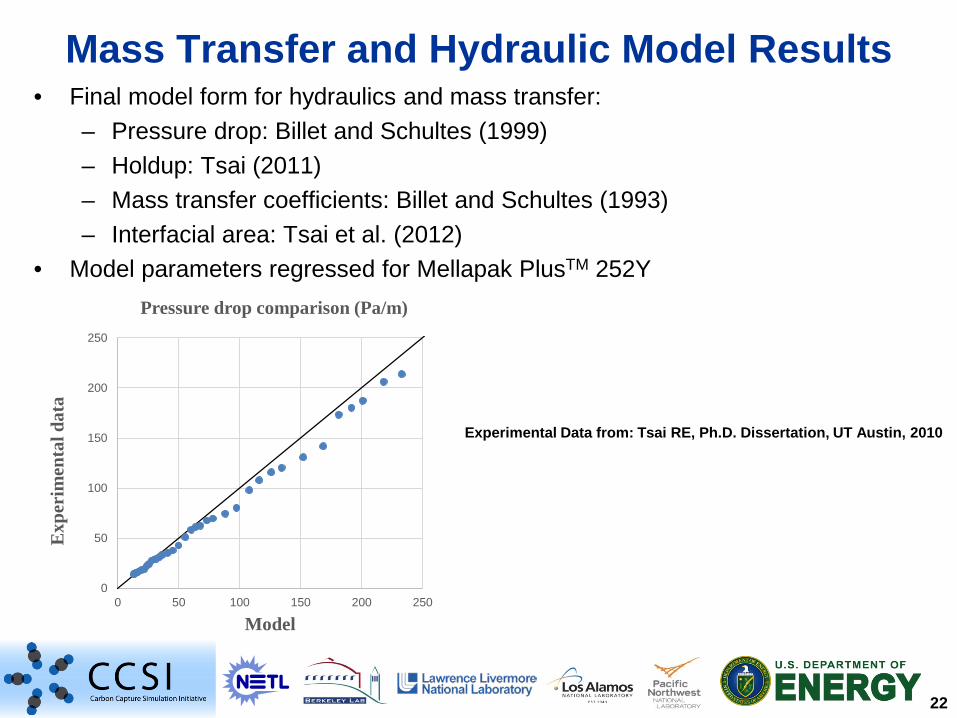
Mass Transfer and Hydraulic Model Results• Final model form for hydraulics and mass transfer:
– Pressure drop: Billet and Schultes (1999)– Holdup: Tsai (2011)– Mass transfer coefficients: Billet and Schultes (1993)– Interfacial area: Tsai et al. (2012)
• Model parameters regressed for Mellapak PlusTM 252Y
Experimental Data from: Tsai RE, Ph.D. Dissertation, UT Austin, 2010
0
50
100
150
200
250
0 50 100 150 200 250
Exp
erim
enta
l dat
a
Model
Pressure drop comparison (Pa/m)
23
Outline• Scope of Work• Submodel Development
– Thermodynamic and kinetic models– Mass transfer and hydraulic models
• Model Validation• Conclusions
24
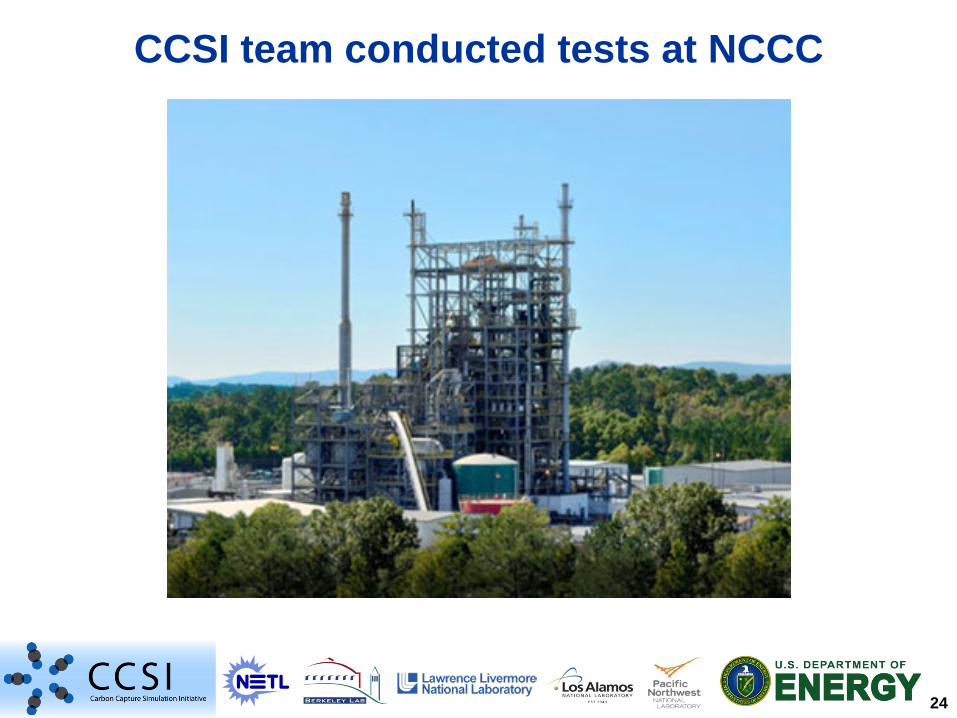
CCSI team conducted tests at NCCC

25
NCCC vs Other Pilot PlantsCO2Capacity (tpd)
Source of Flue Gas
Absorber RegeneratorDiameter (cm)
Height (m)
Diameter (cm)
Height (m)
UT, Austin
3.0 Non-coal
42.7 6.1 42.7 6.1
NTNU/SINTEF
0.3 Non-coal
15.0 4.4 10.0 3.9
ITC,Regina
1.0 Non-coal
33.0 7.1 33.0 10.0
ITT, Stuttgart
0.3 Non-coal
12.5 4.2 12.5 2.5
Esbjerg CASTOR
24.0 Coal 110.0 17.0 110.0 10.0
NCCC (PSTU)
10.0 Coal 64.1 18.5 59.1 12.1

26
NCCC Steady State Testing• Runs selected from test matrix developed by CCSI team• Total of 23 tests performed• Range of variables/operating conditions
Variable RangeAbsorber Inlet Flue Gas Flow (kg/hr) 1320-2900
Lean Solvent Flowrate (kg/hr) 3175-11800Absorber L/G ratio (molar) 1.7-10.4
Reboiler Duty (kW) 166-677Lean Solvent Loading (mol CO2/mol MEA) 0.045-0.287Rich Solvent Loading (mol CO2/mol MEA) 0.198-0.343
Inlet Flue Gas CO2 Volume % 9-11Number of Beds in Absorber 1-3
Presence of Intercooling in Absorber Yes/No

27
Uncertainty of the Measurement Techniques• Dynamic Test Runs: Gas Chromatography (GC) for Amine Concentration
and Bench Equivalence Point (EQP) Base Titration (CO2 Concentration)• Steady State Runs: Online EQP Acid Titration (Amine Concentration) and
Online EQP Base Titration (CO2 Concentration)
Analysis Techniques Repeatability Evaluation Analysis Techniques Uncertainty Evaluation
Critical Model Parameters:
Portion of Campaign Dynamic Steady State
Amine Concentration(wt% MEA Nominal)% rel expanded uncertainty (k=2)
4.9% 7.3%
CO2 Loading(mol CO2 / mol MEA)% rel expanded uncertainty (k=2)
7.4% 10.7%

28
Steady State Absorber Validation
Percent Deviation Between Data and Model Values (Summary)
Data CO2 Capture-Liquid vs. Gas Discrepancy
CO2 Capture-Gas Side CO2 Capture-Liquid Side
Rich Loading
Maximum 9.19 8.09 10.84 7.36
Average 3.62 2.69 3.97 2.69
40
50
60
70
80
90
100
40 50 60 70 80 90 100
Mod
el C
O2
Cap
ture
Data CO2 Capture
0.25
0.3
0.35
0.4
0.45
0.5
0.55
0.25 0.3 0.35 0.4 0.45 0.5 0.55
Mod
el R
ich
Loa
ding
(m
olC
O2/m
olM
EA
)
Data Rich Loading (mol CO2/mol MEA)
CO2 Capture Prediction Rich Loading Comparison
29
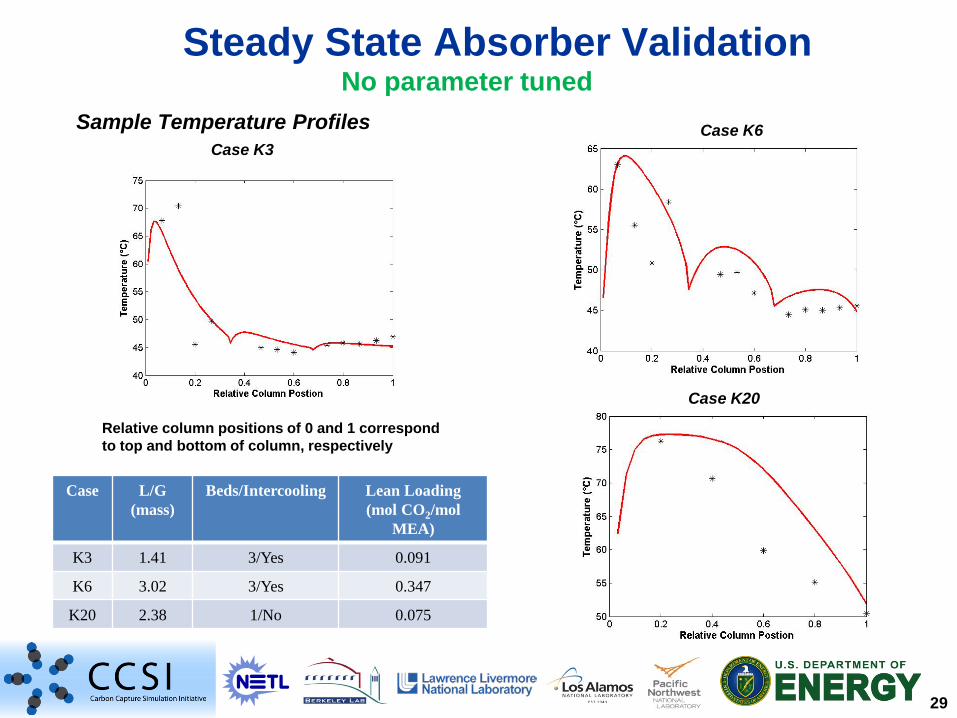
Steady State Absorber Validation
Sample Temperature ProfilesCase K3
No parameter tuned
Relative column positions of 0 and 1 correspond to top and bottom of column, respectively
Case L/G (mass)
Beds/Intercooling Lean Loading (mol CO2/mol
MEA)
K3 1.41 3/Yes 0.091
K6 3.02 3/Yes 0.347
K20 2.38 1/No 0.075
Case K20
Case K6

30
Steady State Regenerator ValidationLean Loading Comparison Lean Solvent Temperature Comparison
00.050.1
0.150.2
0.250.3
0.350.4
0.450.5
0 0.1 0.2 0.3 0.4 0.5
Mod
el L
ean
Loa
ding
(m
olC
O2/m
olM
EA
)
Data Lean Loading (mol CO2/mol MEA)
100
105
110
115
120
125
100 105 110 115 120 125
Mod
el L
ean
Solv
ent
Tem
pera
ture
(°C
)
Data Lean Solvent Temperature (°C)
Percent Deviation Between Data and Model Values (Summary)
Lean Loading Lean Solvent Temperature
Maximum 16.53 1.14
Average 6.39 0.48
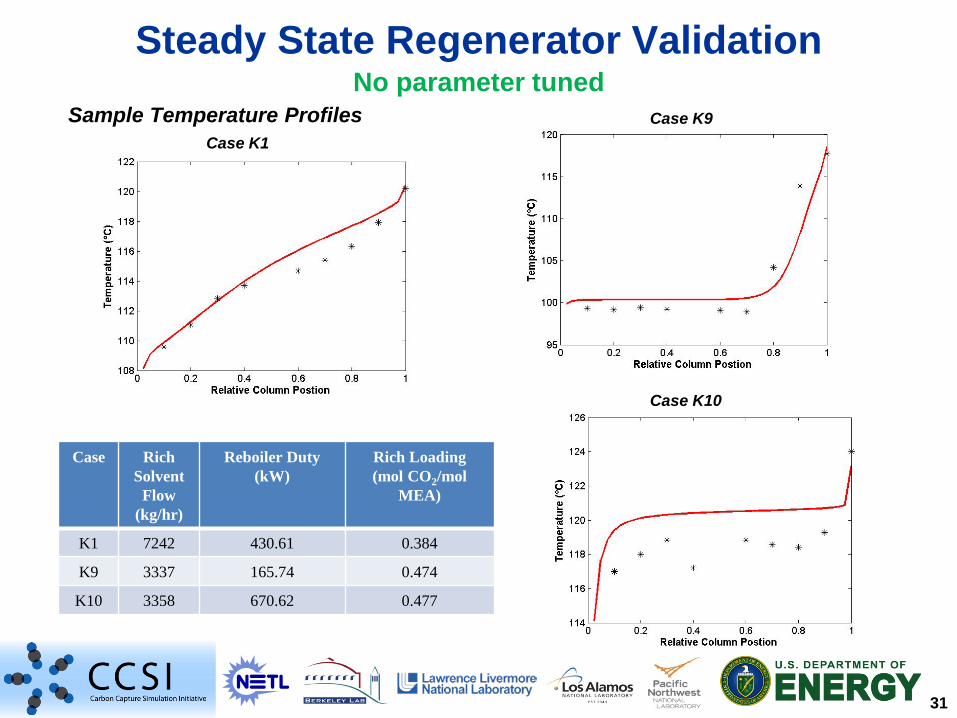
31
Steady State Regenerator ValidationNo parameter tuned
Sample Temperature Profiles
Case RichSolvent
Flow (kg/hr)
Reboiler Duty (kW)
Rich Loading (mol CO2/mol
MEA)
K1 7242 430.61 0.384
K9 3337 165.74 0.474
K10 3358 670.62 0.477
Case K1Case K9
Case K10

32
Outline• Scope of Work• Submodel Development
– Thermodynamic and kinetic models– Mass transfer and hydraulic models
• Model Validation• Conclusions
33
Conclusions• Developed complete process model of MEA carbon
capture system– Includes consistent thermodynamic framework
• Model adequately predicts performance of NCCC absorber and stripper– Model parameters not adjusted to improve fit of model
to plant data • Future work
– Complete uncertainty quantification of full process model
– Apply methodology to novel solvent systems

34
This research was conducted through the Carbon Capture Simulation Initiative (CCSI), funded through the U.S. DOE Office of Fossil Energy.A portion of this work was conducted as part of the National Energy Technology Laboratory’s Regional University Alliance (NETL-RUA), a collaborative initiative of the NETL; this technical effort was performed under the RES contract DE-FE0004000.
The authors would like to thank Prof. Gary T. Rochelle from The University of Texas at Austin for sharing the Phoenix model. The authors sincerely acknowledge valuable discussions with Prof. Rochelle and Brent Sherman from The University of Texas at Austin
Acknowledgements
Disclaimer This presentation was prepared as an account of work sponsored by an agency of the United States Government. Neither the United States Government nor any agency thereof, nor any of their employees, makes any warranty, express or implied, or assumes any legal liability or responsibility for the accuracy, completeness, or usefulness of any information, apparatus, product, or process disclosed, or represents that its use would not infringe privately owned rights. Reference herein to any specific commercial product, process, or service by trade name, trademark, manufacturer, or otherwise does not necessarily constitute or imply its endorsement, recommendation, or favoring by the United States Government or any agency thereof. The views and opinions of authors expressed herein do not necessarily state or reflect those of the United States Government or any agency thereof.