thermodynamic properties of 2,3,3,3-tetrafluoroprop-1-ene
TRANSCRIPT
Published: June 02, 2011
This article not subject to U.S. Copyright.Published 2011 by the American Chemical Society 3254 dx.doi.org/10.1021/je200369m | J. Chem. Eng. Data 2011, 56, 3254–3264
ARTICLE
pubs.acs.org/jced
Thermodynamic Properties of 2,3,3,3-Tetrafluoroprop-1-ene(R1234yf): Vapor Pressure and p�G�T Measurements andan Equation of StateMarkus Richter,† Mark O. McLinden,* and Eric W. Lemmon
Thermophysical Properties Division, National Institute of Standards and Technology, 325 Broadway, Mailstop 838.07, Boulder,Colorado 80305, United States
bS Supporting Information
ABSTRACT: The p�F�T behavior of 2,3,3,3-tetrafluoroprop-1-ene (R1234yf) was measured from T = (232 to 400) K withpressures up to 10 MPa using a two-sinker densimeter. The measurements extend from low-density vapor to compressed-liquidstates, and include the extended critical region. Vapor pressures from T = (250 to 366) K were also measured. The expanded (k = 2)uncertainty in density is (56 3 10
�63 Fþ 0.0014 kg 3m
�3) at near-ambient conditions, increasing to (99 3 10�6
3 Fþ 0.0014 kg 3m�3)
at T = 400 K and p = 10 MPa. The maximum uncertainties in temperature and pressure are 0.004 K and (51 3 10�6
3 p þ 2.0 kPa),respectively. The analysis for density accounts for the force transmission error in the magnetic suspension coupling of thedensimeter and includes corrections for vertical density gradients in themeasuring cell. These data, together with other data from theliterature, have been used to develop an equation of state explicit in the Helmholtz energy covering the fluid region from T = (220 to410) K with pressures up to 30 MPa. Comparisons to experimental data, including other literature data, are given to establish theaccuracy of the equation of state.
1. INTRODUCTION
2,3,3,3-Tetrafluoroprop-1-ene (R1234yf) is a fluorinated hy-drocarbon that has been recently proposed to replace R134a inautomotive air-conditioning and other applications. R1234yfoffers a remarkably low global warming potential (GWP) of 4relative to CO2 for a 100 year time horizon.1 In comparison,R134a has a GWP of 1430. The atmospheric lifetime is 11 dayscompared to a lifetime for R134a of about 13 years.1 Its shortatmospheric lifetime is a result of the double bond in thechemical structure. The thermophysical properties of both fluidsare similar, thus minimizing equipment changes in refrigerationapplications. R1234yf has a critical temperature of 367.85 K.2
Under normal conditions, it is a stable material of low toxicity,although it is slightly flammable. It has been assigned a safetyclassification of A2L according to ASHRAE Standard 34.3
In the present project, we have measured the p�F�T proper-ties and vapor pressures of R1234yf. These data, together withadditional data from the literature, have been used to develop anequation of state covering the entire fluid region fromT = (220 to410) Kwith pressures up to 30MPa. The present paper describeshigh-accuracy measurements of the p�F�T behavior of high-purity (99.96 %) R1234yf from T = (232 to 400) K withpressures up to 10 MPa using a two-sinker densimeter; theseinclude measurements in the vicinity of the critical point. Vaporpressures from T = (250 to 366) K were also measured. Detailedcomparisons of the measured data with the new equation of state(EOS) and also with all prior literature data are given.
2. EXPERIMENTAL SECTION
For the measurements reported in this paper a two-sinkerdensimeter was utilized. This type of instrument applies the
Archimedes (buoyancy) principle to provide an absolute deter-mination of the density, that is, a measurement that is indepen-dent of calibration fluids. The accuracy of the Archimedestechnique has been improved by the use of two sinkers. Inparticular, the two-sinker technique developed by Kleinrahm andWagner4 has proven very successful. The state of the art of thisgeneral type of instrument is described by Wagner andKleinrahm.5
2.1. Apparatus Description.The two-sinker densimeter usedin this work is described in detail by McLinden and L€osch-Will6
as well as by L€osch-Will.7 Only a brief description is given here.Two sinkers of nearly the same mass and surface area, but madeof materials with different densities such that they have verydifferent volumes, are weighed separately with a high-precisionbalance while they are immersed in a fluid of unknown density.For the present two-sinker densimeter, one sinker was madefrom tantalum with a mass m1 of 60.177 91 g and a volume of3.610 25 cm3 at T = 293.15 K and ambient pressure, and theother was made from titanium with a massm2 of 60.163 34 g anda volume of 13.347 55 cm3 at T = 293.15 K. The fluid density isgiven by
Ffluid ¼ ðm1 �m2Þ � ðW1 �W2ÞðV1 � V2Þ ð1Þ
where m and V are the sinker mass and volume,W is the balancereading, and the subscripts refer to the two sinkers.
Received: April 14, 2011Accepted: May 21, 2011
3255 dx.doi.org/10.1021/je200369m |J. Chem. Eng. Data 2011, 56, 3254–3264
Journal of Chemical & Engineering Data ARTICLE
The main advantage of the two-sinker method is that adsorp-tion onto the surfaces of the sinkers, systematic errors in theweighings, and other effects that reduce the accuracy of mostbuoyancy techniques largely cancel out. A magnetic suspensioncoupling (MSC) transmits the gravity and buoyancy forces onthe sinkers to the balance, thus isolating the fluid sample (whichmay be at high pressure and high temperature) from the balance,which is placed under ambient conditions. The central elementsof the coupling are two magnets, one on each side of a nearlynonmagnetic, pressure-separating wall. The top magnet, which isan electromagnet with a ferrite core, is attached to the under-panweighing hook of the balance. The bottom (permanent) magnetis immersed in the fluid sample; it is held in stable suspensionwith respect to the top magnet by means of a feedback controlcircuit making fine adjustments in the electromagnet current.The permanent magnet is linked with a “lifting fork” to pick up asinker for weighing. A mass comparator balance with a resolutionof 1 μg and a capacity of 111 g is used for the weighings.In addition to the sinkers, two calibration masses are also
weighed. This calibrates the balance and provides the informa-tion needed to correct for magnetic effects as described byMcLinden et al.8 The weighings yield a set of four equationsthat are solved to yield a balance calibration factorR, a parameterβ related to the balance tare (i.e., the magnets and other elementsof the system that are always weighed), and a parameter φ, whichexpresses the efficiency of the MSC. This analysis yields the fluiddensity in terms of directly measured quantities:
Ffluid ¼ðm1 �m2Þ � ðW1 �W2Þm1
W1 � Rβ
� �
ðV1 � V2Þ � ðW1 �W2ÞV1
W1 � Rβ
� � � F0 ð2Þ
where the F0 is the indicated density when the sinkers areweighed in vacuum; F0 accounts for small changes in sinkermass with time. The key point of the analysis byMcLinden et al.8
is that the density given by eq 2 compensates for the magneticeffects of both the apparatus and the fluid being measured. Theeffect of magnetic materials on the magnetic suspension couplingis known as the “force transmission error”, and this effect ischaracterized by the coupling factor φ. A value of φ = 1corresponds to a zero force transmission error; that is, thebalance would give the same reading for an object weighed viathe magnetic suspension coupling as for the same object weigheddirectly on the balance pan. For the present measurements φvaried from 1.000 022 in vacuum to 0.999 976 for R1234yf at thehighest densities.From the coupling factor φ and its variation with density it is
possible to estimate the specific magnetic susceptibility of a fluidas detailed by McLinden et al.8 R1234yf is slightly diamagnetic(as is typical for most fluids) with a specific magnetic suscept-ibility χs = �0.68 3 10
�8 ( 0.12 3 10�8 m3
3 kg�1.
In addition to themeasuring cell, sinkers, suspension coupling,and balance that made up the density measuring system, theapparatus included a thermostat, pressure instrumentation, and asample handling system. The temperature was measured with a25 Ω standard platinum resistance thermometer (SPRT) and aresistance bridge referenced to a thermostatted standard resistor.The signal from the SPRT was used in a digital control circuit tomaintain the cell temperature constant within ( 0.001 K. Thepressures were measured with vibrating-quartz-crystal-type pres-sure transducers. One of three transducers, with maximum
pressures of 2.80 MPa, 13.8 MPa, and 68.9 MPa, was used,depending on the pressure range. The transducers (as well as thepressure manifold) were thermostatted tominimize the effects ofvariations in laboratory temperature.The thermostat isolated the measuring cell from ambient
conditions. It was a vacuum-insulated, cryostat-type design.The measuring cell was surrounded by two isothermal shields.The first (inner) shield was directly attached to the measuringcell and was controlled to the same temperature. The second(outer) shield thermally isolated the measuring cell and the innershield from variations in ambient temperature; this shield wasmaintained at a constant (( 0.01 K) temperature 1 K below thecell temperature by means of electric heating. Additional electricheaters on the cell compensated for the small heat flow from thecell to the shield and allowed millikelvin-level control of the celltemperature. Operation at subambient temperatures was effectedby circulating ethanol from a chiller through channels in the outershield.2.2. Experimental Procedures. The measurements were
carried out primarily along pseudoisochores (that is, varyingtemperature at states of nearly constant density). This procedurewas used to minimize (compared to isothermal operation) therequired quantity of sample. This also avoided the need to useany type of compressor, which is a possible source of contamina-tion. The measuring cell was filled at a relatively high density andlow temperature. After several replicate points were measured atthe desired temperature, the cell was heated to the next, higherset-point temperature (thus raising the pressure), and measure-ments were made at that temperature. When measurements atthe maximum temperature were completed, the cell was cooled,and a portion of the R1234yf charge was vented into a recoverybottle. The measurement of the next isochore then commenced.Two near-critical isotherms atT = 370 K andT = 380 Kwere alsocarried out.Themeasurements comprised five separate fillings of R1234yf.
The cell was evacuated between fillings (and also prior to the firstfilling and after the final filling), and measurements were carriedout in vacuum to determine F0. A fresh sample was used for eachfilling.Vapor pressures were measured with the first filling of the cell,
using the densimeter as a static vapor pressure instrument withthe measuring cell partially filled with liquid (densities were notmeasured). In addition, check measurements of the vaporpressure were also carried out at the completion of several otherfillings. The second filling studied the vapor phase densities;several replicate isochores were carried out with the fifth filling.Filling 3 was used to study compressed liquid-phase densities andalso the supercritical isotherm at T = 370 K. The fourth fillingmeasured supercritical states at T = 380 K.2.3. Experimental Material. The supplier's analysis for the
R1234yf indicated a purity of 99.96 %. Our own analysis by gaschromatography combined with mass spectrometry and infraredspectrophotometry (carried out according to the protocols ofBruno and Svoronos9,10) revealed only very small impurity peaksthat were too small to permit identification. The sample wasdegassed by freezing in liquid nitrogen and evacuating the vaporspace. The sample, as received, contained a considerable amountof dissolved air, and a total of eight freeze�pump�thaw cycleswere carried out. On the final pumping cycle, the initial pressure inthe vapor space was 1 3 10
�4 Pa. The material used in thedensimeter was collected in a recovery bottle and analyzed againfollowing themeasurements; no change in the purity was detected.
3256 dx.doi.org/10.1021/je200369m |J. Chem. Eng. Data 2011, 56, 3254–3264
Journal of Chemical & Engineering Data ARTICLE
Two different series of tests were performed to study thethermal stability of R1234yf. For the first set of tests, the fluid washeated for (16 to 23) h atT = 250 �C or at T = 150 �C in stainlesssteel ampule reactors with a volume of approximately 0.3 mLaccording to the protocols ofWidegren and Bruno.11 For the firsttwo tests at T = 250 �C and T = 150 �C, the reactor was notevacuated prior to filling. Polymerization was observed in bothcases. For the third test atT = 150 �C, the reactor was thoroughlyevacuated prior to filling, and no polymerization was detected.Thus, air promotes the polymerization of R1234yf. For thesecond set of tests, a pressure vessel of type 316 stainless steelwith a volume of about 16 mL was used; here shavings ofcopper�beryllium, titanium, tantalum, stainless steel, and gold-plated copper were placed in the test reactor to include anypossible interactions between the fluid and the materials of thedensimeter. Before filling the reactor, it was evacuated to apressure of about 1 3 10
�4 Pa. The reactor was weighed andcompletely filled with the R1234yf. To obtain the desiredmaximum pressure at the test temperature, the mass of thesample was appropriately vented. After weighing the test reactoragain, it was put into an oven for 72 h (first test atT = 150 �C andp = 20MPa, second test at T = 120 �C and p = 12MPa, and thirdtest at T = 120 �C and p = 6 MPa). Polymerization was observedfor the first two tests but not in the third. Thus high pressure aswell as high temperature promotes polymerization of R1234yf.These tests served to determine the maximum temperature andpressure of the subsequent measurements.
3. RESULTS
3.1. Uncertainty of the Measurements. The experimentaluncertainties of the individual properties p, F, and T have beendiscussed in detail in previous papers.6,12 The expanded uncer-tainty (k = 2, or approximately 95 % confidence level) in densityis given by
uðFÞkg 3m�3
¼ ð56Þ2 þ 0:75TK� 293
� �� �2(
þ 1:25p
MPa
� �2�0:510�6Fkg 3m�3
þ 0:0014 ð3Þ
This uncertainty in density accounts for the uncertainties in theweighings, the sinker volumes, and the force transmission error inthe magnetic suspension coupling of the densimeter; it alsoincludes corrections for vertical density gradients in the measur-ing cell. A detailed description of the force transmission erroranalysis of theNIST two-sinker densimeter is given byMcLindenet al.8 The temperature reported in the p�F�T data wasdetermined with the measuring-cell standard platinum resistancethermometer (SPRT), which was calibrated on ITS-90 by usingfixed-point cells in the temperature range from (83 to 505) K(argon triple point, mercury triple point, water triple point,indium freezing point, and tin freezing point). The expandeduncertainty (k = 2) in the temperature is 4 mK. Pressures aremeasured with three different transducers, which were calibratedby use of a piston gauge. The expanded uncertainty (k = 2) of thepressure measurement is (40 3 10
�63 p þ 0.06 kPa) for the low-
range transducer, (40 3 10�6
3 p þ 0.30 kPa) for the midrangetransducer, and (52 3 10
�63 p þ 2.0 kPa) for the high-range
transducer.
The variance in the multiple measurements of temperatureand pressure carried out during the course of a single densitydetermination was added (in quadrature) to the above instru-ment uncertainties. The variance in the multiple balance readingsconstituting a density determination was converted to theirequivalent effect on density and added to the density uncertaintygiven by eq 3. In most cases these variances (or “type A”uncertainties) are small compared to the systematic (or “typeB”) uncertainties arising from instrument calibrations and othereffects. These are detailed for each measured point in theSupporting Information. An additional pressure uncertainty,amounting to (0.1 to 0.35) kPa, was added to the vapor pressuredata to reflect an increased uncertainty in the hydrostatic headcorrection.
Table 1. Experimental Vapor Pressure psat for R1234yf fromT = (250 to 366) K and Relative Deviations of the Experi-mental Data fromValues Calculated with theNew Equation ofState Developed in this Work Δp
a
T/K psat/MPa Δp
Filling 1
269.998 0.28341 �0.0021
279.999 0.39591 0.0004
290.000 0.53938 0.0085
250.002 0.13337 0.4770
260.003 0.19744 0.1271
270.005 0.28348 �0.0139
290.002 0.53942 0.0088
299.999 0.71868 �0.0029
309.999 0.93928 �0.0114
311.999 0.98909 0.0107
314.000 1.04087 0.0328
315.999 1.09440 0.0343
320.000 1.20763 0.0361
330.001 1.52905 0.0350
340.002 1.91025 �0.0110
350.003 2.36144 �0.0032
355.004 2.61653 0.0055
360.005 2.89380 0.0137
362.005 3.01152 0.0162
364.005 3.13357 0.0165
366.005 3.26023 0.0101
309.999 0.93930 �0.0073
320.000 1.20765 0.0360
Filling 3
319.994 1.20704 0.0017
Filling 4
319.994 1.20638 �0.0535
Filling 5
250.000 0.13303 0.2310
270.000 0.28303 �0.1405
289.995 0.53895 �0.0581
309.989 0.93857 �0.0612
319.990 1.20681 �0.0095aOnly one point per temperatureT is given; see Supporting Informationfor all data.
3257 dx.doi.org/10.1021/je200369m |J. Chem. Eng. Data 2011, 56, 3254–3264
Journal of Chemical & Engineering Data ARTICLE
The above uncertainties for temperature, pressure, and densityare for these quantities in isolation. For the purpose of fitting anequation of state, it is customary to assume that the temperatureand pressure (or sometimes temperature and density) are knownexactly, and lump all uncertainties into a single value for thedensity (or pressure). This overall combined, or state-point,uncertainty is given by
uCðFÞ ¼ ½uðFÞ�2 þ DFDp
!T
uðpÞ24
352
þ DFDT
� �p
uðTÞ" #28><
>:9>=>;
0:5
ð4Þwhere uC designates a combined uncertainty, u stands for theindividual uncertainties, and the derivatives are calculated with anequation of state. For near-critical states where deviations inpressure are an appropriate measure of quality (as discussed byMcLinden12), the state-point uncertainty is
uCðpÞ ¼ ½uðpÞ�2 þ DpDF
� �T
uðFÞ" #2
þ DpDT
� �FuðTÞ
" #28<:
9=;
0:5
ð5ÞFor vapor pressure, the combined uncertainty can be calculatedwith
uCðpsatÞ ¼ ½uðpÞ�2 þ DpsatDT
� �uðTÞ
� �2( )0:5
ð6Þ
These state-point uncertainties are tabulated for each measuredpoint in the Supporting Information.3.2. Vapor Pressures. The densimeter was used to measure
the vapor pressure of R1234yf at 28 temperatures from T = (250to 366) K. Four to eight replicate determinations were carriedout at each temperature to yield 216 data points. The experi-mental data are given in Table 1, and deviations to the equationof state developed within this work are given by
Δp ¼ 100pexp � pEOS
pEOS
!ð7Þ
Only average values of the replicates are reported in the table at
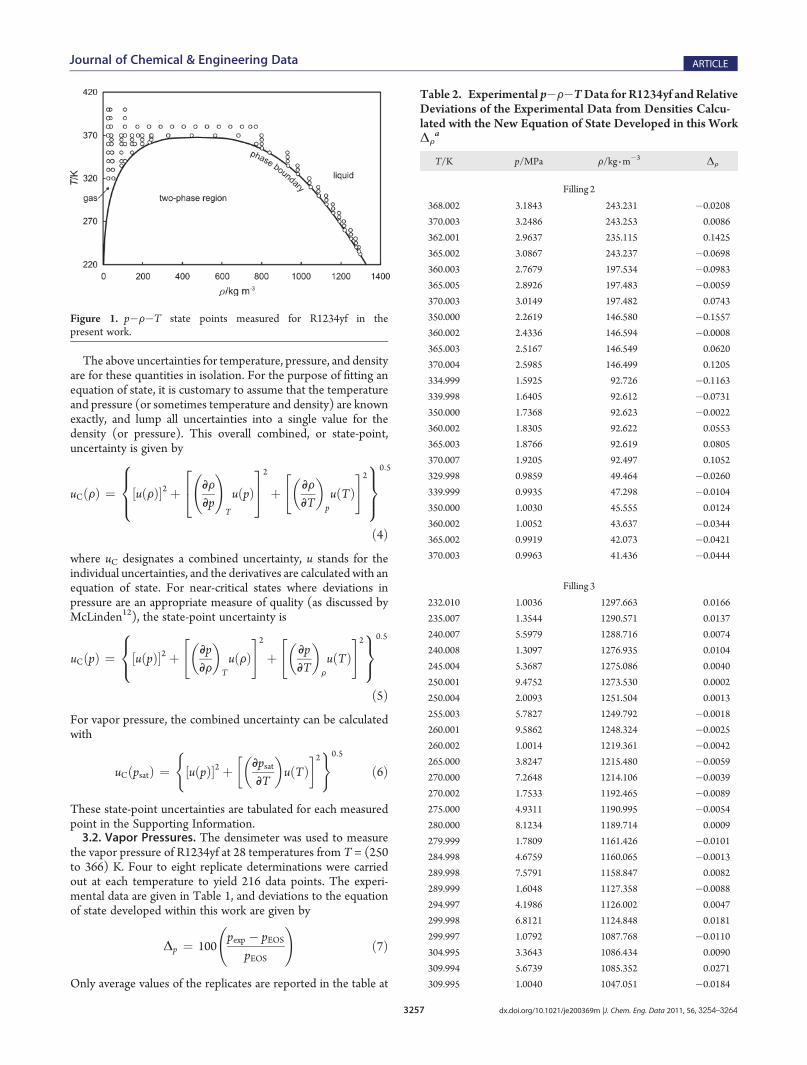
Figure 1. p�F�T state points measured for R1234yf in thepresent work.
Table 2. Experimental p�F�TData for R1234yf andRelativeDeviations of the Experimental Data from Densities Calcu-lated with the New Equation of State Developed in this WorkΔF
a
T/K p/MPa F/kg 3m�3 ΔF
Filling 2
368.002 3.1843 243.231 �0.0208
370.003 3.2486 243.253 0.0086
362.001 2.9637 235.115 0.1425
365.002 3.0867 243.237 �0.0698
360.003 2.7679 197.534 �0.0983
365.005 2.8926 197.483 �0.0059
370.003 3.0149 197.482 0.0743
350.000 2.2619 146.580 �0.1557
360.002 2.4336 146.594 �0.0008
365.003 2.5167 146.549 0.0620
370.004 2.5985 146.499 0.1205
334.999 1.5925 92.726 �0.1163
339.998 1.6405 92.612 �0.0731
350.000 1.7368 92.623 �0.0022
360.002 1.8305 92.622 0.0553
365.003 1.8766 92.619 0.0805
370.007 1.9205 92.497 0.1052
329.998 0.9859 49.464 �0.0260
339.999 0.9935 47.298 �0.0104
350.000 1.0030 45.555 0.0124
360.002 1.0052 43.637 �0.0344
365.002 0.9919 42.073 �0.0421
370.003 0.9963 41.436 �0.0444
Filling 3
232.010 1.0036 1297.663 0.0166
235.007 1.3544 1290.571 0.0137
240.007 5.5979 1288.716 0.0074
240.008 1.3097 1276.935 0.0104
245.004 5.3687 1275.086 0.0040
250.001 9.4752 1273.530 0.0002
250.004 2.0093 1251.504 0.0013
255.003 5.7827 1249.792 �0.0018
260.001 9.5862 1248.324 �0.0025
260.002 1.0014 1219.361 �0.0042
265.000 3.8247 1215.480 �0.0059
270.000 7.2648 1214.106 �0.0039
270.002 1.7533 1192.465 �0.0089
275.000 4.9311 1190.995 �0.0054
280.000 8.1234 1189.714 0.0009
279.999 1.7809 1161.426 �0.0101
284.998 4.6759 1160.065 �0.0013
289.998 7.5791 1158.847 0.0082
289.999 1.6048 1127.358 �0.0088
294.997 4.1986 1126.002 0.0047
299.998 6.8121 1124.848 0.0181
299.997 1.0792 1087.768 �0.0110
304.995 3.3643 1086.434 0.0090
309.994 5.6739 1085.352 0.0271
309.995 1.0040 1047.051 �0.0184
3258 dx.doi.org/10.1021/je200369m |J. Chem. Eng. Data 2011, 56, 3254–3264
Journal of Chemical & Engineering Data ARTICLE
each temperature; all of the data points are included in theSupporting Information. The data are compared to other litera-ture data and the new EOS in section 4.2.
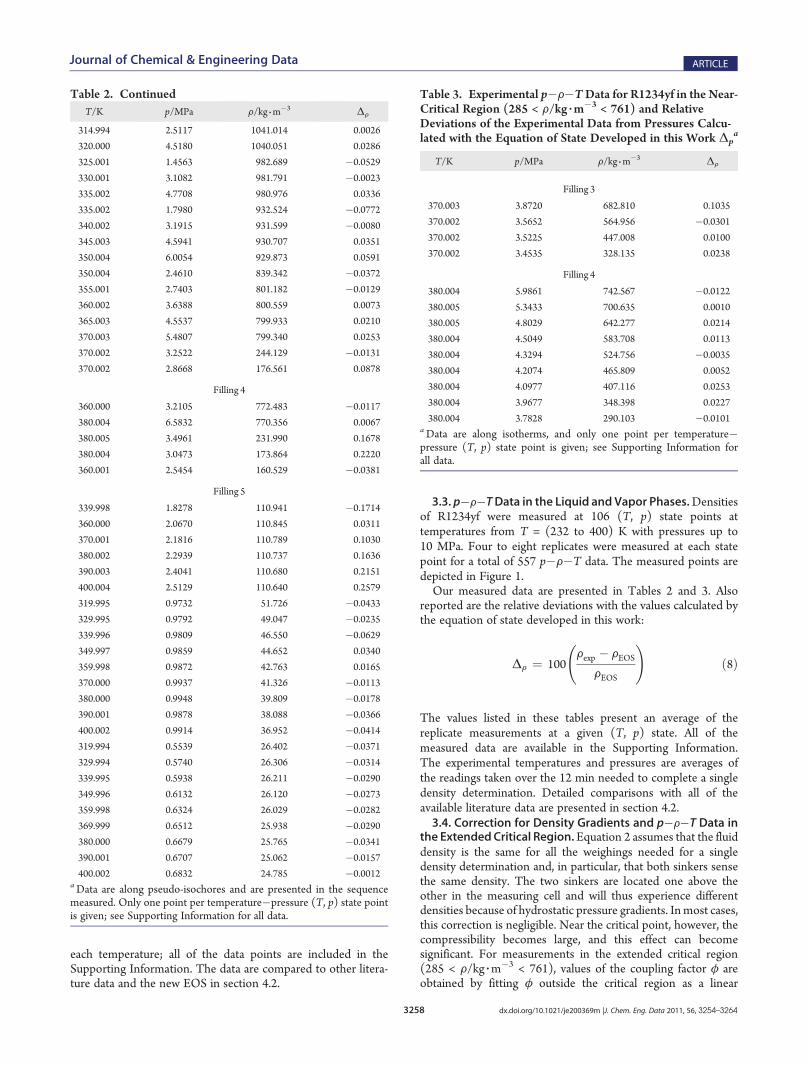
3.3. p�F�TData in the Liquid and Vapor Phases.Densitiesof R1234yf were measured at 106 (T, p) state points attemperatures from T = (232 to 400) K with pressures up to10 MPa. Four to eight replicates were measured at each statepoint for a total of 557 p�F�T data. The measured points aredepicted in Figure 1.Our measured data are presented in Tables 2 and 3. Also
reported are the relative deviations with the values calculated bythe equation of state developed in this work:
ΔF ¼ 100Fexp � FEOS
FEOS
!ð8Þ
The values listed in these tables present an average of thereplicate measurements at a given (T, p) state. All of themeasured data are available in the Supporting Information.The experimental temperatures and pressures are averages ofthe readings taken over the 12 min needed to complete a singledensity determination. Detailed comparisons with all of theavailable literature data are presented in section 4.2.3.4. Correction for Density Gradients and p�F�T Data in
the ExtendedCritical Region.Equation 2 assumes that the fluiddensity is the same for all the weighings needed for a singledensity determination and, in particular, that both sinkers sensethe same density. The two sinkers are located one above theother in the measuring cell and will thus experience differentdensities because of hydrostatic pressure gradients. Inmost cases,this correction is negligible. Near the critical point, however, thecompressibility becomes large, and this effect can becomesignificant. For measurements in the extended critical region(285 < F/kg 3m
�3 < 761), values of the coupling factor φ areobtained by fitting φ outside the critical region as a linear
Table 2. ContinuedT/K p/MPa F/kg 3m
�3 ΔF
314.994 2.5117 1041.014 0.0026
320.000 4.5180 1040.051 0.0286
325.001 1.4563 982.689 �0.0529
330.001 3.1082 981.791 �0.0023
335.002 4.7708 980.976 0.0336
335.002 1.7980 932.524 �0.0772
340.002 3.1915 931.599 �0.0080
345.003 4.5941 930.707 0.0351
350.004 6.0054 929.873 0.0591
350.004 2.4610 839.342 �0.0372
355.001 2.7403 801.182 �0.0129
360.002 3.6388 800.559 0.0073
365.003 4.5537 799.933 0.0210
370.003 5.4807 799.340 0.0253
370.002 3.2522 244.129 �0.0131
370.002 2.8668 176.561 0.0878
Filling 4
360.000 3.2105 772.483 �0.0117
380.004 6.5832 770.356 0.0067
380.005 3.4961 231.990 0.1678
380.004 3.0473 173.864 0.2220
360.001 2.5454 160.529 �0.0381
Filling 5
339.998 1.8278 110.941 �0.1714
360.000 2.0670 110.845 0.0311
370.001 2.1816 110.789 0.1030
380.002 2.2939 110.737 0.1636
390.003 2.4041 110.680 0.2151
400.004 2.5129 110.640 0.2579
319.995 0.9732 51.726 �0.0433
329.995 0.9792 49.047 �0.0235
339.996 0.9809 46.550 �0.0629
349.997 0.9859 44.652 0.0340
359.998 0.9872 42.763 0.0165
370.000 0.9937 41.326 �0.0113
380.000 0.9948 39.809 �0.0178
390.001 0.9878 38.088 �0.0366
400.002 0.9914 36.952 �0.0414
319.994 0.5539 26.402 �0.0371
329.994 0.5740 26.306 �0.0314
339.995 0.5938 26.211 �0.0290
349.996 0.6132 26.120 �0.0273
359.998 0.6324 26.029 �0.0282
369.999 0.6512 25.938 �0.0290
380.000 0.6679 25.765 �0.0341
390.001 0.6707 25.062 �0.0157
400.002 0.6832 24.785 �0.0012aData are along pseudo-isochores and are presented in the sequencemeasured. Only one point per temperature�pressure (T, p) state pointis given; see Supporting Information for all data.
Table 3. Experimental p�F�TData for R1234yf in the Near-Critical Region (285 < F/kg 3m
�3 < 761) and RelativeDeviations of the Experimental Data from Pressures Calcu-lated with the Equation of State Developed in this Work Δp
a
T/K p/MPa F/kg 3m�3 ΔF
Filling 3
370.003 3.8720 682.810 0.1035
370.002 3.5652 564.956 �0.0301
370.002 3.5225 447.008 0.0100
370.002 3.4535 328.135 0.0238
Filling 4
380.004 5.9861 742.567 �0.0122
380.005 5.3433 700.635 0.0010
380.005 4.8029 642.277 0.0214
380.004 4.5049 583.708 0.0113
380.004 4.3294 524.756 �0.0035
380.004 4.2074 465.809 0.0052
380.004 4.0977 407.116 0.0253
380.004 3.9677 348.398 0.0227
380.004 3.7828 290.103 �0.0101aData are along isotherms, and only one point per temperature�pressure (T, p) state point is given; see Supporting Information forall data.
3259 dx.doi.org/10.1021/je200369m |J. Chem. Eng. Data 2011, 56, 3254–3264
Journal of Chemical & Engineering Data ARTICLE
function of density. This point is discussed in detail byMcLinden.12
4. EQUATION OF STATE
A 15-term equation of state for R1234yf was fitted with theHelmholtz energy as the fundamental property with independentvariables of density and temperature. The fit started with the“short form” equation of state of Span and Wagner;13 the finalEOS is a related, but more flexible form. For its development, thepresent measured vapor pressures, densities, and critical-regiondata plus additional p�F�T data,2,14,15 vapor pressures,2,16
speed of sound data,17,18 and isobaric heat capacities15,18�20
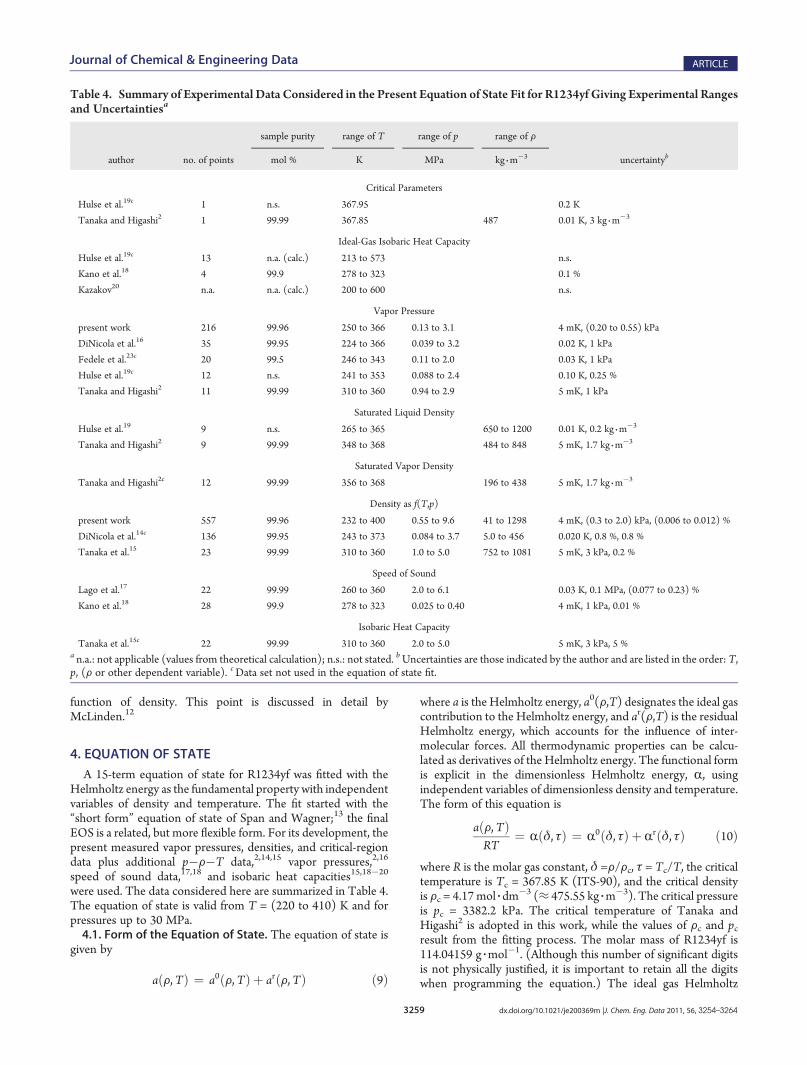
were used. The data considered here are summarized in Table 4.The equation of state is valid from T = (220 to 410) K and forpressures up to 30 MPa.4.1. Form of the Equation of State. The equation of state is
given by
aðF,TÞ ¼ a0ðF,TÞ þ arðF,TÞ ð9Þ
where a is the Helmholtz energy, a0(F,T) designates the ideal gascontribution to the Helmholtz energy, and ar(F,T) is the residualHelmholtz energy, which accounts for the influence of inter-molecular forces. All thermodynamic properties can be calcu-lated as derivatives of the Helmholtz energy. The functional formis explicit in the dimensionless Helmholtz energy, R, usingindependent variables of dimensionless density and temperature.The form of this equation is
aðF,TÞRT
¼ Rðδ, τÞ ¼ R0ðδ, τÞ þ Rrðδ, τÞ ð10Þ
where R is the molar gas constant, δ =F/Fc, τ = Tc/T, the criticaltemperature is Tc = 367.85 K (ITS-90), and the critical densityis Fc = 4.17 mol 3 dm
�3 (≈ 475.55 kg 3m�3). The critical pressure
is pc = 3382.2 kPa. The critical temperature of Tanaka andHigashi2 is adopted in this work, while the values of Fc and pcresult from the fitting process. The molar mass of R1234yf is114.04159 g 3mol�1. (Although this number of significant digitsis not physically justified, it is important to retain all the digitswhen programming the equation.) The ideal gas Helmholtz
Table 4. Summary of Experimental Data Considered in the Present Equation of State Fit for R1234yf Giving Experimental Rangesand Uncertaintiesa
sample purity range of T range of p range of F
author no. of points mol % K MPa kg 3m�3 uncertaintyb
Critical Parameters
Hulse et al.19c 1 n.s. 367.95 0.2 K
Tanaka and Higashi2 1 99.99 367.85 487 0.01 K, 3 kg 3m�3
Ideal-Gas Isobaric Heat Capacity
Hulse et al.19c 13 n.a. (calc.) 213 to 573 n.s.
Kano et al.18 4 99.9 278 to 323 0.1 %
Kazakov20 n.a. n.a. (calc.) 200 to 600 n.s.
Vapor Pressure
present work 216 99.96 250 to 366 0.13 to 3.1 4 mK, (0.20 to 0.55) kPa
DiNicola et al.16 35 99.95 224 to 366 0.039 to 3.2 0.02 K, 1 kPa
Fedele et al.23c 20 99.5 246 to 343 0.11 to 2.0 0.03 K, 1 kPa
Hulse et al.19c 12 n.s. 241 to 353 0.088 to 2.4 0.10 K, 0.25 %
Tanaka and Higashi2 11 99.99 310 to 360 0.94 to 2.9 5 mK, 1 kPa
Saturated Liquid Density
Hulse et al.19 9 n.s. 265 to 365 650 to 1200 0.01 K, 0.2 kg 3m�3
Tanaka and Higashi2 9 99.99 348 to 368 484 to 848 5 mK, 1.7 kg 3m�3
Saturated Vapor Density
Tanaka and Higashi2c 12 99.99 356 to 368 196 to 438 5 mK, 1.7 kg 3m�3
Density as f(T,p)
present work 557 99.96 232 to 400 0.55 to 9.6 41 to 1298 4 mK, (0.3 to 2.0) kPa, (0.006 to 0.012) %
DiNicola et al.14c 136 99.95 243 to 373 0.084 to 3.7 5.0 to 456 0.020 K, 0.8 %, 0.8 %
Tanaka et al.15 23 99.99 310 to 360 1.0 to 5.0 752 to 1081 5 mK, 3 kPa, 0.2 %
Speed of Sound
Lago et al.17 22 99.99 260 to 360 2.0 to 6.1 0.03 K, 0.1 MPa, (0.077 to 0.23) %
Kano et al.18 28 99.9 278 to 323 0.025 to 0.40 4 mK, 1 kPa, 0.01 %
Isobaric Heat Capacity
Tanaka et al.15c 22 99.99 310 to 360 2.0 to 5.0 5 mK, 3 kPa, 5 %a n.a.: not applicable (values from theoretical calculation); n.s.: not stated. bUncertainties are those indicated by the author and are listed in the order: T,p, (F or other dependent variable). cData set not used in the equation of state fit.
3260 dx.doi.org/10.1021/je200369m |J. Chem. Eng. Data 2011, 56, 3254–3264
Journal of Chemical & Engineering Data ARTICLE
energy can be written in a dimensionless form as
R0 ¼ h00τRTc
� s00R� 1þ ln
δτ0δ0τ
� τ
R
Z τ
τ0
c0pτ2dτþ 1
R
Z τ
τ0
c0pτdτ
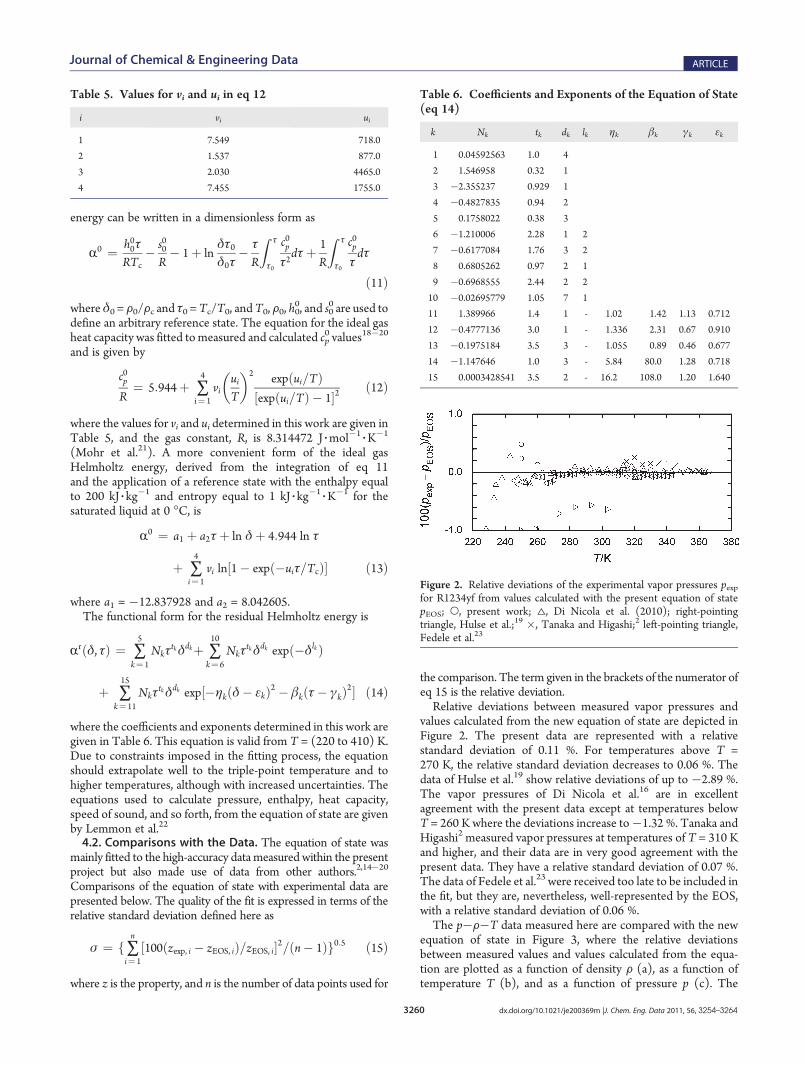
ð11Þwhere δ0 = F0/Fc and τ0 =Tc/T0, andT0, F0, h00, and s00 are used todefine an arbitrary reference state. The equation for the ideal gasheat capacity was fitted tomeasured and calculated cp
0 values18�20
and is given by
c0pR
¼ 5:944þ ∑4
i¼ 1vi
uiT
� �2 expðui=TÞ½expðui=TÞ � 1�2 ð12Þ
where the values for vi and ui determined in this work are given inTable 5, and the gas constant, R, is 8.314472 J 3mol�1
3K�1
(Mohr et al.21). A more convenient form of the ideal gasHelmholtz energy, derived from the integration of eq 11and the application of a reference state with the enthalpy equalto 200 kJ 3 kg
�1 and entropy equal to 1 kJ 3 kg�1
3K�1 for the
saturated liquid at 0 �C, is
R0 ¼ a1 þ a2τþ ln δþ 4:944 ln τ
þ ∑4
i¼ 1vi ln½1� expð�uiτ=TcÞ� ð13Þ
where a1 = �12.837928 and a2 = 8.042605.The functional form for the residual Helmholtz energy is
Rrðδ, τÞ ¼ ∑5
k¼ 1Nkτ
tkδdkþ ∑10
k¼ 6Nkτ
tkδdk expð�δlkÞ
þ ∑15
k¼ 11Nkτ
tkδdk exp½�ηkðδ� εkÞ2 � βkðτ� γkÞ2� ð14Þ
where the coefficients and exponents determined in this work aregiven in Table 6. This equation is valid from T = (220 to 410) K.Due to constraints imposed in the fitting process, the equationshould extrapolate well to the triple-point temperature and tohigher temperatures, although with increased uncertainties. Theequations used to calculate pressure, enthalpy, heat capacity,speed of sound, and so forth, from the equation of state are givenby Lemmon et al.22
4.2. Comparisons with the Data. The equation of state wasmainly fitted to the high-accuracy datameasured within the presentproject but also made use of data from other authors.2,14�20
Comparisons of the equation of state with experimental data arepresented below. The quality of the fit is expressed in terms of therelative standard deviation defined here as
σ ¼ f∑n
i¼ 1½100ðzexp, i � zEOS, iÞ=zEOS, i�2=ðn� 1Þg0:5 ð15Þ
where z is the property, and n is the number of data points used for
the comparison. The term given in the brackets of the numerator ofeq 15 is the relative deviation.Relative deviations between measured vapor pressures and
values calculated from the new equation of state are depicted inFigure 2. The present data are represented with a relativestandard deviation of 0.11 %. For temperatures above T =270 K, the relative standard deviation decreases to 0.06 %. Thedata of Hulse et al.19 show relative deviations of up to �2.89 %.The vapor pressures of Di Nicola et al.16 are in excellentagreement with the present data except at temperatures belowT = 260 K where the deviations increase to�1.32 %. Tanaka andHigashi2 measured vapor pressures at temperatures of T = 310 Kand higher, and their data are in very good agreement with thepresent data. They have a relative standard deviation of 0.07 %.The data of Fedele et al.23 were received too late to be included inthe fit, but they are, nevertheless, well-represented by the EOS,with a relative standard deviation of 0.06 %.The p�F�T data measured here are compared with the new
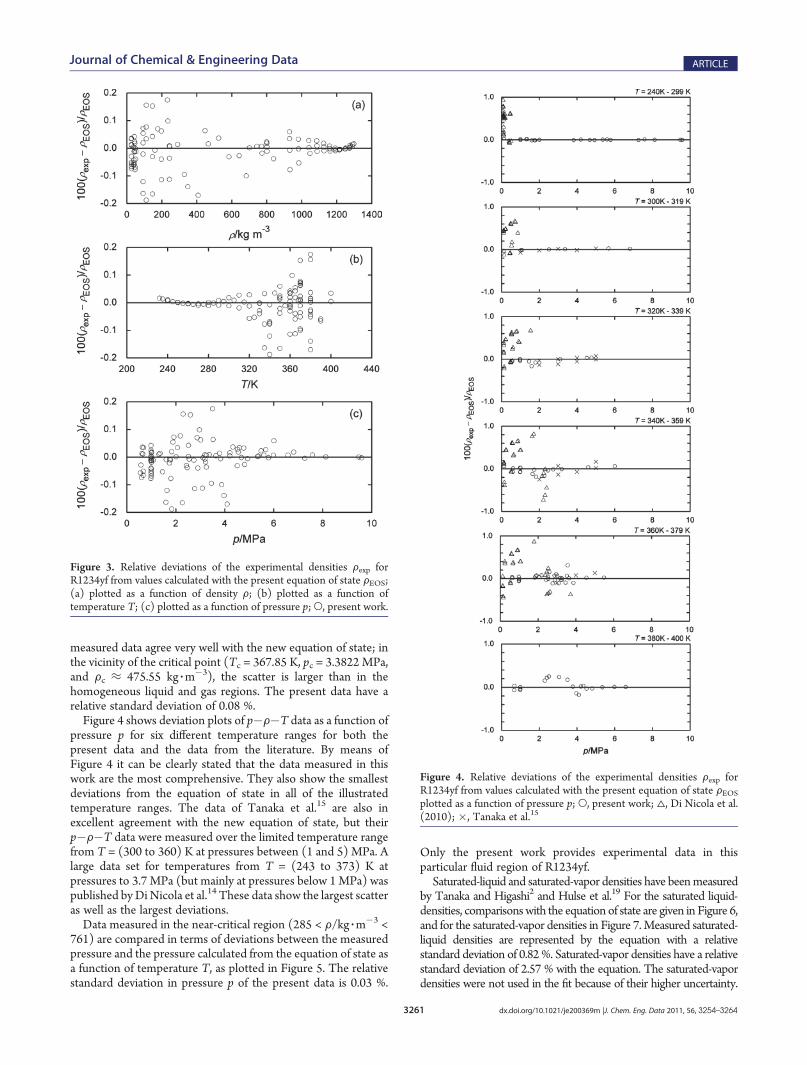
equation of state in Figure 3, where the relative deviationsbetween measured values and values calculated from the equa-tion are plotted as a function of density F (a), as a function oftemperature T (b), and as a function of pressure p (c). The
Table 5. Values for vi and ui in eq 12
i vi ui
1 7.549 718.0
2 1.537 877.0
3 2.030 4465.0
4 7.455 1755.0
Figure 2. Relative deviations of the experimental vapor pressures pexpfor R1234yf from values calculated with the present equation of statepEOS; O, present work; 4, Di Nicola et al. (2010); right-pointingtriangle, Hulse et al.;19 �, Tanaka and Higashi;2 left-pointing triangle,Fedele et al.23
Table 6. Coefficients and Exponents of the Equation of State(eq 14)
k Nk tk dk lk ηk βk γk εk
1 0.04592563 1.0 4
2 1.546958 0.32 1
3 �2.355237 0.929 1
4 �0.4827835 0.94 2
5 0.1758022 0.38 3
6 �1.210006 2.28 1 2
7 �0.6177084 1.76 3 2
8 0.6805262 0.97 2 1
9 �0.6968555 2.44 2 2
10 �0.02695779 1.05 7 1
11 1.389966 1.4 1 - 1.02 1.42 1.13 0.712
12 �0.4777136 3.0 1 - 1.336 2.31 0.67 0.910
13 �0.1975184 3.5 3 - 1.055 0.89 0.46 0.677
14 �1.147646 1.0 3 - 5.84 80.0 1.28 0.718
15 0.0003428541 3.5 2 - 16.2 108.0 1.20 1.640
3261 dx.doi.org/10.1021/je200369m |J. Chem. Eng. Data 2011, 56, 3254–3264
Journal of Chemical & Engineering Data ARTICLE
measured data agree very well with the new equation of state; inthe vicinity of the critical point (Tc = 367.85 K, pc = 3.3822 MPa,and Fc ≈ 475.55 kg 3m
�3), the scatter is larger than in thehomogeneous liquid and gas regions. The present data have arelative standard deviation of 0.08 %.Figure 4 shows deviation plots of p�F�T data as a function of
pressure p for six different temperature ranges for both thepresent data and the data from the literature. By means ofFigure 4 it can be clearly stated that the data measured in thiswork are the most comprehensive. They also show the smallestdeviations from the equation of state in all of the illustratedtemperature ranges. The data of Tanaka et al.15 are also inexcellent agreement with the new equation of state, but theirp�F�T data were measured over the limited temperature rangefrom T = (300 to 360) K at pressures between (1 and 5) MPa. Alarge data set for temperatures from T = (243 to 373) K atpressures to 3.7 MPa (but mainly at pressures below 1MPa) waspublished byDi Nicola et al.14 These data show the largest scatteras well as the largest deviations.Data measured in the near-critical region (285 < F/kg 3m
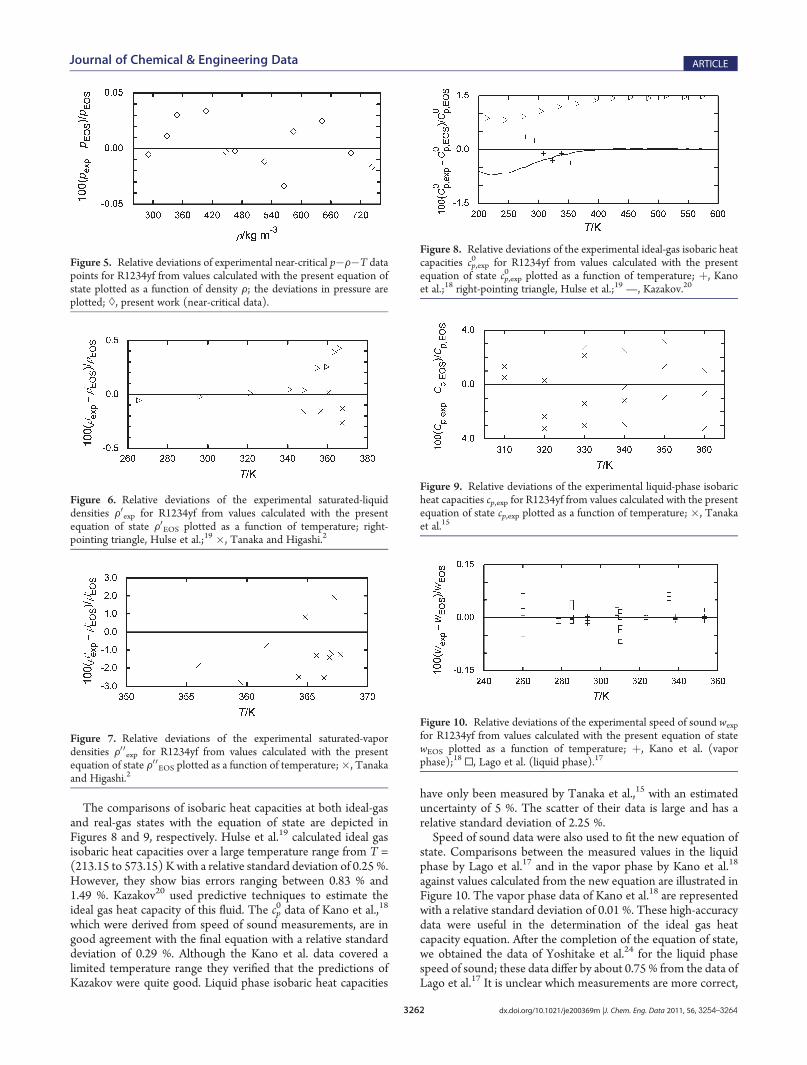
�3 <761) are compared in terms of deviations between the measuredpressure and the pressure calculated from the equation of state asa function of temperature T, as plotted in Figure 5. The relativestandard deviation in pressure p of the present data is 0.03 %.
Only the present work provides experimental data in thisparticular fluid region of R1234yf.Saturated-liquid and saturated-vapor densities have beenmeasured
by Tanaka and Higashi2 and Hulse et al.19 For the saturated liquid-densities, comparisonswith the equation of state are given in Figure 6,and for the saturated-vapor densities in Figure 7.Measured saturated-liquid densities are represented by the equation with a relativestandard deviation of 0.82 %. Saturated-vapor densities have a relativestandard deviation of 2.57 % with the equation. The saturated-vapordensities were not used in the fit because of their higher uncertainty.
Figure 3. Relative deviations of the experimental densities Fexp forR1234yf from values calculated with the present equation of state FEOS;(a) plotted as a function of density F; (b) plotted as a function oftemperature T; (c) plotted as a function of pressure p; O, present work.
Figure 4. Relative deviations of the experimental densities Fexp forR1234yf from values calculated with the present equation of state FEOSplotted as a function of pressure p; O, present work; 4, Di Nicola et al.(2010); �, Tanaka et al.15
3262 dx.doi.org/10.1021/je200369m |J. Chem. Eng. Data 2011, 56, 3254–3264
Journal of Chemical & Engineering Data ARTICLE
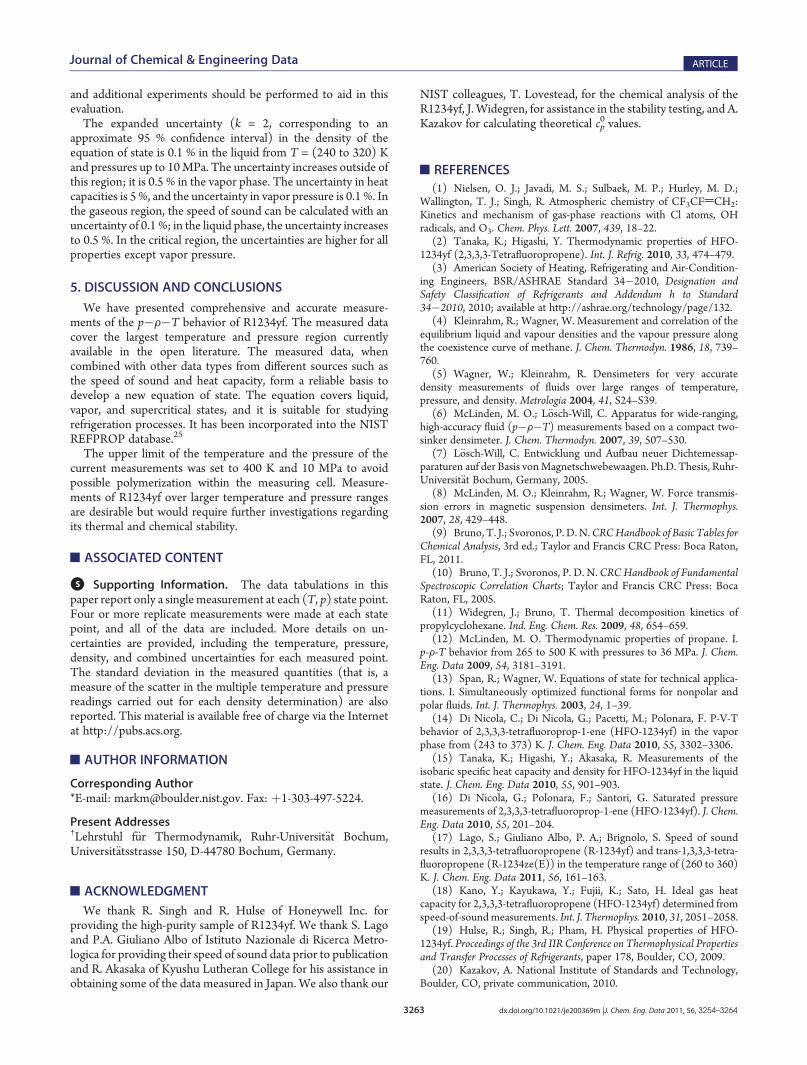
The comparisons of isobaric heat capacities at both ideal-gasand real-gas states with the equation of state are depicted inFigures 8 and 9, respectively. Hulse et al.19 calculated ideal gasisobaric heat capacities over a large temperature range from T =(213.15 to 573.15) K with a relative standard deviation of 0.25 %.However, they show bias errors ranging between 0.83 % and1.49 %. Kazakov20 used predictive techniques to estimate theideal gas heat capacity of this fluid. The cp
0 data of Kano et al.,18
which were derived from speed of sound measurements, are ingood agreement with the final equation with a relative standarddeviation of 0.29 %. Although the Kano et al. data covered alimited temperature range they verified that the predictions ofKazakov were quite good. Liquid phase isobaric heat capacities
have only been measured by Tanaka et al.,15 with an estimateduncertainty of 5 %. The scatter of their data is large and has arelative standard deviation of 2.25 %.Speed of sound data were also used to fit the new equation of
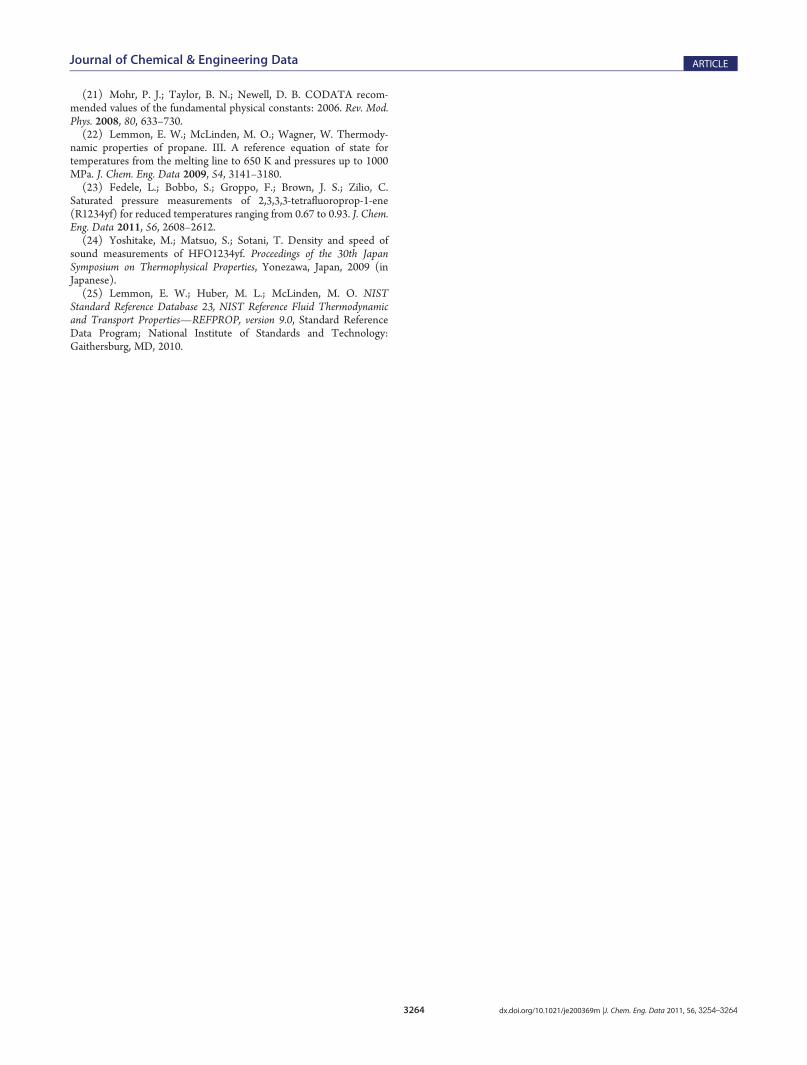
state. Comparisons between the measured values in the liquidphase by Lago et al.17 and in the vapor phase by Kano et al.18
against values calculated from the new equation are illustrated inFigure 10. The vapor phase data of Kano et al.18 are representedwith a relative standard deviation of 0.01 %. These high-accuracydata were useful in the determination of the ideal gas heatcapacity equation. After the completion of the equation of state,we obtained the data of Yoshitake et al.24 for the liquid phasespeed of sound; these data differ by about 0.75 % from the data ofLago et al.17 It is unclear which measurements are more correct,
Figure 5. Relative deviations of experimental near-critical p�F�T datapoints for R1234yf from values calculated with the present equation ofstate plotted as a function of density F; the deviations in pressure areplotted; ), present work (near-critical data).
Figure 6. Relative deviations of the experimental saturated-liquiddensities F0exp for R1234yf from values calculated with the presentequation of state F0EOS plotted as a function of temperature; right-pointing triangle, Hulse et al.;19 �, Tanaka and Higashi.2
Figure 8. Relative deviations of the experimental ideal-gas isobaric heatcapacities cp,exp
0 for R1234yf from values calculated with the presentequation of state cp,exp
0 plotted as a function of temperature; þ, Kanoet al.;18 right-pointing triangle, Hulse et al.;19 —, Kazakov.20
Figure 9. Relative deviations of the experimental liquid-phase isobaricheat capacities cp,exp for R1234yf from values calculated with the presentequation of state cp,exp plotted as a function of temperature; �, Tanakaet al.15
Figure 10. Relative deviations of the experimental speed of sound wexp
for R1234yf from values calculated with the present equation of statewEOS plotted as a function of temperature; þ, Kano et al. (vaporphase);18 0, Lago et al. (liquid phase).17
Figure 7. Relative deviations of the experimental saturated-vapordensities F0 0exp for R1234yf from values calculated with the presentequation of state F00EOS plotted as a function of temperature;�, Tanakaand Higashi.2
3263 dx.doi.org/10.1021/je200369m |J. Chem. Eng. Data 2011, 56, 3254–3264
Journal of Chemical & Engineering Data ARTICLE
and additional experiments should be performed to aid in thisevaluation.The expanded uncertainty (k = 2, corresponding to an
approximate 95 % confidence interval) in the density of theequation of state is 0.1 % in the liquid from T = (240 to 320) Kand pressures up to 10MPa. The uncertainty increases outside ofthis region; it is 0.5 % in the vapor phase. The uncertainty in heatcapacities is 5 %, and the uncertainty in vapor pressure is 0.1 %. Inthe gaseous region, the speed of sound can be calculated with anuncertainty of 0.1 %; in the liquid phase, the uncertainty increasesto 0.5 %. In the critical region, the uncertainties are higher for allproperties except vapor pressure.
5. DISCUSSION AND CONCLUSIONS
We have presented comprehensive and accurate measure-ments of the p�F�T behavior of R1234yf. The measured datacover the largest temperature and pressure region currentlyavailable in the open literature. The measured data, whencombined with other data types from different sources such asthe speed of sound and heat capacity, form a reliable basis todevelop a new equation of state. The equation covers liquid,vapor, and supercritical states, and it is suitable for studyingrefrigeration processes. It has been incorporated into the NISTREFPROP database.25
The upper limit of the temperature and the pressure of thecurrent measurements was set to 400 K and 10 MPa to avoidpossible polymerization within the measuring cell. Measure-ments of R1234yf over larger temperature and pressure rangesare desirable but would require further investigations regardingits thermal and chemical stability.
’ASSOCIATED CONTENT
bS Supporting Information. The data tabulations in thispaper report only a single measurement at each (T, p) state point.Four or more replicate measurements were made at each statepoint, and all of the data are included. More details on un-certainties are provided, including the temperature, pressure,density, and combined uncertainties for each measured point.The standard deviation in the measured quantities (that is, ameasure of the scatter in the multiple temperature and pressurereadings carried out for each density determination) are alsoreported. This material is available free of charge via the Internetat http://pubs.acs.org.
’AUTHOR INFORMATION
Corresponding Author*E-mail: [email protected]. Fax: þ1-303-497-5224.
Present Addresses†Lehrstuhl f€ur Thermodynamik, Ruhr-Universit€at Bochum,Universit€atsstrasse 150, D-44780 Bochum, Germany.
’ACKNOWLEDGMENT
We thank R. Singh and R. Hulse of Honeywell Inc. forproviding the high-purity sample of R1234yf. We thank S. Lagoand P.A. Giuliano Albo of Istituto Nazionale di Ricerca Metro-logica for providing their speed of sound data prior to publicationand R. Akasaka of Kyushu Lutheran College for his assistance inobtaining some of the data measured in Japan. We also thank our
NIST colleagues, T. Lovestead, for the chemical analysis of theR1234yf, J. Widegren, for assistance in the stability testing, and A.Kazakov for calculating theoretical cp
0 values.
’REFERENCES
(1) Nielsen, O. J.; Javadi, M. S.; Sulbaek, M. P.; Hurley, M. D.;Wallington, T. J.; Singh, R. Atmospheric chemistry of CF3CFdCH2:Kinetics and mechanism of gas-phase reactions with Cl atoms, OHradicals, and O3. Chem. Phys. Lett. 2007, 439, 18–22.
(2) Tanaka, K.; Higashi, Y. Thermodynamic properties of HFO-1234yf (2,3,3,3-Tetrafluoropropene). Int. J. Refrig. 2010, 33, 474–479.
(3) American Society of Heating, Refrigerating and Air-Condition-ing Engineers, BSR/ASHRAE Standard 34�2010, Designation andSafety Classification of Refrigerants and Addendum h to Standard34�2010, 2010; available at http://ashrae.org/technology/page/132.
(4) Kleinrahm, R.; Wagner, W. Measurement and correlation of theequilibrium liquid and vapour densities and the vapour pressure alongthe coexistence curve of methane. J. Chem. Thermodyn. 1986, 18, 739–760.
(5) Wagner, W.; Kleinrahm, R. Densimeters for very accuratedensity measurements of fluids over large ranges of temperature,pressure, and density. Metrologia 2004, 41, S24–S39.
(6) McLinden, M. O.; L€osch-Will, C. Apparatus for wide-ranging,high-accuracy fluid (p�F�T) measurements based on a compact two-sinker densimeter. J. Chem. Thermodyn. 2007, 39, 507–530.
(7) L€osch-Will, C. Entwicklung und Aufbau neuer Dichtemessap-paraturen auf der Basis vonMagnetschwebewaagen. Ph.D. Thesis, Ruhr-Universit€at Bochum, Germany, 2005.
(8) McLinden, M. O.; Kleinrahm, R.; Wagner, W. Force transmis-sion errors in magnetic suspension densimeters. Int. J. Thermophys.2007, 28, 429–448.
(9) Bruno, T. J.; Svoronos, P. D. N.CRCHandbook of Basic Tables forChemical Analysis, 3rd ed.; Taylor and Francis CRC Press: Boca Raton,FL, 2011.
(10) Bruno, T. J.; Svoronos, P. D. N. CRCHandbook of FundamentalSpectroscopic Correlation Charts; Taylor and Francis CRC Press: BocaRaton, FL, 2005.
(11) Widegren, J.; Bruno, T. Thermal decomposition kinetics ofpropylcyclohexane. Ind. Eng. Chem. Res. 2009, 48, 654–659.
(12) McLinden, M. O. Thermodynamic properties of propane. I.p-F-T behavior from 265 to 500 K with pressures to 36 MPa. J. Chem.Eng. Data 2009, 54, 3181–3191.
(13) Span, R.; Wagner, W. Equations of state for technical applica-tions. I. Simultaneously optimized functional forms for nonpolar andpolar fluids. Int. J. Thermophys. 2003, 24, 1–39.
(14) Di Nicola, C.; Di Nicola, G.; Pacetti, M.; Polonara, F. P-V-Tbehavior of 2,3,3,3-tetrafluoroprop-1-ene (HFO-1234yf) in the vaporphase from (243 to 373) K. J. Chem. Eng. Data 2010, 55, 3302–3306.
(15) Tanaka, K.; Higashi, Y.; Akasaka, R. Measurements of theisobaric specific heat capacity and density for HFO-1234yf in the liquidstate. J. Chem. Eng. Data 2010, 55, 901–903.
(16) Di Nicola, G.; Polonara, F.; Santori, G. Saturated pressuremeasurements of 2,3,3,3-tetrafluoroprop-1-ene (HFO-1234yf). J. Chem.Eng. Data 2010, 55, 201–204.
(17) Lago, S.; Giuliano Albo, P. A.; Brignolo, S. Speed of soundresults in 2,3,3,3-tetrafluoropropene (R-1234yf) and trans-1,3,3,3-tetra-fluoropropene (R-1234ze(E)) in the temperature range of (260 to 360)K. J. Chem. Eng. Data 2011, 56, 161–163.
(18) Kano, Y.; Kayukawa, Y.; Fujii, K.; Sato, H. Ideal gas heatcapacity for 2,3,3,3-tetrafluoropropene (HFO-1234yf) determined fromspeed-of-soundmeasurements. Int. J. Thermophys. 2010, 31, 2051–2058.
(19) Hulse, R.; Singh, R.; Pham, H. Physical properties of HFO-1234yf. Proceedings of the 3rd IIR Conference on Thermophysical Propertiesand Transfer Processes of Refrigerants, paper 178, Boulder, CO, 2009.
(20) Kazakov, A. National Institute of Standards and Technology,Boulder, CO, private communication, 2010.
3264 dx.doi.org/10.1021/je200369m |J. Chem. Eng. Data 2011, 56, 3254–3264
Journal of Chemical & Engineering Data ARTICLE
(21) Mohr, P. J.; Taylor, B. N.; Newell, D. B. CODATA recom-mended values of the fundamental physical constants: 2006. Rev. Mod.Phys. 2008, 80, 633–730.(22) Lemmon, E. W.; McLinden, M. O.; Wagner, W. Thermody-
namic properties of propane. III. A reference equation of state fortemperatures from the melting line to 650 K and pressures up to 1000MPa. J. Chem. Eng. Data 2009, 54, 3141–3180.(23) Fedele, L.; Bobbo, S.; Groppo, F.; Brown, J. S.; Zilio, C.
Saturated pressure measurements of 2,3,3,3-tetrafluoroprop-1-ene(R1234yf) for reduced temperatures ranging from 0.67 to 0.93. J. Chem.Eng. Data 2011, 56, 2608–2612.(24) Yoshitake, M.; Matsuo, S.; Sotani, T. Density and speed of
sound measurements of HFO1234yf. Proceedings of the 30th JapanSymposium on Thermophysical Properties, Yonezawa, Japan, 2009 (inJapanese).(25) Lemmon, E. W.; Huber, M. L.; McLinden, M. O. NIST
Standard Reference Database 23, NIST Reference Fluid Thermodynamicand Transport Properties—REFPROP, version 9.0, Standard ReferenceData Program; National Institute of Standards and Technology:Gaithersburg, MD, 2010.