thermoelectric powers of liquid alkaline earth metals
TRANSCRIPT
Thermoelectric powers of liquid alkaline earth metals
This article has been downloaded from IOPscience. Please scroll down to see the full text article.
1973 J. Phys. F: Met. Phys. 3 1819
(http://iopscience.iop.org/0305-4608/3/10/017)
Download details:
IP Address: 139.184.30.133
The article was downloaded on 18/05/2012 at 19:21
Please note that terms and conditions apply.
View the table of contents for this issue, or go to the journal homepage for more
Home Search Collections Journals About Contact us My IOPscience
J. Phys. F: Metal Phys., Vol. 3, October 1973. Printed in Great Britain. @ 1973.
Thermoelectric powers of liquid alkaline earth metals
J B Van Zytveldt, J E Enderby1 and E W Collingsg t Physics Department, Calvin College, Grand Rapids, Michigan. USA
9 Metal Science Group, Battelle Memorial Institute, Columbus. Ohio, USA Physics Department, The University, Leicester, U K
Received 1 May 1973
Abstract. The thermoelectric powers, S, of the pure metals Mg, Ca, Sr, and Ba have been measured across their melting points. The values obtained for the liquids at the melting point are: Mg, 1 .6pV°C- ' : Ca, 9 . 9 p V - C - ' : Sr, -0 .4pVcC- ' : Ba, -0.2pV C - ' , S shows little change with melting for Ca. Sr, and Ba; for Mg, S changes sign upon melting. The measured liquid thermopowers. in light of recent resistivity data for these liquids. indicate a progressively increasing energy dependence of the pseudopotentials with increasing atomic number (Mg + Ba). The temperature dependence of the thermopower, dSidT, for these liquids is discussed in terms of a simple theory.
1. Introduction
In the past decade, the study of the electronic properties of liquid metals and alloys has received considerable attention both theoretically and experimentally. Much of the success of these studies has resulted from the application of the Ziman pseudopotential formulation (Ziman 1964) to these systems. Most recently, considerable effort has been expended in especially two areas: attempts to take proper account of the energy dependence of the pseudopotential (cf Enderby et nl 1968, Evans er nl 1969, Bortolani and Calandra 1968, Cubiotti et nl 1971), and attempts to extend the pseudopotential method to the transition metals (cf Harrison 1969, Evans et a1 1971, Rogers and Fong 1972). Studies of the resistivity and thermopower of the liquid alkaline earth metals are expected to make contributions in both of these areas. Measurements of the resistivities of these liquid metals (Van Zytveld et a1 1972, referred to as I ) was interpreted as resulting from resonant scattering from the vacant d band just above the Fermi level. In the present paper, we report measurements of the thermopowers of these liquid metals and, in conjunction with the data of I, estimate the energy dependences of the respective pseudopotentials. We also compare the temperature dependence of the thermopowers of these liquids with a simple theory due to Thornton and Young (1969).
2. Theory
The electrical resistivity, p , and the thermopower, S, of a liquid metal may be expressed (Ziman 1964 and Bradley et al 1962) as
1819
F-FIO
1820 J B Van Zytveld, J E Enderby and E W Collings
and
where
x = 3 - 2q - f r ,
Here
and
Here Ef is the free electron Fermi energy and k the electron wavevector. The remaining symbols are defined in I.
We note that, if the pseudopotential is energy independent, the expression x = 3 - 2q should provide an adequate estimate of the thermopower ; if, however, the energy dependence of U ( K , k) is not negligible, we must include the term i r in the expression for x. Estimates of U ( K ) are taken from the model potentials of Ashcroft (1968) (ASH), and Moriarty (Moriarty 1972) (MOR). a(K) is available from either x ray or neutron scattering data (for Mg, see Woerner et a1 1969, or can be calculated assuming a hard sphere liquid (Ashcroft and Lekner 1966).
If the thermopower parameter, x, is instead cast in terms of phase shifts, (nl , for the Ith partial wave), we obtain an expression (Young et al 1967)
(6) x = 2 - y - z .
If backscattering dominates, y can be approximated by
If the phase shifts, ql , and their energy derivatives are independent of temperature, x should exhibit the negative of the temperature dependence of the structure dominated term, y ; that is, the temperature dependence of z would be expected to be small (Thornton and Young 1969). (For full expressions for y and z , see Young et ~111967.) Since y depends upon the value of 2kf at which the gradient of the structure factor and the structure factor itself are evaluated, we expect the temperature dependence of x for liquid metals to be grouped roughly according to valence. In particular, for divalent metals, we expect dxJdT to be negative.
3. Experimental procedure
Two methods of thermopower measurement were used in the present experiments. In the first case, a vertical column of liquid metal was contained in an alumina tube, thc contacts to the column being made through thin (0.002 in) molybdenum sheets drawn over holes bored into the tube. Chromel-alumel thermocouple leads and copper
Thermoelectric powers of liquid alkaline earth metals 1821
counterelectrodes were pressed to the molybdenum sheets directly over the holes. Because the samples were rather long (about 6 in), one thermocouple junction could be held at a constant temperature while the temperature of the other junction was varied, sustaining a temperature difference as large as 75°C. The relative thermopower was then taken as the slope of the thermoelectric voltage-temperature curve in the usual way. The alumina tubes used in these measurements were of density 3.83 g cmP3. No evidence of any attack was found for liquid Mg held in this material.
It was found, however, that the liquid metals Ca, Sr and Ba would attack these alumina tubes. As a result, these metals were contained in horizontal boats of higher density alumina (density 3.96 g ~ m - ~ ) . No evidence of attack was found for these boats. The temperature measurements were made with chromel-alumel thermocouples sheathed in corrosion resistant, type 347, stainless steel. There is no evidence of any attack on the stainless steel, even after repeated immersions. (By comparison, types 302 and 304 stainless steel show flaking rather quickly.) The chromel leads of the two thermocouples were used as counterelectrodes ; the absolute thermopower of chromel was obtained by careful measurement against copper over the entire temperature range in question. Because of the small size of the sample (2-2; in), small temperature differences, always less than lO"C, were held across the samples and the temperatures of both junctions were varied. By means of a specially designed temperature controller, the temperature gradient across the sample could be held constant to 0.02-0.03"C while the temperatures of both junctions drifted slowly. Small parasitic voltages and thermo- couple errors were eliminated by making two measurements at different temperature differences, AT,, and corresponding thermoelectric voltages. AV? at each average temperature. The average relative thermopower, Srel, free from constant parasitic voltages, was then obtained from the relation
AV1 - AV2 AT, - AT2 Sre , =
As a result, each data point on the graphs of the thermopowers of these metals is a result of two measurements, and is independent of all other measurements. Experimental accuracies provide an estimated standard deviation for random errors for each data point of 0 3 pV "C-'. Measurements of the absolute thermopower of solid molybdenum (compared with the data of Cusack and Kendalll958) and of liquid cadmium (compared with the data of Marwaha and Cusack 1966) indicated that we have achieved the desired accuracy. In addition, measurements on liquid Mg by this method and by the first method described above are compared in figure 1.
In all cases (except for Mg), metals were scraped clean of oxide, cut and mounted inside a specially constructed evacuable glove box kept under an inert atmosphere. An over pressure of this inert gas was maintained during the course of the experiment.
The sample materials used, and their purities, have been previously reported (see I).
4. Results
Figures 1-4 display the measured thermopowers, S , of the pure metals Mg, Ca, Sr, Ba across their respective melting points. In each case, different geometrical figures indicate data points from different runs. Of the four metals, only Mg shows an appreciable discontinuity in S at the melting point. In the case of this metal, S is actually observed to change in sign. This is a property which Mg appears to share only with Hg (see Stanford
1822 J B Van Zytceld, J E Enderby and E W Collings
3 . 0 3
r I
n 0 - r
> t -1.0 w r t
- 3.0 L
i 1
1 i
I
1 1 , 500 550 600 650 700 750
r ( ' c
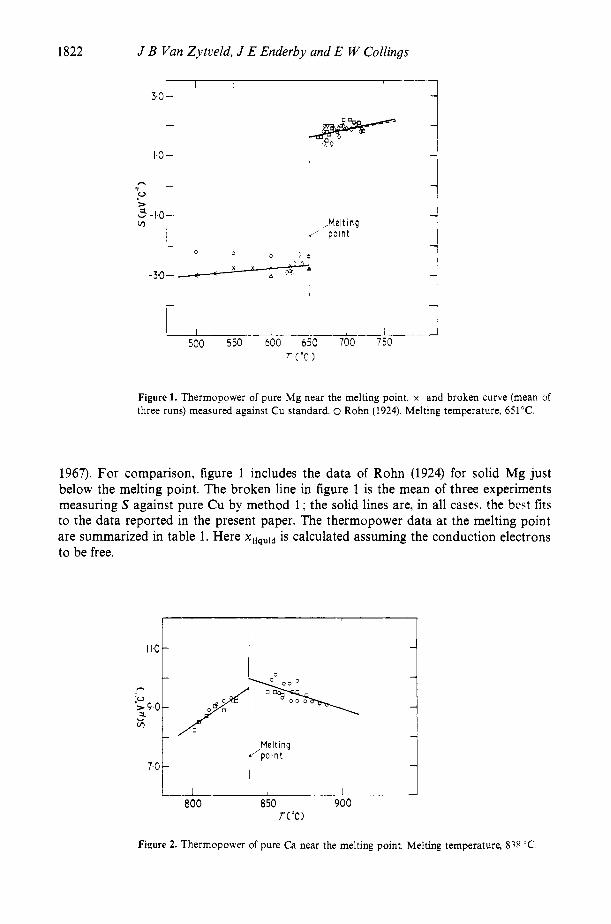
Figure 1. Thermopower of pure Mg near the melting point. x and broken curve (mean of three runs) measured against Cu standard. o Rohn (1924). Melting temperature. 651°C.
1967). For comparison, figure 1 includes the data of Rohn (1924) for solid Mg just below the melting point. The broken line in figure 1 is the mean of three experiments measuring S against pure Cu by method 1 ; the solid lines are, in all cases. the best fits to the data reported in the present paper. The thermopower data at the melting point are summarized in table 1. Here xliquid is calculated assuming the conduction electrons to be free.
r I I 1 I
Melting point
1 1 800 850 900
rrc)
Figure 2. Thermopower of pure Ca near the melting point. Melting temperature, 838 'C.
Thermoelectric powers of liquid alkaline earth metals 1823
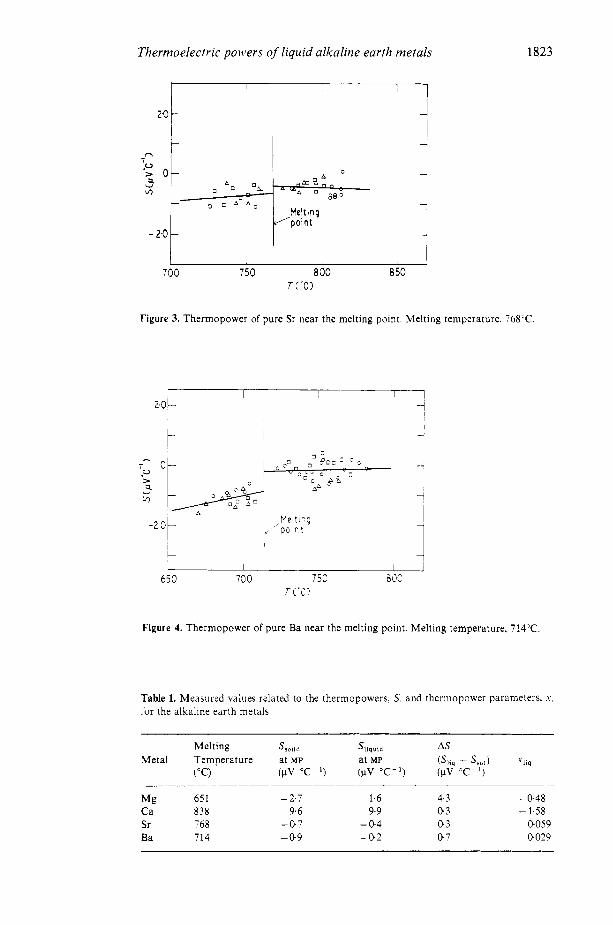
Figure 3. Thermopower of pure Sr near the melting point. Melting temperature, 768-C
I !V 2 0
c -1 650 700 750
T ( * C >
Figure 4. Thermopower of pure Ba near the melting point. Melting temperature, 714°C
Table 1. Measured values related to the thermopowers. S, and thermopower parameters, .Y.
for the alkaline earth metals
~ ~~
Melting SS0, td Sliquid AS Metal Temperature at MP at MP (SI,, - S,,,) X1,q
("C) (pV "C') (pV Y - 1 ) (pV Y ' )
Mg 65 1 - 2.7 1.6 4.3 -0.48 Ca 838 9.6 9.9 0.3 - 1.58 Sr '68 -0.7 - a 4 a 3 0.059 Ba 714 -0.9 - a 2 0.7 -0.029
1824 J B Van Zytveld, J E Enderby and E W Collings
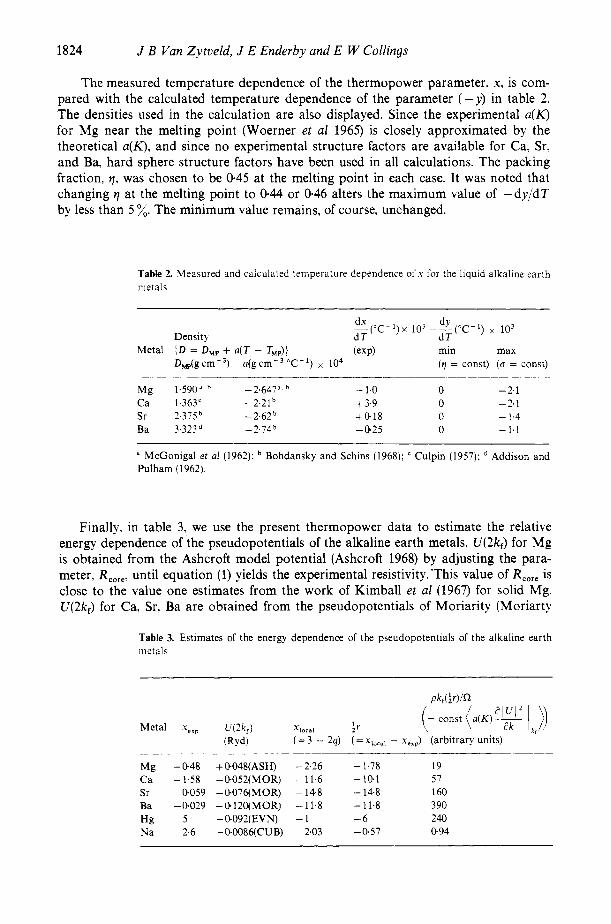
The measured temperature dependence of the thermopower parameter, x, is com- pared with the calculated temperature dependence of the parameter (-y) in table 2. The densities used in the calculation are also displayed. Since the experimental n ( K ) for Mg near the melting point (Woerner et nl 1965) is closely approximated by the theoretical n(K), and since no experimental structure factors are available for Ca, Sr. and B a hard sphere structure factors have been used in all calculations. The packing fraction, q, was chosen to be 045 at the melting point in each case. It was noted that changing q at the melting point to 0.44 or 0.46 alters the maximum value of -dy/dT by less than 5 %. The minimum value remains, of course, unchanged.
Table 2. Measured and calculated temperature dependence ofx for the liquid alkaline earth metals
Densit\ Metal ID = D,, + n(T - T,,,J} (exp) min max
D,w(g cm-3) n(g cm-3 " c - ' ) x io4 ( q = const) (U = const)
M g 1.590".b - 2.647". - 1.0 0 -2.1 Ca 1.363' -2.21b + 3.9 0 - 2.1
Ba 3.32!d - 2.14 -Q25 0 - 1.1 Sr 2,375b - 2.62 + 0 1 8 0 - 1.4
a McGonigal et al (1962): Bohdansky and Schins (1968): Culpin (1957): Addison and Pulham (1962).
Finally, in table 3, we use the present thermopower data to estimate the relative energy dependence of the pseudopotentials of the alkaline earth metals. U(2k f ) for Mg is obtained from the Ashcroft model potential (Ashcroft 1968) by adjusting the para- meter, R,,,,, until equation (1) yields the experimental resistivity. 'This value of R,,,, is close to the value one estimates from the work of Kimball et nl (1967) for solid Mg. U(2k f ) for Ca, Sr, Ba are obtained from the pseudopotentials of Moriarity (Moriarty
Table 3. Estimates of the energy dependence of the pseudopotentials of the alkaline earth met a1 s
Metal Y , , ~ U(2k,) XloEal ) r (Ryd) ( = 3 - 2q) ( =xlocal - x,,J (arbitrary units)
Mg - 0 4 8 +@048(ASH) -2.26 - 1.78 19
Sr 0059 -0076(MOR) -14.8 - 14.8 160 Ba -0029 -Q12O(MOR) -11.8 - 11.8 390
C a -1.58 -0052(MOR) -11.6 - i o 1 57
Hg 5 -0092(EVN) -1 -6 240 N a 2.6 -0.008qCUB) 2.03 -057 0 9 4
Thermoelectric powers of liquid alkaline earth metals 1825
1972) for these metals. Again, the model potential parameter, asW. has been adjusted to yield the measured resistivity via equation (1) for each metal. These values of U(2kf) are then used to estimate q (equation (4)) and hence xlocal The difference between xlocal and xeXp is assumed to be attributable to the term, i r , which has to this point been ignored. Since, by equations (1) and (3, the integral
we evaluate the latter expression to obtain an estimate of the energy dependence of the pseudopotential. The results of this calculation are displayed in the last column. In each case, the resistivities have been those reported in I. Finally, data on Hg from Evans et a1 (1969) and on Na from Cubiotti et a1 (1971) have been included for purposes of comparison
5. Discussion
We have, following Thornton and Young (1969), calculated the temperature dependence of the parameter, y, for these liquids, and compared this with the measured values of dx/dT. Within this framework, one explains the change in liquid density with tempera- ture in terms of a change in the packing fraction, q, or a change in the hard sphere diameter, B, or some combination of these two. (We assume here that the liquid structure is adequately described by a theoretical structure factor (Ashcroft and Lekner 1966)) For the liquified inert gases (for example, liquid Ar), the assumption that B equals a constant is probably valid, and density changes can be attributed to changes in q. For liquid metals, B must be related to the electron screening. Since changes in density result in a redistribution of the screening electrons, we expect both q and B to change with temperature for liquid metals (cf Dickey et al 1967). The hard sphere structure factor, n(Ka), is independent of changes in a if q is held constant.
We see from table 2 that dx/dT for Mg falls about midway between the extremes predicted by the behaviour of the structure factor with temperature, suggesting that the observed dx/dT may be the result of changes in both q and B with increasing temperature. This is just as we expect. dx/dT for Ba also falls nicely within the predicted range of values.
On the other hand, we note that the calculated values of dx/dT for Ca and Sr do not follow the experimental values nearly as well, with Ca showing the greatest deviation. We recall that we have, in our treatment, chosen to consider z independent of tempera- ture. In many cases this assumption should be fairly good; however, if the phrase shifts, in particular q2, and their energy derivatives at the Fermi level, are significantly tempera- ture dependent, we can no longer neglect dz/dT (cf Young et a1 1967). At least in the case of Ca and Sr, the d resonance may introduce sufficient temperature dependence into z to require its inclusion. It would be interesting to apply the full formalism to the calculation of dx/dT for these liquid metals.
It is also of interest to consider the effect of the choice of q(T) and a(T) on the calcu- lated temperature dependence of the electrical resistivity for Mg. Using the Ashcroft model potential and a hard sphere structure factor we obtain dp/dT= -0012pQ cm "C-'. This is unchanged, however, over the entire range from q = constant to a = constant. The measured value, from I, is dp/dT = 0 0.03 p!2 "C- '. We see that dx/dTis much more sensitive than dp/dT to the choice of a( T ) and q( T).
1826 J B Van Zytveld, J E Enderby and E W Collings
The energy dependence of the pseudopotentials for the alkaline earth metals shows a progressive increase as we proceed from Mg to Ba (see last column, table 3). This is consistent with a d resonance dominating the scattering properties of Ca. Sr, and Ba. and results from the unfilled transition metal d band approaching the Fermi level from above as we proceed from Ca to Ba. It is a bit surprising, however, that the local (3 - 2q) and non local ( i r ) contributions to x, both large, should so nearly cancel out in each case, leaving x quite small. For comparison, the work of Evans et al (1969) indicates an energy dependence of U ( K , k) for Hg that is comparable with those for Sr and Ba. Na, however, shows a very small energy dependence (Cubiotti et a1 1971).
Since the liquid alloys Ca-Sr and Sr-Ba are nearly substitutional in the sense of Faber and Ziman (1969, it should be possible to test the magnitude of the energy dependence experimentally along the lines of Enderby et al (1968). It would also be interesting to attempt to calculate x by taking full account of its energy dependence ab initio (cf Evans 1969). It should be borne in mind, however, that the. free electron mean free path for liquid Ba is slightly less than the nearest neighbour separation in that liquid, perhaps invalidating the use of free electron methods for this metal.
One final comment should be made. We see (table 2) that the temperature dependence of the thermopower of liquid Ca seems anomalously large when compared with the other liquid alkaline earth metals. During the course of the present measurements, it was noted that when small amounts of oxygen were added to liquid Ca, the thermo- power was drastically depressed. This is probably due to the removal of electrons from the conduction band in liquid Ca. Both the strong temperature and impurity concentra- tion effects for liquid Ca are consistent with the assumption of a very narrow d density of states, much narrower than for either Sr or Ba. Some very preliminary calculations do seem to indicate that this may be the case (R Evans, private communication).
Acknowledgments
J E Enderby wishes to acknowledge Battelle Memorial Institute for the award of a Fellowship during the tenure of which the liquid metal studies were begun. J B Van Zytveld acknowledges the hospitality of Sheffield University, the financial support of the Science Research Council in connection with the liquid magnesium research and the hospitality of the Metal Science Group, Battelle-Columbus Laboratories where pre- liminary work on calcium, strontium, and barium was carried out. We wish to acknow- ledge the United States Atomic Energy Commission, Division of Research, Battelle- Columbus Laboratories for financial support, and the Research Corporation for a Cottrell College Science Grant which permitted completion of the work at Calvin College. We thank G W Waters and W Friesema for competent technical assistance, and Dr R Evans. University of Bristol, for a helpful communication.
References
Addison C C and Pulham R J 1962 J . Chem. Soc. 3873-6 Ashcroft N W 1968 J . Phys. C : Solid Sr. Phys. 1 232-43 Ashcroft N W and Lekner J 1966 Phys . Rei.. 145 83-90 Bohdansky J and Schins H E J 1968 J . Inorg. Nuclear Chemistry 30 2331-7 Bortolani V and Calandra C 1968 Nuoco Cim. 58B 393-401 Bradley C C, Faber T E. Wilson E G and Ziman J M 1962 Phil. Mag. 7 865-87
Thermoelectric powers of liquid alkaline earth metals
Cubiotti G. Giuliano E S, Ruggeri R 1971 h'uoco Cirn. 3B 193-205 Culpin M F 1957 Proc. Phys. Soc. B 70 1079-86 Cusack N and Kendall P 1958 Proc. Phys. Soc. 72 898-901 Dickey J M, Meyer A and Young W H 1967 Proc. Phys. Soc. 92 460-75 Enderby J E, Van Zytveld J B, Howe R A and Mian A J 1968 Phys. Lett. 28A 144-5 Evans R, Greenwood D A and Lloyd P 1971 Phys. Lett. 3% 57-8 Evans R, Greenwood D A, Lloyd P and Ziman J M 1969 Phys. Lett. 30A 313-4 Faber T E and Ziman J M 1965 Phil. Mag. 11 153-73 Harrison W A 1969 Phys. Rev. 181 1036-53 Kimball J C, Stark R W and Mueller F M 1967 Ply.$. Rec. 162 6 W 8 Marwaha A S and Cusack N E 1966 P h p . Lett. 22 556 McGonigal P J, Kirshenbaum A D and Grosse A V 1962 J . Phys. Chem. 66 737-40 Moriarty J A 1972 Phys. Rev. 6 4445-58 Rogers D L and Fong C Y 1972 Phys. Lett. 39A 345-6 Rohn 1924 Z. Metallk. 16 297 Stanford R H 1967 RAE Tech. Rep. 67185 Thorton D E and Young W H 1969 J . Phys. C : Solid St. Phys. 2 1070-6 Van Zytveld J B, Enderby J E and Collings E W 1972 J . Phys. F : .Wetal Phys. 2 73-8 Woerner S, Steeb S and Hezel R 1965 Z . Metallk. 56 682-5 Young W H, Meyer A and Kilby G E 1967 Phys. Rei:. 160 482-9 Ziman J M 1964 A h . Phys. 13 89-138
1827