eprints.hud.ac.ukeprints.hud.ac.uk/id/eprint/32090/1/final thesis (2).pdf · i abstract...
TRANSCRIPT

University of Huddersfield Repository
Scotson, James L.
Understanding oligonucleotide synthesis
Original Citation
Scotson, James L. (2016) Understanding oligonucleotide synthesis. Doctoral thesis, University of Huddersfield.
This version is available at http://eprints.hud.ac.uk/id/eprint/32090/
The University Repository is a digital collection of the research output of theUniversity, available on Open Access. Copyright and Moral Rights for the itemson this site are retained by the individual author and/or other copyright owners.Users may access full items free of charge; copies of full text items generallycan be reproduced, displayed or performed and given to third parties in anyformat or medium for personal research or study, educational or notforprofitpurposes without prior permission or charge, provided:
• The authors, title and full bibliographic details is credited in any copy;• A hyperlink and/or URL is included for the original metadata page; and• The content is not changed in any way.
For more information, including our policy and submission procedure, pleasecontact the Repository Team at: [email protected].
http://eprints.hud.ac.uk/

Understanding Oligonucleotide Synthesis
By
James Lee Scotson
November 2016
A thesis submitted to the University of Huddersfield in
partial fulfilment of the requirement for the degree of
Doctor of Philosophy
The Department of Chemical Sciences,
The University of Huddersfield,
Queensgate,
Huddersfield
HD1 3DH
In collaboration with GlaxoSmithKline

i
Abstract
Oligonucleotides are synthesised almost exclusively via the solid-supported phosphoramidite
method. However popular this method may be, the expensive reagents used in large excess during
the synthesis as well as the large amounts of organic and aqueous solvents and purification steps
makes the scale-up of oligonucleotide synthesis costly and possibly harmful to the environment.
The therapeutic use of anti-sense oligonucleotides (ASOs) is hindered by their susceptibility to
nuclease catalysed hydrolysis and to overcome this problem ASOs have been modified commonly
by the introduction of a phosphorothioate backbone. This research aims to provide a better
understanding of some of the more problematic stages of the synthesis cycle, the formation of the
sulfurizing agent and sulfurisation of inter-nucleotide phosphite linkages, in order to make this
method more sustainable and efficient.
The investigation of the activation, alcoholysis and hydrolysis of the phosphoramidites 2´-methoxy-
5´-O-DMT-uridine 3´-CE phosphoramidite (UAm) and di-tert-butyl N,N-di-isopropyl
phosphoramidite (DBAm) using several tetrazole activators found that complete conversion of the
phosphoramidite UAm to products required an excess of activator and that this was due to the
generation of di-isopropyl amine during coupling. Conductivity measurements show that the amine
deprotonates the acidic activator and that the ammonium and tetrazolide ions that are subsequently
formed strongly ion pair (Kip = 6540 M-1
) removing free activator from solution. The tetrazole-
catalysed reaction of phosphoramidites with oxygen nucleophiles was found to be first order with
respect to phosphoramidite and activator and the nucleophilic displacement of the di-isopropyl
amine group by the tetrazoyl group at phosphorus is rate-limiting.
Investigation into the 3-picoline-catalysed ageing of the sulfur transfer reagent phenylacetyl
disulfide (PADS) has shown that the process is overall second order and is proportional to the
concentration of PADS and 3-picoline. Deuterium exchange experiments show that ageing proceeds
via abstraction of the methylene CH2 protons of PADS via an E1cB-type decomposition of the
PADS molecule generating a disulfide anion and a ketene by-product which was trapped using an
intra-molecular [2+2]-cycloaddition reaction. Mass spectrometry data shows that disulfide anions
act as nucleophiles with PADS molecules to generate polysulfides which are the active sulfur
transfer reagents in aged PADS solutions. Using pyridines that are less basic than 3-picoline causes
the rate of degradation of PADS to become slower, indicating the possibility that the rate-limiting
step of this process is the generation of the disulfide anion.
The rate of sulfurisation of phosphites by both ‘fresh’ and ‘aged’ PADS in the presence of 3-
picoline was found to be first order with respect to phosphite, PADS and 3-picoline at low
concentrations of each. However, the rate of the reaction becomes independent of base when using
aged PADS in the presence of high 3-picoline concentration. Brönsted correlations for the
sulfurisation of alkyl phosphites using fresh PADS give a βnuc value of 0.51, consistent with a
mechanism involving nucleophilic attack by the phosphite on the disulfide bond of PADS to
generate a phosphonium ion intermediate. This degrades to the phosphorothioate product via a base-
catalysed mechanism which has been confirmed by removal of the methylene protons from the
PADS molecule. Comparison of the βnuc values seen when altering the pKa of the pyridine catalyst
used shows that the rate of the reaction of fresh PADS is much more sensitive to the pKa of the
pyridine than is aged PADS (βnuc = 0.43 and 0.26 for fresh and aged PADS respectively). This
suggests that in the case of aged PADS, the phosphite attacks the sulfur atom adjacent to the
carboxylate group in the polysulfide chain. This generates a phosphonium intermediate which can
be broken down via a much more facile S-S bond fission, as opposed to the C-S bond fission as
seen in when using fresh PADS.

ii
Acknowledgements
Firstly, I would like to thank my supervisors Professor Andrew P. Laws and Professor Michael I.
Page for their relentless effort and endless patience. Their guidance over the years, academically,
professionally and personally, has been invaluable and I am honoured to have been a student of
theirs.
Secondly, this project would not have been possible without the contribution of GlaxoSmithKline. I
would like to thank GlaxoSmithKline for their support throughout the process, in particular Dr.
Benjamin I. Andrews for all of his help during my time at GSK and throughout the whole PhD
process.
Thirdly, a special thanks to Dr. Neil McClay and Dr. Richard Hughes for all their help with NMR
and HPLC and the team at IPOS for their help with just about every other technique used
throughout this work. Thanks to Dr. Denisa Tarabová for her help with synthesis.
I would like to thank my partner Sophie who has been a pillar of support, particularly in the closing
months of this work, and finally, my parents: all of them. They have given me every ounce of
support possible over the years and for that I am eternally grateful. In particular, I'd like to thank my
Mum Angela, whose kindness and selflessness have taught me more than any book ever could.
This thesis is dedicated to her.

iii
Table of Contents
Table of Figures .................................................................................................................................. ix
Table of Tables.................................................................................................................................. xiii
Table of Schemes ............................................................................................................................... xv
List of Abbreviations ....................................................................................................................... xvii
1. Introduction ...................................................................................................................................... 1
1.1 Introduction to Anti-Sense therapies ......................................................................................... 2
1.1.1 DNA ...................................................................................................................................... 2
1.1.2 Protein Synthesis – Transcription and Translation .............................................................. 3
1.2 Anti-Sense Therapies .................................................................................................................. 5
1.2.1 Steric Blocking ...................................................................................................................... 6
1.2.2 Exon-Skipping Mechanism ................................................................................................... 7
1.2.3 RNase-H Activation .............................................................................................................. 9
1.3 Oligonucleotide Modifications ................................................................................................. 10
1.3.1 Backbone Modifications .................................................................................................... 10
1.3.1.1 Phosphorthioates and Phosphorodithioates .................................................................. 11
1.3.1.2 Alkylphosphonates ......................................................................................................... 13
1.3.1.3 Phosphoramidates .......................................................................................................... 14
1.3.1.4 Boranophosphates .......................................................................................................... 15
1.3.1.5 Exchange of the Bridging Oxygens and Dephospho Analogues ..................................... 15
1.3.2 Sugar Modifications ........................................................................................................... 17
1.4 Synthesis of Oligonucleotides .................................................................................................. 18
1.5 H-Phosphonate Method ........................................................................................................... 19
1.6 Phosphoramidite Method ........................................................................................................ 20
1.6.1 Activation and Coupling of Phosphoramidites .................................................................. 22

iv
1.6.1.2 Nucleophilic substitution during coupling ...................................................................... 23
1.6.1.3 Phosphoramidite protonation ........................................................................................ 23
1.6.1.4 Choosing an activator ..................................................................................................... 24
1.6.2 Sulfurisation step ............................................................................................................... 25
1.6.2.1 Overview of Disulfides .................................................................................................... 26
1.6.2.2 Sulfurisation of Phosphites Using PADS ......................................................................... 28
1.7 General Aims of the Work ........................................................................................................... 29
2. Experimental .................................................................................................................................. 30
2.1 Materials ................................................................................................................................... 31
2.2 HPLC Method and Specification ............................................................................................... 31
2.3 NMR Specification .................................................................................................................... 31
2.4 Infra-Red Spectroscopy ............................................................................................................ 31
2.5 Mass Spectrometry LC-MS Methods and Specification ........................................................... 32
2.6 Conductivity Measurements .................................................................................................... 32
2.7 General Method of Generating Aged PADS Solutions ............................................................. 32
2.8 General HPLC Degradation Kinetics Method ........................................................................... 33
2.9 General NMR Sulfurisation Kinetics Method ........................................................................... 33
2.10 Experimental – Ageing PADS .................................................................................................. 34
2.10.1 Analysis of Aged PADS Solutions ......................................................................................... 34
2.10.2 Dependence of PADS Decomposition on 3-Picoline Concentration ................................... 34
2.10.3 Effect of Pyridine pKa on the Rate of Degradation .............................................................. 34
2.10.4 Reaction of 3-Picoline with Phenylacetyl Chloride ............................................................. 35
2.10.5 Assessment of the Rate of Decomposition of Phenyl-Substituted PADS Analogues .......... 35
2.10.6 Deuterium Exchange with PADS ......................................................................................... 35
2.10.7 Deuterium Exchange with Phenyl-Substituted PADS Analogues ........................................ 36
2.10.8 Trapping the Ketene Generated During Ageing of 2,2´-diallyl-2,2´-phenylacetyl disulfide 36

v
2.10.9 Separation of the Products of PADS Ageing by HPLC .......................................................... 37
2.10.10 Assessment of Sulfur-Transfer Activity of Aged PADS Fractions ...................................... 38
2.10.11 Quantification and Kinetic Measurements of Sulfur Transfer with Fractions from Aged
PADS Solutions ............................................................................................................................... 38
2.10.12 Assessment of the Rate of Decomposition of PADS in the Presence of BHT.................... 38
2.10.13 Synthesis of Methyl o-iodophenylacetate ........................................................................ 39
2.10.14 Synthesis of Methyl 2-(2´-allylphenyl)acetate .................................................................. 40
2.10.15 Synthesis of 2-(2´-allylphenyl)acetic acid .......................................................................... 41
2.10.16 Synthesis of 7,7a-dihydro-1H-cyclobuta[a]inden-2(2aH)-one .......................................... 42
2.10.17 Synthesis of 2,2´-di(σ-allylphenyl)acetyl disulfide ............................................................ 43
2.10.18 Synthesis of Bis-benzoyl disulfide ..................................................................................... 44
2.10.19 Synthesis of 2,2,2´,2´-tetramethyl-2,2´-phenylacetyl disulfide ........................................ 45
2.10.20 Synthesis of 2,2´-(4-chlorophenyl)acetyl disulfide ............................................................ 46
2.10.21 Synthesis of 2,2´-(4-cyanophenyl)acetyl disulfide ............................................................ 47
2.10.22 Synthesis of 2,2´-(4-methoxyphenyl)acetyl disulfide ........................................................ 48
2.11 Experimental: Sulfurisation with Fresh and Aged PADS ........................................................ 49
2.11.1 Varying 3-Picoline Concentration in Sulfurisation with Fresh PADS ................................... 49
2.11.2 Varying PADS Concentration in Sulfurisation Reaction with Fresh PADS ........................... 49
2.11.3 Sulfurisation Reaction in the Presence of BHT (1 M) .......................................................... 50
2.11.4 Sulfurisation Reaction in the Presence of BHT (0.1 M) ....................................................... 50
2.11.5 Sulfurisation of Aryl Phosphites with Fresh PADS in Acetonitrile-d3 .................................. 50
2.11.6 Sulfurisation of Aryl Phosphites with Fresh PADS in Toluene-d8 ........................................ 51
2.11.7 Sulfurisation of Aryl Phosphites with Fresh PADS in CDCl3 ................................................. 51
2.11.8 Sulfurisation of Aryl Phosphites with Fresh PADS in DMSO-d6 ........................................... 51
2.11.9 Sulfurisation of Alkyl Phosphites with Fresh PADS in CDCl3 ............................................... 51

vi
2.11.10 Sulfurisation of Phosphites in Acetonitrile-d3 Using Fresh PADS with Various Substituted
Pyridines ......................................................................................................................................... 52
2.11.11 Sulfurisation of Phosphites Using 2,2,2´2´-tetramethyl-2,2´-phenylacetyl disulfide with
Various Substituted Pyridines ........................................................................................................ 52
2.11.12 Sulfurisation of Phosphites Using Dibenzoyl disulfide with Various Substituted Pyridines
........................................................................................................................................................ 52
2.11.13 Sulfurisation of Phosphites in Acetonitrile-d3 Using Fresh PADS with Various Substituted
Pyridines ......................................................................................................................................... 52
2.11.14 Sulfurisation of Phosphites in Acetonitrile-d3 Using Various Phenyl Substituted PADS
with 3-Picoline ................................................................................................................................ 53
2.11.15 Synthesis of tris-(4-methoxyphenyl)phosphite ................................................................. 53
2.11.16 Synthesis of 2,2′-(4-fluorophenyl)acetyl disulfide ............................................................ 54
2.11.17 Synthesis of 2,2′-(3-chlorophenyl)acetyl disulfide ............................................................ 55
2.11.18 Synthesis of tris(3-chlorophenyl)phosphite ...................................................................... 56
2.11.19 Preparation of tris (4-chlorophenyl)phosphite ................................................................. 57
2.11.20 Preparation of tris (4-fluorophenyl)phosphite ................................................................. 58
2.12 Experimental – Activation and Coupling ................................................................................ 59
2.12.1 Solubility of ETTH in Acetonitrile at 25oC ............................................................................ 59
2.12.2 Solubility of [ETTHDIA] in Acetonitrile at 25oC .................................................................... 59
2.12.3 Calculation of ETTH pKa in H2O ............................................................................................ 60
2.12.4 Calculation of pKa of Several Tetrazoles in 10% v/v DMSO/H2O ........................................ 60
2.12.5 Conductance Measurements of ETTH Solutions in Acetonitrile ......................................... 60
2.12.6 Conductance Measurements of ETTHDIA Solutions in Acetonitrile ................................... 61
2.12.7 Conductance Measurements of ETTHDIA Solutions with Excess ETTH in Acetonitrile ...... 61
2.12.8 Activation of UAm Using ETTH Monitored by Conductivity ................................................ 61
2.12.9 Methanolysis of UAm Activated by ETTH Monitored by Conductivity ............................... 61
2.12.10 Investigation into the Acitvation Equillibrium by 31P NMR ............................................... 62

vii
2.12.11 Kinetics of Activation of di-tert-butyl N,N-di-isopropyl phosphoramidite (DBAm) with
Various Substituted Tetrazoles. Reactions Followed by 31P NMR Using Samples Quenched With
Diethyl amine ................................................................................................................................. 62
3. Results and Discussion: Ageing PADS ......................................................................................... 63
3.1 Analysis of Aged PADS Solutions .............................................................................................. 65
3.2 Dependence of PADS Decomposition on 3-Picoline Concentration ........................................ 70
3.3 Effect of Pyridine pKa on the Rate of Degradation ................................................................... 72
3.4 Nucleophilic or General Base Catalysis by 3-Picoline ............................................................... 74
3.5 Possible Mechanisms Proceeding With 3-Picoline Acting as a Base ........................................ 76
3.6 Trapping the Carbanion Intermediate with D2O Exchange ...................................................... 78
3.7 Calculation of the pKa of PADS ................................................................................................. 83
3.8 Deuterium Exchange with Phenyl Substituted PADS Species .................................................. 86
3.9 Ageing PADS Analogues without Dissociable Protons ............................................................. 88
3.10 Trapping the Ketene By-Product ............................................................................................ 89
3.11 Isolation of the Products of Ageing by Preparative HPLC ...................................................... 93
3.12 Ageing PADS in the Presence of the Radical Trap Butylated Hydroxytoluene ...................... 97
4. Results and Discussion: Sulfurisation ............................................................................................ 99
4.1 Fresh PADS................................................................................................................................ 101
4.1.1 Determination of the Order of the Sulfurisation Reaction ................................................. 101
4.1.2 Distinction between PADS and Polysulfides as Active Sulfurisation Agent in Fresh PADS
Solution......................................................................................................................................... 104
4.1.3 Distinction between a Radical and an Ionic Pathway ......................................................... 106
4.1.4 Phosphite Substituent Effects on the Rate of Sulfurisation with Fresh PADS .................... 109
4.1.5 The Effect of Pyridine pKa on the Rate of Reaction ............................................................. 113
4.1.7 The Effect of PADS Phenyl Substituents on the Rate of Reaction....................................... 117
4.1.8 Summary of the Mechanism of the Sulfurisation of Phosphites using Fresh PADS ........... 119

viii
4.2 Aged PADS ................................................................................................................................ 120
4.2.1 Effect of Phosphite Substituents on the Rate of Sulfurisation Using Aged PADS ............... 123
4.2.2 Dependence of the Rate of Sulfurisation Using Aged PADS on Base pKa ........................... 125
4.2.3 Effect of 3-Picoline Concentration on the Rate of the Sulfurisation Reaction using Aged
PADS ............................................................................................................................................. 129
4.2.4 Summary of the Mechanism of Sulfurisation of Phosphites by Aged PADS Solutions ....... 134
5. Results and Discussion: Activation and Coupling of Phosphoramidites ..................................... 136
5.1 Determination of the Solubility of Ethylthiotetrazole (ETTH) and Di-isopropylammonium
ethylthiotetrazolide salt (ETTHDIA) .............................................................................................. 138
5.2 Determination of the pKa of ETTH in Water ........................................................................... 139
5.3 Determination of the pKa of ETTH in Acetonitrile .................................................................. 141
5.4 Determination of the Ion-Pair Constant (Kip) for the Acid-Base Equilibrium Between ETT- and
DIAH+ and [ETTHDIA]ip .................................................................................................................. 145
5.5 Kinetics of Activation of 2´-Methoxy-5´-O-DMT-Uridine 3´-CE Phosphoramidite by ETT
Followed by Conductivity ............................................................................................................. 150
5.6 Investigation into the Activation Equilibrium by 31P NMR ..................................................... 154
5.7 Investigation of the Kinetics of Activation of di-tert-Butyl N,N-di-isopropyl phosphoramidite
(DBAm) Using Various Tetrazole Activators by 31P NMR ............................................................. 157
6. Conclusions and Further Work .................................................................................................... 161
6.1 Ageing PADS ........................................................................................................................... 162
6.2 Sulfurisation of Phosphites using Fresh and Aged PADS ....................................................... 163
6.3 Coupling and Activation ......................................................................................................... 165
7. References .................................................................................................................................... 166
Appendix 1: X-Ray Crystal Structure Data ..................................................................................... 171
Appendix 2: Publications from this Work ....................................................................................... 173
Word Count: 41,741

ix
Table of Figures
Figure 1 Basic structure of DNA and RNA nucleotides ...................................................................... 2
Figure 2: Simplified diagram showing mRNA synthesis via the transcription of DNA ..................... 3
Figure 3: Simplified diagram showing polypeptide synthesis translation of mRNA .......................... 4
Figure 4: Simplified Diagram of a steric-blocking anti-sense therapy blocking translation of mRNA
.............................................................................................................................................................. 6
Figure 5: Simplified Diagram of an exon-skipping anti-sense therapy blocking translation of
specific exons to generate abridged but functional proteins ................................................................ 7
Figure 6: Simplified Diagram of RNase-H activation by synthetic oligonucleotides ......................... 9
Figure 7: Examples of oligonucleotide backbone modifications ....................................................... 10
Figure 8: Phosphorothioate and phosphorodithioate linkages ........................................................... 11
Figure 9: Various dephospho and bridge modified oligonucleotide linkages ................................... 16
Figure 10: Examples of sugar modifications used in therapeutic oligonucleotides ........................... 17
Figure 11: Diagram Showing C3-Endo and C2-Endo conformations of the ribose sugar ring and the
resulting Newman projections along the C1*-C2
* bond. ..................................................................... 17
Figure 12: Coupling reagents used in various methods of oligonucleotide synthesis ....................... 18
Figure 13: 1H-Tetrazole ..................................................................................................................... 22
Figure 14: Various novel sulfur-transfer reagents used in phosphorothioate synthesis .................... 25
Figure 15: Oxidation of glutathione to form glutathione disulfide. ................................................... 26
Figure 16: HPLC chromatograms of PADS (3.3 mM) in a solution of 3-picoline (5M) in ACN
(naphthalene internal standard at T=0 (top) and T=48 h (bottom) showing PADS degradation.*1 =
Naphthalene (internal standard), *2 = PADS..................................................................................... 65
Figure 17: HPLC chromatograms of PADS (3.3 mM) in a solution of 3-picoline (5M) in ACN
(naphthalene internal standard at T=0 (top) and T=24 hours (bottom) showing non-polar
degradation products.*1 = Naphthalene (internal standard), *2 = PADS .......................................... 66
Figure 18: HPLC chromatograms of PADS (3.3 mM) in a solution of 3-picoline (5M) in ACN
(naphthalene internal standard at T=0 (top) and T=24 hours (bottom) showing polar degradation
products.*3 = 3-picoline .................................................................................................................... 66
Figure 19: 1H and
13C
NMR spectra of PADS (0.2M) in 3-picoline (0.4M) in ACN at T=n h ........ 67
Figure 20: Mass spectrum of sodium adduct of bis-phenylacetyl trisulfide. m/zexp = 357.0054, m/zobs
= 357.0047. ........................................................................................................................................ 67

x
Figure 21: Mass spectrum of potassium adduct of bis-phenylacetyl pentasulfide. m/zexp = 436.9234,
m/zobs = 437.0248 ............................................................................................................................... 68
Figure 22: Mass spectrum of proton adduct of bis-phenylacetyl hexasulfide. m/zexp = 430.9300,
m/zobs = 431.0554 ............................................................................................................................... 68
Figure 23: Pseudo first-order rate constant of degradation of PADS (3.3mM) in various
concentrations of 3-picoline in acetonitrile monitored by HPLC at 25oC. ........................................ 71
Figure 24: Brønsted plot of log of the second-order rate constants for the degradation of PADS (0.2
M) with various pyridines (2.5 M) determined by 1H NMR in acetonitrile-d3 at 25
oC ..................... 72
Figure 25: Reaction of 3-picoline with phenylacetyl chloride and subsequent polymerisation of the
ketene product. ................................................................................................................................... 75
Figure 26: log of the pseudo first-order rate constants for the decomposition of various substituted
PADS analogues (3.3 mM) with 3-picoline (1 M) as a function of the Hammett σ value of the
PADS phenyl substituent ................................................................................................................... 76
Figure 27: Concentration of PADS CH2 and CHD as a function of time for 3-picoline catalysed
PADS deuterium exchange. ............................................................................................................... 79
Figure 28: Pseudo first-order rate constants for deuterium exchange as a function of 3-picoline
concentration determined by 1H NMR at 25
OC in 12%
D2O in acetonitrile-d3 ................................. 80
Figure 29: log of the pseudo first-order rate constants for H/D exchange of methylene protons in
various substituted PADS analogs (0.17 M) with 3-Picoline (0.35 M) monitored by 1H NMR at
25oC in deuterated acetonitrile with 12% D2O .................................................................................. 86
Figure 30: Brønsted plot showing the log of the observed pseudo first-order rate constants of the
degradation of substituted PADS analogues (0.17 M) as a function of pKa calc in 12% D2O in
Acetonitrile-d3 using 3-Picoline (0.35 M) as the base. Pseaudo first-order rate constants determined
by 31
P NMR ........................................................................................................................................ 87
Figure 31: Acyldisulfide compounds synthesised without dissociable protons ................................ 88
Figure 32: Synthesis and 1H NMR spectrum of cycloaddition product (6) ....................................... 90
Figure 33: 1H NMR spectra of crude solutions of 2,2´-(allylphenyl)acetyl disulfide(bottom, blue)
and pure, isolated cycloaddition product (6) (top, red) ...................................................................... 91
Figure 34: Mass spec. analysis of cyclo-addition product (6) degradation fragments. ..................... 92
Figure 35: Above - HPLC chromatogram of a solution of PADS aged for 48 h and extracted with
dilute HCl. Below: Expansion of fractions 6-10 from the chromatogram above .............................. 93

xi
Figure 36: 31
P NMR analysis of reactions of HPLC fractions of aged PADS solution with triphenyl
phosphite in the presence of 3-picoline. Blue- triphenyl phosphite, red- triphenyl phosphorothioate,
green- triphenyl phosphine oxide (internal standard). ....................................................................... 94
Figure 37:Acyl CH2 region of various PADS species isolated from aged PADS mixtures by HPLC
............................................................................................................................................................ 95
Figure 38: Mechanism of quenching radicals by butylated hydroxytoluene113
. ................................ 97
Figure 39: ln Concentration of PADS as a function of time during ageing with 3-picoline (1 M) in
acetonitrile-d3 at 25oC both with (left) and without (right) BHT (3.3mM) ....................................... 98
Figure 40: Pseudo first-order rate constants for sulfurisation of (PhO)3P (0.1 M) using PADS (1 M)
aged for n h in 3-picoline (5 M) in acetonitrile at 25oC determined by
31P NMR ........................... 100
Figure 41: Literature106
reported mechanism of sulfurisation of phosphites by PADS. .................. 101
Figure 42: Pseudo first-order rate constants (s-1
) for sulfurisation of (PhO)3P (0.1 M) using PADS (1
M) with varying concentrations of 3-Picoline determined by 31
P NMR at 25oC in acetonitrile-d3 . 102
Figure 43: Pseudo first-order rate constants for sulfurisation of (PhO)3P (0.1 M) using 3-picoline (2
M) with varying concentrations of PADS ........................................................................................ 103
Figure 44: rate profiles of the decomposition of PADS and the sulfurisation of triphenyl phosphite
in two parallel reactions containing fresh PADS (1M), 3-picoline (2M) and, in solution B only,
triphenyl phosphite (0.1M). Reactions were performed at 25oC in acetonitrile .............................. 105
Figure 45: Concentration of triphenyl phosphite (ln[P(OPh)3]) during sulfurisation with PADS (1
M) and 3-Picoline (2 M) in the presence of BHT (n M) in Acetonitrile at 25oC determined by
31P
NMR................................................................................................................................................. 107
Figure 46: log of the observed pseudo first-order rate constants for the sulfurisation of various
triaryl phosphites (0.1 M) with PADS (1 M) and 3-Picoline (2 M) as a function of the Hammett σ
value of the substituent in acetonitrile-d3 at 25oC. ........................................................................... 109
Figure 47: Brønsted plot for the sulfurisation of various alkoxy phosphites (0.03 M) with PADS
(0.3 M) and 3-Picoline (0.6 M) determined by 31
P NMR in Chloroform at 25
oC .......................... 111
Figure 48: Dependence of the pseudo first-order rate constants for sulfurisation of triphenyl
phosphite (0.1 M) with PADS (1 M) on the pKa 111
of the pyridine catalyst used (3 M) in
acetonitrile at 25oC. Reactions followed by
31P NMR. .................................................................... 113
Figure 49: Linear free-energy relationship for sulfurisation of P(OPh)3 (0.1 M) with 3-Picoline (2
M) using various substituted PADS analogues ................................................................................ 117
Figure 50: Nucleophilic attack by phosphites on sulfur atoms in 2,2´-phenylacetyl trisulfide. ...... 121

xii
Figure 51: Hammett plot for sulfurisation of various substituted phenyl phosphites (0.1 M) using
fresh and aged PADS (1 M) with 3-picoline (2 M) in acetonitrile-d3 at 25oC ................................. 123
Figure 52: log of the observed pseudo first-order rate constants for sulfurisation of (PhO)3P (0.1 M)
using various PADS species (1 M) as a function of pyridine pKa. Reactions followed by 31
P NMR
in acetonitrile-d3 at 25oC ................................................................................................................. 125
Figure 53: Observed pseudo first-order rate constants for the of sulfurisation of P(OPh)3 (0.1 M)
using PADS aged for 48 h (1 M) as a function of the concentration of 3-Picoline at 25oC in
acetonitrile-d3 ................................................................................................................................... 130
Figure 54: Observed pseudo first-order rate constants for sulfurisation of (PhO)3P (0.01 M) using
2,2,2´,2´-tetramethyl PADS (4) (0.1 M) with varying concentrations of 3-picoline in acetonitrile-d3
at 25oC. Reactions followed by
31P NMR ........................................................................................ 131
Figure 55: Observed pseudo first-order rate constants for sulfurisation of (PhO)3P (0.01 M) using
dibenzoyl disulfide (5) (0.1 M) with varying concentrations of 3-picoline in acetonitrile-d3 at 25oC.
Reactions followed by 31
P NMR ...................................................................................................... 132
Figure 56: pH profile of titration of ETTH (0.1 M) with NaOH (0.1 M) ........................................ 139
Figure 57: Conductivity (Sm-1
) of ETTH solutions as a function of concentration (M) of several
solutions of ETTH in acetonitrile at 25oC ........................................................................................ 141
Figure 58: Correlation between pKa (H2O) and pKa (ACN) for various N-heterocyclic acids. ...... 143
Figure 59: Conductivity (Sm-1
) as a function of concentration (M) of several solutions of ETTHDIA
in acetonitrile at 25oC ....................................................................................................................... 145
Figure 60: Conductivity (Sm-1
) of solutions containing ETTHDIA (4.8 mM) and ETTH (n M) ... 149
Figure 61: Conductivity measurements (Sm-1
) taken during the activation of Uam (5 mM) using
varying concentrations of ETTH as a function of time in acetonitrile-d3 at 25oC. Concentrations
determined by 31
P NMR ................................................................................................................... 151
Figure 62: Pseudo first-order rate constants (s-1
) for the activation of UAm with various
concentration of ETTH as a function of ETTH concentration in acetonitrile at 25oC followed by
conductivity ...................................................................................................................................... 151
Figure 63: Observed pseudo first-order rate constants (kobs/s-1
) for methanolysis of UAm (5 mM)
using ETTH (50 mM) as an activator as a function of methanol concentration (mM) in acetonitrile
at 25oC .............................................................................................................................................. 153
Figure 64: Activation of Uam (0.2 M) using ETT as the activator in acetonitrile. 1: Uam (0.2 M), 2:
Uam (0.2 M) + 1eq ETT, 3: Uam (0.2 M) + 2eq ETT, 4: Uam (0.2 M) + 3eq ETT, 5: Uam (0.2 M)

xiii
+ 3eq ETT + 1eq DIA, 6: Uam (0.2 M) + 3eq ETT + 2eq DIA, 7: Uam (0.2 M) + 3eq ETT + 3eq
DIA................................................................................................................................................... 155
Figure 65: 31
P NMR spectrum of activation of DBAm (2.5 mM) using ETTH (5 mM) quenched
with diethyl amine (50 eq) at t=30 s in acetonitrile at 25oC. 1: di-tert-butyl N,N-di-isopropyl
phosphoramidite; 2: di-tert-butyl N,N-diethyl phosphoramidite ..................................................... 157
Figure 66: Brønsted plot showing the dependence of the observed rate constants of reaction of
DBAm with various tetrazoles on the pKa(s) of the tetrazole. ......................................................... 159
Table of Tables
Table 1: Table of calculated and literature reported pKas of various ethyl esters in various solvents.
............................................................................................................................................................ 84
Table 2: Table of the second-order H/D exchange rate constants determined by 1H NMR at 25
oC in
12% D2O in acetonitrile-d3 and calculated pKa of several substituted PADS analogues in 12% D2O
in Acetonitrile-d3. ............................................................................................................................... 87
Table 3: Table of data from sulfurisation reactions using fractions from aged PADS reaction. ....... 95
Table 4: Table of pseudo first-order rate constants for the reaction of triphenyl phosphite (3.5mM)
with various PADS species (35 mM) in the presence of 3-picoline (70 mM) determined by 31
P
NMR at 25oC
in acetonitrile-d3. ........................................................................................................ 96
Table 5: Pseudo first-order rate constants for sulfurisation of triphenyl phosphite (0.1 M) with fresh
PADS (1 M) and 3-picoline (3 M) in the presence of BHT (n M). Reactions followed by 31
P NMR
at 25oC in acetonitrile-d3 .................................................................................................................. 107
Table 6: Third-order rate constants for sulfurisation of (PhO)3P as a function of the solvent
dielectric constant for sulfurisation with 10eq PADS and 20eq 3-Picoline. Reactions followed by
31P NMR at 25
oC. ............................................................................................................................. 108
Table 7: Data from Hammett plot for the sulfurisation of various tris-aryl phosphites (0.1 M) with
PADS (1 M) and 3-Picoline (2 M) in acetonitrile-d3 at 25oC. ......................................................... 110
Table 8: Table of observed pseudo first-order rate constants determined by 31
P NMR for the
sulfurisation of various alkoxy phosphites (0.03 M) with PADS (0.3 M) and 3-Picoline (0.6 M) in
CDCl3 at 25oC .................................................................................................................................. 112
Table 9: Observed pseudo first-order rate constants (kobs/s-1
) for sulfurisation of triphenyl phosphite
(0.1 M) with various pyridines (2 M) with fresh PADS (1 M) in acetonitrile at 25oC .................... 114

xiv
Table 10: βnuc values from Brønsted plots for the sulfurisation of P(OPh)3 using vaious different
sulfur transfer reagents with different substituted pyridines in acetonitrile at 25oC ........................ 116
Table 11: kobs for sulfurisation of (PhO)3P (0.1 M) with fresh PADS, (2) and (3) (1 M) with 3-
picoline (2 M)................................................................................................................................... 116
Table 12: table of pKas of oxyacids and thioacids in water and in acetonitrile. Red values have been
calculated using the above correlation equation. ............................................................................. 121
Table 13: log of the pseudo first-order rate constants for sulfurisation of various substituted triaryl
phosphites (0.1 M) with PADS (1 M) and 3-picoline (2 M) determined by 31
P NMR at 25oC in
acetonitrile-d3. .................................................................................................................................. 124
Table 14: βnuc values for sulfurisation of (PhO)3P (0.1 M) using various sulfurising agents (1 M)
whilst varying the base catalyst (2 M) ............................................................................................. 125
Table 15: Pseudo first-order rate constants (kobs/s-1
) for sulfurisation of (PhO)3P (0.1 M) using fresh
PADS (1 M) and PADS aged for 24 h (1 M) using 2,6-lutidine (2 M) as the base catalyst followed
by 31
P NMR at 25oC in acetonitrile-d3 ............................................................................................. 127
Table 16: Data table from calculation of maximum solubility of ETTH in acetonitrile at 25oC ..... 138
Table 17: Table of calculated equilibrium constants from the modelling of conductivity data of
solutions of ETTHDIA..................................................................................................................... 147
Table 18: Pseudo first-order rate constants (kobs/s-1
) for reaction of DBAm with various tetrazole
activators .......................................................................................................................................... 158

xv
Table of Schemes
Scheme 1: Synthesis of methylphosphonates via the phosphonoamidite method (top) and the
Arbuzov reaction (bottom) ................................................................................................................. 13
Scheme 2: Synthesis of phosphoramidates via oxidation of phosphite triesters in the presence of
amine .................................................................................................................................................. 14
Scheme 3: Synthesis of dephospho-triazole-linked nucleotides using click chemistry ..................... 16
Scheme 4: General scheme for phosphorothioate synthesis via the H-phosphonate method ............ 19
Scheme 5:The synthesis cycle of a DNA oligonucleotide with phosphate backbone using tetrazole
as the activator ................................................................................................................................... 20
Scheme 6: Hydrolysis of a phosphoramidite activated by 1H-tetrazole ............................................ 21
Scheme 7: Scheme showing the different possible pathways of phosphoramidite protonation. Direct
P-Protonation (1) and protonation of the di-isopropylamine group (2). ............................................ 24
Scheme 8: General scheme for reaction of phosphites and sulfide anions with disulfides ............... 27
Scheme 9: Literature proposed mechanism for the sulfurisation of phosphites using PADS ........... 28
Scheme 10: General scheme for reaction of PADS with inter-nucleotide phosphite linkage. .......... 64
Scheme 11: Proposed general mechanism for the formation of acylpolysulfides during ageing of
PADS in solutions of 3-picoline in acetonitrile. ................................................................................ 69
Scheme 12: Possible mechanisms of attack of 3-picoline on PADS as (1) a base and (2) a
nucleophile. ........................................................................................................................................ 73
Scheme 13: Nucleophilic attack by 3-picoline on PADS .................................................................. 74
Scheme 14: Possible mechanisms for the base catalysed degradation of PADS ............................... 77
Scheme 15: Mechanism of deuterium exchange between PADS and D2O catalysed by 3-picoline. 78
Scheme 16: E1cB initiated degradation of PADS ............................................................................. 81
Scheme 17: E1cB initiated degradation of PADS ............................................................................. 89
Scheme 18: Mechanism of [2+2]-intramolecular cycloaddition reaction trapping the ketene
intermediate. ....................................................................................................................................... 89
Scheme 19: possible pathways for the sulfurisation of phosphites using fresh PADS .................... 104
Scheme 20: Reported mechanisms of sulfurisation of phosphites by disulfides. ............................ 106
Scheme 21: Possible mechanisms of sulfurisation of phosphites by PADS in 3-
Picoline/Acetonitrile. ....................................................................................................................... 110
Scheme 22: Two possible mechanisms for the action of picoline in the sulfurisation reaction A: 3-
picoline acting as a base, B: 3-picoline acting as a nucleophile ...................................................... 114

xvi
Scheme 23: Alternative mechanisms of phosphonium degradation with substituted phenyl PADS
analogues .......................................................................................................................................... 118
Scheme 24: Mechanism of sulfurisation of phosphites using fresh PADS in the presence of a
pyridine base. ................................................................................................................................... 119
Scheme 25: General scheme of reactions of substituted phosphites with both fresh PADS and aged
PADS. .............................................................................................................................................. 124
Scheme 26: Base catalysed decomposition of the phosphonium intermediate generated from fresh
PADS and nucleophile catalysed decomposition of the phosphonium intermediate formed using
aged PADS. ...................................................................................................................................... 126
Scheme 27: The nucleophilic breakdown of the various phosphonium intermediates formed by
reaction of fresh PADS, (4), (5) and polysulfides with phosphites. ................................................ 128
Scheme 28: Possible scheme for regeneration of an active sulfur transfer reagent during the reaction
of phenylacetyl disulfide with a phosphite in the presence of a nucleophile. .................................. 133
Scheme 29: Mechanism of sulfurisation of phosphites using aged PADS with and without 3-
picoline. ............................................................................................................................................ 135
Scheme 30: Activation of di-isopropylphosphoramidites by ethylthiotetrazole .............................. 137
Scheme 31: Homo-conjugation of ETTH with ETT-. ...................................................................... 144
Scheme 32: Activation of UAm using ETT as the activator............................................................ 150
Scheme 33: Mechanism of hydrolysis of activated phosphoramidites. ........................................... 152
Scheme 34: Activation and hydrolysis of UAm using ETTH as the activator. ............................... 153
Scheme 35: Equilibrium between un-activated and activated phosphoramidites. ........................... 154
Scheme 36: Mechanism of hydrolysis of activated phosphoramidites ............................................ 156
Scheme 37: Rate equation for activation of DBAm with ETTH ..................................................... 160

xvii
List of Abbreviations
PADS Phenylacetyl disulfide
Me4PADS 2,2,2´,2´-tetramethyl phenyl acetyldisulfide
Me2PADS 2,2´-dimethylphenylacetyl disulfide
DBDS Bis-benzoyl disulfide
TPP Triphenylphosphate
TPPt Triphenylphosphite
TPPnO Triphenylphosphine oxide
BHT Betahydroxy toluene
UAm 2´-methoxy-5´-O-DMT-uridine 3´-CE
phosphoramidite
DBAm Di-tert-butyl N,N-diisopropyl phosphoramidite
ETTH Ethylthio tetrazole
DIA Diisopropyl amine
ETTHDIA Diisopropyl ammonium ethylthio tetrazolide
TetH 1-H-tetrazole
MTTH Methylthio tetrazole
(4-F-Ph)TH (4-fluorophenyl) Tetrazole
PhTH Phenylthio tetrazole
DEA Diethyl amine

1
1. Introduction

2
1.1 Introduction to Anti-Sense therapies
1.1.1 DNA
DNA (deoxyribonucleic acid) is a biopolymer contained within the nucleus of all eukaryotic cells
(in prokaryotes the DNA is located in the cytoplasm and some viruses do not carry DNA) that holds
the information necessary for the biosynthesis of proteins. The repeat units of the DNA polymer are
known as nucleotides and consist of 3 main components; a nitrogen-containing base group, a sugar
molecule (2′ deoxyribose) and a phosphate group. The phosphate group at the 5′ position of one
nucleotide forms a phosphodiester linkage with the 3′ hydroxyl group of another nucleotide unit
formed by an enzyme catalysed condensation reaction which creates the ‘sugar-phosphate’
backbone of the DNA polymer as follows (Fig. 1):
Figure 1 Basic structure of DNA and RNA nucleotides
In DNA there are 4 different nitrogen bases. The sequence of bases of DNA determines the amino
acid sequence of the proteins for which the specific DNA segment codes. The nitrogen bases also
have a structural role. The four nitrogen bases are split into complementary pairs; in DNA, cytosine
and guanine are complementary bases and adenine and thymine are complementary. In RNA,
thymine is replaced by uracil as the complementary base to adenine. Each base is able to hydrogen

3
bond specifically to its complementary base on another DNA strand. This interaction is the driving
force behind the formation of the double helix macro structure of the DNA molecule. This double
helix structure consists of 2 complementary DNA polymers bonded anti-parallel to each other i.e.
one is read from 5′-3′ and one reads from 3′-5′. However, only one strand of the DNA molecule, the
‘sense’ strand codes for proteins. The other strand is a structural feature necessary for the
mechanism of protein synthesis, and is known as the ‘anti-sense’ strand1-5
.
1.1.2 Protein Synthesis – Transcription and Translation
The function of DNA in biological systems is to code for proteins. This occurs via the processes of
transcription and translation (Fig. 2).
Figure 2: Simplified diagram showing mRNA synthesis via the transcription of DNA
Transcription is the process of translating DNA into a complementary RNA code. Transcription of
the DNA into mRNA is necessary as a control mechanism in protein synthesis. For example
synthesis of a particular protein may be amplified by transcription of the corresponding DNA
sequence into multiple mRNA strands. Protein synthesis can therefore occur at several sites rather
than just the one strand of DNA. Furthermore, the inclusion of the 2´-OH makes the mRNA strand
more susceptible to hydrolysis6. This allows protein synthesis to be terminated upon hydrolysis of
the RNA strand, leaving the DNA intact, inside the nucleus.
Transcription is initiated by the enzyme RNA polymerase. The RNA polymerase binds to the sense
strand of the DNA at the point which indicates where the protein is to begin being synthesised from
Single Stranded DNAUn-zipped DNAmRNA Strand
RNA Polymerase
DNA Double-Helix
RNA Polymerase
Free mRNA nucleodites

4
and moves along the DNA double helix ‘unzipping’ it (breaking hydrogen bonds between strands)
as it goes. This allows complementary mRNA nucleotides to bind to the DNA chain to create a
RNA polynucleotide which has the same sequence as the original DNA sense strand i.e. RNA C
nucleotides bind to DNA G nucleotides, RNA U nucleotides bind to DNA A nucleotides etc. The
RNA polymerase catalyses the coupling of mRNA nucleotides to form the sugar-phosphate
backbone of the mRNA chain. When the sequence has been fully transcribed the newly synthesised
mRNA polymer dissociates. The RNA polymerase is able to rebind to the beginning of the
sequence, initiating the synthesis again, meaning that multiple mRNA strands can be synthesised
from the same DNA sequence1-5
. Note that RNA fragments synthesised in this way are known as
pre-RNA fragments as they contain non-coding regions known as ‘introns’. Before translocation out
of the nucleus these introns must be removed or ‘spliced’ out of the sequence. Translocation of the
‘mature’ mRNA then takes place as a single-stranded RNA unit.
Translation is the process by which polypeptides are synthesised from mRNA fragments. mRNA is
translated three base-pairs at a time. These three-base-pair units are known as codons and there are
64 different codons in the universal genetic code. Each codon codes for one amino acid to be
included in the polypeptide chain. Once mRNA is transported out of the nucleus a ribosomal unit is
attached to the 5´ end of it which facilitates the addition of complementary tRNA to the mRNA
strand. Each tRNA molecule contains one codon and the specific amino acid coded for by that
codon. When the mRNA is completely translated into tRNA the polypeptide chain assembled
alongside the chain is bonded together to form the completed polypeptide chain1-5
.
Polypeptide Chain
Free tRNA
mRNA:tRNA duplexmRNA Strand
RIBOSOMERIBOSOME
amino acids
Figure 3: Simplified diagram showing polypeptide synthesis translation of mRNA

5
1.2 Anti-Sense Therapies
Many diseases are caused by the mis-expression of proteins i.e. under-expression or overexpression
of a certain protein or proteins containing flaws such as the inclusion of extra or incorrect amino
acids in the polypeptide chain. Therefore many conventional drugs focus on protein targets.
However, developing these drugs can be time consuming and expensive and involve a lot of trial
and error. The concept of anti-sense therapies is that small chains of modified or unmodified DNA
or RNA can be synthesised that are complementary to specific sections of DNA or RNA genes that
are involved in the biosynthesis of proteins causing pathology. Anti-sense therapies therefore focus
on addressing the root cause of the protein mis-expression: the genes, rather than targeting the
proteins themselves. The term ‘anti-sense’ is employed as the coding strand of the DNA double
helix is known as the ‘sense’ strand and its complementary strand is known as the ‘anti-sense’
strand. Providing that an appropriate DNA sequence can be identified to affect the expression of the
protein in question this method can be highly selective as any DNA sequence consisting of 17
nucleotides or above occurs only once in the entire genome.
This methodology was first proposed by Zamnecnik and Stephenson7 in the 1970s. Since then many
studies have looked at applying anti-sense techniques to provide therapeutic ageints for the
treatment of a variety of diseases such as Alzheimer’s disease8, rheumatoid arthritis
9, viral
infections10
and Duchenne muscular dystrophy11
. Therefore synthesising oligonucleotide sequences
that are complementary to DNA/RNA targets allows simple Watson and Crick base pairing to occur
bonding the oligonucleotide to its target. Though this may sound simple, since Watson and Crick
base pairing has been established for decades, the use of synthetic oligonucleotides to alter protein
synthesis is extremely complicated and therefore there are several mechanisms by which these
therapies take effect.

6
1.2.1 Steric Blocking
Oligonucleotides acting through steric blocking use sequences that are complementary to the
terminal end of a target strand of DNA or mRNA that is responsible for coding a particular protein.
As the name suggests, these therapies work by forming a DNA:anti-sense or mRNA:anti-sense
complex that is strongly bound and thus forms a steric barrier. The resulting complex prevents
transcription (in the case of DNA:anti-sense complexes) or the downstream processes of translation
or splicing (when the target is an mRNA strand)3,5,7
. This mechanism of action is extremely
versatile and can be employed to many targets to prevent genetic processing. There are no specific
structural features necessary in the synthetic oligonucleotide for this mechanism to be employed,
the molecules simply has to bind strongly to its target5-7
.
Figure 4: Simplified Diagram of a steric-blocking anti-sense therapy blocking translation of mRNA
As stated above, whilst the majority of therapies employing this strategy work at the transcription12
or translation13
level, some oligonucleotides have been reported to affect the splicing of pre-RNA to
mature RNA14
or to prevent translocation of mRNA across the nuclear membrane by forming an
mRNA:anti-sense complex inside the nucleus15
.
Though this mechanism of action of oligonucleotide therapies is extremely versatile it is quite
demanding in terms of the dose of oligonucleotide required as the effect is only observed whilst the
oligonucleotide is bound to its target. Larger doses of these oligonucleotides are therefore required
to be effective therapies16
.
No Translation
Anti-sense molecule
Target mRNA sequence
RIBOSOME
X
Strongly bound mRNA:anti-sense complex

7
1.2.2 Exon-Skipping Mechanism
Exon-skipping is a type of steric-blocking utilised by some anti-sense oligonucleotide therapies17
.
Exons are the sequences of mRNA that make up the final mature mRNA sequence. After DNA is
transcribed into pre-mRNA, sections of nucleotides known as ‘introns’ are cut out and the resulting
pieces (exons) are spliced together to make up the final mRNA sequence1,2,4
.
The exon skipping mechanism is similar to a steric blocking mechanism in that the oligonucleotide
blocks the ribosome binding to the mRNA. However, in an exon skipping mechanism, the
therapeutic oligonucleotide binds to a specific exon (the section of the mRNA responsible for the
pathology of the disease) within the mRNA sequence rather than at the terminal end. This type of
interaction does not prevent the ribosome from binding to the mRNA sequence but rather blocks the
translation of the particular section to which it is bound. This allows some of the RNA to be
translated into a polypeptide chain but skips misinformation thus synthesising an incomplete but
functional protein18,19
. This mechanism relies on the fact that the protein would still be functional
without the inclusion of the small section coded for by the ‘skipped’ exon.
Figure 5: Simplified Diagram of an exon-skipping anti-sense therapy blocking translation of specific exons to generate
abridged but functional proteins
Ribosome
Abridged but functional polypeptide chain
Synthetic Oligonucleotide
Translation is blocked and so ribosome 'skips' the blocked
exon
Target RNA Strand RNA:Anti-sense duplex

8
In 2016 the exon-skipping drug ‘Eteplirsen’ from Sarepta Therapeutics was granted accelerated
approval from the FDA as a treatment for Duchenne muscular dystrophy. This particular molecule
contains 30 nucleotide units (a ‘30mer’) and has a full morpholinodiphophoramidate backbone (see
section 1.3)20
however similar candidates have also been proposed containing full 2´OMe-
phosphorothioate backbones21
.
Duchenne muscular dystrophy (DMD) has many manifestations from exon deletions, exon
duplications or specific nucleotide mutations in the gene coding for the dystrophin protein; a key
structural component in skeletal muscle22
. The condition affects approximately 1 in every 3500
new-born boys and causes extreme muscle weakness, early loss of ambulation (pre-10 years old)
and typically death between the ages of 20 and 35 years old. The gene contains 79 exons and over
3600 base pairs23
.
The exon-skipping anti-sense therapies used to treat the condition target exon 51 of the dystrophin
gene. These compounds bind to exon 51 of the mRNA strand coding for the defective dystrophin
protein prior to splicing and translocation out of the nucleus. This causes exons 50 and 51 to be
omitted from the mature mRNA sequence which can then be translated into a polypeptide chain via
the normal mechanism (Fig. 3)21
. This causes the synthesis of a truncated but functional polypeptide
chain. Though Eteplirsen was only found to afford patients 1% of the amount of functional
dystrophin protein seen in the normal population, other candidates have shown levels of between 3-
12% of the amount of the protein21
, a significant increase in patients whose natural, functional
dystrophin production is negligible.
Due to the diversity of the manifestation of DMD, it is estimated that therapies targeting exon 51 of
the dystrophin gene are able to treat around 16% of the patient population and the therapy must be
administered for the rest of the patient’s life21
. This is nevertheless a promising example of the
ability of anti-sense therapies to treat life threatening diseases that current medicines are only able
to manage the symptoms of.

9
1.2.3 RNase-H Activation
RNase-H is a non-specific enzyme which hydrolyses the sugar-phosphate backbone of the mRNA
strand in free DNA:mRNA complexes during DNA replication generating free DNA and short
sections of the mRNA primer3,5
. The function of RNase-H is to prevent translated newly
synthesised mRNA from remaining bound to their template DNA for too long as this can prevent
protein synthesis and reformation of the DNA double-helix structure. It must be stressed that
RNase-H is only able to hydrolyse the mRNA strand and is inactive towards DNA polymers.
Oligonucleotides can activate RNase-H enzymes by forming mRNA:oligonucleotide complexes
with the target mRNA. In order to activate this process, the RNase-H enzyme must recognise this
oligonucleotide:RNA complex as a natural DNA:mRNA complex. The mRNA strand will then be
cleaved in order to generate free oligonucleotide. Since most backbone modifications render
oligonucleotides unrecognisable to RNase-H an essential inclusion in an anti-sense oligonucleotide
employing this mode of action is an unmodified section of the backbone; i.e. a small section
replicating wild-type DNA24
. This of course increases the therapy’s susceptibility to hydrolysis in
vivo and may make it less likely that the sequence will be able to cross the phospholipid bi-layer of
the cell due to the increased negative charge on the backbone16
.
Activating RNase-H is a desirable method of action of therapeutic, synthetic, anti-sense
oligonucleotides since molecules acting in this way are able to bind to multiple targets, generating a
catalyst-like effect.
Figure 6: Simplified Diagram of RNase-H activation by synthetic oligonucleotides
Synthetic DNA Oligonucleotide
RNAse H
RNA:Anti-sense duplex
Target RNA Strand
RNAse H
RNAse H hydrolyses natural RNA strand.Synthetic oligonucleotide can
now bind with another target

10
1.3 Oligonucleotide Modifications
Though anti-sense therapies offer the possibility of an effective, selective and easily synthesised
treatment for many diseases, oligonucleotides present several problems in terms of their physical
properties17
. Wild-type or natural oligonucleotides containing DNA or RNA units linked together
via the sugar-phosphate backbone are very large molecules, with molecular weights in the order of
103 gmol
-1, and carry extremely large negative charges
17. This poses problems in terms of cell
uptake as such large, highly charged molecules have trouble crossing the hydrophobic phospholipid
bi-layer of cells25-27
. The second problem posed by these unmodified oligonucleotides is the fact
that they are extremely susceptible to hydrolysis by nuclease enzymes. These difficulties can be
largely overcome by modifying the synthetic oligonucleotide in one of several ways26,27
, each
presenting their own advantages and disadvantages.
1.3.1 Backbone Modifications
Modifications can be made to the phosphate-backbone of the oligonucleotide in which one or more
of the bridging or (more commonly) non-bridging oxygen atoms in the chain are exchanged with
different groups. Some are shown below (Fig. 7).
Figure 7: Examples of oligonucleotide backbone modifications

11
- - -....
Phosphorothioate Phosphordiothioate
....
1.3.1.1 Phosphorthioates and Phosphorodithioates
Figure 8: Phosphorothioate and phosphorodithioate linkages
The phosphorothioate linkage differs from the natural phosphodiester-type back bone in that it has
one of the non-bridging oxygen atoms replaced by a sulfur atom. Naturally occurring
phosphorothioate linkages have been found in the DNA of certain bacteria28
. These types of
derivatives have also been used to study enzyme stereochemistry29
since the incorporation of sulfur
into the phosphate backbone generates chirality at phosphorus. The resultant diasteroisomers show
resistance and susceptibility to different enzymes, for example, snake venom phosphodiesterase
(SVP) was found to hydrolyse the Rp diastereosiomer, leaving the Sp isomer in-tact whilst nuclease
P1 cleaved the Sp configured linkages and was inactive towards the Rp30
.
These functional groups are now widely being employed as a non-bridging backbone modification
in anti-sense therapies. The presence of the chiral phosphorus centres has been shown to decrease
the overall binding efficiency of the oligonucleotide to its target as only the Rp isomer binds more
strongly since the orientation of the Sp isomer is helix destabilising31,32
. The chirality also has
implications on nuclease resistance. Incorporation of sulfur into the phosphate backbone of the
molecule increases nuclease resistance. However, it has been shown that whilst the Sp
diasteroisomer is entirely resistant to endo- and exonucleases, the Rp diastereosiomer is sensitive to
such enzymes, albeit only slightly33
.

12
Though attempts have been made to synthesise diastereomerically pure phosphorothioate
linkages32,34
these have often either shown low diastereomeric selectivity or incompatibility with
current oligonucleotide synthesis techniques. An alternative to this is to replace both of the non-
bridging oxygen atoms with sulfur, generating phosphorodithioate group which are non-chiral at
phosphorus. As these molecules do not have chiral phosphorus centres they show increased duplex
stability when compared to phosphorothioates and similar aqueous solubility to both
phosphorothioates and phosphates. However, these molecules show a highly increased
susceptibility towards nuclease hydrolysis compared to phosphorothioates35,36
.
The charge distribution of phosphorothioates is slightly different to that seen in the phosphate
group. The wild-type phosphate groups are able to distribute their negative charge over both of the
non-bridging oxygen atoms whereas NMR studies have shown that in phosphorothioates, the
negative charge is largely on the sulfur atom. This gives the non-bridging oxygen a double bond to
phosphorus37
. The negative charge on sulfur greatly increases aqueous solubility. Suprisingly, due
to the polarisability of the thioate anion, this functionality also facilitates cell uptake, meaning that
phosphorothioates also have favourable cell absorption as compared with the wild-type33,38
. Perhaps
the most important aspect of the use of phosphorothioates is that they are able to activate RNAse H
enzymes when complexed with the target DNA5.
Synthesis of phosphorothioate containing oligonucleotides can be performed in many different
ways, using many different reagents. The first instance of the synthesis of oligonucleotide
phosphorothioates was described in 197039
and involved the oxidative sulfurisation of phosphite
triesters using elemental sulfur in pyridine. Since then, many novel sulfur transfer reagents have
been developed (detailed in section 1.6.2) that are compatible with most synthesis and coupling
methodologies. Synthesis of phosphorodithioates is acheived in much the same way as that of
phosphorothioates except that a protected phosphorothioamidite reagent must be generated in-situ
prior to the coupling step. Also, whilst di-isopropyl phosphoramidites are the reagent of choice for
phosphorothioate synthesis, the steric bulk of these compounds results in low coupling efficiency
during phosphorodithioate synthesis40
.

13
1.3.1.2 Alkylphosphonates
Alkylphosphonates are oligonucleotides in which one of the non-bridging oxygen atoms in the
natural phosphodiester groups along the backbone of the molecule is replaced with an alkyl group14
.
The major advantage of using this modification is that the resulting phosphorus species is neutral.
This alters the mechanism of absorption in to cells, allowing passive diffusion across membranes
rather than entering via endocytosis, as is the case with wild-type or other modified
oligonucleotides41,42
.
These modifications also generate a chiral phosphorus centre. This has resulted in conflict in the
literature as to whether this chirality is an advantage or disadvantage as it has both been shown that
the stability of many duplexes of methylphosphonates is not influenced by the stereochemistry at
phosphorus35,43,44
, and conversely, that duplex stability suffers when the methyl group is pointing
into the major groove of the duplex due to steric repulsion35
. Nevertheless, the elimination of
electrostatic repulsion between the oligonucleotide and its target, caused by the lack of charge in
this group, appears to have favourable results in terms of binding affinity. A further advantage of
the inclusion of this modification into oligonucleotide chains is that they are resistant to hydrolysis
by endo- and exonuclease enzymes45
. However, this biological stability eliminates the ability of
molecules of this type to activate RNAse H.
There are many reported methods of synthesis of these modifications. The most efficient
methodologies, however, involve the use of either alkyl phosphonoamidites46
as starting materials
or the addition of alkyl groups via Arbuzov-type reactions47
(scheme 1).
Scheme 1: Synthesis of methylphosphonates via the phosphonoamidite method (top) and the Arbuzov reaction (bottom)
1. 1H-Tetrazole2. I2/H2O
CH3I
CH3CH2I
Phosphonoamidite Method
Arbuzov Method

14
1.3.1.3 Phosphoramidates
Phosphoramidates include the replacement of one of the non-bridging oxygen atoms with an amine
group. These groups again generate chirality at phosphorus and so show decreased duplex stability.
However, these groups have been shown to have increased binding efficiency at lower pH due to
protonation of the amine group.
Modifying oligonucleotides in this way increases resistance to nuclease hydrolysis. However,
oligonucleotides in which every phosphate group is replaced with a phosphoramidate group show
decreased duplex stability due to distortions occurring in the molecule35,48
. As with
alkylphosphonates, phosphoramidates are unable to activate RNase-H enzymes and as such must
act only in steric blocking pathways when used as anti-sense therapies.
Again, there have been many synthetic methods reported for these compounds. These, however,
often involve the use of extreme conditions which are incompatible with modern solid-phase
synthesis routes such as reflux or elongated reaction times49
. The easiest method (and most widely
compatible with solid phase techniques) involves the oxidation of phosphite triesters by iodine in
the presence of alkylamines.This generates the desired phosphoramidite; however, yields can often
vary between 50-90%50
.
Scheme 2: Synthesis of phosphoramidates via oxidation of phosphite triesters in the presence of amine

15
1.3.1.4 Boranophosphates
Boranophosphates are chiral phosphate analogues in which a borane group has been introduced to
replace one of the non-bridging oxygen atoms (Fig. 7). These can be considered a hybrid between
the polar PO and PS linkages and the non-polar alkylphosphate linkages since the negatively
charged borane group is isoelectronic with the chalcogen derivatives and isostructural with the alkyl
analogue. Much like the wild-type phosphate linkage, the boranophosphate group has a permanent
negative charge and therefore displays reduced binding affinity when compared with other
analogues due to steric repulsion45
. However, this functionality shows excellent nuclease stability
and, unlike alkylphosphonates and phosphoramidates, this linkage is also stable to extreme reaction
conditions and extreme pH51
.
Synthesis of these compounds can be performed easily and in a similar manner to that of modern
oligonucleotide synthesis methods by using boronated phosphoramidites as the coupling substrate51
.
1.3.1.5 Exchange of the Bridging Oxygens and Dephospho Analogues
Exchange of the non-bridging oxygen atoms in the phosphate linkage provides possible solutions to
problems with solubility, membrane translocation and binding affinity. Many of these modifications
have also been shown to be applicable, in principle to the bridging oxygen atoms also, such as
bridging phosphorothiolates52
, methylene bridged phosphonates53
and bridging
phosphoroamidates54
. These groups all provide the desirable properties associated with removing
the negative charge and eliminating chirality at phosphorus to improve overall binding efficiency
and, in the case of the charge minimisation, improvement in transport across the cell membrane
with minimal steric demand. However, changing the chemistry at the bridging oxygen atoms can
have a much more drastic effect on the stability of the resultant complex than exchange of non-
bridging oxygens. For example, exposing bridging phosphoramidates to acetic acid at room
temperature causes cleavage of the strand55
whereas treating a non-bridging phosphoramidate with
acid can in fact cause increased duplex stability.
Similarly, it has proved possible to synthesise dephospho inter-nucleotide bridges which also meet
these criteria such as replacement of the phosphate group with a siloxane56
, carbonate 57
or amide
linkage to name but a few58
(Fig. 9).

16
Figure 9: Various dephospho and bridge modified oligonucleotide linkages
The major issue with these functionalities is that they are generally incompatible with solid phase
synthesis, requiring high temperatures or complex multi-step syntheses. Due to the difficulty in
their manufacture few dephospho-oligonucleotides have ever been synthesised larger than trimers.
One way to avoid this issue is to synthesise a dimer which can then be phosphitylated to form a
phosphoramidite which can then be used as a coupling reagent in the phosphoramidite synthesis
method. Whilst this may seem like a plausible solution, this greatly increases the cost and
complexity of the synthesis and results in a backbone with mixed functionality.
The most promising dephospho-oligonucleotide analogue currently is the replacement of the
phosphate group with a triazole linker using click chemistry as the coupling chemistry. This method
has been used in tandem with modern solid-phase methodology and is able to produce
oligonucleotides containing 100+ base units59
(scheme 3).
Scheme 3: Synthesis of dephospho-triazole-linked nucleotides using click chemistry

17
1.3.2 Sugar Modifications
Figure 10: Examples of sugar modifications used in therapeutic oligonucleotides
Oligonucleotides have also been reported that feature modifications to the nucleotide sugar
unit35,60,61
. Altering nucleotides in this way has been proven to greatly increase nuclease resistance.
For example, linkages comprised of nucleotides in which the furan oxygen is replaced with sulfur
display hydrolysis rates of around nine times slower than the natural nucleotides62
, whilst replacing
the furanose oxygen with a methylene group renders the linkage almost completely resistant to all
tested nuclease enzymes63
. Modifications of this type have little or no effect on duplex stability 64-66
.
The most common sugar modifications used in therapeutic oligonucleotide are modifications at the
2′ position of the sugar. An electronegative group at this position, such as methoxy or fluoro groups,
promote a favourable C2-endo gauche conformation of the sugar (Fig. 11) The gauche relationship
refers to the orientation of the nucleobase group relative to the O of the furanose ring. This
increases the binding efficiency of the oligonucleotide:RNA duplex67
. Large alkyl groups at the 2′-
position decrease binding efficiency due to the steric bulk. Modifications of this type do increase
resistance to most nuclease enzymes compared to the natural RNA or DNA-type oligomers. A
disadvantage is that 2′-sugar modifications typically render the oligomer non-RNase-H active61
.
Figure 11: Diagram Showing C3-Endo and C2-Endo conformations of the ribose sugar ring and the resulting Newman
projections along the C1*-C2
* bond.
2' ModificationsX= OMe, F, OEt
-
-
-
X= S, CH2, NH Morpholino Nucleic Acid 2'-5' Linkage Locked Nucleic Acids (LNAs)
--
BASE H
*
C3 Endo Conformation
**
*
C2 Endo Conformation
BASE

18
1.4 Synthesis of Oligonucleotides
The first polynucleotide was synthesised, in solution, by Khorana and a team of researchers in
196068
using phosphate diester technology. At the time, there was no projected use for such
compounds and this was seen purely as a synthetic challenge. Several other solution phase
methodologies were later developed using phosphate triester of nucleic acids69
. Caruthers
introduced the idea of synthesising these molecules on a solid support in 198170
. The advantage of
using a solid-phase synthesis is that products do not need to be purified after each reaction step
since the product molecules are immobilised and the excess reagents can simply be washed away.
Whilst phosphochloridite chemistry can be applied to solid-supported methodology, the reactivity
of the starting materials meant that the use of this technology on a solid-support was not widely
adopted.
Today, oligonucleotide synthesis is almost exclusively carried out using solid-supported synthesis
in which the 3′ end of the chain is attached by a chemical linker to a polymer support. The
oligonucleotide is then synthesised by the addition of one nucleotide at a time to the 5′ end of the
growing polymer. The coupling reactions of these monomer units vary depending on both the
methodology used and the starting material (Fig. 12).
Figure 12: Coupling reagents used in various methods of oligonucleotide synthesis

19
1.5 H-Phosphonate Method
Scheme 4: General scheme for phosphorothioate synthesis via the H-phosphonate method
The H-phosphonate method of oligonucleotide synthesis was first proposed in 1957 but was not
actually implemented until 198671
. This method consists of two basic steps: activation
withactivating agent such as 2,4,6-triisopropylbenzenesulfonyl chloride, N,N-bis(2-oxo-3-
oxazolidinyl)- phosphorodiamidic chloride, diphenylchlorophosphate or pivaloyl chloride and then
reaction with a 5´-deprotected nucleoside. This cycle is repeated until the desired chain length is
attained. When the desired chain length is achieved, the resulting oligonucleotide is followed by a
functionalisation or oxidation step. Synthesis of oligonucleotides containing full phosphorothioate
backbones is possible using this method when the resulting H-phosphonate oligonucleotides are
treated with a solution of S8 in toluene72,73
(scheme 4). Oxidation to the natural phosphate backbone
is achieved by treating the H-phosphonate oligonucleotide with a solution of I2 in water.
The disadvantage of this cycle is that, unlike with the phosphoramidite method, no mixed
functionality can be achieved as only one oxidation step is carried out per synthesis. A further
disadvantage of this method is that the reagents are susceptible to side reactions with the activators
such as acylation72-75
. However, H-phosphonates are extremely stable starting materials requiring
no careful solvent drying or special handling procedures. They are unreactive towards any
nucleophilic impurities in solution (including water) meaning that coupling reactions using H-
phosphonate nucleotides does not require the large excess of starting material that, for example,
coupling phosphoramidites requires, making the H-phosphonate method an attractive alternative to
other popular synthesis methodologies.

20
1.6 Phosphoramidite Method
The phosphoramidite method of synthesising oligonucleotides is currently the most commonly used
method of synthesising long-chain oligonucleotides for pharmaceutical application. The modern
incarnation of this method is a solid-phase synthesis whereby the growing oligonucleotide chain is
bonded to a polymer support. The synthesis comprises four steps (scheme 5) which are repeated
until the desired chain length is reached. Once the desired chain length is reached the
oligonucleotides are cleaved from the polymer support and deprotected using base70,76
. The newly
synthesised oligonucleotides are then subjected to various purification steps.
Scheme 5:The synthesis cycle of a DNA oligonucleotide with phosphate backbone using tetrazole as the activator. 1.
Deprotection with dichloroacetic acid in toluene, 2a. Activation with 1H-tetrazole, 2b. Coupling, 3. Oxidation with
Iodine, 4. Capping with acetic anhydride.
BASE
3
4
2b
1
2a
BASE
I2

21
This method is widely employed due to the ease with which it can be performed and the variety of
functionality achievable via this method. The solid support methodology allows this synthesis to be
fully automated and the step-wise nature of the synthesis allows various different oligonucleotides
to be produced i.e. phosphorothioate, methylphosphonate, boranophosphate etc. It is possible to
generate chains with mixed functionality using this method since functionalisation takes place
directly after each coupling and not at the end of the synthesis as was the case with the H-
phosphonate method. The ease of manipulating backbone modifications is an advantage of the
initial generation of the P(III) linkage when using phosphoramidites as the coupling reagents.
This method was first developed by Caruthers in the 1980s. The original phosphoramidites used in
this synthesis were N,N-dimethylaminophosphoramidites which were activated by N,N-
dimethylaniline hydrochloride. However, since the introduction of the method, there has been a lot
of focus on improving and refining the procedure to make it more suitable to the modern demand
for these reagents. The nucleosides used in the synthesis are now generally 3′-β-cyanoethyl N,N-di-
isopropylphosphoramidites. The bulkier isopropyl substituents on the amine group render the
phosphorus centre in the molecule less reactive and therefore easier to handle70,76
.
The major disadvantage of using this chemistry is that activated phosphoramidites are highly
susceptible to hydrolysis by the water which is present in the solvent and so careful drying of
solvents and reagents must be carried out, though loss of yield due to hydrolysis is always expected
(scheme 6). Therefore, when implemented in an industrial setting, a large excess of coupling
reagents is used to force a complete reaction. This has major implications on the cost of the total
synthesis as well as the environmental impact.
Scheme 6: Hydrolysis of a phosphoramidite activated by 1H-tetrazole

22
1.6.1 Activation and Coupling of Phosphoramidites
The coupling step of the phosphoramidite synthesis cycle consists of the alcoholysis of the 3′-β-
cyanoethyl N,N-di-isopropyl phosphoramidite reagents by the free 5′-hydroxyl group of the growing
oligonucleotide chain. This reaction is responsible for extending the oligonucleotide chain. Neutral
phosphoramidites are generally quite resistant to nucleophilic attack and so this step only occurs in
the presence of an activator. The high cost of the phosphoramidite reagents means the choice of
activator is extremely important as the activator needs to afford high yielding coupling reactions
with a fast rate in order to avoid side reactions whilst ensuring the maximal number of couplings77
.
Research by Caruthers into novel activators led to the discovery that 1H-tetrazole (Fig. 13)provided
rapid rates of reaction with near quantitative conversion to the coupled dinucleotide whilst being
commercially available. It is generally accepted that the mechanism of activation of
phosphoramidites by 1H-tetrazole is one of general acid catalysis in which the phosphoramidite
group is protonated by the acidic activator (scheme 7.2). 1H-Tetrazole has a pKa of 14.5 in ACN78
which allows protonation of the phosphoramidite but does not cause any unwanted side reactions
such as depurination or detritylation which occurs with the use of other, stronger acids76,77,79
. This
compound therefore remains a popular choice as an activator. Disadvantages of using 1H-tetrazole
are that it is expensive, toxic and potentially explosive70,76
. Therefore further research has gone into
identifying alternative activators.
.
Figure 13: 1H-Tetrazole

23
1.6.1.2 Nucleophilic substitution during coupling
The reaction of the activated amidite with the 5′OH group of the oligonucleotide chain occurs via a
nucleophilic substitution reaction. This could either occur by direct attack of the alcohol group on
the phosphorus or it could proceed via an intermediate formed by reaction with the activator i.e. by
nucleophilic displacement of the amine group of the amidite by the conjugate base of the
deprotonated activator. It is worth noting that an attractive proprty of tetrazoles in this regard is that
whilst they are relatively acidic, the conjugate base of these acids (tetrazolide ions) are also
reasonable nucleophiles. To determine whether the alcoholysis occurs by attack directly at the
phosphoromadite or whether is occurs via a tetrazolide intermediate, nucleoside tetrazolide species
were synthesised and isolated. The 31
P NMR shifts of these compounds are similar to those found in
reaction mixtures when tetrazole is used as an activator during the reaction. This is indicative of
nucleophilic attack by the tetrazolide on the protonated phosphoramidite70,79
(scheme 7).
Regardless of the mechanism of nucleophilic attack, every coupling step generates one molar
equivalent of di-isopropylamine. The nature of the tetrazole-based activator system is such that a
salt is formed between the acidic activator and the basic leaving group80,81
. This stops the activator
from acting as a catalyst since one molar equivalent of activator becomes involved in acid-base
equilibria with the amine leaving group. Studies have shown that removing the generated amine
with 10Ǻ molecular sieves allows the activator to act catalytically80
.
1.6.1.3 Phosphoramidite protonation
It has been proposed that protonation of the amidite could occur either at the phosphorus centre77,82
or on the nitrogen atom of the di-isopropylamine group83
. Molecular modelling work however has
shown that protonation of the phosphorus shortens, and therefore strengthens, the P-N bond
whereas protonation of the nitrogen lengthens and therefore weakens the P-N bond. This therefore
indicates that protonation of the nitrogen generates a more reactive species than a P-protonated
system84,85
. This was supported by work done by Nurminen et al who showed by NMR that the rate
of coupling was slower when P protonation occurred78,83
. During this work, Nurminen also showed
that P-protonation was indeed possible, however, this requires acids with pKa in acetonitrile of less
than 10. The use of acids of this strength is undesirable under the conditions of the phosphoramidite
synthesis as it increases the risk of side reactions occurring including depurination.
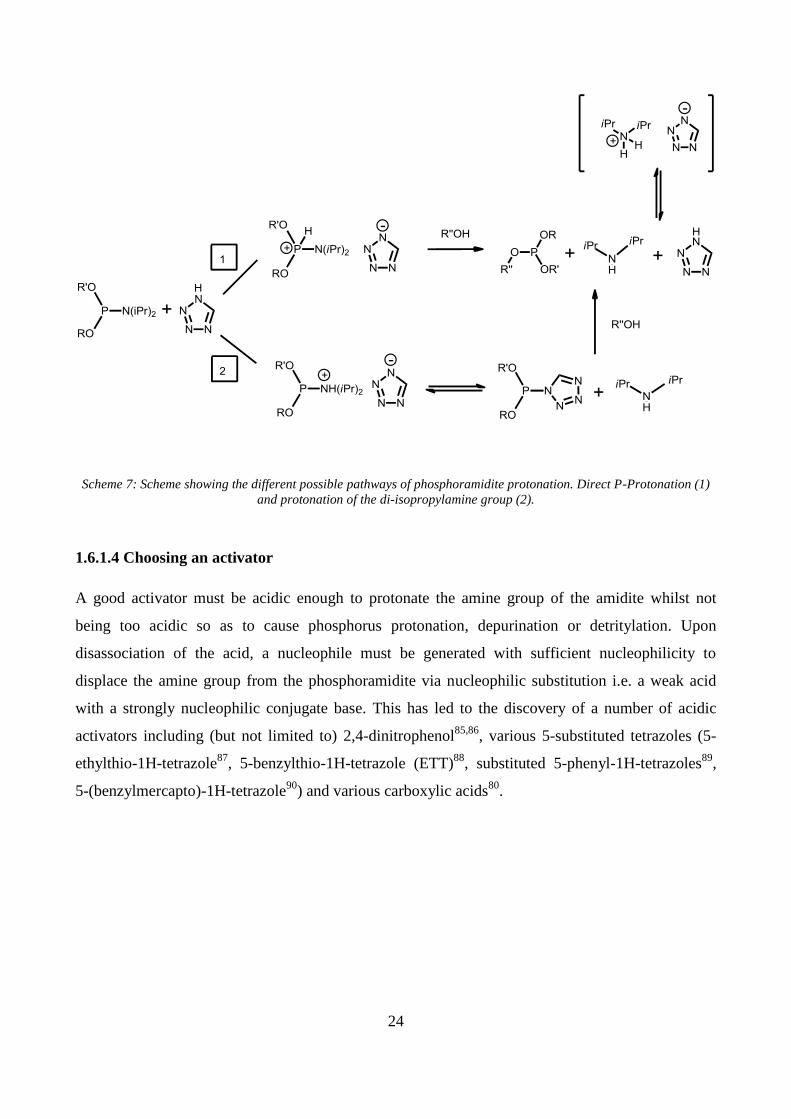
24
Scheme 7: Scheme showing the different possible pathways of phosphoramidite protonation. Direct P-Protonation (1)
and protonation of the di-isopropylamine group (2).
1.6.1.4 Choosing an activator
A good activator must be acidic enough to protonate the amine group of the amidite whilst not
being too acidic so as to cause phosphorus protonation, depurination or detritylation. Upon
disassociation of the acid, a nucleophile must be generated with sufficient nucleophilicity to
displace the amine group from the phosphoramidite via nucleophilic substitution i.e. a weak acid
with a strongly nucleophilic conjugate base. This has led to the discovery of a number of acidic
activators including (but not limited to) 2,4-dinitrophenol85,86
, various 5-substituted tetrazoles (5-
ethylthio-1H-tetrazole87
, 5-benzylthio-1H-tetrazole (ETT)88
, substituted 5-phenyl-1H-tetrazoles89
,
5-(benzylmercapto)-1H-tetrazole90
) and various carboxylic acids80
.

25
1.6.2 Sulfurisation step
Phosphorothioate modified oligonucleotides are extremely popular structures to use as potential
therapeutic agents due to their increased nuclease resistance and their improved cell uptake
compared to the wild-type phosphate oligonucleotides. These molecules can be readily synthesised
on a solid support. If using the phosphoramidite method, sulfurisation involves the oxidative
transfer of sulfur to the P(III) inter-nucleotide linkage from an appropriate sulfur transfer reagent
after each coupling reaction.
Traditionally, elemental sulfur91
was used as the sulfurising agent in such reactions. However,
inefficient sulfur transfer and the general low solubility of sulfur in most solvents led to the
development of other more efficient sulfurising agents such as 3H-1,2-benzodithiol-3-one 1,1-
dioxide (Beaucage reagent)92
, 3-amino-1,2,4-dithiazole-5-thione (Xanthane Hydride)93
, 3-Methyl-
l,2,4-dithiazolin-5-one (MEDITH)94
, 3-ethoxy-1,2,4-dithiazoline-5-one (EDITH)95
and phenylacetyl
disulfide (PADS). The most notable of these is the ‘Beaucage Reagent’ (Fig. 14). This compound
was widely adopted as the sulfurising agent of choice because of its extremely efficient sulfurising
ability. However, synthesis of this compound requires a long, multi-stage synthetic process and it is
therefore fairly expensive. Sulfurisation using this compound also forms potentially oxidising side
products. More recently, the industry has largely moved away from using this compound and now
favours the cheap and efficient phenylacetyl disulfide (PADS) which can be easily synthesised from
Na2S2 and phenylacetic acid96-98
.
Figure 14: Various novel sulfur-transfer reagents used in phosphorothioate synthesis
The common feature amongst these novel sulfur transfer reagents is the presence of a sulfur-sulfur
bond. Largely, the proposed mechanism for sulfurisation of phosphite linkages is that of
nucleophilic attack on the sulfur-sulfur bond (contained in all of these molecules) by the
nucleophilic phosphorus(III) centre93,99
.
Beaucage Reagent Xanthane Hydride MEDITH EDITH PADS

26
1.6.2.1 Overview of Disulfides
Disulfide bonds are ubiquitous in nature. They are important structural elements in the quaternary
structure of proteins, for example the hormone insulin, and they are also found in a range of other
naturally occurring compounds such as several toxins and various seaweed and plant extracts100
.
Disulfide bonds are the third strongest homo-covalent bonds known with a bond dissociation energy
of 265 kJmol-1 101
. The strength and length of the S-S bond is also fairly independent of the
electronic or steric properties of the groups bonded to the sulfur atoms with the bond lengths of
Cl2S2, Me2S2 and H2S2 varying by only 0.01Ǻ100
.
Figure 15: Oxidation of glutathione to form glutathione disulfide.
In proteins, disulfide bonds are formed by the oxidation of thiol groups in cysteine residues in the
protein. This thiol-disulfide interchange also plays a key role in the function of the anti-oxidant
glutathione (Fig. 15)102
, however, this is not limited to biological systems. Data have shown that
many thiols will readily form disulfides with mercaptoethanol and dithioethreitol, oxidising at
neutral pH in 50% v/v methanol/water at 25oC
103. This suggests a high reactivity of disulfides
towards sulfur nucleophiles.
Though disulfides show reactivity towards strong electrophiles and radicals, the broadest category
of reactivity of disulfides is towards nucleophiles. Disulfides show excellent reactivity towards a
broad range of nucleophiles, the most thiophilic nucleophiles being phosphites100
. Reaction of
phosphites with disulfides usually proceeds via nucleophilic attack by phosphorus to generate a
phosphonium intermediate followed by decomposition to form a phosphorothioate104
(scheme 8).

27
P(OR')3 + RSSR R-S-P+(OR')3 + RS- RSR + (R'O)3P=S
RSSSR' + R- RSSR + R'S- RSSR' + RS-
Scheme 8: General scheme for reaction of phosphites and sulfide anions with disulfides
However, a further important class of disulfide reactions is that with sulfur nucleophiles,
particularly S- anions and S· raidcals, mentioned previously. Disulfides are known to react with
sulfide ions to form asymmetrical disulfides or polysulfides
105 , the reaction products are dependent
upon the stability of the leaving group.
Polysulfides are highly reactive species and are known to be formed in many biological systems106
.
Thermal studies of organic polysulfides have shown that, upon heating, these molecules are able to
disproportionate and form an equilibrium between species with varying numbers of sulfur atoms.
For example, a solution of Me2S3 in CCl4 heated to 80oC for a period of 20 days was found to
contain a mixture of Me2S2 (21%), Me2S3 (62%), Me2S4 (14%) and Me2S5 (3%) determined by
monitoring the slightly different chemical shifts of the methyl protons in 1H NMR spectra of these
mixtures. The mechanism of this disproportionation is unclear, both radical and ionic mechanisms
have been proposed as the addition of a radical inhibitor is able to block the generation of the S4+
species when starting with S3 or S2 by quenching the S3.
radical, thus preventing the
disproportionation reaction. Also, sulfide anions are known to have poor delocalisation of charge
with neighbouring atoms. This is not the case with sulfur radicals and so the radical species are
stabilised to a greater extent than the anions with increasing sulfur chain length101
. However, the
initiation of the degradation of these alkyl polysulfides in the presence of heat is reported to be via
homolytic cleavage of and S-S bond and not via the cleavage of the C-S bond107
.

28
1.6.2.2 Sulfurisation of Phosphites Using PADS
Very few mechanistic studies have been undertaken on the sulfurisation of phosphites by PADS.
Nevertheless, the mechanism of action of PADS has been proposed (scheme 9)108
:
Scheme 9: Literature proposed mechanism for the sulfurisation of phosphites using PADS
However, it is widely known that solutions of freshly made PADS are not optimal96
sulfurising
agents. PADS is often made up in solutions containing up to 50% v/v 3-picoline in ACN or other
compounds such as pyridine or collidine108
. One suggestion is that sulfurisation generally occurs
more rapidly in solvents of higher dielectric constant109
and so adding co-solvents such as these
increases the dielectric constant and therefore the overall rate of reaction.
It is also widely accepted that the efficiency of PADS improves greatly upon ageing96
. Sierzchala et
al. stated that a solution of fresh PADS affords a 99.6% yield of phosphorothioate per cycle
whereas an ‘aged’ solution affords a 99.89% yield. This difference may appear small however when
extrapolated to afford, for example, a 20 nucleotide oligonucleotide this represents an overall yield
difference of 7.5%. Chromatographic data of solutions of fresh PADS compared to chromatograms
of ‘aged’ PADS show significant differences in the chemical composition96
such as the formation of
unidentified peaks in the chromatograms. Visual inspection of aged PADS solutions suggests
significant chemical change as there is a very distinct colour change from a pale yellow to a blue-
black colour with PADS solutions aged in 50% v/v 3-picoline/acetonitrile solution over 48 h.
Therefore in order to elucidate a mechanism of action of PADS it is important to quantify these
changes and identify any new compounds present in aged solutions of PADS.
+
.. -

29
1.7 General Aims of the Work
The general aims of the work are to investigate the mechanisms of the reactions involved in the
phosphoramidite method of oligonucleotide synthesis. The work will focus particularly on the
formation of new inter-nucleotide linkages via coupling of nucleoside phosphoramidites and the
sulfurisation of the newly-formed linkages using the sulfur transfer reagent PADS.
The investigation into the coupling reaction aims to analyse the kinetics of the activation of
phosphoramidites by tetrazole activators (mainly ethylthio tetrazole). Using NMR spectroscopy the
work aims to investigate the effect of substituents on the tetrazole ring and use these observations to
infer details of the transition state during the activation process. The work also aims to investigate
the ion-pairing behaviour between the acidic activator and the basic amine leaving group liberated
during this process by means of conductivity.
The majority of this thesis aims to elucidate the mechanism of sulfurisation of phosphites by the
sulfur-transfer reagent PADS under basic conditions. The work initially aims to identify and
characterise the active sulfur transfer species generated during the ‘ageing’ of PADS. Using
intermediate-trapping experiments and the synthesis of mechanistic probes the work also aims to
identify the mechanism by which the aging of PADS.
Using linear-free energy relationships the work aims to identify the mechanism of sulfur transfer
from PADS to phosphites to generate phosphorothioates. Of particular interest in this work is the
difference between the mechanisms of sulfur transfer using fresh PADS and aged PADS in order to
identify the origin of the vast differences in the rate of reaction using these species. The work aims
to make an accurate assessment of the role of the various pyridine bases used in both the aging of
PADS and the subsequent reaction between PADS and phosphites.

30
2. Experimental

31
2.1 Materials
All materials used during the work were of an analytical or equivalent grade if available. All
reagents and solvents were supplied by Aldrich, Fisher, Avocado, Alfa Aesar, Glenn Research and
Fluorochem with PADS being supplied by Carbosynth. Deuterated solvents were supplied by Goss
Scientific. All reagents were used as provided with no further purification. All solvents used were
stored over 3Ǻ molecular sieves which were activated by heating to 280oC overnight and cooled
under an atmosphere of nitrogen.
2.2 HPLC Method and Specification
All HPLC traces were acquired using a Shimadzu SIL 50AH instrument. The column used in all
cases was a Phenomenex Luna 5μ C18 4.67 × 250mm. The detection method used was a diode
array UV-Vis detector. Chromatograms were recorded at a wavelength of 260 nm. The method was
a gradient of water and acetonitrile as follows:
Time (min) % Acetonitrile Flow Rate (ml/min)
0 30 1
15 95 1
20 95 1
21 30 1
30 30 1
2.3 NMR Specification
All NMR experiments were performed using a 400 MHz Bruker Avance DP X400 NMR machine
unless stated otherwise. All solvents were deuterated and purchased from Goss Scientific unless
stated otherwise.
2.4 Infra-Red Spectroscopy
I.R. spectroscopy was performed using a Thermo-Electron Nicolet 380 ‘Smart Orbit’ FT-IR ATR
spectrometer.

32
2.5 Mass Spectrometry LC-MS Methods and Specification
Mass spectra were recorded using an Agilent 6210 tine-of-flight mass spectrometer. Data was
acquired at a 2 GHz dynamic range scanning at a rate of 5.00 spectra per second with a m/z range of
80-1700 m/z. Gas flow was kept at 10 L per minute at a temperature of 350oC. When LC-MS was
performed the HPLC system was an Agilent 1200 series HPLC using a diode array detector. This
was fitted with a Phenomenex Luna 5μ C18 2.4 x 250mm column and the method used was as
follows:
Time (min) %
Acetonitrile
Flow Rate
(ml/min)
0 30 0.2
15 95 0.2
20 95 0.2
21 30 0.2
30 30 0.2
2.6 Conductivity Measurements
Conductivity measurements were taken using a Metrohm five-ring conductivity cell with 856
conductivity module using tiamolight software for kinetics measurements. All conductivity
measurements were recorded in a 20 ml jacketed cell kept at a constant temperature of 25oC.
2.7 General Method of Generating Aged PADS Solutions
A solution of PADS (1 M) was made up in a solution of 3-picoline (5 M) in acetonitrile and left to
age for 48 h. At T=n h a 1 ml sample of this was removed and quenched in dilute hydrochloric acid
(10 ml, 2 M) in order to remove the 3-picoline as the protonated pyridinium species. The organic
species were then extracted with DCM (2 × 10ml). The aqueous layer was discarded. The organic
layers were collected and dried over anhydrous sodium sulfate which was removed by gravity
filtration. The solvent was then removed under vacuum. The resulting oil was then made up to 1 ml
in deuterated acetonitrile.

33
2.8 General HPLC Degradation Kinetics Method
A solution of PADS (1000 ppm, 3.3 mM) was made up in a solution of 3-picoline (0.5-5 M) in
HPLC-grade acetonitrile. Naphthalene (100 ppm, 0.8 mM) was added as an internal standard. Due
to the size of the HPLC vials used and the sample sizes required, it was necessary to split this
solution between two HPLC vials which were inserted into an auto-samplerand chromatograms
were recorded every 30 min for 48 h. The chromatographic method is stated in section 2.2.
2.9 General NMR Sulfurisation Kinetics Method
A mixed equimolar solution of triaryl phosphite and triphenyl phosphine oxide (0.05-1 M, 50-200
μL) in deuterated acetonitrile was added to an NMR tube (note that the triphenyl phosphine oxide
was added as an internal standard). This was mixed with 3-picoline (0.5-10.2 M, 8-200 μL) in
deuterated acetonitrile. At T=0 PADS solution (50-200 μL, 0.5-3 M) was added to the mixture. If
necessary deuterated acetonitrile was also added in order to make-up a total reaction volume in all
cases of 600 μL. 31
P NMR spectra were recorded approximately every 90 s until the reaction was
deemed complete. The reaction was deemed complete when the peak corresponding to the
phosphite starting material was no longer visible.

34
2.10 Experimental – Ageing PADS
2.10.1 Analysis of Aged PADS Solutions
A solution of PADS (1000 ppm, 3.3 mM) was made-up in a solution of 3-picoline (5 M) in HPLC-
grade acetonitrile and were left for 1 week. At t=n h 20 μL aliquots of these solutions were analysed
using the HPLC system and method described in section 2.2. At these time points, 20 μL samples
were also submitted for LC-MS analysis using the method detailed in section 2.4. To analyse aged
PADS mixtures by NMR, a solution of PADS (0.2 M) and 3-picoline (0.4 M) was made up in
deuterated acetonitrile and left for 1 week. Again, at t=n h 1H and
13C NMR spectra were recorded.
2.10.2 Dependence of PADS Decomposition on 3-Picoline Concentration
Seven solutions of PADS were analysed as described in section 2.6; each solution contained a
different concentration of 3-picoline such that solutions containing 0 M, 0.5 M, 1 M, 1.5 M, 2 M,
2.5 M and 5 M 3-picoline were analysed. The rate of reaction was assessed by monitoring the
change in the ratio of the peak area of the peaks corresponding to PADS and to that of the internal
standard (naphthalene) over time.
2.10.3 Effect of Pyridine pKa on the Rate of Degradation
A solution of PADS (1 M, 300 μL) in deuterated acetonitrile was added to an NMR tube. At T=0 a
solution of 3-picoline (5 M, 300 μL) was added to this and a 1H NMR spectrum of this solution was
taken. Further 1H NMR spectra were taken periodically over a period of 48 h. The concentration of
PADS was assessed by monitoring the change in the ratio of the PADS methylene peak and the
PADS aromatic peak region. This was repeated several times under identical conditions but the 3-
picoline was replaced for an equimolar amount of 4-pyridinecarbonitrile, 3-pyridinecarbonitrile, 3-
chloropyridine, pyridine, 3-methoxypyridine, 4-methoxypyridine, 2,6-dimethylpyridine and
triethylamine. Note that the data for triethylamine are not included as the reaction was too fast to
monitor the disappearance of PADS.

35
2.10.4 Reaction of 3-Picoline with Phenylacetyl Chloride
To a 5 ml vial was added phenylacetyl chloride (100 μL, 116.9 mg, 0.75 mmol) and the solution
was stirred. To this, 3-picoline (146 μL, 140 mg, 1.5 mmol) was added dropwise. The reaction was
complete almost instantaneously as the reaction mixture solidified. This was diluted to 5 ml using
HPLC-grade acetonitrile and were further diluted by a factor of 100. This solution was then
analysed by mass spectrometry and the products identified as stated in the discussion.
2.10.5 Assessment of the Rate of Decomposition of Phenyl-Substituted PADS Analogues
The rates of decomposition of 2,2´-(4-fluorophenyl)acetyl disulfide (section 2.11.16),, 2,2´-(4-
chlorophenyl)acetyl disulfide (section 2.10.19), 2,2´-(3-chlorophenyl)acetyl disulfide (section
2.11.17) were assessed via the method described in section 2.6. The concentration of 3-picoline in
these solutions was 1 M.
2.10.6 Deuterium Exchange with PADS
A solution of PADS (0.2 M, 400 µl) in deuterated acetonitrile was added to an NMR tube with D2O
(50 µl). At T=0 3-picoline (15.5 µl, 16.2 mg, 0.17 mmol) was added to the reaction mixture and the
tube inverted to mix. 1H NMR spectra of this mixture were recorded approximately every 2 min
until no signal corresponding to the PADS CH2 or CHD could be observed and the reaction was
complete.
This process was repeated twice under identical conditions but using 31 µl and 7.5 µl of 3-picoline.
This process was also repeated replacing the D2O with an equal volume of ultra-pure H2O.

36
2.10.7 Deuterium Exchange with Phenyl-Substituted PADS Analogues
The above reaction (2.10.6) was repeated several times under identical conditions replacing PADS
with an equimolar amount of 2,2´-( 4-methoxyphenyl)acetyl disulfide (section 2.10.21), 2,2´-(4-
chlorophenyl)acetyl disulfide (section 2.10.19) and 2,2´-(4-cyanophenyl)acetyl disulfide (section
2.10.20).
2.10.8 Trapping the Ketene Generated During Ageing of 2,2´-diallyl-2,2´-phenylacetyl
disulfide
The cycloaddition product 7,7a-dihydro-1H-cyclobuta[a]inden-2(2aH)-one was synthesised
according to the method described in section 2.9.16. This was characterised by NMR and M.S.
which were used as reference spectra in order to identify the presence of this species in aged PADS
mixtures.
A mixture of 2,2’-(σ -allylphenyl)acetyl disulfide (330mg, 0.852mmol) and 3-picoline (165.6 µl,
1.7 mmol) in acetonitrile (10 ml) was heated to reflux for 2 h. The reaction was followed by HPLC
and was complete after 2 h. This reaction was not purified further as mass spec and NMR analysis
showed evidence of the product 7,7a-dihydro-1H-cyclobuta[a]inden-2(2aH)-one. HRMS (m/z):
[M+H]+ for C11H10O, calculated 159.0809, measured 159.0804.

37
2.10.9 Separation of the Products of PADS Ageing by HPLC
A solution of PADS (3 M, 1 ml) was aged for 48 h and the products extracted according to the
method described in section 2.6. This solution was then separated using an Agilent 1200 series
HPLC system using the column and method described in section 2.2. This system was fitted with an
Agilent 1200 series quantitative fraction collector. Ten unique fractions were collected,
concentrated and fractions were combined over many runs. Due to the small load capacity of the
column, over 100 runs were required to get a useable sample size.
^ HPLC fractions collected
Expanded: Region containing fractions 6-9

38
2.10.10 Assessment of Sulfur-Transfer Activity of Aged PADS Fractions
An arbitrarily-sized sample of each of the combined fractions recovered from the aged PADS
solution was taken and made up in deuterated acetonitrile. 20 µL of each sample was analysed by
HPLC in order to ensure an adequate concentration and homogeneity of material. To each of these,
excess triphenyl phosphite (50 µl) and 3-picoline (50 µl) were added. After 1 h tese reaction
mixtures were analysed by 31
P NMR to assess whether any of the phosphite had been converted to
the phosphorothioate. Phosphorothioate was detected in 5 samples (fractions 5, 7, 8, 9, 10). These
were deemed the active sulfur transfer reagents.
2.10.11 Quantification and Kinetic Measurements of Sulfur Transfer with Fractions from
Aged PADS Solutions
The reactive fractions collected from aged PADS solutions were made up to 0.5 ml in deuterated
acetonitrile. To these solutions naphthalene (100 ppm) was added as an internal standard. These
solutions were then analysed by HPLC and the ratio of the peak area of the active species and the
standard was calculated. It was assumed that these species had a similar UV response to PADS. The
concentrations of these solutions were calculated by comparing the ratios of species/standard to the
ratios of the peak areas of known concentrations of PADS to the standard (naphthalene, 100 ppm).
These solutions were then diluted to a concentration of 35 mM based on the calibration with the
reference PADS solution. Sulfurisation kinetics were measured as described in section 2.8 using
triphenyl phosphite ( 3.5 mM, 200 µl) and 3-picoline (70 mM, 200 µl) and replacing PADS with the
appropriate fraction (35 mM, 200 µl).
A reference experiment using PADS (35 mM, 200 µl) was also performed using the same method.
2.10.12 Assessment of the Rate of Decomposition of PADS in the Presence of BHT
Two separate degradation experiments were run according to the method described in section 2.7
using 3-picoline at a concentration of 1 M. To one of these experiments was added butylated
hydroxyl toluene (3.3 mM). The concentrations of PADS in each were monitored simultaneously by
HPLC.

39
2.10.13 Synthesis of Methyl o-iodophenylacetate
To a clean, dry, 25 ml round-bottomed flask o-iodophenylacetic acid (5.01 g, 19.1 mmol) and
H2SO4 (98%, 1.25 ml) were added. This mixture was then added to methanol (7.5 ml). The reaction
mixture was stirred for 2.5 h at 65oC after which time the reaction mixture was diluted with DCM
(250 ml). This was extracted with water (2 × 100 ml) and brine (50 ml). The resulting organic
solution was dried using anhydrous MgSO4 and filtered before DCM was removed under vacuum.
The product was obtained as a pale yellow oil (4.88 g, 93% yield). HPLC retention time 5.4 min; 1H
NMR (CDCl3, 400MHz) δ 3.69 (s, 3H, CH3), 3.79 (s, 2H, CH2), 6.92-6.96 (m, 1H, ArH), 7.22-7.32
(m, 2H, ArH), 7.83 (d, 1H, J 7.9Hz, ArH) ppm; 13
C NMR (CDCl3, 100 MHz) δ 46.1 (CH3), 52.2
(CH2), 101.1 (CI), 128.5 (CH), 128.9 (CH), 130.7 (CH), 137.7 (Cq), 139.5 (CH), 171.0 (CO) ppm;
IR (film) 1732 cm-1
.
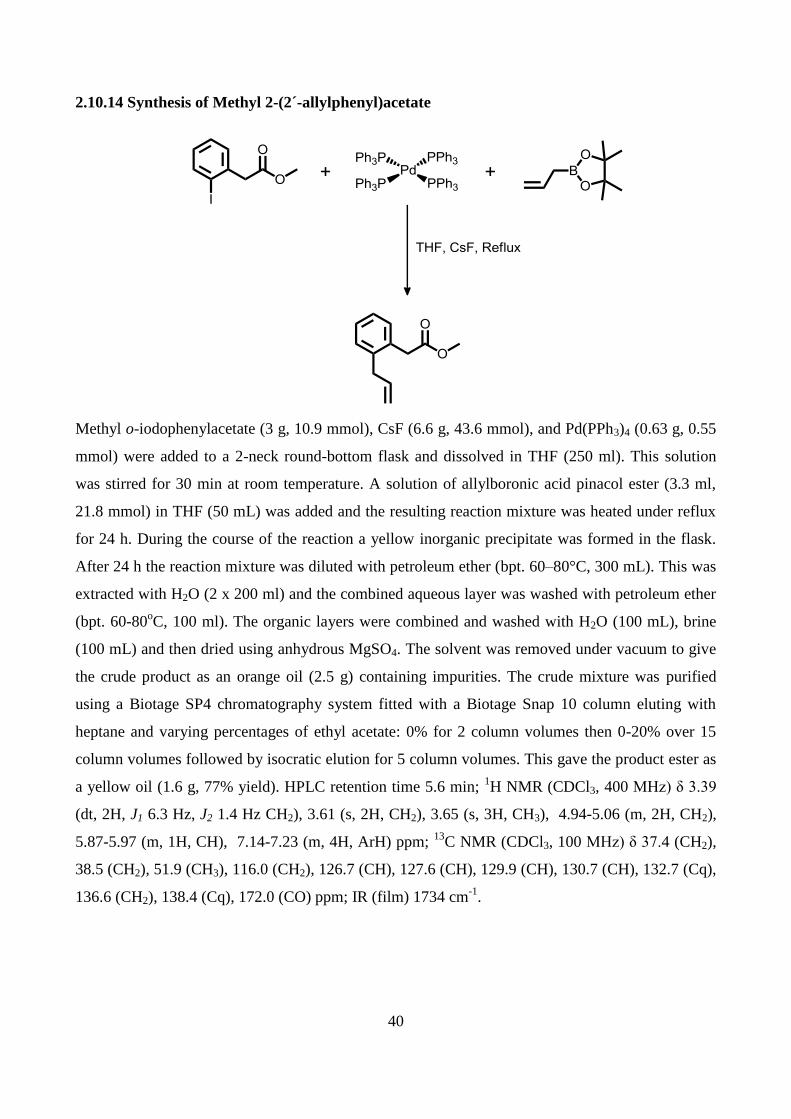
40
2.10.14 Synthesis of Methyl 2-(2´-allylphenyl)acetate
Methyl o-iodophenylacetate (3 g, 10.9 mmol), CsF (6.6 g, 43.6 mmol), and Pd(PPh3)4 (0.63 g, 0.55
mmol) were added to a 2-neck round-bottom flask and dissolved in THF (250 ml). This solution
was stirred for 30 min at room temperature. A solution of allylboronic acid pinacol ester (3.3 ml,
21.8 mmol) in THF (50 mL) was added and the resulting reaction mixture was heated under reflux
for 24 h. During the course of the reaction a yellow inorganic precipitate was formed in the flask.
After 24 h the reaction mixture was diluted with petroleum ether (bpt. 60–80°C, 300 mL). This was
extracted with H2O (2 x 200 ml) and the combined aqueous layer was washed with petroleum ether
(bpt. 60-80oC, 100 ml). The organic layers were combined and washed with H2O (100 mL), brine
(100 mL) and then dried using anhydrous MgSO4. The solvent was removed under vacuum to give
the crude product as an orange oil (2.5 g) containing impurities. The crude mixture was purified
using a Biotage SP4 chromatography system fitted with a Biotage Snap 10 column eluting with
heptane and varying percentages of ethyl acetate: 0% for 2 column volumes then 0-20% over 15
column volumes followed by isocratic elution for 5 column volumes. This gave the product ester as
a yellow oil (1.6 g, 77% yield). HPLC retention time 5.6 min; 1H NMR (CDCl3, 400 MHz) δ 3.39
(dt, 2H, J1 6.3 Hz, J2 1.4 Hz CH2), 3.61 (s, 2H, CH2), 3.65 (s, 3H, CH3), 4.94-5.06 (m, 2H, CH2),
5.87-5.97 (m, 1H, CH), 7.14-7.23 (m, 4H, ArH) ppm; 13
C NMR (CDCl3, 100 MHz) δ 37.4 (CH2),
38.5 (CH2), 51.9 (CH3), 116.0 (CH2), 126.7 (CH), 127.6 (CH), 129.9 (CH), 130.7 (CH), 132.7 (Cq),
136.6 (CH2), 138.4 (Cq), 172.0 (CO) ppm; IR (film) 1734 cm-1
.

41
2.10.15 Synthesis of 2-(2´-allylphenyl)acetic acid
Methyl 2-(2´-allylphenyl)acetate (1.7 g, 8.9 mmol) was added to a round-bottom flask and dissolved
in THF (20 ml). To this was added an aqueous lithium hydroxide solution (0.4 M, 20 ml). The
solution was stirred at room temperature for 3 h. After the reaction was complete (monitored by
HPLC) the reaction mixture was diluted with water (40 ml) and extracted with DCM (2 x 20 ml).
The pH of the aqueous layer was then lowered to around pH 1. This was then re-extracted with
DCM (2 x 20ml). The 2 layers from the acidified aqueous extraction were then combined and dried
using MgSO4. The solvent was then removed under vacuum giving the product as a brown oil (1.7
g, 9.7 mmol, 83% yield). HPLC retention time 4.6 min; 1H NMR (CDCl3, 400 MHz) δ 3.38 (dt, 2H,
J1 6.4 Hz, J2 1.6 Hz, CH2), 3.65 (s, 2H, CH2), 4.94-5.06 (m, 2H, CH2), 5.86-5.96 (m, 1H, CH), 7.14-
7.23 (m, 4H, ArH), 10.76 (bs, 1H, OH) ppm; 13
C NMR (CDCl3, 100 MHz) δ 37.5 (CH2), 38.5
(CH2), 116.22 (CH2), 126.8 (CH), 128.0 (CH), 130.1 (CH), 130.9 (CH), 132.1 (Cq), 136.5 (CH),
138.6 (Cq), 178.4 (CO) ppm; IR (film) 1702cm-1
.
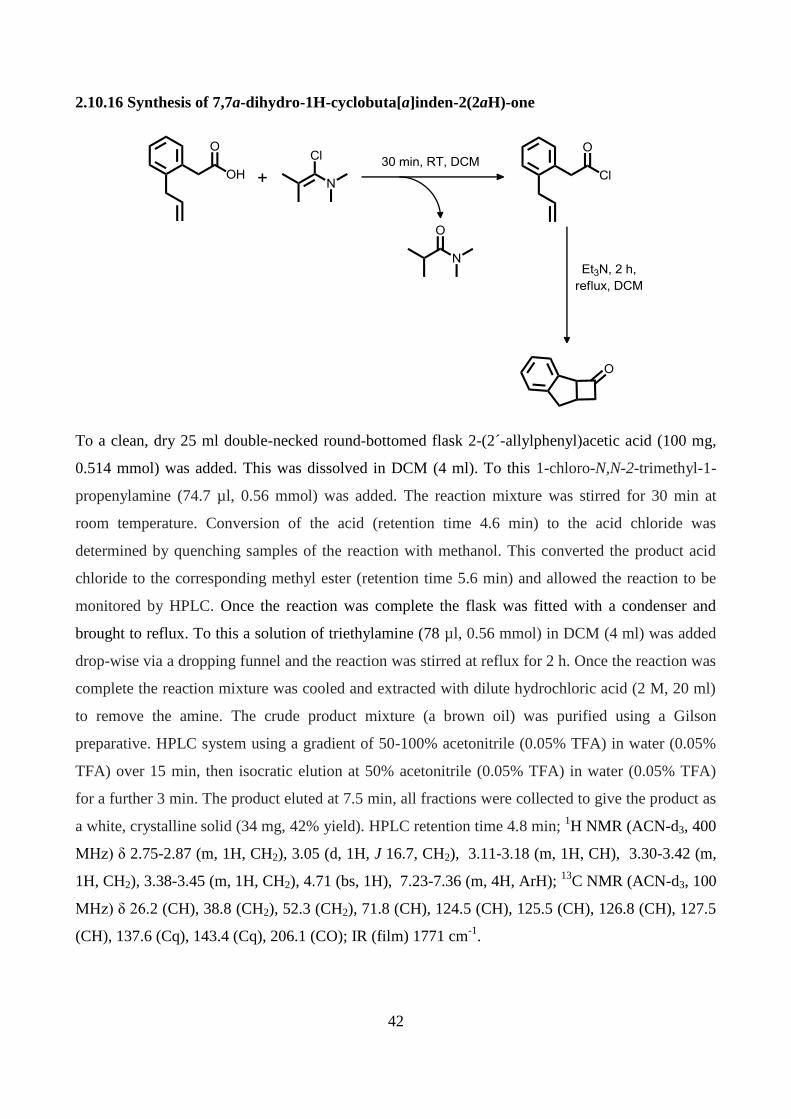
42
2.10.16 Synthesis of 7,7a-dihydro-1H-cyclobuta[a]inden-2(2aH)-one
To a clean, dry 25 ml double-necked round-bottomed flask 2-(2´-allylphenyl)acetic acid (100 mg,
0.514 mmol) was added. This was dissolved in DCM (4 ml). To this 1-chloro-N,N-2-trimethyl-1-
propenylamine (74.7 µl, 0.56 mmol) was added. The reaction mixture was stirred for 30 min at
room temperature. Conversion of the acid (retention time 4.6 min) to the acid chloride was
determined by quenching samples of the reaction with methanol. This converted the product acid
chloride to the corresponding methyl ester (retention time 5.6 min) and allowed the reaction to be
monitored by HPLC. Once the reaction was complete the flask was fitted with a condenser and
brought to reflux. To this a solution of triethylamine (78 µl, 0.56 mmol) in DCM (4 ml) was added
drop-wise via a dropping funnel and the reaction was stirred at reflux for 2 h. Once the reaction was
complete the reaction mixture was cooled and extracted with dilute hydrochloric acid (2 M, 20 ml)
to remove the amine. The crude product mixture (a brown oil) was purified using a Gilson
preparative. HPLC system using a gradient of 50-100% acetonitrile (0.05% TFA) in water (0.05%
TFA) over 15 min, then isocratic elution at 50% acetonitrile (0.05% TFA) in water (0.05% TFA)
for a further 3 min. The product eluted at 7.5 min, all fractions were collected to give the product as
a white, crystalline solid (34 mg, 42% yield). HPLC retention time 4.8 min; 1H NMR (ACN-d3, 400
MHz) δ 2.75-2.87 (m, 1H, CH2), 3.05 (d, 1H, J 16.7, CH2), 3.11-3.18 (m, 1H, CH), 3.30-3.42 (m,
1H, CH2), 3.38-3.45 (m, 1H, CH2), 4.71 (bs, 1H), 7.23-7.36 (m, 4H, ArH); 13
C NMR (ACN-d3, 100
MHz) δ 26.2 (CH), 38.8 (CH2), 52.3 (CH2), 71.8 (CH), 124.5 (CH), 125.5 (CH), 126.8 (CH), 127.5
(CH), 137.6 (Cq), 143.4 (Cq), 206.1 (CO); IR (film) 1771 cm-1
.

43
2.10.17 Synthesis of 2,2´-di(σ-allylphenyl)acetyl disulfide
In a clean, dry, 25 ml round bottom flask sodium hydrosulfide (798 mg, 14.25 mmol) was dissolved
in ethanol (5 ml) and chilled over ice. Working in a well-ventilated fume hood this flask was fitted
with an exhaust line allowing any gasses generated to be scrubbed by sodium hypochlorite. Into a
separate 25 ml round bottom flask 2-(2´-allylphenyl)acetic acid (1 g, 5.7 mmol) was dissolved in
dichloromethane (10 ml). To this, 1-chloro-N,N-2-trimethyl-1-propenylamine (1.04 g, 1.03 ml, 8.5
mmol) was added and stirred at room temperature for 30 min. After the reaction was complete the
solvent was removed under vacuum to yield an orange oil. This oil was added to the ethanolic
sodium hydrosulfide, the solution instantly turned yellow and a precipitate (sodium chloride) was
formed. This precipitate was removed under vacuum filtration and was washed with ice cold
ethanol (1.5 ml). The resulting yellow solution was recovered from the Buchner flask, added to a
clean 25 ml round bottomed flask and stirred over ice. To this solution, iodine was slowly added
until the colour of the suspension changed from white to pale brown (approximately 1 g, 7.8 mmol)
after around 60 s. The resulting reaction mixture was diluted with dichloromethane (10 ml) and was
washed twice with saturated sodium thiosulfate solution (2 x 15 ml). The organic layer was then
concentrated under vacuum to yield the crude product as a brown oil. This was purified using a
Biotage SP4 chromatography system fitted with a Biotage Snap 10 column eluting with 25% ethyl
acetate in hexane (rf. Product = 0.41). This gave the product as a clear oil (384 mg, 1 mmol, 14.1%
yield). HPLC retention time 7.6 min; 1H NMR (CDCl3, 400 MHz) δ 3.41 (d, 4H, J 6.3 Hz, CH2),

44
4.00 (s, 4H, CH2), 4.96-5.60 (m, 4H, CH2), 5.88-5.98 (m, 2H, CH), 7.17-7.30 (m, 8H, ArH) ppm;
13C NMR (CDCl3, 100 MHz) δ 37.5 (CH2), 46.7 (CH2), 116.6 (CH2), 127.0 (CH), 128.6 (CH),
130.2 (CH), 130.88 (Cq), 131.5 (CH), 136.1 (CH), 139.1 (Cq), 191.8 (CO) ppm. HRMS (m/z):
[M+NH4]+ for C20H22O2S2, calculated 400.1399, measured 400.1356; IR: 1796 cm
-1 (film).
2.10.18 Synthesis of Bis-benzoyl disulfide
Sodium sulfide (1.84 g, 23.6 mmol) was dissolved in water (12ml) and heated to 50oC. To this tetra-
N-butylammonium bromide (380 mg, 1.18 mmol) was added and stirred at 50oC for 30 min. In a
separate flask, benzoyl chloride (2 ml, 1.6 5g, 11.8 mmol) was dissolved in toluene (12 ml) and
rapidly stirred. In a well-ventilated fume hood this flask was fitted with an exhaust line allowing
any gasses generated to be scrubbed by sodium hypochlorite and chilled in an ice bath. After 30 min
the sodium sulfide solution was cooled to room temperature and slowly added to the rapidly
stirring, chilled benzoyl chloride solution under a nitrogen atmosphere. A yellow precipitate
immediately precipitated out of solution. This two-phase system was stirred for 24 h. After 24 h the
organic and the aqueous layer were separated, the aqueous layer washed with portions of toluene (2
× 5 ml) and the organic layers combined. The toluene was then removed under vacuum giving the
product as white crystals (738 mg, 46% yield, M.P. 129-30oC
132) from which a single crystal X-ray
diffraction pattern was resolved (see appendix 1). Please note that the aqueous layer contains
residual Na2S which will generate extremely toxic H2S gas if exposed to acid. This must be
disposed of extremely carefully. 1H NMR (CDCl3, 400MHz) δ 7.52 (t, 4H, J 7.6 Hz, ArH), 7.66 (t,
2H, J 7.6 Hz, ArH), 8.08 (d, 4H, J 8.1, ArH) ppm; 13
C NMR (CDCl3, 100MHz) δ 127.9 (CH), 128.8
(CH), 134.0 (CH), 136.6 (Cq), 190.4 (CO) ppm.

45
2.10.19 Synthesis of 2,2,2´,2´-tetramethyl-2,2´-phenylacetyl disulfide
In a clean, dry, 50 ml round bottom flask sodium hydrosulfide (4.2 g, 75 mmol) was dissolved in
ethanol (30 ml) and chilled over ice. Working in a well-ventilated fume hood this flask was fitted
with an exhaust line allowing any gasses generated to be scrubbed by sodium hypochlorite. Into a
separate 50 ml round bottom flask 2-phenylisobutyric acid (5 g, 30 mmol) was dissolved in
dichloromethane (20 ml). To this, 1-chloro-N,N-2-trimethyl-1-propenylamine (6.16 g, 5.6 ml, 45
mmol) was added and the solution stirred at room temperature for 30 min. After the reaction was
complete (determined by HPLC) the solvent was removed under vacuum to yield an orange oil. The
oil was added to the ethanolic sodium hydrosulfide, the solution instantly turned yellow and a
precipitate (sodium chloride) was formed. This precipitate was removed under vacuum filtration
and was washed with ice cold ethanol (1.5 ml). The resulting yellow solution was recovered from
the Buchner flask, added to a clean 50 ml round bottomed flask and stirred over ice to ensure that
the temperature was kept below 15oC. To this solution iodine was added (2 g, 15.6 mmol) and the
product precipitated out of solution. Iodine was slowly added until the colour of the suspension
changed from white to pale brown (approximately 1 g, 7.8 mmol) after around 60 s. The precipitate
was collected by vacuum filtration and washed with ice-cold ethanol (5 ml) and water (10ml) to
give a waxy yellow solid (2.2 g, 5.9 mmol, 39.3 % yield). HPLC retention time 7.6 min; 1H NMR
(ACN-d3, 400 MHz) δ 1.69 (s, 12H, CH3), 7.35–7.49 (m, 10H, ArH) ppm; 13
C NMR (CDCl3, 100
MHz) δ 26.3 (CH3), 54.2 (Cq) , 127.3 (CH), 128.0 (Cq), 128.8 (CH), 142.3 (CH), 198.8 (CO) ppm.
HRMS (m/z): [M+NH4]+ for C20H22O2S2, calculated 390.0782, measured 390.0788; IR: 1707 cm
-1
(film).

46
2.10.20 Synthesis of 2,2´-(4-chlorophenyl)acetyl disulfide
Into a clean, dry, 50 ml round bottom flask sodium hydrosulfide (1.6 g, 29.25 mmol) was dissolved
in ethanol (15 ml) and chilled over ice. Working in a well-ventilated fume hood this flask was fitted
with an exhaust line allowing any gasses generated to be scrubbed by sodium hypochlorite. Into a
separate 50 ml round bottom flask 2-(4-chlorophenyl)acetic acid (2 g, 11.7 mmol) was dissolved in
dichloromethane (15 ml). To this, 1-chloro-N,N-2-trimethyl-1-propenylamine (1.72 g, 1.57 ml, 12.9
mmol) was added and the mixture was stirred at room temperature for 30 min. After the reaction
was complete (determined by HPLC) the solvent was removed under vacuum to yield a pale-brown
oil. This oil was added to the ethanolic sodium hydrosulfide, the solution instantly turned yellow
and a precipitate (sodium chloride) was formed. This precipitate was removed under vacuum
filtration and was washed with ice cold ethanol (1.5 ml). The resulting yellow solution was
recovered from the Buchner flask, added to a clean 50 ml round bottomed flask and stirred over ice
to ensure that the temperature was kept below 15oC. To this solution iodine was added (0.5 g, 3.9
mmol) and the product precipitated out of solution. Iodine was slowly added until the colour of the
suspension changed from white to pale brown (approximately 1 g, 7.8 mmol). The precipitate was
collected by vacuum filtration and was washed with ice-cold ethanol (2.5 ml) and water (10 ml) to
give off-white crystals (1.5 g, 4.1 mmol, 70 % yield). HPLC retention time 7.3 min; 1H NMR
(CDCl3, 400 MHz) δ 3.94 (s, 4H, CH2), 7.22 (d, 8H, J 8.3 Hz, ArH) and 7.32 (d, 8H, J 8.28 Hz,
ArH) ppm; 13
C NMR (CDCl3, 100 MHz) δ 48.4 (CH2), 129.1 (CH), 130.5 (Cq), 131.1 (CH), 134.1
(Cq), 190.8 (CO) ppm. HRMS (m/z): [M+NH4]+ for C16H12Cl2O2S2, calculated 387.9994, measured
388.0000; IR: 1720cm-1
(film).

47
2.10.21 Synthesis of 2,2´-(4-cyanophenyl)acetyl disulfide
In a clean, dry, 50 ml round bottom flask sodium hydrosulfide (2.4 g, 43 mmol) was dissolved in
ethanol (20 ml) and chilled over ice. Working in a well-ventilated fume hood this flask was fitted
with an exhaust line allowing any gasses generated to be scrubbed by sodium hypochlorite. Into a
separate 50 ml round bottom flask 2-(4-cyanophenyl)acetic acid (2.753 g, 17.1 mmol) was
dissolved in dichloromethane (150 ml). To this, 1-chloro-N,N-2-trimethyl-1-propenylamine (3.432
g, 3.120 ml, 25.7 mmol) was added and the mixture was stirred at room temperature for 30 min.
After the reaction was complete (determined by HPLC) the solvent was removed under vacuum to
yield a bright green oil. This oil was added to the ethanolic sodium hydrosulfide, the solution
instantly turned yellow and a precipitate (sodium chloride) was formed. This precipitate was
removed under vacuum filtration and was washed with ice cold ethanol (1.5ml). The resulting
yellow solution was recovered from the Buchner flask, added to a clean 50 ml round bottomed flask
and stirred over ice. To this solution iodine was added (0.5 g, 3.9 mmol) and the product
precipitated out of solution. Iodine was slowly added until the colour of the suspension changed
from white to pale brown (approximately 1 g, 7.8 mmol). The precipitate was collected by vacuum
filtration and washed with ice-cold ethanol (2.5 ml) and water (10 ml) to give a yellow powder (1.6
g, 4.6 mmol, 53.8 % yield). HPLC retention time 6.0 min; 1H NMR (CDCl3, 400 MHz) δ 4.08 (s,
4H), 7.41 (d, 8H, J 8.1 Hz, ArH) and 7.64 (d, 8H, J 8.06 Hz, ArH) ppm; 13
C NMR (CDCl3, 100
MHz) δ 48.8 (CH2), 112.1 (CN), 118.4 (Cq), 130.5 (CH), 132.7 (CH), 137.3 (Cq), 189.76 (CO)
ppm. HRMS (m/z): [M+NH4]+ for C18H12N2O2S2, calculated 370.0678, measured 370.0692; IR:
1716 cm-1
(film).
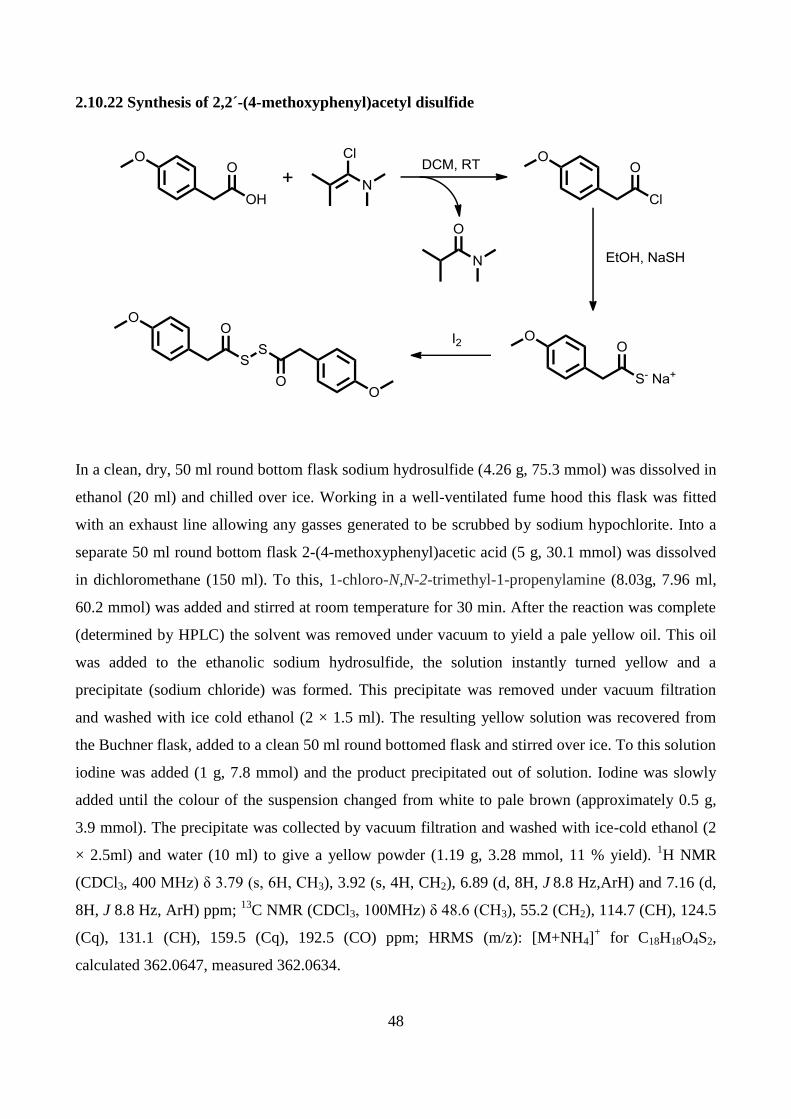
48
2.10.22 Synthesis of 2,2´-(4-methoxyphenyl)acetyl disulfide
In a clean, dry, 50 ml round bottom flask sodium hydrosulfide (4.26 g, 75.3 mmol) was dissolved in
ethanol (20 ml) and chilled over ice. Working in a well-ventilated fume hood this flask was fitted
with an exhaust line allowing any gasses generated to be scrubbed by sodium hypochlorite. Into a
separate 50 ml round bottom flask 2-(4-methoxyphenyl)acetic acid (5 g, 30.1 mmol) was dissolved
in dichloromethane (150 ml). To this, 1-chloro-N,N-2-trimethyl-1-propenylamine (8.03g, 7.96 ml,
60.2 mmol) was added and stirred at room temperature for 30 min. After the reaction was complete
(determined by HPLC) the solvent was removed under vacuum to yield a pale yellow oil. This oil
was added to the ethanolic sodium hydrosulfide, the solution instantly turned yellow and a
precipitate (sodium chloride) was formed. This precipitate was removed under vacuum filtration
and washed with ice cold ethanol (2 × 1.5 ml). The resulting yellow solution was recovered from
the Buchner flask, added to a clean 50 ml round bottomed flask and stirred over ice. To this solution
iodine was added (1 g, 7.8 mmol) and the product precipitated out of solution. Iodine was slowly
added until the colour of the suspension changed from white to pale brown (approximately 0.5 g,
3.9 mmol). The precipitate was collected by vacuum filtration and washed with ice-cold ethanol (2
× 2.5ml) and water (10 ml) to give a yellow powder (1.19 g, 3.28 mmol, 11 % yield). 1H NMR
(CDCl3, 400 MHz) δ 3.79 (s, 6H, CH3), 3.92 (s, 4H, CH2), 6.89 (d, 8H, J 8.8 Hz,ArH) and 7.16 (d,
8H, J 8.8 Hz, ArH) ppm; 13
C NMR (CDCl3, 100MHz) δ 48.6 (CH3), 55.2 (CH2), 114.7 (CH), 124.5
(Cq), 131.1 (CH), 159.5 (Cq), 192.5 (CO) ppm; HRMS (m/z): [M+NH4]+ for C18H18O4S2,
calculated 362.0647, measured 362.0634.

49
2.11 Experimental: Sulfurisation with Fresh and Aged PADS
2.11.1 Varying 3-Picoline Concentration in Sulfurisation with Fresh PADS
Several 31
P NMR experiments were run in order to assess the dependence of the rate of the
sulfurisation reaction on 3-picoline concentration. A mixed solution of triphenyl phosphite and
triphenyl phosphine oxide (0.6 M, 100 µL) was added to an NMR tube. Varying amounts of 3-
picoline were added to this as follows to make a total reaction volume of 600 µL.
3-Picoline concentration (M) Volume (µL)
3-Picoline ACN-d3
0.5 29.2 270.8
1.0 58.3 241.7
1.5 87.5 212.5
2.0 116.6 183.4
2.5 145.8 154.2
3.0 174.9 125.1
3.5 204.1 95.9
4.0 233.2 66.8
At T=0 PADS (3 M, 200 µL) was added to this and 31
P NMR spectra were acquired approximately
every 90 s until the phosphite starting material had been consumed.
2.11.2 Varying PADS Concentration in Sulfurisation Reaction with Fresh PADS
Several 31
P NMR experiments were run in order to assess the dependence of the rate of reaction on
PADS concentration. A mixed solution of triphenyl phosphite and triphenyl phosphine oxide (1.2
M, 50 µL), 3-picoline (116.6 µL) and varying quantities of deuterated acetonitrile (see below) were
added to an NMR tube. At T=0 varying quantities of PADS were added to this and 31
P NMR
spectra were run approximately every 90 s until the phosphite starting material had been consumed.

50
PADS Reaction Conc. (M) Volume (µL)
PADS (5 M) ACN-d3
1.0 120 314
2.0 240 194
2.5 300 134
3.0 360 74
3.5 420 14
2.11.3 Sulfurisation Reaction in the Presence of BHT (1 M)
To an NMR tube, a mixed solution of triphenyl phosphite and triphenyl phosphine oxide (0.6 M,
100 µL), 3-picoline (100 µL, 6 M) and butylated hydroxy toluene (3 M, 100 µL) were added to an
NMR tube. At T=0 PADS (3 M, 200 µL) was added and 31
P NMR spectra were run approximately
every 90 s until the phosphite starting material had been consumed.
2.11.4 Sulfurisation Reaction in the Presence of BHT (0.1 M)
To an NMR tube, a mixed solution of triphenyl phosphite and triphenyl phosphine oxide (0.6 M,
100 µL), 3-picoline (100 µL, 6 M) and butylated hydroxy toluene (3 M, 10 µL) and deuterated
acetonitrile (90 µL) were added to an NMR tube. At T=0 PADS (3 M, 200 µL) was added and 31
P
NMR spectra were run approximately every 90 s until the phosphite starting material had been
consumed.
2.11.5 Sulfurisation of Aryl Phosphites with Fresh PADS in Acetonitrile-d3
Solutions of several differently substituted aryl phosphites (x= p-OMe, p-Me, H, p-F, p-Cl, m-Cl)
were made up in acetonitrile-d3 with an equimolar concentration of triphenyl phosphine oxide (0.3
M) in acetonitrile-d3. Aliquots of these solutions (200 µL) were added to NMR tubes with 3-
picoline (6 M, 200 µL). At T=0 PADS (3 M, 200 µL) was added and 31
P NMR spectra were run
approximately every 90 s until the phosphite starting material had been consumed.

51
2.11.6 Sulfurisation of Aryl Phosphites with Fresh PADS in Toluene-d8
Solutions of several differently substituted aryl phosphites (x= p-OMe, p-Me, H, p-F, p-Cl, m-Cl)
were made up in toluene-d8 with an equimolar concentration of triphenyl phosphine oxide (0.1 M)
in toluene-d8. Aliquots of these solutions (200 µL) were added to NMR tubes with 3-picoline (2 M,
200 µL). At T=0 PADS (1 M, 200 µL) was added and 31
P NMR spectra were run approximately
every 90 s until the phosphite starting material had been consumed.
2.11.7 Sulfurisation of Aryl Phosphites with Fresh PADS in CDCl3
Solutions of several differently substituted aryl phosphites (x= p-OMe, p-Me, H, p-F, p-Cl, m-Cl)
were made up in CDCl3 with an equimolar concentration of triphenyl phosphine oxide (0.1 M) in
CDCl3. Aliquots of these solutions (200 µL) were added to NMR tubes with 3-picoline (2 M, 200
µL). At T=0 PADS (1 M, 200 µL) was added and 31
P NMR spectra were run approximately every
90 s until the phosphite starting material had been consumed.
2.11.8 Sulfurisation of Aryl Phosphites with Fresh PADS in DMSO-d6
Solutions of several different substituted aryl phosphites (x= p-OMe, p-Me, H, p-F, p-Cl, m-Cl)
were made up in DMSO-d6 with an equimolar concentration of triphenyl phosphine oxide (0.1 M)
in DMSO-d6. Aliquots of these solutions (200 µL) were added to NMR tubes with 3-picoline (2 M,
200 µL). At T=0 PADS (1 M, 200 µL) was added and 31
P NMR spectra were run approximately
every 90 s until the phosphite starting material had been consumed.
2.11.9 Sulfurisation of Alkyl Phosphites with Fresh PADS in CDCl3
Solutions of several different alkyl phosphites (R= MeO, EtO, 2-ClEtO, F3EtO) were made up in
CDCl3 with an equimolar concentration of triphenyl phosphine oxide (0.1 M) in CDCl3. Aliquots of
these solutions (200 µL) were added to NMR tubes with 3-picoline (2 M, 200 µL). At T=0 PADS (1
M, 200 µL) was added and 31
P NMR spectra were run approximately every 90 s until the phosphite
starting material had been consumed.

52
2.11.10 Sulfurisation of Phosphites in Acetonitrile-d3 Using Fresh PADS with Various
Substituted Pyridines
Sulfurisation kinetic experiments were run in acetonitrile-d3 according to the method detailed in
section 2.8 using triphenyl phosphite (0.3 M, 200 µL) and PADS (3 M, 200 µL). In place of 3-
picoline various substituted pyridines were used (6 M, 200 µL) where x = p-CN, p-OMe, H, m-CN,
m-Cl, m-OMe and m-Me.
2.11.11 Sulfurisation of Phosphites Using 2,2,2´2´-tetramethyl-2,2´-phenylacetyl disulfide with
Various Substituted Pyridines
Sulfurisation kinetic experiments were run in acetonitrile-d3 according to the method detailed in
section 2.8 using triphenyl phosphite (0.07 M, 200 µL). PADS was replaced in this experiment set
with 2,2,2’2’-tetramethyl-2,2’-phenylacetyl disulfide (0.7 M, 200 µL). In place of 3-picoline
various substituted pyridines were used (1.4 M, 200 µL) where x = p-CN, p-OMe, H, m-CN, m-Cl,
m-OMe and m-Me.
2.11.12 Sulfurisation of Phosphites Using Dibenzoyl disulfide with Various Substituted
Pyridines
Sulfurisation kinetic experiments were run in acetonitrile-d3 according to the method detailed in
section 2.8 using triphenyl phosphite (0.025 M, 200 µL). In these experiments, PADS was replaced
with dibenzoyl disulfide (0.25 M, 200 µL). In place of 3-picoline various substituted pyridines were
used (0.5 M, 200 µL) where x = p-CN, p-OMe, H, m-CN, m-Cl, m-OMe and m-Me.
2.11.13 Sulfurisation of Phosphites in Acetonitrile-d3 Using Fresh PADS with Various
Substituted Pyridines
Sulfurisation kinetic experiments were run in acetonitrile-d3 according to the method detailed in
section 2.8 using triphenyl phosphite (0.3 M, 200 µL) and PADS (3 M, 200 µL). In this experiment,
3-picoline was replaced with triethyl amine (167 µL). Acetonitrile-d3 (33 µL) was added to make
the total reaction volume up to 600 µL.

53
2.11.14 Sulfurisation of Phosphites in Acetonitrile-d3 Using Various Phenyl Substituted PADS
with 3-Picoline
Sulfurisation kinetic experiments were run in acetonitrile-d3 according to the method detailed in
section 2.8 using triphenyl phosphite (0.3 M, 200 µL) and 3-picoline (6M, 200 µL). In this series of
experiments, PADS was replaced with various phenyl substituted PADS compounds (3M, 200 µL)
where x = p-OMe, p-F, p-Cl, p-CN and m-Cl.
2.11.15 Synthesis of tris-(4-methoxyphenyl)phosphite
In a clean, dry 250 ml three-necked round-bottom flask a solution of 4-methoxyphenol (9.77 g, 78.7
mmol) and pyridine (8.10 ml, 7.92 g, 100 mmol) was prepared in diethyl ether (80 ml). To this,
phosphorus trichloride (1.74 ml, 2.74 g, 20.0 mmol) was added dropwise at room temperature under
nitrogen atmosphere and stirred for 1.5 h. When the reaction was complete, the reaction mixture
was quenched with water (100 ml). The reaction mixture was transferred to a separating funnel. The
organic phase was separated and washed with water (50 ml) and brine (50 ml). This was then dried
with magnesium sulfate, and the solvent was removed under vacuum. The crude mixture was
purified by silica gel column chromatography using chloroform as the eluent to give the product as
a colourless oil (4.87 g, 4.03 ml, 12.2 mmol, 61 % yield). 1H NMR (CDCl3, 400 MHz) δ 3.78 (s,
9H, CH3), 6.87 (d, 6H, J 9.1 Hz, ArH) and 7.11 (d, 6H, J 9.1 Hz, ArH) ppm; 13
C NMR (CDCl3, 100
MHz) δ 55.6 (CH3), 114.7 (CH), 121.7 (CH), 145.1 (Cq), 156.3 (Cq) ppm; 31
P NMR (CDCl3, 400
MHz), δ 128.9 ppm, HRMS (m/z): [M+H]+ for C21H21O3P, calculated 401.1149, measured
401.1150.

54
2.11.16 Synthesis of 2,2′-(4-fluorophenyl)acetyl disulfide
Into a clean, dry, 50 ml round bottom flask sodium hydrosulfide (1.8 g, 33.3 mmol) was dissolved
in ethanol (15 ml) and chilled over ice. This flask was fitted with an exhaust line allowing any
gasses generated to be scrubbed by sodium hypochlorite in a well-ventilated fume hood. Into a
separate 50 ml round bottom flask 2-(4-fluorophenyl)acetic acid (2 g, 13.2 mmol) was dissolved in
dichloromethane (15 ml). To this, 1-chloro-N,N-2-trimethyl-1-propenylamine (1.9 g, 1.73 ml, 14.0
mmol) was added and stirred at room temperature for 30 min. After the reaction was complete
(determined by HPLC) the solvent was removed under vacuum to yield a dark-brown oil. This oil
was added to the ethanolic sodium hydrosulfide, the solution instantly turned yellow and a
precipitate (sodium chloride) was formed. This precipitate was removed under vacuum filtration
and washed with ice cold ethanol (1.5ml). The resulting yellow solution was recovered from the
Buchner flask, added to a clean 50 ml round bottomed flask and stirred over ice to ensure that the
temperature was kept below 15oC. To this solution excess iodine was added (1.5 g, 11.7 mmol)
until the colour of the solution changed from white to pale brown and the product precipitated out
of solution. The precipitate was collected by vacuum filtration and washed with ice-cold ethanol
(2.5ml) and water (10ml) to give off-white crystals (1.5 g, 4.4 mmol, 67% yield). HPLC retention
time 6.7 min; 1H NMR (CDCl3, 400MHz) δ 3.94 (s, 4H, CH2), 7.01 and 7.24 (2t, 8H, J 7.3, ArH)
ppm; 13
C NMR (CDCl3, 100MHz) δ 48.2 (CH2), 115.8 (d, J 21.2 Hz, CH), 127.9 (d, 3.3 Hz, Cq),
131.5 (d, 8.1 Hz, CH), 162.1 (d, J 246.9 Hz, CF), 191.3 (CO) ppm. HRMS (m/z): [M+NH4]+ for
C16H12F2O2S2, calculated 338.0247, measured 338.0254; IR: 1719 cm-1
(film).
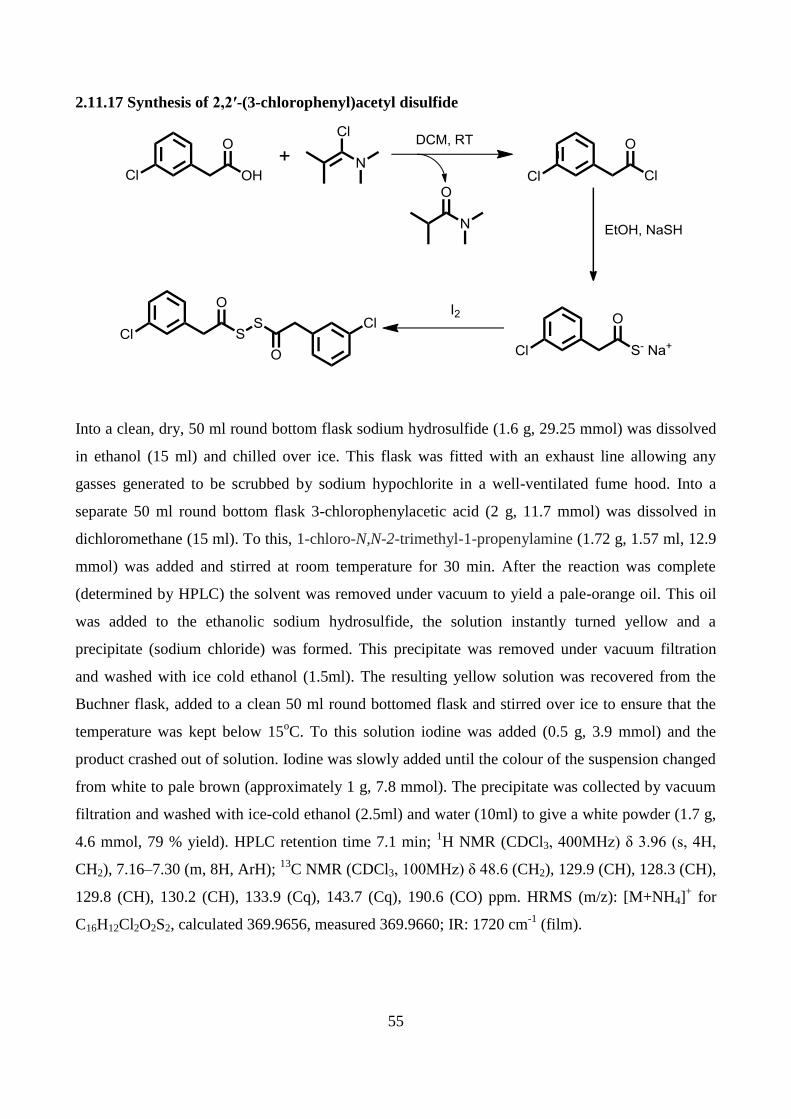
55
2.11.17 Synthesis of 2,2′-(3-chlorophenyl)acetyl disulfide
Into a clean, dry, 50 ml round bottom flask sodium hydrosulfide (1.6 g, 29.25 mmol) was dissolved
in ethanol (15 ml) and chilled over ice. This flask was fitted with an exhaust line allowing any
gasses generated to be scrubbed by sodium hypochlorite in a well-ventilated fume hood. Into a
separate 50 ml round bottom flask 3-chlorophenylacetic acid (2 g, 11.7 mmol) was dissolved in
dichloromethane (15 ml). To this, 1-chloro-N,N-2-trimethyl-1-propenylamine (1.72 g, 1.57 ml, 12.9
mmol) was added and stirred at room temperature for 30 min. After the reaction was complete
(determined by HPLC) the solvent was removed under vacuum to yield a pale-orange oil. This oil
was added to the ethanolic sodium hydrosulfide, the solution instantly turned yellow and a
precipitate (sodium chloride) was formed. This precipitate was removed under vacuum filtration
and washed with ice cold ethanol (1.5ml). The resulting yellow solution was recovered from the
Buchner flask, added to a clean 50 ml round bottomed flask and stirred over ice to ensure that the
temperature was kept below 15oC. To this solution iodine was added (0.5 g, 3.9 mmol) and the
product crashed out of solution. Iodine was slowly added until the colour of the suspension changed
from white to pale brown (approximately 1 g, 7.8 mmol). The precipitate was collected by vacuum
filtration and washed with ice-cold ethanol (2.5ml) and water (10ml) to give a white powder (1.7 g,
4.6 mmol, 79 % yield). HPLC retention time 7.1 min; 1H NMR (CDCl3, 400MHz) δ 3.96 (s, 4H,
CH2), 7.16–7.30 (m, 8H, ArH); 13
C NMR (CDCl3, 100MHz) δ 48.6 (CH2), 129.9 (CH), 128.3 (CH),
129.8 (CH), 130.2 (CH), 133.9 (Cq), 143.7 (Cq), 190.6 (CO) ppm. HRMS (m/z): [M+NH4]+ for
C16H12Cl2O2S2, calculated 369.9656, measured 369.9660; IR: 1720 cm-1
(film).

56
2.11.18 Synthesis of tris(3-chlorophenyl)phosphite
In a clean, dry 250 ml three-necked round-bottom flask a solution of 3-chlorophenol (14.04 g, 112.8
mmol) and pyridine (10.8 ml, 10.58 g, 141 mmol) was prepared in diethyl ether (120 ml). To this,
phosphorus trichloride (4.0 ml, 3.87 g, 28.2 mmol) was added dropwise at room temperature under
nitrogen atmosphere and stirred for 1.5 h. When the reaction was complete, the reaction mixture
was quenched with water (150 ml). The reaction mixture was transferred to a separating funnel. The
organic phase was separated and washed with water (50 ml) and brine (50 ml). This was then dried
with magnesium sulfate, and the solvent was removed under vacuum. The crude mixture was
purified by silica gel column chromatography using chloroform as the eluent to give the product as
a yellow oil (9.1 g, 6.8 ml, 22 mmol, 78 % yield). 1H NMR (CDCl3, 400 MHz) δ 7.01–7.29 (m,
12H, ArH) ppm; 13
C NMR (CDCl3, 100 MHz) δ 118.8 (d, JC-P 7.5 Hz, CH), 121.2 (d, JC-P = 6.6 Hz,
CH), 124.9 (CH), 130.6(CH), 135.1 (Cq), 151.8 (Cq) ppm; 31
P NMR (CDCl3, 400 MHz), δ 126.5
ppm, HRMS (m/z): [M+H]+ for C18H12O3Cl3P, calculated 412.9662, measured 411.9672.

57
2.11.19 Preparation of tris (4-chlorophenyl)phosphite
In a clean, dry 250 ml three-necked round-bottom flask a solution of 4-chlorophenol (10.3 g, 80
mmol) and pyridine (8.10 ml, 7.92 g, 100 mmol) was prepared in diethyl ether (80 ml). To this,
phosphorus trichloride (1.74 ml, 2.74 g, 20.0 mmol) was added dropwise at room temperature under
nitrogen atmosphere and stirrer for 1.5 h. When the reaction was complete, the reaction mixture was
quenched with water (100 ml). The reaction mixture was transferred to a separating funnel. The
organic phase was separated and washed with water (50 ml) and brine (50 ml). This was then dried
with magnesium sulfate, and the solvent was removed under vacuum. The crude mixture was
purified by silica gel column chromatography using chloroform as the eluent to give the product as
a white solid (5.06 g, 12.2 mmol, 61 % yield). 1H NMR (CDCl3, 400 MHz) δ 7.17 (2d, J = 8.8 Hz,
12H, ArH) ppm; 13
C NMR (CDCl3, 100 MHz) δ 121.9 (d, JC-P 6.6 Hz, Cq), 129.9 (CH), 149.8 (d,
JC-P = 2.8 Hz, Cq) ppm; 31
P NMR (CDCl3, 400 MHz), δ 126.8 ppm, HRMS (m/z): [M+H]+ for
C18H12O3Cl3P, calculated 412.9662, measured 412.9665.

58
2.11.20 Preparation of tris (4-fluorophenyl)phosphite
In a clean, dry 250 ml three-necked round-bottom flask a solution of 4-fluorophenol (4.41 g, 39.3
mmol) and triethylamine (5.6 ml, 4.06 g, 40 mmol) was prepared in diethyl ether (40 ml). To this,
phosphorus trichloride (0.87 ml, 1.37 g, 10.0 mmol) was added dropwise at room temperature under
nitrogen atmosphere and stirrer for 24 h. After 24 h the solid precipitate from the reaction was
removed by vacuum filtration and washed with diethyl ether (2 ×10ml). The filtrate was then
transferred into a round-bottomed flask and the solvent was removed under vacuum. The crude
product was purified by silica gel column chromatography eluting with chloroform to give the
product as a white solid (4.77 g, 13.1 mmol, 71% yield). 1H NMR (CDCl3, 400 MHz) δ 7.01 – 7.13
(m, 12H, ArH) ppm; 13
C NMR (CDCl3, 100 MHz) 116.4 (d, JC-F = 23 Hz, CH), 122.0 (t, JC-F = 7.4
Hz, JC-P = 7.3 Hz, CH), 147.2 (d, JC-F = 2.9 Hz, JC-P = 3.0 Hz, Cq), 159.5 (d, JC-F = 243 Hz, CF)
ppm; 31
P NMR (CDCl3, 400 MHz) δ 127.5 (127.8) ppm, HRMS (m/z): [M+H]+ for C18H12O3F3P,
calculated 365.0476, measured 365.0550.

59
2.12 Experimental – Activation and Coupling
2.12.1 Solubility of ETTH in Acetonitrile at 25oC
Acetonitrile (ca. 10 ml) was accurately weighed and added to a 25 ml round-bottomed flask. ETTH
(ca. 10 g) was accurately weighed and added to this. The mixture was kept at 25oC in a water bath
and stirred for 24 h. After 24 h the solution was filtered under vacuum and the recovered solid
masswas dried overnight in an oven set at 80oC. The solubility was calculated by subtracting the
remaining solid from the total solid added as follows:
𝑆𝑜𝑙𝑢𝑏𝑖𝑙𝑖𝑡𝑦𝑚𝑎𝑥 (𝑔) =(
𝑀𝑎𝑠𝑠 𝐸𝑇𝑇𝐻𝑡𝑜𝑡𝑎𝑙 (𝑔) − 𝑀𝑎𝑠𝑠 𝐸𝑇𝑇𝐻𝑟𝑒𝑐𝑜𝑣𝑒𝑟𝑒𝑑 (𝑔)𝑅𝑀𝑀 𝑜𝑓 𝐸𝑇𝑇𝐻 (130.03𝑔𝑚𝑜𝑙−1)
)
(𝑀𝑎𝑠𝑠 𝑜𝑓 𝐴𝐶𝑁
𝑑𝑒𝑛𝑠𝑖𝑡𝑦 𝑜𝑓 𝐴𝐶𝑁 (0.786 𝑔𝑚𝑙−1))
2.12.2 Solubility of [ETTHDIA] in Acetonitrile at 25oC
A saturated solution of ETTH was prepared (1.6 M, 50 ml) in acetonitrile. To this, di-isopropyl
amine was added in excess. As amine was added, ETTHDIA precipitated as white crystals. This
mixture was then filtered under vacuum and the solid washed with ice-cold acetonitrile (2 × 5 ml).
The solid was collected and dried in an oven set to 80oC overnight. The maximum solubility of
[ETTHDIA] was calculated in the same way as the maximum solubility of ETTH in section 2.10.1.

60
2.12.3 Calculation of ETTH pKa in H2O
Solutions of ETTH (0.1 M, 250 ml) and NaOH (0.1 M, 250 ml) were prepared in ultra-pure water.
A portion of the ETTH solution (25 ml) was added to a 250 ml beaker which was suspended in a
water bath kept at 25oC. This was then equipped with a stirrer bar and a pH probe was placed in the
solution to monitor the pH. Above this, a burette was kept in place using a clamp stand. This was
filled with the NaOH solution. Small amounts of NaOH were then added to the ETTH solution and
the pH was monitored throughout. The titration ended when the pH of the solution remained stable
upon the addition of NaOH. The pKa of ETT was then determined using the Henderson-Hasselbach
equation.
pH = p𝐾𝑎 + log[𝐴−]
[𝐻𝐴]
2.12.4 Calculation of pKa of Several Tetrazoles in 10% v/v DMSO/H2O
Solutions of x-tetrazole (0.1 M, 250 ml) and NaOH (1 M, 250 ml) were prepared in a solvent
mixture of 10% v/v DMSO/H2O. A portion of the x-tetrazole solution (25 ml) was added to a 250
ml beaker equipped with a stirrer bar and a pH probe was placed in the solution to monitor the pH
and was incubated in a water bath at 25oC. Above this, a burette was kept in place using a clamp
stand. This was filled with the NaOH solution. Small amounts of NaOH were then added to the
substituted tetrazole solution and the pH was monitored throughout. The titration was ended when
the pH of the solution remained stable upon the addition of NaOH. The pKa of the substituted
tetrazole was then determined using the Henderson-Hasselbach equation.
2.12.5 Conductance Measurements of ETTH Solutions in Acetonitrile
Several solutions of ETTH were made up in acetonitrile (10 – 100 mM, 10 ml) and placed in a
jacketed flask, equipped with a stirrer bar, with the temperature maintained at 25oC. Once at
temperature the conductance probe was submerged in the solution and allowed to equilibrate for 5
min before values were recorded.

61
2.12.6 Conductance Measurements of ETTHDIA Solutions in Acetonitrile
ETTHDIA was prepared as described in section 2.12.2. Solutions of ETTHDIA were prepared in
acetonitrile (0.5 – 5 mM, 10 ml). Conductance measurements were taken in the same way as that
described for ETTH in section 2.12.5.
2.12.7 Conductance Measurements of ETTHDIA Solutions with Excess ETTH in Acetonitrile
Several solutions of ETTH were made up (0 – 30 mM, 10 ml) in acetonitrile. Each solution was
added individually to a jacketed vessel, equipped with a stirrer bar, with the temperature maintained
at 25oC. To these solutions, ETTHDIA was added (250 µL, 0.2 M). Once at temperature the
conductance probe was submerged in the solution and allowed to equilibrate for 5 min before the
value was recorded.
2.12.8 Activation of UAm Using ETTH Monitored by Conductivity
Into a jacketed reaction vessel, a solution of UAm in acetonitrile (5 mM, 30ml) was added and kept
at a constant 25oC. The conductivity probe was inserted to monitor the conductivity and
temperature. Once the solution had reached temperature, varying amounts of ETT (0.1-1 M, 3 ml)
were added and the conductivity was recorded every 0.1 s until the conductivity stabilised and the
reaction was complete.
2.12.9 Methanolysis of UAm Activated by ETTH Monitored by Conductivity
A solution of methanol in acetonitrile was prepared (5% v/v, 1.2 M, 50 ml). Into a jacketed reaction
vessel, a solution of UAm in acetonitrile (5 mM, 30ml) was mixed varying amounts of the 5%
methanol solution (0-1.25 ml) and kept at a constant 25oC. The conductivity probe was inserted to
monitor the conductivity and temperature. Once the solution had reached temperature, ETT (1 M,
1.5 ml) was added and the conductivity was recorded every 0.1 seconds until the conductivity
stabilised and the reaction was complete.

62
2.12.10 Investigation into the Acitvation Equillibrium by 31
P NMR
A solution of UAm (0.1 M, 500 µL) in acetonitrile-d3 was added to an NMR tube and a 31
P NMR
spectra recorded. To this, three aliquots of ETTH (1 M, 50µL) were added periodically with 31
P
NMR spectra being taken after each addition. To the resulting solution, DIA (2 M, 25 µL) was
added again periodically with 31
P NMR spectra being taken after each addition.
2.12.11 Kinetics of Activation of di-tert-butyl N,N-di-isopropyl phosphoramidite (DBAm) with
Various Substituted Tetrazoles. Reactions Followed by 31
P NMR Using Samples Quenched
With Diethyl amine
Solutions of various substituted tetrazoles were made up in acetonitrile-d3 (10 mM, 5 ml). A
solution of DBAm (5 mM, 5 ml) was also made up in acetonitrile-d3. Aliquots of the UAm solution
(300 µL) were added to a 5 ml reaction vial. At t=0 the substituted tetrazole (300 µL) was added. At
t=n diethyl amine (31 µL) was added neat and thoroughly mixed. These solutions were transferred
to separate NMR tubes and 31
P NMR spectra were recorded. This allowed the concentration of
DBAm to be plotted as a function of time for these reactions.

63
3. Results and Discussion: Ageing
PADS

64
3. Ageing PADS
Phosphorothioate oligonucleotides are synthesised via sulfurization of newly formed phosphite
linkages between coupled nucleotides. In the phosphoramidite method of oligonucleotide synthesis
this is done immediately after the linkage is formed.
Currently, the most popular reagent used to perform this sulfurization is phenylacetyl disulfide
(PADS). PADS is used because it gives low PO:PS ratio (95-99% PS) and reaction with PADS does
not generate any oxidizing by-products unlike other sulfur transfer reagents such as the Beaucage92
.
PADS also gives rapid rates of reaction, affording almost full conversion of starting material to
products with contact times of around 3 mins96
.
Scheme 10: General scheme for reaction of PADS with inter-nucleotide phosphite linkage.
Despite the efficiency of this reaction it is well known that the reaction rate and yield can be
improved by ‘ageing’ PADS97
. This involves preparing a solution of PADS in a 50% vol/vol
mixture of acetonitrile and a pyridine (usually 3-picoline97
although bases such as pyridine and
collidine108
have been used). This solution is then allowed to ‘age’ for around 48 h. This process
generates a more efficient sulfurisation mixture (with the yield of phosphorothioate increasing from
99.5% yield with fresh PADS to 99.8% yield using aged PADS)96
. Though this process is widely
adopted and accepted to be of value, little is known about the products or mechanism of the process.
It has been suggested that this process generates acylpolysulfides and that these are the active sulfur
transfer reagents in these mixtures.
5 min
ACN 50% v/v

65
3.1 Analysis of Aged PADS Solutions
Solutions of PADS made up in acetonitrile with 3-picoline (5 M) exhibit multiple colour changes
over time, changing from a pale-yellow through green/blue to brown/black. As well as the colour
change, a further observation to be made looking at these solutions is that elemental sulfur
crystallises out of the mixture after around 48 h. It is worth noting that PADS is stable in
acetonitrile with no base present and that these changes are dependent on the presence of base.
In the current work, solutions of PADS aged in acetonitrile with 3-picoline (5 M) were analysed by
HPLC, 1H and
13C NMR and mass spectrometry was performed in order to identify the products of
the ageing process. HPLC analysis showed that under these conditions PADS degraded completely
in 48 h and NMR analysis shows the disappearance of the peak corresponding to the methylene
group of PADS at δ 1H 4.1,
13C 48.4 ppm (Fig. 16). All analytical methods show the generation of
multiple degradation products, rather than one single species.
Figure 16: HPLC chromatograms of PADS (3.3 mM) in a solution of 3-picoline (5M) in ACN (naphthalene internal
standard at T=0 (top) and T=48 h (bottom) showing PADS degradation.*1 = Naphthalene (internal standard), *2 =
PADS
*1 *2
*1

66
Figure 17: HPLC chromatograms of PADS (3.3 mM) in a solution of 3-picoline (5M) in ACN (naphthalene internal
standard at T=0 (top) and T=24 hours (bottom) showing non-polar degradation products.*1 = Naphthalene (internal
standard), *2 = PADS
Figure 18: HPLC chromatograms of PADS (3.3 mM) in a solution of 3-picoline (5M) in ACN (naphthalene internal
standard at T=0 (top) and T=24 hours (bottom) showing polar degradation products.*3 = 3-picoline
*1 *2
*1 *2
*3
*3

67
Figure 19: 1H and
13C
NMR spectra of PADS (0.2M) in 3-picoline (0.4M) in ACN at T=n h
The NMR spectra in figure 19 show that the products of ageing are somewhat similar in structure to
PADS itself, i.e. multiple methylene and carbonyl peaks are generated in close proximity to the
original peaks. Similarly, the HPLC chromatograms show that multiple sharp peaks are generated
with progressively longer retention times than PADS. Mass spectral analysis of these mixtures
suggests that these degradation products are acylpolysulfides.
Figure 20: Mass spectrum of sodium adduct of bis-phenylacetyl trisulfide. m/zexp = 357.0054, m/zobs = 357.0047.

68
Figure 21: Mass spectrum of potassium adduct of bis-phenylacetyl pentasulfide. m/zexp = 436.9234, m/zobs = 437.0248
.
Figure 22: Mass spectrum of proton adduct of bis-phenylacetyl hexasulfide. m/zexp = 430.9300, m/zobs = 431.0554
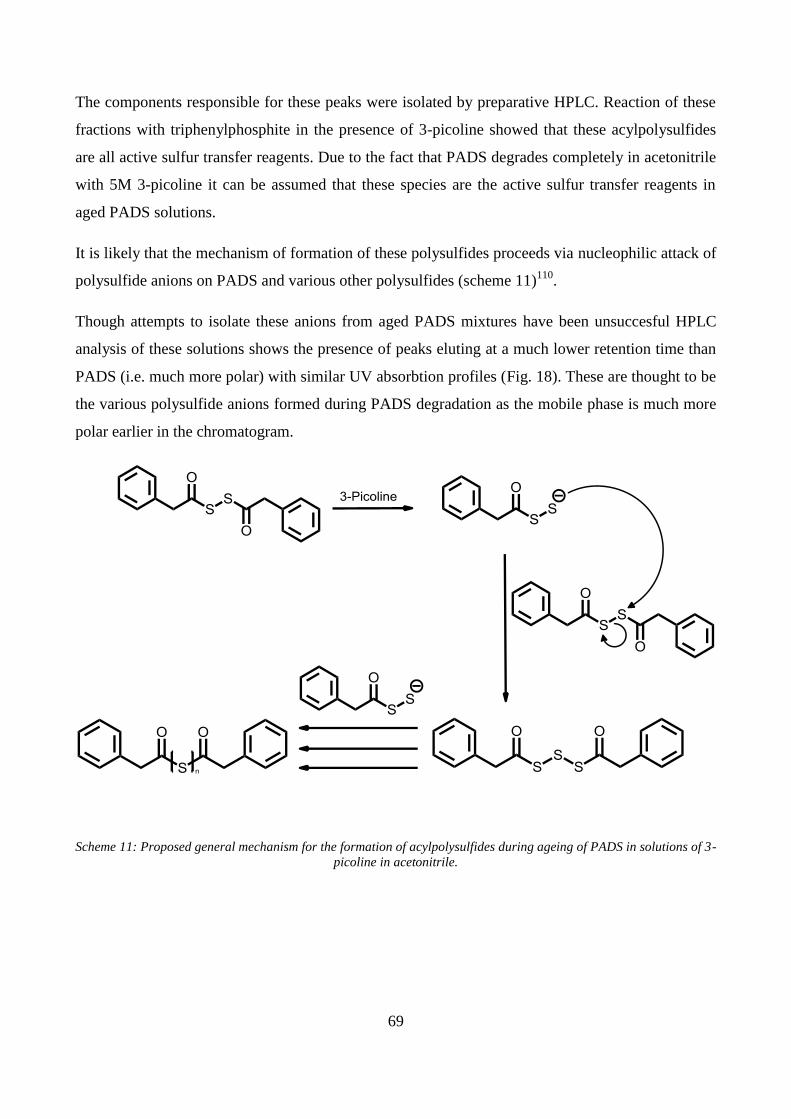
69
The components responsible for these peaks were isolated by preparative HPLC. Reaction of these
fractions with triphenylphosphite in the presence of 3-picoline showed that these acylpolysulfides
are all active sulfur transfer reagents. Due to the fact that PADS degrades completely in acetonitrile
with 5M 3-picoline it can be assumed that these species are the active sulfur transfer reagents in
aged PADS solutions.
It is likely that the mechanism of formation of these polysulfides proceeds via nucleophilic attack of
polysulfide anions on PADS and various other polysulfides (scheme 11)110
.
Though attempts to isolate these anions from aged PADS mixtures have been unsuccesful HPLC
analysis of these solutions shows the presence of peaks eluting at a much lower retention time than
PADS (i.e. much more polar) with similar UV absorbtion profiles (Fig. 18). These are thought to be
the various polysulfide anions formed during PADS degradation as the mobile phase is much more
polar earlier in the chromatogram.
Scheme 11: Proposed general mechanism for the formation of acylpolysulfides during ageing of PADS in solutions of 3-
picoline in acetonitrile.

70
3.2 Dependence of PADS Decomposition on 3-Picoline Concentration
It has been proposed in the literature that the enhanced rate of decomposition of PADS in solutions
of 3-picoline is due to an increase in the dielectric of the solvent when 3-picoline is added108
. In
order to investigate this, a solution of PADS (3.3 mM) was made up in 10% v/v dimethyl sulfoxide
in acetonitrile. This solvent was chosen due to its extremely high dielectric constant and low
nucleophilicity and basicity. HPLC analysis showed that PADS is stable in this solution for at least
one week. Due to this observation, it is unlikely that the effect of 3-picoline is due solely to a
dielectric effect.
The effect of the concentration of 3-picoline on the rate of decomposition of PADS was
investigated by HPLC in which PADS (3.3 mM) in acetonitrile was made up in solutions of
varying concentrations of 3-picoline (Figure 23). It was found that the pseudo first–order rate
constants for the degradation of PADS were linearly related to 3-picoline concentration meaning
that the reaction is first order with respect to picoline with an overall second-order rate constant of
1.29 × 10⁻⁵
M-1
. The rate equation for the degradation of PADS can be written as:
𝑅𝑎𝑡𝑒 = 𝑘𝑑𝑒𝑔[𝑃𝐴𝐷𝑆][𝑃𝑖𝑐𝑜𝑙𝑖𝑛𝑒]
The fact that the rate of the degradation is related to picoline concentration suggests a reaction
pathway proceeding via a polar transition state. Further evidence of this can be seen in the literature
in which it has been reported that PADS solutions made up in less polar solvents with high
concentrations of base (e.g. 5 M 3-picoline in toluene) degrade at a much slower rate96
.

71
kobs = (1.29 × 10-05) × [Picoline]
R² = 7.64E-01
0
1
2
3
4
5
6
7
8
0 1 2 3 4 5 6
ko
bs ×
10
5 / s
-1
[Picoline] / M
Pseudo First-Order Rate Constants (kobs /s-1) for Decomposition of PADS
(3.3 mM) as a Function of 3-Picoline Concentration (M) in Acetonitrile at
25oC
Figure 23: Pseudo first-order rate constants of degradation of PADS (3.3mM) in various concentrations of 3-picoline
in acetonitrile monitored by HPLC at 25oC.

72
4-MeO
3-Me
H
3-MeO
4-CN
2,6-Me log k = 0.36 x pKa(ACN) - 10.5
R² = 0.94
-7.75
-7.25
-6.75
-6.25
-5.75
-5.25
7.50 8.50 9.50 10.50 11.50 12.50 13.50 14.50
log
k
pKa (ACN)
3.3 Effect of Pyridine pKa on the Rate of Degradation
Since the rate of degradation of PADS is related to the concentration of 3-picoline it is important to
assess the role of 3-picoline in the reaction. If degradation is due to a solvent effect then altering the
pKa of the pyridine used as a catalyst in this process should have a random effect, not proportional
to the substituent since solvent dielectric constant is not related to the acidity or basicity of the
solvent molecules. PADS (0.2 M) was made up in solutions of several different pyridines (2.5M) in
ACN-d3 and the pseudo first-order rate constants for the degradation of PADS were determined by
1H NMR and the corresponding second order rate constants plotted as a function of the pKa of the
base (Fig. 24).
Second-Order Rate Constants (log k/M-1s-1) for Ageing PADS (0.2 M) with
various Pyridines (2.5 M) in Acetonitrile-d3 at 25oC Monitored by 1H NMR
Figure 24: Brønsted plot of log of the second-order rate constants for the degradation of PADS (0.2 M) with various
pyridines (2.5 M) determined by 1H NMR in acetonitrile-d3 at 25
oC

73
Inspection of Fig. 24 shows that PADS degradation is linearly related to the pKa of the pyridine
catalyst used and the rate constants increase with increasing basicity of the catalyst. This makes it
unlikely that the role of 3-picoline in the ageing process is entirely a solvent effect. Instead, these
data suggest that these pyridine catalysts act as either a base of a nucleophile (Scheme 12). The
slope of the Brønsted plot gives a βNuc value of 0.37 which suggests only partial build-up of positive
charge on the pyridine nitrogen in the transition state of the reaction if it is acting as a nucleophile.
However, since pKa can be indicative of both the relative nucleophilicity and basicity, it is not
possible to ascertain the exact role of 3-picoline directly from these data.
Scheme 12: Possible mechanisms of attack of 3-picoline on PADS as (1) a base and (2) a nucleophile.

74
3.4 Nucleophilic or General Base Catalysis by 3-Picoline
As mentioned previously, the rate of decomposition of PADS is linearly related to the pKa of the
pyridine catalyst used. If catalysis involved nucleophilic attack on PADS by 3-picoline then the first
step in the mechanism proceeds as illustrated in Scheme 13, producing the acylpyridinium cation as
one of the major products.
Scheme 13: Nucleophilic attack by 3-picoline on PADS
Mass spectral analysis of multiple solutions of aged PADS was not able to detect the presence of
the acylpyridinium ion. An attempt was therefore made to synthesise this species by reacting 3-
picoline with phenylacetyl chloride since the carbonyl carbon is extremely electrophilic. However,
rather than acting as a nucleophile the 3-picoline acted as a base, removing the proton alpha to the
carbonyl group. This generated the ketene (Scheme 13) and multiple cyclo-addition products
(Figure 25). This result suggests that 3-picoline may not act as a nucleophile in the pyridine
catalysed decomposition of PADS and instead acts as a base.
Further evidence for picoline acting as a base and not a nucleophile can be seen when using non-
nucleophilic pyridines as the catalyst. Using either two equivalents of triethylamine or di-isopropyl
ethyl amine (Hϋnug’s Base) gives complete degradation of PADS within 5 minutes. Similarly,
using 2,6-lutidine, a sterically hindered pyridine, causes degradation at a rate which fits the linear
correlation of the Brønsted plot (Figure 24). If the reaction mechanism involved nucleophilic
catalysis then using these sterically hindered bases would be expected to hinder catalysis.
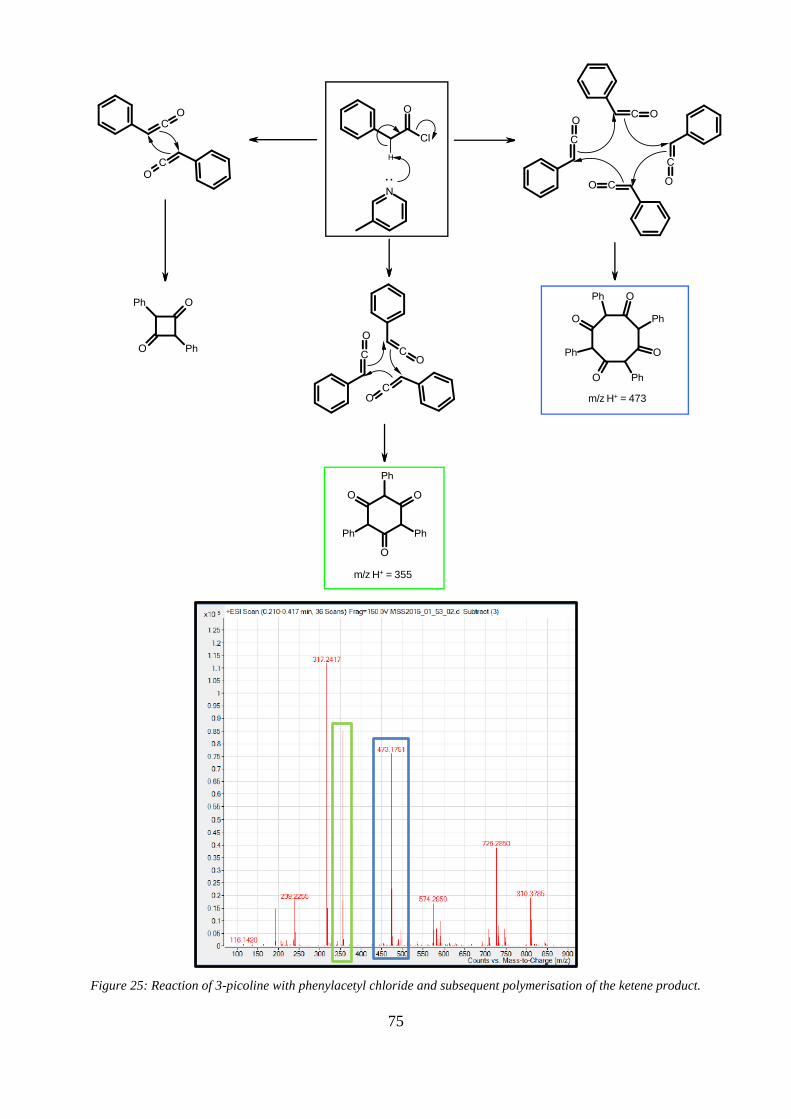
75
Figure 25: Reaction of 3-picoline with phenylacetyl chloride and subsequent polymerisation of the ketene product.
m/z H+ = 473
m/z H+ = 355
..

76
X = H
X = 3-Cl
X = 4-Cl
X = 4-F
-4.10
-4.00
-3.90
-3.80
-3.70
-3.60
-3.50
-3.40
-3.30
-3.20
0 0.05 0.1 0.15 0.2 0.25 0.3 0.35 0.4
log
ko
bs
Hammet σ
3.5 Possible Mechanisms Proceeding With 3-Picoline Acting as a Base
The experimental evidence so far suggests that nucleophilic attack by picoline during PADS
degradation does not occur. Therefore it is likely that picoline acts as a base in this process,
removing the proton adjacent to the carbonyl group in PADS (Scheme 12). This proposal is
supported by the reaction of 3-picoline with phenylacetyl chloride (Figure 25). Electron
withdrawing substituents in the aromatic ring of PADS increase the rate of degradation. This is
expected if these substituents increase the acidity of the PADS CH2 hydrogens (figure 26). These
substituents would have little effect on the electrophilicity of the carbonyl carbon and therefore any
reaction proceeding via a nucleophilic pathway would be little affected by this.
log Pseudo First-Order Rate Constant k (s-1) for the ageing of various
substituted PADS as a function of the Hammett σ of phenyl substituent
Figure 26: log of the pseudo first-order rate constants for the decomposition of various substituted PADS analogues
(3.3 mM) with 3-picoline (1 M) as a function of the Hammett σ value of the PADS phenyl substituent

77
There are two ways in which this base catalysis could proceed, both involving elimination
mechanisms: an E2 mechanism in which the proton abstraction and C-S bond fission occur
simultaneously, or an E1cB mechanism in which the proton is abstracted to yield an intermediate
which degrades in the rate-limiting step (Scheme 14). In both cases, the suggested products of the
degradation are the ketene (2) and the acyl disulfide anion (1).
Scheme 14: Possible mechanisms for the base catalysed degradation of PADS
As mentioned previously, attempts to isolate the acyl polysulfide anionic species have been
unsuccessful, however, HPLC analysis of aged PADS solutions suggests that they may exist in
small quantities (Figure 18). Therefore, in order to distinguish between these two mechanisms and
to justify the proposed mechanistic pathway other species generated in the mechanism needed to be
identified or trapped.
-
-
(1) (2)
E2
E1cB
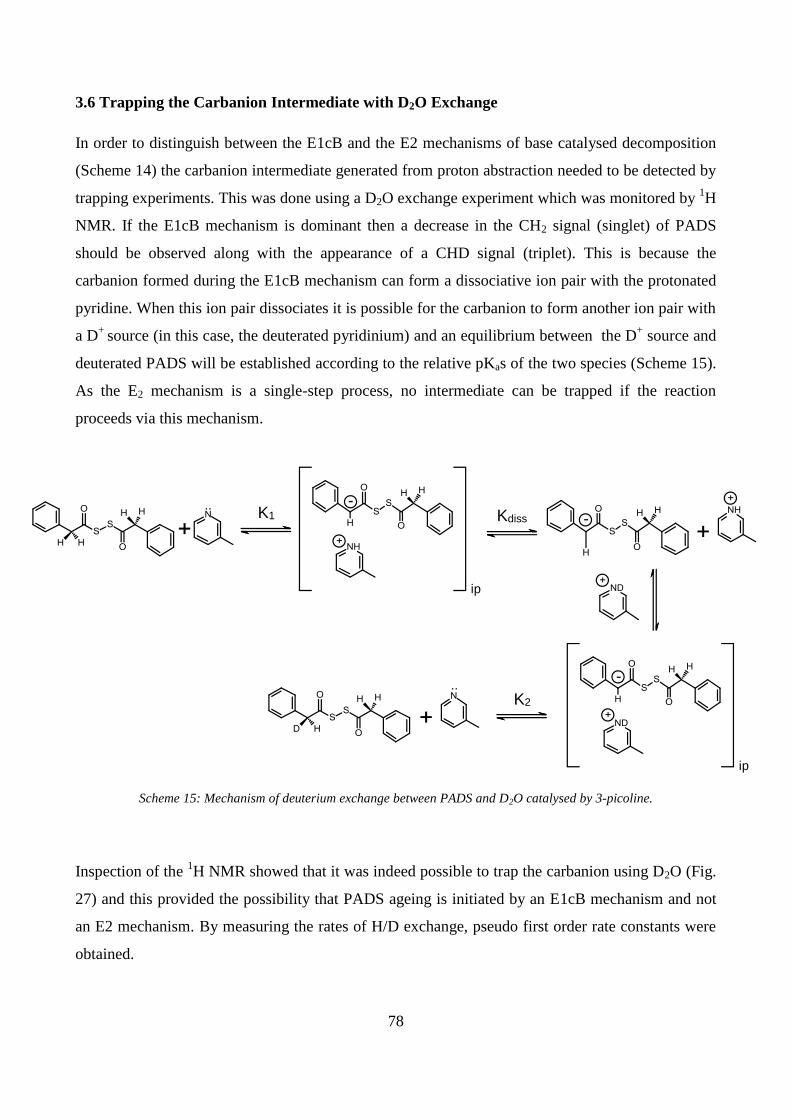
78
3.6 Trapping the Carbanion Intermediate with D2O Exchange
In order to distinguish between the E1cB and the E2 mechanisms of base catalysed decomposition
(Scheme 14) the carbanion intermediate generated from proton abstraction needed to be detected by
trapping experiments. This was done using a D2O exchange experiment which was monitored by 1H
NMR. If the E1cB mechanism is dominant then a decrease in the CH2 signal (singlet) of PADS
should be observed along with the appearance of a CHD signal (triplet). This is because the
carbanion formed during the E1cB mechanism can form a dissociative ion pair with the protonated
pyridine. When this ion pair dissociates it is possible for the carbanion to form another ion pair with
a D+
source (in this case, the deuterated pyridinium) and an equilibrium between the D+ source and
deuterated PADS will be established according to the relative pKas of the two species (Scheme 15).
As the E2 mechanism is a single-step process, no intermediate can be trapped if the reaction
proceeds via this mechanism.
Scheme 15: Mechanism of deuterium exchange between PADS and D2O catalysed by 3-picoline.
Inspection of the 1H NMR showed that it was indeed possible to trap the carbanion using D2O (Fig.
27) and this provided the possibility that PADS ageing is initiated by an E1cB mechanism and not
an E2 mechanism. By measuring the rates of H/D exchange, pseudo first order rate constants were
obtained.
..K1
ip
ip
..
--
-
Kdiss
K2

79
0
0.02
0.04
0.06
0.08
0.1
0.12
0.14
0.16
0.18
-500 500 1500 2500 3500 4500
Co
nc
en
tra
tio
n (
M)
Time (s)
[CH2]
[CHD]
Concentration (M) of CH2 and CHD PADS Species (1H NMR) in D2O
Exchange Experiment
Figure 27: Concentration of PADS CH2 and CHD as a function of time for 3-picoline catalysed PADS deuterium
exchange.
TIM
E
(3)
R = Me or H

80
kobs = (5.69 × 10⁻³) × [Picoline]
R² = 0.96
0
0.5
1
1.5
2
2.5
3
3.5
4
4.5
0 0.1 0.2 0.3 0.4 0.5 0.6 0.7
ko
bs ×
10
3 /
s-1
[Picoline] / M
Further experiments demonstrated that these pseudo first-order rate constants for carbanion
formation, like PADS decomposition, is linearly related to the concentration of 3-picoline and is
therefore a second order process in which the rate is proportional to the concentration of PADS and
of the base catalyst (Fig. 28). The corresponding second order rate constant for exchange is 5.69 x
10-3
M-1
s-1
at 25oCin 12% D2O in acetonitrile-d3.
Pseudo First-Order Rate Constants (kobs/s-1) for Deuterium Exchange as a
function of 3-Picoline Concentration at 25oC in 12% D2O in Acetonitrile-d3
Figure 28: Pseudo first-order rate constants for deuterium exchange as a function of 3-picoline concentration
determined by 1H NMR at 25
OC in 12%
D2O in acetonitrile-d3
Analysis of the 1H NMR spectra for the deuterium exchange experiment (Fig. 27) not only shows
loss of the CH2 signal but also the rise and subsequent loss of the CHD signal. In order for this
carbanion formation to be relevant to PADS ageing it must be much faster than the ageing process.
To ensure this is the case, a similar experiment was performed substuting D2O for H2O, under the
same conditions as the deuterium exchange experiment. The 1H NMR spectra showed that loss of
the CH2 signal still occurs due to decomposition and is around 500 times slower than the rate of
exchange with pseudo first-order rate constants kobs (D2O) = 1.75 × 10⁻³
s-1
and kobs (H2O) = 6.30 ×
10-6
. This difference in the observed pseudo first-order rate constants is adequate to assume that
carbanion formation is relevant to the ageing process.

81
Finally in a separate experiment to establish the intermediate formation of a carbanion, an attempt
was made to quench ageing PADS mixtures with methyl triflate which trapped the carbanion
yielding a mixture of the varying degrees of α-methylated PADS species (3).
From the above data, it is possible to calculate the rate of decomposition of the carbanion
intermediate if the pKa of PADS were known. This is important information as for the mechanism
to be classified as an E1cB mechanism and not a concerted E2 mechanism, the intermediate must
have a reasonable lifetime (i.e. longer than the time taken for a C-H bond vibration but short enough
to give the observed decomposition).
Scheme 16: E1cB initiated degradation of PADS
The proposed mechanism of PADS degradation by an E1cB mechanism is illustrated in Scheme 16.
The rate of degradation of PADS determined from the experiment performed with 12% H2O in
acetonitrile—d3 is equal to the overall rate of degradation whereas the rate observed from the D2O
experiment is the rate of carbanion formation i.e:

82
+
-..
K1
+
kobsdegrad.
= K1 x k2
kobsex-
= k1
Where K1 = k1 / k-1
Therefore the rate of degradation of the carbanion can be calculated as shown below.k-1 is assumed
to be diffusion controlled111
and therefore ≈ 1 x 10¹⁰
M-1
s-1
. The rate of the diffusion controlled
process may be expected to vary slightly as the viscosity of acetonitrile is lower than that of water
however the value of 1010
can be used as a minimum value.
kobsdegrad.
= K1 x k2 = 6.30 x 10⁻⁶
s-1
K1 = kobsex
/ k-1 = (5.69 x 10⁻³
)/(1010
) = 5.69 x 10⁻¹³
Calculated k2 = kobsdegrad.
/ K1
= (6.30 x10⁻⁶
)/(5.69 x 10-13
)
= 1.12 x 10⁷ s
-1
The value of ~107 s
-1 for the degradation of the carbanion is reasonable and shows the reversibility
of the carbanion formation.

83
3.7 Calculation of the pKa of PADS
In order to test the validity of the suggested E1cB mechanism the deuterium exchange data can be
used to estimate the pKa of PADS under the solvent conditions of the experiment (i.e. acetonitrile-d3
with ~12% D2O).
As mentioned earlier, equilibrium between deuterated PADS and deuterated picoline is established
according to the relative pKas of the two species i.e:
Since the pKa of 3-picoline is known in pure acetonitrile111
then the pKa of PADS can be calculated
as follows:
pKa of 3-picoline ACN = 13.7
Ka of 3-picoline in ACN = 2 x 10-14
K1 = 5.69 x 10⁻¹³
KaPADS
= (KaPicH+
) x (K1) = (2 x 10-14
) x (5.69 x 10⁻¹³
)
KaPADS
= 1.138 x 10⁻²⁶
pKaPADS
= 25.9
In order to see if this value is reasonable it is possible to compare it to the pKa of similar
compounds and assess how substituents affect the pKa of these derivatives. The pKa values of
several esters are listed in Table 1.
K1 = [PADS−][PicH+]
[PADS][Pic]
𝐾𝑎PicH+ =
[Pic][H+]
[PicH+]
K𝑎PADS =
[PADS−][H+]
[PADS]
K1 = [K𝑎
PADS]
[K𝑎PicH+]

84
Compound pKa in Solvent
Water DMSO ACN
1
21 24.9 37.8
2
25.6 29.5
3
18.7 22.6
4
14.1 18 30.9
5
H +
5.7 3.7 13.7
Table 1: Table of calculated and literature reported pKas of various ethyl esters in various solvents111
.
The black values are reported in the literature whilst the red values are estimated based on looking
at the effects of structural changes in compounds of known pKa. For example, changing the ester
group (2) for a thioester group (1) decreases the pKa of the α-protons by 4.6 units, changing the
solvent from water to DMSO increases the pKa of the ethylester (2) by 3.9 units and replacing one
of the α-protons with a phenyl ring decreases the pKa of the remaining α-protons in the ethyl ester
(3) by 6.9 units. Assuming that these changes are roughly uniform and can be applied to derivatives
within the same series, the approximate pKa values of the phenyl substituted ethyl thioester (4) can
be estimated (30.9). The chemical environment in which the α-protons in this molecule are situated

85
is very similar to the environment in which the α-protons in PADS are situated and therefore this
can be considered a good comparison, since no data is available for the pKa of acyldisulfides or
peroxides.
The measured value of 25.9 for the pKa of PADS is slightly lower than the calculated value for that
of the thioester (8) in Table 1. This could be due to one of two or both of the following factors:
1. The measured value for PADS was measured in a solution containing ~12% D2O. This
would be expected to lower the pKa by several units. There is little to no data on the pKa in
binary solvents of this type and due to the macro behaviour of solvent molecules it is not
easy to predict what this change might be.
2. The model compound is a thioester whereas PADS is an acyl disulfide in which the adjacent
sulfur and acyl group would be expected to be more electron withdrawing than the ethyl
group in the model. This also lowers the pKa.
In summary the calculated pKa value for PADS as a carbon acid of ~26 is a reasonable value.

86
x = 4OMe
x = H
x = 4Cl
x = 4CN
log kobs = (2.06 × Hammett σ) - 2.72
-3.5
-3.0
-2.5
-2.0
-1.5
-0.4 -0.2 0 0.2 0.4 0.6 0.8
log
ko
bs
Hammett σ
3.8 Deuterium Exchange with Phenyl Substituted PADS Species
Further evidence for a base-catalysed mechanism for the degradation of PADS can be seen when
investigating the rate of degradation of phenyl substituted PADS species. Adding substituents to the
phenyl rings of PADS should alter the pKa of the methylene CH2 protons whilst leaving the
electrophilic carbonyl carbon largely unaffected. If the process is indeed base-catalysed then adding
electron withdrawing groups to the phenyl ring of PADS should increase the rate of proton-transfer
and degradation. To investigate this, various phenyl substituted PADS compounds were
synthesised112
and the rates of deuterium exchange and proton transfer were assessed under
identical conditions as those used for PADS.
Pseudo First-Order Rate Constants (Log kobs/s-1) for H/D Exchange for
Various Phenyl Substituted PADS as a Function of Hammett σ Value of
PADS Substituent in 12% D2O/acetonitrile
Figure 29: log of the pseudo first-order rate constants for H/D exchange of methylene protons in various substituted
PADS analogs (0.17 M) with 3-Picoline (0.35 M) monitored by 1H NMR at 25
oC in deuterated acetonitrile with 12%
D2O
From these data, the pKas of the various substituted PADS analogues can be calculated based
onsimilar calculations to those used for PADS in section 3.7. These data can then be used to
construct a Brønsted plot of degradation of substituted PADS analogues vs their pKa calc.

87
log kobs = (-0.49 × pKa calc.) + 7.75
-5.80
-5.60
-5.40
-5.20
-5.00
-4.80
-4.60
-4.40
24.25 24.75 25.25 25.75 26.25 26.75
log
ko
bs
pKa calc.
Subst. σ kexchange (M-1s-1) log kexchange pKa calc
MeO -0.27 1.38 × 10⁻³ -2.86 26.56
H +0.00 5.16 × 10⁻³ -2.29 25.99
4Cl +0.23 2.20 × 10⁻² -1.66 25.36
4CN +0.66 1.09 × 10⁻¹ -1.42 24.66
Table 2: Table of the second-order H/D exchange rate constants determined by 1H NMR at 25
oC in 12% D2O in
acetonitrile-d3 and calculated pKa of several substituted PADS analogues in 12% D2O in Acetonitrile-d3.
Brønsted Plot of Degradation of Substituted PADS Analogues as a
Function of pKa calc in 12% D2O in Acetonitrile-d3
Figure 30: Brønsted plot showing the log of the observed pseudo first-order rate constants of the degradation of
substituted PADS analogues (0.17 M) as a function of pKa calc in 12% D2O in Acetonitrile-d3 using 3-Picoline (0.35 M)
as the base. Pseaudo first-order rate constants determined by 31
P NMR
The inverse relationship between pKa and the rate of degradation seen in Fig 30 is indicative of
negative charge build-up on the methylene CH2 of PADS as would be the case with base-catalysed
carbanion formation. This further supports the idea that the degradation of PADS proceeds via an
E1cB mechanism.

88
3.9 Ageing PADS Analogues without Dissociable Protons
Experimental evidence suggests that the ageing of PADS is initiated via an E1cB mechanism in
which the α-protons of the PADS molecule are removed by the base catalyst (Scheme 16).
In order to confirm this and to assess whether an alternative mechanism can occur, PADS analogues
with no dissociable α-protons were synthesised: 2,2,2′,2′-tetramethyl 2,2′phenylacetyl disulfide (4)
and bis-benzoyl disulfide (5). Solutions of these were made in a solution of 3-picoline (5M) in
acetonitrile. The concentration of these species was monitored over the course of 1 week.
(5)(4)
Figure 31: Acyldisulfide compounds synthesised without dissociable protons
NMR and HPLC analysis showed that these molecules were stable in 5 M 3-picoline acetonitrile
solution under the same conditions which caused the degradation of PADS. This therefore further
suggests that the predominant mechanism of PADS degradation is initiated by picoline acting as a
base.

89
3.10 Trapping the Ketene By-Product
The suggested E1cB mechanism of PADS degradation involves the asymmetrical degradation of the
PADS molecule generating two major by-products: a disulfide anion and a ketene.
Scheme 17: E1cB initiated degradation of PADS
As previously mentioned, attempts to isolate the disulfide anions were unsuccessful, however the
presence of acyl polysulfides and sulfur in aged PADS solutions suggests their existence. Therefore
an attempt was made to detect the ketene by-product by trapping it via a [2+2]-cycloaddition
reaction. This was done by synthesising an o-allyl substituted PADS molecule and ageing this in the
usual way.
Scheme 18: Mechanism of [2+2]-intramolecular cycloaddition reaction trapping the ketene intermediate.
-
K1-
k2
(6) (7)
..

90
1
2 2 3
4 4
1
23
4
RMM = 158.07
Initially, the desired cyclo-addition product was synthesised using 2-(o-allylphenyl)-acetylchloride
using diethyl amine as the base catalyst in DCM. A pure sample of the cyclo-addition product (6)
was isolated by preparative HPLC and analysed by 1H NMR (figure 32) so that this could be used
as a reference sample for analysis of crude ageing PADS mixtures.
Figure 32: Synthesis and 1H NMR spectrum of cycloaddition product (6)
1H NMR Analysis of aged PADS solutions showed the presence of this cyclo-addition product
(figs33 and 34) amongst other ageing products. Mass spectral analysis of these solutions also
showed evidence of the cyclo-addition product and the expected mass spectra fragments. This
further supports the proposed mechanism of PADS ageing.
DCM, 2 h
Reflux
(6)

91
Figure 33: 1H NMR spectra of crude solutions of 2,2´-(allylphenyl)acetyl disulfide(bottom, blue) and pure, isolated
cycloaddition product (6) (top, red)

92
m/z H+ = 159.0804
Figure 34: Mass spec. analysis of cyclo-addition product (6) degradation fragments.

93
3.11 Isolation of the Products of Ageing by Preparative HPLC
A sample of PADS (1 M, 1 ml) was made up in acetonitrile with 3-picoline (3 M) and was allowed
to age for 48 h. After 48 h the solution was quenched with HCl (2 M, 10 ml) and the aqueous
solution was extracted with DCM (30ml). The organic layer was retained and the solvent removed
to give a solution of aged PADS in which the 3-picoline and any very polar degradation products
had been removed (Fig. 35).
Figure 35: Above - HPLC chromatogram of a solution of PADS aged for 48 h and extracted with dilute HCl. Below:
Expansion of fractions 6-10 from the chromatogram above

94
Using a HPLC equipped with a fraction collector the crude aged PADS mixture was separated
according to the fractions illustrated in Fig. 35. Before further analysis each fraction was mixed
with an excess of triphenyl phosphite and 3-picoline in order to assess whether these fractions were
active sulfur transfer reagents or not. 31
P NMR analysis of these reaction mixtures found that
triphenyl phosphorothioate ((PhO)3PS) was only present in the reactions of fractions 5, 7, 8, 9 and
10. Therefore fractions 1, 2, 3, 4 and 6 were discarded and were not collected. (note: the
concentration of the reactant in the fractions was not standardised at this point as the test merely
aimed to qualitatively assess which fractions were active and so some fractions were more
concentrated than others hence the large difference in the amount of conversion to product).
Figure 36:
31P NMR analysis of reactions of HPLC fractions of aged PADS solution with triphenyl phosphite in the
presence of 3-picoline. Blue- triphenyl phosphite, red- triphenyl phosphorothioate, green- triphenyl phosphine oxide
(internal standard).
FRACTION 1
FRACTION 2
FRACTION 4
FRACTION 5
FRACTION 6
FRACTION 7
FRACTION 8
FRACTION 9
FRACTION 10

95
Table 3: Table of data from sulfurisation reactions using fractions from aged PADS reaction.
It was difficult to obtain reliable mass spectral data for phenylacetyl polysulfides. This, coupled
with the small amount of material collected during these separations, meant that no mass spectral
data was generated for these fractions. However, previous LC-MS (Fig. 20-22) suggests that these
fractions are polysulfides. Similarly, small amount of material collected meant that full 2D NMR
analysis of these fractions was not possible. Careful analysis of the acyl CH2 region of the 1H NMR
spectra (figure 37), however, show similar patterns to that of aged PADS i.e. the CH2 signals move
further and further upfield with the remainder of the spectrum remaining very similar to that of
PADS itself (Fig. 19).
Figure 37:Acyl CH2 region of various PADS species isolated from aged PADS mixtures by HPLC
Fraction no. Integration %
Reaction Phosphite P=S
1 1.53 0.00 0.00
2 1.50 0.00 0.00
4 1.43 0.00 0.00
5 1.06 0.60 36.14
6 1.54 0.00 0.00
7 1.57 0.07 4.27
8 1.05 0.68 39.31
9 1.46 0.25 14.62
10 0.95 0.99 51.03
FRACTION 10
FRACTION 9
FRACTION 8
FRACTION 7
FRESH PADS
FRACTION 5
24 h AGED

96
Once the reactive fractions in the aged PADS mixtures were identified solutions of each (35 mM
calculated by HPLC) were made up in acetonitrile-d3. The relative rates of reaction of these
compounds were then assessed using 31
P NMR by reaction with triphenyl phosphite as the limiting
reagent. The experiment showed that each of these compounds show a pseudo first-order rate
profile due to the excess of the sulfur transfer reagent and 3-picoline. The data also showed that
each of these compounds generally showed a similar rate of reactivity towards triphenyl phosphite
to PADS under the same conditions. Some fractions (fractions 5, 9 and 10) show a slight increase in
rate over PADS but their concentrations in degraded PADS are not known, other than they must be
less than that of PADS itself.
Species kobs (s-1) Ratio kfrac/kPADS
PADS 7.46 × 10⁻⁵ 1.00
Frac. 5 8.72 × 10⁻⁵ 1.17
Frac. 7 1.83 × 10⁻⁵ 0.25
Frac. 8 2.65 × 10⁻⁵ 0.36
Frac. 9 4.23 × 10⁻⁴ 5.67
Frac. 10 1.09 × 10⁻⁴ 1.46
Table 4: Table of pseudo first-order rate constants for the reaction of triphenyl phosphite (3.5mM) with various PADS
species (35 mM) in the presence of 3-picoline (70 mM) determined by 31
P NMR at 25oC
in acetonitrile-d3.

97
3.12 Ageing PADS in the Presence of the Radical Trap Butylated Hydroxytoluene
The mechanism of ageing of PADS proposed here is initiated by base and proceeds via charged
intermediates as suggested by all previous experimental data. There are several reports in the
literature, however, of disproportionation of polysulfides via pathways involving polysulfide
radicals107
. In order to assess whether there is any radical involvement in the ageing of PADS two
samples of PADS (3.3mM) were made up in solutions of 3-picoline (1 M) in acetonitrile. To one of
the solutions, the radical trap butylated hydroxytoluene (BHT) was added (3.3 mM). The
concentration of PADS in these solutions was monitored simultaneously by HPLC over 60 hours. If
PADS degradation proceeds via a radical mechanism then the addition of BHT would be expected
to slow or stop degradation by quenching the radical products of degradation and forming the stable
BHT radical (Fig. 38).
Figure 38: Mechanism of quenching radicals by butylated hydroxytoluene113
.
RSHRS.
.
(BHT)

98
ln [PADS] = (-4.91 × 10⁻⁶) × Time - 5.94
-7.00
-6.80
-6.60
-6.40
-6.20
-6.00
-5.80
0 50000 100000 150000 200000
ln [
PA
DS
]
ln [PADS] = (-5.69 × 10⁻⁶) × Time - 5.98
0 50000 100000 150000 200000
ln[PADS] as a Function of Time for Degradation of PADS (3.3 mM) in 3-
picoline (1 M) in acetonitrile with (right) and without (left) BHT (3.3 mM)
Time (s)
Concentration of BHT (mM) kdeg (s-1)
0 5.69 × 10⁻⁶
3.3 4.91 × 10⁻⁶
Figure 39: ln Concentration of PADS as a function of time during ageing with 3-picoline (1 M) in acetonitrile-d3 at
25oC both with (left) and without (right) BHT (3.3mM)
Figure 39 shows that the addition of BHT into the system made no significant difference to the rate
of degradation of PADS. It can be assumed that there is no radical involvement in the ageing of
PADS.

99
4. Results and Discussion:
Sulfurisation

100
0
2
4
6
8
10
12
0 10 20 30 40 50
ko
bs ×
10
3 / s
-1
Time aged (h)
PADS is widely used as a sulfur transfer reagent. As seen in the previous chapter, before PADS is
used industrially, it is ‘aged’ in basic acetonitrile to yield polysulfides114
. These species are more
active sulfur transfer reagents than PADS and therefore the rate of sulfurisation increases with
ageing (figure 40). However, fresh solutions of PADS are still active sulfur transfer reagents.
Psuedo first order rate constants (kobs / s-1) for sulfurisation of triphenyl
phosphite (0.1 M) using PADS (1 M) aged for n hours in 3-picoline (2 M) in
Acetonitrile at 25oC
Figure 40: Pseudo first-order rate constants for sulfurisation of (PhO)3P (0.1 M) using PADS (1 M) aged for n h in 3-
picoline (5 M) in acetonitrile at 25oC determined by
31P NMR
There has been speculation about the mechanism of sulfur transfer using PADS in the literature108
but no detailed kinetic or mechanistic studies have been performed. The following chapter describes
a study of the mechanism of sulfur transfer using both fresh and aged PADS and also describes the
differences in their reaction mechanisms.

101
4.1 Fresh PADS
4.1.1 Determination of the Order of the Sulfurisation Reaction
The mechanism of sulfurisation of phosphites by PADS has been presumed in the literature to
involve nucleophilic attack of the phosphite on PADS to form a phosphonium ion intermediate.
This is followed by attack of a thiocarboxylate ion at the thioester to generate the thiophosphate
product and the monosulfur acid anhydride species (Fig. 41)108
.
Figure 41: Literature106
reported mechanism of sulfurisation of phosphites by PADS.
However, since the reaction is always performed in the presence of a large amount of organic base,
it is important to assess whether or not the base plays a part in the mechanism or is simply present
as a co-solvent. In order to assess this, the rates of sulfurisation reactions were determined with
varying concentrations of 3-picoline (Fig. 42) under pseudo first-order conditions. It was found that
the rate constants for pseudo first-order sulfurisation were linearly proportional to the concentration
of 3-picoline. This suggests that the organic base is involved in the mechanism of the reaction and,
more importantly, acts before or during the rate limiting step and therefore appears in the rate
equation. As the relationship between the rate and the concentration of 3-picoline is linear (i.e. the
rate increase is directly proportional to the 3-picoline concentration) the reaction must be first order
with respect to picoline. It has been suggested in the literature106
that this relationship is due to a
solvent effect as a solution of 5 M 3-picoline is around 50 % v/v. The dielectric constant of 3-
picoline is 10 and the dielectric constant of acetonitrile is 37.5115
. Adding 3-picoline to acetonitrile
would therefore lower the overall dielectric constant of the solution. As will be shown later in this
section, sulfurisation reactions proceed faster in higher dielectric solutions and therefore the effect
of 3-picoline is unlikely to be a solvent effect.
: P(OR)3
(PhO)3P=S
-

102
kobs = (3.56 × 10⁻⁴) × [Picoline]
0
2
4
6
8
10
12
14
16
0 1 2 3 4 5
ko
bs ×
10
4 / s
-1
[Picoline] / M
It is also worthy of note that the sulfurisation reactions detailed within this report are performed
under pseudo first-order conditions i.e. all reagents except the phosphite are in excess. During the
course of the reaction the concentration of the phosphite (the rate limiting reagent) decreases
exponentially and so the reaction is also first order with respect to phosphite.
Pseudo first-order rate constants (kobs / s-1) for sulfurisation of P(OPh)3
(0.1 M) Using Fresh PADS (1 M) with Varying Concentrations of 3-Picoline
in Acetonitrile at 25oC
Figure 42: Pseudo first-order rate constants (s-1
) for sulfurisation of (PhO)3P (0.1 M) using PADS (1 M) with varying
concentrations of 3-Picoline determined by 31
P NMR at 25oC in acetonitrile-d3
Finally, the dependence of the rate of sulfurisation on the concentration of PADS was assessed
(Scheme 19) and again, the rate was found to be linearly dependent on the concentration of PADS
and the reaction is therefore first order with respect to PADS. This suggests an overall third order
process in which the rate of reaction is proportional to the concentration of all three reaction
components: phosphite, PADS and base. A rate law for the reaction is as follows:
Rate = k [Phosphite] [PADS] [Base]

103
kobs sulf. = 1.25 × [PADS] + (6.35 x 10⁻⁴)
7
8
9
10
11
12
0 1 2 3 4 5
ko
bs
su
lf. ×
10
4 / s
-1
[PADS] / M
Pseudo first-order rate constants (kobs/s-1) for Sulfurisation of P(OPh)3 (0.1
M) Using 3-Picoline (2 M) in Acetonitrile With Varying Concentrations of
Fresh PADS
Figure 43: Pseudo first-order rate constants for sulfurisation of (PhO)3P (0.1 M) using 3-picoline (2 M) with varying
concentrations of PADS

104
4.1.2 Distinction between PADS and Polysulfides as Active Sulfurisation Agent in Fresh PADS
Solution
Although showing lower reactivity than aged solutions, fresh solutions of PADS are active sulfur
transfer reagents. The sulfur transfer reaction is base catalysed. Since the decomposition of PADS
to generate polysulfides is also base catalysed it is important to make a distinction as to whether the
active sulfur transfer reagent in fresh PADS solutions is phenylacetyl disulfide (bottom route in
scheme 19) or the phenylacetyl polysulfides generated via ageing (top route in scheme 19). Since
the rate of reaction of fresh solutions is slower than with aged solutions it could be possible that this
difference in rate is due to the fact that PADS must first be converted to polysulfides before the
sulfurisation reaction can occur.
Scheme 19: possible pathways for the sulfurisation of phosphites using fresh PADS
In order to assess which route is active, two simultaneous reactions were performed in which PADS
(1 M) was mixed with 3-picoline (2 M) and to one of the reactions triphenyl phosphite (0.1M) was
added (herein labelled solution A and B respectively). Using 1H NMR, the concentration of PADS
was followed in solution A, whilst the concentration of phosphite was followed using 31
P NMR in
solution B (Fig. 44).
n
SULFURISATIONSLOW
AGEING
SULFURISATIONFAST

105
ln concentration PADS CH2 = (-1.05 × 10⁻³) × Time - 2.50
ln concentration phosphite = (-9.58 × 10⁻⁶) × Time - 0.01
-9
-8
-7
-6
-5
-4
-3
-2
-1
0
0 1000 2000 3000 4000 5000 6000
ln c
on
ce
ntr
ati
on
Time / s
ln concentration phosphite during sulfurisation ln concentration PADS CH2 during age
Figure 44: rate profiles of the decomposition of PADS and the sulfurisation of triphenyl phosphite in two parallel
reactions containing fresh PADS (1M), 3-picoline (2M) and, in solution B only, triphenyl phosphite (0.1M). Reactions
were performed at 25oC in acetonitrile
The data showed that under identical conditions, the rate of ageing is 2 orders of magnitude slower
than that of sulfurisation. Therefore it is unlikely that sulfurisation using fresh PADS is dependent
on the ageing of PADS and the generation of an active sulfur transfer species. These data also,
therefore, suggests that the PADS molecule itself acts as a sulfur transfer reagent under these
experimental conditions.

106
4.1.3 Distinction between a Radical and an Ionic Pathway
The oxidation of phosphites by disulfides is well known93,97
. The mechanism of this process,
however, is not easy to discern as there are potentially two different pathways i.e. nucleophilic
attack by phosphorus93
(Scheme 20 B) or single electron, radical mechanisms116
(scheme 20 A).
Scheme 20: Reported mechanisms of sulfurisation of phosphites by disulfides.
In order to distinguish between an ionic and a radical mechanism several sulfurisation reactions
were performed in the presence of the radical trap butylated hydroxyl toluene. If there is radical
involvement in the pathway then including this species should stop, or at least slow the reaction.
B
P(OR')3A RS.
-
R S P(OR')3 S=P(OR')3
.
S=P(OR')3
.
(OR')3P :
R

107
-12
-10
-8
-6
-4
-2
0
0 2000 4000 6000 8000 10000
Ln
[P
(OP
h) 3
]
Time (s)
0M BHT
0.1M BHT
1M BHT
The Time Dependence of the Concentration of Triphenyl Phosphite
(ln[P(OPh)3]) during Sulfurisation of P(OPh)3 using Fresh PADS (1 M), 3-
Picoline (2 M) and BHT (n M) in Acetonitrile at 25oC
Figure 45: Concentration of triphenyl phosphite (ln[P(OPh)3]) during sulfurisation with PADS (1 M) and 3-Picoline
(2 M) in the presence of BHT (n M) in Acetonitrile at 25oC determined by
31P NMR.
Table 5: Pseudo first-order rate constants for sulfurisation of triphenyl phosphite (0.1 M) with fresh PADS (1 M) and 3-
picoline (3 M) in the presence of BHT (n M). Reactions followed by 31
P NMR at 25oC in acetonitrile-d3
Inspection of the results of these experiments (Fig. 45) clearly shows that adding BHT to the
sulfurisation reaction has no effect on the rate of the reaction. Therefore it is unlikely that the
sulfurisation reaction proceeds via a radical process and is instead likely to be an ionic mechanism.
Further evidence for this can be seen when looking at the effect of solvent properties on the rate of
the reaction.
Concentration of BHT (M) kobs (s-1)
0 7.46 × 10⁻⁴
0.1 6.26 × 10⁻⁴
1 8.46 ×[# 10-4

108
Industrially, the sulfurisation reaction is carried out in a solvent of 50% (5 M) 3-picoline in
acetonitrile. In order to assess whether or not the reaction proceeds with significant charge
generation, the reaction was carried out in various solvents and the rates of the reactions were
assessed.
Table 6: Third-order rate constants for sulfurisation of (PhO)3P as a function of the solvent dielectric constant for
sulfurisation with 10eq PADS and 20eq 3-Picoline. Reactions followed by 31
P NMR at 25oC.
Inspection of the rate constants measured for the different solvent systems (Table 6) shows that the
sulfurisation of triphenyl phosphite by PADS proceeds faster in more polar solvents. This suggests
the generation of a significant amount of charge during the reaction which is stabilised by the
solvent. These data favour the proposal that the sulfurisation reaction proceeds via an electron pair
exchange (i.e. an ionic mechanism) rather than exchange of a single electron in a radical mechanism
since polar solvents solvate charged species more easily. As previously mentioned in section 4.1.1
the solvent effect observed here contradicts the theory proposed in the literature that the influence
of 3-picoline on this reaction is simply a solvent effect since adding 3-picoline would lower the
dielectric constant of the solvent and, as suggested by the data in table 6, slow the rate of reaction. It
therefore follows that the role of 3-picoline in this process is as a reagent and not simply a solvent.
Solvent Dielectric Constant k / M-2s-1 log k
Toluene 2.38 1.62 × 10⁻⁴ -3.79
Chloroform 4.81 5.90 × 10⁻⁴ -3.23
ACN 37.5 1.54 × 10⁻³ -2.81
DMSO 46.7 4.13 × 10⁻³ -2.38

109
x = 4OMe
x = 4Me
x = H
x = 4Cl
x = 4F
log kobs = 0.32 × (3 × σ) - 3.09
-3.4
-3.3
-3.2
-3.1
-3.0
-2.9
-2.8
-0.9 -0.4 0.1 0.6
log
ko
bs
3 × σ
4.1.4 Phosphite Substituent Effects on the Rate of Sulfurisation with Fresh PADS
The sulfurisation reaction probably proceeds via nucleophilic attack either by phosphite on PADS
or by PADS on the phosphite. In order to distinguish between a nucleophilic phosphite and an
electrophilic phosphite several substituted aryl phosphites were synthesised in order to assess the
effect of substituents on the rate of the sulfurisation reaction. The reaction was followed by 31
P
NMR, monitoring the consumption of the phosphite under pseudo first-order conditions in which
the concentrations of phosphite, PADS and 3-picoline were 0.1 M, 1 M and 2 M respectively (Fig.
46).
Observed Pseudo First-Order Rate constants (log kobs / s-1) for
Sulfurisation of Various Aryl Phosphites as a Function of the Substituent
(Hammett σ) in Acetonitrile
Figure 46: log of the observed pseudo first-order rate constants for the sulfurisation of various triaryl phosphites (0.1
M) with PADS (1 M) and 3-Picoline (2 M) as a function of the Hammett σ value of the substituent in acetonitrile-d3 at
25oC.

110
Table 7: Data from Hammett plot for the sulfurisation of various tris-aryl phosphites (0.1 M) with PADS (1 M) and 3-
Picoline (2 M) in acetonitrile-d3 at 25oC.
A Hammett plot for the data (Fig. 46) shows that electron-withdrawing groups increase the rate of
reaction. This could suggest a build-up of negative charge on phosphorus in the transition state of
reaction relative to the reactant state, i.e. phosphorus acting as an electrophile. However, the small
value of the reaction constant (ρ = 0.32) suggests either a small build-up of negative charge
(unlikely in a mechanism involving nucleophilic attack on phosphorus) or a multi-step reaction in
which the ρobs is the sum of opposing ρ values of each step (Scheme 21). However, when looking at
the individual rate constants of these reactions (Table 7) there is only a 3 fold increase in rate from
the most electron donating substituent to the most electron withdrawing substituent, which is not
very significant. Similarly, as previously mentioned, the magnitude of the reaction constant is not
very large. For example, the ρ value for the reaction of substituted triaryl phosphites with aryl
selenoxides, in which the phosphite is an electrophile is +2.3117
. In reactions involving triaryl
phosphites as nucleophiles, for example reaction with diphenyl trisulfide, the ρ value is -1.1117
. The
ρobs in this case is obviously much lower than these values.
Scheme 21: Possible mechanisms of sulfurisation of phosphites by PADS in 3-Picoline/Acetonitrile.
Subst. σ k / s-1 log k
4-OMe -0.804 4.22 × 10⁻⁴
-3.374
4-Me -0.51 6.36 × 10⁻⁴
-3.197
H 0 7.70 × 10⁻⁴
-3.113
4-F 0.186 1.30 × 10⁻³
-2.886
4-Cl 0.681 1.24 × 10⁻³
-2.907
: P(OR)3
S=P(OR)3
-ve ρ
-+ Nuc
A
ρobs = ρ1 + ρ2
++ve ρ
P(OR)3
+ve ρ
--ve ρ
S=P(OR)3
B

111
R = Me
R = Et
R = F3Et
R = 2ClEt
log kobs = (0.51 × subst. pKa (H2O)) - 10.24
-4
-3.5
-3
-2.5
-2
-1.5
12 13 14 15 16
log
ko
bs
pKa of ROH in H2O
Due to this low dependence of the rate of sulfurisation on phosphite substituent effect, the effect of
alkoxy substituents was assessed. It is possible that the small effect of aryl substituents is due to the
distance of the phosphorus centre from the m- and p- substituents as seen in the relative sensitivities
of the ionisation of benzoic acid and phenylacetic acid in which the acid group in the benzoic acid is
closer to the substituent and so the substituent has a larger effect118
. This is minimised when using
alkoxy phosphites. Also, not only are the reactions of alkoxy phosphites with PADS much faster
than those of the aryl phosphites, the alkoxy species offer a much wider range of the strength of the
nucleophiles. The Brønsted pKa range of the corresponding alcohols of the alkoxy substituents
investigated spans over 3 units whereas the pKa range of the corresponding phenols of the alkoxy
substituents barely spans 0.6 units (note pKa values refer to aqueous acidity). However, due to the
rapid rates of reaction of these compounds in acetonitrile, it was necessary to perform the reactions
in chloroform at a lower concentration.
Pseudo First-Order Rate Constants (log kobs/s-1) of Sulfurisation of Various
Alkoxy Phosphites (P(OR)3) as a Function of ROH pKa(H2O) in Chloroform
at 25oC
Figure 47: Brønsted plot for the sulfurisation of various alkoxy phosphites (0.03 M) with PADS (0.3 M) and 3-Picoline
(0.6 M) determined by 31
P NMR in Chloroform at 25
oC

112
R pKa(H2O) kobs /s-1 log k
Me 15.54 5.10 × 10⁻³
-2.29
Et 16.00 1.43 × 10⁻²
-1.84
F3Et 12.43 1.98 × 10⁻⁴
-3.70
2ClEt 14.31 5.60 × 10⁻⁴
-3.25
Table 8: Table of observed pseudo first-order rate constants determined by 31
P NMR for the sulfurisation of various
alkoxy phosphites (0.03 M) with PADS (0.3 M) and 3-Picoline (0.6 M) in CDCl3 at 25oC
The Brønsted βnuc value +0.51 (Fig. 47) is much more definitive and mechanistically useful than the
value of the reaction constant determined with aryl phosphites. The βnuc value of +0.51 indicates a
build-up of positive charge on phosphorus in the transition state. This is in-line with a reaction
mechanism proceeding via nucleophilic attack by phosphorus on one of the sulfur atoms in the
PADS disulfide bond (Scheme 21, A). This is consistent with either rate-limiting nucleophilic
attack with a transition state in between the phosphite and the phosphonium or with rate-limiting
cleavage of the phosphonium species.

113
4MeO
3Me
H
3MeO
3Cl
3CN
4CN
2,6Me
log kobs = (0.43 × pKaH+) - 8.40
-6
-5.5
-5
-4.5
-4
-3.5
-3
-2.5
-2
7.00 9.00 11.00 13.00 15.00
log
ko
bs
pKaH+
4.1.5 The Effect of Pyridine pKa on the Rate of Reaction
As mentioned in section 4.1.1, the sulfurisation of phosphites by PADS is a third-order process
which is first-order in respect to phosphite, PADS and the pyridine base. Therefore, the pyridine (in
this work so far: 3-picoline) must be involved in a step preceding or including the rate-limiting step.
In order to further probe the role of 3-picoline in this reaction an investigation was undertaken to
study how using various different substituted pyridines, with varying pKas, influenced the rate
constant for the reaction (Fig. 48, Table 9).
Dependence of the Pseudo First-Order Rate Constants (log kobs / s-1) for the
Sulfurisation of P(OPh)3 (0.1 M) with PADS (1 M) with various substituted
Pyridines (2 M) on the pKaH of the Pyridine
Figure 48: Dependence of the pseudo first-order rate constants for sulfurisation of triphenyl phosphite (0.1 M) with
PADS (1 M) on the pKa 111
of the pyridine catalyst used (3 M) in acetonitrile at 25oC. Reactions followed by
31P NMR.

114
Table 9: Observed pseudo first-order rate constants (kobs / s-1
) for sulfurisation of triphenyl phosphite (0.1 M) with
various pyridines (2 M) with fresh PADS (1 M) in acetonitrile at 25oC
The results of this investigation clearly show a positive correlation between the pKa of the pyridine
and the rate of sulfurisation in which stronger bases afford faster rates of reaction. The βnuc value of
+0.43 determined from the Brønsted plot (Fig. 48) is significant and suggests a reaction pathway
that proceeds via a mechanism in which there is significant positive charge build-up on the pyridine
nitrogen.
However, as discussed in the previous chapter, a positive correlation between pyridine pKa and rate
of reaction is only indicative of the charge build-up during the reaction and does not give details
about the role of the pyridine i.e. whether the pyridine acts as a nucleophile or as a base and since
both routes are possible, further analysis of the data is required.
Scheme 22: Two possible mechanisms for the action of picoline in the sulfurisation reaction A: 3-picoline acting as a
base, B: 3-picoline acting as a nucleophile
Subst. pKa ACN kobs / s-1 log k
4-MeO 14.73 7.15 × 10⁻³
-2.15
2,6-Me 14.70 8.75 × 10⁻⁴
-3.06
3-Me 13.70 8.81 × 10⁻⁴
-3.06
H 12.60 2.96 × 10⁻⁴
-3.53
3-MeO 12.45 4.92 × 10⁻⁴
-3.31
3-Cl 9.77 2.27 × 10⁻⁵
-4.64
4-CN 8.50 7.26 × 10⁻⁶
-5.14
3-CN 8.00 7.38 × 10⁻⁶
-5.13
..
A
S=P(OR)3
..
B
: P(OR)3
S=P(OR)3
: P(OR)3
+ve ρ

115
In general, pyridines become more nucleophilic as their pKa increases. This therefore leads to
ambiguity in determining the mechanistic role of pyridines in the sulfurisation reaction. However,
with a non-nucleophilic base, 2,6-lutidine (8), the pseudo first-order rate constant (kobs) for this
reaction is still within the range predicted by the Brønsted plot for a pyridine of its pKa. Similar
reactions were also run with other hindered bases such as triethyl amine which is extremely basic
(pKaH(H2O) = 10.75111
) and affords a rapid rate of reaction (t1/2 ≈ 18 s). This, therefore suggests
that in the sulfurisation of phosphites using fresh PADS, the role of the pyridine is as a base and
they are involved in abstraction of the α-protons which leads to the decomposition of the
phosphonium intermediate (Scheme 22,A). This is supported by the literature reports of pyridine
catalysed proton abstraction from carbon acids, in which the relative rates of deprotonation by
lutidine and pyridine is proportional to the pKas of the two compounds119
. Whereas in the
nucleophile catalysed hydrolysis of acetic anhydride120
and acetyl fluoride121
kpyridine is far greater
than klutidine despite its lower pKa.
Further evidence for a mechanism involving base-catalysed decomposition of the phosphonium
intermediate can be seen when comparing the dependence of the rate of sulfurisation of phosphites
using the compounds 2,2,2′,2′-tetramethyl-2,2′phenylacetyl disulfide (4) and bis-benzoyl disulfide
(5) in which the protons α to the carbonyl are missing. Under the same reaction conditions, not only
are the relative rates of reaction of these compounds much slower (kobs for reaction with (PhO)3P
(0.1 M), 3-Picoline (2 M) and either PADS, (4) or (5) ≈ 46:4:1 respectively) but the dependence of
the rate of these reactions on the pKa of the base (β value) is much lower (Table 10).
(9)
(8)
(5)
(4)

116
Table 10: βnuc values from Brønsted plots for the sulfurisation of P(OPh)3 using vaious different sulfur transfer reagents
with different substituted pyridines in acetonitrile at 25oC
The difference in the Brønsted β values indicates an alternative mechanism of reaction when
moving from PADS to (4) or (5). Equally important is the fact that there is no reaction observed
when using the tetramethyl derivative (4) as the sulfur transfer reagent and with 2,6-lutidine (8) as
the base. This is to be expected since there are no dissociable protons in (4) and therefore the
reaction must proceed via nucleophilic attack rather than proton transfer. The non-nucleophilic 2,6-
lutidine is therefore incapable of catalysing this reaction.
Further evidence that the pyridines act as bases in reactions with fresh PADS can be seen when
comparing the rates of reaction between 2,2′-methyl-2,2′-phenylacetyl disulfide (9). Though the
reaction with (9) is slower than that of PADS, the replacement of one of the methyl groups of (4)
with a proton increases the rate by a factor of 4.5. This is due to the fact that the pyridine is now
able to act as a base. The difference in rate between fresh PADS and (9) can be explained by the
fact that the α-proton in (9) is expected to be much less acidic than that of PADS due to electron
donating nature of the methyl group (for example adding a methyl group to the secondary carbon in
iPrOH increases the pKa H2O from 16.5 to 17.0111
).
Compound kobs / s-1 log kobs kobs/kPADS
PADS 8.81 x 10⁻⁴
-3.06 1.00
(9) 3.27 x 10⁻⁴
-3.49 0.37
(4) 7.07 x 10⁻⁵
-4.15 0.08
Table 11: kobs for sulfurisation of (PhO)3P (0.1 M) with fresh PADS, (2) and (3) (1 M) with 3-picoline (2 M).
Sulfurising Agent βnuc
PADS +0.43
(4) +0.30
(5) +0.16

117
x = 4OMe
x = H
x = 4F
x = 4Cl x = 3Cl
x = 4CN
Dotted Line: log kobs = (2.34 × σ) - 3.03
Solid Line: log kobs = (0.45 × σ) - 2.50
-4
-3
-2
-0.5 0 0.5 1
log
ko
bs
σ
4.1.7 The Effect of PADS Phenyl Substituents on the Rate of Reaction
In the work so far, the effects of substituents on two of the components of the sulfurisation reaction
have been assessed i.e. in the phosphite and the pyridine. In order to complete the data set and to
fully understand the effect of substituents on the sulfurisation reaction, several more substituted
PADS compounds were synthesised in order to construct a linear-free energy relationship and
assess the effect of PADS phenyl substituents on the rate of reaction.
Pseudo First-Order Rate Constants (log kobs / s-1) for Sulfurisation of
P(OPh)3 (0.1 M) with Various Phenyl Substituted PADS Derivatives (1 M)
and Pyridine (2 M) as a Function of the Substituent Hammett σ at 25oC in
Acetonitrile-d3
Figure 49: Linear free-energy relationship for sulfurisation of P(OPh)3 (0.1 M) with 3-Picoline (2 M) using various
substituted PADS analogues
Whilst the Hammett plot is non-linear (Fig. 49) the results suggest that electron withdrawing
substituents increase the rate of the sulfurisation reaction. A non-linear Hammett plot tending
towards a decreased slope indicates a change in the rate-limiting step of the reaction. It is possible
to envision two initial steps for the reaction (Scheme 21); the first is nucleophilic attack by the
phosphite at one of the sulfur atoms of PADS to generate a phosphonium intermediate. The second
is a mechanism in which the phosphite acts as an electrophile and is attacked by an in-situ generated
disulfide anion to generate a phosphide intermediate, generating a positive ρ value. Since
decomposition of this phosphide intermediate to afford the phosphorothioate product involves the

118
transfer of negative charge from the phosphorus onto the phenylthioacetate group, electron
withdrawing groups would have a rate enhancing effect on this pathway, generating a negative ρ
value.
However, the magnitude of the initial ρ value (dotted line in Fig. 49) indicates the generation of a
significant amount of negative charge close to the phenyl ring. This build-up of a significant
negative charge is more consistent with a mechanism in which one of the methylene protons is
removed in the rate-limiting step. This suggests a mechanism in which the pyridine present acts as a
base to remove these protons in a step preceding the rate-limiting step.
In the linear-free energy relationship (Fig.49) there is a change in the gradient of the slope, i.e. the
rate becomes less dependent on the PADS phenyl substituent for the most electron withdrawing
substituents. This is most likely explained by a change in the rate-limiting step of the reaction in
which k2 (the decomposition of the phosphonium to form products) becomes greater than k-1 (the
reverse reaction of the nucleophilic attack by the phosphite on PADS). This would be expected as
adding electron withdrawing groups decreases the pKa of the methylene protons. This could result
in a pathway in which the phenylthioacetate by-product of the nucleophilic decomposition of PADS
is now basic enough to remove these protons (pKaH(ACN)3-picoline= 13.7, pKa(ACN) 2-
phenylthioacetic acid ≈ 20111
). This changes the rate-limiting step of the reaction from k2 to k1.
Scheme 23: Alternative mechanisms of phosphonium degradation
with substituted phenyl PADS analogues
..
σx < 0.2
-
k1
k2
RLS
: P(OR)3
-
S=P(OR)3σx > 0.2
k-1
S=P(OR)3
-
k1
k2RLS
: P(OR)3
k-1

119
4.1.8 Summary of the Mechanism of the Sulfurisation of Phosphites using Fresh PADS
As discussed in previous sections, the sulfurisation of phosphites using fresh PADS in the presence
of a pyridine is a third-order process which is first-order with respect to each component: phosphite,
PADS and pyridine. Substituent effects on the phosphite and pyridine show Brønsted βnuc values of
+0.51 and +0.43 respectively, indicating a reaction mechanism pathway in which substantial
positive charge is transferred or generated on the pyridine nitrogen and phosphite phosphorus
atoms. Adding electron withdrawing substituents to the phenyl rings of PADS affords an increase in
the rate of reaction with a Hammett ρ value of +2.34 indicating a build-up of significant negative
charge next to the PADS phenyl ring in the rate-limiting step. This suggests that the role of the
pyridine in this process is as a base, not a nucleophile. The mechanism of sulfurisation using fresh
PADS is proposed as follows:
.. -
k1
k2
RLS
k-1
: P(OR)3
S=P(OR)3
Scheme 24: Mechanism of sulfurisation of phosphites using fresh PADS in the presence of a pyridine base.
The linear free-energy relationship correlating the rate of reaction with PADS substituents also
shows a change in the rate limiting step. Therefore, the rate law for the rate of the reaction can be
written as follows:
𝜎𝑥 > 0.2 𝑡ℎ𝑒𝑛 𝑘−1 ≪ 𝑘2 𝑠𝑜 𝑅𝑎𝑡𝑒 = 𝑘1 [𝑃𝐴𝐷𝑆][𝑃ℎ𝑜𝑠]
𝜎𝑥 < 0.2 𝑡ℎ𝑒𝑛 𝑘−1 ≫ 𝑘2 𝑠𝑜 𝑅𝑎𝑡𝑒 = 𝑘1𝑘2[𝑃𝐴𝐷𝑆][𝑃ℎ𝑜𝑠][𝑃𝑦𝑟]
𝑘−1[𝑆−]
Where: [Phos] = Phosphite, [SH] = 2-phenylthioacetate and [Pyr] = pyridine.

120
4.2 Aged PADS
As discussed previously, sulfurisation of phosphites with PADS solutions that have been aged are
much more efficient than using fresh PADS solutions, with rate increases of 13-fold when aged for
48 h. Using aged PADS has also been shown to improve the ratio of PS/PO phosphate esters
present in the backbone of the oligonucleotide chain by a significant 0.2%96
. When PADS is aged in
the presence of a pyridine it decomposes and forms polysulfides. This, coupled with the increase in
rate, suggests a somewhat different mechanism of sulfurisation when using aged PADS solutions
compared with fresh PADS. In the following sections, the acyl polysulfide products of PADS
ageing will be generally represented diagrammatically with 2,2′-phenylacetyl trisulfide, however,
as seen in the mass spectra in the previous chapter, these polysulfides vary in the number of sulfur
atoms in the polysulfide chain. Furthermore the second and third order rate constants reported are
based on the starting concentration of PADS and as the actual concentrations of the polysulfides
must be smaller than this, the reported constants are the minimum values.
Structurally, there is not a big difference between the disulfide PADS and the phenylacetyl
polysulfides generated by ageing except that they vary in the number of sulfur atoms the molecules
contain. However, this increase in the number of sulfur atoms allows for a more facile pathway of
sulfurisation. In terms of reaction initiation, it is proposed that this remains very much the same as
in PADS; i.e. nucleophilic attack from the lone pair of the phosphite on one of the sulfur atoms in
the molecule. However, since the symmetry of the polysulfides is slightly different to that of PADS,
there are more possible sites for phosphite attack; i.e. the phosphite can either attack a terminal
sufur or a sulfur in the middle of the polysulfide chain (Fig 50).
The possible phosphonium products of phosphite attack on the polysulfide ageing products (simply
represented here by the trisulfide) are illustrated in figure (50). This process is slightly more
complicated as there are now potentially 4 products. Which sulfur is likely to be attacked by
phosphorus in this case is mechanistically important as the ease (and therefore the rate) of product
formation from these two different sets of reactions is different. The attack of phosphorus on
phenylacetyl trisulfide has been expanded below.

121
Figure 50: Nucleophilic attack by phosphites on sulfur atoms in 2,2´-phenylacetyl trisulfide.
Figure 50 shows not only the products of the nucleophilic attack on the trisulfide species but also
the pKa of the corresponding eliminated thioacid and acylthiol products. Attack at the different sites
(Fig. 50) generates different sulfur leaving group species which have different pKas. The pKa of the
acyldisulfide anion has been calculated based on the literature values for the pKas of thioacetic acid,
phenylacetic acid and peracetic acid122
and literature correlations between aqueous pKas and those
in acetonitrile for carboxylic acids. Though oxygen acids and thio acids are different in terms of
structure and polarizability, using the oxygen acid system as a model for the thio system is
sufficient for the purposes of this approximation.
pKa(ACN) = 1.6 x pKa(H2O) + 14.9
-
Table 12: table of pKas of oxyacids and thioacids in water and in acetonitrile. Red values have been calculated using
the above correlation equation111
.
Compound pKa
H2O ACN
Acetic acid 4.8 23.5
Phenylacetic Acid 4.3 21.8
Peracetic acid 8.2 28.0
Thioacetic Acid 3.3 20.2
Phenylthioacetic Acid 2.9 19.5
Phenylperthioacetic Acid 15.4 39.5
:P(OR)3
-
-
:P(OR)3
pKa (ACN) ≈ 39.5
pKa (ACN) ≈ 19.5
1
2

122
It has been assumed in the calculation that the effect that the disulfide bond has on the pKa of the
perthioacetic acid relative to the thioacetic acid is equal to the effect the peroxide bond has on the
pKa of peracetic acid relative to acetic acid (Table 12). Despite the approximations used it is clear
that the thioacid leaving group (PhCH2COS-) is much less basic than the disulfide anion
(PhCH2COSS-).
Looking at the pKas of the protonated forms of the two anionic leaving groups of the possible,
alternate reaction pathways it can be seen that the corresponding thioacid is several orders of
magnitude more acidic than the acyldisulfide anion. This mean that the thioacetate has a much more
delocalised charge and is not only much more stable in acetonitrile but is also a much better leaving
group and weaker nucleophile than the acyldisulfide anion. It is proposed therefore that this is the
most likely way in which the reaction will proceed: i.e. the phosphorus will likely always attack at
the position which will cause the formation of the most stable transition state and products and is
less likely to give a reversible step. In this particular case this means that the reaction is likely
initiated by attack by the phosphorus on the sulfur adjacent to the thiocarboxyl group. This
generates the phenylthioacetate species and a phenylthioacyl phosphonium containing n-1 sulfur
atoms (where n is the total number of sulfur atoms in the polysulfide).
This is consistent with the literature surrounding desulfurisation of 35
S-labelled alkyl trisulfides
with phosphites and phosphines where it was found that the nucleophile removes the central sulfur
atom and not the terminal sulfur atom. These reactions however do require the addition of an
external nucleophile as the thiol by-products of these reactions are poorer leaving groups than the
thioacid by-products in the case of acylpolysulfides and are therefore also better nucleophiles. It is
proposed that, in the case of alkyl polysufides, a tight ion-pair is formed between the leaving group
and the phosphonium which facilitates product formation123
.

123
log kobs = (0.04 × (3 x σ)) - 2.03
log kobs = (0.32 × (3 x σ)) - 3.07
-3.5
-3.0
-2.5
-2.0
-1.5
-0.9 -0.4 0.1 0.6
log
ko
bs
3 x σ
48 h aged PADS
Fresh PADS
4.2.1 Effect of Phosphite Substituents on the Rate of Sulfurisation Using Aged PADS
Due to the increased activity of aged PADS solutions reaction with alkyl phosphites were too fast to
monitor by 1H NMR and HPLC, even in solvents which would usually slow the rate of reaction
enough to measure e.g. chloroform. It is not possible to monitor these reactions by UV due to the
fact that the λmax of all three components occurs within the same region. This does not allow for the
reaction to be monitored under pseudo first-order conditions. Therefore the only data that could be
obtained was the effect of phosphite substituents in reactions with aryl phosphites.
A comparison of the Pseudo first order rate constants (kobs / s-1) for
Sulfurisation of Various Phenyl Substituted Aryl Phosphites (0.1 M) Using
Both Fresh and Aged PADS (1 M) with 3-Picoline (2 M) as a Function of
Aryl Substituent Hammett σ in Acetonitrile at 25oC
Figure 51: Hammett plot for sulfurisation of various substituted phenyl phosphites (0.1 M) using fresh and aged PADS
(1 M) with 3-picoline (2 M) in acetonitrile-d3 at 25oC

124
Subst. Hammett σ log kobs
Fresh PADS 48 h Aged PADS
4-OMe -0.80 -3.37 -2.14
4-Me -0.51 -3.20 -2.14
H 0.00 -3.11 -2.20
4-Cl 0.68 -2.91 -2.36
4-F 0.19 -2.89 -1.33
Table 13: log of the pseudo first-order rate constants for sulfurisation of various substituted triaryl phosphites (0.1 M)
with PADS (1 M) and 3-picoline (2 M) determined by 31
P NMR at 25oC in acetonitrile-d3.
In our earlier experiments it was found that the effect of substituents on aryl phosphites with fresh
PADS was relatively small. The results with aged PADS show that this effect is in fact even
smaller, by a factor of almost 10 fold. It can be said therefore that the rate of reaction of phosphites
with PADS aged for 48 h is independent of the phenyl substituent. The fact that alkoxy phosphites
still present a faster rate of reaction than phenyl phosphites is still indicative of a mechanism
proceeding via nucleophilic attack by the phosphite as these species are generally more nucleophilic
than aryl phosphites. However, the fact that the reaction shows little dependence on the phosphite
substituent is indicative of a process in which the transition state for the rate-limiting step is
different to that with fresh PADS where it was shown that with phenyl phosphites electron
withdrawing groups aid the decomposition of the phosphonium intermediate. The data indicate that,
with aged PADS, the overall change in charge on the phosphite is small when moving from reactant
to the highest energy transition state.
Scheme 25: General scheme of reactions of substituted phosphites with both fresh PADS and aged PADS.
ρ1 = -ve
ρobs = ρ1 + ρ2 = +ve
ρ2 = +ve
ρ = -ve
AGED PADS
FRESH PADS
ρ2 = +ve
ρobs = ρ1 + ρ2 = 0
: P(OR)3
: P(OR)3

125
-5.50
-5.00
-4.50
-4.00
-3.50
-3.00
-2.50
-2.00
-1.50
7.00 9.00 11.00 13.00 15.00
log
ko
bs
Pyridine pKa (ACN)
Fresh
Aged 24 h
Aged 48 h
4.2.2 Dependence of the Rate of Sulfurisation Using Aged PADS on Base pKa
A study of the observed pseudo first-order rate constants of the sulfurisation of phosphites using
aged PADS (Fig. 52) demonstrated that the reaction can be catalysed by the presence of a pyridine,
much like fresh PADS. However, when using aged PADS solutions, the dependence of the rate of
reaction on the pKa of the pyridine used is not as great (Fig. 52). The measured βnuc values are much
lower and more closely match those measured for 2,2,2´,2´-tetramethyl PADS (4) and dibenzoyl
disulfide (5) than fresh PADS.
log of the Observed Pseudo First-Order Rate Constants for Sulfurisation
of (PhO)3P (0.1 M) using Various PADS Species (1 M) as a function of
Pyridine pKa in Acetonitrile-d3 at 25oC
Figure 52: log of the observed pseudo first-order rate constants for sulfurisation of (PhO)3P (0.1 M) using various
PADS species (1 M) as a function of pyridine pKa. Reactions followed by 31
P NMR in acetonitrile-d3 at 25oC
Sulfurising Agent βnuc
Fresh PADS 0.43
24 h Aged PADS 0.23
48 h Aged PADS 0.26
2,2,2´,2´-tetramethyl PADS (4) 0.30
DBDS (5) 0.16
Table 14: βnuc values for sulfurisation of (PhO)3P (0.1 M) using various sulfurising agents (1 M) whilst varying the base
catalyst (2 M)

126
Previously (section 4.1) it was suggested that the mechanism of sulfurisation of phosphites using
fresh PADS proceeds via a pathway in which the pyridine acts as a base to remove one of the
methylene protons from the phenylacetyl- group of the phosphonium intermediate (Scheme 24).
The pKa of these protons in the intermediate formed by attack of the phosphite on PADS and the
intermediate formed by attack of the phosphite on the polysulfides present in aged PADS solutions
can be expected to be very similar due to the similar electronic environment. Therefore, since the
pKa values of the respective pyridines remain constant throughout the experiment, if decomposition
of the polysulfide phosphonium proceeded via a base catalysed mechanism (as seen with fresh
PADS) the dependence of the rate of reaction on the pKa of the base would be expected to be
roughly the same as the pKa ratios remain the same. As can be seen from the results (Fig. 52),
however, the dependence on pyridine pKa is much lower in aged PADS than in fresh PADS. In fact,
the βnuc values for aged PADS solutions are more similar to those seen when using 2,2,2′,2′-
tetramethyl-2,2′-phenylacetyl disulfide (4) and dibenzoyl disulfide (5), molecules that react by a
nucleophilic mechanism due to the absence of the methylene protons.
This set of results suggests that the decomposition of the phosphonium intermediate when using
aged PADS solutions occurs via a different mechanism to that seen in fresh PADS i.e. not base
catalysed. It is likely that the operating mechanism therefore involves nucleophilic attack of the
pyridine on the sulfur adjacent to the P-S bond.
Scheme 26: Base catalysed decomposition of the phosphonium intermediate generated from fresh PADS and
nucleophile catalysed decomposition of the phosphonium intermediate formed using aged PADS.
+
..
S=P(OR)3
FRESH PADS
..
S=P(OR)3
AGED PADS

127
A further observation to be made about the effect of the pyridine substituents on the rate of reaction
with aged PADS is the effect of using the non-nucleophilic base 2,6-lutidine.
Table 15: Pseudo first-order rate constants (kobs/s-1
) for sulfurisation of (PhO)3P (0.1 M) using fresh PADS (1 M) and
PADS aged for 24 h (1 M) using 2,6-lutidine (2 M) as the base catalyst followed by 31
P NMR at 25oC in acetonitrile-d3
Using the equation of the correlation line of the Brønsted plot of the dependence of the rate of
sulfurisation of PADS aged for 24 h on the basicity of the pyridine base the observed pseudo first-
order rate constant, kobs, for the reaction using 2,6-lutidine as the base would be expected to be ca.
7.33 x 10⁻³
s-1
. The value actually observed of 7.97 x 10⁻⁴
s-1
is ten-fold slower than this. Since 2,6-
lutidine is unable to act as a nucleophile due to the steric bulk around the nucleophilic nitrogen
atom, it can be assumed that the observed value of kobs = 7.97 x 10⁻⁴
s-1
is the rate constant for base
catalysed decomposition of the polysulfide phosphonium intermediate. The fact that this value is
approximately the same as the value observed using fresh PADS (kfresh/kaged ≈ 0.7) is further
evidence that the rate-limiting steps of the reaction of fresh PADS and aged PADS with phosphites
proceeds via two different pathways.
It is likely that the change in the mechanism of the rate-limiting step (the breakdown of the
phosphonium intermediate in both cases) in moving from fresh PADS to aged is the cause of the
observed rate enhancement. The reason for this rate enhancement can be explained fairly simply
when looking at the proposed mechanisms of each process (Scheme 26). The base catalysed
degradation must proceed via the breakage of a carbon-sulfur bond (ΔHdiss = 272 kJ.mol-1
) whereas
the nucleophile catalysed process proceeds via the breakage of a sulfur-sulfur bond (ΔHdiss = 226
kJ.mol-1
)101
. The difference in the bond dissociation energy of these two bonds makes the
nucleophilic process energetically favoured. It is also worth noting that whilst the reactions of (4)
and (5) also proceed via a nucleophilic catalysed process, these processes also require the breakage
of a carbon-sulfur bond and are therefore slower. It may also be the case that in these systems there
is a greater degree of reversibility in the breakdown of the phosphonium ion intermediate.
Sulfurising Agent kobs / s-1
Fresh PADS 5.47 x 10⁻⁴
24 h Aged PADS 7.97 x 10⁻⁴

128
Scheme 27: The nucleophilic breakdown of the various phosphonium intermediates formed by reaction of fresh PADS,
(4), (5) and polysulfides with phosphites.
The carbon atoms in the C-N bonds in the reactions of the tetramethyl PADS derivative (4) and
dibenzoyl disulfide (5) have less electron density than the sulfur atom in the S-N bond due to the
electronegative oxygen and nitrogen atoms bonded to it. Therefore this carbon is a better
electrophile and is more susceptible to nucleophilic attack by the sulfide anion in the ion pair. Also,
the formation of a carbon-sulfur bond (ΔHdiss = 272 kJ.mol-1
) is more energetically favourable than
the formation of a sulfur-sulfur bond (ΔHdiss = 226 kJ.mol-1
)101
.
FRESH PADS
sulfur-sulfur cleavage
carbon-sulfur cleavage
carbon-sulfur cleavage
carbon-sulfur cleavage
: P(OR)3
POLYSULFIDES
:
(4)
:
ip
-
-
ip
: P(OR)3
ip
: P(OR)3
(5):
-
:
: P(OR)3

129
4.2.3 Effect of 3-Picoline Concentration on the Rate of the Sulfurisation Reaction using Aged
PADS
In earlier experiments it was shown that the sulfurisation of phosphites using aged PADS solutions
can be catalysed by pyridines. When using aged PADS solutions it is possible for the reaction to
proceed slowly without the presence of a pyridine. However, no reaction is observed with fresh
PADS if there is no pyridine present. It is thought that this slow sulfurisation reaction with aged
PADS could be due to the fact that during the ageing process, polysulfide anions are produced (see
section 3 for further details). It is possible that, in the absence of a pyridine, these polysulfide anions
could act as a nucleophile to facilitate the conversion of the reaction intermediates into products.
Extending the sulfur chain in these anionic species drastically increases the pKa, and thus the
nucleophilicity, of the anionic sulfur. In fresh PADS, the thioacetate by-product is not a good
enough nucleophile and no reaction is observed.
A further difference between the two systems can be seen by comparing the relative dependencies
of the rates of reaction of fresh PADS and aged PADS solutions on the concentration of base. For
aged PADS there is a non-linear dependence of the rate constant on the concentration of base (Fig.
53) whereas for fresh PADS, over the same concentration range, the correlation remains linear (Fig.
42).

130
0
2
4
6
8
10
12
14
0 0.5 1 1.5 2 2.5 3 3.5 4 4.5
ko
bs
× 1
03 / s
-1
[3-picoline] / M
Pseudo First-Order Rate Constants (kobs / s-1) for Sulfurisation of (PhO)3P
(0.1 M) Using PADS Aged 48 h (1 M) with Varying Concentrations of 3-
Picoline
Figure 53: Observed pseudo first-order rate constants for the of sulfurisation of P(OPh)3 (0.1 M) using PADS aged for
48 h (1 M) as a function of the concentration of 3-Picoline at 25oC in acetonitrile-d3
For aged PADS, at low concentration of 3-picoline, the concentration of base has a large effect.
However, at high concentrations of 3-picoline, the rate constant appears to become near-
independent of base concentration. This is again indicative of an alternative mechanism of
phosphonium decomposition when moving from fresh PADS to aged PADS. The fact that the
reaction becomes independent of base concentration suggests a change in the rate limiting step due
to a more facile reaction pathway (i.e. the nucleophilic pathway suggested in section 4.2.2) and the
rate laws for these processes can be written as follows:
𝑎𝑡 𝑙𝑜𝑤 [3 − 𝑃𝑖𝑐𝑜𝑙𝑖𝑛𝑒] 𝑘2[𝑃𝑖𝑐] ≪ 𝑘−1[𝑆−] 𝑠𝑜 𝑅𝑎𝑡𝑒 = 𝑘1𝑘2[𝑃𝐴𝐷𝑆][𝑃ℎ𝑜𝑠][𝑃𝑖𝑐]
𝑘−1[𝑆−]
𝑎𝑡 [3 − 𝑃𝑖𝑐𝑜𝑙𝑖𝑛𝑒] 𝑘2[𝑃𝑖𝑐] ≫ 𝑘−1[𝑆−] 𝑠𝑜 𝑅𝑎𝑡𝑒 = 𝑘1 [𝑃𝐴𝐷𝑆][𝑃ℎ𝑜𝑠]
Where [Phos] = Phosphite, [S-] = 2-phenylthioacetate and [Pic] = 3-Picoline.

131
0
1
2
3
4
5
6
7
0 0.2 0.4 0.6 0.8
ko
bs
× 1
05 / s
-1
[3-Picoline] / M
This change in the rate limiting step in moving from low to high concentration of 3-picoline can
also be seen when looking at the effect of increasing the concentration of 3-picoline on the reactions
of 2,2,2´,2´-tetramethyl PADS (4) and dibenzoyl disulfide (5) which, as mentioned earlier are only
able to participate in mechanisms involving nucleophilic decomposition of the phosphonium
intermediate (scheme 27).
Pseudo First-Order Rate Constants (105 kobs / s-1) for Sulfurisation of
P(OPh)3 (0.01 M) using 2,2,2',2'-tetramethyl PADS (4) (0.1 M) with Varying
Concentrations of 3-Picoline
Figure 54: Observed pseudo first-order rate constants for sulfurisation of (PhO)3P (0.01 M) using 2,2,2´,2´-tetramethyl
PADS (4) (0.1 M) with varying concentrations of 3-picoline in acetonitrile-d3 at 25oC. Reactions followed by
31P NMR
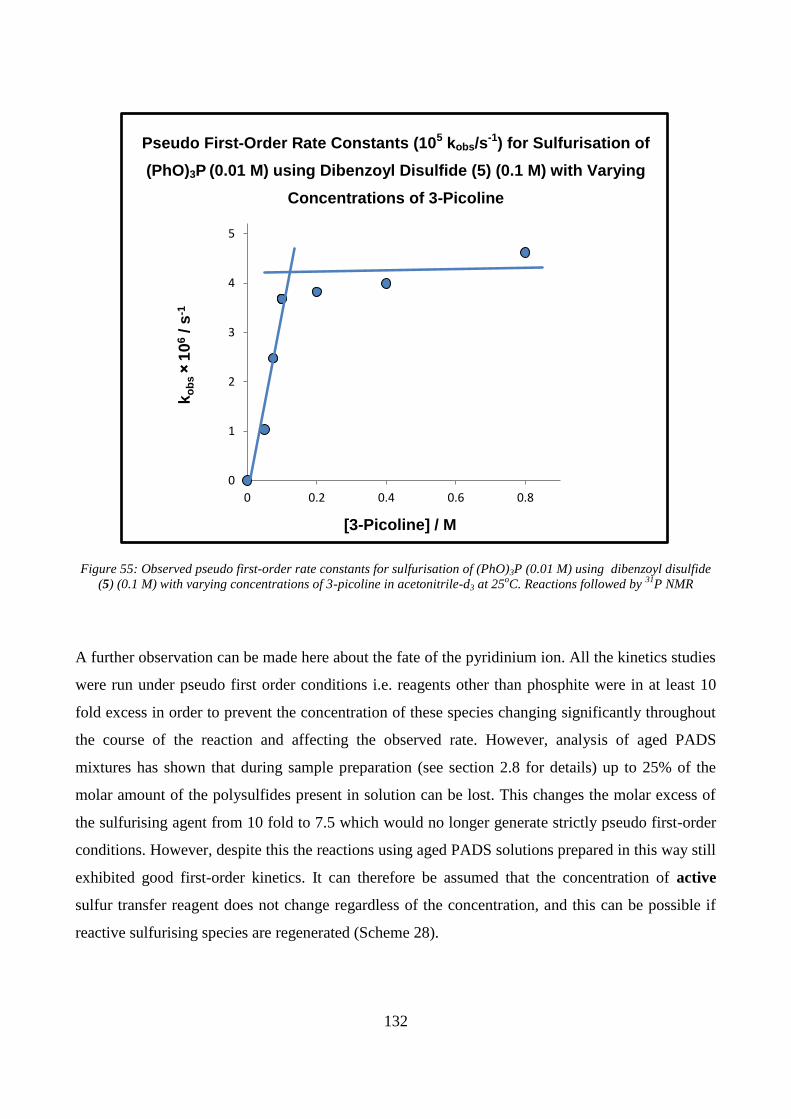
132
0
1
2
3
4
5
0 0.2 0.4 0.6 0.8
ko
bs
× 1
06 / s
-1
[3-Picoline] / M
Pseudo First-Order Rate Constants (105 kobs/s-1) for Sulfurisation of
(PhO)3P (0.01 M) using Dibenzoyl Disulfide (5) (0.1 M) with Varying
Concentrations of 3-Picoline
Figure 55: Observed pseudo first-order rate constants for sulfurisation of (PhO)3P (0.01 M) using dibenzoyl disulfide
(5) (0.1 M) with varying concentrations of 3-picoline in acetonitrile-d3 at 25oC. Reactions followed by
31P NMR
A further observation can be made here about the fate of the pyridinium ion. All the kinetics studies
were run under pseudo first order conditions i.e. reagents other than phosphite were in at least 10
fold excess in order to prevent the concentration of these species changing significantly throughout
the course of the reaction and affecting the observed rate. However, analysis of aged PADS
mixtures has shown that during sample preparation (see section 2.8 for details) up to 25% of the
molar amount of the polysulfides present in solution can be lost. This changes the molar excess of
the sulfurising agent from 10 fold to 7.5 which would no longer generate strictly pseudo first-order
conditions. However, despite this the reactions using aged PADS solutions prepared in this way still
exhibited good first-order kinetics. It can therefore be assumed that the concentration of active
sulfur transfer reagent does not change regardless of the concentration, and this can be possible if
reactive sulfurising species are regenerated (Scheme 28).

133
Scheme 28: Possible scheme for regeneration of an active sulfur transfer reagent during the reaction of phenylacetyl
disulfide with a phosphite in the presence of a nucleophile.
This is possible due to the fact that the pKa of the thioacid is approximately 7 units higher than that
of 3-picoline in acetonitrile (Scheme 25). This reaction also neutralises the charged species present
in solution which, in acetonitrile, would be relatively unstable.
-
:
: P(OR)3

134
4.2.4 Summary of the Mechanism of Sulfurisation of Phosphites by Aged PADS Solutions
As discussed in section 4.1, sulfurisation of phosphites using PADS analogues is a third order
process in which the rate of the reaction is proportional to all three reaction components: phosphite,
sulfurising agent and pyridine base. However, unlike with fresh PADS, the rate of reaction can
become independent of base at high concentrations of the pyridine suggesting a change in the rate
limiting step of the reaction when using aged PADS. The correlation between reaction rate and 3-
picoline concentration using aged PADS (Fig. 53) shows a similar profile to those of the hindered
sulfurising agents 2,2,2′,2′-tetramethyl phenylacetyl disulfide (4) and dibenzoyl disulfide (5) in
which, as mentioned, breakdown of the phosphonium intermediate is only able to proceed via
nucleophilic attack of the pyridine. This supports the hypothesis that the decomposition of the
phosphonium intermediate in aged PADS solutions occurs through nucleophilic attack by pyridine.
It is also proposed here that polysulfide anions produced from the ageing process present in aged
PADS solutions are able to catalyse the conversion of the phosphonium intermediate to the product
phosphorothioate at a much slower rate than 3-picoline, as evidenced by the fact that, unlike when
using fresh PADS, a reaction still occurs without base present.
The observed βnuc value when varying the pKa of the base used in the reactions of aged PADS with
phosphites is smaller than that observed when using fresh PADS. This is further support of the
pyridines in these reactions acting as nucleophiles and not as bases since the observed βnuc value is
more similar to that of 2,2,2′,2′-tetramethyl phenylacetyl disulfide (4) and dibenzoyl disulfide (5)
than to that of fresh PADS in which phosphonium breakdown is catalysed by a proton abstraction
mechanism. Similarly, the effect of using hindered bases such as 2,6-lutidine supports the proposal
that nucleophilic attack on the phosphonium products using aged PADS is the faster and preferred
pathway since when a non-nucleophilic base is used, the rate of reaction becomes more similar to
that of fresh PADS (kfresh/kaged ≈ 0.7).
The rate enhancement seen in moving from fresh PADS to aged PADS has made studying the effect
of alkyl substituents on the phosphite difficult. However, due to the fact that more nucleophilic
phosphites (alkoxy phosphites) afford faster rates of reaction with aged PADS solutions it can be
assumed that the reaction still proceeds via nucleophilic attack of the phosphite on the sulfurising
agent.

135
: P(OR)3
..
S=P(OR)3
K1
-
NO BASE
k2
: P(OR)3
WITH BASE
S=P(OR)3
K1 k2
Scheme 29: Mechanism of sulfurisation of phosphites using aged PADS with and without 3-picoline.
Looking at the data therefore it is proposed that the mechanism of the sulfurisation of phosphites
using aged PADS solutions is as follows: the phosphite acts as a nucleophile to attack the sulfur
adjacent to the terminal sulfur to generate a phosphonium intermediate and phenylthioacetic acid as
a by-product. The pyridine then acts as a nucleophile to attack the sulfur adjacent to the P-S bond in
order to form the product phosphorothioate and a thio pyridinium derrivative which may react
subsequently with the thioacid anion to generate polysulfides.

136
5. Results and Discussion: Activation
and Coupling of Phosphoramidites

137
The coupling reaction is the second stage of the four-step synthesis of oligonucleotides and involves
the reaction of the de-protected 5´ hydroxyl group of the growing oligonucleotide chain with free
phosphoramidites that are introduced into the system (Scheme 30). Reactions of phosphoramidites
with simple alcohols in the presence of an acid catalyst are extremely fast, this is due in part to the
high enthalpy of formation of the P-O bond. For example, reactions of phosphoramidites with even
bulky alcohols such as t-BuOH using a 1:1 mixture of a tetrazole and a tetrazolide-amine salt as the
catalyst (referred to as an activator) display third-order rate constants of the order of 1.2 M-2
s-1 81
.
However, phosphoramidites are very stable and in the absence of an activator are relatively
unreactive.
Activation of phosphoramidites involves initial protonation of the amine group by an acid catalyst.
This is followed by subsequent nucleophilic attack by the conjugate base of the acid, used in the
initial protonation step, on the phosphorus centre to eliminate an amine, normally di-isopropylamine
(Scheme 30) and to form an activated phosphorus species. The kinetics and mechanism of this
process are dependent on the solvent, the pKa of the activator, the pKa of the amine leaving groups
and the equilibrium formed between these two species. Understanding this relationship is key to
fully understanding the mechanism of the phosphoramidite-activator system.
This study mainly focuses on understanding the nature of the equilibrium between activator and
leaving group which are ethylthiotetrazole and di-isopropylamine respectively.
Scheme 30: Activation of di-isopropylphosphoramidites by ethylthiotetrazole

138
5.1 Determination of the Solubility of Ethylthiotetrazole (ETTH) and Di-isopropylammonium
ethylthiotetrazolide salt (ETTHDIA)
In order to study the acid-base equilibrium between the activator and the phosphoramidite it was
necessary to determine the solubility limits of the different species in solution. This was done
simply by attempting to dissolve a known amount of material in a known volume of acetonitrile at
25oC and then calculating the masses of dissolved and undissolved solid in the saturated solutions
(Table 16).
Table 16: Data table from calculation of maximum solubility of ETTH in acetonitrile at 25oC
As the phosphoramidites used throughout this work are N,N-di-isopropyl phosphoramidites,
unreacted or excess activator will form a salt with the di-isopropylamine leaving group. Since this
salt formation can alter the equilibrium of the reaction and remove free activator, the solubility of
this was also measured. The salt (ETTHDIA) was formed by making up a solution of ETTH in
acetonitrile (1.5 M) and adding excess di-isopropylamine to it. Once the solubility limit of
ETTHDIA was reached, excess salt precipitated out. This was vacuum filtered and washed with
small amounts of ether to remove any excess ETTH or di-isopropylamine. This was dried in an
oven and used as pure ETTHDIA in solubility studies. 1H NMR analysis of this solid showed a 1:1
ratio of ETTH and DIA. The maximum solubility of the salt (ETTHDIA) in acetonitrile was found
to be 0.22 M (50.8 g/L).
Repetition
1 2 3
Mass of ETTH added (g) 2.93 3.08 2.95
Vol. of ACN (ml) 9.98 10.22 9.96
Mass of undissolved solid measured (g) 0.77 0.90 0.93
Mass of dissolved solid calculated (g) 2.15 2.19 2.02
Moles of Dissolved ETTH (mol) 0.02 0.02 0.02
Concentration (M) 1.66 1.64 1.56
Max concentration 1.62 M
210.9 g/L

139
3
4
5
6
7
8
9
10
11
12
13
21 22 23 24 25
pH
Vol. of NaOH (ml)
5.2 Determination of the pKa of ETTH in Water
Because the activation of phosphoramidites is initiated by a proton transfer from the activator to the
phosphoramidite (Scheme 30), this process is dependent on the pKa of the activator and, perhaps
more importantly, the relative pKas of the activator and the amine leaving group.
Ionisation and ion-pair formation is very dependent on the nature of the solvent. Although the
synthesis is conducted in the aprotic solvent acetonitrile it is simpler to measure pKas in water and
so the pKa of ETTH was determined in water using a standard pH titration. Samples of ETTH (0.1
M, 25 ml) were titrated against NaOH (0.1 M) in deionised water. The pH was monitored
throughout the experiment to give a pH profile (Fig. 56.)
pH as a Function of Volume of NaOH (0.1 M) Added to a Solution of ETTH
(0.1 M, 25 ml)
Figure 56: pH profile of titration of ETTH (0.1 M) with NaOH (0.1 M)
140
The data in the pH profile were fitted to the Henderson-Hasselbach equation which gives a pKa
value for ETTH in water of 3.61.
pH = p𝐾𝑎 + log[𝐴−]
[𝐻𝐴]
Note: At the equivalence point of the reaction (the steepest part of the curve), [A-]/[HA] = 1 and so the term
‘log ([A-]/[HA])’ can be removed as log(1)= 0.
The measured pKa of tetrazole itself in water is 4.586
, the lower value of 3.6 for ETTH is to be
expected since the sulfide group, β to the ionising NH, stabilises negative charge in such systems124
.
However, perhaps more important than the absolute value in determining the efficacy of ETTH as
an activator is its pKa relative to that of the di-isopropylamine leaving group. The free amine has a
pKa (H2O) of 11.07111
, giving a Δ pKa of around 7.5 units. This means that, in water, the activator
would be expected to protonate the amine group of the amidite generating the positively charged
amidite (Scheme 30). However, whilst pKas in water can be indicative of what the pKa of a certain
species may be in other solvents, different classes of compounds often display varying responses in
their pKa in transferring from one solvent to another. For example, the pKa of a carboxylic acid
changes when moving from water to acetonitrile according to the equation pKa(ACN) = 1.6
pKa(H2O) + 14.9 whereas the same change in solvent for phenols changes the pKa according to the
equation pKa(ACN) = 1.8 pKa + 9.6111
. This means that a carboxylic acid and a phenol that have
the same pKa in water, for example pKa(H2O) = 5, would have pKas that vary by 4.3 units in
acetonitrile. This is an important consideration when considering acid-base equilibria in non-
aqueous solvents.

141
Conductivity = 0.012 × [ETTH] - 2 × 10⁻⁴
0
1
2
3
4
5
6
7
8
0.00 0.20 0.40 0.60 0.80
Co
nd
ucti
vit
y ×
10
3 / S
m-1
[ETTH] / M
5.3 Determination of the pKa of ETTH in Acetonitrile
An appreciation of the pKa of ETTH and di-isopropylamine in acetonitrile is essential in order to
fully understand the acid-base equilibria in the coupling reaction. This is due to the fact that amines
and tetrazoles are likely to respond to the change in solvent differently. Therefore, an attempt was
made to determine the pKa of the activator ETTH in acetonitrile. Measuring the accurate pH of
solutions in acetonitrile is difficult and requires specialist equipment; therefore the pKa could not be
measured using the usual titrimetric or spectroscopic methods which require accurate pH. Similarly,
since there are very few hydrogen or carbon atoms surrounding the acidic nitrogen in the tetrazole,
the use of 1H or
13C NMR was also difficult.
A method using conductance, proposed by Nag and Datta125
was employed in which the pKa is
determined by looking at the conductance of solutions of various concentrations of the acid (Fig.
57). As only ionised species contribute to conductance, the conductance is proportional to the
concentration of (in this system) the ETT- anion and ACNH
+. Using a correlation reported by
Gearey126
it is possible to relate the conductivity of acid solutions to the mole fraction of anion
present and therefore to calculate the pKa.
Conductivity (Sm-1) as a Function of Concentration of ETTH (M) in
Acetonitrile at 25oC
Figure 57: Conductivity (Sm-1
) of ETTH solutions as a function of concentration (M) of several solutions of ETTH in
acetonitrile at 25oC
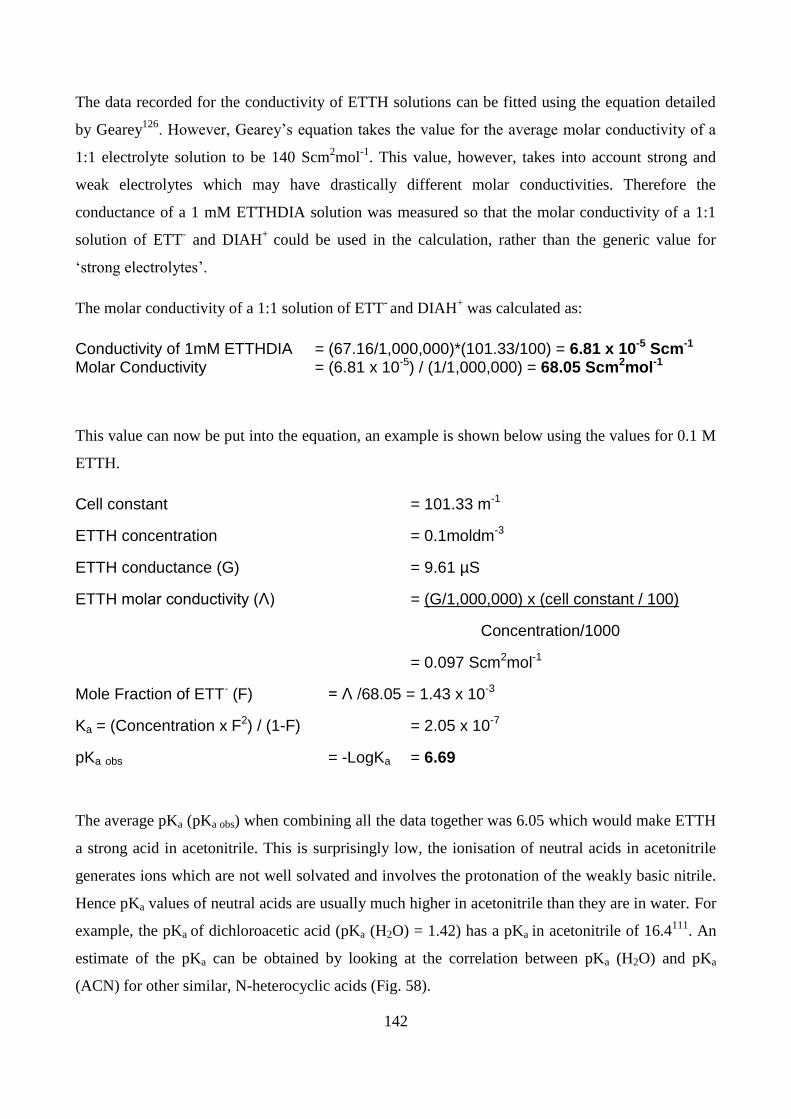
142
The data recorded for the conductivity of ETTH solutions can be fitted using the equation detailed
by Gearey126
. However, Gearey’s equation takes the value for the average molar conductivity of a
1:1 electrolyte solution to be 140 Scm2mol
-1. This value, however, takes into account strong and
weak electrolytes which may have drastically different molar conductivities. Therefore the
conductance of a 1 mM ETTHDIA solution was measured so that the molar conductivity of a 1:1
solution of ETT- and DIAH
+ could be used in the calculation, rather than the generic value for
‘strong electrolytes’.
The molar conductivity of a 1:1 solution of ETT- and DIAH
+ was calculated as:
Conductivity of 1mM ETTHDIA = (67.16/1,000,000)*(101.33/100) = 6.81 x 10⁻⁵ Scm-1
Molar Conductivity = (6.81 x 10⁻⁵) / (1/1,000,000) = 68.05 Scm2mol-1
This value can now be put into the equation, an example is shown below using the values for 0.1 M
ETTH.
Cell constant = 101.33 m-1
ETTH concentration = 0.1moldm-3
ETTH conductance (G) = 9.61 µS
ETTH molar conductivity (Λ) = (G/1,000,000) x (cell constant / 100)
Concentration/1000
= 0.097 Scm2mol-1
Mole Fraction of ETT- (F) = Λ /68.05 = 1.43 x 10⁻³
Ka = (Concentration x F2) / (1-F) = 2.05 x 10⁻⁷
pKa obs = -LogKa = 6.69
The average pKa (pKa obs) when combining all the data together was 6.05 which would make ETTH
a strong acid in acetonitrile. This is surprisingly low, the ionisation of neutral acids in acetonitrile
generates ions which are not well solvated and involves the protonation of the weakly basic nitrile.
Hence pKa values of neutral acids are usually much higher in acetonitrile than they are in water. For
example, the pKa of dichloroacetic acid (pKa (H2O) = 1.42) has a pKa in acetonitrile of 16.4111
. An
estimate of the pKa can be obtained by looking at the correlation between pKa (H2O) and pKa
(ACN) for other similar, N-heterocyclic acids (Fig. 58).

143
Correlation between pKa(H2O) and pKa(ACN) for various N-heterocyclic
acids
Figure 58: Correlation between pKa (H2O) and pKa (ACN) for various N-heterocyclic acids.
Based on the correlation (Fig. 58), the pKa (ACN) for ETTH would be expected to be 11.7. The
closest compound to ETTH in the table above is 1H-Tetrazole which has a Δ pKa (ACN-H2O) of
9.6. The estimated pKa value of ETTH taken from the graph is clearly vastly different from the
experimental value of 6.05. The calculated value of 6.05, determined by conductance, is clearly
erroneous.
One reason why these two values may vary so drastically is because tetrazoles exhibit a behaviour
known as homo-conjugation in which tetrazolide anions hydrogen-bond to non-dissociated tetrazole
molecules (Scheme 31). The effect of this phenomena is more pronounced in non-aqueous solvents
as it helps to stabilise the charge of the anion formed by proton dissociation127
. Since these homo-
conjugates affect ion mobility and transport in solution it is possible that Ka obs is actually an
apparent value composed of a contribution from the actual pKa and the homo-conjugation constant
Khomo.
pyrrole
imidazole
1,2,4-triazole
1H-Tetrazole
pKa(ACN) = (1.68 × pKa(H2O) + 5.66
10
15
20
25
30
35
3 8 13 18
pK
a(A
CN
)
pKa(H2O)
benzimidazole

144
-Kip
-
-
ACN
Ka
KhomoK obs
ACNH
ip
Scheme 31: Homo-conjugation of ETTH with ETT- 128-
.
If the above equilibria are active then it is possible to get a feel for the extent of homo-conjugation
by estimating the homo-conjugation constant with the following equation:
𝐾𝑎 𝑜𝑏𝑠 = 𝐾𝑎 × 𝐾𝑖𝑝 × 𝐾ℎ𝑜𝑚𝑜
If the pKa of ETTH is taken as the value obtained from the correlation graph (Fig. 58) of 11.7 and
and Kip of the ETT- and ACNH
+ ions is taken to be around 10
3 M
-1 (the order of magnitude expected
for Kip in acetonitrile)111
then the Khomo can be estimated as:
2 × 10−7 = (2 × 10−12) × 103 × 𝐾ℎ𝑜𝑚𝑜
𝐾ℎ𝑜𝑚𝑜 =9 × 10⁻⁷
(2 × 10−12) × 103
𝐾ℎ𝑜𝑚𝑜 = 102
This suggests that in acetonitrile, ETT- and ETTH would likely form homo-conjugates. This is
likely to distort the conductivity measurements due to the difference in specific conductivity of the
ETT- ion and the homo-conjugate. This could be responsible for the low value obtained for pKa obs
for ETTH. Alternatively, this can be expressed by assuming the reasonable values of Kip = 103 M
-1
and Khomo = 102 so using the observed apparent Ka gives a calculated pKa = 11.7.

145
0
0.2
0.4
0.6
0.8
1
1.2
1.4
1.6
1.8
0 0.5 1 1.5 2 2.5 3 3.5
Co
nd
ucti
vit
y ×
10
2 (
Sm
-1)
Concentration × 103 (M)
5.4 Determination of the Ion-Pair Constant (Kip) for the Acid-Base Equilibrium Between
ETT- and DIAH
+ and [ETTHDIA]ip
Another important factor affecting the acid-base equilibrium between activator and leaving group is
the ion pairing of the deprotonated activator and the protonated basic leaving group. Examination of
the conductivity behaviour of solutions of the ETTHDIA salt shows that the correlation between
conductivity and concentration is non-linear which is probably due to ion-pairing.
Conductivity (Sm-1) as a Function of Concentration (M) of ETTHDIA in
Acetonitrile at 25oC
Figure 59: Conductivity (Sm-1
) as a function of concentration (M) of several solutions of ETTHDIA in acetonitrile at
25oC
The acid-base equilibria can be described as follows:
ETTH + DIA ETT- + DIAH+ [ETTHDIA]ip
K1 Kip
As the salt is a 1:1 mixture of ETTH and DIA, the concentrations of ETTH and DIA are equal, as
are the concentrations of ETT- and DIAH
+.

146
𝐾1 = [𝐸𝑇𝑇−][𝐷𝐼𝐴𝐻+]
[𝐸𝑇𝑇𝐻][𝐷𝐼𝐴]=
[𝐸𝑇𝑇−]2
[𝐸𝑇𝑇𝐻]2 𝐾𝑖𝑝 =
[𝐸𝑇𝑇𝐻𝐷𝐼𝐴]𝑖𝑝
[𝐸𝑇𝑇−][𝐷𝐼𝐴𝐻+]=
[𝐸𝑇𝑇𝐻𝐷𝐼𝐴]
[𝐸𝑇𝑇−]2
The conductivity of the solution is proportional to the concentration of the ionic species only and is
not affected by neutral acid or base or by ions involved in ion pairing interactions due to the fact
that their charges are compensated by the counter-ion. Therefore in order to quantitatively analyse
the conductivity data (Fig. 59), an expression for the concentration of the ionic species is required.
Assessment and rearrangement of the mass balance of the equilibrium allows expressions for the
concentration of the individual species. The mass balances are as follows:
[𝐸𝑇𝑇]𝑡𝑜𝑡𝑎𝑙 = [𝐸𝑇𝑇𝐻] + [𝐸𝑇𝑇−] + [𝐸𝑇𝑇𝐻𝐷𝐼𝐴]𝑖𝑝
[𝐷𝐼𝐴]𝑡𝑜𝑡𝑎𝑙 = [𝐷𝐼𝐴] + [𝐷𝐼𝐴𝐻+] + [𝐸𝑇𝑇𝐻𝐷𝐼𝐴]𝑖𝑝
The equilibrium constants can be rearranged and substituted into the mass balances to give an
expression for the individual species in terms of [ETT-] or [DIAH
+]. The concentrations are
expressed in terms of the ionic species because these are the only species monitored by the
conductivity measurements.
[𝐸𝑇𝑇]𝑡𝑜𝑡𝑎𝑙 = [𝐸𝑇𝑇−]
√𝐾1
+ [𝐸𝑇𝑇−] + 𝐾𝑖𝑝[𝐸𝑇𝑇−]2
This can now be rearranged into a quadratic equation of the form 0 = ax2 + bx + c as follows:
0 = 𝐾𝑖𝑝[𝐸𝑇𝑇−]2 + [𝐸𝑇𝑇−] +[𝐸𝑇𝑇−]
√𝐾1
− [𝐸𝑇𝑇]𝑡𝑜𝑡𝑎𝑙
This can then be solved according to the following equation:
[𝐸𝑇𝑇−] =−𝑏 ± √𝑏2 − 4𝑎𝑐
2𝑎
Where: 𝑥 = [𝐸𝑇𝑇−] 𝑎 = 𝐾𝑖𝑝 𝑏 = 1 + 1
√𝐾1 𝑐 = −[𝐸𝑇𝑇]𝑡𝑜𝑡𝑎𝑙

147
The total conductivity of a solution (Ʌ) is equal to the background conductivity of the solution (λ0)
plus the sum of the conductivity of the ionic species multiplied by their individual specific
conductivities (εx), in this case:
Ʌ = 𝜆 + (𝜀𝐸𝑇𝑇− × [𝐸𝑇𝑇−]) + (𝜀𝐷𝐼𝐴𝐻+ × [𝐷𝐼𝐴𝐻+])
Since the specific conductivities for ETT- and DIAH
+ are unknown in acetonitrile, these terms must
be combined in the equation into one variable term. The quadratic expression for the concentration
of the ionic species can then be substituted into the conductivity equation to give the following
equation:
Ʌ = 𝜆 + (𝜀𝑡𝑜𝑡𝑎𝑙 −𝑏 ± √𝑏2 − 4𝑎𝑐
2𝑎)
Using the solver function in Microsoft Excel the data were modelled using a least squares method
with the terms b, a and ε as variables whilst the conductivity (Ʌ), background conductivity (λ) and
total concentration of species (c) were as measured during the experiment. This gave a fit (Fig. 59)
with the following values for the variables:
K1 0.36
Kip 6540.02 M-1
εtotal 32.50 Sm-1M-1
Table 17: Table of calculated equilibrium constants from the modelling of conductivity data of solutions of ETTHDIA
These values indicate that, when ionised, the charged species in the system are strongly ion paired
due to the large value of Kip. This is in the range typically expected for ions in acetonitrile111
. When
comparing the gradient of the slope between the conductivity of ETTH in acetonitrile alone (Fig.
57) with the slope of the linear section of the plot of concentration versus conductance measured for
the ETTHDIA salt solution (0.9-3.3 mM) it is clear that the salt is around 400 times more
conducting than ETTH alone. This is indicative of a much larger degree of ionisation of ETTH with
added base despite the low value calculated for K1. The pKaH of di-isopropylamine has not been
determined in acetonitrile but based on the values measured for other secondary amines it is

148
expected to be around 18 whilst the estimated value of the pKa of ETTH from calibration data is
11.7. These values predict a favourable equilibrium constant (K1) for salt formation of around 106.
ETTH + DIA ETT- + DIAH+ [ETTHDIA]ip
K1 Kip
𝐾1 = [𝐸𝑇𝑇−][𝐷𝐼𝐴𝐻+]
[𝐸𝑇𝑇𝐻][𝐷𝐼𝐴]=
𝐾𝑎 𝐸𝑇𝑇𝐻
𝐾𝑎 𝐷𝐼𝐴
Conversely, if the pKa of DIAH+
in acetonitrile is taken to be 18 then, with the equilibrium constant
K1 for salt formation being 0.36, the estimated pKa of ETTH would be 18.44. This suggests either
an error or a more complicated equilibrium than the model is accounting for. This could be due to
variances in the specific ion contributions or homo-conjugation of tetrazolide ions and free tetrazole
molecules.
Homo-conjugation was briefly discussed in section 5.3.3 where the homo-conjugation constant was
estimated to be in the order of 102
M-1
. The effect of homo-conjugation on conductivity can be seen
when adding excess ETTH to a solution of [ETTHDIA] i.e. adding free tetrazole to a solution of
tetrazolide ions (Fig. 60). It is clear looking at the data in figure 60 that the conductivity behaviour
of ETTH when added to solutions of ETTHDIA is very different from that of ETTH in acetonitrile
alone. The first observation to be made from the data is that the relationship between conductivity
and concentration of added ETTH is non-linear due to homo-conjugation between free ETTH
molecules and deprotonated ETT- ions (Scheme 31).

149
2.2E-2
2.7E-2
3.2E-2
3.7E-2
4.2E-2
0.E+0 1.E-2 2.E-2 3.E-2
Co
nd
ucti
vit
y (
Sm
-1)
Concentration of Excess ETTH (M)
Conductivity (Sm-1) of Solutions containing ETTHDIA (4.8 mM) with
Excess ETTH (n M)
Figure 60: Conductivity (Sm-1
) of solutions containing ETTHDIA (4.8 mM) and ETTH (n M)
The second major observation to be made from figure 60 is that adding ETTH to solutions of
ETTHDIA has a much larger effect than adding ETTH to acetonitrile alone. For example,adding a
0.01 M amount of ETTH to a 4.8 mM ETTHDIA solution in acetonitrile causes a conductivity
increase of 8.78 x 10⁻⁴
mSm-1
whereas the same amount of ETTH in acetonitrile alone causes a
conductivity increase of only 1.1 x 10⁻⁵
mSm-1
. This increase in conductivity could be due to the
excess ETTH pushing the acid-base equilibrium between ETTH and DIA (K1) towards the right,
thus generating more ionic species. A possible further effect of adding ETTH to the ETTHDIA
solution could be that excess ETTH disrupts ion pairing between ETT- and DIAH
+ thus generating
more conducting species (scheme 31).
More work is needed before the values for Khomo can be accurately calculated.

150
5.5 Kinetics of Activation of 2´-Methoxy-5´-O-DMT-Uridine 3´-CE Phosphoramidite by ETT
Followed by Conductivity
Scheme 32: Activation of UAm using ETT as the activator
The kinetics of activation and alcoholysis of phosphoramidites proved extremely difficult
employing conventional methods such as NMR or UV stopped-flow spectroscopy due to the
extremely fast reactions (too fast to measure on NMR) or due to the lack of a substantial change in
the UV absorbance of the solution. However, it was found that the proton transfer involved in the
pre-equilibrium between the activator and leaving group (in this case ethylthiotetrazole and di-
isopropylamine) allowed the reaction to be monitored by conductivity measurements: the amine
released from the phosphoramidite, reacts with excess ETTH generating ETT- and DIAH
+ and in
doing so leads to an increase in conductance (Scheme 32). These measurements could be carried out
rapidly and in real-time allowing kinetics to be measured. Since the conductivity behaviour of these
solutions is complex and the ion-pairing behaviour of the protonated phosphoramidite is not
understood, the conductivity values here have not been rationalised into accurate concentrations.
Several experiments were performed in which the conductivity was monitored of solutions
containing 2'-deoxy-5'-O-DMT-uridine 3'-CE-phosphoramidite (5 mM) – referred to hereafter as
UAm – with varying excess concentrations of ETTH in order to assess the order of the reaction with
respect to ETTH in acetonitrile. The conductivity versus time profiles for these reactions showed a
first-order relationship in which there was an exponential increase in conductivity and plots of the
natural log of the conductance versus time were linear (Fig. 61).

151
kobs = (8.72 × 10⁻⁴) × [ETTH]
0
0.02
0.04
0.06
0.08
0.1
0.12
0.14
0 20 40 60 80 100
ko
bs / s
-1
Concetration of ETTH ([ETTH]) / mM
-2.2
-2
-1.8
-1.6
-1.4
-1.2
-1
-0.8
-0.6
0 5 10 15
ln (
Ʌ∞
- Ʌ
t)
Time (s)
ETTH 30mM
ETTH 40mM
ETTH 50mM
ETTH 60mM
ln (Conductivity∞-Conductivityt) as a Function of Time (s) During
Reactions of UAm (5 mM) with Various Concentrations of ETTH in
Acetonitrile at 25oC
Figure 61: Conductivity measurements (Sm-1
) taken during the activation of Uam (5 mM) using varying concentrations
of ETTH as a function of time in acetonitrile-d3 at 25oC. Concentrations determined by
31P NMR
Pseudo First-Order Rate Constants (kobs / s-1) for Activation of UAm (5 mM)
with Varying Concentrations of ETTH in Acetonitrile at 25oC Followed by
Conductivity
Figure 62: Pseudo first-order rate constants (s-1
) for the activation of UAm with various concentration of ETTH as a
function of ETTH concentration in acetonitrile at 25oC followed by conductivity
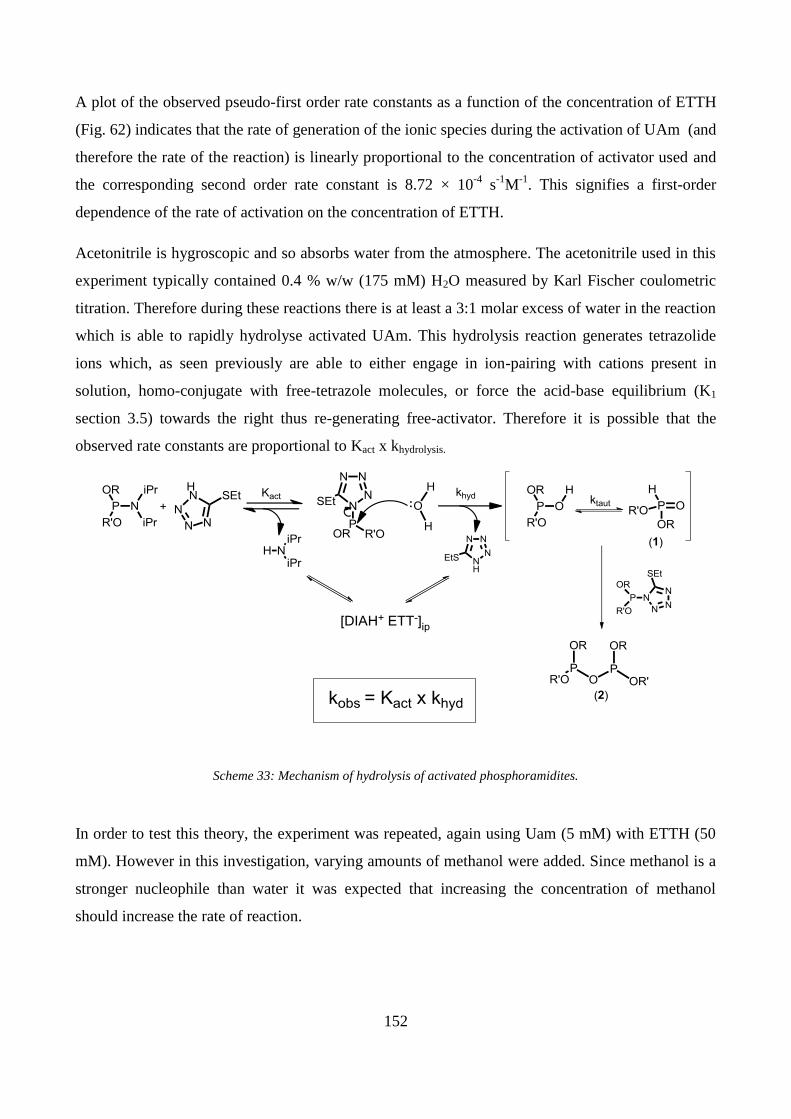
152
A plot of the observed pseudo-first order rate constants as a function of the concentration of ETTH
(Fig. 62) indicates that the rate of generation of the ionic species during the activation of UAm (and
therefore the rate of the reaction) is linearly proportional to the concentration of activator used and
the corresponding second order rate constant is 8.72 × 10⁻⁴
s-1
M-1
. This signifies a first-order
dependence of the rate of activation on the concentration of ETTH.
Acetonitrile is hygroscopic and so absorbs water from the atmosphere. The acetonitrile used in this
experiment typically contained 0.4 % w/w (175 mM) H2O measured by Karl Fischer coulometric
titration. Therefore during these reactions there is at least a 3:1 molar excess of water in the reaction
which is able to rapidly hydrolyse activated UAm. This hydrolysis reaction generates tetrazolide
ions which, as seen previously are able to either engage in ion-pairing with cations present in
solution, homo-conjugate with free-tetrazole molecules, or force the acid-base equilibrium (K1
section 3.5) towards the right thus re-generating free-activator. Therefore it is possible that the
observed rate constants are proportional to Kact x khydrolysis.
Scheme 33: Mechanism of hydrolysis of activated phosphoramidites.
In order to test this theory, the experiment was repeated, again using Uam (5 mM) with ETTH (50
mM). However in this investigation, varying amounts of methanol were added. Since methanol is a
stronger nucleophile than water it was expected that increasing the concentration of methanol
should increase the rate of reaction.

153
kobs = ((-9.0 x 10-07) × [MeOH]) + 0.026
2.0E-2
2.2E-2
2.4E-2
2.6E-2
2.8E-2
3.0E-2
3.2E-2
0 10 20 30 40 50
ko
bs / s
-1
Concentration of MeOH ([MeOH]) / mM
Observed Pseudo First-Order Rate Constants (kobs / s-1) of Methanolysis of
UAm (5 mM) Using ETTH (50 mM) as an Activator as a Function of
Methanol Concentration (mM) in Acetonitrile at 25oC
Figure 63: Observed pseudo first-order rate constants (kobs/s-1
) for methanolysis of UAm (5 mM) using ETTH (50 mM)
as an activator as a function of methanol concentration (mM) in acetonitrile at 25oC
Despite the increased concentration of nucleophiles in solution, the rate of reaction with methanol
present was independent of methanol concentration (Fig. 63). Since activated phosphoramidites are
known to be highly reactive towards nucleophiles it is likely that the rate of cleavage of the
activated phosphoramidite species is much faster than the rate of activation i.e. khydrolysis >> k-1 act.
This is indicative therefore of a process in which activation of the phosphoramidite with
ethylthiotetrazole is the rate limiting step followed by rapid decomposition of the activated species.
The rate law for the reaction can be written as:
𝑅𝑎𝑡𝑒𝑜𝑏𝑠 =𝑘1[𝑈𝐴𝑚][𝐸𝑇𝑇𝐻]
𝑘−1[𝑈𝐴𝑐𝑡][𝐷𝐼𝐴]
Scheme 34: Activation and hydrolysis of UAm using ETTH as the activator.

154
5.6 Investigation into the Activation Equilibrium by 31
P NMR
The activation of phosphoramidites can be achieved with a number of activators. During activation,
an equilibrium is set up, not only between the activator and the amine leaving group (as discussed in
previous sections), but also between reactants and products (Scheme 35). This equilibrium is known
to be reversible, i.e. adding an excess of the amine leaving group (in this case di-isopropylamine)
can push the equilibrium towards the left-hand side129
. As mentioned previously, the efficacy of the
activator is related to its pKa (in the case of acidic activators) and therefore the position of this
equilibrium (Kact value) is different for each activator. The activation equilibrium must therefore be
investigated using ethylthiotetrazole to assess reversibility.
Scheme 35: Equilibrium between un-activated and activated phosphoramidites.
An experiment was set up in which 2'-deoxy-5'-O-DMT-uridine 3'-CE-phosphoramidite (UAm) was
titrated using ETTH until full conversion of the starting material to activated species (UAct) was
achieved monitored by 31
P NMR. To this, di-isopropylamine was added to determine whether the
activated species could be converted back to the starting material. The 31
P chemical shifts of these
species are well known130
. The structures of the compounds generated during these reactions are
shown below:
Kact

155
0.00
0.05
0.10
0.15
0.20
0 1 2 3 4 5 6 7
Sp
ec
ies
Co
nc
en
tra
tio
n / M
Time Point
UAm
UAct
POP
HPhos
Concentration (M) of Various Phosphorus Species in Solution During Titration of
Phosphoramidite (0.2 M) with ETTH and DIA
Figure 64: Activation of UAm (0.2 M) using ETT as the activator in acetonitrile. 1: UAm (0.2 M), 2: UAm (0.2 M) +
1eq ETT, 3: UAm (0.2 M) + 2eq ETT, 4: UAm (0.2 M) + 3eq ETT, 5: UAm (0.2 M) + 3eq ETT + 1eq DIA, 6: UAm (0.2
M) + 3eq ETT + 2eq DIA, 7: UAm (0.2 M) + 3eq ETT + 3eq DIA.

156
The data from these experiments show that the phosphoramidite requires two equivalents of the
activator to achieve full conversion to the activated species and this is due to ion-pair formation
between the activator and the amine leaving group. The spectra also show that the reaction is indeed
reversible: when using excess base the concentration of activated species decreases and the
concentration of starting material increases. However, the high reactivity of the activated species
means that it is susceptible to nucleophilic attack by any nucleophiles present in the solution,
including water, as discussed in the previous section. Thus the spectra also show evidence of the
products of hydrolysis of the activated species: H-phosphonate (1) and a POP pyrophosphate
species (2). This hydrolysis distorts the equilibrium somewhat because it not only consumes starting
material it also liberates one molecule of activator for each mole of hydrolysed species. (Scheme
36).
Scheme 36: Mechanism of hydrolysis of activated phosphoramidites

157
5.7 Investigation of the Kinetics of Activation of di-tert-Butyl N,N-di-isopropyl
phosphoramidite (DBAm) Using Various Tetrazole Activators by 31
P NMR
Attempts to follow the kinetics of activation and hydrolysis of a number of phosphoramidites
proved difficult since the solvent, and indeed reactants, used in these experiments contained
absorbed water which caused full hydrolysis of the activated species within 5 minutes (Scheme 36).
This is too fast to follow by conventional 31
P NMR since the delay time between starting the
experiment and recording spectra is at least 5 minutes. Whilst conductivity allows the determination
of reaction rates, it does not allow the quantification of the concentration of individual species (fig.
65). However, since the equilibrium involving activated phosphoramidites and the amine leaving
groups is known to be reversible (Fig. 64) a method was devised in which the activation was
quenched with excess of a new base at t=n s. Adding excess of a different base in this way couples
the new base to the activated species, allowing quantification of this species, and also quenches any
free activator in solution by reaction with the excess base, preventing further reaction. After the
reaction was quenched, a 31
P NMR spectrum of the reaction mixture was recorded.
Figure 65: 31
P NMR spectrum of activation of DBAm (2.5 mM) using ETTH (5 mM) quenched with diethyl amine (50
eq) at t=30 s in acetonitrile at 25oC. 1: di-tert-butyl N,N-di-isopropyl phosphoramidite; 2: di-tert-butyl N,N-diethyl
phosphoramidite

158
Diethylamine was chosen as the new base, whilst it is basic enough to reverse the activation
process, the chemical shift of the N,N-diethyl phosphoramidite is slightly different to that of the
N,N-di-isopropyl phosphoramidite. This allows quantification of the concentration of the initial
starting material at t= n as the reverse reaction does not re-generate the starting material. Attempts
to follow the kinetics of activation by NMR had previously been unsuccessful, and so di-tert-butyl
N,N-di-isopropyl phosphoramidite (DBAm) was chosen as the phosphoramidite due to its reported
low coupling efficiency131
.
Monitoring reaction kinetics in this way allowed the rates of activation of DBAm to be measured
using 5 different substituted tetrazole activators (substituted at the 5´ position) (Table 18). Again,
these reactions showed first-order kinetics even at low concentrations of activator, due to the
regeneration of the activator catalyst with subsequent hydrolysis of the activated species.
Activator Abbreviation kobs / s-1 pKa(sol.)
Tetrazole TetH 1.20 × 10⁻³ 4.73
Methylthiotetrazole MTTH 9.32 × 10⁻³ 3.89
Ethylthiotetrazole ETTH 8.20 × 10⁻³ 3.85
4-Fluorophenyltetrazole (4-F-Ph)TH 5.56 × 10⁻³ 3.96
Phenyltetrazole PhTH 4.18 × 10⁻³ 4.07
Table 18: Pseudo first-order rate constants (kobs / s-1
) for reaction of DBAm with various tetrazole activators
In order to quantify and properly compare these results, the pKa(sol.) of these activators were
determined in a solvent mixture of 10% v/v DMSO in water (Table 18). This solvent composition
was chosen as some of the activators were highly insoluble in water and so needed the DMSO co-
solvent before any experiments could be performed. Addition of 10% DMSO was not expected to
alter the ability of the pH probe to measure the pH. The pKa(sol.)s of the activators were determined
by pH titration with NaOH in 10% DMSO in H2O in a similar way to that used to measure the pK-
a(H2O) of ETTH. Using these data, a Brønsted plot (Fig. 66) was constructed in order to determine
the dependence of the rate of activation on the pKa of the activator.

159
log kobs= (-0.9639 × Activator pKa(sol.)) + 1.6175
-3.1
-2.9
-2.6
-2.4
-2.1
3.60 3.85 4.10 4.35 4.60 4.85
log
ko
bs
Activator pKa(sol.)
Dependence of the Observed Pseudo First-Order Rate Constants (kobs/s-1)
of the Reaction between DBAm and Various Tetrazoles on the pKa(sol.) of
the Tetrazole Used
Figure 66: Brønsted plot showing the dependence of the observed rate constants of reaction of DBAm with various
tetrazoles on the pKa(sol.) of the tetrazole.
Although the Brønsted plot covers only a narrow range of pKa it clearly indicates activity increase
with increased acidity of the activator. Correlation of the pKa(s) of the activators with the observed
rate constants shows a linear correlation. The fact that the observed α-value is approximately equal
to 1 indicates that activation of phosphoramidites proceeds via specific acid catalysis involving a
rapid pre-equilibrium in which a proton has been completely transferred to from the protonated
reactant in the transition state. It can be said, therefore, that activation proceeds via a two-step
process: step 1- proton transfer to the phosphoramidite amine group followed by a nucleophilic
attack by the conjugate base of the activator at the phosphorus centre (Scheme 37).

160
Scheme 37: Rate equation for activation of DBAm with ETTH
It is likely that the pKas in acetonitrile would be linearly related to those in 10% DMSO-water
similar to the linear correlation observed in figure 58 showing the correlation between the
pKa(ACN) and the pKa(H2O) for various heterocyclic nitrogen acids. It is reasonable, therefore, to
assume that the Brønsted coefficient based on pKas in acetonitrile would be similarly high and
approximately 1, suggesting that in the transition state the tetrazole is fully deprotonated and bears
a full negative charge compatible with a a rapid pre-equilibrium and rate-limiting attack by the
tetrazolide ion on the N-protected phosphoramidite (step k2, Scheme 37).

161
6. Conclusions and Further Work

162
6.1 Ageing PADS
PADS degrades in basic acetonitrile solution to yield acyl polysulfides which are the active
sulfurizing reagents. The generation of these species is responsible for the observed increase in rate
of sulfur transfer from aged PADS solutions compared with ‘fresh’ or non-aged solutions.
This process is initiated by an E1cB mechanism in which the methylene protons are removed by the
base to form a semi-stable carbanion. This process is reversible as demonstrated by H/D exchange.
The carbanion formed by the proton abstraction degrades to form a ketene intermediate and a
disulfide anion. The ketene intermediate can be trapped via an intramolecular [2+2]-cycloaddition
reaction upon addition of an allyl group in the σ position of the phenyl ring in PADS. The disulfide
anions generated from the degradation of the carbanion subsequently react with other unreacted
PADS and polysulfide molecules to form species with extended sulfur chains.
Ageing of PADS is first-order with respect to PADS and the pyridine base used. The rate of
decomposition of PADS can be slowed by using a less basic pyridineor, conversely, the rate can be
increased using a stronger base. Similarly, the rates of decomposition of PADS and deuterium
exchange are increased when electron withdrawing substituents are added to the PADS phenyl ring.
Removal of the methylene protons in PADS prevents any decomposition of the PADS molecule.

163
The solvent dependence of this process and the fact that the reaction occurs in the presence of the
radical trap butylated hydroxy toluene indicates that this is an ionic process and does not involve the
generation of radicals.
Further work on this area could include further preparative HPLC on aged PADS solutions in order
to obtain a suitable sample size, allowing more physical and spectroscopic data on the polysulfides
to be obtained. This would also allow more kinetic measurements of the sulfur transfer reactions
with the isolated species to be recorded. Conversely, the phenylacetyl polysulfide molecules could
also be synthesised and isolated. Similarly, PADS molecules could be synthesised in which the
methylene protons are exchanged for deuterium in order to assess the effect of the isotopes on the
kinetics of ageing.
During this work, the reaction kinetics have been followed solely by HPLC and NMR. Monitoring
the ageing process by infra-red spectroscopy via a react-IR method would allow the concentration
of the ketene intermediate to be followed in order to observe this species in a non-invasive way (i.e.
without trapping).
6.2 Sulfurisation of Phosphites using Fresh and Aged PADS
Ageing PADS solutions in basic acetonitrile increases the rate of sulfurisation. The reason for the
increase in reactivity of aged PADS solutions is due to the presence of polysulfides. This difference
in reactivity is demonstrated by the kinetic behaviour and the dependencies of the rate of these
solutions on the concentrations of the reactant components. The sulfurisation reaction with both
fresh and aged PADS is first-order with respect to each reagent: phosphite, PADS and base at low
concentrations however with aged PADS the reaction rate becomes independent of base at higher
concentrations. First and foremost, this indicates that the pyridine base used in the reaction is
intimately involved in the mechanism of sulfurisation, a point previously overlooked in the
literature. Brönsted βnuc values for the base dependence of the reactions of fresh and aged PADS on
the pKa of the pyridine used are +0.43 and +0.26 respectively indicating positive charge transfer to
the pyridine nitrogen before or during the rate-limiting step of the reaction.
Brönsted βnuc value for varying the substituent on the alkyl phosphite used in reactions of fresh
PADS is +0.51 which is indicative of a build-up of positive charge on the phosphite, i.e.
nucleophilic attack by the phosphite on the disulfide bond to yield a phosphonium ion intermediate.

164
Removing the methylene protons from the PADS molecule decreases the rate of sulfurisation,
indicating that the rate limiting step of sulfurisation is the breakdown of the phosphonium
intermediate since removing the protons from this position forces an alternate decomposition
mechanism.
Breakdown of the mono-sulfide phosphonium generated by reaction with fresh PADS proceeds via
an E1cB-type elimination involving cleavage of the C-S bond, similar to that seen in the initiation
of PADS decomposition by pyridines in chapter 3. This is supported by the Hammett plot of various
phenyl substituted PADS molecules in which it was seen that electron withdrawing substituents
increase the rate of reaction. Breakdown of the polysulfide phosphonium intermediate generated by
reaction with aged PADS proceeds via a nucleophilic attack of the pyridine base to break the
weaker S-S bond. This more facile pathway results in a faster rate of reaction with aged PADS.
The solvent dependence of these reactions and the fact that the reactions still proceed in the
presence of the radical trap butylated hydroxyl toluene indicates that this is an ionic process and
does not involve the generation of radicals.
In order to further this work experiments could be done in which the methylene protons in the
PADS molecules are replaced by deuterium molecules in order to assess the kinetic isotope effects
of PADS degradation and distinguish between a base-catalysed process (fresh PADS) and a
nucleophile-catalysed process (aged PADS). Similarly, reactions using the o-allyl analogue of
PADS and σ-allyl polysulfides could be used in sulfurisation experiments in order to detect the
presence of the cycloaddition products, again distinguishing between the two pathways.
165
6.3 Coupling and Activation
Ethylthiotetrazole (ETTH) has been shown to be an efficient activator of phosphoramidites for use
in coupling reactions in oligonucleotide synthesis. The equilibrium between unreacted tetrazole and
di-isopropylamine means that the activator cannot fully act catalytically. It is shown here that the
tetrazolide and ammonium ions generated in this acid-base equilibrium are strongly ion paired and
are therefore effectively removed from the reaction.
Initial conductivity work has shown that the activation of phosphoramidites by ETTH is first order
with respect to activator and to amidite. It is also shown here that the rate limiting step of the
alcoholysis of phosphoramidites is the activation by ETTH and that the nucleophilic substitution is
rapid.
Further work must be carried out in order to fully understand the acid-base equilibrium between
ETTH, DIAH+
and the homo-conjugate species. This includes full mass balance equations to assess
the extent of homo-conjugation as well as experiments to determine the specific ionic conductivities
of the ETT- and DIAH
+ ions. In this work structure-activity relationships of the activation of
phosphoramidites have been constructed varying tetrazole substituents. However, more information
about the transition state of the activation could be gleaned by varying the phosphoramidite leaving
group, for example, by modifying the amine pKa. This will allow a value of βnuc L.G. to be deduced,
providing information about the state of the bond between the phosphorus and both the amine and
tetrazole in the transition state.

166
7. References

167
1 Berg, J. M., L., Tymoczko, J. & Stryer, L. Biochemistry. 5th
ed., (W. H. Freeman and Co.,
2003).
2 Devlin, T. M. Textbook of Biochemistry: With Clinical Correlations. 6th
ed., (John Wiley &
Sons Inc., 2006).
3 Kvaerno, L. & Wengel, J. Chem. Commun.1419-24 (2001).
4 Voet, D. V., Voet, J. G. & Pratt, C. W. Fundamentals of Biochemistry: Life at the Molecular
Level. 2nd
ed., (John Wiley & Sons Inc., 2006).
5 Uhlmann, E. & Peyman, A. Chem. Rev. 90 (1990).
6 Wang, S. & Kool, E. T. Biochemistry 34, 4125-4132 (1995).
7 Zamecnik, P. C. & Stephenson, M. L. Proc. Natl. Acad. Sci. U.S.A. 75, 285-288 (1978).
8 Boado, R. J., Tsukamoto, H. & M., Padridge, W. M. J. Pharm. Sci. 87, 1308-15 (1998).
9 Kennewell, P. Curr. Opin. Mol. Ther. 5 (1), 76-80 (2003).
10 Aershot, A. V. Antiviral Res. 71, 307-16 (2006).
11 Lu, Q. L., Rabinowitz, A., Yin, H., Alter, J., Bou-Gharios, G., & Partridge, T. Mol. Ther. 11,
306-306 (2005).
12 Hélène, C. Montenay-Garestier, T., Saison, T., Takasugi, M., Toulmé, J. J., Asseline, U.,
Lancelot, G., Maurizot, J. C., Toulmé, F. & Thuong, N. T. Biochimie 67, 777-783 (1985).
13 Lebedeva, I. & Stein, C.; Annu. Rev. Pharmacol. 41, 403-419 (2001).
14 Ts'O, P. O. P., Miller, P. S., Aurelian, L., Murakami, A., Agris, C., Blake, K. R., Lin, S. B.,
Lee, B. L. & Smith, C. C. Ann. N.Y. Acad. Sci. 507, 220 (1988).
15 Le Doan, T., Perrouault, L., Praseuth, D., Habhoub, N., Decout, J. L., Thuong, N. T.,
Lhomme, J. & Hélène, C. Nucleic Acids Res. 15, 7749-7760 (1987).
16 Uhlmann, E. & Peyman, A. Chem. Rev. 90, 543-584 (1990).
17 Juliano, R. L., Ming, Nakagawa, X. & Nakagawa, O. Acc. Chem. Res. 45, 1067-1076
(2012).
18 Juliano, R. L., Ming, X and Nakagawa, O. Acc. Chem. Res 45, 1067-1076 (2011).
19 Wilton, S. D., Fall, A. M., Harding, P. L., McClorey, G., Coleman, C. & Fletcher, S. Mol.
Ther. 15, 1288-1296 (2007).
20 Moulton, H. M. & Moulton, J. D. Biochim. Biophys. Acta 1798, 2296-2303 (2010).
21 Van Deutekom, J. C. Janson, A. A., Ginjaar, I. B., Frankhuizen, W. S., Aartsma-Rus, A.,
Bremmer-Bout, M., Den Dunnen, J. T., Koop, K., Van der Kooi, A. J., Goemans, N. M. &
De Kimpe, S. J. New Engl. J. Med. 357, 2677-2686 (2007).
22 Aartsma‐Rus, A., Van Deutekom, J. C., Fokkema, I. F., Van Ommen, G. J. B. & Den
Dunnen, J. T. Muscle & nerve 34, 135-144 (2006).
23 Strachan, T. & Read, A. Human Molecular Genetics. 3rd
ed.,(Wiley, Oxford, 1999).
24 Monio, B. P., Lesnik, E. A., Gonzalez, C., Lima, W. F., McGee, D., Guinosso, C. J.,
Kawasaki, A. M., Cook, P. D. & Freier, S. M. J. Biol. Chem.268, 14514-14522 (1993).
25 Clark, R. E. Leukemia lymphoma 19, 189-195 (1995).
26 Leonetti, J. P., Degols, G. & Lebleu, B. Bioconjugate Chem. 1, 149-153 (1990).
27 Loke, S., Stein, C. A., Zhang, X. H., Mori, K., Nakanishi, M., Subasinghe, C., Cohen, J. S.
& Neckers, L. M. Proc.Nat. Acad.Sci. 86, 3474-3478 (1989).
28 Wang, L., Chen, S., Xu, T., Taghizadeh, K., Wishnok, J. S., Zhou, X., You, D., Deng, Z.
and Dedon, P. C. Nat. Chem. Biol. 3, 709-710 (2007).
29 Richard, J. P. & Frey, P. A. J.Am.Chem. Soc. 100, 7757-7758 (1978).
30 Eckstien, F. Angew. Chem. Int. Ed. Engl. 22, 423-439 (1983).
31 Suska, A., Grajkowski, A., Wilk, A., Uznanski, B., Blaszczyk, J., Wieczorek, M. & Stec, W.
J. Pure Appl. Chem. 65, 707-707 (1993).
32 Stec, W. J. & Wilk, A. Angew. Chem. Int. Ed. Engl.33, 709-722 (1994).
33 Guga, P. & Koziołkiewicz, M. Chem. Biodiv. 8, 1642-1681 (2011).

168
34 Stec, W. J., Grajkowski, A., Koziolkiewicz, M. & Uznanski, B. Nucleic Acids Res. 19,
5883-5888 (1991).
35 De Mesmaeker, A., Altmann, K.-H., Waldner, A. & Wendeborn, S. Curr. opin. Struc. Biol.
5, 343-355 (1995).
36 Marshall, W. & Caruthers, M. Science 259, 1564-1564 (1993).
37 Frey, P. A. & Sammons, R. D. Science 228, 541-545 (1985).
38 Iversen, P. L., Mata, J., Tracewell, W. G. & Zon, G. Antisense Res.Dev. 4, 43-52 (1994).
39 De Clercq, E., Eckstein, F., Sternbach, H. & Merigan, T. C. Virology 42, 421-428 (1970).
40 Nielsen, J., Brill, W. K. D. & Caruthers, M. H. Tetrahedron Lett. 29, 2911-2914 (1988).
41 Jayaraman, K., McParland, K., Miller, P. & Ts'o, P. O. P. P. Nat. Acad. Sci. 78, 1537-1541
(1981).
42 Akhtar, S. B., S., Wickstrom, E, Juliano, R. L. Nucl. Acids Res. 19, 5543-5550 (1991).
43 Quartin, R. S. & Wetmur, J. G. Biochemistry 28, 1040-1047 (1989).
44 Lin, S. B., Blake, K. R., Miller, P. S. & Ts'o, P. O. P. Biochemistry 28, 1054-1061 (1989).
45 Miller, P. Y., J., Yano, E., Carroll, C., Jayaraman, K. & Ts'O, P. O. P. Biochemistry 18,
5134-5143 (1979).
46 Agrawal, S. & Goodchild, J. Tetrahedron Lett. 28, 3539-3542 (1987).
47 Stec, W. J., Zon, G., Egan, W., Byrd, R.A., Phillips, L.R. & Gallo, K.A.J. Org. Chem. 50,
3908-3913 (1985).
48 Froehler, B., Ng, P. & Matteucci, M. Nucleic Acids Res. 16, 4831-4839 (1988).
49 Letsinger, R. L. & Heavner, G. A. Tetrahedron Lett. 16, 147-150 (1975).
50 Jäger, A., Levy, M. J. & Hecht, S. M. Biochemistry 27, 7237–7246 (1988).
51 Sood, A., Shaw, B. R. & Spielvogel, B. F. J. Am. Chem. Soc. 112, 9000-9001 (1990).
52 Sproat, B. S., Beijer, B., Rider, P. & Neuner, P. Nucleic Acids Res. 15, 4837-4848 (1987).
53 Morr, M., Ernst, L. & Grotjahn, L. Z.Naturforsch. B. 38, 1665-1668 (1983).
54 Sproat, B. S., Beijer, B. & Rider, P. Nucleic Acids Res. 15, 6181-6196 (1987).
55 Hata, T., Yamamoto, I. & Sekine, M. Chem. Lett. 5, 601-604 (1976).
56 Ogilvie, K. & Cormier, J. Tetrahedron Lett. 26, 4159-4162 (1985).
57 Jones, D. & Tittensor, J. J. Chem. Soc. D.: Chem. Commun., 1240a-1240a (1969).
58 Marcus-Sekura, C., Woerner, A. M., Shinozuka, K., Zon, G. & Quinnan, G. V. Nucleic
Acids Res. 15, 5749-5763 (1987).
59 Qiu, J., El-Sagheer, A. H. & Brown, T. Chem. Commun. 49, 6959-6961 (2013).
60 Monia, B. P., Lesnik, E. A., Gonzalez, C., Lima, W. F., McGee, D., Guinosso, C. J.,
Kawasaki, A. M., Cook, P. D. & Freier, S. M.J. Biol. Chem. 268, 14514-14522 (1993).
61 De Mesmaeker, A., Haener, R., Martin, P. & Moser, H. E. Accounts Chem. Res. 28, 366-374
(1995).
62 Bellon, L., Morvan, F., Barascut, J. L. & Imbach, J. L. Biochem. Biophys. Res. Co. 184,
797-803 (1992).
63 Sagi, J., Szemzõ, A., Szécsi, J. & Ötvös, L. Nucleic Acids Res. 18, 2133-2140 (1990).
64 Sanghvi, Y. S. & Cook, P. D. Carbohydrate Modifications in Antisense Research. Vol. 580
(ACS Publications, 1994).
65 Jones, R. J., Lin, K. Y., Milligan, J. F., Wadwani, S. & Matteucci, M. D. J. Org. Chem. 58,
2983-2991 (1993).
66 Gryaznov, S. & Schultz, R. G. Tetrahedron Lett. 35, 2489-2492 (1994).
67 Saenger, W. Principles of nucleic acid structure. Vol. 7 (Springer-Verlag New York, 1984).
68 Khorana, H. G. Federation Proc. 19, 931-941 (1960).
69 Shibahara, S., Mukai, S., Nishihara, T., Inoue, H., Ohtsuka, E. & Morisawa, H., Nucleic
Acids Res. 15, 4403-4415 (1987).
70 Matteucci, M. D. & Caruthers, M. J. Am. Chem. Soc. 103, 3185-3191 (1981).
71 Froehler, B. & Matteucci, M. Tetrahedron Lett. 27, 469-472 (1986).

169
72 Froehler, B. C. Tetrahedron Lett. 27, 5575-5578 (1986).
73 Hall, R., Todd, A. & Webb, R. J. Chem. Soc. (Resumed), 3291-3296 (1957).
74 Froehler, B. C., Ng, P. G. & Matteucci, M. D. Nucleic Acids Res. 14, 5399-5407 (1986).
75 Reese, C. B. Tetrahedron 58, 8893-8920 (2002).
76 Beaucage, S. & Caruthers, M. Tetrahedron Lett. 22, 1859-1862 (1981).
77 Dahl, B. H., Nielsen, J. & Dahl, O. Nucleic Acids Res. 15, 1729-1743 (1987).
78 Nurminen, E. J., Mattinen, J. K. & Lonnberg, H. J. Chem. Soc., Perkin Trans. 2, 2159-2165
(2001).
79 Berner, S., Mūhlegger, K. & Seliger, H. Nucleic Acids Res. 17, 853-864 (1989).
80 Hayakawa, Y., Iwase, T., Nurminen, E. J., Tsukamoto, M. & Kataoka, M. Tetrahedron 61,
2203-2209 (2005).
81 Nurminen, E. J., Mattinen, J. K. & Lönnberg, H. J. Chem. Soc., Perkin Trans. 2, 1621-1628
(1998).
82 Knaap, T. A. V. D. & Bickelhaupt, F. Phosphorus Sulfur 21, 227-236 (1984).
83 Nurminen, E. J., Mattinen, J. K. & Lönnberg, H. J. Chem. Soc., Perkin Trans. 2, 2238-2240
(2000).
84 Korkin, A. Russ. Chem. Rev. 61, 473 (1992).
85 Dąbkowski, W., Tworowska, I., Michalski, J. & Cramer, F. Tetrahedron Lett. 41, 7535-
7539 (2000).
86 Nurminen, E. J., Mattinen, J. K. & Lönnberg, H. J. Chem. Soc., Perkin Trans. 2, 2159-2165
(2001).
87 Sproat, B., Colonna, F., Mullah, B., Tsou, D., Andrus, A., Hampel, A. & Vinayak, R.
Nucleos. Nucleot. Nucl. 14, 255-273 (1995).
88 Wu, X. & Pitsch, S. Nucleic Acids Res. 26, 4315-4323 (1998).
89 Froehler, B. & Matteucci, M. Tetrahedron Lett. 24, 3171-3174 (1983).
90 Welz, R. & Müller, S. Tetrahedron Lett. 43, 795-797 (2002).
91 Connolly, B. A., Potter, B. V., Eckstein, F., Pingoud, A. & Grotjahn, L. Biochemistry 23,
3443-3453 (1984).
92 Iyer, R. P., Egan, W., Regan, J. B. & Beaucage, S. L. J. Am. Chem. Soc. 112, 1253-1254
(1990).
93 Hanusek, J., Russell, M. A., Laws, A. P., Jansa, P., Atherton, J. H., Fettes, K. & Page, M. I.
Org. Biomol. Chem. 5, 478-484 (2007).
94 Zhang, Z., Nichols, A., Tang, J. X., Han, Y. & Tang, J. Y. Tetrahedron Lett. 40, 2095-2098
(1999).
95 Xu, Q., Barany, G., Hammer, R. P. & Musier-Forsyth, K. Nucleic Acids Res. 24, 3643-3644
(1996).
96 Krotz, A. H., Gorman, D., Mataruse, P., Foster, C., Godbout, J. D., Coffin, C. C. &
Scozzari, A. N.Org. Proc. Res. Dev. 8, 852-858 (2004).
97 Cheruvallath, Z. S., Carty, R. L., Moore, M. N., Capaldi, D. C., Krotz, A. H., Wheeler, P.
D., Turney, B. J., Craig, S. R., Gaus, H. J., Scozzari, A. N. & Cole, D. L.Org. Proc. Res.
Dev. 4, 199-204 (2000).
98 Efimov, V. A., Kalinkina, A. L., Chakhmakhcheva, O. G., Hill, T. S. & Jayaraman, K.
Nucleic Acids Res. 23, 4029-4033 (1995).
99 Iyer, R. P., Egan, W., Regan, J. B. & Beaucage, S. L. J. Am. Chem. Soc. 112, 1253-1254
(1990).
100 Oae, S. & Doi, J. Organic Sulfur Chemistry. Vol. 1 (CRC Press, 1991).
101 Steudel, R. Properties of sulfur‐sulfur bonds. Angew. Chem. Int. Ed. Engl. 14, 655-664
(1975).
102 Epplequist, C. H. D., K. Reinhart. Introduction to Organic Chemistry. 3rd
ed. (1982).
103 Houk, J. & Whitesides, G. M. J. Am. Chem. Soc.109, 6825-6836 (1987).

170
104 Belen’kii, L. The Chemistry of Organic Compounds of Sulfur. General Aspects (1988).
105 Koval, I. V. Russ. Chem. Rev. 63, 735-750 (1994).
106 Wiewiorowski, T. K. & Touro, F. J. J. Phys. Chem. 70, 234-238 (1966).
107 Pickering, T. L., Saunders, K. & Tobolsky, A. V. J. Am. Chem. Soc. 89, 2364-2367 (1967).
108 Sierzchala, A. B., Dellinger, D. J., Mokler, V. R. & Timar, Z. Use Of Thioacetic Acid
Derivatives In The Sulfurization Of Oligonucleotides With Phenylacetyl Disulfide. US
2010/0331533 A1 (2009).
109 Vu, H. & Hirschbein, B. L. Tetrahedron Lett. 32, 3005-3008 (1991).
110 Kamyshny, A., Goifman, A., Gun, J., Rizkov, D. & Lev, O. Environmental Science &
Technology 38, 6633-6644 (2004).
111 Cox, B. G. Acids and Bases: Solvent Effects on Acid-Base Strength. (OUP Oxford, 2013).
112 Roelen, H., Kamer, P., Van den Elst, H., Van der Marel, G. & Van Boom, J. Recl. Trav.
Chim. Pay. B. 110, 325-331 (1991).
113 Black, H. S. Front. Biosci. 7, 1044-1055 (2002).
114 Scotson, J. L., Andrews, B. I., Laws, A. P. & Page, M. I. Org. Biomol. Chem. 14, 8301-8308
(2016).
115 Bakshi, M. S. J. Chem. Soc., Faraday Trans. 89, 3049-3054 (1993).
116 Walling, C. & Rabinowitz, R. J. Am. Chem. Soc. 81, 1243-1249 (1959).
117 Stratakis, M., Rabalakos, C. & Sofikiti, Tetrahedron Lett. 44, 349-351 (2003).
118 Hammett, L. P. J. Am. Chem. Soc. 59, 96-103 (1937).
119 Pearson, R. G. & Williams, F. V. J. Am. Chem. Soc. 76, 258-260 (1954).
120 Johnson, S. Adv. Phys. Org. Chem. 5, 237-330 (1967).
121 Bunton, C. & Fendler, J. J. Org. Chem. 31, 2307-2312 (1966).
122 Serjeant, E. P. & Dempsey, B. Ionisation constants of organic acids in aqueous solution.
Vol. 23 (Pergamon, 1979).
123 Harpp, D. N., Ash, D. K. & Smith, R. A. J. Org. Chem. 45, 5155-5160 (1980).
124 Deacon, T., Farrar, C. R., Sikkel, B. J. & Williams, A. J. Am. Chem. Soc. 100, 2525-2534
(1978).
125 Nag, S. & Datta, D. Indian J. Chem. 46, 1263-1265 (2007).
126 Gearey, W. J. Coord. Chem. Rev. 7, 81 (1971).
127 Zielińska, J., Makowski, M., Maj, K., Liwo, A. & Chmurzyński, L. Anal. Chim. Acta 401,
317-321 (1999).
128 Huyskens, P., Platteborze, K. & Zeegers-Huyskens, T. J. Mol. Struct. 436, 91-102 (1997).
129 Russell, M. A. Kinetics and Mechanisms of Steps in Anti-Sense Oligonucleotide Synthesis,
University of Huddersfield, (2007).
130 Russell, M. A., Laws, A. P., Atherton, J. H. & Page, M. I. Org. & Biomol. Chem. 6, 3270-
3275 (2008).
131 Scheuer-Larsen, C., Dahl, B. M., Wengel, J. & Dahl, O. Tetrahedron Lett. 39, 8361-8364
(1998).
132 Shelton, R. S., Rider, T. H. J. Am. Chem. Soc. 58, 1282-4 (1936).

171
Appendix 1: X-Ray Crystal Structure
Data

172
X-Ray Crystal Structure Information for Bis-benzoyl Disulfide
Chemical Formula C14H10O2S2
Formula Mass 274.34
Crystal System Monoclinic
a/Å 12.2493(3)
b/Å 12.0214(3)
c/Å 8.9707(2)
α/° 90
β/° 107.4043(11)
γ/° 90
Unit cell volume/Å3 1260.49(5)
Temperature/K 150(2)
Space group P 21/c
No. of formula units per unit cell, Z 4
Rint 0.0599
Final R1 values 0.0645

173
Appendix 2: Publications from this
Work

Organic &Biomolecular Chemistry
PAPER
Cite this: Org. Biomol. Chem., 2016,14, 8301
Received 18th July 2016,Accepted 9th August 2016
DOI: 10.1039/c6ob01531j
www.rsc.org/obc
Phosphorothioate anti-sense oligonucleotides:the kinetics and mechanism of the generationof the sulfurising agent from phenylacetyldisulfide (PADS)†
James L. Scotson,a Benjamin I. Andrews,b Andrew P. Lawsa and Michael I. Page*a
The synthesis of phosphorothioate oligonucleotides is often accomplished in the pharmaceutical industry
by the sulfurisation of the nucleotide–phosphite using phenylacetyl disulfide (PADS) which has an optimal
combination of properties. This is best achieved by an initial ‘ageing’ of PADS for 48 h in acetonitrile with
3-picoline to generate polysulfides. The initial base-catalysed degradation of PADS occurs by an
E1cB-type elimination to generate a ketene and acyldisulfide anion. Proton abstraction to reversibly
generate a carbanion is demonstrated by H/D exchange, the rate of which is greatly increased by
electron-withdrawing substituents in the aromatic ring of PADS. The ketene can be trapped intra-
molecularly by an o-allyl group. The disulfide anion generated subsequently attacks unreacted PADS on
sulfur to give polysulfides, the active sulfurising agent. The rate of degradation of PADS is decreased by
less basic substituted pyridines and is only first order in PADS indicating that the rate-limiting step is
formation of the disulfide anion from the carbanion.
Introduction
Synthetic oligonucleotides have been used in many differentways for several decades,1 such as therapeutic agents and indiagnostics. An anti-sense oligonucleotide (ASO) is usually asingle-stranded deoxy-ribonucleotide (usually 15–35 basepairs in length) which is complementary to a target mRNA.Complex dimer formation between the ASO and the targetmRNA through normal Watson–Crick base pairing can lead toinhibition of translation and so prevent synthesis of anunwanted target protein. The formation of the ASO–mRNAhetero-duplex often activates RNase H endonuclease activitywhich then catalyses the hydrolysis of the mRNA leaving theASO intact.2 The first approved anti-sense oligonucleotide wasVitravene (formiversen, for treating the blinding viralcondition cytomegalovirus induced retinitis afflicting some ofthose infected with HIV3), which was followed by numerousclinical trials of other oligonucleotides4 and, more recently,Kynamro (mipomersen) to treat genetically inherited high
cholesterol levels.5 Other mechanisms of action of ASOsinclude ‘exon-skipping’ where, instead of binding to mRNA,the ASO binds to longer pre-mRNA chains sterically blockingan unwanted mutation and its surrounding sequence prevent-ing the exon, containing the mutation, being spliced into themRNA. Antisense-mediated exon skipping is a promisingtherapeutic for neuromuscular diseases,6 although trials fordrisapersen to treat Duchenne Muscular Dystrophy haverecently been stopped. ASOs are also useful as valuablegenetic diagnostic tools, for example, HyBeacon probes aresingle-stranded oligonucleotides with one or more internalbases labelled with a fluorescent dye so that when duplexformation occurs with its target sequence there is an increasein fluorescence.7
However, the use of phosphodiester anti-sense oligonucleo-tides is limited because they are rapidly hydrolysed by intra-cellular endonucleases and exonucleases.8 Consequently, ASOshave been modified to decrease their susceptibility to nucleasecleavage and to increase their uptake into cells, bindingefficiency, bio-stability and potency.9 Examples of these modi-fications are the inclusion of phosphorothioate backbones(1)10 and changes to the 2′ position of the ribose sugar (e.g.2′-O-methoxyethyl) or the sugar-phosphate (e.g. morpholinoand locked nucleic acid, (S)-constrained-2′-O-ethyl – bicyclicconstrained riboses).11 These changes do not disruptH-bonding between the nucleobases.
†Electronic supplementary information (ESI) available: Detailed kinetic data.See DOI: 10.1039/c6ob01531j
aDepartment of Chemistry, University of Huddersfield, Queensgate, Huddersfield
HD1 3DH, UK. E-mail: [email protected] Medicines Research Centre, Gunnels Wood Road, Stevenage, Hertfordshire,
SG1 2NY, UK
This journal is © The Royal Society of Chemistry 2016 Org. Biomol. Chem., 2016, 14, 8301–8308 | 8301

Phosphorothioates (1) are the most widely investigated oligo-nucleotides because of their relative nuclease stability andease of synthesis and a naturally occurring phosphorothioatehas even been found in bacterial DNA.12 The replacement ofone of the phosphate non-bridging oxygens by sulfur intro-duces chirality at phosphorus and it is only the (S)-P phosphoro-thioate diastereomer that is nuclease resistant.13 However,phosphorothioate oligonucleotides can reduce the affinity ofthe ASO for its mRNA target as shown by the melting tempera-ture of the ASO–mRNA hetero-duplex which is decreased byapproximately 0.5 °C per nucleotide.14 Conversely, the intro-duction of the hydrophobic sulfur increases cell uptake com-pared with the wild-type phosphodiester. Phosphorothioateoligonucleotides remain highly water soluble, still bind well tomRNA and activate RNase H making them the most commonmodification of ASOs undergoing clinical trials.
The synthesis of phosphorothioate oligonucleotides is oftenaccomplished by the sulfurisation of the nucleotide–phosphitethrough reaction of the corresponding P(III) analogue, usuallyattached to a solid support, with an organic sulfurising agentwhich is present in an organic solvent. As with all the stepsinvolved in the synthesis of oligonucleotide based phos-phorthioates, the sulfurisation step of the synthesis should berapid, have a near quantitative yield and give a maximal PvSto PvO ratio. The sulfurisation of phosphorus(III) compoundshas been achieved with a number of reagents such as: phenyl-acetyl disulfide (PADS) (2),15 3H-1,2-benzodithiol-3-one-1,1-dioxide (Beaucage reagent),16 tetraethylthiuram disulfide(TETD),17 dibenzoyl tetrasulfide,18 bis-(O,O-diisopropoxy-phosphinothioyl) disulfide (S-tetra),19 benzyltriethylammoniumtetrathiomolybdate (BTTM),20 bis-(p-toluenesulfonyl) di-sulfide,21 3-ethoxy-1,2,4-dithiazoline-5-one (EDITH) and 1,2,4-dithiazolidine-3,5-dione (DTSNH),22 bis(ethoxythiocarbonyl)tetrasulfide,23 3-methyl-1,2,4-dithiazolin-5-one (MEDITH)24
and 3-amino-1,2,4-dithiazole-5-thione (ADTT, xanthanehydride).25
Although PADS (2) has an optimal combination ofproperties and is often used as the sulfurising reagent in the
pharmaceutical industry,26,27 there have been very fewmechanistic studies of the sulfurisation reactions of phos-phorus(III) analogues using PADS. In particular, PADS must be‘aged’ in a basic acetonitrile solution to obtain optimal sulfuri-sation activity28 and the reasons for this are not understood.Herein we report the results of our kinetic and mechanisticstudies which identify the actual sulfurising agent and suggestan unexpected pathway for its generation. Elsewhere wedescribe the kinetics and mechanism of the sulfurisation stepof substituted triphenyl phosphites and trialkyl phosphitesusing PADS.29
Results and discussion
It is known that a freshly made solution of PADS (2) is not anoptimal sulfurising agent.26 Solutions of PADS usually consistof 50% v/v 3-picoline in acetonitrile or other bases such as pyr-idine or collidine but their efficiency improves greatly upon‘ageing’ for about 2 days.26 PADS degrades completely over thisperiod of time as shown by HPLC, 1H NMR and MS and thecolour of the solution changes dramatically from pale yellowthrough green/blue to brown/black over about 5 days. Thepseudo first-order rate constants for the sulfurisation of0.05 M triphenyl phosphite in acetonitrile by 0.5 M PADS with1.0 M 3-picoline increase with the length of ‘ageing’ (Fig. 1),such that PADS ‘aged’ for 48 h is 13-fold more active than afreshly prepared solution of PADS. It is apparent therefore thatthe degradation product(s) of PADS are more efficient sulfuris-ing agents, but their identity is not known.
The exponential rate of degradation of 3.3 M PADS (2) inacetonitrile 25 °C was followed by HPLC and the associatedfirst-order rate constants depend on the concentration of3-picoline (Fig. 2). This increase in rate is unlikely to be a con-sequence of a change in the dielectric constant of the solutionas, for example, PADS is stable in a solution of acetonitrile/
Fig. 1 The pseudo first-order rate constants for the sulfurisation of tri-phenyl phosphite (0.05 M) to (PhO)3PvS by (0.5 M) PADS (2) as a func-tion of the time that PADS has been ‘aged’ in acetonitrile with (1.0 M)3-picoline at 25 °C.
Paper Organic & Biomolecular Chemistry
8302 | Org. Biomol. Chem., 2016, 14, 8301–8308 This journal is © The Royal Society of Chemistry 2016

dimethylsulfoxide 90/10% v/v over 24 h. Furthermore, the rateof degradation of PADS in acetonitrile increases with thebasicity of the pyridine base. The slope of the dependence ofthe observed pseudo first-order rate constants for thedecomposition of PADS (2) (Fig. 2) gives the associated second-order rate constant. These rate constants for the ‘ageing’ ofPADS by substituted pyridines (Table 1) generate a Brønstedβ-value of 0.37 based on the estimated pKa in acetonitrile.30
This is compatible with the pyridine acting as either a base oras a nucleophile with little charge development on the basicnitrogen. The rate of degradation of PADS in acetonitrile isfaster with a more basic amine, e.g. with 1.0 M triethylamine itis complete within 5 min.
The products of the ‘ageing’ of PADS are a mixture of diacyl-polysulfides and acylpolysulfide anions. HPLC-mass spec-troscopy data performed on aged PADS solutions showed thepresence of m/z values corresponding to a variety of diacylpoly-sulfides, in particular the tri-sulfide (3) at m/z = 357(Na+ adduct) and the penta-sulfide (4) at m/z = 437 (K+ adduct).After several days elemental sulfur crystallised from the solu-tion. The diphenylacetyl polysulfides are presumably formedfrom nucleophilic attack of the disulfide anion on PADS atsulfur. It is known that disulfide anions are better nucleo-
philes than the corresponding thiolate.31 The formation ofphenylacetyl disulfide anion (5) could result from eithernucleophilic attack on PADS or a general-base catalysed eli-mination reaction of PADS by the picoline base. It is likely thatthere is an equilibrium set up between the diacylpolysulfidesand acylpolysulfide anions and sulfur.32
Nucleophilic attack on PADS (2) by picoline would generate anacyl-picolinium ion intermediate (6) but no direct experi-mental evidence for this could be found nor could its presencebe inferred from trapping experiments with a variety of nucleo-philes. However, the general-base catalysed formation of thedisulfide anion by an E1cB – type mechanism (Scheme 1) isindicated by both D-exchange and trapping of the keteneintermediate.
The rate of H/D exchange was measured by 1H NMR using asolution of 0.17 M PADS (2) in d3-acetonitrile containingvarious concentrations of 3-picoline and 0.6 M D2O at 25 °C.The CH2 singlet at δ 4.15 ppm disappeared with a first-orderdecay generating a triplet for CHD at δ 4.13 ppm whichreached a maximum intensity followed by its disappearance togive CD2. The pseudo first-order rate constants for D-exchangeshowed a first-order dependence on the concentration of3-picoline (Fig. 3) which gives a second-order rate constantkpic = 5.37 × 10⁻³ M−1 s−1.
The mechanism of D-exchange presumably occurs throughthe formation of the intermediate carbanion. The relativelylow dielectric constant of the solvent may mean that theionization of this carbon acid may give rise to ion-pairs in
Fig. 2 The dependence of the pseudo first-order rate constants for thedecomposition of PADS (2) in acetonitrile on the concentration of3-picoline at 25 °C.
Table 1 The second-order rate constants for the decomposition ofPADS (2) in acetonitrile (ACN) as a function of the basicity of substitutedpyridines in ACN at 25 °C
Pyridine substituent pKa (ACN) conjugate acid kcat (M−1 s−1)
4-MeO 14.73 7.76 × 10⁻⁶
3-Me 13.70 3.34 × 10⁻⁶
H 12.60 1.63 × 10⁻⁶
3-MeO 12.45 3.79 × 10⁻⁷
4-CN 8.50 3.76 × 10⁻⁸
2,6-DiMe 14.72 4.44 × 10⁻⁶ Scheme 1
Organic & Biomolecular Chemistry Paper
This journal is © The Royal Society of Chemistry 2016 Org. Biomol. Chem., 2016, 14, 8301–8308 | 8303

equilibrium with the dissociated species (Scheme 2), wherethe product KiKd corresponds to the normal ionization con-stant Ka. However, it is unlikely that exchange can occur fromthe ion-pair and so if isotopic exchange occurs with the disso-ciated carbanion, then the rate of protonation of the carbanionk−2 can be assumed to be diffusion-controlled,33 which, basedon a viscosity of 0.35 cP for acetonitrile can be assumed to be∼1010 M−1 s−1. The pKa value for PADS in acetonitrile/water(90/10% v/v) can then be calculated to be 26.0 by using thisestimated diffusion-controlled rate constant, the measuredrate of D-exchange and the pKa of 13.7 for 3-picoline in aceto-nitrile.34 There are no pKa data for thioesters in acetonitrilebut that for ethyl thioacetate in water is 21 (ref. 35) and, basedon substituent and solvent effects,30 that for ethyl thiophenyl-acetate PhCH2COSEt in acetonitrile is ∼31, so the estimatedvalue of 26.0 for PADS is reasonable given the additionalelectron-withdrawing SSCOCH2Ph residue.
The rate of degradation of PADS (2) is ca. 500-fold slowerthan the rate of D-exchange under the same conditions, indi-cating that carbanion formation is relevant to the formation ofthe degradation products of PADS. Indeed, removing thedissociable protons in PADS by α,α-dimethylation prevents thedegradation of the tetramethyl derivative (7) which remainsunchanged after 1 week in acetonitrile with 5 equivalents ofpicoline at 25 °C. Similarly, bis-benzoyl disulfide is stable inacetonitrile with 5 equivalents of picoline at 25 °C for 1 week,
confirming the elimination mechanism for the degradation ofPADS (2).
The proposed mechanism for the degradation of PADS(Scheme 1) involves the generation of the ketene intermediate.The reaction of o-allyl PADS (8) in 50% v/v acetonitrile/3-pico-line yields the bicyclic ketone (9) identified by MS and1H NMR, consistent with trapping the intermediate ketene bya [2 + 2] cycloaddition. With PADS itself, the ketene forms the3-hydroxycyclobutenone dimer, (10) and the pyran-4-onetrimer (11) as observed with the base-catalysed reaction ofphenylacetyl chloride.36
The relative effect of substituents in the aromatic ring of PADS(2) on the rate constants for H/D-exchange and the degradationprocess are shown in Table 2.
All of the above observations suggest that a polar mechan-ism is taking place, which is also supported by the rate ofdegradation of PADS (2) being unaffected by light or dark orthe addition of the radical scavenger 2,6-di-tert-butyl-4-methyl-phenol (BHT).
In summary, the degradation of PADS (2) in acetonitrile cat-alysed by pyridine bases involves reversible carbanion for-mation, which expels acyl disulfide anion to generate a ketene
Fig. 3 The dependence of the pseudo observed first-order rate con-stants for the H/D – exchange of PADS on the concentration of 3-pico-line in acetonitrile at 25 °C.
Scheme 2
Table 2 The dependence of the second-order rate constants for H/D-exchange and for the degradation of substituted PADS (2) in acetonitrileat 25 °C
PADS substituent σ kex (M−1 s−1)
4-MeO −0.27 1.38 × 10⁻³
H 0 5.16 × 10⁻³
4-Cl 0.23 2.20 × 10⁻²
4-CN 0.66 1.09 × 10⁻¹
Paper Organic & Biomolecular Chemistry
8304 | Org. Biomol. Chem., 2016, 14, 8301–8308 This journal is © The Royal Society of Chemistry 2016

intermediate. The disulfide anion then attacks unreactedPADS at sulfur to give polysulfides (Scheme 3). Other possi-bilities are feasible, including polysulfide anion attack onPADS (2) and diacylated polysulfides. It is interesting that therate of degradation is only first order in PADS (2) indicatingthat the rate-limiting step is k2 formation of the disulfideanion from the carbanion, rather than its subsequent reactionwith a second mole of PADS.
Conclusion
The activation of PADS by its ‘ageing’ for 48 h in acetonitrilewith 3-picoline involves the generation of polysulfides whichare the actual nucleotide–phosphite sulfurising agents. Theinitial base-catalysed degradation of PADS occurs by anE1cB-type elimination to generate a ketene and acyldisulfideanion. Carbanion formation from PADS is reversible, demon-strated by H/D exchange, the mechanism of which occurs bybase catalysis and is greatly increased by electron-withdrawingsubstituents in the aromatic ring of PADS. The ketene can betrapped intramolecularly by an o-allyl group. The disulfideanion generated subsequently attacks unreacted PADS onsulfur to give polysulfides, the active sulfurising agent. Therate of degradation of PADS is decreased by less basic substi-tuted pyridines and is only first order in PADS indicating thatthe rate-limiting step is formation of the disulfide anion fromthe carbanion.
Experimental
NMR experiments were performed using a 400 MHz BrukerAvance DP X400 NMR spectrometer. HPLC traces wereacquired using a Shimadzu SIL 50AH instrument with a Luna5μ C18 4.67 × 250 mm column. The gradient used for kineticmeasurements was 30–95% acetonitrile in water over10 minutes followed by isocratic elution for a further10 minutes.
H/D exchange of PADS
To a solution of phenylacetyl disulfide in deuterated aceto-nitrile (0.2 M, 400 µl) and D2O (50 µl) was added 3-picoline(15.5 µl, 16.2 mg, 0.17 mmol). The 1H NMR of this mixturewas run every 2 minutes until exchange was complete.
General degradation kinetics of PADS
A solution of PADS (1000 ppm, 3.3 mM) in HPLC-grade aceto-nitrile containing the appropriate concentration of 3-picolinewas divided between 2 HPLC vials and chromatograms weretaken every 30 minutes for 48 hours.
General sulfurisation kinetics with ‘aged’ PADS
A solution of PADS (1 M) 50/50 v/v acetonitrile/3-picoline wasleft to age for 48 hours. At T = n h a 1 ml sample of this wasremoved and quenched with dilute hydrochloric acid (10 ml,2 M) to remove the picoline as the protonated pyridinium ion.This was then washed with DCM (2 × 10 ml) the combinedorganic layers dried and the solvent removed under vacuum.The resulting oil was then made up to 1 ml using deuteratedacetonitrile. To an NMR tube containing triphenyl phosphitein deuterated acetonitrile (0.1 M, 200 μL) and 3-picoline indeuterated acetonitrile (2 M, 200 μL) was added ‘aged’ PADSsolution (200 μL, 1 M) and 31P NMR spectra recorded every90 seconds.
Trapping the ketene intermediate
A mixture of 2,2′-allyl-2,2′-phenylacetyl disulfide (330 mg,0.852 mmol) and 3-picoline (165.6 µl, 1.7 mmol) in acetonitrile(10 ml) was refluxed for 2 h. The reaction was followed byHPLC and was complete after 2 h. The mass spec and NMRanalysis showed evidence of the product 7,7a-dihydro-1H-cyclo-buta[a]inden-2(2aH)-one as described below.
Synthesis
Methyl 2′-iodo-2-phenylacetate. 2′-Iodo-phenylacetic acid(5.01 g, 19.1 mmol) and H2SO4 (98%, 1.25 ml) were dissolved
Scheme 3
Organic & Biomolecular Chemistry Paper
This journal is © The Royal Society of Chemistry 2016 Org. Biomol. Chem., 2016, 14, 8301–8308 | 8305

in methanol (7.5 ml). The reaction mixture was stirred for2.5 h at 65 °C, then diluted with 250 ml dichloromethane(DCM), extracted with water (2 × 100 ml) and brine (50 ml).The organic solution was dried over MgSO4, and gravityfiltered. DCM was removed under vacuum to give a pale yellowoil (4.88 g, 92.6% yield). HPLC retention time 5.397 min;1H NMR (CDCl3, 400 MHz) δ 3.69 (s, 3H, CH3), 3.79 (s, 2H,CH2), 6.92–6.96 (m, 1H, ArH), 7.22–7.32 (m, 2H, ArH), 7.83(d, 1H, J 7.91 Hz, ArH) ppm; 13C NMR (CDCl3, 100 MHz)δ 46.12 (CH3), 52.22 (CH2), 101.07 (CI), 128.48 (CH),128.94 (CH), 130.68 (CH), 137.72 (Cq), 139.54 (CH),170.95 (CO) ppm; IR (film) 1732.81 cm−1.
Methyl 2′-allyl-2-phenylacetate.37 Methyl 2′-iodo 2-phenyl-acetate (3.0 g, 10.9 mmol), CsF (6.6 g, 43.6 mmol), and Pd(PPh3)4(0.63 g, 0.55 mmol) were dissolved in THF (250 ml), stirred for30 min at room temperature. A solution of allylboronic acidpinacol ester (3.3 ml, 21.8 mmol) in THF (50 mL) was addedand then heated under reflux for 24 h. The reaction mixturewas diluted with petroleum ether (bpt. 60–80 °C, 300 mL),extracted with water (2 × 200 ml) and the combined aqueouslayers washed with petroleum ether (bpt 60–80 °C, 100 ml).The combined organic layers were washed with water(100 mL), brine (100 mL), dried over MgSO4. The solvent wasremoved under vacuum to give an orange oil product (2.5 g)which was purified using a Biotage SP4 chromatographysystem fitted with a Biotage Snap 10 column eluting with a gra-dient of 0–25% ethyl acetate in hexane over 15 columnvolumes to give the product ester as a yellow oil (1.6 g, 77.2%yield). HPLC retention time 5.630 min; 1H NMR (CDCl3,400 MHz) δ 3.39 (dt, 2H, J 6.29 Hz, CH2), 3.61 (s, 2H, CH2),3.65 (s, 3H, CH3), 4.94–5.06 (m, 2H, CH2), 5.87–5.97 (m, 1H,CH), 7.14–7.23 (m, 4H, ArH) ppm; 13C NMR (CDCl3, 100 MHz)δ 37.35 (CH2), 38.45 (CH2), 51.94 (CH3), 115.96 (CH2), 126.65(CH), 127.55 (CH), 129.91 (CH), 130.65 (CH), 132.66 (Cq),136.57 (CH2), 138.35 (Cq), 171.95 (CO) ppm; IR (film)1734.52 cm−1.
2′-Allyl 2-phenylacetic acid. To methyl-2′-allyl 2-phenylacetate(1.7 g, 8.9 mmol) in THF (20 ml) was added an aqueouslithium hydroxide solution (0.4 M, 20 ml) and the solutionstirred at room temperature for 3 h after which the mixturewas diluted with water (40 ml) and extracted with DCM(2 × 20 ml). The pH of the aqueous layer was reduced to pH 1with HCl, extracted with DCM (2 × 20 ml), dried over MgSO4
and the solvent removed under vacuum giving the brown oilproduct (1.7 g, 9.7 mmol, 82.9% yield). HPLC retention time4.634 min; 1H NMR (CDCl3, 400 MHz) δ 3.38 (dt, 2H, J 6.37 Hz,CH2), 3.65 (s, 2H, CH2), 4.94–5.06 (m, 2H, CH2), 5.86–5.96 (m,1H, CH), 7.14–7.23 (m, 4H, ArH), 10.76 (broad, s, 1H, OH)ppm; 13C NMR (CDCl3, 100 MHz) δ 37.5 (CH2), 38.45 (CH2),116.22 (CH2), 126.79 (CH), 127.96 (CH), 130.08 (CH), 130.88(CH), 132.05 (Cq), 136.52 (CH), 138.55 (Cq), 178.41 (CO) ppm;IR (film) 1702.49 cm−1.
2′,2′-Diallyl 2,2-phenylacetyl disulfide (8).38 Sodium hydro-sulfide (798 mg, 14.25 mmol) was dissolved in ethanol (5 ml)and chilled over ice. The flask was fitted with an exhaust lineallowing any gasses generated to be scrubbed by sodium hypo-
chlorite in a well-ventilated fume hood. In a separate flask, to2′-allyl 2-phenylacetic acid (1.0 g, 5.7 mmol) dissolved in DCM(10 ml) was added Ghosez reagent (1.04 g, 1.03 ml, 8.5 mmol)then stirred at room temperature for 30 min and the solventremoved under vacuum to yield an orange oil. This oil wasadded to the ethanolic sodium hydrosulfide solution whichinstantly turned yellow and the precipitate of sodium chlorideremoved under vacuum filtration and washed with ice coldethanol (1.5 ml). To the solution, stirred over ice, iodine wasslowly added until the colour of the suspension changed fromwhite to pale brown (approximately 1 g, 7.8 mmol). The result-ing mixture was diluted with DCM (10 ml), washed twice withsaturated sodium thiosulfate solution (2 × 15 ml) and theorganic layer concentrated under vacuum to yield the brownoil product which was purified using a Biotage SP4 chromato-graphy system fitted with a Biotage Snap 10 column elutingwith 25% ethyl acetate in hexane (Rf = 0.41) to give the productas a clear oil (384 mg, 1 mmol, 14.1% yield). HPLC retentiontime 7.6 min; 1H NMR (CDCl3, 400 MHz) δ 3.41 (d, 4H, J =6.3 Hz, CH2), 4.00 (s, 4H, CH2), 4.96–5.60 (m, 4H, CH2),5.88–5.98 (m, 2H, CH), 7.17–7.30 (m, 8H, ArH) ppm; 13C NMR(CDCl3, 100 MHz) δ 37.51 (CH2), 46.68 (CH2), 116.63 (CH2),126.95 (CH), 128.58 (CH), 130.22 (CH), 130.88 (Cq), 131.53(CH), 136.12 (CH), 139.07 (Cq), 191.81 (CO) ppm.
7,7a-Dihydro-1H-cyclobuta[a]inden-2(2aH)-one (9). A mixtureof 2′-allyl 2-phenylacetylchloride (100 mg, 0.514 mmol) and1-chloro-N,N,2-trimethyl-1-propenylamine (74.7 µl, 0.56 mmol)in DCM (10 ml) was stirred for 30 min at room temperature,triethylamine (78 µl, 0.56 mmol) in DCM (4 ml) was addedand refluxed for 2 h. The reaction mixture was cooled andextracted with 2 M hydrochloric acid (20 ml) to remove the3-picoline. The crude bright orange oil product mixture waspurified using a Gilson prep. HPLC system equipped with aphenomenex luna C18, 5µ 250 × 20 mm column. The mobilephase consisted of a gradient of 50–100% acetonitrile (0.05%TFA) in water (0.05% TFA) over 15 minutes then isocraticelution at 50% acetonitrile (0.05% TFA) in water (0.05% TFA)for a further 3 minutes. The product eluted at 7.5 min. All frac-tions were combined and the solvent removed under vacuumto give the product as a white, crystalline solid (24 mg, 41.8%yield). HPLC retention time 4.775 min; 1H NMR (d3ACN,400 MHz) δ 2 2.75–2.87 (m, 1H, CH2), 3.05 (d, 1H, J 16.73,CH2), 3.11–3.18 (m, 1H, CH), 3.30–3.42 (m, 1H, CH2),3.38–3.45 (m, 1H, CH2), 4.71 (broad, s, 1H), 7.23–7.36 (m, 4H,ArH); 13C NMR (ACN-d3, 100 MHz) δ 26.18 (CH), 38.82 (CH2),52.32 (CH2), 71.81 (CH), 124.45 (CH), 125.50 (CH), 126.82(CH), 127.52 (CH), 137.6 (Cq), 143.38 (Cq), 206.13 (CO),IR (film) 1771.39 cm−1.
2,2,2′,2′-Tetramethyl 2,2′-phenylacetyl disulfide (7). Sodiumhydrosulfide (4.2 g, 75 mmol) was dissolved in ethanol (30 ml)and chilled over ice. The flask was fitted with an exhaustline allowing any gasses generated to be scrubbed by sodiumhypochlorite in a well-ventilated fume hood. In a separateflask, to 2-phenylisobutyric acid (5 g, 30 mmol) dissolved inDCM (20 ml) was added Ghosez reagent (6.16 g, 5.6 ml,45 mmol) then stirred at room temperature for 30 min and
Paper Organic & Biomolecular Chemistry
8306 | Org. Biomol. Chem., 2016, 14, 8301–8308 This journal is © The Royal Society of Chemistry 2016

the solvent removed under vacuum to yield an orange oil.This oil was added to the ethanolic sodium hydrosulfidesolution which instantly turned yellow and the precipitateof sodium chloride removed under vacuum filtrationand washed with ice cold ethanol (1.5 ml). To thesolution, stirred over ice, iodine (2 g, 15.6 mmol) was slowlyadded. The resulting precipitate was collected by vacuumfiltration and washed with ice-cold ethanol (5 ml) andwater (10 ml) to give a waxy yellow solid (2.2 g, 5.9 mmol,39.3% yield). HPLC retention time 7.6 min; 1H NMR(CDCl3, 400 MHz) δ 1.68 (s, 12H), 7.34 (m, 10H) ppm; 13C NMR(CDCl3, 100 MHz) δ 26.82, 54.21, 127.27, 127.86, 128.61,142.14, 199.39 ppm. HRMS (m/z): [M + NH4]
+ for C20H22O2S2,calculated 390.0782, measured 390.0788; IR: 1707.3 cm−1
(film).2,2′-(4-Chlorophenyl)acetyl disulfide. As above using sodium
hydrosulfide (1.6 g, 29.25 mmol) in ethanol; (15 ml) 4-chloro-phenylacetic acid (2 g, 11.7 mmol) in DCM (20 ml); Ghosezreagent (1.72 g, 1.57 ml, 12.9 mmol); iodine (0.5 g, 3.9 mmol)to give product (1.5 g, 4.1 mmol, 70.1% yield). HPLC retentiontime 7.3 min; 1H NMR (CDCl3, 400 MHz) δ 3.94 (s, 4H, CH2),7.22 and 7.32 (2d, 8H, J 8.53 Hz, ArH) ppm; 13C NMR (CDCl3,100 MHz) δ 48.37 (CH2), 129.12 (CH), 130.48 (Cq), 131.06 (CH),134.12 (Cq), 190.83 (CO) ppm. HRMS (m/z): [M + NH4]
+ forC16H12Cl2O2S2, calculated 387.9994, measured 388.0000;IR: 1720.2 cm−1 (film).
2,2′-(4-Cyanophenyl)acetyl disulfide. As above using sodiumhydrosulfide (2.4 g, 43 mmol) in ethanol (20 ml); 4-cyano-phenylacetic acid (2.753 g, 17.1 mmol) in DCM (20 ml);Ghosez reagent (3.432 g, 3.120 ml, 25.7 mmol); iodine (0.5 g,3.9 mmol) to give the product as a oragne/yellow solid (1.6 g,4.6 mmol, 53.8% yield). HPLC retention time 6.0 min;1H NMR (CDCl3, 400 MHz) δ 4.08 (s, 4H), 7.41 and 7.64 (2d,8H, J 8.23 Hz, ArH) ppm; 13C NMR (CDCl3, 100 MHz) δ 48.82(CH2), 112.06 (CN), 118.41 (Cq), 130.47 (CH), 132.65 (CH),137.28 (Cq), 189.76 (CO) ppm. HRMS (m/z): [M + NH4]
+ forC18H12N2O2S2, calculated 352.0340, measured 352.0352; IR:1715.6 cm−1 (film).
2,2′-(4-Methoxyphenyl)acetyl disulfide. As above usingsodium hydrosulfide (4.26 g, 75.3 mmol) in ethanol (20 ml);4-methoxyphenylacetic acid (5 g, 30.1 mmol) in DCM (20 ml);Ghosez reagent (8.03 g, 7.96 ml, 60.2 mmol); iodine (1 g,7.8 mmol) to give product (1.19 g, 3.28 mmol, 10.9% yield).1H NMR (CDCl3, 400 MHz) δ 3.79 (s, 6H, CH3), 3.92 (s, 4H,CH2), 6.89 and 7.16 (2d, 8H, J 8.15 Hz, ArH) ppm; 13C NMR(CDCl3, 100 MHz) δ 48.6 (CH3), 55.2 (CH2), 114.7 (CH), 124.5(Cq), 131.1 (CH), 159.5 (Cq), 192.5 (CO) ppm; HRMS (m/z):[M + NH4]
+ for C18H18O4S2, calculated 362.0647, measured362.0634.
Bis-benzoyl disulfide.39 To sodium sulfide (1.84 g,23.6 mmol) in water (12 ml) and heated to 50 °C was addedtetra-N-butylammonium bromide (380 mg, 1.18 mmol) thenstirred for 30 minutes. In a separate flask, (fitted with anexhaust line allowing any gasses generated to be scrubbed bysodium hypochlorite in a well-ventilated fume hood) benzoylchloride (2 ml, 1.65 g, 11.8 mmol) in toluene (12 ml). This was
chilled in an ice bath. After 30 minutes the sodium sulfidesolution was cooled to room temperature and slowly added tothe rapidly stirring, chilled benzoyl chloride solution under anitrogen atmosphere creating a biphasic reaction mixture.This was stirred for 24 hours at room temperature. Theorganic and aqueous layers were separated, the aqueous layerwashed with 2 × 5 ml portions of toluene and the organiclayers combined. The toluene was then removed undervacuum giving the product as white crystals (738 mg, 45.7%yield) from which a single crystal X-ray diffraction pattern wasresolved. The aqueous layer contains residual Na2S which willgenerate H2S if exposed to acid and was disposed of carefully.1H NMR (CDCl3, 400 MHz) δ 7.43 (t, 4H, ArH), 7.57 (t, 2H,ArH), 7.89 (d, 4H, ArH) ppm; 13C NMR (CDCl3, 100 MHz)δ 127.91 (CH), 128.79 (CH), 134.02 (CH), 136.61 (Cq), 190.37(CO) ppm.
Acknowledgements
JS is grateful to GSK for the award of an BBSRC CASEstudentship.
Notes and references
1 P. C. Zamecnik and M. L. Stephenson, Proc. Natl. Acad.Sci. U. S. A., 1978, 75, 285.
2 R. S. Geary, D. Norris, R. Yu and C. F. Bennett, Adv. DrugDelivery Rev., 2015, 87, 46; S. T. Crooke, T. Vickers,W. F. Lima and H. Wu, Mechanisms of antisense drugaction, an introduction, in Antisense Drug Technology:Principles, Strategies, and Applications, ed. S. T. Crooke, CRCPress, Boca Raton, 2nd edn, 2007, pp. 3–46; C. F. Bennettand E. E. Swayze, Annu. Rev. Pharmacol. Toxicol., 2010, 50,259; H. Wu, W. F. Lima, H. Zhang, A. Fan, H. Sun andS. T. Crooke, J. Biol. Chem., 2004, 279, 181.
3 R. M. Orr, Curr. Opin. Mol. Ther., 2001, 3, 288; B. Roehr,J. Int. Assoc. Physicians AIDS Care, 1998, 4, 14.
4 S. Agrawal and E. R. Kandimalla, Mol. Med. Today, 2000, 6,72.
5 D. A. Bell, A. J. Hooper and J. R. Burnett, Expert Opin. Inves.Drugs, 2011, 20, 265.
6 A. Goyenvalle, J. Wright, A. Babbs, V. Wilkins, L. Garcia andK. E. Davies, Mol. Ther., 2012, 20, 1212.
7 D. J. French, D. G. McDowell, P. Debenham, N. Gale andT. Brown, Methods Mol. Biol., 2008, 429, 17.
8 P. S. Eder, R. J. DeVine, J. M. Dagle and J. A. Walder,Antisense Res. Dev., 1991, 1, 141–151.
9 B. Nawrot and K. Sipa, Curr. Top. Med. Chem., 2006, 6, 913;E. L. Chernolovskaya and M. A. Zenkova, Curr. Opin. Mol.Ther., 2010, 12, 158; S. P. Walton, M. Wu, J. A. Gredell andC. Chan, FEBS J., 2010, 277, 4806; M. R. Laresa, J. J. Rossiaand D. L. Ouellet, Trends Biotechnol., 2010, 28, 570;P. Guga, Curr. Top. Med. Chem., 2007, 7, 695.
Organic & Biomolecular Chemistry Paper
This journal is © The Royal Society of Chemistry 2016 Org. Biomol. Chem., 2016, 14, 8301–8308 | 8307

10 F. Eckstein, Antisense Nucleic Acids Drug Dev., 2000,10, 117.
11 J. H. P. Chan, S. Lim and W. S. F. Wong, Clin. Exp.Pharmacol. Physiol., 2006, 33, 533; T. Yamamoto,M. Nakatani, K. Narukawa and S. Obika, Future Med.Chem., 2011, 3, 339; N. M. Bell and J. Micklefield,ChemBioChem, 2009, 10, 2691.
12 L. Wang, S. Chen, T. Xu, K. Taghizadeh, J. S. Wishnok,X. Zhou, D. You, Z. Deng and P. C. Dedon, Nat. Chem. Biol.,2007, 3, 709.
13 P. Guga and M. Koziołkiewiczb, Chem. Biodiversity, 2011, 8,1642.
14 S. T. Crooke, Methods Enzymol., 2000, 313, 3; C. A. Steinand Y. C. Cheng, Science, 1993, 261, 1004.
15 P. C. J. Kamer, H. C. P. F. Roelen, H. van den Elst, G. A. vander Marel and J. H. van Boom, Tetrahedron Lett., 1989, 30,6757–6760.
16 R. P. Iyer, L. R. Phillips, W. Egan, J. B. Regan andS. L. Beaucage, J. Org. Chem., 1990, 55, 4693–4699.
17 H. Vu and B. L. Hirschbein, Tetrahedron Lett., 1991, 32,3005–3008.
18 M. V. Rao, C. B. Reese and Z. Zhao, Tetrahedron Lett., 1992,33, 4839–4842.
19 W. J. Stec, B. Uznanski and A. Wilk, Tetrahedron Lett., 1993,33, 5317–5320.
20 M. V. Rao and K. Macfarlane, Tetrahedron Lett., 1994, 35,6741–6744.
21 V. A. Efimov, A. L. Kalinkina, O. G. Chakhmakhcheva,T. S. Hill and K. Jayaraman, Nucleic Acids Res., 1995, 23,4029–4033.
22 Q. Xu, K. Musier-Forsyth, R. P. Hammer and G. Barany,Nucleic Acids Res., 1996, 24, 1602–1607.
23 Z. Zhang, A. Nichols, M. Alsbeti, J. X. Tang and J.-Y. Tang,Tetrahedron Lett., 1998, 39, 2467–2470.
24 Z. Zhang, A. Nichols, J. X. Tang, Y. Han and J.-Y. Tang,Tetrahedron Lett., 1999, 40, 2095–2098.
25 J.-Y. Tang, Z. Han, J. X. Tang and Z. Zhang, Org. Process Res.Dev., 2000, 4, 194–198.
26 A. H. Krotz, D. Gorman, P. Mataruse, C. Foster,J. D. Godbout, C. C. Coffin and A. N. Scozzari, Org. ProcessRes. Dev., 2004, 8, 852–858.
27 Z. S. Cheruvallath, R. L. Carty, M. N. Moore, D. C. Capaldi,A. H. Krotz, P. D. Wheeler, B. J. Turney, S. R. Craig,H. J. Gaus, A. N. Scozzari, D. L. Cole and V. T. Ravikumar,Org. Process Res. Dev., 2000, 4, 199–204.
28 A. H. Krotz, D. Gorman, P. Mataruse, C. Foster,J. D. Godbout, C. C. Coffin and A. N. Scozzari, Org. ProcessRes. Dev., 2004, 8, 852–858.
29 J. Scotson, B. I. Andrews, A. P. Laws and M. I. Page, inpreparation.
30 B. G. Cox, ‘Acids and Bases, solvent effects on acid–basestrength’, Oxford UP, Oxford, 2013.
31 M. Benaïchouche, G. Bosser, J. Paris and V. Plichon,J. Chem. Soc., Perkin Trans. 2, 1990, 1421.
32 J. Robert, M. Anouti and J. Paris, J. Chem. Soc., Perkin Trans.2, 1997, 473–478.
33 P. Ji, N. T. Powles, J. H. Atherton and M. I. Page, Org. Lett.,2011, 13, 6118–6121.
34 I. Kaljurand, A. Kutt, L. Soovali, V. Maemets, I. Leito andI. A. Koppel, J. Org. Chem., 2005, 70, 1019.
35 T. L. Amyes and J. P. Richard, J. Am. Chem. Soc., 1992, 114,10297.
36 D. G. Farnum, J. R. Johnson, R. E. Hess, T. B. Marshall andB. Webster, J. Am. Chem. Soc., 1965, 87, 5191–5197.
37 S. Kotha, M. Behera and V. R. Shah, Synlett, 2005, 1877–1880.
38 C. D. Dittmer, Encyclopedia of Reagents for OrganicSynthesis, John Wiley & Sons, Chichester, 2001.
39 Z. S. Cheruvallath, R. L. Carty, M. N. Moore, D. C. Capaldi,A. H. Krotz, P. D. Wheeler, B. J. Turney, S. R. Craig,H. J. Gaus, A. N. Scozzari, D. L. Cole and V. T. Ravikumar,Org. Process Res. Dev., 2000, 4, 199–204.
Paper Organic & Biomolecular Chemistry
8308 | Org. Biomol. Chem., 2016, 14, 8301–8308 This journal is © The Royal Society of Chemistry 2016

Organic &Biomolecular Chemistry
PAPER
Cite this: Org. Biomol. Chem., 2016,14, 10840
Received 27th September 2016,Accepted 26th October 2016
DOI: 10.1039/c6ob02108e
www.rsc.org/obc
Phosphorothioate anti-sense oligonucleotides:the kinetics and mechanism of thesulfurisation of phosphites by phenylacetyldisulfide (PADS)†
James L. Scotson,a Benjamin I. Andrews,b Andrew P. Lawsa and Michael I. Page*a
In the pharmaceutical industry the sulfurisation of nucleotide-phosphites to produce more biologically
stable thiophosphates is often achieved using ‘aged’ solutions of phenylacetyl disulfide (PADS) which
consist of a mixture of polysulfides that are more efficient sulfur transfer reagents. However, both ‘fresh’
and ‘aged’ solutions of PADS are capable of the sulfurisation of phosphites. The rates of both processes in
acetonitrile are first order in sulfurising agent, phosphite and a pyridine base, although with ‘aged’ PADS
the rate becomes independent of base at high concentrations. The Brönsted β values for sulfurisation
using ‘fresh’ and ‘aged’ PADS with substituted pyridines are 0.43 and 0.26, respectively. With ‘fresh’ PADS
the Brönsted βnuc = 0.51 for substituted trialkyl phosphites is consistent with a mechanism involving
nucleophilic attack of the phosphite on the PADS disulfide bond to reversibly generate a phosphonium
intermediate, the rate-limiting breakdown of which occurs by a base catalysed elimination process,
confirmed by replacing the ionisable hydrogens in PADS with methyl groups. The comparable polysulfide
phosphonium ion intermediate seen with ‘aged’ PADS presents a more facile pathway for product
formation involving S–S bond fission as opposed to C–S bond fission.
Introduction
Anti-sense oligonucleotides (ASOs)1 are usually single-strandeddeoxy-ribonucleotides of 15–35 bases which bind to a specificsection of mRNA to form a dimer that may then inhibit trans-lation and therefore prevent synthesis of an unwanted targetprotein. ASOs are promising therapeutics2 but the incorpor-ation of a native phosphodiester link means they are rapidlyhydrolysed by intracellular endonucleases and exonucleases.3
To overcome this problem ASOs have been modified todecrease their susceptibility to nuclease catalysed hydrolysisand improve their pharmacokinetics.4 One of the mostcommon examples of these changes is the introduction of aphosphorothioate backbone (1)5 to give derivatives which arepoor substrates for enzyme catalysed hydrolysis and yet do notdisrupt binding between the nucleobases.6 The introduction
of the relatively hydrophobic sulfur also increases cell uptakecompared with the native PvO phosphodiester whilst stillmaintaining good water solubility as a polarisable anion.Although the replacement of one of the phosphate non-bridg-ing oxygens by sulfur makes the phosphorus chiral, it is onlythe (S)-P phosphorothioate diastereomer that is nucleaseresistant.7
The successful large scale synthesis of oligonucleotideswith phosphorothioate links requires the sulfurisation step tohave a near quantitative yield, to be rapid and give a maximalPvS to PvO ratio. Sulfurisation of the protected nucleotide-phosphite (2), attached to a solid support, is often carried outwith the sulfurising agent present in an organic solvent.Although there are a number of reagents available8,9 phenyl-acetyl disulfide (PADS) (3) is commonly used in the pharma-ceutical industry.10–12 This reagent is unusual in that it is best‘aged’ in a basic acetonitrile solution to obtain optimal sulfuri-sation activity,13 often using 3-picoline as the base. We haverecently shown that this is due to the formation of diacyl poly-sulfides (4) by an unusual elimination E1cB mechanism.14
Although both ‘fresh’ and ‘aged’ PADS convert phosphiteesters to the corresponding thiophosphate, ‘ageing’ improvesthe rate and efficiency of sulfurisation. Herein we address the
†Electronic supplementary information (ESI) available: Detailed kinetic data.See DOI: 10.1039/c6ob02108e
aDepartment of Chemistry, University of Huddersfield, Queensgate,
Huddersfield HD1 3DH, UK. E-mail: [email protected] Medicines Research Centre, Gunnels Wood Road, Stevenage, Hertfordshire,
SG1 2NY, UK
10840 | Org. Biomol. Chem., 2016, 14, 10840–10847 This journal is © The Royal Society of Chemistry 2016

reasons for this difference and report the kinetics and mechan-ism of both sulfurisation reactions.
Results and discussionSulfurisation by ‘fresh’ PADS
Although a freshly made solution of PADS (3) is not an optimalsulfurising agent13 it is still capable of converting phosphitetriesters to the corresponding thiophosphate (Scheme 1).For example, a solution of 1.0 M PADS (3) and 2.0 M 3-picolinein acetonitrile sulfurises 0.1 M triphenyl phosphite to tri-phenyl thiophosphate at 25 °C with a half-life of ∼15 min. Thekinetics of this process were determined by following the reac-tion by 31P NMR from which the rate law was found to be firstorder in each reagent (eqn (1)). With excess PADS and 3-pico-line there is an exponential decrease in phosphite concen-tration from which the observed pseudo first-order rate con-stants were found to increase with increasing concentration ofcatalytic base, 3-picoline (Fig. 1) giving a second-order rateconstant kcat = 4.13 × 10⁻⁴ M−1 s−1 at 25 °C. Similarly theobserved pseudo first-order rate constants increase with theconcentration of PADS.
Rate ¼ k½PADS�½picoline�½ðROÞ3P� ð1ÞSolutions of PADS in acetonitrile with 3-picoline slowly
degrade to give polysulfides.14 However, when using ‘fresh’solutions of PADS for the sulfurisation of phosphites, theactive sulfurising reagent must be the intact diacyl disulfide(3) as the rate of sulfurisation of phosphite esters by ‘fresh’
PADS are two orders of magnitude faster than the rate ofdegradation of PADS under similar conditions.
The sulfurisation process is likely to occur by an ionicmechanism as indicated by the dependency of the rate on abase, substituent effects in all three reagents and on thepolarity of the solvent. For example, the relative rates of sulfuri-sation of triphenyl phosphite in toluene, chloroform, aceto-nitrile and DMSO are 1 : 4 : 86 : 230, respectively, and theseratios remain similar for the sulfurisation of substituted triarylphosphites.
The mechanism of the reaction was investigated by deter-mining the effect of substituents in the three reagents – thephosphite, the sulfurising agent and the catalytic base on therates of sulfurisation. Trialkyl phosphites undergo sulfurisa-tion extremely rapidly in acetonitrile making kinetic investi-gations difficult, but the reactions are measurable in chloro-form (Table 1). Electron-withdrawing substituents in trialkyl-phosphites (RO)3P decrease the rate of sulfurisation and thereis a Brönsted-type linear dependence of the observed pseudofirst-order rate constants (kobs) on the pKa of the correspondingalcohol in water generating an apparent βnuc = 0.51 (Fig. 2)indicative of positive charge development on phosphorus inthe transition state and compatible with the phosphite acting
Scheme 1
Fig. 1 Pseudo first-order rate constants (kobs) at 25 °C as a function ofthe concentration of 3-picoline for the sulfurisation of 0.10 M triphenylphosphite by 1.0 M PADS.
Table 1 The observed pseudo first-order rate constants (kobs) for thesulfurisation of substituted trialkyl and triphenyl phosphites (0.10 M) by‘fresh’ PADS (1.0 M) and 3-picoline (2.0 M), in CDCl3 at 25 °C
(RO)3PpKa ROH (H2O) kobs (s
−1)R substituent
Ethyl 16.0 1.43 × 10⁻²
Methyl 15.54 5.10 × 10⁻³
2-Chloroethyl 14.31 5.60 × 10⁻⁴
2,2,2-Trifluoroethyl 12.43 1.98 × 10⁻⁴
4-Methoxyphenyl 10.20 3.51 × 10⁻⁵
4-Methylphenyl 10.19 6.55 × 10⁻⁵
Phenyl 9.95 3.28 × 10⁻⁵
4-Fluorophenyl 9.95 2.66 × 10⁻⁵
4-Chlorophenyl 9.38 7.88 × 10⁻⁵
3-Chlorophenyl 9.02 4.62 × 10⁻⁵
Organic & Biomolecular Chemistry Paper
This journal is © The Royal Society of Chemistry 2016 Org. Biomol. Chem., 2016, 14, 10840–10847 | 10841

as a nucleophile in the sulfurising reaction. Trialkyl phos-phites have a high thiophilicity and their S-nucleophilicity isgreater than that of sulfides.15 There is little or no dependenceof the rates of sulfurisation of triaryl phosphites on the arylsubstituent (Table 1).
On the other hand, electron-withdrawing substituents inthe aromatic rings of PADS (3) increase the rate of sulfurisationof triphenyl phosphite (0.10 M) with 3-picoline (2.0 M) inacetonitrile (Table 2). However, there is a non-linear depen-dence on the Hammett σ-values probably suggesting a changein rate-limiting step (Fig. 3). For the 4-methoxy to the 4-chloro-substituted PADS the Hammett ρ-value is 2.34 indicative of sig-nificant generation of negative charge near the PADS residuein the transition state.
The rates of sulfurisation of triphenyl phosphite by ‘fresh’PADS (3) in acetonitrile also increase with the basicity of sub-stituted pyridines. A Brönsted-type plot of the dependence ofthe observed pseudo first-order rate constants at 25 °C on thepKa of the conjugate acid of substituted pyridines in aceto-nitrile (Table 3) generates a slope β = 0.43 (Fig. 4), compatiblewith positive charge development on the pyridine nitrogen inthe transition state.
In order to distinguish between the role of the catalytic pyri-dines acting as general bases or as nucleophiles, sulfurisationwas investigated with hindered bases and sulfurising agent.
For example, the observed first-order rate constant for the sul-furisation of triphenyl phosphite in acetonitrile with PADSusing sterically hindered 2,6-lutidine as the base is 3-foldgreater than that for pyridine which is similar to the ratiosseen for proton abstraction from carbon acids.16 Whereas forpyridine acting as a nucleophilic catalyst such as in the hydro-
Fig. 2 Dependence of the observed pseudo first-order rate constant(kobs) for the sulfurisation of substituted trialkyl phosphites (RO)3P byPADS with 3-picoline in chloroform at 25 °C on the pKa of the corres-ponding alcohol (ROH) in water.
Table 2 The observed pseudo first-order rate constants (kobs) for thesulfurisation of triphenyl phosphites (0.10 M) by ‘fresh’ aryl-substitutedPADS (1.0 M) and 3-picoline (2.0 M), in acetonitrile at 25 °C
Ar substituent in (ArCH2COS)2 kobs (s−1) Hammett σ substituent
4-MeO 2.56 × 10⁻⁴ −0.27H 7.70 × 10⁻⁴ 04-F 1.07 × 10⁻³ 0.064-Cl 4.01 × 10⁻³ 0.233-Cl 4.67 × 10⁻³ 0.374-CN 6.27 × 10⁻³ 0.66
Fig. 3 Dependence of the observed pseudo first-order rate constant(kobs) for the sulfurisation of triphenyl phosphite (0.10 M) by aryl substi-tuted PADS (1.0 M) with 3-picoline (2.0 M) in acetonitrile at 25 °C on theHammett σ-value of the aryl substituent.
Table 3 The observed pseudo first-order rate constants (kobs) for thesulfurisation of triphenyl phosphite (0.10 M) by ‘fresh’ PADS (1.0 M) andthe pKa of the catalysing base, substituted pyridines (2.0 M), in aceto-nitrile at 25 °C
Pyridine substituent pKa (ACN) kobs (s−1)
4-CN 8.50 7.26 × 10⁻⁶
3-CN 8.00 7.38 × 10⁻⁶
3-Cl 9.77 2.27 × 10⁻⁵
3-MeO 12.45 4.92 × 10⁻⁴
H 12.60 2.96 × 10⁻⁴
3-Me 13.70 8.81 × 10⁻⁴
4-MeO 14.73 7.15 × 10⁻³
2,6 diMe 14.70 8.75 × 10⁻⁴
Fig. 4 Dependence of the observed pseudo first-order rate constants(kobs) for the sulfurisation of triphenyl phosphite by ‘fresh’ PADS on thepKa of substituted pyridines in acetonitrile at 25 °C.
Paper Organic & Biomolecular Chemistry
10842 | Org. Biomol. Chem., 2016, 14, 10840–10847 This journal is © The Royal Society of Chemistry 2016

lysis of acetic anhydride17 and acetyl fluoride,18 through theintermediate formation of the acetyl pyridinium ion, 2,6-luti-dine is an ineffective catalyst despite its higher basicity.3,4 Thesulfurising reaction with ‘fresh’ PADS therefore appears toinvolve the pyridine acting as a base abstracting a proton fromthe benzyl methylene in an elimination step. Such a role canbe prevented by replacing these ionisable hydrogens andindeed the rate of sulfurisation of triphenyl phosphite with2,2,2′,2′-tetramethyl PADS (5) and 3-picoline in acetonitrile isan order of magnitude slower than with PADS (3) under thesame conditions. With the sterically hindered 2,6-lutidine asthe base and (5) there is no observable sulfurisation of tri-phenyl phosphite indicating that the mechanism of sulfurisa-tion with tetramethyl PADS (5) and 3-picoline occurs bynucleophilic catalysis in contrast to the general base catalysedreaction of PADS (3) itself.
Finally, removing the methylenes of PADS to give dibenzoyldisulfide (DBDS) (6) generates a sulfurising agent which is20-fold less effective than PADS under the same reaction con-ditions (kDBDS = 3.82 × 10⁻⁵ s−1, kPADS = 7.70 × 10⁻⁴ s−1). Thedependence of the observed pseudo first-order rate constants(kobs) for the sulfurisation of triphenyl phosphite by dibenzoyldisulfides (6) with substituted pyridines in acetonitrile at25 °C on the pKa of the conjugate acid of substituted pyridinesin acetonitrile generates a β = 0.16 compared with β = 0.43with ‘fresh’ PADS. The different β-values are consistent withdifferent roles of the base in the sulfurisation reactions usingdibenzoyl disulfides (5) and ‘fresh’ PADS (3).
These observations are compatible with sulfurisation using‘fresh’ PADS (3) occurring with the phosphite acting as anucleophile and the pyridine acting as a general basesuggesting the mechanism outlined in Scheme 2. Cleavage ofthe S–S bond in disulfides by nucleophiles is well established19
and, in this case, initial nucleophilic attack of the phosphiteon sulfur of the diacylsulfide generates an intermediate phos-phonium ion and thioacetate anion in a reversible step; inacetonitrile these two species probably exist as an ion-pair.Rate-limiting breakdown of the phosphonium ion occurs byan elimination step involving proton abstraction by the pyri-dine base to give the product thiophosphate. This step issimilar to that which we have suggested for the ‘ageing’ ofPADS by trapping the ketene and D-exchange of the methylenehydrogens. In acetonitrile, the pKa of the thioacid is ∼20 andthat for 3-picoline 13.7 20 so favouring formation of the neutralspecies (Scheme 2). Rate-limiting breakdown of the phos-phonium ion is compatible with the LFER observationsreported here which indicate that in the transition state thephosphorus and the catalytic pyridine base nitrogen are bothrelatively positively charged, whilst there is relative negativecharge development transmitted to the aryl ring of PADS.There may be a change in rate-limiting step with electron-with-drawing substituents in the aryl ring of PADS due to theincreased acidity of the methylene hydrogens facilitatingproton abstraction causing the first step to become rate-limiting.
Sulfurisation by ‘aged’ PADS
A freshly made solution of PADS (3) is not an optimal sulfuris-ing agent11 and a solution ‘aged’ for about 2 days in 50% v/v3-picoline in acetonitrile improves their efficiency. Forexample, the pseudo first-order rate constants for the sulfurisa-tion of 0.05 M triphenyl phosphite in acetonitrile by 0.5 MPADS with 1.0 M 3-picoline increase with the length of ‘ageing’(Fig. 5), such that PADS ‘aged’ for 48 h is more than an orderof magnitude more active than a freshly prepared solution ofPADS. We have shown that PADS degrades completely over thisperiod of time due to its degradation to phenylacetyl poly-sulfides. Given that the molar concentration of the polysulfidesis less than that derived from PADS they are thus much moreefficient sulfurising agents.
The general procedure for preparing ‘aged’ PADS was to dis-solve (3) (3 M) in acetonitrile with 3-picoline (5 M) maintainedat 25 °C for 48 h. This was then quenched with excess aqueous
Scheme 2
Organic & Biomolecular Chemistry Paper
This journal is © The Royal Society of Chemistry 2016 Org. Biomol. Chem., 2016, 14, 10840–10847 | 10843

hydrochloric acid (2 M) to remove excess 3-picoline and themixture extracted using dichloromethane, which was thendried and removed under vacuum. The resultant yellow oil wasthen made up to the same volume as the original solution gen-erating a solution with the same nominal concentration as theoriginal PADS solution. A crude estimate of the total concen-trations of the phenylacetyl polysulfides generated from thestandard solution of PADS is 1.45 M based on HPLC dataassuming similar extinction coefficients for all species.
The kinetics of the sulfurisation reactions of phosphiteswere determined by following the reaction by 31P NMR usuallywith excess PADS and 3-picoline so there is an exponentialdecrease in phosphite concentration from which the observedfirst order constants could be obtained. The rate law using‘aged’ PADS is first order in each reagent at low base concen-trations, similar to that seen with ‘fresh’ PADS (eqn (1)).However, there is a non-linear dependence on base concen-tration (Fig. 6) indicative of a change in rate-limiting step with
increasing concentration and therefore a stepwise reactionmechanism. In the region where there is a first-order depen-dence on 3-picoline concentration, the corresponding second-order rate constant kcat = 6.72 × 10⁻³ M−1 s−1 at 25 °C which is16 fold greater than that using ‘fresh’ PADS for which kcat =4.13 × 10⁻⁴ M−1 s−1 However, the second-order rate constantfor ‘aged’ PADS is based on the nominal concentration ofPADS before it is degraded to a mixture of lower molar concen-tration of polysulfides and so the true constant is much higherthan this.
The rates of sulfurisation of triphenyl phosphite by ‘aged’PADS (4) in acetonitrile have a smaller dependency on the basi-city of the catalytic base. A Brönsted-type plot of the depen-dence of the observed pseudo first-order rate constants at25 °C on the pKa of the conjugate acid of substituted pyridinesin acetonitrile (Table 4) generates a slope β = 0.26 comparedwith β = 0.43 using ‘fresh’ PADS. This indicates a transitionstate with less positive charge development on the pyridinenitrogen for ‘aged’ PADS. One of the consequences of thesmaller dependency of the rate of sulfurisation on the basicityof the pyridine catalyst using ‘aged’ PADS is that the rates ofsulfurisation with 4-methoxypyridine using ‘aged’ and ‘fresh’PADS are similar, based on the same starting concentration ofPADS.
If the mechanism of sulfurisation using ‘aged’ PADSinvolved nucleophilic attack by trialkyl phosphite on the sulfuradjacent to the acyl group of diacyl polysulfides (4), as occurswith ‘fresh’ PADS (Scheme 2), this would eliminate a sulfideanion compared with the better leaving group thiocarboxylateanion using ‘fresh’ PADS. Therefore this seems an unlikelyprocess to explain the greater reactivity of ‘aged’ PADS as thepre-equilibrium constant K1 would be reduced and the rateconstant for the reverse step k−1 increased because of thegreater nucleophilicity of sulfide anion compared with thio-acetate ion.
It is proposed that the sulfurisation reaction with ‘aged’PADS occurs with initial nucleophilic attack by trialkyl phos-phite on a central sulfur of diacyl polysulfides (4) to liberate athioacetate anion in a pre-equilibrium step similar to thatsuggested for ‘fresh’ PADS (Scheme 2). Nucleophilic attack byphosphite on the polysulfide (4) reversibly generates a phos-phonium ion (Scheme 3) and both the magnitude of the rate
Fig. 6 The dependence of the observed pseudo first-order rate con-stants for the sulfurisation of triphenyl phosphite (0.10 M) to (PhO)3PvSby (1.0 M) PADS (3) that has been ‘aged’ for 48 h in acetonitrile and3-picoline (5.0 M) on the concentration of 3-picoline at 25 °C.
Fig. 5 The pseudo first-order rate constants for the sulfurisation of tri-phenyl phosphite (0.05 M) to (PhO)3PvS by (0.5 M) PADS (3) as a func-tion of the time that PADS has been ‘aged’ in acetonitrile with (1.0 M)3-picoline at 25 °C.
Table 4 The observed pseudo first-order rate constants (kobs) for thesulfurisation of triphenyl phosphite (0.10 M) by ‘aged’ PADS (1.0 M) andthe pKa of the catalysing base, substituted pyridines (2.0 M), in aceto-nitrile at 25 °C
Pyridine substituent pKa (ACN) kobs (s−1)
4-CN 8.50 3.92 × 10⁻⁴
3-CN 8.00 4.09 × 10⁻⁴
3-Cl 9.77 8.75 × 10⁻⁴
3-MeO 12.45 4.78 × 10⁻³
H 12.60 9.88 × 10⁻³
3-Me 13.70 1.14 × 10⁻²
4-MeO 14.73 1.28 × 10⁻²
Paper Organic & Biomolecular Chemistry
10844 | Org. Biomol. Chem., 2016, 14, 10840–10847 This journal is © The Royal Society of Chemistry 2016

(k1 and k−1) and equilibrium constants (K1) for this process aresimilar to those for the comparable step using ‘fresh’ PADS (3).However, the pyridine base now acts as a nucleophile in thesulfurisation reaction with ‘aged’ PADS compared with its roleas a base using ‘fresh’ PADS (Scheme 2).
However, the polysulfide phosphonium ion intermediatepresents a more facile pathway for product formation involvingS–S bond fission as opposed to C–S bond fission. The bonddissociation energy is 226 kJ mol−1 for the former comparedwith 272 kJ mol−1 for the latter and the force constant for S–Sstretch (440 N m−1)21 is significantly smaller leading to facilebond cleavage, especially in polysulfides.22 There are manyexamples of S–S bond cleavage as a result of nucleophilicattack by nitrogen nucleophiles.19,23 The relatively small valuefor the Brönsted βnuc = 0.26 for catalysis by substituted pyri-dines is also compatible with a facile process for the secondstep k2 and the change in rate-limiting step24 with increasingpicoline concentration (Fig. 6) occurs when k2[pic] ≫ k−1.
Conclusion
Although an ‘aged’ solution of phenylacetyl disulfide (PADS),consisting of polysulfides, is a more efficient sulfur transferreagent than ‘fresh’ PADS to convert trialkylphosphites to thecorresponding thiophosphate ‘fresh’ PADS is still an effectivesulfurising reagent. The differences in reactivity of the twosolutions are reflected in their kinetic behaviour and thedependencies of their respective rates on variables such assubstituent effects and concentration of the catalysing pyridinebase. The rates of both processes in acetonitrile are first orderin sulfurising agent, phosphite and a pyridine base. However,with an ‘aged’ solution of PADS the rate becomes independentof base at high concentrations. The Brönsted β values for sul-furisation using ‘fresh’ and ‘aged’ PADS with substitutedpyridines are different, 0.43 and 0.26, respectively. With ‘fresh’PADS the Brönsted βnuc = 0.51 for substituted trialkyl phos-phites is consistent with a mechanism involving nucleophilicattack of the phosphite on the PADS disulfide bond to reversi-bly generate a phosphonium intermediate. Replacing the ioni-sable hydrogens in PADS with methyl groups significantlyreduces the rate of sulfurisation indicating that the rate-limit-
ing breakdown of the phosphonium ion intermediate occursby a base catalysed elimination process. The comparable poly-sulfide phosphonium ion intermediate seen with ‘aged’ PADSallows a more facile pathway for product formation involvingS–S bond fission as opposed to C–S bond fission.
ExperimentalGeneral sulfurisation kinetics with ‘aged’ PADS
A solution of PADS (1 M) 50/50 v/v acetonitrile/3-picoline wasleft to ‘age’ for 48 h. At T = n h a 1 ml sample of this wasremoved and quenched with dilute hydrochloric acid (10 ml,2 M) to remove the picoline. This was then washed with di-chloromethane (DCM) (2 × 10 ml), dried over magnesiumsulfate and the solvent removed under vacuum. The resultingoil was then made up to 1 ml using deuterated acetonitrile. Toan NMR tube containing triphenyl phosphite in deuteratedacetonitrile (0.1 M, 200 μl) and 3-picoline in deuterated aceto-nitrile (2 M, 200 μl) was added ‘aged’ PADS solution (200 μl,1 M) and 31P NMR spectrum recorded every 90 s.
Synthesis
The syntheses of the various arylacetyl disulfides have beenpreviously reported.14
Tris-(4-methoxyphenyl)phosphite. To a solution of 4-meth-oxyphenol (9.77 g, 78.7 mmol) and pyridine (8.10 ml, 7.92 g,100 mmol) in diethyl ether (80 ml) phosphorus trichloride(1.74 ml, 2.74 g, 20.0 mmol) was added dropwise at roomtemperature under a nitrogen atmosphere and stirred for1.5 h. When the reaction was complete, the reaction mixturewas quenched with water (100 ml) and the organic phase thenwashed with water (50 ml) and brine (50 ml), dried over mag-nesium sulfate and the solvent removed under vacuum. Thecrude mixture was purified by silica gel column chromato-graphy using chloroform as the eluent to give the product as acolourless oil (4.87 g, 4.03 ml, 12.2 mmol, 61% yield). 1H NMR(CDCl3, 400 MHz) δ 3.78 (s, 9H, CH3), 6.87 (d, 6H, J 9.23 Hz,ArH), 7.11 (d, 6H, J 9.23 Hz, ArH) ppm; 13C NMR (CDCl3,100 MHz) δ 55.6 (CH3), 114.7 (CH), 121.7 (CH), 145.1 (Cq),156.3 (Cq) ppm; 31P NMR (CDCl3, 400 MHz), δ 128.9 ppm,
Scheme 3
Organic & Biomolecular Chemistry Paper
This journal is © The Royal Society of Chemistry 2016 Org. Biomol. Chem., 2016, 14, 10840–10847 | 10845

HRMS (m/z): [M + H]+ for C21H21O6P calculated 401.1149,observed 401.1150
Tris-(3-chlorophenyl)phosphite. As above using 3-chloro-phenol (14.04 g, 112.8 mmol) and pyridine (10.78 ml, 10.58 g,141 mmol) in diethyl ether (120 ml), phosphorus trichloride(4.0 ml, 3.87 g, 28.2 mmol). The crude mixture was purified bysilica gel column chromatography using chloroform as theeluent to give the product as a pale yellow oil (9.1 g, 6.8 ml,22 mmol, 78% yield). 1H NMR (CDCl3, 400 MHz) δ 7.01–7.29(m, 12H, ArH) ppm; 13C NMR (CDCl3, 100 MHz) δ 118.8 (d, JC–P7.49 Hz, CH), 121.2 (d, JC–P 6.55 Hz, CH), 124.9 (CH), 130.6(CH), 135.1 (Cq), 151.8 (Cq) ppm; 31P NMR (CDCl3, 400 MHz),δ 126.5 ppm, HRMS (m/z): [M + H]+ for C18H12O3Cl3P, calcu-lated 412.9662, observed 412.9672.
Tris-(4-chlorophenyl)phosphite. As above using 4-chloro-phenol (10.3 g, 80 mmol) and pyridine (8.10 ml, 7.92 g,100 mmol) in diethyl ether (80 ml), phosphorus trichloride(1.74 ml, 2.74 g, 20.0 mmol). The crude mixture was purifiedby silica gel column chromatography using chloroform as theeluent to give the product as a white solid (5.06 g, 12.2 mmol,61% yield). 1H NMR (CDCl3, 400 MHz) δ 7.06 (d, J 8.93 Hz, 6H,ArH), 7.30 (d, J 8.96 Hz, 6H, ArH) ppm; 13C NMR (CDCl3,100 MHz) δ 121.9 (d, JC–P 6.6 Hz, Cq), 129.9 (CH), 149.8 (d, JC–P2.8 Hz, Cq) ppm; 31P NMR (CDCl3, 400 MHz), δ 126.8 ppm,HRMS (m/z): [M + H]+ for C18H12O3Cl3P, calculated 412.9662,observed 412.9665.
Tris-(4-fluorophenyl)phosphite. To a solution of 4-fluoro-phenol (4.41 g, 39.3 mmol) and triethylamine (5.6 ml, 4.06 g,40 mmol) in diethyl ether (40 ml) was added dropwise phos-phorus trichloride (0.87 ml, 1.37 g, 10.0 mmol) then stirred atroom temperature under nitrogen atmosphere for 24 h. Thesolid precipitate from the reaction was removed by vacuum fil-tration and washed with diethyl ether (2 × 10 ml). The solventfrom the filtrate was removed under vacuum and the crudeproduct purified by silica gel column chromatography elutingwith chloroform to give the product as a white solid (4.77 g,13.1 mmol, 71% yield). 1H NMR (CDCl3, 400 MHz) δ 7.01–7.13(m, 12H, ArH) ppm; 13C NMR (CDCl3, 100 MHz) 116.4 (d, JC–F23 Hz, CH), 122.0 (t, JC–F 7.4 Hz, JC–P 7.3 Hz, CH), 147.2 (d, JC–F2.9 Hz, JC–P 3.0 Hz, Cq), 159.5 (d, JC–F 243 Hz, CF) ppm;31P NMR (CDCl3, 400 MHz) δ 127.5 (127.8) ppm, HRMS (m/z):[M + H]+ for C18H12O3F3P, calculated 365.0549, observed365.0550.
Acknowledgements
JS is grateful to GSK for the award of an BBSRC CASEstudentship.
Notes and references
1 P. C. Zamecnik and M. L. Stephenson, Proc. Natl. Acad.Sci. U. S. A., 1978, 75, 285.
2 R. M. Orr, Curr. Opin. Mol. Ther., 2001, 3, 288; B. Roehr,J. Int. Assoc. Physicians AIDS Care, 1998, 4, 14; S. Agrawal
and E. R. Kandimalla, Mol. Med. Today, 2000, 6, 72;D. A. Bell, A. J. Hooper and J. R. Burnett, Expert Opin.Invest. Drugs, 2011, 20, 265; A. Goyenvalle, J. Wright,A. Babbs, V. Wilkins, L. Garcia and K. E. Davies, Mol. Ther.,2012, 20, 1212.
3 P. S. Eder, R. J. DeVine, J. M. Dagle and J. A. Walder,Antisense Res. Dev., 1991, 1, 141–151.
4 B. Nawrot and K. Sipa, Curr. Top. Med. Chem., 2006, 6, 913;E. L. Chernolovskaya and M. A. Zenkova, Curr. Opin. Mol.Ther., 2010, 12, 158; S. P. Walton, M. Wu, J. A. Gredell andC. Chan, FEBS J., 2010, 277, 4806; M. R. Laresa, J. J. Rossiaand D. L. Ouellet, Trends Biotechnol., 2010, 28, 570;P. Guga, Curr. Top. Med. Chem., 2007, 7, 695.
5 F. Eckstein, Antisense Nucleic Acids Drug Dev., 2000, 10, 117.6 S. T. Crooke, Methods Enzymol., 2000, 313, 3; C. A. Stein
and Y. C. Cheng, Science, 1993, 261, 1004.7 P. Guga and M. Koziołkiewiczb, Chem. Biodiversity, 2011, 8,
1642.8 R. P. Iyer, L. R. Phillips, W. Egan, J. B. Regan and
S. L. Beaucage, J. Org. Chem., 1990, 55, 4693–4699; H. Vuand B. L. Hirschbein, Tetrahedron Lett., 1991, 32, 3005–3008; M. V. Rao, C. B. Reese and Z. Zhao, Tetrahedron Lett.,1992, 33, 4839–4842.
9 W. J. Stec, B. Uznanski and A. Wilk, Tetrahedron Lett.,1993, 33, 5317–5320; M. V. Rao and K. Macfarlane,Tetrahedron Lett., 1994, 35, 6741–6744; V. A. Efimov,A. L. Kalinkina, O. G. Chakhmakhcheva, T. S. Hill andK. Jayaraman, Nucleic Acids Res., 1995, 23, 4029–4033;Z. Zhang, A. Nichols, J. X. Tang, Y. Han and J.-Y. Tang,Tetrahedron Lett., 1999, 40, 2095–2098; J.-Y. Tang, Z. Han,J. X. Tang and Z. Zhang, Org. Process Res. Dev., 2000, 4,194–198.
10 P. C. J. Kamer, H. C. P. F. Roelen, H. van den Elst, G. A. vander Marel and J. H. van Boom, Tetrahedron Lett., 1989, 30,6757–6760.
11 A. H. Krotz, D. Gorman, P. Mataruse, C. Foster,J. D. Godbout, C. C. Coffin and A. N. Scozzari, Org. ProcessRes. Dev., 2004, 8, 852–858.
12 Z. S. Cheruvallath, R. L. Carty, M. N. Moore, D. C. Capaldi,A. H. Krotz, P. D. Wheeler, B. J. Turney, S. R. Craig,H. J. Gaus, A. N. Scozzari, D. L. Cole and V. T. Ravikumar,Org. Process Res. Dev., 2000, 4, 199–204.
13 A. H. Krotz, D. Gorman, P. Mataruse, C. Foster,J. D. Godbout, C. C. Coffin and A. N. Scozzari, Org. ProcessRes. Dev., 2004, 8, 852–858.
14 J. Scotson, B. I. Andrews, A. P. Laws and M. I. Page, Org.Biomol. Chem., 2016, 14, 8301–8308.
15 D. R. Hogg, in Comprehensive Organic Chemistry, ed. D.Barton and W. D. Ollis, Pergamon, Oxford, 1979, vol. 5,p. 445.
16 R. G. Pearson and F. V. Williams, J. Am. Chem. Soc., 1953,75, 3073; R. G. Pearson and F. V. Williams, J. Am. Chem.Soc., 1954, 76, 258; E. S. Lewis and J. D. Allen, J. Am. Chem.Soc., 1964, 86, 2022; J. P. Calmon, M. Calmon and V. Gold,J. Chem. Soc. B, 1969, 659.
17 A. R. Butler and V. Gold, J. Chem. Soc., 1961, 4362.
Paper Organic & Biomolecular Chemistry
10846 | Org. Biomol. Chem., 2016, 14, 10840–10847 This journal is © The Royal Society of Chemistry 2016

18 C. A. Bunton and J. H. Fendler, J. Am. Chem. Soc., 1966, 31,2307.
19 I. V. Koval, Russ. Chem. Rev., 1994, 63, 735–750.20 B. Cox, Acids and Bases, solvent effects on acid-base strength,
Oxford UP, Oxford, 2013.21 K. B. Wiberg and A. Shruke, Spectrochim. Acta, Part A, 1973,
29, 583.
22 R. Steudal, Angew. Chem., Int. Ed. Eng., 1975, 14, 655–720.23 S. Oae, Y. Tsuchida, K. Tsujihara and N. Furukawa, Bull.
Chem. Soc. Jpn., 1972, 45, 2856; N. N. Mel’nikov,B. A. Kashkin and N. A. Torgasheva, Zh. Obshch. Khim.,1972, 45, 2856.
24 M. I. Page and A. Williams, in Organic and Bio-OrganicMechanisms, Longmans, 1997, p. 26.
Organic & Biomolecular Chemistry Paper
This journal is © The Royal Society of Chemistry 2016 Org. Biomol. Chem., 2016, 14, 10840–10847 | 10847