thesis leaching gold in iodide solutionspdf
TRANSCRIPT
INFORMATION TO USERS
The most advanced technology has been used to photograph and reproduce this manuscript from the microfilm master. UMI films the text directly from the original or copy submitted. Thus, some thesis and dissertation copies are in typewriter face, while others may be from any type of computer printer.
The quality of this reproduction is dependent upon the quality of the copy submitted. Broken or indistinct print, colored or poor quality illustrations and photographs, print bleedthrough, substandard margins, and improper alignment can adversely affect reproduction.
In the unlikely event that the author did not send UMI a complete manuscript and there are missing pages, these will be noted. Also, if unauthorized copyright material had to be removed, a note will indicate the deletion.
Oversize materials (e.g., maps, drawings, charts) are reproduced by sectioning the original, beginning at the upper left-hand corner and continuing from left to right in equal sections with small overlaps. Each original is also photographed in one exposure and is included in reduced form at the back of the book.
Photographs included in the original manuscript have been reproduced xerographically in this copy. Higher quality 6" x 9" black and white photographic prints are available for any photographs or illustrations appearing in this copy for an additional charge. Contact UMI directly to order.
University Microfilms International A Bell & Howell Information Company
300 North Zeeb Road, Ann Arbor, Ml 48106-1346 USA 313/761-4700 800/521-0600
Order Number 1341473
Leaching and electrochemical behavior of gold in iodide solutions
Qi, Peihao, M.S.
The University of Arizona, 1990
U M I 300 N. Zeeb Rd. Ann Arbor, MI 48106

LEACHING & ELECTROCHEMICAL BEHAVIOR OF GOLD
IN IODIDE SOLUTIONS
by
Peihao Qi
A Thesis Submitted to the Faculty of
DEPARTMENT OF MATERIALS SCIENCE AND ENGINEERING
In Partial Fulfillment of the Requirements
For the Degree of
MASTER OF SCIENCE
In the Graduate College
The UNIVERSITY OF ARIZONA
19 9 0

2
STATEMENT BY AUTHOR
This thesis has been submitted in partial fulfillment of requirements for an advanced degree at the University of Arizona and. is deposited in the University Library to be made available to borrowers under rules of the Library.
Brief quotations from this thesis are allowable without special permission, provided that accurate acknowledgment of source is made. Requests for permission for extended quotation from or reproduction of this manuscript in whole or in part may be granted by the head of major department or the Dean of the Graduate College when in his or her judgment the proposed use of the material is in the interests of scholarship. In all other instances, however, permission must be obtained from the author.
This thesis has been approved on the date shown below:
SIGNED
APPROVAL BY THESIS DIRECTOR
xofessor of Materials Science & Engineering
u, mo (f cfete '

3
ACKNOWLEDGEMENTS
I wish to express my heartfelt thanks to Dr. J. Brent Hiskey, my thesis and research supervisor, for his great assistance, constant guidance and encouragement during my study for M.S. degree.
I am also grateful to the Arizona Mining and Mineral Resources Research Institute under U. S. Bureau of Mines for their financial support.
I would like to acknowledge Drs. W. G. Davenport and S. Raghavan for serving in my defense committee. I also wish to thank all of our group members for their beneficial discussions and assistance.
I also wish to take this opportunity to appreciate my wife, Siying Chen, for her constant and useful discussion, inspiration and support.
4
TABLE OF CONTENTS
LIST OF ILLUSTRATIONS . . 6
LIST OF TABLES 9
ABSTRACT 10
CHAPTER
1. INTRODUCTION 11
2. LITERATURE REVIEW 14
2.1 Leaching Aspects of Gold 14 2.1.1 Dissolution Chemistry of Gold 14 2.1.2 Polyiodide Species 17 2.1.3 Bromide Leaching 18 2.1.4 Iodide Leaching 19
2.2 Potential-pH Equilibrium Diagrams 20 2.2.1 Au-HpO System 20 2.2.2 Au-Cl"-H20 System 22 2.2.3 Au-Br"-H20 System .22 2.2.4 Au-I'-HjO System 22
2.3 Electrochemical Behavior of Gold in Halides . 26 2.3.1 Electrochemical Behavior of Gold
in Chloride Solutions 27 2.3.2 Electrochemical Behavior of Gold
in Bromide Solutions 33 2.3.3 Electrochemical Behavior of Gold
in Iodide Solutions 33 2.3.4 Adsorption of Halides on the Gold
Surface 35
2.4 Rotating Disk Electrode 36
3. EXPERIMENTAL PROCEDURE 37
3.1 Experimental Preparation 37
3.2 Leaching Tests 39 3.2.1 Apparatus 39 3.2.2 Conditions 41

5
TABLE OF CONTENTS (Continued)
3.3 Electrochemical Tests 41 3.3.1 Apparatus 41 3.3.2 Conditions 43
4. RESULTS AND DISCUSSION 44
4.1 Leaching Kinetics 44 4.1.1 I2/Ij Solution Chemistry 44 4.1.2 Effect of Disk Rotating Speed 47 4.1.3 Effect of Iodine Concentration 50 4.1.4 Effect of Iodide Concentration 56 4.1.5 Effect of Electrolytes 56 4.1.6 Effect of Temperature 62 4.1.7 Effect of pH 66 4.1.8 Comparison with Cyanidation 66 4.1.9 Kinetic Considerations 70
4.2 Electrochemistry 74 4.2.1 Cyclic Voltammetry of Gold in Halides . 74 4.2.2 Cyclic Voltammetry of Gold in Various
[Nal] 79 4.2.3 Anodic Polarization of Gold in Different
[Nal] 81 4.2.4 Effect of Disk Rotating Speed 85 4.2.5 Reduction of Iodine Species on Gold . . 92 4.2.6 Mixed Halide System 95 4.2.7 Effect of Sweep Rate 95
5. CONCLUSIONS 100
5.1 Leaching of Gold 100
5.2 Electrochemistry Behavior 101
REFERENCES 104

6
LIST OF ILLUSTRATIONS
Figure
1. Potential-pH equilibrium diagram for the gold-water system for dissolved gold species of 10"4 M (after ref. 5) 21
2. Potential-pH equilibrium diagram for the gold chloride system for [Au] = io"5 and [CI] = 10~2 M (after ref. 5) 23
3. Potential-pH equilibrium diagram for the gold bromide system for [Au] = 10^ and [Br] = 10"2 M (after ref. 5) 24
4. Potential-pH equilibrium diagram for the gold iodide system for [Au] = 10"5 and [I] = 10"2 M (after ref. 5) 25
5. Current density and potential curves for gold in unstirred NaCl solutions (after ref. 28) ... . 30
6. Cyclic voltammograms at a sweep rate of 20 mV/s and at a rotaint gold-disk electrode of 600 rpm in various solutions (after ref. 32) 32
7. Schematic illustration of the gold rotating disk . 38
8. Schematic representation of reaction apparatus for leaching cell 40
9. Schematic representation of three electrode cell . 42
10. Solubility of iodine at 25°C as a function of sodium iodide concentration 46
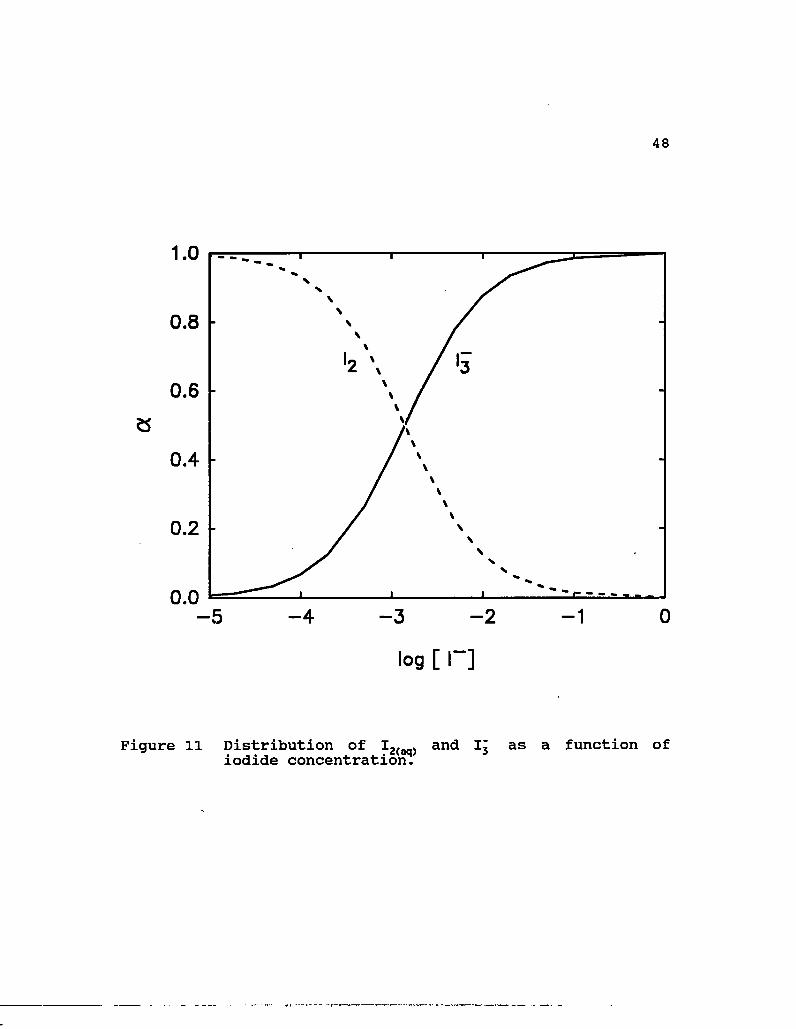
11. Distribution of I?(aq) and Ij as a function of iodide concentration 48
12. Gold dissolution at various disk rotation speeds using 10~2 M I" and 5x10 M I2 49
13. Gold dissolution rate plotted against the square-root of disk rotation speed 51

7
LIST OF ILLUSTRATIONS (CONTINUED)
Figure
14. Effect of I, concentration on the dissolution of gold in 10"^ M Nal 52
15. Reaction order plot for Ij 55
16. Effect of I2 concentration on the dissolution of gold from a stationary disk using a stirring bar for agitation 57
17. Effect of I" on the dissolution of gold in the presence of 10~3 M I2 58
18. Reaction order plot for I" 60
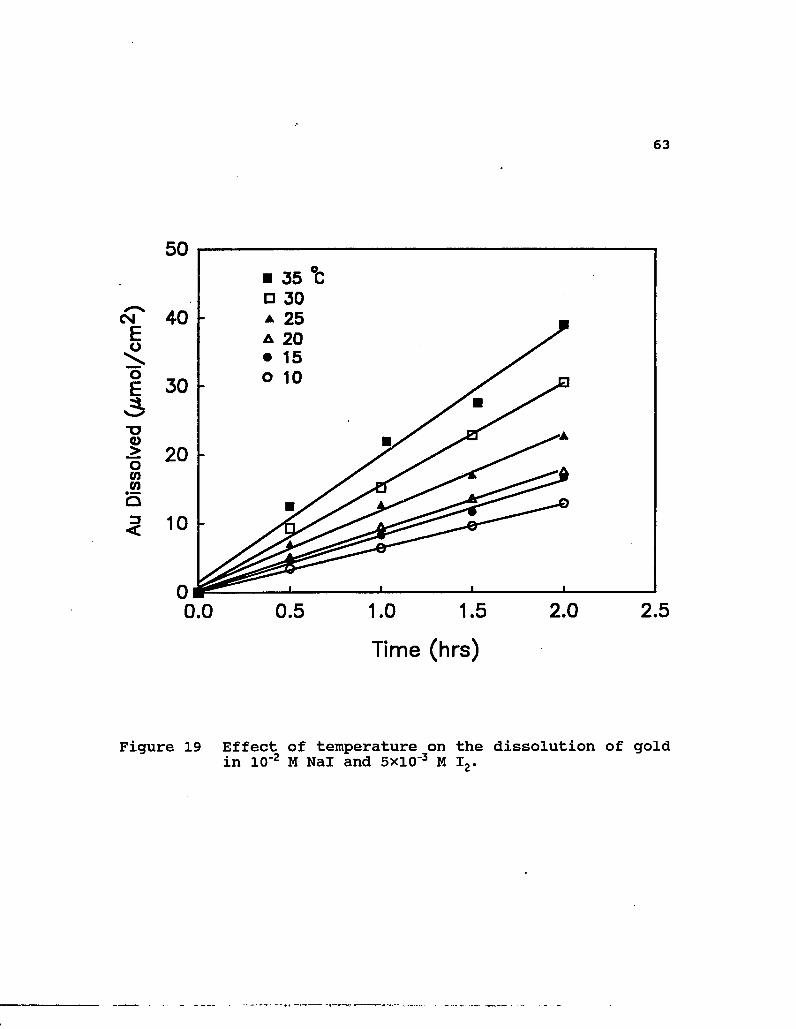
19. Effect of temperature on the dissolution of gold in 10"2 M Nal and 5xio~3 M I2 63
20. Effect of temperature on the dissolution of gold in 10"2 M Nal and lxio-3 M I2 64
21. Arrhenius plots for the leaching of gold in 10"2 M Nal solution containing 5xio~3 and lxio-3 M I2, respectively 67
22. Solubility of iodine at 10"2 M Nal as a function of temperature 68
23. Effect of pH on the dissolution of gold in 10~2 M Nal, 10 M I2 and 10"1 M Na2S04 69
24. Comparison of iodide and cyanide leaching of gold for different I2 concentrations 71
25. Cyclic voltammograms of gold in solutions containing 10~2 M NaCl, NaBr, and Nal respectively and 1 M HC104 with a scan rate of 20 mV/s and a static e l e c t r o d e . . . . . . . . . . . . . . . . . . . . . 7 6
26. Cyclic voltammograms of gold in 1 M HC10, with a scan rate of 20 mV/s and a static electrode ... 78

8
LIST OF ILLUSTRATIONS (CONTINUED)
Figure
27. Cyclic voltammograms of gold in various concentrations of Nal and 1 M HC10A with 20 mV/s and a stirring bar for agitation 80
28. Anodic polarization curves of gold in different concentrations of sodium iodide and 4xio_1 M Na2S04 using a scan rate of 1 mV/s and a RDE at 500 rpm ...................... 82
29. Comparison of anodic polarization curves of gold at 10"2 M Nal with and without disk rotation ... 84
30. Schematic diagrams of electrochemical processes for gold with rotation 86
31. Schematic diagram of electrochemical processes for gold without rotation 87
32. Effect of disk rotating speed on the anodic oxidation of gold at 2xl0-3 M Nal .88
33. Effect of disk rotating speed on the anodic oxidation of gold at 10"2 M Nal 89
34. Plot of limiting current densities for the first (0.65 V) and the second (0.95 V) plateau regions as a function of o1/2 91
35. Effect of iodine concentration on its reduction on gold at 10"2 M Nal and a RDE at 500 rpm .... 94
36. Anodic polarization curves of gold in mixed halide systems 97
37. Effect of sweep rate on the anodic oxidation of gold at 10"2 M Nal and a RDE at 500 rpm 98
9
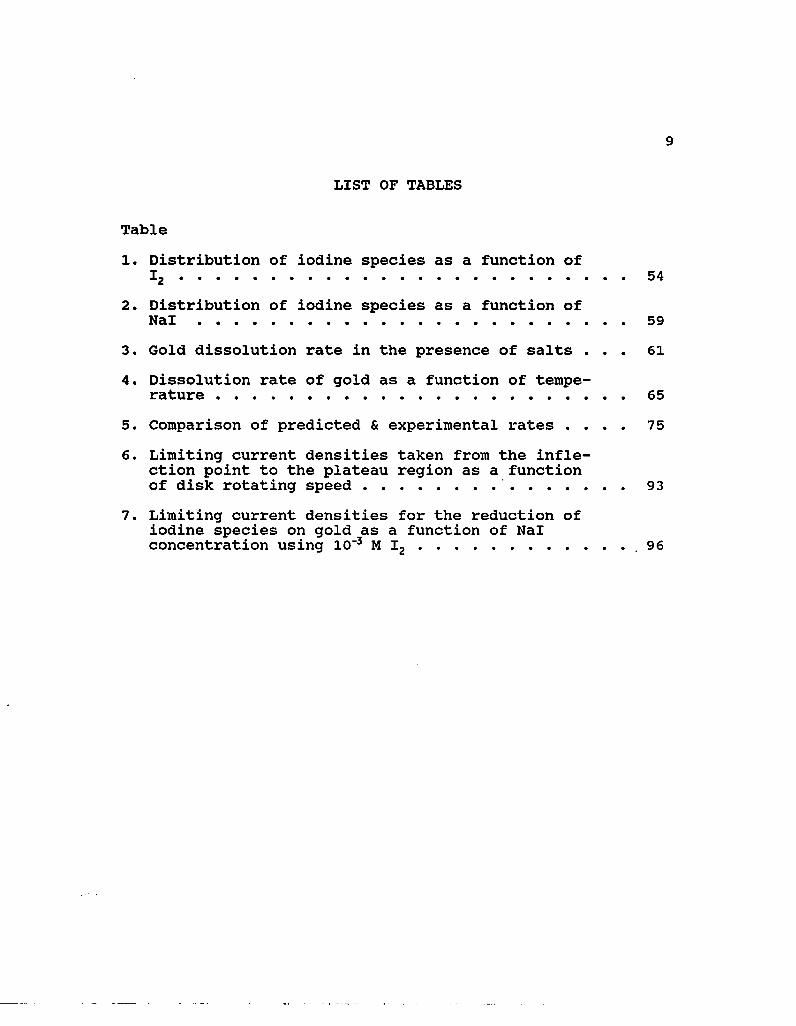
LIST OF TABLES
Table
1. Distribution of iodine species as a function of I2 54
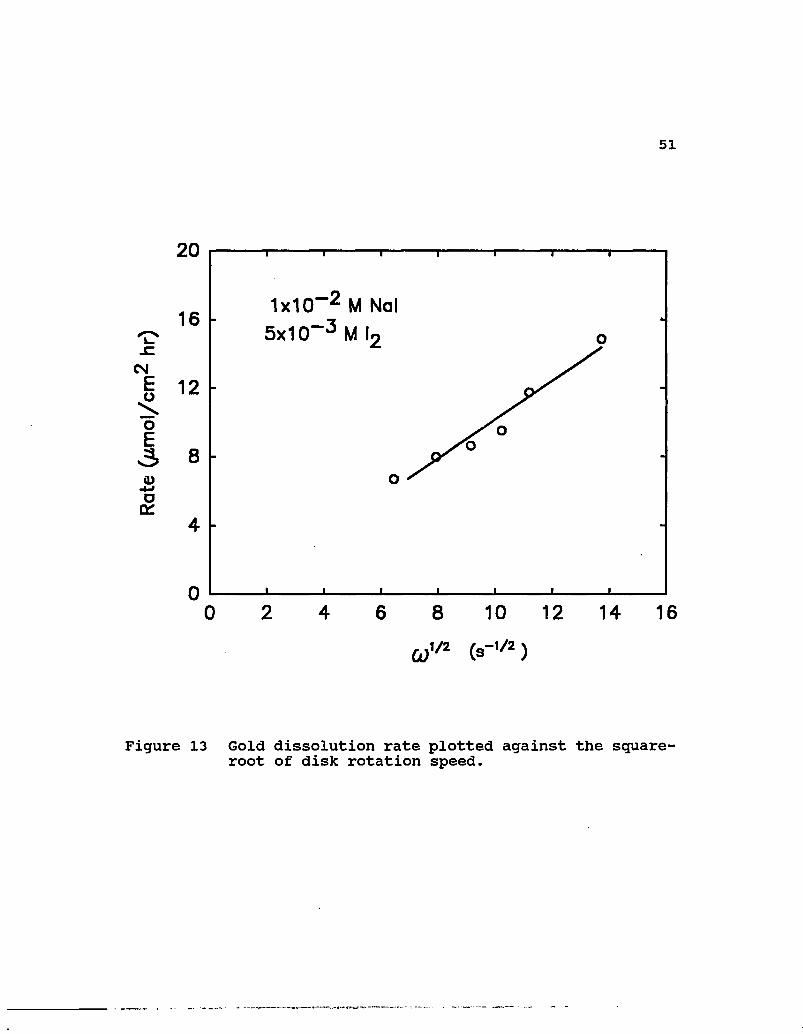
2. Distribution of iodine species as a function of Nal 59
3. Gold dissolution rate in the presence of salts ... 61
4. Dissolution rate of gold as a function of temperature 65
5. Comparison of predicted & experimental rates .... 75
6. Limiting current densities taken from the inflection point to the plateau region as a function of disk rotating speed 93
7. Limiting current densities for the reduction of iodine species on gold as a function of Nal concentration using 10'3 M I2 .96

10
ABSTRACT
Of the halogens, the gold iodide complexes are the most
stable in aqueous solutions. A series of experiments was
performed to investigate the kinetics and mechanism of the
leaching reaction between gold and iodide. Using a rotation
disk technique, the most important kinetic parameters were
measured. The reaction rate was found to be first order with
respect to Ij and half order with respect to I". A gold
leaching rate of about 2.6xio-9 mol/cm2»sec for 10"2 M I" and
5xio-3 M I2 was obtained. This value is close to that for
typical cyanidation. The reaction rate appears to be
controlled mainly by diffusion of reactants through the
boundary layer of solution to the gold electrode under the
conditions studied.
The electrochemical study of gold in different halide
solutions, with emphasis on iodide, was also carried out. The
electrochemical techniques used in this investigation include
cyclic voltammetry and linear sweep voltammetry. The results
displayed the sequential oxidation for gold dissolution in
iodide solution and confirmed that iodide has the strongest
oxidation capability of dissolving gold of the halides.

11
CHAPTER ONE
INTRODUCTION
Gold undoubtedly is the most noble of metals. Its noblity
is exhibited by the fact that it is the only metal that cannot
be oxidized by dissolved oxygen at any temperature and is also
not attacked by strong acids and alkalis. Fortunately, gold
can dissolve in aqueous solution containing both an
appropriate complexing ligand and an oxidizing agent [1].
Cyanidation of gold, a typical example, was invented as early
as 1880's [2,3], in which CN~ was used as a complexing ligand
and 02 as an oxidant according to the reaction
4AU + 8CN" + 02 + 2H20 -» 4Au(CN)2 + 40H" (1)
Although traditional cyanidation remains the overwhelming
choice for treating free milling gold and silver ores because
of its economy and process simplicity, there are certain
classes of ores and concentrates that are considered
refractory. The inability of conventional cyanidation to treat
effectively these materials has prompted the search for more
powerful lixiviants. In addition, because of its toxicity and
the problems of waste disposal management, the use of cyanide
has been of some environmental concern.
12
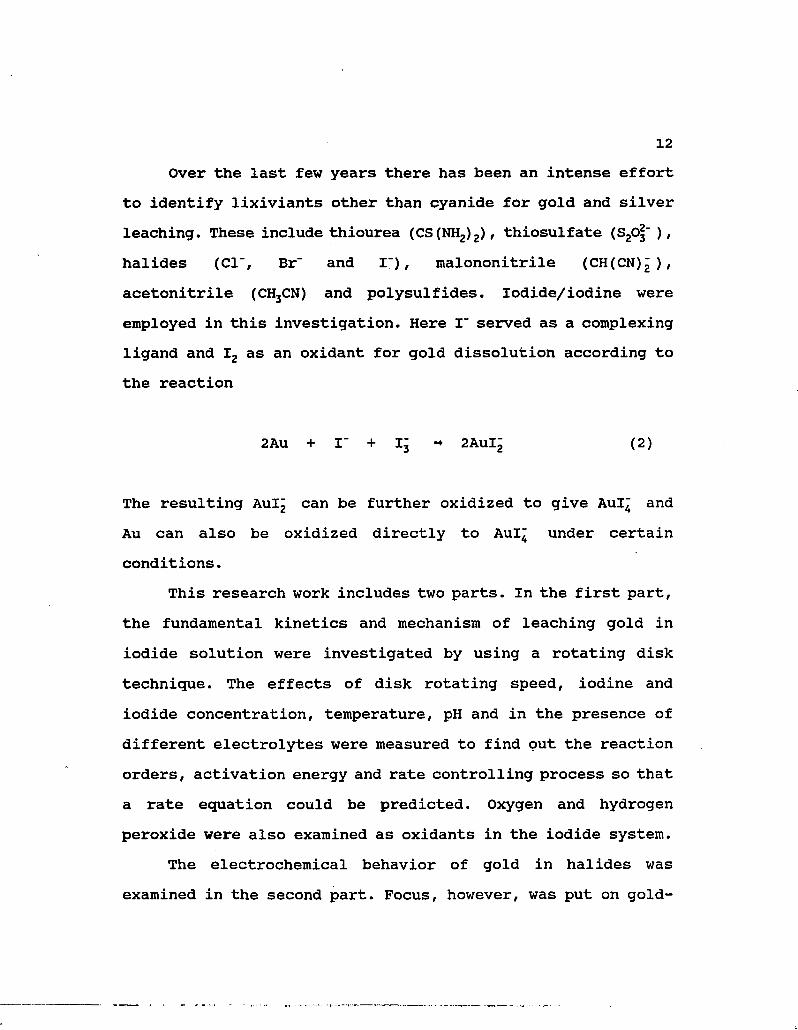
Over the last few years there has been an intense effort
to identify lixiviants other than cyanide for gold and silver
leaching. These include thiourea (CS(NH2)2), thiosulfate (S20§~ ),
halides (CI", Br" and I"), malononitrile (CH(CN)2),
acetonitrile (CH3CN) and polysulfides. Iodide/iodine were
employed in this investigation. Here I" served as a complexing
ligand and I2 as an oxidant for gold dissolution according to
the reaction
2Au + I" + IJ 2AUI2 (2)
The resulting Aulj can be further oxidized to give Aul^ and
Au can also be oxidized directly to Aul^ under certain
conditions.
This research work includes two parts. In the first part,
the fundamental kinetics and mechanism of leaching gold in
iodide solution were investigated by using a rotating disk
technique. The effects of disk rotating speed, iodine and
iodide concentration, temperature, pH and in the presence of
different electrolytes were measured to find put the reaction
orders, activation energy and rate controlling process so that
a rate equation could be predicted. Oxygen and hydrogen
peroxide were also examined as oxidants in the iodide system.
The electrochemical behavior of gold in halides was
examined in the second part. Focus, however, was put on gold-

13
iodide system. Cyclic voltammetry measurements were used to
distinguish and determine the oxidation capability and the
oxidation potentials for gold in iodide solutions. Linear
sweep voltammetry methods were employed to determine the
electrochemical nature of oxidation and reduction processes
for gold. The effects of disk rotating speed, sweep rate and
iodide concentration were the fundamental parameters
considered in this investigation. In addition, reduction of
iodine species at the gold electrode and aspect of mixed
halide systems were also studied.

14
CHAPTER TWO
LITERATURE REVIEW
2.1 Leaching Aspects of Gold
2.1.1 Dissolution Chemistry of Gold
Even though traditional cyanidation is still widely
practiced in commercial operations, its ineffectiveness in
treating some refractory ores and concentrates, the high
toxicity of cyanide and the problems of waste disposal
management have provoked the search for more powerful and non-
oxic ligands.
Gold is generally realized to be oxidized to gold(I)
and/or gold(III) complexes in the presence of a coordinating
ligand (X) [1]:
Au + 2X = Au X+ + e- (3)
Au + 4X = AuX;j+ + 3e" (4)
It is also possible to oxidize Au(I) to Au(III) in the
presence of these complexing ligands:
AuXj + 2X = AuXf + 2e~ (5)
15
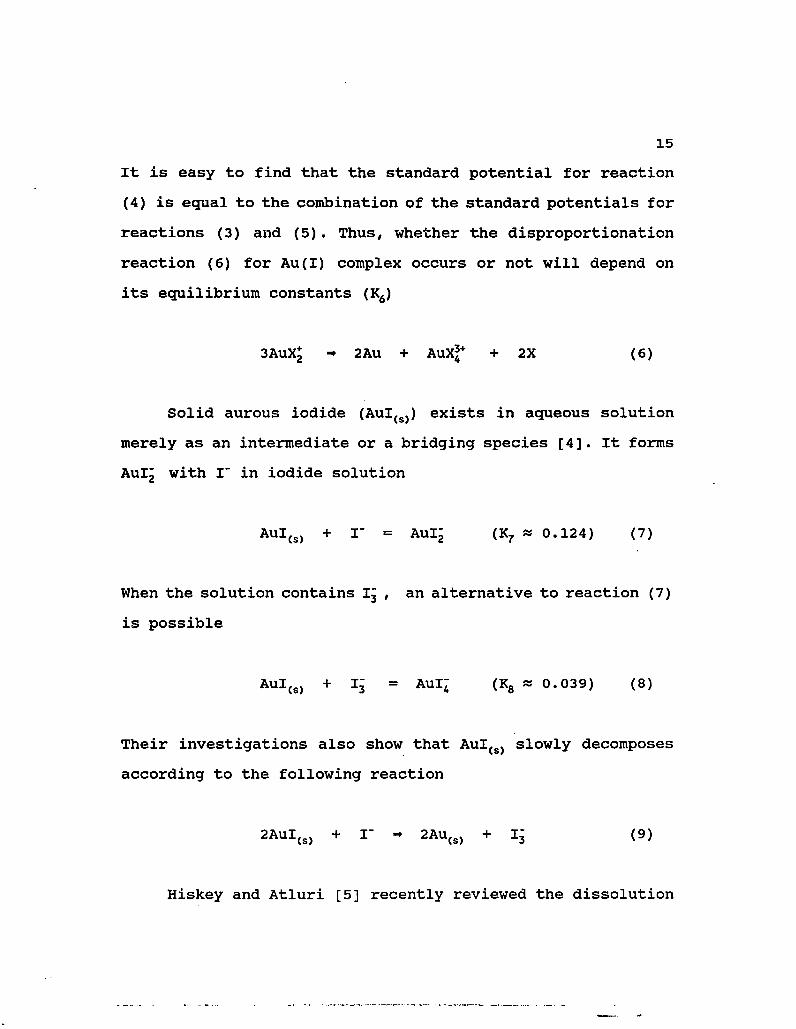
It is easy to find that the standard potential for reaction
(4) is equal to the combination of the standard potentials for
reactions (3) and (5) . Thus, whether the disproportionation
reaction (6) for Au(I) complex occurs or not will depend on
its equilibrium constants (K6)
3AuX* - 2Au + AuXf + 2X (6)
Solid aurous iodide (Aul(s)) exists in aqueous solution
merely as an intermediate or a bridging species [4]. It forms
Aulj with I" in iodide solution
Aul(s) + I" = Aul" (K7 « 0.124) (7)
When the solution contains Ij , an alternative to reaction (7)
is possible
Aul(s) + Ij = Aul" (K8 « 0.039) (8)
Their investigations also show that Aul(s) slowly decomposes
according to the following reaction
2AuI(s) + I" -» 2Au(s) + Ij (9)
Hiskey and Atluri [5] recently reviewed the dissolution

16
chemistry of gold and silver in different lixiviants. The
halides were shown to have special properties for the
processing of gold and silver ores and concentrates. Gold
forms both Au(I) and Au(III) complex ions with chloride,
bromide and iodide depending on solution chemistry conditions.
In aqueous solution, the stability of the gold-halide
complexes increases in the order CI" < Br" < I" which shows a
preference for gold to bond with large polarizable ligands.
They concluded that there are two important reasons to use
halides as lixiviants for gold; one is their extreme stability
in aqueous solution, and the other is that all are to some
extent soluble in water and can also serve as oxidants for
gold.
Finkelstein and Hancock [6] have analyzed the stability
of various gold complexes in terms of standard potential
diagrams for aurous and auric complexes. They demonstrated
that with CI", the stable species is the AuCl^ complex. On the
other hand, with I", the preferred species is the Aulj
complex. A borderline situation appears to exist with Br".
This behavior reflects that Au(I) has a greater affinity of
soft polarizable ligand than does Au(III) . They put both Au(I)
and Au(III) into B-type metal ions which means that the
stability of their complexes tends to decrease with increasing
electronegativity of the ligand donor atom. Thus, for halides,
the stability order follows CI" < Br" < I".

17
Bromide and iodide also exhibit the ability to form
polyhalide complexes [7, 8]. This characteristic promotes the
dissolution of Br2(liq) and I2(s) in aqueous solution. Iodine
reacts with iodide ion as follows:
^(s) = I2(aq) (10)
12<aq> + I = I3 (11)
The triiodide ion can serve as an oxidant for gold leaching
according to the following electrochemical reactions:
Au + 21" -» Aulj + e" anodic (12)
Ij + 2e" -» 31" cathodic (13)
2Au + I" + Ij -> 2AuIj overall (2)
2.1.2 Polyiodide Species
Iodine is generally viewed as dissolving in an aqueous
solution by the formation of polyiodide complexes.
Spectrophotometric studies have suggested the following
iodine/iodide complexation equilibria [9]:
2(aq)
I" + I
+ I"
3 r2-
*2 +
2i; r2-
(11)
(14)
(15)
(16)

18
In addition to these, Sillen and Martell [7] report the
possible presence of 1^ and l|~ . Among these reactions,
equilibrium constants of Kn = 7.14xio2 for reaction (11) and
K16 = 1.21 for reaction (16) have been reported by Latimer [8]
and estimated from the data provided by Sillen and Martell
[7], respectively. Sano et al. [9] also indicated that
reaction (14) occurs predominantly at very high ionic strength
and can be discared at low ionic strength. Reaction (15) can
be neglected from the possible origin of the relaxation since
the positive value of the enthalpy change results in the
decrease of iodine concentration with the increase of
temperature.
2.1.3 Bromide Leaching
Although the leaching of gold in bromide solution can be
traced back to 1882 [10], it has not been used widely because
of the problems of handling, high vapor pressure and corrosion
nature of liquid bromine. Other leaching processes using
halogens, halides or other halogen-bearing compounds [11-14]
were also reported to extract and recover precious metals from
ores.
Recently, Dadgar [15] developed a liquid bromine carrier
of considerably lower vapor pressure than liquid bromine and
used the bottle-roll-leach technique and agitation of the
slurry for cyanide and bromide leaching tests. The same gold

19
extractions (94-96%) were achieved for 24-48 hour cyanide
leaching (Ixi0"2-4xi0"2 M NaCN) and 6 hour bromide leaching
(2.5xl0-2 M Br2 and 0-l.6xl0~1 M NaBr) on two samples of
Canadian flotation concentrate. In addition, 99.9% or more
gold recoveries were obtained from bromide pregnant solutions
using carbon absorption, ion exchange and zinc precipitation
methods respectively. Furthermore, almost the same cost for
chemicals was estimated for cyanidation and bromine leaching.
2.1.4 Iodide Leaching
McGrew and Murphy [16] proposed the use of an I"
containing electrolyte to leach gold ores. An iodine lixiviant
is added to an ore containing iodine reducing components. As
iodide ion increases in the lixiviant, it is possible with
continued addition of iodide to achieve the desired
concentration for leaching gold. This is made possible by the
complexation of I2 with I" to form the polyiodide species. They
report that the initial solubility of iodine is about 1.2xio-3
M and that the desired concentration of about 1.2xio"2 M could
be attained by solution recycle. In a column experiment, 80%
of the gold in a marcasite ore was recovered by iodine
leaching. It should be noted that gold did not start to
dissolve until a sufficient concentration of iodine species
remained in solution.
Murphy [17] further reported treatment of the loaded
20
solution in an electrolytic cell to deposit gold at a cathode,
and then convert the iodide to iodine at an anode to
regenerate the leaching solution after leaching of gold ores
with an iodide-iodine solution.
2.2 Potential-pH Equilibrium Diagrams
Oxidation potential-pH (Eh-pH) equilibrium diagrams
provide a starting point for the study and interpretation of
electrochemical reactions, although whether real reactions
take place readily or not will depend on kinetic factors.
These diagrams for gold in different lixiviant system have
been systematically summarized [5].
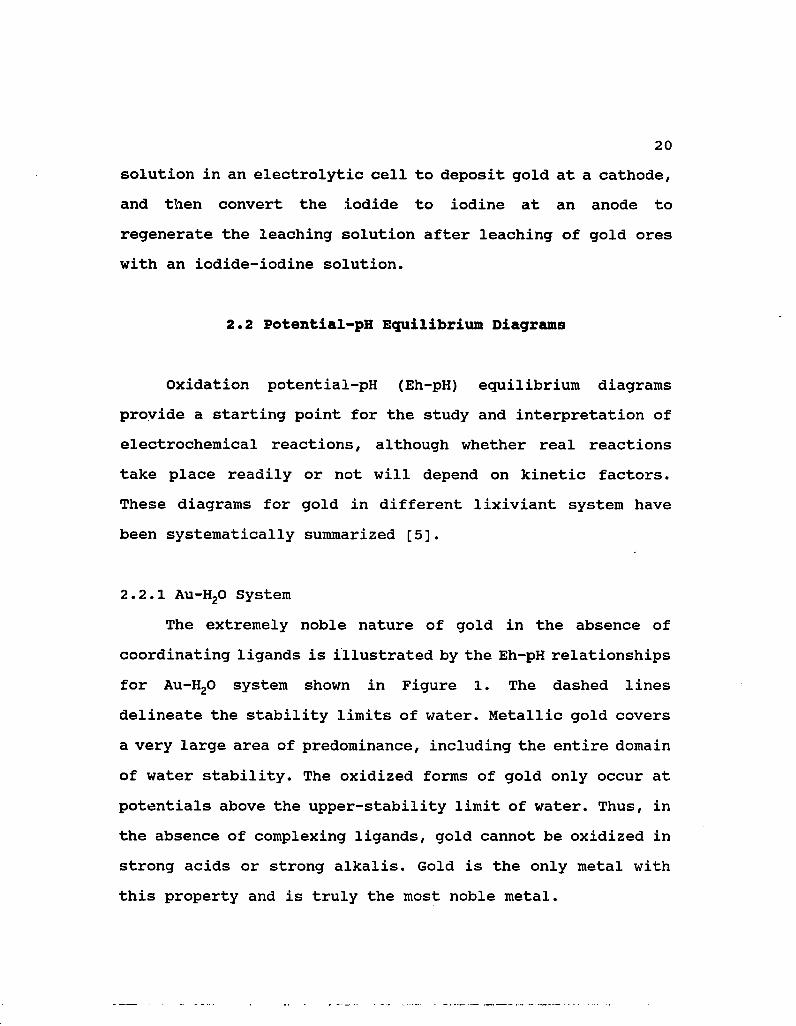
2.2.1 AU-H20 System
The extremely noble nature of gold in the absence of
coordinating ligands is illustrated by the Eh-pH relationships
for AU-H20 system shown in Figure 1. The dashed lines
delineate the stability limits of water. Metallic gold covers
a very large area of predominance, including the entire domain
of water stability. The oxidized forms of gold only occur at
potentials above the upper-stability limit of water. Thus, in
the absence of complexing ligands, gold cannot be oxidized in
strong acids or strong alkalis. Gold is the only metal with
this property and is truly the most noble metal.
21
Au(OH),
HAuO
Figure 1 Potential-pH equilibrium diagram for the gold-water system for dissolved gold species of 10"4 M (after ref. 5).

22
2.2.2 AU-C1~-H20 System
In the presence of coordinating ligands, the Eh-pH
diagrams for gold are very different. Figure 2 depicts the
effect of the additional 10~2 M CI" to the Au-H20 system. The
shaded area shows the region of the water domain occupied by
dissolved gold species. Hence, gold can exist in an oxidized
form (AuCl^ complex) in chloride solution under highly acid
conditions. On the other hand, there is no region of
thermodynamic stability for AuClj at this concentration.
Increasing the chloride concentration to 0.1 M, a region for
AuClj would appear in the Eh-pH diagram.
2.2.3 Au-Br"-H20 System
The Eh-pH behavior for gold in 10~2 M Br" is presented in
Figure 3. This diagram expresses the existence of both AuBrj
and AuBr^ complexes. In addition, a larger region of stability
for AuBr^ is evident compared with that for AuCl^ .
2.2.4 AU-I"-H20 System
The Eh-pH behavior of the AU-I"-H20 system is given in
Figure 4 for 10~2 M I". This diagram illustrates that metallic
gold is oxidized in the presence of iodide to yield both Aulj
and Aul^ complexes. By comparison, it is not difficult to find
that the gold iodide system has the largest stability region
for both Au(I) and Au(III) complexes, and the stability area

23
AuO: 2.0
Au(OH) AuCl 1.5
1.0
0.5
0.0
0.5 2 0 2 4 6 6 10 12 14 16
Figure 2 Potential-pH equilibrium diagram for the gold chloride system for [Au] = 10"5 and [CI] = 10"2 M (after ref. 5).

24
AUO; 2.0
Au(OH)J 1.5
HAuO AuBr
1.0
AuBr
0.5
0.0
0.5 2 0 2 4 6 8 10 12 14 16
Figure 3. Potential-pH equilibrium diagram for the gold bromide system for [Aul = io-5 and TBrl = 10"2 M (after ref. 5).

25
,Au02, 2.0
1.5
HAuO*" 1.0
0.5 Aui;
0.0
-0.5 1 1 1 I J I i I ~2 0 2 4 6 8 10 12 14 16
Figure 4 Potential-pH equilibrium diagram for the gold iodide system for [Au] = 10"5 and [I] = 10"2 M (after ref. 5).

26
for Aulj extends upto about pH 12. Therefore, of the halogens,
the gold iodide complexes are the most stable in aqueous
environments.
2.3 Electrochemical Behavior of Gold
There are two important characteristics to study
electrochemical electrode processes. One is that the
activation energy of the reaction step with regard to charge
transfer depends on the potential difference between the
electrode and the solution, which was first recognized by
Ergey-Gruz and Volmer [18]. The other is that the rate of an
electrochemical reaction is dependent on the structure of the
double layer at the electrode surface since it affects the
distribution of ion concentration and electric potential near
the electrode. This was stated by Frumkin [19].
To discuss current density-potential (i-E) curves, Kiss
[20] described two cases often seen for anodic dissolution of
metals; after a current density reaches a certain extent, it
then drops because of passivation on the electrode surface or
hits the limiting current density in which the dissolution
rate is controlled by diffusion.
A number of investigators have studied the fundamental
electrochemistry of gold using chloride and sometimes bromide
as complexing lixiviants [21-31]. However, only limited work

27
has been devoted to the basic electrochemistry of gold
oxidation in iodide solution. In addition, the results for
anodic dissolution and the explanation offered are somewhat
inconsistent.
2.3.1 Electrochemical Behavior of Gold in Chloride Solutions
As summarized by Nicol [21-22], cyclic voltammograms for
gold in the presence of only acidic and alkaline electrolyte
media are generally similar and voltammograms for gold in
chloride solution indicate a rise in anodic current density at
about 1.0 V followed by passivation which is believed to be
caused by the formation of an oxide film on the electrode.
Oxygen and chlorine evolution take place at potentials higher
than 1.6 V.
Just and Landsberg [23] studied the anodic passivation of
gold in hydrochloric acid using galvanostatic and
potentiostatic methods and a rotating disk electrode, and
showed that the passivation time for gold was determined by
transport processes.
Heumann and Panesar [24] determined analytically the gold
species resulting from electrochemical oxidation in sodium
chloride to be both Au(I) and Au(III) species for potentials
below 1.2 V. At potentials between 1.2 and 1.4 V, a plateau
region was found where the reaction is controlled by diffusion
of chloride ions to the gold surface. Then at approximately

28
1.5 V, passivation was observed due to the formation of an
oxide layer. Oxygen evolution started at about 1.6 V.
Gaur and Schmid [25] produced cyclic voltammograms of
gold in 2X10"4 to lxio-2 M KC1 solutions containing 10"1 M HCIO^.
A current peak at about 1.2 V was attributed to the oxidation
of Au to Au(III). Its height was dependent on the chloride
concentration and its position was independent of chloride
concentration indicating that it was the formation of
"adsorbed oxygen" on the electrode surface, which prevented
further dissolution of gold as Au(III). On the reverse scan,
this film was removed at about 0.9 V. In addition, this
passive film was stable for 13 hours at 10"2 M KCl and at 1.1
V.
Gallego et al. [26] defined the anodic current peak for
cyclic voltammograms of gold in concentrated HCl solutions as
the electro-dissolution of gold to Au(I) and the cathodic
current peak as the electro-deposition of the dissolved Au(I).
The proposed mechanism did not involve the direct oxidation of
Au(I) to Au(III), but incorporated an improbable
disproportionation step for adsorbed Au(I).
Podesta and co-workers [27] found that AuClj was the
electro-dissolution species of gold. Its reaction was
diffusion controlled and an oxide layer formed when the
solution was depleted of CI" ion. This oxide layer caused the
anodic current drop and the passivation of electrode. As Cl"
29
diffused backwards, the oxide layer dissolved.
Frankenthal and Siconolfi [28] discussed the normal shape
of the steady-state i-E curves for gold in chloride solutions
as shown in Figure 5 and divided them into five potential
regions: active, prepassive, prepassive-to-passive transition,
passive and transpassive. The gold dissolution rate was
independent of pH at pH > 1.5 and increased remarkably with
the decrease of pH at pH < 0. In the active region, gold
anodically dissolved to Au(I) and then to Au(III) . Diffusional
limiting current densities caused by chloride ion depletion at
the anode surface were observed only at [Cl~] > 0.1 M. In the
prepassive region, a film of an oxide or hydroxide of gold was
found. In the prepassive-to-passive transition region, an
oxide or adsorbed oxygen film was formed. In the passive and
transpassive region, the gases Cl2 and 02 were evolved.
Benari and co-authors [29] showed that the current
increased almost linearly with potential and no passivation
existed for linear sweep voltammetry for gold in
chloride/dimethylsulfoxide solution, which differed from that
observed in water/chloride solution.
Nicol and Schalch [21, 30-34] reviewed and made a
detailed study of the dissolution and passivation of gold in,
chloride solutions. They [30] found that the dissolved Au(III)
species increased with potential, and decreased with the
increase of chloride concentration and with the decrease of

30
§ §
O SAI'O NOtt • 1M NOCi O CUM NOCI
Qt 10 12 POTENTIAL, VOLTS Vt SCC.
It II
Figure 5 Current density and potential curves for gold in unstirred NaCl solutions (after ref. 28).

31
rotating speed at all potentials. The Au(I) appeared as an
intermediate species which could be further oxidized to
Au(III) or could diffuse away from the electrode into the bulk
solution. The dissolution rate for Au(I) also increased with
the increase of chloride concentration and the
disproportionation rate for Au(I) was negligible. They [31-32]
also found that cyclic voltammograms of gold (at 20 mV/s) in
10"3 M NaCl resulted in an anodic oxidation peak followed by
passivation and a cathodic reduction peak on the reverse scan.
In 10"2 M NaCl, however, reactivation instead of cathodic peak
was obtained, which indicated that no oxide existed, as shown
in Figure 6. The reactivation of the electrode, which occurred
at potentials close to those at which passivation occurred
during the reverse scan, was possibly caused by quick
dissolution of the oxide film in high concentration of
chloride. Furthermore, cyclic voltammograms of gold (at 5
mV/s) at lower concentrations of hydrochloric acid exhibited
typical diffusion-controlled behavior at high potentials. The
height of this diffusional region was dependent on the
agitation, and was about proportional to the concentration of
HC1, which indicated that diffusion of chloride ions to the
electrode surface limited the dissolution rate. The height of
this diffusional region was not affected notably by
temperature. There was no big difference between cyclic
voltammograms using sodium chloride and hydrochloric acid.

32
1M HOO. 1M HCKfc AND V'MNaa 1M HCKfc ANO « ' M NtCI
/' .-•""'x 1*1
1.2
POTENTIAL V
Figure 6 Cyclic voltairnnograms at a sweep rate of 20 mV/s and at a rotaint gold-disk electrode of 600 rpm in various solutions (after ref. 32).

33
They [34] also showed, after studying the cathodic deposition
of gold, that the deposition of gold from Au(I) in chloride
solutions was favored both thermodynamically and kinetically
over that from Au(III), and passivation caused by the
formation of oxides on the electrode could be prevented by low
anodic current density, high temperature and high chloride
concentration.
2.3.2 Electrochemical Behavior of Gold in Bromide Solutions
Gaur and Schmid [25] reported a cyclic voltammogram for
gold in 4xio-4 M KBr containing 10"1 M HC104 and using a
relatively fast scan rate (40 mV/s). This scan showed a rise
in current density indicating the oxidation of Au to AuBr^ and
no passivation on the gold electrode up to 1.4 V.
Nicol [21] conducted some experiments using a gold disk-
platinum ring electrode in bromide solution. The results
showed that the general shape of curves for gold oxidation in
bromide was similar to that in chloride solution and that
Au(I), Au(III) and bromine were all produced during anodic
oxidation.
2.3.3 Electrochemical Behavior of Gold in Iodide Solutions
Nicol [21] predicted that the electrochemical behavior of
gold in iodide solution would be similar to that in bromide
solution with possible passivation by insoluble Aul.
34
Gold-iodide complexes on the surface of a gold electrode
were analyzed using Surface-Enhanced Raman Spectroscopy (SERS)
during anodic oxidation [35-36]. Loo [35] concluded that Aulj
was the predominant species at potentials < 0.5 V and Aul^
prevailed at potentials > 0.7 V. The similar phenomena were
also detected in chloride and bromide solutions. Based on
these results, the following mechanism for the
electrochemistry dissolution of gold in aqueous solutions
containing halide ions was proposed:
Au + X" = (AuX~) ad (17)
(AuX") ad + X" = (AuX")ad + e" (18)
(AuXj )ad = AuXj (dissolution) (19)
(AuX")ad + 2X" = (AuX')ad + 2e" (20)
(AuX^ )ad = AuX^ (dissolution) (21)
where X represents CI, Br or I.
Tadayyoni et al. [36] pointed out that iodide formed an
irreversibly adsorbed and electro-inactive layer on gold in
dilute iodide concentration (10~3 M) . They also pointed out
that thick insoluble iodine films (>10-100 nm) were formed on
the gold electrode at higher iodide concentrations where the
iodine generated exceeded its solubility. Thus, the solid
iodine rather than triiodide is the main surface product at
the electrode surface.
35
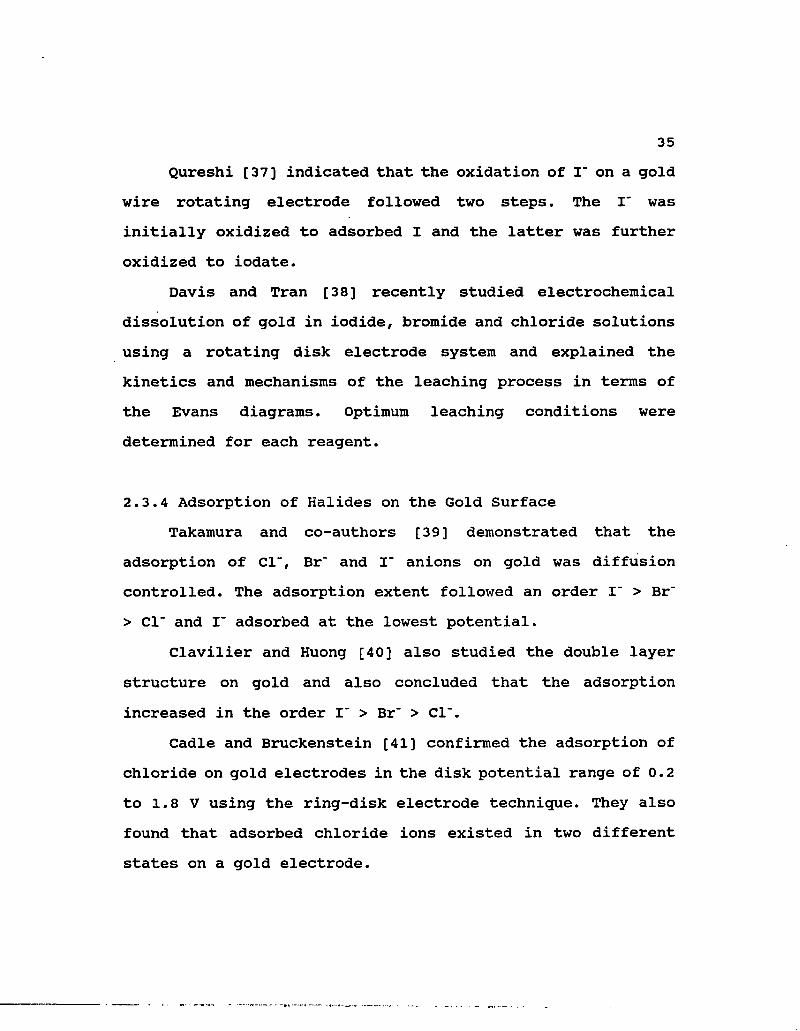
Qureshi [37] indicated that the oxidation of I- on a gold
wire rotating electrode followed two steps. The I~ was
initially oxidized to adsorbed I and the latter was further
oxidized to iodate.
Davis and Tran [38] recently studied electrochemical
dissolution of gold in iodide, bromide and chloride solutions
using a rotating disk electrode system and explained the
kinetics and mechanisms of the leaching process in terms of
the Evans diagrams. Optimum leaching conditions were
determined for each reagent.
2.3.4 Adsorption of Halides on the Gold Surface
Takamura and co-authors [39] demonstrated that the
adsorption of CI", Br" and I" anions on gold was diffusion
controlled. The adsorption extent followed an order I" > Br"
> CI" and I" adsorbed at the lowest potential.
Clavilier and Huong [40] also studied the double layer
structure on gold and also concluded that the adsorption
increased in the order I" > Br" > CI".
Cadle and Bruckenstein [41] confirmed the adsorption of
chloride on gold electrodes in the disk potential range of 0.2
to 1.8 V using the ring-disk electrode technique. They also
found that adsorbed chloride ions existed in two different
states on a gold electrode.

2. 4 Rotating Disk Electrode
36
The rotating disk electrode theory which was first
described by Levich in 1942 [42-43] has been discussed at
length by several literature [44-47], It is quite easy to
construct and compose a disk of the electrode material
imbedded in a rod of an insulating materials. It is also easy
to clean the electrode surface by polishing without changing
its geometry, and also simple to change the experimental
conditions by variations in the rotating rate. The liquid flow
and the mass transport in solution are the two principal
factors affecting the performance of the electrodes [44].
Riddiford [45] discussed as many as twelve types of the
experimental electrodes. However, in practice the shape of
electrodes is usually not bothersome except perhaps at high
rotating rates which may cause turbulence and vortex formation
[46].
Some of the papers [44-45] also discussed the
applications of disk electrodes. These involve the measurement
of diffusion coefficients, the studies of electrode volume
reaction kinetics (including preceding, parallel and follow-up
chemical reactions). Others include electro-deposition, the
dissolution of metals in corroding media and the molten salt
system and so on.

37
CHAPTER THREE
EXPERIMENTAL PROCEDURE
3.1 Experimental Preparations
The rotating disk technique was employed as a fundamental
method for the leaching and electrochemical tests. Two grams
of gold high purity powder which was obtained from D.F.
Goldsmith Chemical & Metal Corp. was used to make the gold
pellet. The flat pellet was formed in a 1.27 cm diameter
pressure mold at a total pressure of 20,000 pounds per square
inch. The calculated density of pellet was approximately 17.6
g/cm3 compared with the theoretical density for gold of 19.3
g/cm3. The pellet was then sealed in a Teflon holder which
could be screwed on the Analytical Rotator (Model ASR2 of Pine
Instrument Co.) so that only one surface of the pellet was
exposed to solution. Conducting silver paste was used to
connect the gold pellet and the holder. The total resistance
of the assembly was measured to approach to zero. Figure 7 is
a schematic illustration of the gold rotating disk used in
this study.
The surface of gold pellet was carefully polished on 600-
grit silicon carbide paper and thoroughly rinsed prior to each
test. All chemicals used in this research were of reagent-

38
metallic rod
Ag paste
Au pellet .teflon shroud
Figure 7 Schematic illustration of the gold rotating disk.
39
grade quality. Distilled-deionized water was used to prepare
the required solution.
Leaching solutions were made up by adding sodium iodide
into small amount of the distilled-deionized water first and
solid iodine was then added into the solution. After the
solution was filled to the required amount, a stirring bar was
used to aid the dissolution of solid iodine which is difficult
to dissolve in aqueous solutions.
Pure oxygen was used in the test requiring oxygen sparge.
For those tests examining the effect of pH, solution pH
adjustments were made with additions of sulfuric acid and
sodium hydroxide.
3.2 Leaching Test
3.2.1 Apparatus
Leaching reaction was carried out in a 500-ml round-
bottom reaction flask with three angled necks. Samples were
withdrawn at regular intervals for analysis. These samples
were analyzed using a Perkin-Elmer (model 273) Atomic
Absorption Spectrophotometer.
To study the effect of temperature, a constant
temperature water bath/circulator was employed which
circulated water through a jacketed reaction flask.
Figure 8 is the schematic diagram of the reaction

40
Analytical Rotator
1—1
r-
Jacket, Reactor L J f Water
Constant Temperature
Bath f. Au Pellet / / (r=6.35mm) /
/ Solution /
•//, Wafer/// Circulator
Figure 8 Schematic representation of reaction apparatus for leaching cell.

41
apparatus.
3.2.2 Conditions
The leaching experiments were carried out under the
following conditions, which were maintained constant except
for the studied or indicated parameters:
Solution: lxlO"2 M Nal & 5xl0"3 M I2
Temperature: room temperature (23°C)
Rotating Speed: 500 rpm
Time: 6 hours
pH: 4—6 (natural pH)
3.3 Electrochemical Tests
3.3.1 Apparatus
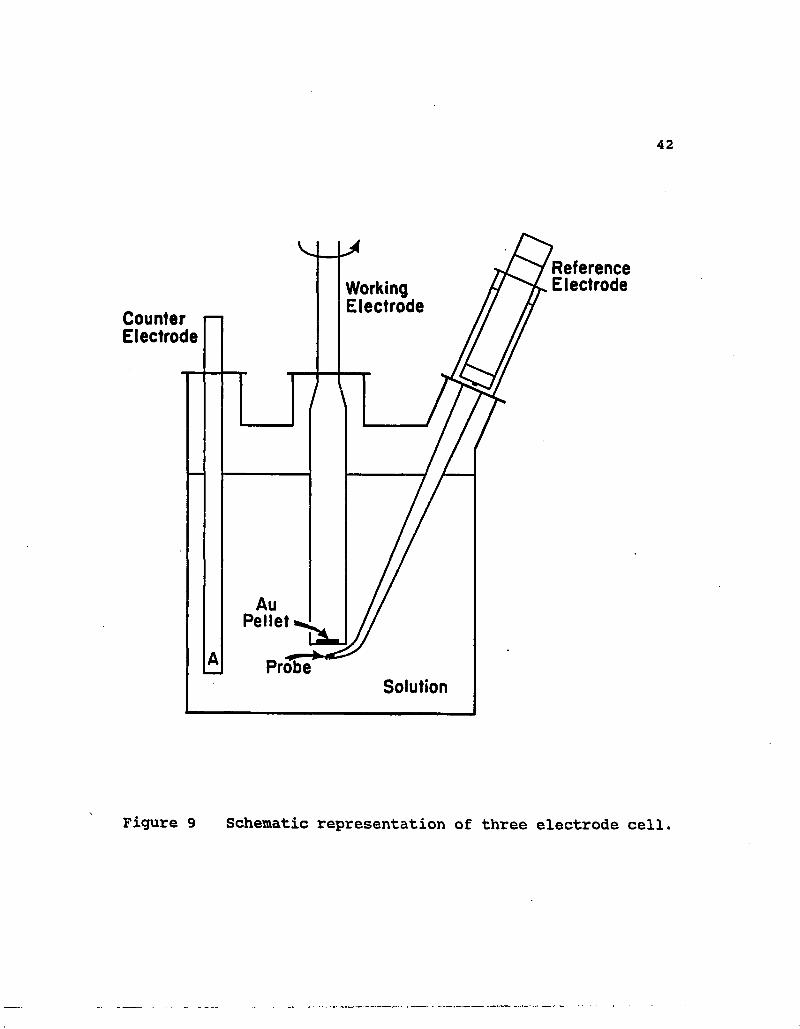
A conventional three-compartment cell was employed for
electrochemical measurement during this study as shown in
Figure 9. The cell consisted of a gold-rotating disk working
electrode (RDE), two graphite rods as the counter-electrodes,
and a saturated calomel electrode (SCE) as a reference
electrode with the end of the Luggin capillary tube positioned
directly below the surface of the gold disk. A potentiostat
(PAR Model 273) was used to set and control the
electrochemical conditions and current-potential curves were
42
Reference Electrode Working
Electrode Counter Electrode
Au Pellet
Probe Solution
Figure 9 Schematic representation of three electrode cell.

43
recorded on an X-Y recorder (Houston Instrument Model 200).
3.3.2 Conditions
All potentials reported in this paper are with respect to
the SCE scale. Sodium sulfate or perchloric acid was added to
the halide solutions to establish the ionic strength of these
solutions. All scans were started at the corresponding rest
potentials.
All of the electrochemical experiments were carried out
at room temperature (23°C) and at natural pH (6.2-6.5 for
Na2S04 containing solutions and < 0 for HC104 containing
solutions) . A disk rotating speed of 500 rpm was used for most
of the experiments and disk rotating speeds from 200 to 700
rpm were used for the tests of the anodic oxidation of gold as
a function of disk rotating speed. A stirring bar was also
employed to perform some early tests.
The tests for cyclic voltammetry and for linear sweep
voltammetry were conducted at sweep rates of 20 and 1 mV/s,
respectively. Sweep rates ranging from 1 to 200 mV/s were used
to investigate the tests of the anodic polarization of gold as
a function of sweep rate.

44
CHAPTER FOUR
RESULTS AND DISCUSSION
4.1 Leaching Kinetics
Dissolution of gold in iodide proceeds by the following
reaction:
2AU + I" + Ij = 2AuI" (2)
As shown iodide and iodine are consumed during the course of
this reaction. The dissolution experiments were carried out
with negligible changes in the bulk concentration of iodide
and iodine. As predicated from the general reaction, the
amount of gold dissolved from a rotating disk of constant area
should vary as a linear function of time. Linear rate
constants having the units (/xmol/cm2 hr) were determined from
the slopes of these plots.
4.1.1 Xg/Xj Solution Chemistry
A series of polyiodide complexes exist in iodine/iodide
solutions as discussed in 2.1.2. Unfortunately, thermodynamic
data are extremely scarce for the polyiodide complexes.
Latimer [8] gives an equilibrium constant of = 7.14xio2 for
45
reaction (11) and it is possible to calculate a value of K16
= 1.21 from the data provided by Sillen and Martell [7].
I" + I2 «• Ij (K„ = 7.14X10²) (11)
<6~ <K16 21; - l!" (K.. - 1.21) (16)
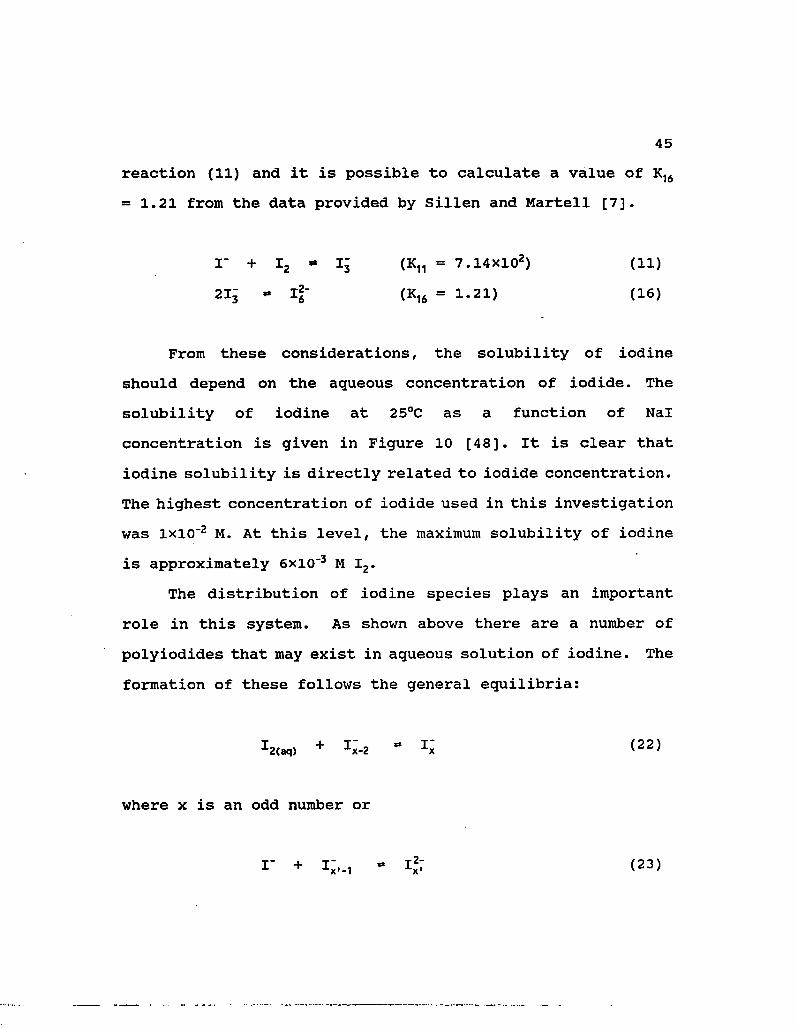
From these considerations, the solubility of iodine
should depend on the aqueous concentration of iodide. The
solubility of iodine at 25°C as a function of Nal
concentration is given in Figure 10 [48]. It is clear that
iodine solubility is directly related to iodide concentration.
The highest concentration of iodide used in this investigation
was lxio-2 M. At this level, the maximum solubility of iodine
is approximately 6xio-3 M I2.
The distribution of iodine species plays an important
role in this system. As shown above there are a number of
polyiodides that may exist in aqueous solution of iodine. The
formation of these follows the general equilibria:
*2<aq) + " K <22>
where x is an odd number or
I + IxM ** Ixi (23)

10
\ o E E
i—i
i i
0 2 4 6 8 10 12 14 16 18 20
[ Nal ] (mmol/l)
Figure 10 Solubility of iodine at 25°C as a function of sodium iodide concentration.

47
where x* is an even number. It can be seen that the formation
of the monovalent poly iodide complexes (I~ ) involves reactions
with I2(aq) while formation of the divalent polyiodide (1*7)
complexes requires I". With available thermodynamic data, it
is possible to calculate distribution of species relationship
for I", I2<aq)' and *6 • other species can be considered
negligible according to mass action consideration and the fact
that in our study dilute concentration of both I" and I2 were
utilized.
The distribution of I2(aq) and Ij as a function of iodide
concentration is provided in Figure 11. At lxio-2 M I", the
triiodide species is the predominant form in aqueous solution.
4.1.2 Effect of Disk Rotating Speed
Gold dissolution rate was determined as a function of
disk rotating speed in solution containing lxio-2 M I" and
5xio~3 M I2> Linear dissolution rates were observed for
rotating speeds from 400 to 1800 rpm as shown in Figure 12.
Levich derived the following mass flux expression for
hydrodynamic convective diffusion in liquids [49]:
j = 0.62 Dz/3 (<>1/2 V'1/6 C0 (24)
where j is the mass flux (mol/cm2 sec) , D is the diffusion
coefficient (cm2/sec) , v is the kinematic viscosity (cm2/sec) ,
48
.0
0.8
0.6
0.4
0.2
0.0 -1 0 -4 -3 -2 -5
log [ I ]
Figure 11 Distribution of I2(aq) and I3 as a function of iodide concentration.

49
• 1800 rpm • 1200 a 1000 A 800 • 600 o 400
3 4
Time (hrs)
Figure 12 Gold dissolution at various disk rotation speeds using 10"2 M I" and 5x10 M I2.
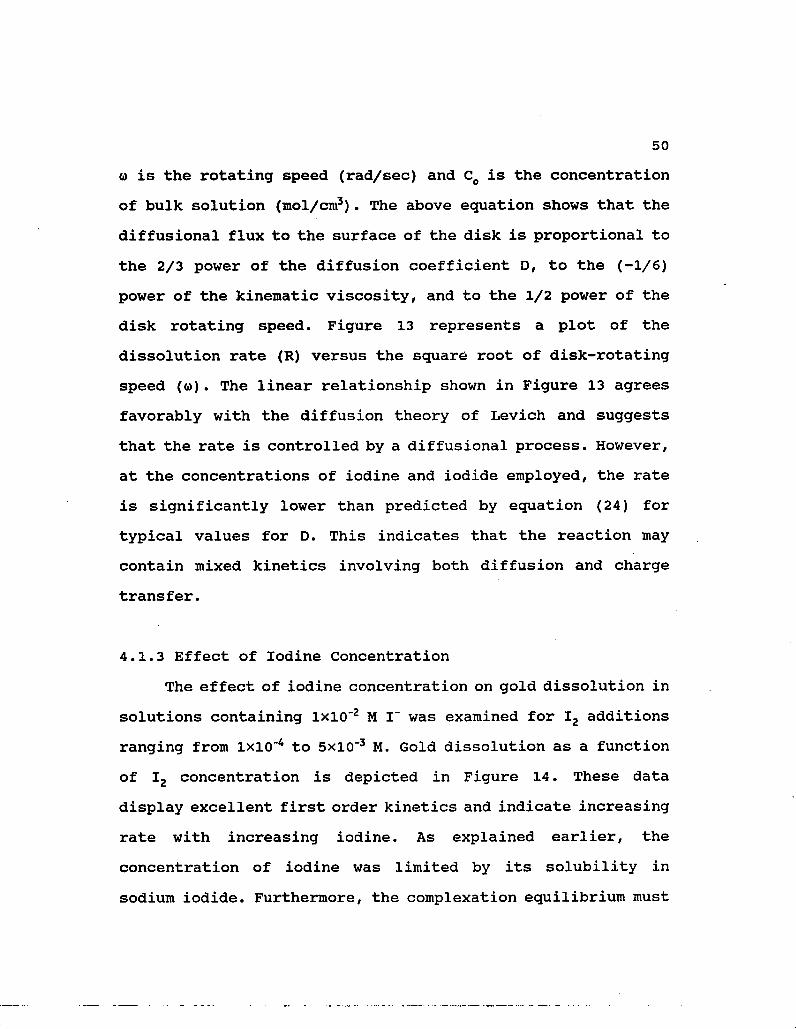
50
o) is the rotating speed (rad/sec) and C0 is the concentration
of bulk solution (mol/cm3) . The above equation shows that the
diffusional flux to the surface of the disk is proportional to
the 2/3 power of the diffusion coefficient D, to the (-1/6)
power of the kinematic viscosity, and to the 1/2 power of the
disk rotating speed. Figure 13 represents a plot of the
dissolution rate (R) versus the square root of disk-rotating
speed (o). The linear relationship shown in Figure 13 agrees
favorably with the diffusion theory of Levich and suggests
that the rate is controlled by a diffusional process. However,
at the concentrations of iodine and iodide employed, the rate
is significantly lower than predicted by equation (24) for
typical values for D. This indicates that the reaction may
contain mixed kinetics involving both diffusion and charge
transfer.
4.1.3 Effect of Iodine Concentration
The effect of iodine concentration on gold dissolution in
solutions containing lxio-2 M I" was examined for I2 additions
ranging from lxio-4 to 5xio~3 M. Gold dissolution as a function
of I2 concentration is depicted in Figure 14. These data
display excellent first order kinetics and indicate increasing
rate with increasing iodine. As explained earlier, the
concentration of iodine was limited by its solubility in
sodium iodide. Furthermore, the complexation equilibrium must
51
20
1 6 • 1x10 2 M Nal 5x10"3 M lo
CN
E 12 o
o E 3 0) a a:
8 •
8 10 12 14 16
CJ1/2 (s"1/2)
Figure 13 Gold dissolution rate plotted against the square root of disk rotation speed.

52
70
1x10~2 M Nal 60 N <N E \ 50
40 2.5x10
30
20
5x10~4
0 m i —I 1 1 1 j 1
0 1 2 3 4 5 6 7 8
Time (hrs)
Figure 14 Effect of I2 concentration on the dissolution of gold in 10"2 M Nal.

53
be considered in determining the distribution of oxidant
species. The concentration of iodide/iodine species is given
in Table 1 for various concentration of I2(s) added to a
solution containing 10"2 M Nal. Also provided in Table 1 are
dissolution rates as a function of I2 concentration. The
concentration of Ij is approximately 5 times greater than I2(s)
for these conditions. A reaction order plot was determined for
Ij for I2(aq) concentrations of lxio"3, 5xio~4 and lxio"4 M.
Iodide concentration remains essentially constant in this
range. This plot is shown in Figure 15 and yields a slope of
0.96. A first order dependence on Ij is indicated by these
results. It should be noted that a first order dependence on
12<aq> also obtained for the reaction at these conditions.
In some early experiments, the effect of oxidants other
than iodine was investigated using a stationary disk and a
stirring bar for agitation. Oxygen and hydrogen peroxide are
compared in Figure 16 with different iodine concentrations in
solutions containing lxio-2 M Nal. These results show that
almost no gold was dissolved using either a 1 atm P02 sparge
or 2xio-2 M hydrogen peroxide solution. Unlike conventional
cyanidation, which is characterized by relatively low
oxidation potentials and the use of air in the oxidation
process, leaching gold in iodide requires more aggressive
oxidants. Even at low concentrations of iodine, measurable
levels of gold are found to dissolve. It should be noted that

54
Table 1: Distribution of Iodine Species as a Function of l2
Nal
(M)
(̂s)
(M)
Rate*
(R)
m ] (M)
[I"]
(M)
[I2]
(M)
ciS"]
(M)
10"2 5X10"3 8.71 4 • 02X10"3 5. 94X10-3 9. 48X10' -4 1. 96X10 -5
10"2 2.5X10"3 5.58 2 . 13xl0"3 7. 86X10"3 3. 80x10" -4 5. 49x10" -6
10"2 1X10"3 4.04 8 .73x10"* 9. 13X10"3 1. 34X10 -4 9. 22X10 -7
10-2 5X10"4 2.10 4 .42X10"4 9. 56X10"3 6. 48X10' -5 2. 36X10" -7
10"2 lxlO"4 0.47 9 .35X10"5 9. 91X10"3 1. 32X10 -5 1. 06X10" -8
* Dissolution rate (nmol/cm2 hr).

55
0.7
slope = 0.96 0.1
-0.2
-0.5 i
-4.5 -4.0 -3.5 -3.0 -2.5
log [ I3 ]
Figure 15 Reaction order plot for Ij.

56
the experiments employing lxio-2 and 2xio~2 M I2 were above the
solubility limit of iodine at lxio"2 M Nal. The lower rate
observed for 5xio-3 M I2 in Figure 16 as compared to that in
Figure 14 is attributed to the decreased hydrodynamic
efficiency of the system using the stirring bar.
4.1.4 Effect of Iodide Concentration
The effect of iodide concentration on gold dissolution
was investigated for a fixed iodine concentration. In this
series of experiments, Nal additions ranging from 10~3 to 10~2
M were used. Gold dissolution as a function of Nal
concentration is provided in Figure 17. The rate was observed
to increase with increasing Nal concentration. The
concentration of iodide/iodine species is given in Table 2 for
the conditions employed in this series of tests. A reaction
order plot is shown for I" in Figure 18. The slope of this
line is 0.52 which indicates a half-order dependence on I" for
the leaching reaction. This suggests that an electrochemical
process other than just diffusion may involve in the reaction.
4.1.5 Effect of Electrolytes
Gold dissolution using lxio-2 Nal and 5xi0"3 M I2 was
examined with different concentrations of sodium sulfate and
sodium chloride. These results are summarized in Table 3. The
rate of gold dissolution is relatively insensitive to sodium

57
A 2x10~"2 M I,
a 1x10 -2
• 5x10 -3
O2x10~3
—m HP2 or Q2
4 5 6 7 8 9 10 11
Time (hrs)
Figure 16 Effect of I2 concentration on the dissolution of gold from a stationary disk using a stirring bar for agitation.

58
40
CM E 30 o
20
10
t 1 r
1x10~3 M I,
—i r
Nal
A 1x10—2 M
5x10 -3
2x10
1x10
-3
-3
0 1 2 3 4 5 6 7 8 9 1 0 1 1
Time (hrs)
Figure 17 Effect of I" on the dissolution of gold in the presence of 10"3 M I2.
59
Table 2: Distribution of Iodine Species as a Function of Nal
Nal
(M)
-̂ (s)
(M)
Rate*
(R)
3
(M)
[i"]
(M)
[I2]
(M)
CI|- 3
(M)
lxicr2 10"3 3.94 8 .73x10"* 9. 13X10"3 1. 34X10 -4 9 .22X10"7
5X10"3 10"3 2.86 7 .62x10"* 4. 24X10"3 2. 52X10' -4 7 .03X10"7
2X10"3 10"3 1.51 5 . 35x10"* 1. 46X10"3 5. 13X10 -4 3 .46xl0"7
lxlO"3 10"3 1.02 3 .48x10"* 6 • 52x10"* 7. 48X10" -4 1 .47X10"7
* Dissolution rate (/xmol/cm2 hr) .

60
1.0
0.5 u 0 01 u*
_o
0.0
-0.5 -3.5 -3.0 -2.5 -2.0 -1.5
log [ r ]
Figure 18 Reaction order plot for I".
t 1 T
slope = 0.52
J L

61
Table 3: Gold Dissolution Rate in the Presence of Salts
(M) (/mol/cm2 hr) (M) (/xmol/cm2 hr)
1X10"3 10.68 lxlO"3 10.02
5xl0"3 10.85 5X10"3 11.05
1X10"2 9.85 1X10"2 9.80
5X10"2 9.09 5xl0"2 9.93
lxlO"1 9.31 1X10"1 11.11
5X10"1 7.14 5xl0"1 7.06

62
sulfate concentration in the range of lxio-3 to lxio-1 M.
However, there is a noticeable decrease in the rate when the
sodium sulfate concentration is increased to 5xio~1. The data
for sodium chloride indicate similar behavior. The decrease in
gold dissolution rate at the high concentration of both sodium
sulfate and sodium chloride can be explained in terms of
possible activity coefficient effects and the fact that iodine
solubility decreases in the presence of these salts [48].
Solubility data [48] show that iodine solubility in lxio"2
M Nal drops from 6.0xl0~3 M to 2.5xl0~3 M in the presence of
1.63 M Na2S04 and in lxio"3 M Nal from 1.8X10"3 to 5.0xi0"4 at
the same Na2S04 concentration.
4.1.6 Effect of Temperature
Two sets of tests were performed to determine the
influence of temperature on the gold dissolution rate. One set
was carried out using 5xio-3 M I2 and the other using lxio-3 M
I2. The concentration of Nal was fixed at lxio"2 M.
Temperatures ranging from 10 to 35°C were investigated. Owning
to volatility and thermal instability of iodide, experiments
at temperature higher than 35°C were not performed. The
results are summarized in Figures 19 & 20 for 5xio"3 and
lxio-3, respectively for the initial kinetic region. The
initial kinetic data obtained at two hours and less resulted
in well behaved first order rate plots as shown in Table 4.
63
1.0 1.5
Time (hrs)
Figure 19 Effect of temperature on the dissolution of gold in 10-2 M Nal and 5xio-3 M I2.

64
• 30
1.0 1.5
Time (hrs)
Figure 20 Effect of temperature on the dissolution of gold in 10~* M Nal and lxlO-3 M I2.

65
Table 4: Dissolution Rate of Gold as a Function of Temperature (iimol/cm2 hr)
[ I2] Temperature, °C
(M) 10 15 20 25 30 35
5X10"3 6.41 8.10 8.75 11.40 15.26 18.49
1X10"3 3.31 5.04 6.41 7.97 9.28 11.04

66
The rate constants for the initial stages of reaction are
higher than those previously reported for extended reaction
time. Their values are plotted according to the Arrhenius1 law
in Figure 21. The activation energies under these conditions
are 31.6 kJ/mol for 5xl0"3 M I2 and 34.4 kJ/mol for lxlO"3 M I2.
The high activation energy supports the possibility of an
electrochemical process controlling the reaction rate.
Iodine solubility as a function of temperature at 10"2 M
Nal was extrapolated from the data provided by [48], as shown
in Figure 22. Obviously, iodine solubility decreases linearly
with the decrease of temperature from 7.4xi0"3 M at 60°C to
5.3xio"3 M at 10°C. However, the system studied remained within
these solubility limits.
4.1.7 Effect of pH
The effect of pH on gold dissolution using lxio-2 M Nal
and lxio-3 M I2 with lxio-1 M Na2S04 was examined in the pH range
from 2 to 10. The initial pH of this solution was
approximately 8.20. Sodium hydroxide and sulfuric acid were
used to adjust the pH. As shown in Figure 23, the rate of
dissolution of gold with I'/I2 is relatively insensitive to pH
over this range.
4.1.8 Comparison with Cyanidation
The comparison of gold leaching between iodide and

67
3.5
"D 3.0
CM E <2.5 o
^2.0 •+•> o tx c - 1.5
1.0 3.2 3.3 3.4 3.5 3.6 3.7
1/f. * 10-3 (K~1)
Figure 21 Arrhenius plots for the leaching of gold in 10"2 M Nal solution containing 5xio-3 and lxio-3 M I2, respectively.
Ea = 31.6 kJ/mol
Ea = 34.4 kJ/mol

68
8
7 •
6 -
10 ^ M
0 10 20 30 40 50 60
Temperature (°C)
Figure 22 Solubility of iodine at 10"2 M Nal as a function of temperature.

69
CM E o
o E =L v_^ <Z>
+->
a a:
6 -
5 -
4 -
3 -
1x10 M Na2S04
1 2 3 4 5 6
pH
7 8 9 10 11 12
Figure 23 Effect of pH on the dissolution of gold in 10"2 M Nal, 10"3 M I2 and 10"1 M Na2S04.
70
cyanide is presented in Figure 24, in which the leaching
conditions are listed separately and the data for cyanide
leaching is selected from [50]. Nearly the same level of gold
dissolution rate was achieved in the solutions containing
lxio-2 M Nal and 5xio-3 M I2 (R = 2.6xio"9 mol/cm2 sec) as in
alkaline cyanide solution containing >2.7xio-3 M KCN (R =
2.8xio'9 mol/cm2 sec) and air as an oxidant. This suggests that
iodide may adequately serve as a substitute for cyanide in the
leaching of gold.
4.1.9 Kinetic Considerations
The rate controlling step for the dissolution of gold in
iodide solution is postulated to involve a mixed kinetic
regime similar to that involved in the cyanidation of gold and
silver [51]. Gold dissolution rate follows a linear
relationship with the square root of the disk rotation speed
which may indicate that diffusion of reactants through the
liquid boundary layer to the gold surface may control the
rate. However, by the observation alone it is not possible to
eliminate mixed kinetics (i.e. diffusion plus charge transfer)
from being rate controlling. As demonstrated by the
fundamental electrochemical studies by kudryk and Kellogg [50]
for the cyanidation of gold and by Hiskey and Sanchez [52] for
the cyanidation of silver, the mixed kinetic region exhibits
anodic dissolution rates that yield a linear relationships

71
CN E o \
o E 3 -O o > o to tn b 3 <
>2.7x10""3 M KCN
5x10~3 M l2
1x10 MI
Time (hrs)
Figure 24 Comparison of iodide and cyanide leaching of gold for different I2 concentrations.

72
against the square root of rotation speed.
The effect of temperature reported in this study reflects
a complex process possibly involving a diffusion control
mechanism. At lower I2 concentrations, the experimental
activation energy was determined to be 34.4 kJ/mol. While at
higher I2 concentrations, a value of 31.6 kJ/mol was obtained
for the leaching reaction. As pointed out by Levich [49],
activation energies for aqueous diffusion in the viscous
hydrodynamic boundary layer are usually in the range of 8.4 to
12.6 kJ/mol. Furthermore, it has been reported that cathodic
iodine reduction
Ij + 2e = 31" (14)
in a solution of lxio-1 M I2 and 1 M KI is characterized by an
activation energy of about 10.5 kJ/mol for limiting currents
under laminar flow conditions [49]. The Ea values that
characterize the leaching of gold in iodide/iodine solutions
in this study suggest that the leaching mechanism may involve
mixed kinetics.
Iodine solubility was considered in determining the
effects of iodine and iodide on the dissolution of gold.
Iodine remained soluble for all the data at various I2
concentrations, the rate of gold dissolution increased with
increasing I2 under these conditions such that

R <* [i- ]
73
The triiodide complex had the highest concentration of iodine
specific capable of oxidizing gold and the rate was found to
have a first order dependence on this species. A first order
dependence was also observed for aqueous iodine (I2(aq>) • For
constant total iodine concentration, the rate increased
uniformly with increasing iodide concentration according to
the following relationship.
R « [I~]1/2
The half-order dependence on iodide suggests that a process
other than strictly diffusion is controlling the rate of gold
dissolution. As shown in Table 2, the predominant iodine
species shifts from the triiodide to aqueous iodine as the Nal
increases from lxlO"3 M. However, if the reaction order with
respect to [I"] is determined for narrow range of Nal where [Ij ]
predominants and is essentially constant (i.e. Nal at lxio-2
and 5xi0"3) , the reaction order is 0.42 with respect to [I"].
On the other hand, if [I2<aq)] predominants (i.e. Nal at 2xio~3
and lxio-3 M) the reaction order is 0.49 with respect to [I"].
Under conditions where the triiodide complex prevails (i.e.
high [I"]) then the rate should vary according to
R = k e"Ea/RT [I3 ] [!"]1/2
74
(26)
If the following conditions are chosen, [Nal] = 10"2 M and [I2]
= 10"3 M where Ea = 34.4 kJ/mol, it is found that the predicted
rates are very close to the experimental ones as shown in
Table 5. The results from this leaching work suggest that a
rate controlling process other than just diffusion may control
the dissolution of gold in I"/I2 solutions.
4.2 Electrochemistry
4.2.1 Cyclic Voltammetry of Gold in Halides
Cyclic voltammograms of gold in halide solutions with 1
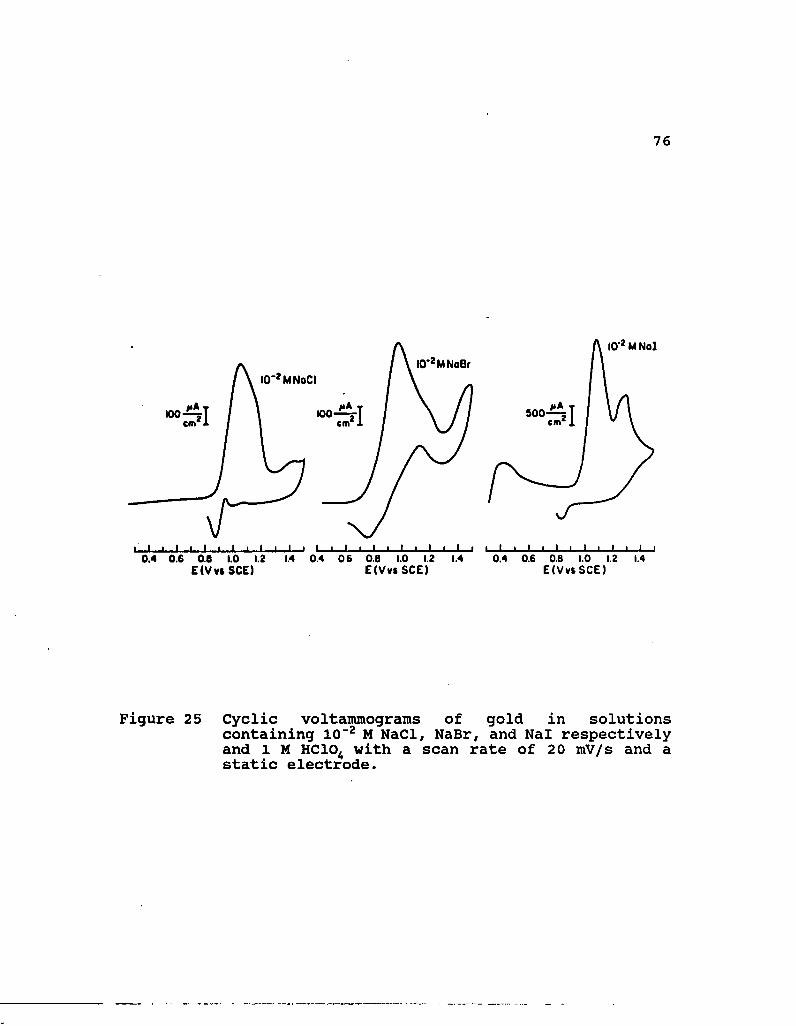
M HCIO^ using a sweep rate of 20 mV/s are shown in Figure 25.
In the presence of 10"2 M NaCl, an anodic peak, corresponding
to the oxidation of Au to AuCl^ is observed at about 1.0 V,
followed by passivation due to the formation of an oxide film
on the gold surface. After the direction of the scan was
changed at 1.5 V, the current returns to zero and then shows
a cathodic peak at 0.85 V. In the presence of 10"2 M NaBr, a
similar shape of curve, representing the oxidation of Au to
AuBr^ was observed at about 1.0 V. During the reverse scan,
reactivation is observed at about 1.1 V and a cathodic peak is
also obtained at about 0.75 V. Other experiments (which are

75
Table 5: Comparison of Predicted & Experimental Rates (ixmol/cm2 hr)
Nal (M) I2(M)
Predicted
R
Experimental
R
10~2 1X10"3 4.02 4.04/3.94
10"2 5X10"4 2.08 2.10
<M 1 o H 1X10"4 0.45 0.47
76
300 cm'
100 100 cm' cm'
L_l I I I I I I I I I I I I 1—I I I—I I—I—I 1—I 1 0.4 0.6 0.8 1.0 1.2 1.4 0.4 06 0.B 1.0 1.2 1.4 0.4 0.6 0.0 1.0 1.2 1.4
E ( V v i S C E ) E ( V v » S C E ) E ( V v t S C E )
Figure 25 Cyclic voltammograms of gold in solutions containing 10"2 M NaCl, NaBr, and Nal respectively and 1 M HC104 with a scan rate of 20 mV/s and a static electrode.

77
not presented here) show that the reverse scan almost traced
the forward scan and no cathodic peak was found when a
stirring bar was used to agitate the solution under the same
conditions. This indicates strong reactivation. Thus,
reactivation is believed to be caused by rapid dissolution of
the oxide film. It should be noted that the anodic peak for
the oxidation of Au to AuClj or AuBrj might be merged into
the one for AuCl^ or AuBr^ , respectively, because the
difference of reduction potential between Au(I) and Au(III)
species is very small (< 60 mV) [46].
In the presence of 10"2 M Nal, the anodic scan records a
peak at about 0.4 which clearly represents the oxidation of Au
to Aulj • The peak current density is 1.2 mA/cm2. This value is
greater than that for oxidation of Au to Au(III) in either
chloride or bromide at 10"2 M. A region of passivation appears
up to 0.9 V, afterwhich a large anodic peak is obtained at 1.1
V for Au to Aul^ . Peak current density of the AuI^T is 4.2
mA/cm2 (ip of this wave was measured using the decaying current
of first wave as the baseline [46]) . This indicates the strong
oxidation capability of iodide and this phenomenon is
consistent with the discussion of the Eh-pH diagram for gold-
iodide system. The electrode was then passivated again due to
the formation of an oxide film on the gold surface. During the
reverse scan, a cathodic peak was also observed at
approximately 0.85 V.
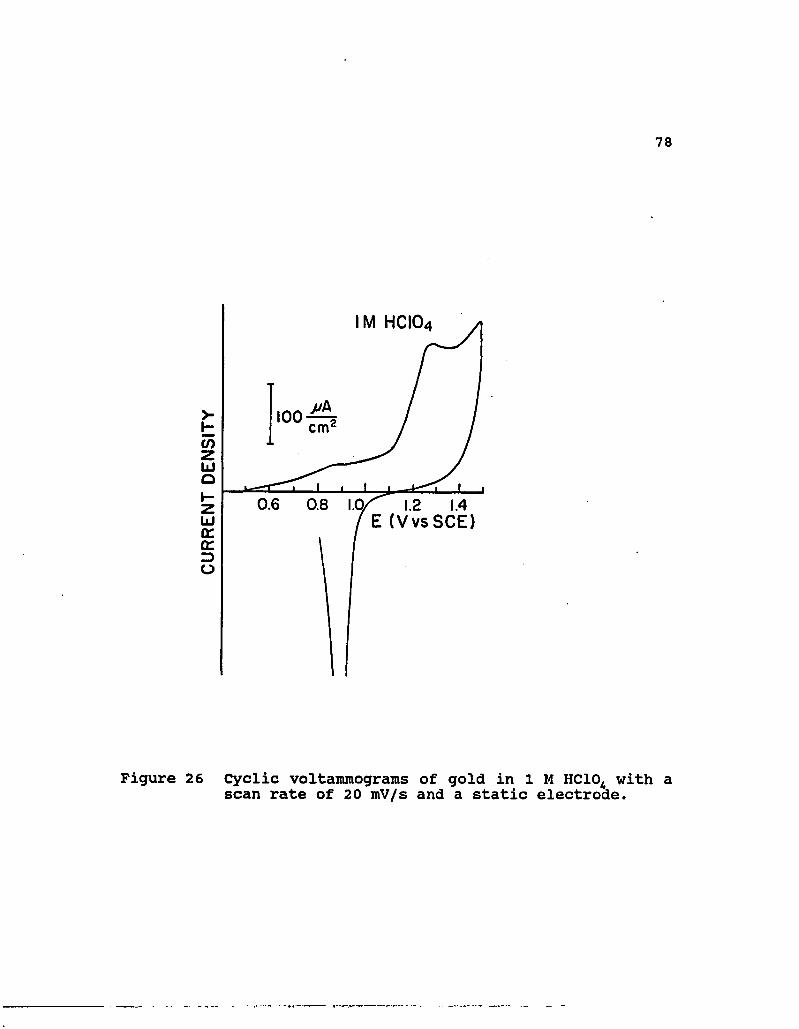
Figure 26 Cyclic voltammograms of gold in 1 M HC10A with a scan rate of 20 mV/s and a static electrode.
79
4.2.2 Cyclic Voltammetry of Gold in Various [Nal]
Figure 26 shows the cyclic voltammogram of gold in pure
water where 1 M HC104 is added for conductivity. The anodic
peak at 1.3 V represents the formation of Au203 and the
subsequent peak represents oxygen evolution. On the reverse
scan, a relatively large cathodic peak is produced at 0.9 V,
indicating that the oxide film on the surface of the electrode
is easily reduced. This is similar to that discovered by Nicol
and Schalch [32].
Cyclic voltammograms of gold in various concentrations of
Nal with 1 M HC104 and a stirring bar for agitation are shown
in Figure 27. The anodic oxidation of gold in 10~3 and 10~2 M
Nal are shown in Figure 27a and 27b, respectively, and
indicate initial oxidation of gold at about 0.5 V followed by
a plateau region where diffusion is controlling. The general
shape of the voltammogram was essentially the same at 5xio"3
M Nal. Limiting current density values in this region are
0.51, 2.92 and 3.99 mA/cm2 for lxlO"3, and 5X10"3 and lxio-2 M
Nal, respectively. Further oxidation to the Au(III) species
takes place above 1.0 V.
Increasing the concentration to 10"1 M Nal resulted in the
scan shown in Figure 27c. It should be noted that nearly
identical shape was obtained for a scan at 5xio-2 M Nal. The
position of the anodic peak for Au(I) occurs at about 0.45 V
for both concentrations. The peak current densities are 31.57

80
10 M Nol 10 M Nol
04 oe oa to 1.2 1.4 E (Vvt SCEI
04 06 08 10 1.2 14 E (Vvt SCE)
>2 04 06 06 10 12 14 E (V»i SCE)
(a) (b) (c)
Figure 27 Cyclic voltammograms of gold in various concentrations of Nal and 1 M HC104 with 20 mV/s and a stirring bar for agitation.

81
and 57.62 mA/cm2 for 5xi0'z and lxio-2 M Nal, respectively. The
electrode at these concentrations indicates prepassive
behavior followed by passivation and a small rise in current
density at above 1.1 V for formation of Au(III) species.
Passivation was only observed at the higher concentrations of
Nal. It is believed that passivation of the gold electrode is
caused by formation of solid iodine on the electrode surface.
It should be noted that the oxidation of iodide to solid
iodine occurs at a standard half cell potential of 0.54 V
(SHE). The region between 0.6 and 1.0 V where current density
is independent of potential is a region where the reaction is
controlled by diffusion through the solid iodine film.
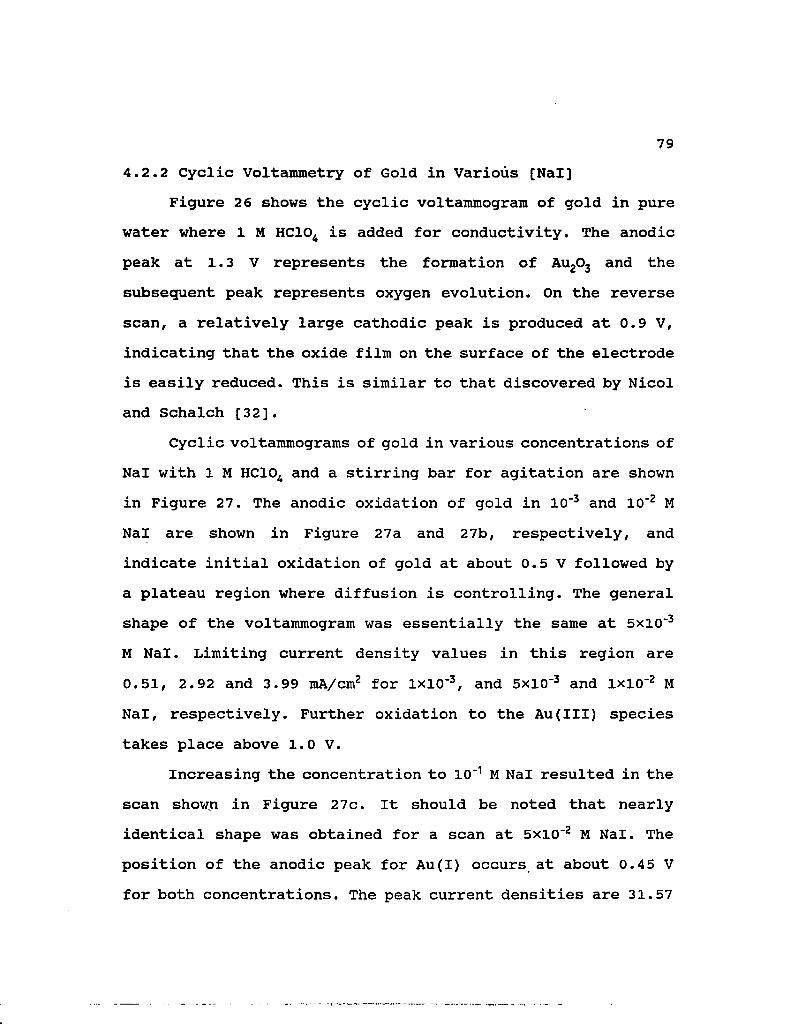
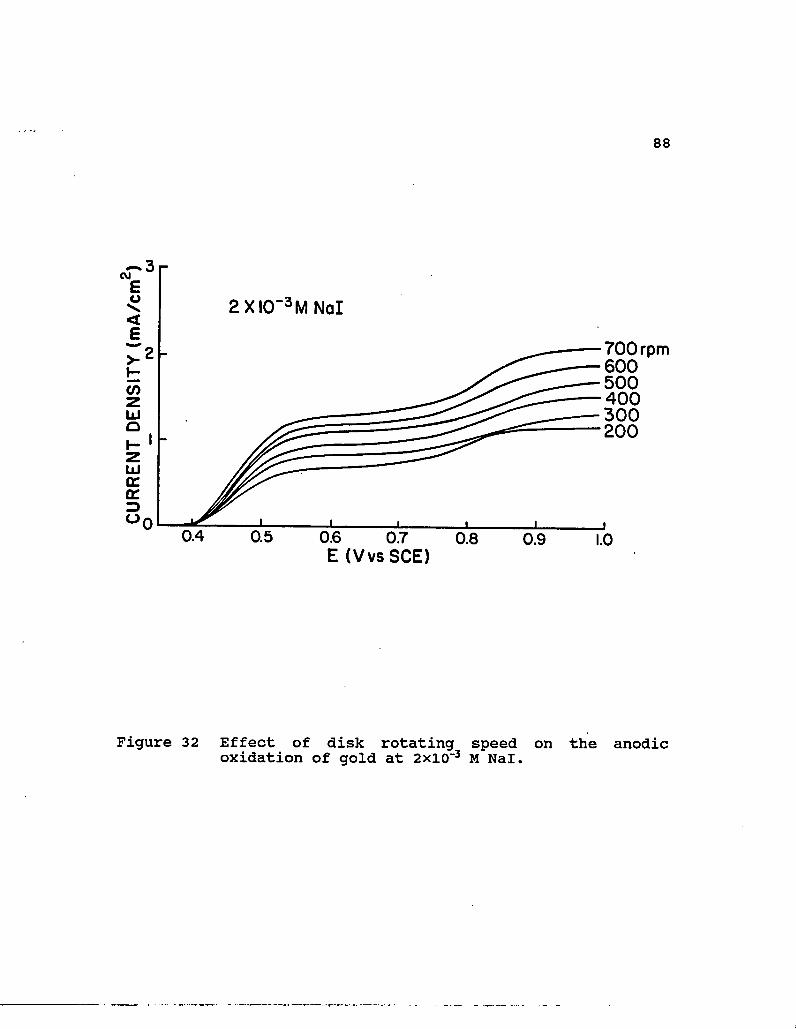
4.2.3 Anodic Polarization of Gold in Different [Nal]
Anodic polarization curves of gold in different
concentrations of sodium iodide in 4xio~1 M Na2S04 using a scan
rate of 1 mV/s and a rotating speed of 500 rpm are shown in
Figure 28. Natural pH is approximately 6.2 to 6.5 in these
solutions. At concentrations up to 3xio-3 M Nal, two plateaus
and no passivation were found. Above 0.5 V, where Au(I) was
formed as discussed earlier, the current density is relatively
insensitive to increase in potential until about 0.8 V. This
is believed to be a region controlled by boundary layer
diffusion. At above 0.8 V, the current density starts to rise
as Au(I) is oxidized to Au(III). Finally, a second plateau is
82
5 r 5XI0"2M
3 X I0~3 M
2 X I0~3 M
5XIO"3M
IXIO"3M
0.5 0.6 0.7 0.8 E (VvsSCE)
Figure 28 Anodic polarization curves of gold in different concentrations of sodium iodide and 4xio"1 M Na2S04 using a scan rate of 1 mV/s and a RDE at 500 rpm.

83
reached. At higher concentrations of Nal (i.e. 10~2 M Nal), one
anodic peak appears at 0.55 V followed by passivation and
diffusion through a solid layer. This transition takes place
at about 4xio-3 M Nal. The voltammogram at this concentration
indicates a broad diffusion region followed by passivation at
higher potentials. The peak becomes sharper and moves to lower
potentials as Nal concentration increases. Again this
indicates that the oxidation of gold at the higher
concentrations of Nal resulted in the formation of a passive
film on the gold surface.
It is interesting to compare the electrochemical results
at 10"2 M Nal with and without disk rotation as shown in Figure
29. The initial oxidation of gold at 500 rpm yields a higher
Au(I) peak current density, prepassive behavior, and a broad
diffusion region. With rotation, the rate of I" transported to
the surface is relatively high and oxidation to solid iodine
can result in film formation at the electrode. Furthermore, Aulj
is transported away from the electrode at a relatively fast
rate and subsequent oxidation to Aul^ is not detected when the
surface film is present. The oxidation of gold without
rotation first produces a Au(I) peak with very low current
density because of the locally depleted I". The depletion of
iodide also prevents strong passivation by solid iodine. A
noticeably higher Au(III) peak is found at about 0.95 V. This
indicates the accumulation of Aulj at the surface and

84
< 5
500 rpm z 3 UJ o 2
without disk rotation
3 01-o 0.3 0.9 0.6 0.7
E (VvsSCE) 0.8 0.4 0.5
Figure 29 Comparison of anodic polarization curves of gold at 10~2 M Nal with and without disk rotation.

85
subsequent oxidation to Aul^ .
Similar experiments were performed using 1 M HC104
instead of 4xio_1 M Na2S04 as electrolyte. Essentially the same
results were observed with the higher iodide concentrations.
However, only one plateau representing the oxidation of Au to
Au(I) was found at lower concentrations. Under these
conditions, the oxidation to Au(III) probably occurs at higher
potentials.
Schematic and general diagrams of electrochemical
processes for gold with and without disk rotation are
summarized in Figures 30 and 31. In general, at low iodide
concentration and with rotation the oxidation of gold occurs
sequentially. However, at the high iodide concentration and
with rotation a passive film of solid iodine forms. Without
rotation, passive film does not occur because of the low
degree of iodide transported to the surface, and the oxidation
of gold occurs by a sequential process with the second wave
higher than that with rotation because of the accumulation of
Aulj at the surface.
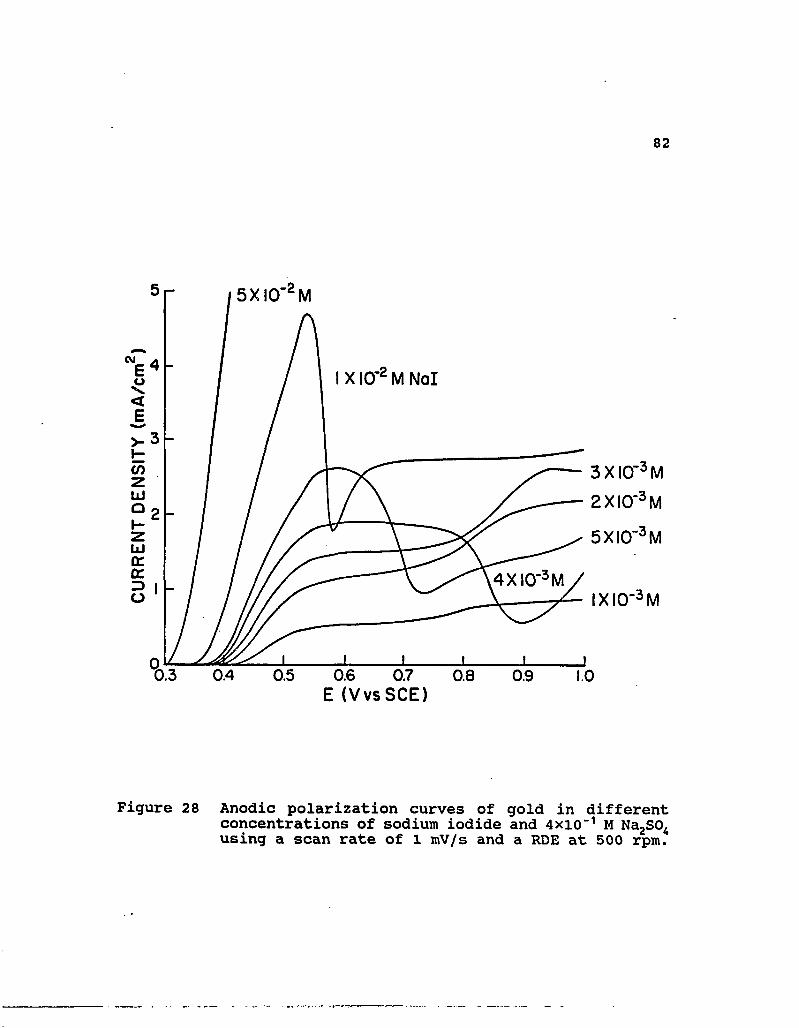
4.2.4 Effect of Disk Rotating Speed
Results for the anodic oxidation of gold as a function of
disk rotating speed are shown in Figures 32 and 33 for 2xi0~3
and lxio"2 M Nal, respectively. In general, the plateau regimes
and the oxidation peaks increase with increasing disk rotating

86
WITH ROTATION
AuII
Au + 21" -» Aulj + e" Low [I"] Low Potential (1st plateau)
Au + 21* -» Aulj + e"
Aulj + 21" -» Aul^ + 2e"
Low [I"] High Potential (2nd plateau)
Au + 21" -» Aulj + e" High [I"]
^2(5)
Figure 3 0 Schematic diagrams of electrochemical processes for gold without rotation

WITHOUT ROTATION
I~ conc. small at the surface
Au + 21" -» Aui: +
Aui; + 21" -» Aui; + 2e" Au
iUlT
AuIT
Figure 31 Schematic diagram of of electrochemical processes for gold without rotation.
88
2X10 MNal
700 rpm 600 500 400 300 200
0.6 0.7 E (VvsSCE)
Figure 32 Effect of disk rotating speed on the anodic oxidation of gold at 2xio~3 M Nal.

89
I0"2 M Nal
inflection point 700rpm 600 >500 400 300 200
0.6 0.7 E (VvsSCE)
Figure 33 Effect of disk rotating speed on the anodic oxidation of gold at 10"2 M Nal.

90
speed from 200 to 700 rpm. According to the Levich equation
[49] the limiting current density (it, A/cm2) is proportional
to the one half power of the rotating speed (o1/2, rad/sec)
it = 0. 62nF D2/3 0)1/2 V_1/6 C0 (27)
where n is the number of electrons per molecule oxidized or
reduced; F is the Faraday constant (coulomb/mol), D is the
diffusion coefficient (cm2/sec), v is the kinematic viscosity
(cm2/sec) and C0 is the bulk solution concentration (mol/cm3) .
As shown in Figure 34, a plot of limiting current densities
for the first plateau region taken at 0.65 V (almost the same
slope can be obtained at 0.60 or 0.63 V) using 2xio-3 M Nal
yields an excellent correlation with o1/2. The diffusion
coefficient can be calculated for a one electron process using
the slope of this line. Its value of D as determined from
these data is 1.35xio-5 cm2/s. This value is quite close to the
diffusion coefficient reported for sodium iodide at 25°C [53].
In the first plateau region, the reaction is controlled by a
boundary layer diffusion process. Limiting current density
values for the second plateau were determined by the procedure
described by Bard and Faulkner [46]. Here values at 0.95 V are
plotted versus o»1/2 also presented in Figure 34. A fairly good
correlation is obtained for these data. The noticeably low
slope of this plot reflects the low concentration of the

91
^ 1.5 CM E o > E
<3 1.0
w c o O -+-< c <D L_ L. 3 o D» C
0.5 -
t 1 1 r
2x10"3 M Nal
t 1 r
CJV2( S-V*)
Figure 34 Plot of limiting current densities for the first (0.65 V) and the second (0.95 V) plateau regions as a function of <i>1/2.

92
species that is being oxidized in the second wave.
Data for lxio-2 M Nal (Figure 33) show that the limiting
current densities (as determined from the inflection point to
the plateau region) are relatively insensitive to rotating
speed. This confirms that the electrode reaction is controlled
by diffusion through a solid iodine film at these potentials
for high Nal concentrations as discussed in the previous
section. Table 6 lists those limiting current densities taken
from two different tests.
4.2.5 Reduction of Iodine Species on Gold
The effect of iodine concentration on its reduction on
gold is depicted in Figure 35. Cathodic current densities
attain well defined limiting values for the iodine
concentration between lxio-3 and 5xio~3 M with 10"2 M Nal at a
rotating speed of 500 and a scan rate of 1 mV/s. From these
results, it is possible to calculate the reaction order with
respect to Ij concentration. At both large cathodic
overpotentials in the limiting current region and small
overpotentials (i.e. 0.35 V), the reaction was found to follow
a first order dependence on Ij . These results confirm the
first order effect for Ij observed during the kinetic study.
Furthermore, the diffusion coefficient for reduction of Ij as
calculated from these results ranged from 0.9xi0~5 to 1.18xi0"5
cm2/s.

93
Table 6: Limiting Current Densities Taken from the Inflection Point to the Plateau Region
as a function of Rotating Speed (i„m, mA/cm2)
Rotating Speed, rpm
200 300 400 500 600 700
iUn) (mA/cm2) 1.15 1.28 1.03 1.17 1.48 1.58
iUin(mA/cm2) 0.80 1.10 1.10 1.46 1.43 1.25

94
3
2 (/)
0L 0.0 0.2 0.3 0.4
E (VvsSCE)
Figure 35 Effect of iodine concentration on its reduction on gold at 10"2 M Nal and a RDE at 500 rpm.

95
Additional scans of reduction on gold at constant I2
concentration of 10"3 M and different Nal concentrations were
also carried out. However, the reduction of iodine species on
gold is relatively insensitive to iodide concentration in the
range lxio-3 to 3xio-3 M Nal as shown in Table 7.
4.2.6 Mixed Halide System
Anodic polarization curves of gold were obtained using
mixed halide solutions. Figure 36 depicts scans using 10~2 M
NaI/10"2 M NaBr, 10-2 M NaI/10"2 M NaCl, and 10"2 M NaBr/10"2 M
NaCl at 500 rpm and 1 mV/s. It is apparent that iodide plays
the major role in the mixed halide solutions. In fact, there
is very little difference between the curves for Nal/NaBr and
Nal/NaCl as compared with the system containing only 10"2 M
Nal. With the addition of NaBr or NaCl in the Nal solution,
the gold oxidation peak shifts to slightly lower potentials.
The mixed NaBr/NaCl system appears to be the same as the
single halide system shown in the scan in Figure 25.
4.2.7 Effect of Sweep Rate
The effect of sweep rate on the anodic polarization of
gold is displayed in Figure 37. Here the scan rate ranged from
1 to 50 mV/s using 10"2 M Nal concentration and 500 rpm
rotating speed. As the scan rate increases., the oxidation
potential shifts to higher values indicating an irreversible
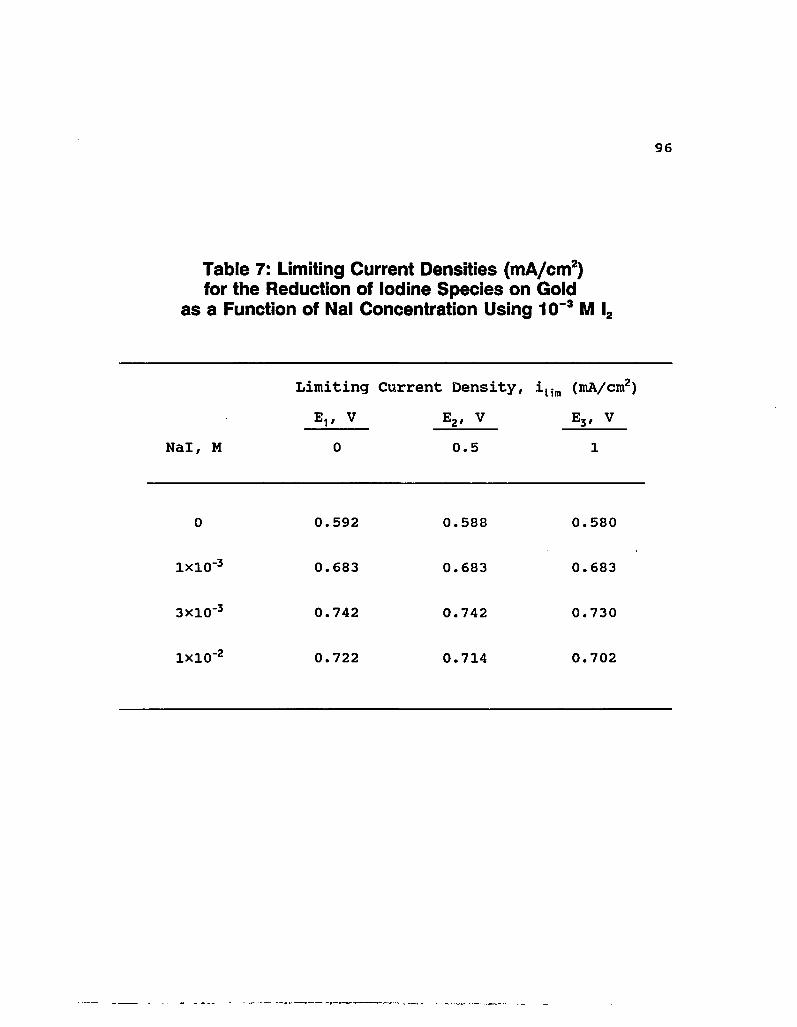
96
Table 7: Limiting Current Densities (mA/cm2) for the Reduction of Iodine Species on Gold
as a Function of Nal Concentration Using 10~3 M l2
Limiting Current Density, iUm (mA/cm2)
E,, V E2, V E3, V
Nal, M 0 0.5 1
0 0.592 0.588 0.580
lxlO"3 0.683 0.683 0.683
3X10⁻³ 0.742 0.742 0.730
lxlO-2 0.722 0.714 0.702

97
IO"2M Nal/NaCI 5 r
IO" 2M Nal /NaBr
> 3
UJ
10 M NaBr/NaCI
0.2 0.3 0.4 0.5 0.6 0.7 0.8 0.9 E (VvsSCE)
Figure 36 Anodic polarization curves of gold in mixed halide systems.

98
8
IO~2MNaI
CVJ
50 mV/s 6 20
Qr 2
Q 0.2
E (VvsSCE)
Figure 37 Effect of sweep rate on the anodic oxidation of gold at 10~2 M Nal and a RDE at 500 rpm.

99
reaction. At the slower scan rates, up to 10 mV/s, only one
gold oxidation peak is observed followed by passivation as
discussed previously. At faster scan rates, Au is first
oxidized to Au(I) and then a region where boundary layer
diffusion occurs is developed. After that, Au(I) is further
oxidized to Au(III). This indicates that if the scan rate is
fast enough, the solid iodine film does not form at the
electrode surface and this results in the sequential oxidation
of Au to Au(I) to Au(III).
CHAPTER FIVE
CONCLUSIONS
100
5.1 Leaching of Gold
1. Gold dissolution in the presence of iodide using iodine as
an oxidant proceeds by the following reaction:
2Au + I" + Ij = 2AuIj
2. Dissolution of gold in I~/I2 solutions follows the first
order kinetics.
3. The first order rate is proportional to square root of the
disk rotation speed.
4. The reaction is first order with respect to the triiodide
complex and half-order with respect to iodide.
5. Oxidants such as oxygen and hydrogen peroxide have almost
no effect on the gold dissolution with iodide.
6. Gold dissolution is insensitive to the presence of Na2S04
and NaCl and is also insensitive to pH over the range pH 2 to
10.

101
7. Of the halogens, iodide has the strongest capability of
dissolving gold in aqueous solutions. Its dissolution rate has
the same level comparing with that of gold cyanide system.
8. At low I2 concentrations, the experimental activation
energy was determined to be 34.4 kJ/mol. While at higher I2
concentrations, a value of 31.6 kJ/mol was obtained for the
leaching reaction.
9. Gold dissolution rate in 5xi0"3 M I2 and lxio-2 M I" is
2.6xi0"9 mol/cm2 sec which is comparable to that in 2.7xio-3 M
KCN with air as an oxidant (i. e. typical cyanidation
conditions).
5.2 Electrochemical Behavior
1. Cyclic and linear sweep voltammograms indicate the
sequential oxidation of gold in iodide solutions where both
Au(I) and Au(III) iodide species form. This phenomenon is in
agreement with the Eh-pH diagram of the gold-iodide system. On
the other hand, only anodic oxidation of gold to Au(III)
species was found in either bromide or chloride solution at
1CT2 M NaBr or NaCl.
2. The anodic oxidation of gold occurs at noticeably higher
102
current densities in iodide than that in either bromide or
chloride. This observation confirms the strong complexing
ability of iodide with gold.
3. At low concentrations of Nal, it was found that gold is
initially oxidized to Au(I) and then attains a plateau region
where boundary layer diffusion controls the reaction.
Afterwhich, Au(I) is further oxidized to Au(III). The reaction
sequence is also observed at faster scan rates using higher
sodium iodide concentrations. While at low scan rates and
higher concentrations of Nal, only one oxidation peak is
observed followed by passivation resulting from the formation
of a solid iodine film on the electrode surface. In this
region, the reaction is controlled by diffusion through the
surface film.
4. Results for the anodic polarization of gold as a function
of disk rotating speed clearly show that limiting current
densities for both oxidation steps are proportional to half
power of disk rotating speed in 2xio~3 M Nal. For oxidation of
gold to Aulj i a diffusion coefficient of 1.35X10"5 cm2/s was
determined for iodide.
5. Reduction of iodine species on the gold surface follows a
first order dependence on Ij which confirms the first order

effect observed during the kinetic study.
103
6. The polarization behavior of mixed halides indicates little
difference between Nal/NaBr and Nal/NaCl and is essentially
equivalent to the behavior of a NaT system.

REFERENCES
104
1. R. J. Puddephatt, The Chemistry of Gold (Elsevier Scientific Publishing Co.,
New York, 1962).
2. J. S. MacArthur, R. W. Forrest and W. Forrest, British Patent 14, 174
(1887).
3. J. S. MacArthur, R. W. Forrest and W. Forrest, U. S. Patents 403, 202, and
418, 137 (1889).
4. A. Hakansson and L. Johansson, Chem. Scr., 1975, 7, 201-203.
5. J. B. Hiskey and V. P. Atluri, Mineral Processing and Extractive Metallurgy
Review, 1988, 4, 95-134.
6. N. P. Finkelstein and R. D. Hancock, Gold Bull., 1974, 7, 72-77.
7. L. G. Sillen and A. E. Martell, Stability Constants of Metal Ion Complexes (The
Chemical Society, London, 1964).
8. W. M. Latimer, The Oxidation States of the Elements and Their Potentials in
Aqueous Solution (Prentice-Hall, Englewood Cliffs, New Jersey, 1952), 2nd
Ed.
9. T. Sano, H. Hori, M. Yamamoto, and T. Yasunaga, Bull. Chem. Soc. Jpn.,
1984, 2, 575-576.
10. C. A. Schaeffer, U. S. Patent 267,723 (1882).
11. C. G. Fink and G. L. Putnam, U. S. Patent 2,283,198 (1940).
105
12. R. P. Homick and H. Sloan, U. S. Patent 3,957,505 (1976).
13. S. K. Bahl and G. L. Leach, U. S. Patent 4,190,489 (1980).
14. R. H, Sergent and K. N. Thanstrom, U. S. Patent 4,637,865 (1987).
15. A. Dadgar, J. Metals, 1989, 41(12), 37-41.
16. K. J. McGrew and J. W. Murphy, U.S. Patent 4,557,759 (1985).
17. J. W. Murphy, U. S. Patent 4,734, 171 (1988).
18. T. Erdey-Gruz and M. Volmer, Z. Phys. Chem. A, 1930, 150, 203-213.
19. A. N. Frumkin, Z. Phys. Chem. A, 1933, 164, 121-133.
20. L. Kiss, Kinetics of Electrochemical Metal Dissolution (Elsevier Science
Publishing Co. Inc., New York, 1988).
21. M. J. Nicol, Gold Bull., 1980, 13, 46-55.
22. M.J. Nicol, Gold Bull., 1980, 13, 105-111.
23. G. Just and R. landsberg, Electrochin. Acta, 1964, 9, 817-826.
24. T. Heumann and H. S. Panesar, Z. Phys. Chem., 1966, 229, 84-97.
25. J. N. Gaur and G. M. Schmid, J. Electroanal. Chem., 1970, 24, 279-291.
26. J. H. Gailego, C. E. Castellano, A. J. Callandra and A. J. Arvia, J.
Electroanal. Chem., 1975, 66, 207-230.
27. J. J. Podesta, R. C. V. Piatti and A. J. Arvia, Electrochim. Acta, 1979, 24,
633-638.
28. R. P. Frankenthal and D. J. Siconolfi, J. Electrochem. Soc., 1982, 129,
1192-1196.

106
29. M. D. Benari, G. T. Hefter and A. J. Parker, Hydrometallurgy, 1983, 10,
367-389.
30. E. Schalch and M. J. Nicol, Gold Bull., 1978, 11, 117-123.
31. E. Schalch, M. J. Nicol and B. D. Charlton, Chloride Hydrometallurgy,
Proceedings, Brussels, 1977, 336-356.
32. M. J. Nicol, National Institute for Metallurgy, Johannesburg, Report No.
1844, 1981.
33. M. J. Nicol, National Institute for Metallurgy, Johannesburg, Report No.
1846, 1981.
34. E. Schalch, M. J. Nicol, J. W. Diggle, B. D. Charlton and J. P. H. Vaessen,
National Institute for Metallurge, Johannesburg, Report No. 1848, 1981.
35. B. H. Loo, J. Phys. Chem., 1982, 86, 433-437.
36. M. A. Tadayyoni, P. Gao and M. J. Weaver, J. Electroanal. Chem., 1986,
198, 125-136.
37. M. M. Qureshi, Pak. J. Sci., 1984, 33, 31-33.
38. A. Davis and T. Tran, Presentation at the 118th SME Annual Meeting, Las
Vegas, Nevada, 1989.
39. T. Takamura, K. Takamura and E. Yeager, J. Electroanal. Chem., 1971, 29,
279-291.
40. J. Clavilier and N. V. Huong, J. Electroanal. Chem., 1973, 41, 193-199.
41. S. H. Cadle and S. Bruckenstein, J. Electroanal. Chem., 1973, 48, 325-331.

107
42. V. G. Levich, Acta Physicochim. URSS, 1942, 17, 257-302.
43. V. G. Levich, J. Phys. Chem. (U.S.S.R.), 1944, 18, 335-355.
44. F. Opekar and P. Beran, J. Electro anal. Chem., 1976, 69, 1-105.
45. A. C. Riddiford, Advances in Electrochemistry and Electrochemical
Engineering, Interscience, New York, 1966, 4, 47-116.
46. A. J. Bard and L. R. Faulkner, Electrochemical Methods (Jhon Wiley and
Sons, New York, N. Y., 1980).
47. R. N. Adams, Electrochemistry at Solid Electrodes (Marcel Dekker, New
York, 1969).
48. H. L. Silcock, Solubilities of Inorganic and Organic Compounds (Pergamon
Press, 1979), Vol. 3, Part 1.
49. V. G. Levich, Physicochemical Hydrodynamics (Prentice-Hall, Englewood
Cliffs, New Jersey, 1962).
50. V. Kudryk and H. H. Kellogg, J. Metals, 1954, 5, 541-548.
51. M. E. Wadsworth, Mining Engineering, 1985, 6,557-562.
52. J. B. Hiskey and V. M. Sanchez, J. Appl. Electrochem., in press.
53. T. W. Chapman, PhD Thesis, University of California-Berkeley, 1967, p. 56.