thin slices of creativity: using single-word utterances to
TRANSCRIPT

Thin slices of creativity: Using single-word utterances to assesscreative cognition
Ranjani Prabhakaran & Adam E. Green &
Jeremy R. Gray
# The Author(s) 2013. This article is published with open access at Springerlink.com
Abstract We investigated the hypothesis that individual differ-ences in creative cognition can be manifest even in brief re-sponses, such as single-word utterances. Participants (n = 193)were instructed to say a verb upon seeing a noun displayed on acomputer screen and were cued to respond creatively to half ofthe nouns. For every noun–verb pair (72 pairs per subject), weassessed the semantic distance between the noun and the verb,using latent semantic analysis (LSA). Semantic distance washigher in the cued ("creative") condition than the uncued condi-tion, within subjects. Critically, between subjects, semantic dis-tance in the cued condition had a strong relationship to a crea-tivity factor derived from a battery of verbal, nonverbal, andachievement-based creativity measures (β= .50), and this rela-tion remained when controlling for intelligence and personality.
The data show that creative cognition can be assessed reliablyand validly from such thin slices of behavior.
Keywords Creative cognition . Creativity . Verb generationtask . Semantic distance . Intelligence . Openness
Introduction
Creativity is an intriguing human ability, with far-reachingimportance to science and society (see Dyer, Gregersen, &Christensen, 2009; Sawyer, 2012; Schunn, Paulus, Cagan, &Wood, 2006; Sternberg, 1998). It is widely agreed that creativeproducts must be both novel and appropriate (or useful), andnot simply random responding. For a scientific understandingof this seemingly ineffable construct, it is essential to be able toquantify individual differences and situational factors that in-fluence performance. To address critical barriers to creativityresearch, we sought to investigate whether creativity can man-ifest reliably in brief samples—or "thin slices" (Ambady &Rosenthal, 1992)—of relatively simple behaviors.
We believe that this question both is interesting in its ownright and has implications for neuroscientific investigations ofcreativity. A number of measures of creativity are available (see,e.g., Amabile, 1982; Fink, Benedek, Grabner, Staudt, &Neubauer, 2007; Ward, Smith, & Vaid, 1997). However, fewcreativity tasks meet the constraints of a neuroimaging environ-ment, in which open-ended responding is generally hard toachieve without special equipment or expertise on the part ofthe participants (e.g., trained at jazz improvisation). As Fink et al.elaborate, most neuroimaging studies of creativity rely on rela-tively broad performance metrics, such as reaction time (RT) orthe number of responses, which do not capture the creativequality of a behavior or product (e.g., Carlsson, Wendt, &Risberg, 2000; Jausovec, 2000; Molle, Marshall, Wolf, Fehm,&Born, 1999; Seger, Desmond, Glover, &Gabrieli, 2000). Like
Ranjani Prabhakaran and Adam E. Green are dual first authors,contributed equally to this work
Electronic supplementary material The online version of this article(doi:10.3758/s13428-013-0401-7) contains supplementary material,which is available to authorized users.
R. Prabhakaran :A. E. Green : J. R. GrayDepartment of Psychology, Yale University, Box 208205,New Haven, CT 06520-8205, USA
J. R. Gray (*)Department of Psychology, Michigan State University,316 Physics Road, Rm 262, East Lansing, MI 48824, USAe-mail: [email protected]
Present Address:R. PrabhakaranClinical Brain Disorders Branch, NIMH, 10 Center Drive, Bldg 10,Rm 3C209, Bethesda, MD 20892,, USA
Present Address:A. E. GreenDepartment of Psychology, Georgetown University, Box 571001,Washington, DC 20057, USA
Behav ResDOI 10.3758/s13428-013-0401-7
most investigators, we are skeptical that a person's creativity orcreative potential could be fully measured using a single task.The goal of the present study was to test whether it is possible toassess variation in creative cognition from mere seconds ofobserved behavior.
We adapted a classic task from the cognitive neuroscienceliterature, known as the verb generation task, which was orig-inally designed to evoke brain activity related to semanticprocessing (Petersen, Fox, Posner, Mintun, & Raichle, 1989).In the task, a noun is presented visually every few seconds, andthe participant is instructed to say a verb out loud—simply, thefirst verb that comes to mind in response to the noun. As such,the task is easy to administer, even within the constraints of animaging environment, and is adaptable to a wide variety ofpopulations, including children or elderly adults. The task hassince been used in many follow-up studies (Chiarello et al.,2006; McCarthy, Blamire, Rothman, Gruetter, & Shulman,1993; Thompson-Schill, D’Esposito, Aguirre, & Farah, 1997;Thompson-Schill, D’Esposito, & Kan, 1999). Using event-related fMRI and recording the words spoken in the scannerhas allowed for some sophisticated brain–behavior analysesbased on the individual words (Barch, Braver, Sabb, & Noll,2000). Two prior reports have suggested that unusual or low-frequency responses are particularly interesting, albeit as relatedto unusualness of responding in a statistical sense, rather thancreativity specifically (Barch et al., 2000; Seger et al., 2000).
Our version of the taskwas quite similar to the original, exceptthat, on half of the trials, subjects were prompted to respondcreatively. Although an instruction to respond creatively mayseem simplistic, it has been consistently shown to influencecreativity across a wide variety of tasks, including divergentthinking (e.g., Harrington, 1975; Runco & Okuda, 1991), gen-erating solutions for workplace-related problems (e.g., Shalley,1991), writing essays about assigned passages (e.g., O'Hara &Sternberg, 2000–2001), collage making and alien drawing (e.g.,Niu & Sternberg, 2001), story writing (e.g., Chen et al., 2005;Howard-Jones, Blakemore, Samuel, Summers, & Claxton,2005), and creative analogical reasoning (Green, Cohen, Kim,& Gray, 2012), among others (cf. Amabile, 1979; Chua &Iyengar, 2008; Niu & Liu, 2009). Explicit creative instructionshave also been shown to influence the relatedness of creative taskperformance to other measures of creativity (e.g., Harrington,1975; see also Barron&Harrington, 1981; Chen, Himsel, Kasof,Greenberger, & Dmitrieva, 2006).
The verb generation task possesses certain features thatmake it an attractive candidate for assessing participants’creative performance, at least in a verbal domain. Mednick(1962; see also Wallach & Kogan, 1965) proposed that asso-ciative ability lies at the heart of creativity and that the struc-ture and strength of participants’ associative hierarchies im-pact individual differences in creativity. Our variant of theverb generation task provides a test of participants’ abilities togenerate creative semantic associations on demand, in the
context of a widely investigated cognitive-neuroscience task.Most creativity measures, such as divergent thinking tasks, theTorrance Tests of Creative Thinking, story writing, andcollage-making tasks, involve paper and pencil or other ma-terials for their completion, thus making them difficult toimplement in neuroimaging paradigms (Abraham &Windmann, 2007; Fink et al., 2007). To test whether "thinslices" of verbal behavior can be used for assessing individualdifferences in creativity, we administered a cued verb gener-ation task, as well as a battery of standard creativity, intelli-gence, and personality measures.
Method
Participants
Participants (N = 193; 88 male) ranged in age from 18 to35 years (M = 22.1 years, SD = 3.7) and were recruited fromYale University and the surrounding community. The exper-imental protocol was approved by the Yale University HumanSubjects Committee. We discovered after testing that 3 par-ticipants had taken part in another study that had employedsome of the same measures used in the present study; theseparticipants were excluded from analyses involving theoverlapping measures to try to avoid practice effects. Datafrom 7 additional participants were excluded for the followingreasons: Participants were taking psychoactive medications,were nonnative English speakers, exceeded the age limit forparticipation, or had participated in pilot testing for this study.
Given the exploratory nature of our work and our use of anovel creativity task, we were unsure about the number ofparticipants necessary to achieve a robust effect size. We se-lected a large sample size in order to ensure that we would haveenough power to detect a significant difference between perfor-mance on cued and uncued conditions of the verb generationtask. Furthermore, it is common in the literature on individualdifferences in creativity to use large sample sizes that are similarin size to the one we chose (e.g., Nusbaum & Silvia, 2011).
Measures and procedure
In addition to the cued creativity verb generation task, partici-pants completed assessments of creativity (divergent thinkingtasks, story-writing task, Torrance figural tests, latent inhibitiontask, Creative Achievement Questionnaire), intelligence andexecutive functions (Wechsler Adult Intelligence Scale, Raven’sAdvanced Progressive Matrices, three-back working memorytask, task-switching paradigm), and personality (Big FiveAspectScales and NEO-PI-R Openness to Experience scale). Thesemeasures are described below. Participants were tested individ-ually, and the total duration of each testing session was approx-imately 2 h. The duration of each individual measure is specified
Behav Res

in the relevant section below. Participants also completed twoadditional measures for research questions not relevant to ouraims in this study: (1) a verbal four-term proportional analogicalreasoning task, in which participants sought to identify validanalogical mappings between word pairs in two groups (“stempairs” and “completion pairs”), and (2) a questionnaire used toassess the frequency and intensity of synesthetic experiencesfrom self-report.
Creativity measures
Cued creativity verb generation task On a given trial, partic-ipants were presented with a noun on a computer screen andwere asked to say a verb that is related to the noun. For nounspresented in green, participants were instructed to think crea-tively when generating a verb response. Participants firstperformed five practice trials for the following nouns: “bowl”(uncued), “comb” (uncued), “fence” (cued), “basket” (cued),and “stage” (uncued). Of the 72 nouns used in experimentaltrials (see the Appendix, Table 6), half (36) were shown ingreen (cued condition), and the other half in purple (uncuedcondition). Cued and uncued trials alternated in sets of two(e.g., two cued trials were followed by two uncued trials, etc.).Because we were interested in individual differences, wechose not to counterbalance the assignment of nouns to con-ditions (cued, uncued). Each noun can be classified in terms ofthe extent to which it intrinsically imposes constraints on theverb response (see Barch et al., 2000). A high-constraint nounis one for which there is a single common verb associate (e.g.,for “scissors,” almost all participants say “cut”). A low-constraint noun is one for which there is not a single commonverb associate (e.g., for “house,” the verb “live”). By design,the two word lists did not differ in terms of their averageconstraint, where constraint refers to the extent to which thenoun is associated with a single common verb associate. Weused data from an independent sample to empirically assessthe frequency, for each noun, of the most commonly generatedverbs. Two cued and two uncued items were removed from allconstraint analyses, because the frequency of the most com-monly generated verb response for these items was equal tothe median value. Of the remaining 68 nouns, no significantdifference was found between cued and uncued nouns in themean frequencies of their most commonly generated verbresponses (p > .32).
For each noun, participants were given 8 s to indicate theirresponse by speaking aloud into a microphone connected to adigital voice recorder (task duration: approximately 9 min).From these responses, we derived two measures of perfor-mance, the first being the RT, as the latency until the start ofthe spoken response (the verb). RTs were obtained usingPsyscope (Cohen, MacWhinney, Flatt, & Provost, 1993),which recorded the time from noun onset to the onset of avocal response (using an external button box). Participants’
responses were later transcribed from the digital voice record-ings. The second measure was an index of the semantic dis-tance of each verb to the presented noun as derived by latentsemantic analysis (LSA; Landauer, Foltz, & Laham, 1998;http://lsa.colorado.edu). LSA is a method for quantifying thesimilarity between words (or even whole passages) on the basisof statistical analyses of a large corpus of text. We used thetopic space of “general reading up to first-year college (300factors)” and term-to-term comparison type. Technically, thismeasure of semantic similarity corresponds to the cosine of theangle between vectors corresponding (in our usage) to a nounand a verb within a given semantic space, which is derivedthrough analyses of all of the contexts in which the word tendsto be present or absent in that topic space (Landauer et al.,1998; see also Laham, 1997; Landauer & Dumais, 1997). Toprovide a measure of semantic distance (i.e., the inverse ofsemantic similarity), LSA-derived semantic similarity valueswere subtracted from 1 (i.e., semantic distance = 1 − semanticsimilarity from LSA). Thus, the higher the semantic distancevalue between two words, the less similar they are in semanticspace. LSA values provide a highly reliable measure of noun–verb semantic distance, one with low measurement error andreasonable construct validity. We have previously used LSA toobtain a quantifiable measure of creativity in analogical rea-soning, establishing a continuum of semantic distance betweenwithin-domain (less creative) and cross-domain (more creative)analogical reasoning (Green, Fugelsang, & Dunbar, 2006;Green, Fugelsang, Kraemer, & Dunbar, 2008; Green,Kraemer, Fugelsang, Gray, & Dunbar, 2010, in press).
Semantic distance is a measure not of the unusualness ofthe verb but, rather, of the unusualness of the verb in thecontext of the given noun; note that the noun is the same forall participants but the verbs can vary. Participants’ verbresponses were screened for general appropriateness, and thefollowing types of responses were excluded from all analyses:nonverbs (1.7 % of all responses) and verb responses thatwere not in the LSA corpus (1.4 % of all responses). Addi-tionally, verb forms were standardized by adding the –ingsuffix (e.g., “cut” and “cuts” were both standardized to “cut-ting”) to ensure that responses with the same verb stemcorresponded to the same semantic distance value. Semanticdistance values for each nounverb pair were calculated andthen averaged within participants, doing so separately for thecued ("creative") and uncued conditions.
Data from 10 participants were excluded from all analysesinvolving semantic distance values for the verb generationtask. For 7 participants, their vocal responses were notrecorded, due to equipment failure, and the remaining 3 par-ticipants had fewer than 50 % of appropriate responses ineither the cued or the uncued condition. N = 183 participantscontributed to analyses of semantic distance. For RTs, anadditional 8 participants were excluded, because each hadfewer than 50 % of voice-onset RTs recorded by the button
Behav Res

box. Thus, N = 175 participants contributed to analyses ofverb generation RT.
Divergent thinking tasks Participants were administered threedivergent thinking problems (Torrance, 1966). For the firstproblem, participants were asked the following: “Suppose thatall humans were born with six fingers on each hand instead offive. List all the consequences or implications that you canthink of.” For the second problem, participants were asked to“list as many white, edible things as you can.” For the thirdproblem, participants were asked to “list all the uses you canthink of for a brick.” Participants were given 3 min for eachproblem (task duration: 9 min).
Two students at Yale University served as independent ratersand assessed participants’ responses for flexibility, fluency, andoriginality. Flexibility refers to the total number of differentcategories that a participant used in each problem, in addition tothe number of times that a participant changed the category ofhis or her response. Fluency refers to the total number ofresponses. Originality refers to the unusualness (relative to theresponses of the other participants in the sample) of partici-pants’ responses. Reliability was high, as assessed by intraclasscorrelation coefficients (ICCs) across the two ratings for eachdimension. For each dimension, interrater reliability for thethree problems was the following: flexibility, ICC = .91–.95;fluency, ICC = .97–.99; and originality, ICC = .95–.97. Theaverage ratings were used in subsequent analyses.
Participants’ scores on each dimension were converted to zscores for each problem. These z scores were then summedacross the three problems to create a separate z score forflexibility, fluency, and originality for a given participant.The sum of z scores across dimensions represents the diver-gent thinking total score.
Data from 9 participants were removed from all analysesinvolving the divergent thinking task due to missing data orfailure to follow task instructions or for taking more than theallotted time on a given problem. N = 184 participants con-tributed data to analyses of divergent thinking.
Story-writing task The story-writing task is a measure ofcreative production. Participants were instructed to write avery short story (around four sentences long) including thefollowing three words presented at the top of the computerscreen: “stamp,” “send,” and “letter” (task duration: approxi-mately 5 min). Participants were instructed to try to use theirimagination and to be creative when writing their story. Par-ticipants typed their responses into a standard text-editorprogram. Four participants with story lengths that were greaterthan three standard deviations from the mean were excludedfrom all analyses of story-writing task performance. Data from7 participants were excluded due to missing data oruninterpretable stories. A total of 182 participants contributeddata to all story-writing task analyses.
Three students at Yale University served as independentraters and assessed participants’ stories on the following fivedimensions: overall creativity (the extent to which the partic-ipant told a unique story that “came alive”), descriptiveness(the extent to which the participant added additional details),semantic flexibility (the manner and number of unique waysin which the participant used the three words), humor (theextent to which the participant incorporated clever, witty, and/or amusing elements into the story), and emotiveness (theextent to which the participant used words that convey emo-tion and shifts of emotion). Raters assessed each of thesedimensions on a 7-point scale (1–7), with 1 reflecting a lowrating and 7 reflecting a high rating .
Reliability was assessed as the ICC across the three ratingsfor each dimension. For each dimension, ICC values indicatedgood reliability: overall creativity (ICC = .87), descriptiveness(ICC = .87), semantic flexibility (ICC = .90), humor(ICC = .77), and emotiveness (ICC = .77). The average ratingon each dimension across raters was used in all reportedanalyses.
The story-writing dimensions were positively correlated(r values = .27–.88). An exploratory factor analysis usingprincipal axis factoring and direct oblimin rotation (allowingthe factors to correlate) was performed on the five story-writing dimensions listed above. Only one factor with aneigenvalue greater than 1.0 was obtained, and this factoraccounted for 68.1 % of the variance. Because all of thestory-writing dimensions loaded on the same factor, we calcu-lated a story-writing total score, consisting of the sum of each ofthe z-scored dimension scores. In all of the correlation tables,we report correlations with the story-writing total score.
Although participants were instructed to write very shortstories (around four sentences long), there was a great deal ofvariability in story length (M = 71.7 words, SD = 25.8; range:19–155 words). Additionally, story word count correlatedstrongly with story-writing total scores, r (180) = .65. Toensure that the correlations with story-writing performancedid not merely reflect story length, all reported correlationsin Tables 2, 3, 4 and 5 are partial correlations after controllingfor word count. Because the zero-order and partial correlationswere very similar, and in order to ease interpretability, allfigures use the raw scores.
Abbreviated Torrance Test for Adults (ATTA): figuraltests Participants completed Activities 2 and 3 of the Abbrevi-ated Torrance Tests for Adults (ATTA) as a shortened version ofthe Torrance Tests of Creative Thinking. Activities 2 and 3 arethe figural tests of the ATTA and assess nonverbal creativeabilities. For Activity 2 of the ATTA, participants were askedto do the following: “Use the incomplete figures below to makesome pictures. Try to make your pictures unusual. Your picturesshould communicate as interesting and as complete a story aspossible. Be sure to give each picture a title.” For Activity 3,
Behav Res

participants were given nine triangles on a sheet of paper andwere asked to do the following: “See how many objects orpictures you can make from the triangles below, just as youdid with the incomplete figures. Remember to create titles foryour pictures.” Participants were given 3 min to complete eachActivity (task duration: 6 min). A total of 193 participantscontributed data to all Torrance analyses.
Three students at Yale University served as independentraters and assessed participants’ designs on two sets of mea-sures: norm-referenced and criterion-referenced creativity in-dicators. Norm-referenced measures consist of the followingdimensions: fluency (the total number of responses for eachproblem), originality (the unusualness of participants’ re-sponses), and elaboration (the number of elaborative detailsthat participants added to their designs). Activity 3 was ratedon the additional norm-referenced measure of flexibility (thenumber of different ways in which participants used thetriangles). Criterion-referenced creativity indicators consistedof the following dimensions: “openness and resistance topremature closure,” “unusual visualization, different perspec-tive,” “movement and/or sound,” “richness and/or colorful-ness of imagery,” “abstractness of titles,” “articulateness intelling story,” “combination/synthesis of two or more figures,”“internal visual perspective,” “expressions of feelings andemotions,” and “fantasy.” Raters assessed each criterion-referenced measure on a 3-point scale (0–2), with a rating of0 reflecting a low rating and 2 reflecting a high rating .
Reliability was assessed as the ICC across the three ratingsfor each norm-referenced measure and the sum of criterion-referenced measure scores. ICC values for the average ofratings across the three raters indicated good interrater reli-ability for fluency (Activity 2, ICC = .92; Activity 3, ICC =.96), originality (Activity 2, ICC = .66; Activity 3, ICC = .57),elaboration (Activity 2, ICC = .91; Activity 3, ICC = .92),flexibility (Activity 3, ICC = .86), and the sum of criterion-referenced measures (ICC = .84). The average of ratingsacross the three raters for each dimension was used in allreported analyses.
For each Activity, participants’ scores were converted to z -scores for each norm-referenced dimension. The sum of par-ticipants’ scores across all criterion-referenced measures forActivities 2 and 3 was added to the sum of z -scores across allnorm-referenced measures to create a Torrance total score. Inall of the correlation tables, we report correlations with theTorrance total score for ease of interpretability.
Latent inhibition task Participants completed a latent inhibi-tion (LI) task (task duration: 7 min). LI assesses the extent towhich participants experience difficulty in learning to associ-ate a preexposed, formerly irrelevant, stimulus with an out-come. In between-subjects versions of the task, participantswho are preexposed to a stimulus tend to require more time tolearn the association, as compared with participants who have
not been preexposed. The task measures the difficulty partic-ipants have in this form of reversal learning. The LI task wasincluded as a putative measure of creativity based largely onEysenck’s theory of creative achievement (Eysenck, 1993,1995), which points to reduced LI as a marker of the overlapbetween high creative achievement and schizotypal personal-ity. Specifically, highly creative individuals are predicted toshow a tendency toward attentional “overinclusiveness” ofstimuli that others would ignore, just as schizotypal personal-ity is characterized by an inability to exclude irrelevant stimulifrom attention (Gray, Feldon, Rawlins, Hemsley, & Smith,1991; Gray, Hemsley, & Gray, 1992). LI has been negativelyassociated with the “Big Five” (Costa & McCrae, 1992)personality trait of openness to experience (Carson,Peterson, & Higgins, 2003; Peterson & Carson, 2000;Peterson, Smith, & Carson, 2002), and openness to experiencehas been found to positively correlate with trait creativity (e.g.,McCrae, 1987). However, the association between LI andopenness to experience has been inconsistent (Wuthrich &Bates, 2001), and at least one prior report did not find apredicted negative association between LI and trait creativity(Burch, Hemsley, Pavelis, & Corr, 2006).
We used a within-participants version of the LI task (Evans,Gray, & Snowden, 2007). The LI effect was calculated as thedifference in mean RTs for preexposed and nonpreexposedstimuli, where a positive difference score indicates the pres-ence of LI. As is described below, a more robust LI effect wasfound for the RT data, as compared with accuracy data. Thus,we focus on the RT measures for all correlational analyses. Inorder to control for processing speed, a regression wasperformed in which RTs from preexposed stimuli wereregressed on RTs from nonpreexposed stimuli. The residualsfrom this regression were used as a measure of LI.
The same exclusionary criteria as in Evans et al. (2007)were employed: Participants who had more than 7 errors ofomission or more than 14 errors of commission were excludedfrom all analyses involving the LI task. Using these criteria,data from 15 participants were excluded from all LI analyses.Two additional participants were excluded from all LI analy-ses due to missing data. A total of 176 participants contributeddata to all LI analyses.
Creative achievement questionnaire The Creative Achieve-ment Questionnaire (CAQ; Carson, Peterson, & Higgins,2005) consists of 80 questions, 8 in each of the followingdomains: visual arts, music, dance, architectural design, crea-tive writing, humor, inventions, scientific discovery, theater andfilm, and culinary arts (task duration: approximately 5 min).
CAQ total scores (summed across all 10 domains) andindividual domain scores were log-transformed in order tobetter approximate a normal distribution. All analyses involv-ing the CAQ measure employ log CAQ scores. Data from 3participants were excluded from all analyses involving the
Behav Res

CAQ, due to missing data and failure to comply with taskinstructions, leaving 190 participants.
Intelligence and executive function measures
Wechsler adult intelligence scale Participants were adminis-tered the following subtests of the Wechsler Adult IntelligenceScale (WAIS): vocabulary, similarities, block design, and matrixreasoning. Scores for each subtest were converted to scaledscores and summed to yield the following scores: total (sumacross all four subtests), verbal (sum of vocabulary and similar-ities subtests), and performance (sum of block design andmatrixreasoning subtests; task duration: approximately 50 min).
The sum of scaled scores for WAIS total, verbal, andperformance measures were then converted to Wechsler De-viation Quotients (DQs) using the conversion table providedin Tellegen and Briggs (1967). A total of 190 participantscontributed data to all WAIS analyses.
Raven’s advanced progressive matrices Participants complet-ed selected questions from the Raven’s Advanced ProgressiveMatrices (RAPM; Raven, Raven, & Court, 1998), whichserves as a measure of general fluid intelligence (gF; taskduration: 15 min). Participants were administered 12 itemsselected from Set II, each of which required the participant toidentify the answer option (out of eight provided options) thatcorrectly completed a given pattern.
Participants’ accuracy on the RAPM served as the measureof performance for this task. Data from 2 participants wereexcluded from all analyses involving the RAPM due to at-chance levels of performance on this task. A total of 191participants contributed data to all RAPM analyses.
Three-back verbal working memory task Participants com-pleted a three-back working memory task in which they werepresented with words in a serial fashion (task duration: ap-proximately 7 min). Participants were instructed to make aresponse when a presented word was the same word that hadbeen presented three stimuli ago. Participants’ accuracy (per-cent correct), d ′, and mean RT (only for correct trials) servedas measures of performance on this task.
Data from 8 participants were removed from all analysesinvolving the three-back task due to performance at chancelevels or below (e.g., negative d ′ values). A total of 184participants contributed data to all three-back task analyses.
Task-switching paradigm Participants completed a number–letter task (adapted from Rogers & Monsell, 1995), designedto assess participants’ ability to switch between different tasksets (task duration: approximately 8 min). Both a letter and anumber were presented on each trial. If the letter and numberappeared in blue, participants were instructed to make aconsonant/vowel judgment for the letter by pressing one of
two labeled keys. If the letter and number appeared in orange,participants were instructed to make an odd/even judgment forthe number by pressing one of two labeled keys.
To control for processing speed, a regression was performedin which RTs from switch trials were regressed on RTs from no-switch (repeat) trials. The residuals from this regression wereused as a measure of task-switching difficulty. Data from 3participants were excluded from all analyses involving the task-switching paradigm, because their RT difference scores forswitch and no-switch trials (i.e., the RT switch cost) were furtherthan three standard deviations from the mean RT switch costacross participants. Additionally, 2 participants were excludedfrom all task-switching analyses, due to missing data. A total of188 participants contributed data to all task-switching analyses.
Personality measures
Big five aspect scales Participants completed the Big FiveAspects Scales (BFAS) personality questionnaire (DeYoung,Quilty, & Peterson, 2007) (task duration: approximately6 min). The BFAS personality questionnaire assesses thefollowing two aspects of each Big Five personality domain:neuroticism (volatility, withdrawal), agreeableness (compas-sion, politeness), conscientiousness (industriousness, orderli-ness), extraversion (enthusiasm, assertiveness), and openness/intellect (openness, intellect). The BFAS includes a total of100 items, with 10 items per aspect. A total of 190 participantscontributed data to all BFAS analyses.
NEO openness to experience scale Participants completed theNEO Openness to Experience scale (task duration: approxi-mately 4 min). This scale assesses the following six facets ofthe Revised NEO Personality Inventory (NEO-PI–R) person-ality trait of openness (Costa & McCrae, 1992), with eightitems per facet: actions (“openness to new experiences on apractical level”), aesthetics (“appreciation of art and beauty”),fantasy (“receptivity to the inner world of imagination”),feelings (“openness to inner feelings and emotions”), ideas(“intellectual curiosity”), and values (“readiness to reexamineown values and those of authority figures”). A total of 193participants contributed data to all analyses involving theNEO Openness to Experience scale.
Results
We first report results from the verb generation task and thenits relationships with creativity, intelligence, personality, and acreativity factor. Descriptive statistics for all creativity mea-sures described above are provided in Table 1. Descriptivestatistics for all other measures are provided in the onlineSupplementary Materials: Table S1 (intelligence and execu-tive function), and Table S2 (personality). For the CAQ,
Behav Res

divergent thinking tasks, story-writing task, and Torrancefigural tests, raw scores are provided in Table 1. However,all analyses employed transformed values for these measures(log CAQ scores; sum of z -scores for divergent thinking,story-writing tasks, and Torrance figural tests).
Verb generation task
We scored the verb generation task in terms of semantic distanceand RT. Reliabilities were calculated for the mean semanticdistance values and RTs for each mini-block of two consecu-tively presented cued and uncued nouns. Reliability for seman-tic distance values in the cued condition was high (α = .78);however, reliability for semantic distance values in the uncuedcondition was lower (α= .40). Reliabilities were high for meanRTs in both cued (α = .88) and uncued (α = .86) conditions.
Participants’mean semantic distance values were submittedto a 2 × 2 repeated measures ANOVA, with the two within-subjects factors of cue type (cued, uncued) and constraint level
(high, low) (see Fig. 1a). As was predicted, a main effect of cuetype was found, F(1, 182) = 172.1, p < .001, partial η2 = .486,due to the higher semantic distance values for cued than foruncued items. That is, when cued to respond creatively, partic-ipants produced verbs that were more semantically distant thanwhen not so cued.
A marginally significant main effect of constraint level wasfound, F(1, 182) = 3.2, p = .07, partial η2 = .017, due to a trendtoward higher semantic distance values for verb responses tolow-constraint nouns, as compared with high-constraint nouns.Interestingly, a cue type × constraint-level interaction effect waspresent, F(1, 182) = 24.8, p < .001, partial η2 = .120. That is,the constraint level of the noun had differential effects on themagnitude of the semantic distance value for the generated verbresponse, depending on whether the noun was cued or uncued.For uncued nouns, high-constraint nouns prompted more sim-ilar verb responses (smaller semantic distance values). In con-trast, for cued nouns, high-constraint nouns yielded more dis-similar verb responses (higher semantic distance values). Al-though we did not anticipate this effect, a possible explanationis that because higher constraint nouns are more easily associ-ated with a common verb response, it may, in turn, be easier togenerate an uncommon response for these nouns simply bychoosing anything except the first word that comes to mind.
We also submitted participants’mean RTs to the same 2 × 2(cue type × constraint level) repeated measures ANOVA (seeFig. 1b). A main effect of cue type was found, F (1, 174) =239.7, p < .001, partial η2 = .579, with longer RTs in the cuedthan in the uncued condition. A main effect of constraint levelwas also found, F(1, 174) = 8.3, p < .01, partial η2 = .045,with longer RTs for the high-constraint than for the low-constraint condition. No interaction was present, F = 0.09,p = .77, partial η2 = 0.
Because responding at random is not the same asresponding creatively, we sought to assess random respondingas best we could. The instructions placed some constraint onthe responses: The words said out loud were required to be aspecific part of speech (verbs). Nonetheless, a verb generatedat randommay be semantically distant from a given noun and,as such, is not necessarily creative. Assessment of the appro-priateness of a given response is nontrivial, due to the inabilityof experimenters to know how a verb response might berelated to a noun for any given participant. Nonetheless, tobetter suggest that our findings are not driven by merelyrandom responding, we conducted an additional set of analy-ses in which we screened participants’ responses for semanticappropriateness, excluding both any responses that appearedto be semantically unrelated to the presented noun and thosethat only 1 participant had generated. This identified only0.6 % of all responses, suggesting that participants typicallywere generating semantically appropriate responses. Further-more, exclusion of these responses led to a pattern of resultsvery similar to those reported below. Due to the small
Table 1 Descriptive statistics for creativity measures
Measure M SD Range
Verb Generation Task
Cued RT 3,649 869 1,274–5,765
Uncued RT 2,791 649 1,056–5,238
Cued semantic distance 0.76 0.06 0.64–0.90
Uncued semantic distance 0.70 0.04 0.63–0.81
Divergent Thinking Task
Total score 95.12 32.62 26–217
Flexibility 36.18 9.93 9–69
Originality 26.16 14.40 3–79
Fluency 32.78 10.22 9–73
Story Writing Task
Total score 18.32 5.55 5.33–31
Overall creativity 4.28 1.39 1–7
Descriptiveness 4.21 1.35 1–7
Semantic flexibility 3.68 1.44 1–7
Humor 2.91 1.36 1–6.3
Emotiveness 3.23 1.25 1–6.7
Torrance Figural Tests
Total score 40.43 15.40 0–82
Flexibility 2.72 1.27 0–5.67
Originality 3.75 1.82 0–8
Fluency 5.78 2.61 0–12
Elaboration 20.56 9.51 0–54.33
Criterion-referenced measures 7.61 3.03 0–13.33
Latent Inhibition Task
Latent inhibition score (RT Difference) 147 240 −430–782CAQ Total Score 21.73 17.14 0–102
Note. CAQ: Creative Achievement Questionnaire. Reaction times (RTs)are given in milliseconds.
Behav Res

percentage of these types of responses and the fact that theirexclusion did not significantly impact our findings, we haveretained them in our analyses.
Relation to creativity measures
Correlations between semantic distance on the verb genera-tion task and all creativity measures are presented in Table 2.In brief, we found that semantic distance values in the cued,but not the uncued, condition significantly predicted partici-pants’ performance on many of the measures—including cre-ative cognition, production, and achievement—strongly vali-dating the task as a measure of creative cognition.
Divergent thinking
Correlations between participants’ semantic distance valuesand their divergent thinking task performance are presented inTable 2 and Fig. 2. Participants’ semantic distance values werea significant predictor of their divergent thinking total scoresin the cued condition (ß = .46, p < .001), but not in the uncuedcondition (ß = .03, p = .72). Cued semantic distance valuesexplained unique variance in divergent thinking total scoresafter accounting for the variance explained by uncued seman-tic distance values,ΔR2 = .21,ΔF(1, 170) = 46.39, p < .001.Cued semantic distance values also significantly predicteddivergent thinking performance for each dimension: flexibil-ity (ß = .41, p < .001), fluency (ß = .44, p < .001), andoriginality (ß = .47, p < .001). However, uncued semanticdistance values did not significantly predict divergent thinkingperformance for any of these dimensions (ps > .21).
Story writing
After controlling for story-writing word counts, semanticdistance values significantly predicted story-writing total
scores in the cued (ß = .31, p < .001) but not in the uncued(ß = .01, p = .90) condition (see Fig. 3). After accounting forthe variance explained by story-writing word counts anduncued semantic distance values, cued semantic distancevalues still explained unique variance in story-writing totalscores, ΔR2 = .09, ΔF (1, 169) = 32.12, p < .001. Thus,participants who generated more semantically distant re-sponses in the cued condition also generated more creativestories in the story-writing task.
Torrance figural test
Semantic distance values in the cued (ß = .19, p < .05),but not the uncued (ß = −.10, p = .19) condition signif-icantly predicted Torrance total scores (see Fig. 4). Afteraccounting for the variance explained by uncued semanticdistance values, cued semantic distance values explained asignificant proportion of unique variance in Torrance totalscores, ΔR2 = .04, ΔF (1, 180) = 6.68, p < .05. Theseresults indicate that participants who generated more se-mantically distant responses in the cued condition of theverb generation task also drew more creative figures in theTorrance tests.
Latent inhibition
Replicating the main finding from Evans et al. (2007), ourparticipants demonstrated robust LI as a group. Participantshad longer RTs to the preexposed (M = 1,331, SD = 182) thanto the nonpreexposed (M = 1,184, SD = 261) stimuli, t(175) =8.12, p < .001, d = 0.65. However, cued semantic distancevalues did not significantly predict individual participants’residual RT effects for the LI task (ß = −.09, p = .23). Uncuedsemantic distance values were marginally related (ß = −.14,p = .08) (see Table 2). Neither of these results was expected.
2000
2200
2400
2600
2800
3000
3200
3400
3600
3800
4000
Cued Uncued
Mea
n R
T (
ms)
Stimulus Condition(cue type, constraint level)
Low Constraint
High Constraint
0.6
0.62
0.64
0.66
0.68
0.7
0.72
0.74
0.76
0.78
0.8
Cued Uncued
Mea
n S
eman
tic D
ista
nce
Stimulus Condition(cue type, constraint level)
Low Constraint
High Constraint
A B
Fig. 1 Performance on verb generation task by noun cue type (cued, uncued) and noun constraint level (low, high) in terms of a mean semantic distanceand b mean reaction times (RTs)
Behav Res

Creative achievement
Semantic distance values significantly predicted participants’log CAQ scores in the cued condition (ß = .18, p < .05), butnot in the uncued condition (ß = 0.10, p = .19) (see Fig. 5).Cued semantic distance scores explained a significant portionof log CAQ scores after accounting for variance explained byuncued semantic distance scores, ΔR2 = .03, ΔF (1, 177) =5.84, p < .05. Thus, participants with higher levels of creativeachievement tended to produce more creative verb responses.
We also examined the relationship between participants’scores on individual CAQ domains and their semantic dis-tance values for the different conditions of the verb generation
task in an exploratory analysis (see Table 3). For cued nouns,significant positive correlations were found between partici-pants’ semantic distance values and log-transformed CAQscores in the science and visual art domains. For uncuednouns, a significant positive correlation was found betweenparticipants’ semantic distance values and log-transformedCAQ scores in the creative writing domain.
Relation to intelligence
Greater semantic distance in the cued condition was positivelyrelated to intelligence and executive function. Correlationsbetween performance on the verb generation task and
Table 2 Correlations between verb generation task performance and creativity measures (divergent thinking, story writing, Torrance figural tests, latentinhibition, and Creative Achievement Questionnaire [CAQ])
Verb GenerationTask SemanticDistance
Divergent Thinking
Cued Uncued Total Flexibility Originality Fluency Story WritingTotal
TorranceTotal
Latent Inhibition(Residual RT)
Verb generation cued semantic distance – – – – – – – – –
Verb generation uncued semantic distance .11 – – – – – – – –
Divergent thinking total .47 .08 – – – – – – –
Flexibility .42 .07 .94 – – – – – –
Originality .48 .14 .92 .76 – – – – –
Fluency .43 .02 .98 .91 .86 – – – –
Story writing total .40 .05 .34 .35 .30 .32 – – –
Torrance total .18 −.08 .33 .36 .25 .32 .21 – –
Latent inhibition (residual RT) −.11 −.15 .00 .07 −.06 .01 −.12 −.01 –
log CAQ total .19 .12 .21 .22 .21 .18 .13 .05 .13
Note. Significant correlations (p < .05) indicated in bold. Marginally significant correlations (p < .10) indicated in italics. Not corrected for multiplecomparisons.
-20
-15
-10
-5
0
5
10
15
20
25
30
0.5 0.6 0.7 0.8 0.9 1
Div
erge
nt T
hink
ing
Tota
l (z-
scor
e)
Cued: Mean Semantic Distance
-20
-15
-10
-5
0
5
10
15
20
25
30
0.5 0.6 0.7 0.8 0.9 1
Div
erge
nt T
hink
ing
Tota
l (z-
scor
e)
Uncued: Mean Semantic Distance
A B
Fig. 2 Correlations between verb generation task semantic distance values and divergent thinking total scores for a cued nouns and b uncued nouns.Lines shown indicate linear regression lines. Corresponding Pearson r coefficients are provided in Table 2
Behav Res

intelligence and executive function are presented in Table 4;correlations among the intelligence and executive functionmeasures are presented separately in Table S3 in the onlineSupplementary Materials.
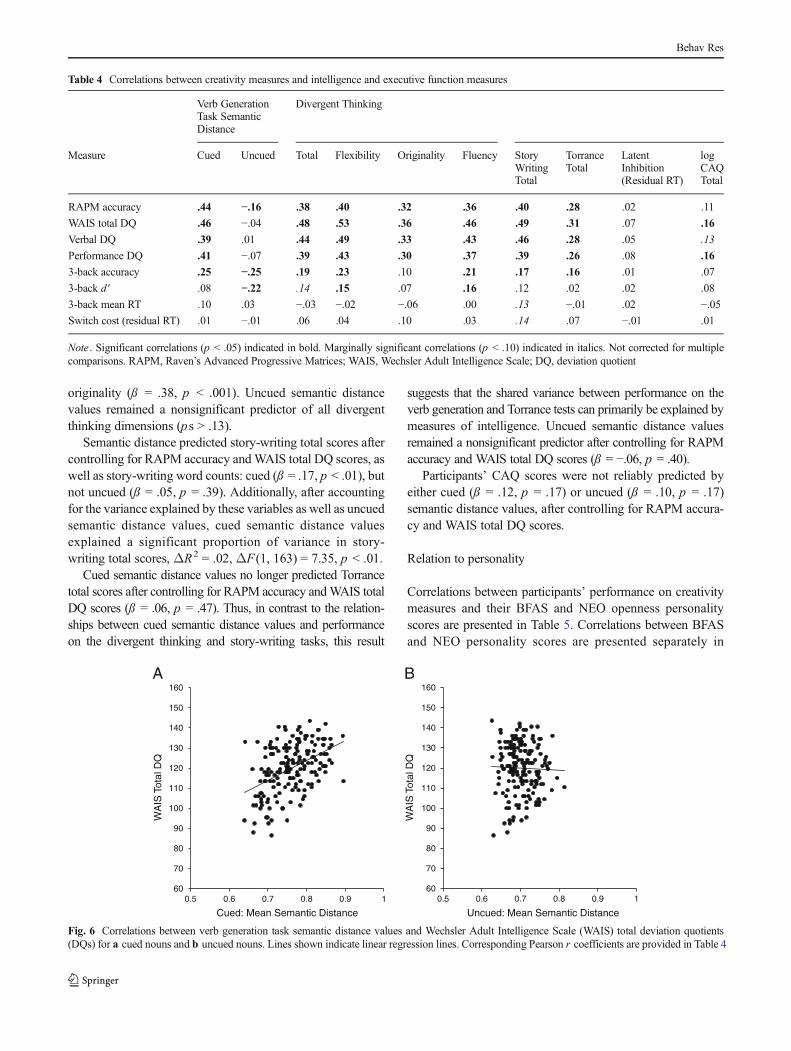
Semantic distance values predicted participants’ WAIStotal scores in the cued (ß = .47, p < .001), but not the uncued(ß = −.09, p = .17), condition (see Fig. 6). Cued semanticdistance values explained unique variance in WAIS totalscores after accounting for the variance explained by uncuedsemantic distance values, ΔR2 = .22, ΔF(1, 177) = 49.98,p < .001. Additionally, cued semantic distance values signif-icantly predicted WAIS verbal (ß = .39, p < .001) and perfor-mance (ß = .42, p < .001) scores. Uncued semantic distancevalues did not predict WAIS verbal scores (ß = −.03, p = .63)
and only marginally predicted WAIS performance scores(ß = −.12, p = .08).
Cued semantic distance was a positive predictor of RAPMaccuracy (ß = .46, p < .001). Unexpectedly, uncued semanticdistance values were a negative predictor of RAPMaccuracy (ß = −.21, p < .01). After accounting for the varianceexplained by uncued semantic distance values, cued semanticdistance values explained unique variance in RAPMaccuracy, ΔR2 = .21, ΔF(1, 179) = 49.28, p < .001. Theseresults indicate that participants with higher intelligencescores on the WAIS and RAPM generated more unusual verbresponses to cued nouns.
Cued semantic distance values predicted three-back work-ing memory accuracy (ß = .28, p < .001). These results
-15
-10
-5
0
5
10
15
0.5 0.6 0.7 0.8 0.9 1
Sto
ry W
ritin
g To
tal (
z-sc
ore)
Cued: Mean Semantic Distance
-15
-10
-5
0
5
10
15
0.5 0.6 0.7 0.8 0.9 1
Sto
ry W
ritin
g To
tal (
z-sc
ore)
Uncued: Mean Semantic Distance
A B
Fig. 3 Correlations between verb generation task semantic distance values and story-writing total scores (zero-order correlation) for a cued nouns and buncued nouns. Lines shown indicate linear regression lines. Pearson r coefficients (controlling for story-writing word count) are provided in Table 2
-20
-15
-10
-5
0
5
10
15
20
25
0.5 0.6 0.7 0.8 0.9 1
Cued: Mean Semantic Distance
-20
-15
-10
-5
0
5
10
15
20
25
0.5 0.6 0.7 0.8 0.9 1
Torr
ance
Tot
al S
core
Torr
ance
Tot
al S
core
Uncued: Mean Semantic Distance
A B
Fig. 4 Correlations between verb generation task semantic distance values and Torrance total scores for a cued nouns and b uncued nouns. Lines shownindicate linear regression lines. Corresponding Pearson r coefficients are provided in Table 2
Behav Res

indicate that participants who had higher accuracy on thethree-back task also tended to generate more creative re-sponses in the verb generation task. However, no significantrelationships were found with d ′ or mean RTs for the three-back task, or task-switching performance ( ps > .15). Uncuedsemantic distance values were a significant negative predictorof three-back accuracy ( ß = −.28, p < .001) and d ′ ( ß = −.23,p < .01). No significant relationships were found with three-back mean RT or task-switching performance ( ps > .29).
Relation to creativity, controlling for intelligence
We sought to further clarify the relationships between crea-tivity measures after controlling for intelligence. Althoughthese relationships were reduced in strength, most remainedsignificant; the Torrance Figural Test and CAQ were no
longer so. These results suggest that although intelligencecan account for some of the shared variance between per-formance on the verb generation task and other creativitymeasures, a significant relationship remains, over and aboveintelligence.
Semantic distance predicted divergent thinking total scoresafter controlling for both RAPM accuracy andWAIS total DQscores: cued ( ß = .33, p < .001), but not uncued ( ß = .05,p = .46). Additionally, after accounting for uncued semanticdistance, RAPM accuracy, and WAIS total DQ scores, it wasstill the case that cued semantic distance values explainedunique variance in divergent thinking total scores, ΔR2 =.08, ΔF(1, 167) = 19.11, p < .001. Cued semantic distancevalues also predicted performance in each dimension of thedivergent thinking tasks after controlling for these variables:flexibility ( ß = .24, p < .01), fluency ( ß = .30, p < .001), and
0
0.5
1
1.5
2
2.5
0.5 0.6 0.7 0.8 0.9 1
log
CA
Q T
otal
Sco
re
Cued: Mean Semantic Distance
0
0.5
1
1.5
2
2.5
0.5 0.6 0.7 0.8 0.9 1
log
CA
Q T
otal
Sco
re
Uncued: Mean Semantic Distance
A B
Fig. 5 Correlations between verb generation task semantic distance values and log CAQ total scores for a cued nouns and b uncued nouns. Lines shownindicate linear regression lines. Corresponding Pearson r coefficients are provided in Table 2
Table 3 Correlations between log Creative Achievement Questionnaire (CAQ) domain scores and creativity measures
Log CAQ Domain Scores
Measure Architecture CreativeWriting
Culinary Dance Humor Inventions Music Science Theater VisualArts
Verb generation cued semantic distance .07 .04 .09 .09 .02 .10 .10 .15 .09 .18
Verb generation uncued semantic distance .05 .17 .00 −.04 .01 −.06 .02 .10 .11 .05
Divergent thinking total .17 .14 .11 .03 .01 .16 .08 .22 .10 .15
Flexibility .16 .13 .11 −.03 .02 .17 .09 .24 .09 .15
Originality .15 .15 .11 .05 .02 .15 .05 .17 .09 .18
Fluency .16 .12 .10 .06 .00 .13 .08 .20 .09 .11
Story writing total .12 .03 −.16 .01 −.03 −.01 .09 .05 .16 .08
Torrance total .02 .07 −.04 −.16 −.02 .10 .08 .05 .03 .09
Latent inhibition (residual RT) .03 −.05 .08 .06 .01 .08 .15 .04 .01 −.04
Note. Significant correlations (p < .05) indicated in bold. Marginally significant correlations (p < .10) indicated in italics. Not corrected for multiplecomparisons.
Behav Res
originality (ß = .38, p < .001). Uncued semantic distancevalues remained a nonsignificant predictor of all divergentthinking dimensions (ps > .13).
Semantic distance predicted story-writing total scores aftercontrolling for RAPM accuracy andWAIS total DQ scores, aswell as story-writing word counts: cued (ß = .17, p < .01), butnot uncued (ß = .05, p = .39). Additionally, after accountingfor the variance explained by these variables as well as uncuedsemantic distance values, cued semantic distance valuesexplained a significant proportion of variance in story-writing total scores, ΔR2 = .02, ΔF(1, 163) = 7.35, p < .01.
Cued semantic distance values no longer predicted Torrancetotal scores after controlling for RAPM accuracy andWAIS totalDQ scores (ß = .06, p = .47). Thus, in contrast to the relation-ships between cued semantic distance values and performanceon the divergent thinking and story-writing tasks, this result
suggests that the shared variance between performance on theverb generation and Torrance tests can primarily be explained bymeasures of intelligence. Uncued semantic distance valuesremained a nonsignificant predictor after controlling for RAPMaccuracy and WAIS total DQ scores (ß = −.06, p = .40).
Participants’ CAQ scores were not reliably predicted byeither cued (ß = .12, p = .17) or uncued (ß = .10, p = .17)semantic distance values, after controlling for RAPM accura-cy and WAIS total DQ scores.
Relation to personality
Correlations between participants’ performance on creativitymeasures and their BFAS and NEO openness personalityscores are presented in Table 5. Correlations between BFASand NEO personality scores are presented separately in
Table 4 Correlations between creativity measures and intelligence and executive function measures
Verb GenerationTask SemanticDistance
Divergent Thinking
Measure Cued Uncued Total Flexibility Originality Fluency StoryWritingTotal
TorranceTotal
LatentInhibition(Residual RT)
logCAQTotal
RAPM accuracy .44 −.16 .38 .40 .32 .36 .40 .28 .02 .11
WAIS total DQ .46 −.04 .48 .53 .36 .46 .49 .31 .07 .16
Verbal DQ .39 .01 .44 .49 .33 .43 .46 .28 .05 .13
Performance DQ .41 −.07 .39 .43 .30 .37 .39 .26 .08 .16
3-back accuracy .25 −.25 .19 .23 .10 .21 .17 .16 .01 .07
3-back d ′ .08 −.22 .14 .15 .07 .16 .12 .02 .02 .08
3-back mean RT .10 .03 −.03 −.02 −.06 .00 .13 −.01 .02 −.05Switch cost (residual RT) .01 −.01 .06 .04 .10 .03 .14 .07 −.01 .01
Note . Significant correlations (p < .05) indicated in bold. Marginally significant correlations (p < .10) indicated in italics. Not corrected for multiplecomparisons. RAPM, Raven’s Advanced Progressive Matrices; WAIS, Wechsler Adult Intelligence Scale; DQ, deviation quotient
60
70
80
90
100
110
120
130
140
150
160
0.5 0.6 0.7 0.8 0.9 1
WA
IS T
otal
DQ
Cued: Mean Semantic Distance
60
70
80
90
100
110
120
130
140
150
160
0.5 0.6 0.7 0.8 0.9 1
WA
IS T
otal
DQ
Uncued: Mean Semantic Distance
A B
Fig. 6 Correlations between verb generation task semantic distance values and Wechsler Adult Intelligence Scale (WAIS) total deviation quotients(DQs) for a cued nouns and b uncued nouns. Lines shown indicate linear regression lines. Corresponding Pearson r coefficients are provided in Table 4
Behav Res

Table S4 in the online Supplementary Materials. As is indi-cated in Table 5, correlations were found between personalityscores (as predicted for the dimension of openness) and sev-eral creativity measures. Here, we focus on relationshipsbetween personality and verb generation performance.
Cued (ß = .19, p < .05), but not uncued (ß = .02, p = .77),semantic distance values significantly related to participants’openness scores (see Fig. 7). Cued semantic distance values
explained a significant proportion of variance in opennessscores after controlling for the variance explained by uncuedsemantic distance values,ΔR2 = .03,ΔF (1, 177) = 6.19, p <.05. As is shown in Table 5, cued semantic distance valuesalso predicted several facets of the NEO Openness to Experi-ence scale. These results suggest that participants with higheropenness scores generated more creative (and more semanti-cally distant) verb responses primarily in the cued condition.
Table 5 Correlations between creativity measures and personality measures (Big Five Aspects Scales [BFAS], NEO openness)
Verb GenerationTask SemanticDistance
Divergent Thinking
Personality Measure Cued Uncued Total Flexibility Originality Fluency StoryWritingTotal
TorranceTotal
LatentInhibition(Residual RT)
logCAQTotal
BFAS openness 0.19 0.04 0.08 .10 .07 .04 .22 .18 .00 .39
BFAS intellect −.03 .03 .06 .11 .00 .07 .00 .05 .05 .22
BFAS assertiveness −.21 .14 .10 .06 .12 .09 −.09 −.01 .04 .25
BFAS enthusiasm −.09 .04 .09 .09 .08 .08 .03 .14 .07 .18
BFAS orderliness −.20 −.08 .07 .06 .01 .12 −.10 .05 .06 −.08BFAS industriousness −.22 .08 .01 −.01 −.02 .05 −.18 −.09 .04 .12
BFAS politeness −.09 −.13 −.22 −.19 −.27 −.15 .004 .08 .04 −.11BFAS compassion .08 −.02 .13 .10 .12 .15 .04 .20 .07 .04
BFAS withdrawal .10 −.04 .08 .09 .04 .09 .03 .10 −.09 −.09BFAS volatility .03 −.03 .12 .11 .10 .12 .01 .06 −.10 −.04NEO actions .17 .16 .10 .11 .13 .05 .16 .16 −.06 .17
NEO aesthetics .18 .03 .10 .10 .10 .08 .19 .15 .07 .40
NEO fantasy .17 .03 .05 .11 .03 .01 .15 .20 −.03 .16
NEO feelings .13 −.01 .14 .15 .11 .13 .22 .13 −.01 .25
NEO ideas .05 .04 .07 .10 .05 .07 .01 .04 .07 .19
NEO values .21 .02 .17 .21 .12 .16 .13 .32 −.08 .05
Note. Significant correlations (p < .05) indicated in bold. Marginally significant correlations (p < .10) indicated in italics. Not corrected for multiplecomparisons.
1
2
3
4
5
0.5 0.6 0.7 0.8 0.9 1
BFA
S O
penn
ess
Sco
re
Cued: Mean Semantic Distance
1
2
3
4
5
0.5 0.6 0.7 0.8 0.9 1
BFA
S O
penn
ess
Sco
re
Uncued: Mean Semantic Distance
A B
Fig. 7 Correlations between verb generation task semantic distance values and Big Five Aspects Scales (BFAS) openness scores for a cued nouns and buncued nouns. Lines shown indicate linear regression lines. Corresponding Pearson r coefficients are provided in Table 5
Behav Res

As is presented in Table 5, no significant relationshipbetween cued semantic distance and intellect was evident. Inexploratory analyses reported for descriptive purposes, nega-tive correlations were found between cued semantic distanceand assertiveness, orderliness, and industriousness. Foruncued semantic distance, there was a weaker negative corre-lation between uncued values and the BFAS aspect of polite-ness and a positive correlation with assertiveness.We note thatthese correlations could well be spurious, given that we didnot control for multiple comparisons; we simply describe theobtained effect sizes.
Relation to a creativity factor
As was anticipated, our measures of creative cognition, crea-tive production, and creative achievement were positivelycorrelated. To assess the factor structure, we used principal-axis factoring, with direct oblimin rotation (Δ = 0) to allow forcorrelated factors, on total scores for the following creativitytask measures: divergent thinking, story writing, Torrancefigural tests, and the CAQ. Although marginally significantlyassociated with uncued semantic distance scores, LI taskperformance did not significantly correlate with any othermeasures used in this study. This was surprising, since wehad expected LI performance to correlate with other measuresof creativity, as well as the personality trait of openness toexperience. However, the association between LI and mea-sures of creativity and openness to experience has been in-consistent in the literature (e.g., Burch et al.,2006;Wuthrich &Bates, 2001). As a result, we chose to exclude the LI task fromour factor analysis. Only one factor with an eigenvalue greaterthan 1.0 was obtained. This factor accounted for 42.46 % ofthe variance; we refer to it as a creativity factor. The factorloadings were the following: divergent thinking, 0.77; storywriting, 0.49; Torrance figural tests, 0.45; and the CAQ, 0.23.
We next performed a multiple regression analysis withcued and uncued semantic distance variables from the verbgeneration task included as predictors of creativity (factorscores). As might be expected from the relationships reportedin the Relation to Creativity Measures section, cued semanticdistance predicted creativity (ß = .50), whereas uncued did not(ß = .03). Cued semantic distance predicted a variance increativity after accounting for uncued semantic distance,ΔR2 = .25, ΔF(1, 160) = 53.88, p < .001.
Because several of the creativity measures were signifi-cantly correlated with both intelligence and personalityscores, we next investigated the discriminant validity ofour cued creativity variant of the verb generation task. Amultiple regression was performed, controlling for the fol-lowing variables: WAIS total scores, RAPM accuracy, andBFAS openness scores. Even after controlling for theseintelligence and personality and uncued semantic distancevalues, cued semantic distance values remained a significant
predictor (ß = .30, p < .001) and explained unique variancein participants’ creativity factor scores, ΔR2 = .07, ΔF (1,156) = 17.66, p < .001.
In sum, the factor-analysis results indicate that the cuedcondition of our version of the verb generation task is quitestrongly associated with a creativity factor, in the sense of thevariance common across a diverse battery of creativity mea-sures (ß = .50). Furthermore, this relationship was not entirelyexplained by intelligence or personality.
Discussion
The data strongly suggest that individual differences in crea-tive cognition can be inferred accurately from single-wordutterances—in our case, verbs spoken aloud in response tovisually presented nouns. Greater semantic distance of thenoun–verb pairs was correlated positively with a creativityfactor derived from a battery of measures, including verbal,nonverbal, and achievement-based measures.
Here, we highlight four main aspects of the results. First,semantic distance was higher in the cued than in the uncuedcondition, suggesting that untrained participants were able tomodulate their word production effectively, and do so ondemand. Second, participants’ semantic distance values inthe cued condition predicted performance across diverse mea-sures of creativity, even after controlling for intelligence(which itself should correlate positively with creativity, anddid so in our data). Third, cued semantic distance scoressignificantly predicted creativity factor scores, representingthe shared variance across our diverse creativity measures,greatly reducing the influence of task- or method-specificvariance. Furthermore, this relationship remained significantafter controlling for both intelligence and self-reported open-ness personality scores. Fourth, we believe that the task issuitable for behavioral and brain-imaging studies in diversepopulations, including ERP, MEG, and fMRI. Below, weconsider the advantages and limitations of our novel verbgeneration task with respect to other creativity measures,including the contribution of intrinsic and extrinsic factors inimpacting creative performance.
Verb generation task as a measure of creative cognition
Aswas noted in the Introduction, there are several measures ofcreativity that have been used extensively in the creativityliterature. The verb generation task, a classic cognitive neuro-science measure of language production and semantic pro-cessing abilities, can be adapted to serve as a measure ofcreative abilities, with certain advantages over existing mea-sures of creativity. Although the tasks mentioned above assessparticipants’ creative abilities and are popular indices of indi-vidual differences in creativity, they tend to rely on assessment
Behav Res

of creative products by groups of raters. Semantic distancevalues, derived using LSA techniques, serve as a stronglyobjective measure of semantic distance that is not subject tothe potentially shared biases of raters measures of creativity.Importantly, LSA values can be derived for different popula-tions, to better reflect a shared language environment. Forassessing creativity, LSAvalues are probably meaningful onlyfor comparisons within a group sharing a common languagebackground.
Additionally, our use of semantic distance values as ametric of creativity improves upon previous studies that haveattempted to uncover the mechanisms underlying processingof distant semantic relationships. In a neuroimaging study ofthe neural correlates of generating typical versus unusualsemantic associations, Seger et al. (2000) had participantsperform a verb generation task in which they generated eitherthe first verb that came tomind or a verb that was related to thenoun in an unusual way, in alternating blocks. Since no overtresponses were collected, the sole measure of behavioralperformance consisted of efficiency in responding, or RTs.Similar to our findings, Seger et al. found that participantstook significantly longer to generate unusual verbs topresented nouns. Additionally, the authors found increasedneural activity in the right prefrontal cortex associated withthe generation of unusual verbs. Although these findings arecertainly intriguing, they also raise several questions. Sinceovert responses were not collected, it is not possible to deter-mine either the degree of novelty or the appropriateness ofparticipants’ responses. Furthermore, RTs serve as merely acrude measure of creative abilities (Fink et al., 2007). Thus,our cued creativity verb generation task offers a more objec-tive, corpus-based measure of creative performance that cap-tures the degree of novelty of participants’ responses in briefsamples of observed behavior and serves as a reliable index ofindividual differences in creativity.
We have also validated our novel cued creativity verbgeneration task by demonstrating its relationship with sev-eral different measures of creativity. The present studymakes a unique contribution to the creativity literature interms of both the diversity of measures in our battery thatassess different aspects of creativity and the investigation ofthe role of both intrinsic and extrinsic factors in impactingcreative performance within the same large sample of par-ticipants. There has been some resistance to the notion thatcreativity is a monolithic construct and, in particular, thatcreativity is synonymous with divergent thinking (seeArden, Chavez, Grazioplene, & Jung, 2010; Dietrich,2007). In order to more effectively capture the complexityof the processing mechanisms underlying creativity, we in-cluded a variety of measures in our battery of creative tasksin order to assess different facets of creativity. The tasks inthis battery included measures of divergent thinking, story-writing ability (i.e., verbal creative production), Torrance
figural test performance (i.e., nonverbal creative production),and creative achievement (self-reported). By demonstratingsignificant relationships between performance in the cuedcondition of the verb generation task and each of thesemeasures, we have shown that “thin slices” of creativityfrom our task appear to assess a similar processing mecha-nism that is invoked by each of these different measures.Indeed, the diversity of these measures greatly mitigates anyconcern that it is merely superficial similarities that aredriving these relationships. Notably, a factor analysis re-vealed that performance on the various measures loadedonto a single factor, thus suggesting that despite the consid-erable differences across these measures, they also assess acommon element—presumably, creativity. Furthermore, thiscommon creative ability, representing the shared varianceacross these diverse measures, was significantly related tocued, but not uncued, performance on the verb generationtask. Although this study was not designed to directly testthe question of whether creative abilities are domain specificor domain general in nature, our results suggest that thereappears to be some degree of domain generality across themeasures in our creativity battery (see Chen et al., 2006;Plucker & Beghetto, 2004). This finding, however, does notpreclude the possibility of additional domain-specific crea-tivity abilities (e.g., Baer, 1998; Silvia, Kaufman, & Pretz,2009).
A key advantage of our novel verb generation task is itssuitability for use in neuroimaging paradigms. For the maineffect of cue type, we performed a post hoc power analysisusing G*Power 3.1.7 (Faul, Erdfelder, Lang, & Buchner,2007). Input parameters consisted of the following: effect size[f (U) = 0.972, derived by G*Power 3.1.7 from our observedeffect size of partial η2 = .486], α error probability (= .05),total sample size (= 20), number of groups (= 1), number ofmeasurements (= 2, reflecting cued and uncued trial types),and nonsphericity correction ε (= 1). We found that with 20subjects, one would have 98 % power to detect the observedeffect size of partial η2 = .486. Since neuroimaging studiestypically use sample sizes around 20 subjects, the cued crea-tivity verb generation task serves as a paradigm that is suitableand convenient for fMRI studies.
The role of intrinsic and extrinsic factors in impacting creativeperformance
Our results indicate that both intrinsic and extrinsic factorsimpact creative performance. Regarding the role of intrinsicfactors, we have shown that intelligence and openness per-sonality scores are related to individual differences in the cuedcondition of the verb generation task, as well as across severalof the other measures in our creativity test battery. Thesefindings support those observed previously in the creativityliterature (see Barron & Harrington, 1981). Furthermore, our
Behav Res

inclusion of intelligence and openness personality scores ascovariates allowed us to establish the discriminant validity ofthe cued creativity verb generation task (see Arden et al.,2010).
Importantly, our results go beyond these findings to dem-onstrate that even after controlling for these intrinsic factors,the extrinsic factor of an explicit “be creative” cue accountsfor a significant portion of the variance in individual differ-ences in creative abilities. Furthermore, we have shown thatthe impact of this explicit cue on creative performance can beobserved in brief samples of observed behavior. Our findingsthus suggest that intrinsic factors do not account for theentirety of variability in creative performance. Additionally,our finding of an important role for cue type in impactingcreative performance observable in “thin slices” of behaviorhas implications for the potential to train and foster creativityin our students. Since intelligence and personality do notappear to account for all of the variability in creative abilitiesacross individuals, this holds promise for the potential use ofextrinsic factors to train participants to produce more creativeresponses on demand. In demonstrating that an explicit “becreative” cue leads to enhanced creative performance, ourfindings support the conjecture of Harrington (1975) thatexplicit instructions are essential for allowing participants todemonstrate their maximal performance or “optimal function-ing” (Simonton, 2000). As such, our findings hold promise forthe use of explicit creativity cues in educational settings inorder to develop creativity skills in students.
Limitations of the present study
Due to our primary interest in individual differences increativity, we chose to administer the words in a single orderwith the same assignment of the noun stimuli to the cued oruncued conditions. This is optimal for avoiding confoundingindividual differences with differences in the word sets. Ifwe had been most interested in the effect of the cue,counterbalancing the assignment of nouns to the cued oruncued condition would have been ideal (to ensure that anydifferences between cued and uncued conditions were notdriven by differences in the word sets). We took care toensure that there were no differences in average constraintlevel between the cued and uncued conditions. Thus, it isunlikely that stimulus assignment to cued and uncued con-ditions was driving our results of main interest—namely, thecorrelations of semantic distance in the cued condition withother aspects of creative cognition.
The lack of correlations in the uncued condition shouldbe interpreted with some caution. The instructions we gaveto participants were fairly general and did not stronglyconstrain their interpretation of what creativity is or howthey should respond. It is possible that, due to demandcharacteristics of the situation, participants may have
interpreted the uncued condition as an opportunity to givetypical responses, even though they were not explicitlyinstructed to do so. To speculate, it seems likely that partic-ipants reserved their creative abilities for the cued condition,adopting a strategy of simply providing the first verb thatcame to mind in the uncued condition. Consistent with this,although we observed high reliability for semantic distancevalues in the cued condition, uncued semantic distancevalues were associated with lower reliability. Importantly,however, these possible interpretations of the uncued condi-tion do not greatly influence the impact of our main find-ings, in which participants’ responses in the cued conditionwere significantly related to their performance across adiverse battery of creativity measures. In follow-up work,it could be interesting to test participants in a no-cue condi-tion of the task, without a cued condition of any sort. Onecould then further test whether individual differences inparticipants’ natural tendency to produce creative or unusualresponses also correlates with variation in performance onother measures of creativity. Overall, our results provide asignificant first step in demonstrating that a classic cognitiveneuroscience measure can be adapted to serve as a reliableand valid index of variation in creative abilities.
Conclusions
In sum, we have demonstrated that individual differencesin creativity can indeed be reliably assessed from thinslices (i.e., brief samples) of behavior, such as single-word utterances. Our creativity-cued verb generation taskcan be used to provide a quantitative measure of semanticdistance of verb associate responses, which is, in turn, areasonably strong correlate of creative performance. Partic-ipants can produce more creative responses when cued todo so, and their performance on our task is related to theircreative performance across a diverse battery of measures.Our findings inform the prior literature on creative cogni-tion and suggest potential future uses for the cued crea-tivity verb generation task to assess individual differencesin creativity in diverse populations, as well as in brain-imaging studies.
Acknowledgments This research was supported by the National Sci-ence Foundation (NSF REC 0634025 and NSF DRL 0644131). Anyopinions, findings, and conclusions or recommendations expressed in thisarticle are those of the author(s) and do not necessarily reflect the views ofthe National Science Foundation. We thank Joseph Kim, Michael Cohen,Kathleen Muller, Rebecca Fine, Jessica Cole, Anne Saulin, PrabinSubedi, Claire Horrell, and Ruhi Mehta for their assistance.
Open Access This article is distributed under the terms of the CreativeCommons Attribution License which permits any use, distribution, andreproduction in any medium, provided the original author(s) and thesource are credited.
Behav Res

Appendix
References
Abraham, A., & Windmann, S. (2007). Creative cognition: The diverseoperations and the prospect of applying a cognitive neuroscienceperspective. Methods, 42, 38–48.
Amabile, T.M. (1979). Effects of external evaluation on artistic creativity.Journal of Personality and Social Psychology, 37, 221–233.
Amabile, T. M. (1982). Social Psychology of Creativity: A ConsensualAssessment Technique. Journal of Personality and Social Psychol-ogy, 43, 997–1013.
Ambady, N., & Rosenthal, R. J. (1992). Thin slices of expressive behav-ior as predictors of interpersonal consequences: A meta-analysis.Psychological Bulletin, 111, 256–274.
Table 6 Noun stimuli used in the cued creativity verb generation task
Trial # Stimulus ConstraintLevel
Most CommonResponse
Frequency of MostCommon Response
1N leaf low fall .437
2N taxi low drive .380
3C coal burn .451
4C house low live .380
5N rock high throw .521
6N card high play .465
7C shoe high wear .549
8C oath high take .521
9N birth fly .451
10N street low walk .408
11C lamp low light .423
12C canoe low paddle .408
13N needle sew .451
14N home low live .352
15C office high work .606
16C belt high wear .535
17N finger high point .521
18N blade high cut .521
19C oven low cook .380
20C fist low punch .408
21N cart high push .493
22N tongue low lick .380
23C shovel high dig .521
24C dish low wash .352
25N pill high take .535
26N flower low smell .437
27C note high write .507
28C church low pray .338
29N boot low wear .423
30N snow low shovel .380
31C feet high walk .521
32C paper low write .408
33N artist high paint .479
34N tree high climb .563
35C cannon high shoot .493
36C tune low play .338
37N poem high read .465
38N soap high wash .592
39C drum low play .423
40C bucket low fill .366
41N cafe low eat .380
42N store low buy .437
43C muscle low flex .380
44C couch high sit .563
45N drug high take .592
46N rose high smell .465
Table 6 (continued)
Trial # Stimulus ConstraintLevel
Most CommonResponse
Frequency of MostCommon Response
47C soup high eat .507
48C letter low write .423
49N pillow high sleep .592
50N tool high use .479
51C debt high pay .606
52C music low play .437
53N ring low wear .380
54N hole high dig .592
55C horn high blow .606
56C razor cut .451
57N golf high play .592
58N manual high read .577
59C infant low cry .352
60C clay low mold .352
61N hair low comb .352
62N baby high cry .507
63C money high spend .479
64C phone low call .408
65N glass low break .408
66N pan low cook .380
67C candle high light .577
68C grass low cut .380
69N bread high eat .479
70N sofa high sit .535
71C key low open .366
72C ship high sail .507
Note. Numbers indicate the trial number, "N" denotes normal (uncued)condition, and "C" denotes cued (creative) condition. “Constraint Level”was determined using a median split of the frequency of the mostcommon verb responses, as described in the main text. “Most CommonResponse” and “Frequency of Most Common Response” values wereobtained from an independent sample. Noun stimuli with no constraintlevel indicated are those items that were removed from all constraintanalyses, because the frequency of the most commonly generated verbresponse for these items was equal to the median value
Behav Res

Arden, R., Chavez, R. S., Grazioplene, R., & Jung, R. E. (2010). Neuro-imaging creativity: A psychometric view. Behavioural Brain Re-search, 214, 143–156.
Baer, J. (1998). The Case for Domain Specificity of Creativity. CreativityResearch Journal, 11, 173–177.
Barch, D. M., Braver, T. S., Sabb, F. W., & Noll, D. C. (2000). AnteriorCingulate and the Monitoring of Response Conflict: Evidence froman fMRI Study of Overt Verb Generation. Journal of CognitiveNeuroscience, 12, 298–309.
Barron, F., & Harrington, D. M. (1981). Creativity, Intelligence, andPersonality. Annual Review of Psychology, 32, 439–476.
Burch, G. S. J., Hemsley, D., Pavelis, C., & Corr, P. J. (2006). Personality,creativity, and latent inhibition. European Journal of Personality,20, 107–122.
Carlsson, I., Wendt, P. E., & Risberg, J. (2000). On the neurobiology ofcreativity. Differences in frontal activity between high and lowcreative subjects. Neuropsychologia, 38, 873–885.
Carson, S. H., Peterson, J. B., & Higgins, D.M. (2003). Decreased LatentInhibition is Associated With Increased Creative Achievement inHigh-Functioning Individuals. Journal of Personality and SocialPsychology, 85, 499–506.
Carson, S. H., Peterson, J. B., & Higgins, D. M. (2005). Reliability,validity, and factor structure of the Creative Achievement Question-naire. Creativity Research Journal, 17, 37–50.
Chen, C., Himsel, A., Kasof, J., Greenberger, E., & Dmitrieva, J. (2006).Boundless Creativity: Evidence for the Domain Generality of Indi-vidual Differences in Creativity. Journal of Creative Behavior, 40,179–199.
Chen, C., Kasof, J., Himsel, A., Dmitrieva, J., Dong, Q., & Xue,G. (2005). Effects of Explicit Instruction to “Be Creative”Across Domains and Cultures. Journal of Creative Behavior,39, 89–110.
Chiarello, C., Kacinik, N. A., Shears, C., Arambel, S. R., Halderman, L.K., & Robinson, C. S. (2006). Exploring Cerebral Asymmetries forthe Verb Generation Task. Neuropsychology, 20, 88–104.
Chua, R. Y., & Iyengar, S. S. (2008). Creativity as a Matter of Choice:Prior Experience and Task Instruction as Boundary Conditions forthe Positive Effect of Choice on Creativity. Journal of CreativeBehavior, 42, 164–180.
Cohen, J. D.,MacWhinney, B., Flatt, M., & Provost, J. (1993). PsyScope:a new graphic interactive environment for designing psychologyexperiments. Behavior Research Methods, 25, 257–271.
Costa, P. T., Jr., & McCrae, R. R. (1992). NEO-PI-R Professional Man-ual . Odessa, FL: Psychological Assessment Resources.
DeYoung, C. G., Quilty, L. C., & Peterson, J. B. (2007). Between Facetsand Domains: 10 Aspects of the Big Five. Journal of Personalityand Social Psychology, 93, 880–896.
Dietrich, A. (2007). Who’s afraid of a cognitive neuroscience of creativ-ity? Methods, 42, 22–27.
Dyer, J. H., Gregersen, H. B., & Christensen, C. M. (2009). The innova-tor’s DNA. Harvard Business Review, 87(12), 61–67.
Evans, L. H., Gray, N. S., & Snowden, R. J. (2007). A new continuouswithin-participants latent inhibition task: Examining associationswith schizotypy dimensions, smoking status, and gender. BiologicalPsychiatry, 74, 365–373.
Eysenck, H. J. (1993). Creativity and personality: Suggestions for atheory. Psychological Inquiry, 4, 147–178.
Eysenck, H. J. (1995). Genius: The natural history of creativity. Cam-bridge: Cambridge University Press.
Faul, F., Erdfelder, E., Lang, A., & Buchner, A. (2007). G*Power 3: Aflexible statistical power analysis program for the social, behav-ioral, and biomedical sciences. Behavior Research Methods,39 (2), 175–191.
Fink, A., Benedek, M., Grabner, R. H., Staudt, B., & Neubauer, A. C.(2007). Creativity meets neuroscience: Experimental tasks for theneuroscientific study of creative thinking. Methods, 42, 68–76.
Gray, J. A., Feldon, J., Rawlins, J. N. P., Hemsley, D. R., & Smith, A. D.(1991). The neuropsychology of schizophrenia. Behavioural andBrain Sciences, 14, 1–84.
Gray, N. S., Hemsley, D. R., & Gray, J. A. (1992). Abolition of latentinhibition in acute, but not chronic, schizophrenics. Neurology andPsychiatry and Brain Research, 1, 83–89.
Green, A. E., Fugelsang, J. A., & Dunbar, K. N. (2006). Automaticactivation of categorical and abstract analogical relations in analog-ical reasoning. Memory & Cognition, 34, 1414–1421.
Green, A. E., Fugelsang, J. A., Kraemer, D. J., &Dunbar, K. N. (2008). TheMicro-Category account of analogy. Cognition, 106, 1004–1016.
Green, A. E., Kraemer, D. J., Fugelsang, J. A., Gray, J. R., & Dunbar.(2010). Connecting long distance: semantic distance in analogicalreasoning modulates frontopolar cortex activity. Cerebral Cortex,20, 70–76.
Green, A.E., Kraemer, D.J., Fugelsang, J.A., Gray, J.R., & Dun-bar, K. (in press). Neural Correlates of Creativity in Analog-ical Reasoning. Journal of Experimental Psychology: Learn-ing, Memory, & Cognition.
Green, A., Cohen, M., Kim, J., & Gray, J.R. (2012). An Explicit CueImproves Creative Analogical Reasoning. Intelligence, 40, 598-603.
Harrington, D. M. (1975). Effects of explicit instructions to “be creative”on the psychological meaning of divergent thinking test scores.Journal of Personality, 43, 434–454.
Howard-Jones, P. A., Blakemore, S. J., Samuel, E. A., Summers, I. R., &Claxton, G. (2005). Semantic divergence and creative story genera-tion: An fMRI investigation.Cognitive Brain Research, 25, 240–250.
Jausovec, N. (2000). Differences in Cognitive Processes Between Gifted,Intelligent, Creative, and Average Individuals While Solving Com-plex Problems: An EEG Study. Intelligence, 28, 213–237.
Laham, D. (1997). Latent semantic analysis approaches to categorization.InM.G. Shafto& P. Langley (Eds.), Proceedings of the 19th AnnualConference of the Cognitive Science Society (p. 979). Hillsdale, NJ:Lawrence Erlbaum Associates.
Landauer, T. K., & Dumais, S. T. (1997). A Solution to Plato’s Problem:The Latent Semantic Analysis Theory of Acquisition, Induction, andRepresentation of Knowledge. Psychological Review, 104, 211–240.
Landauer, T. K., Foltz, P. W., & Laham, D. (1998). An Introduction toLatent Semantic Analysis. Discourse Processes, 25, 259–284.
McCarthy, G., Blamire, A. M., Rothman, D. L., Gruetter, R., &Shulman, R. G. (1993). Echoplanar magnetic resonance im-aging studies of frontal cortex activation during word gener-ation in humans. Proceedings of the National Academy ofSciences USA, 90, 4952–4956.
McCrae, R. R. (1987). Creativity, divergent thinking, and openness toexperience. Journal of Personality and Social Psychology, 52,1258–1265.
Mednick, S. A. (1962). The Associative Basis of the Creative Process.Psychological Review, 69, 220–232.
Molle, M., Marshall, L., Wolf, B., Fehm, H. L., & Born, J. (1999). EEGcomplexity and performance measures of creative thinking. Psycho-physiology, 36, 95–104.
Niu,W., & Liu, D. (2009). Enhancing Creativity: A ComparisonBetweenEffects of an Indicative Instruction “to Be Creative” and a MoreElaborate Heuristic Instruction on Chinese Student Creativity. Psy-chology of Aesthetics, Creativity, and the Arts, 3, 93–98.
Niu, W., & Sternberg, R. J. (2001). Cultural influences on artistic crea-tivity and its evaluation. International Journal of Psychology, 36,225–241.
Nusbaum, E. C., & Silvia, P. J. (2011). Are openness and intellect distinctaspects of openness to experience? A test of the O/I model. Person-ality and Individual Differences, 51(5), 571–574.
O’Hara, L. A., & Sternberg, R. J. (2000–2001). It Doesn’t Hurt to Ask:Effects of Instructions to Be Creative, Practical, or Analytical onEssay-Writing Performance and Their Interaction with Students’Thinking Styles. Creativity Research Journal, 13, 197–210.
Behav Res
Petersen, S. E., Fox, P. T., Posner, M. I., Mintun, M., & Raichle,M. E. (1989). Positron Emission Tomographic Studies of theProcessing of Single Words. Journal of Cognitive Neurosci-ence, 1, 153–170.
Peterson, J. B., & Carson, S. (2000). Latent inhibition and Openness in ahigh achieving student population. Personality and Individual Dif-ferences, 28, 323–332.
Peterson, J. B., Smith, K. W., & Carson, S. (2002). Openness andextraversion are associated with reduced latent inhibition: Replica-tion and commentary. Personality and Individual Differences, 33,1137–1147.
Plucker, J. A., & Beghetto, R. A. (2004). Why creativity is domaingeneral, why it looks domain specific, and why the distinction doesnot matter. In R. J. Sternberg, E. L. Grigorenko, & J. L. Singer(Eds.), Creativity: From potential to realization (pp. 153–167).Washington, DC: American Psychological Association.
Raven, J., Raven, J. C., & Court, J. H. 1998. Manual for Raven'sProgressive Matrices and Vocabulary Scales, Section 1: GeneralOverview. San Antonio, TX: Harcourt Assessment.
Rogers, R. D., & Monsell, S. (1995). Costs of a Predictable SwitchBetween Simple Cognitive Tasks. Journal of Experimental Psychol-ogy: General, 124, 207–231.
Runco,M. A., & Okuda, S. M. (1991). The Instructional Enhancement ofthe Flexibility and Originality Scores of Divergent Thinking Tests.Applied Cognitive Psychology, 5, 435–441.
Sawyer, R. K. (2012). Explaining Creativity: The Science of HumanInnovation: The Science of Human Innovation . USA: Oxford Uni-versity Press.
Schunn, C. D., Paulus, P. B., Cagan, J., & Wood, K. (2006). Final reportfrom the NSF innovation and discovery workshop: The scientificbasis of individual and team innovation and discovery. Washington(DC): National Science Foundation.
Seger, C. A., Desmond, J. E., Glover, G. H., & Gabrieli, J. D. E. (2000).Functional Magnetic Resonance Imaging Evidence for Right-
Hemisphere Involvement in Processing Unusual Semantic Relation-ships. Neuropsychology, 14, 361–369.
Shalley, C. (1991). Effects of productivity goals, creativity goals, andpersonal discretion on individual creativity. Journal of AppliedPsychology, 76, 179–185.
Silvia, P. J., Kaufman, J. C., & Pretz, J. E. (2009). Is Creativity Domain-Specific? Latent Class Models of Creative Accomplishments andCreative Self-Descriptions. Psychology of Aesthetics, Creativity,and the Arts, 3, 139–148.
Simonton, D. K. (2000). Creativity: Cognitive, Personal, Developmental,and Social Aspects. American Psychologist, 55, 151–158.
Sternberg, R. J. (Ed.). (1998). Handbook of Creativity. NY: CambridgeUniversity Press.
Tellegen, A., & Briggs, P. F. (1967). Old Wine in New Skins: GroupingWechsler Subtests Into New Scales. Journal of Consulting Psychol-ogy, 31, 499–506.
Thompson-Schill, S. L., D’Esposito, M., Aguirre, G. K., & Farah, M. J.(1997). Role of left prefrontal cortex in retrieval of semantic knowledge.Proceedings of the National Academy of Sciences, 94, 14792–14797.
Thompson-Schill, S. L., D’Esposito, M., & Kan, I. P. (1999). Effects ofRepetition and Competition on Activity in Left Prefrontal Cortexduring Word Generation. Neuron, 23, 513–522.
Torrance, E.P. (1966). Torrance tests of creative thinking. Bensenville, IL:Scholastic Testing Service.
Wallach, M. A., & Kogan, N. (1965). Models of thinking in youngchildren . New York: Holt, Rinehart, & Winston.
Ward, T. B., Smith, S. M., & Vaid, J. (1997). Conceptual Structures andProcesses in Creative Thought. In T. B.Ward, S.M. Smith, & J. Vaid(Eds.),Creative Thought: An Investigation of Conceptual Structuresand Processes (pp. 1–27). Washington DC: American Psychologi-cal Association.
Wuthrich, V., & Bates, T. C. (2001). Schizotypy and latent inhibition:Non-linear linkage between psychometric and cognitive markers.Personality and Individual Differences, 30, 783–798.
Behav Res