thin solid films - universidade do...
TRANSCRIPT

Thin Solid Films 518 (2010) 5694–5699
Contents lists available at ScienceDirect
Thin Solid Films
j ourna l homepage: www.e lsev ie r.com/ locate / ts f
Influence of the surface morphology and microstructure on the biological propertiesof Ti–Si–C–N–O coatings
Cristina Oliveira a, R. Escobar Galindo b,d, C. Palacio c, L. Vázquez d, A. Espinosa d, B.G. Almeida a,M. Henriques e, S. Calderon V a, S. Carvalho a,⁎a Departamento de Física, Universidade do Minho, Campus de Azurém, 4800-058 Guimarães, Portugalb Centro de Microanálisis de Materiales, Universidad Autónoma de Madrid, Cantoblanco, 28049, Spainc Departamento de Física Aplicada (CXII), Universidad Autónoma de Madrid, Cantoblanco, 28049, Spaind Instituto de Ciencia de Materiales de Madrid (ICMM-CSIC), Cantoblanco, 28049, Madrid, Spaine IBB-Institute for Biotechnology and Bioengineering, Centre for Biological Engineering, Universidade do Minho, Campus de Gualtar, 4700-057, Portugal
⁎ Corresponding author. Tel.: + 351 253 510470; faxE-mail address: [email protected] (S
0040-6090/$ – see front matter © 2010 Elsevier B.V. Adoi:10.1016/j.tsf.2010.05.050
a b s t r a c t
a r t i c l e i n f oAvailable online 10 May 2010
Keywords:Ti–Si–C–N–O coatingsThin filmsMagnetron sputteringStructural propertiesMicrostructural propertiesX-Ray DiffractionAtomic force microscopyBiocompatibility
Detailed structural, microstructural, biofilm formation and cytotoxicity studies were performed on Ti–Si–C–ON hard coatings prepared by DC reactive magnetron sputtering, in order to evaluate the relation amongthese properties. Compositional analysis showed the existence of two distinct regimens; regime I: high C/Siatomic ratio (C/Si≥1.42) and intermediate N/Ti atomic ratio; regime II: low C/Si atomic ratio (C/Si≤0.49)and low N/Ti atomic ratio. The structural analysis revealed that, in regime I, films crystallized in a B1-NaClcrystal structure typical of TiC0.2N0.8. In regime II, the decrease of C/Si and increase in silicon concentrationled to the formation of Ti–Si–C–ON along with a reduction of grain size in the films. Atomic force microscopyobservations showed that the surface morphology of these Ti–Si–C–ON films became smoother when thesilicon content increased and the nitrogen content decreased, which is consistent with the formation ofnanosized clusters. Concerning biological properties, it was observed that cytotoxicity could be related withthe titanium concentration while biofilm formation ability was found to be related with the surfacemorphology of the films.
: + 351 253 510461.. Carvalho).
ll rights reserved.
© 2010 Elsevier B.V. All rights reserved.
1. Introduction
The increasing demand for sustainable products requires thedevelopment of new knowledge-based materials with advancedproperties. These products are then expected to: last longer, have abetter performance, be safe, and be more efficient. These require-ments, which maybe seen as a rule of thumb for most knownmaterials, gain particular importance when dealing with applicationsinvolving the human body: the so-called biomaterials. Typically theserequirements are extremely sensitive to structure variation at themicrometric or nanometric scales and it is important to understandtheir correlation with the material's microstructure [1]. In fact, thisknowledge helps to prevent infections and precocious consuming ofthe developed biomaterials. Beyond the physical and structuralcharacterizations, the study of the biological properties, in particularbiofilm formation and cytotoxicity, has also an important role. Biofilmrepresents a structured community of bacterial cells embedded in aself-produced polymeric matrix adherent to the artificial surface [2].
Cytotoxicity, on the other hand, characterizes the surface's degree oftoxicity to cells.
The purpose of this work is to investigate the feasibility of variousTi–Si–C–ON mechanical hard coatings for applications in medicaldevices (e.g. for knee and hip joint prostheses as well as for medicalinstruments such as lithotripters). According to the literature, it iswidely accepted that it is possible to achieve superhardness byincorporation of silicon (Si) in titanium nitride (TiN) [3], and adecrease in the Young's modulus is observed by addition of oxygen[4]. Oxygen has always been looked upon as an interesting element inthin film materials, not only because of its high reactivity with mostmetals, but also due to the changes that it induces in chemical bondingstates and, therefore, in the material's electrical, optical andmechanical characteristics [5]. In addition, it has been previouslyshown that corrosion resistance tends to be slightly improved byoxygen incorporation [6]. Also, recent work on the Ti–Si–C systemshowed that it is a promising compound due to its particular structureand extraordinary mechanical and tribological properties [7].
Taking this into consideration, the feasibility of coating materialsbased on Ti, Si, C, O and N will be determined through the correlationbetween their structural (roughness, chemical composition and phasecomposition) and biological (biofilm formation ability and cytotoxi-city) properties.

5695C. Oliveira et al. / Thin Solid Films 518 (2010) 5694–5699
2. Materials and methods
The Ti–Si–C–ON samples were deposited by DC reactive magnetronsputtering, in an Ar+(N2+O2) atmosphere, from two opposed highpurity (99.6%) rectangular Ti targets (20×10 cm2). One Ti target had Sipellets incrusted (hereafter designated as the TiSi target) and the otherhad carbon pellets (designated as the TiC target) placed in thepreferential eroded zone. The area occupied by the pellets was close to11 cm2, in each target. AISI 316L stainless steel (surface area of 2×2 cm2
andmechanically polished until amirror-like surfacefinish) and a (100)single crystalline silicon were used as substrate materials. Prior todeposition, the substrates were ultrasonically cleaned during 15 min inpropanol and sputter-etched for 20 min in an argon atmosphere. Thesubstrate bias voltage and the temperaturewere kept constant at−50 Vand 200 °C, respectively. A gas atmosphere composed by Ar+(N2+O2)
was kept at constant pressure. The base pressure in the chamber wasabout 10−4 Pa and rose to 4.5×10⁻¹ Pa during the depositions.Different TiC/TiSi target current combinations were used, being thecurrent density applied to the magnetrons in the range 0 to 10 mA/cm2,for both targets (see Table 1).
The stoichiometry of the films deposited on both substrates wasinvestigated by means of Rutherford Backscattering Spectrometry(RBS) and Glow Discharge Optical Emission Spectroscopy (GDOES).RBS measurements were performed with a 5 MV HVEE Tandetron [8]using He ions at 3.7 MeV to make use of the resonance of alphaparticles with nitrogen at this specific energy. GDOES was carried outusing a Jobin Yvon RF GD Profiler equipped with a 4 mm diameteranode and operating at a typical radio frequency discharge pressure of650 Pa and power of 40 W.
Ball crater tests were used to obtain the thickness of the samples. X-Ray Diffraction (XRD)with a grazing incidencemode (angle of incidenceof 1.5°) using a Cu anode (Cu Kα=1.54 Å) at room temperature wasperformed on a Siemens D-5000 difractometer, to characterize theirstructure. The chemical bonding informationwasobtainedbyRamanandX-Ray Photoelectron Spectroscopy (XPS). Raman spectra were acquiredwith a Jobin Yvon HR 460 monochromator, a nitrogen cooled CCD, andthe excitation light was the 514.5 nm line of an Ar–Kr laser. The incidentand scattered beams were focused using an Olympus microscope. AKaiser Super-Notch filter was used to suppress the elastic scattered light.XPS spectraweremeasuredusing ahemispherical analyzer (SPECSEA-10Plus). The pass energy was 15 eV giving a constant resolution of 0.9 eV.The Ag 3d5/2 line at 367.9 eV was used in order to calibrate the bindingenergies. A twin anode (Mg and Al) X-ray source was operated at aconstant power of 300W using Mg Kα radiation. The samples weresputter-cleaned in situ using a broad 3 keV Ar+ beam for 10 min.
Atomic force microscopy (AFM) observations of the topography ofthe coating surface were carried out using a Nanoscope IIIa model fromDigital Instruments operating in tappingmode. Silicon cantilevers, witha nominal radius of curvature of 10 nm, were used. AFM images overscanning areas of 2×2 µm2 with a resolution of 512×512 pixels wereobtained The root-mean square (rms) roughness valueswere calculatedover 2×2 µm2 areas for, at least, 5 images.
Before performing the biological assays, samples were sterilized at121 °C and 1 atm, for 15 min. Biofilms of Staphylococcus epidermidiswere formed on the coated materials and in well plates with agitation
Table 1Chemical composition, deposition parameters and biological properties of the deposited sa
RatioC/Si
RatioN/Ti
ITi–C(A)
ITi–Si(A)
Chemical composition
Ti(at.%)
C(at.%)
Si(at.%)
O(at.%)
3.9 0.94 2 0.5 37.8 11 2.8 12.81.42 0.86 1 1.2 41.9 7.8 5.5 8.80.49 0.36 0.5 2 56.8 4.8 9.7 8.40.42 0.29 0 2 60.7 3.8 9.1 8.8
(100 rpm). After 48 h, the total biomass was determined by the crystalviolet (CV) stainingmethod [9]. Briefly, 1 ml of CV (1% v/v)was added toeach well containing each sample and incubated for 5 min. The wellswere thengentlywashedwith sterile ultra-purewater and1 ml of aceticacid (33% v/v) was added to release and dissolve the stain. Theabsorbance of the obtained solutionwas read in triplicate in amicrotiterplate reader at 570 nm. Assays were performed in triplicates, in threeindependent assays.
Cytotoxicity was determined by indirect contact of samples withFibroblasts 3T3 (CCL-163). Cellular activity was determined by MTSquantification (3-(4,5-dimethylthiazol-2-yl)-5-(3-carboxymethoxyphe-nyl)-2-(4-sulfophenyl)-2H-tetrazolium, inner salt — Promega CellTiter96® AQueous Non-Radioactive Cell Proliferation Assay). The sampleswereplacedonwells of a cell culture plate, containinga confluent layer offibroblasts, at 5% CO2 and 37 °C. After 24 h of incubation, 1 ml ofmediumwith 20 µL of MTS was added to each well, after the removal of thesample. Then the plate was incubated for 1 h and the absorbance of theresulting solutionwas read at awavelength of 540 nm. Thepercentage offibroblasts death was determined against cell growth in the absence ofthe sample (control— 100%). Assayswere performed in triplicates and inthree independent assays. The results of biofilm formation and % of celldeath obtained for the different averages were compared using a t-Student test with a confidence level of 95%.
3. Results and discussion
3.1. Chemical composition
The as-deposited sample thickness, measured by ball cratering, andtheir atomic composition determined by RBS and GDOES, as a functionof the target's current ratio (ITi–C stands for the DC current applied to Ti–C target and ITi–Si corresponds to the DC current applied to Ti–Si target)are given in Table 1. It should be pointed out that there is no significantdifference between the results obtained by the two techniques, for bothsubstrates. As expected, a decrease of the carbon content, from 11.01 to3.9 at.%, and an increase of the silicon content, from 2.84 to 9.6 at.%, areobservedwhen the ITi–C decreases from 2 to 0 A and ITi–Si increases from0.5 to 2 A. Consequently, in thefilms, the C/Si ratio varies as a functionofthe applied ITi–C/ITi–Si.
N/Ti ratios donot remain constant in thefilms, changing as a functionof the C/Si content. In fact, the N/Ti atomic ratio has a clear andsystematic decrease as C/Si decreases. An increase in the deposition ratewith a reduction on the C/Si ratio (or the N/Ti ratio) can be observed inTable 1. Usually, this variation is explained by taking into account theoccurrence of target poisoning by both reactive gases. However, thiscannot be the reason in the present case since the target potentialsremained constant during all depositions. Thus, a competition betweenthe removal sputtering rate of both targets must have occurred, beinghigher at the Ti–Si target. Keeping inmind that theflowof reactive gas isalways the same, an increase on the deposition rate for higher DCcurrent applied to the Ti–Si target induces re-sputtering in the substrate,with a selective removal of Si, leading to an increase in Ti content and,consequently, an N deficiency. Furthermore, it is also important to notethat althoughusingnopower in the Ti–C target, anamountof about 4 at.% of C is found in this sample. This is due to residual cross contamination
mples.
Thickness(µm)
Deposition rate(µm/h)
Abs CV % Cell death
N(at.%)
35.6 1.7 1.1 0.23±0.03 3.8±0.536 1.8 1.2 0.25±0.05 23.8±2.420.3 2.9 2 0.17±0.02 11.6±0.817.6 3.1 2.1 0.17±0.01 10.5±1.4
5696 C. Oliveira et al. / Thin Solid Films 518 (2010) 5694–5699
of the Ti–Si target during the previous co-depositions using the Ti–C andTi–Si targets.
A deeper analysis of the compositional results allows the possibility todistinguish two distinct regimes of samples. The first regime (regime I)corresponds to films with a high C/Si atomic ratio (C/Si≥1.42) and anintermediate N/Ti atomic ratio (N/Ti≥0.86). The films within the secondregime(regime II)havea lowC/Si atomic ratio (C/Si≤0.49)anda lowN/Tiatomic ratio (N/Ti≤0.36). The composition results are well correlatedwith the structural features of the films. The structural difference withineach regime that will be evidenced in the following sections, is the mainreason for the selection of these two distinct regimes.
3.2. AFM results
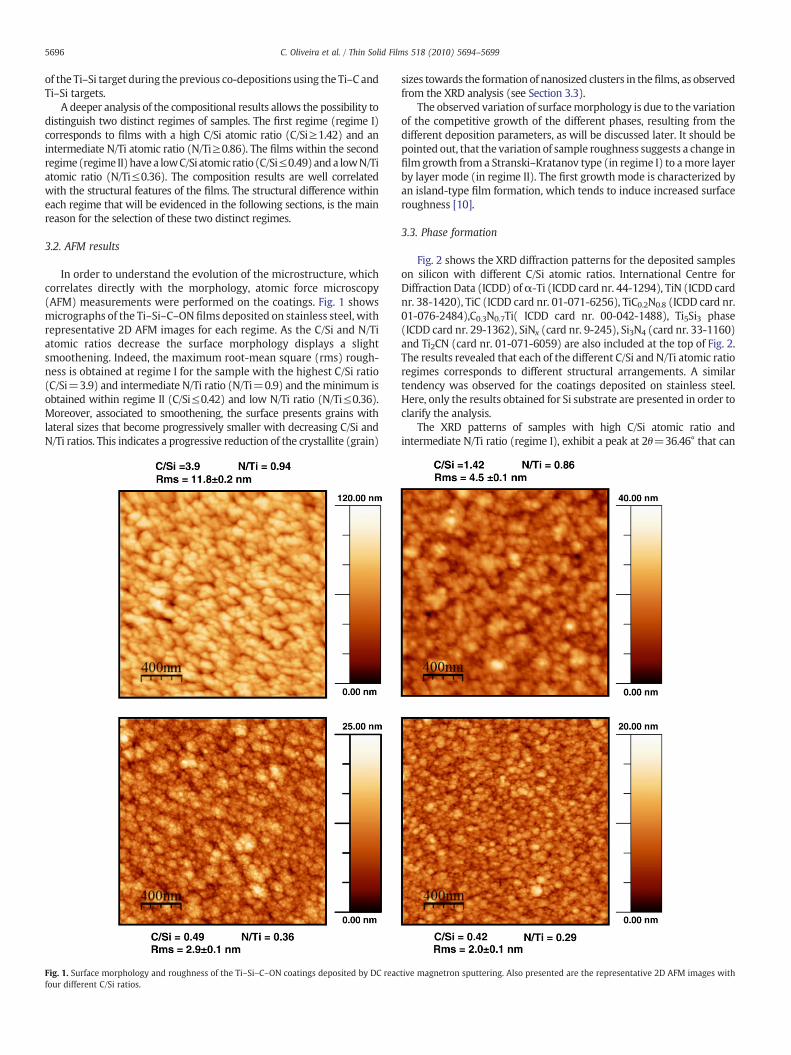
In order to understand the evolution of the microstructure, whichcorrelates directly with the morphology, atomic force microscopy(AFM) measurements were performed on the coatings. Fig. 1 showsmicrographs of the Ti–Si–C–ON films deposited on stainless steel, withrepresentative 2D AFM images for each regime. As the C/Si and N/Tiatomic ratios decrease the surface morphology displays a slightsmoothening. Indeed, the maximum root-mean square (rms) rough-ness is obtained at regime I for the sample with the highest C/Si ratio(C/Si=3.9) and intermediate N/Ti ratio (N/Ti=0.9) and the minimum isobtained within regime II (C/Si≤0.42) and low N/Ti ratio (N/Ti≤0.36).Moreover, associated to smoothening, the surface presents grains withlateral sizes that become progressively smaller with decreasing C/Si andN/Ti ratios. This indicates a progressive reduction of the crystallite (grain)
Fig. 1. Surface morphology and roughness of the Ti–Si–C–ON coatings deposited by DC reacfour different C/Si ratios.
sizes towards the formation of nanosized clusters in thefilms, as observedfrom the XRD analysis (see Section 3.3).
The observed variation of surfacemorphology is due to the variationof the competitive growth of the different phases, resulting from thedifferent deposition parameters, as will be discussed later. It should bepointed out, that the variation of sample roughness suggests a change infilm growth from a Stranski–Kratanov type (in regime I) to amore layerby layer mode (in regime II). The first growth mode is characterized byan island-type film formation, which tends to induce increased surfaceroughness [10].
3.3. Phase formation
Fig. 2 shows the XRD diffraction patterns for the deposited sampleson silicon with different C/Si atomic ratios. International Centre forDiffraction Data (ICDD) ofα-Ti (ICDD card nr. 44-1294), TiN (ICDD cardnr. 38-1420), TiC (ICDD card nr. 01-071-6256), TiC0.2N0.8 (ICDD card nr.01-076-2484),C0.3N0.7Ti( ICDD card nr. 00-042-1488), Ti5Si3 phase(ICDD card nr. 29-1362), SiNx (card nr. 9-245), Si3N4 (card nr. 33-1160)and Ti2CN (card nr. 01-071-6059) are also included at the top of Fig. 2.The results revealed that each of the different C/Si and N/Ti atomic ratioregimes corresponds to different structural arrangements. A similartendency was observed for the coatings deposited on stainless steel.Here, only the results obtained for Si substrate are presented in order toclarify the analysis.
The XRD patterns of samples with high C/Si atomic ratio andintermediate N/Ti ratio (regime I), exhibit a peak at 2θ=36.46° that can
tive magnetron sputtering. Also presented are the representative 2D AFM images with

Fig. 2. XRD patterns of the Ti–Si–C–ON coatings deposited by DC reactive magnetronsputtering on silicon, with different C/Si ratios.
Fig. 3. Raman spectra of the Ti–Si–C–ON coatings deposited by DC reactive magnetronsputtering on silicon, with different C/Si ratios.
5697C. Oliveira et al. / Thin Solid Films 518 (2010) 5694–5699
be attributed to a B1-NaCl-like crystal structure, typical of C0.3N0.7Ti. Forthe C/Si ratio (C/Si=1.42), the films crystallize also in a B1-NaCl crystalstructure, typical of TiC0.2N0.8. This sample shows an additional diffractionpeak, at 44.6°,which canbeassigned to the (101)directionof Ti2C0.06witha hexagonal structure, in accordance with the ICDD card number 051-0628 [11]. Thepresenceof thesepeaks canbe explainedby thedecrease ofcarbon content.
On theother hand, the silicon could be in grain boundaries, formingaSiNx amorphous phase. In fact, due to the low deposition rate, thesurface mobility should be enough to ensure the segregation of the Siatoms and consequent formation of an amorphous phase (SiNx). For thesamplewithC/Si=1.42 the segregated Si can be enough tonucleate anddevelop SiNx phases that in turn form a layer on the growth surfacecovering the Ti(C,N) nanocrystallites. This hinders their growth [12],leading to smaller crystallite sizes and broader diffraction peaks, asobserved on the measured diffraction spectra.
For regime II, the much higher lattice disorder is attributed to ahigher deposition rate and to the lower N/Ti and C/Si atomic ratios. Inthis regime the structure is characterized by a very broad peak in therange 30 to 50° which is not enough to identify the structure.However, there are fcc phases that have the main peaks close to thesevalues, as for example: α-Ti, Ti2CN, SiNx, Ti5Si3 and Si3N4 phases. Infact, an increase in the deposition rate, observed in regime II, withouta significant increase in the density bias current at the substrate,induces a decrease in the ion to atom flux ratio and consequently to adecrease of the adatom surface mobility. These conditions do notprovide the necessary atomic surfacemobility for the Si segregation inthe growing film and, thus, very small, nanometre sized, clusters canbe formed on the films. By using the width of the peak at ∼38° and theScherrer equation [13], the grain size of the sample with lower C/Si(and lower N/Ti) is estimated to be ∼3 nm, consistent with the AFMresults previously discussed.
On the other hand, the decrease in the C/Si ratio, with theconsequent increase of silicon concentration, along with the increas-ing number of N-vacancies that can be progressively filled by siliconatoms (due to the decreasing N/Ti), leads to the formation of Ti–Si–C–ON.
3.4. Raman and XPS analysis
Inorder to further understand the structural and chemical propertiesof the films, Raman and XPS studieswere performed on the Ti–Si–C–ON
samples, deposited on silicon substrates, with different C/Si and N/Tiatomic ratios.
Fig. 3 shows theRamanspectraof depositedTi–Si–C–ONsamples. Theabsence of sharp and well defined peaks is consistent with the presenceof a small grain sized structure on the polycrystalline films. Fig. 4 showsTi2p, Si2p, C1s, N1s and O1s core level spectra of the deposited Ti–Si–C–ON films.
For the samples with C/Si≥1.42 and intermediate N/Ti atomic ratio(regime I), Constable et al. [14] stated that thedispersion curves lead to agroup of ‘lines’ (bands) due to acoustic phonon modes in the 150–300 cm−1 region (longitudinal acoustical (LA) and transverse acoustical(TA) modes) and another set of lines due to optic modes in the 400–650 cm−1 region (longitudinal optical (LO) and transverse optical (TO)modes). Thus, the four weak and broad bands in Raman spectra, centredabout 300, 332, 550 and 568 cm−1 can be associated to acoustic (LA/TA)andoptical (LO/TO)phononmodes of TiNandTiCN [14,15]. Thesemodescanbe associatedwith the presence of the Ti(C,N) phase, consistentwithXRD results. On the XPS analysis, the Ti2p spectra (Fig. 4a) can besimulated using two doublet (Ti2p3/2 and Ti2p1/2 separated by 5.8 eV)contributions ascribed to Ti–N (electron binding energies at 455 and460.8 eV) and Ti–C (454.5 eV and 460.3 eV) bonds, according to theliterature [15–17]. In order to quantify separately the individualcontribution of those two phases a complete deconvolution of thespectra should be performed. Therefore, in the following discussion wewill refer to themasaTi–C–Nphase.However, these bindingenergies fortitaniumare consistentwith theC–Ti andN–Tibondsobserved at theC1s(282 eV) and N1s (397 eV) XPS spectra of Fig. 4c and e, respectively.Furthermore, there is evidence of graphitic C–C bonds at 284.5 eV andthe presence of C–N bonds with carbon atoms hybridized sp2 withbinding energies of approximately 286.1 eV [18], cannot be discarded.For this same regime, the Si2p XPS spectrum (Fig. 4b) shows a majorcontribution at 102 eV attributed to Si–N bonds [18] that can beassociated to anamorphous SiNxphase. However, this asymmetric broadpeak suggests the presence of at least other two minor contributions asSi–O (103 eV) and Si–C–N (101.4 eV) bonds [18]. Within the O1s regionit is evident the appearance of a wide peak (FHWMN3 eV) centred at531.2 eV. This binding energy lies between the reported values for O–Ti(529.6 eV) and O–Si (532.7), suggesting the formation of titaniumsilicates. The Raman band around 720 cm−1 that starts to appear in thesample with C/Si=1.42 (see Fig. 3), is associated to the presence of C–Nbonds in the films [19,20]. The Si–O band appearing at ∼1100 cm−1 isdue to the asymmetric stretching vibration of Si–O bonds [21].
For regime II (C/Si≤0.43 (low ratio) and low N/Ti ratio), in additionto the Ti–C–N phase, an extra contribution located at 454.4 eV has to beincluded to the analysis of the Ti2pXPS spectra. This is attributed toTi–Sibonds [20], suggesting that Simay be incorporated into the Ti(C,N)filmsduring deposition, forming a Ti–Si–(C,N) solid solution. Regarding Si2p

Fig. 4. XPS spectra of a) Ti2p, b) Si2p, c) C1s, d) O1s and e) N1s core levels of the Ti–Si–C–ON coatings deposited by DC reactive magnetron sputtering on silicon, with different C/Siratios.
5698 C. Oliveira et al. / Thin Solid Films 518 (2010) 5694–5699
spectra, the main difference with samples from regime I is the clearreduction of the Si–N and Si–C–N contribution and the appearance of amajor peak at 99 eV. In the literature this contribution is typicallyascribed to metal Si bonds [18], although other authors do not discardthe formation of Si–Ti bonds as titanium silicides can also be formed[22–24]. In the C1s and N2p spectra, as expected, there is a decreaseof the graphitic C–C and theN–Ti contributionswith the reduction of theC/Si and N/Ti ratio, respectively. In the Raman spectra it is possible toobserve the increase of the band around 720 cm−1, which is due to anincreasing number of C–N bonds with decreasing C/Si and N/Ti atomicratios. These bonds can be formed in the grain boundaries of thenanosized clusters, with carbon bonding to neighbouring nitrogen, orcan be due to the presence of carbon in lattice sites adjacent to nitrogen,which is gradually very low to occupy all the available places as it wouldnormally do in the TiN.
3.5. Biological behaviour
Concerning the biological behaviour of the coated samples (Table 1),it is possible to see that there is no systematic trend of the biofilmbiomass (Abs CV) or cytotoxicity (% cell death) evolution with the C/Siand N/Ti atomic ratios. However, it is interesting to note that samplesfrom regime II (lower C/Si and N/Ti ratios) present similar behaviourregarding both biological properties.
Concerning biofilm formation ability, samples from regime I presenthigher values of biomass than samples from regime II (pb0.05). Severalfactors have been found to be related with biofilm formation ability,namely the surfacemorphology and roughness [25,26] aswell as surfacechemical composition [27]. From Fig. 1 it is possible to observe thatsamples from regimen I present higher roughness corresponding to amore heterogeneous surface, which may allow more bacteria to adhere

5699C. Oliveira et al. / Thin Solid Films 518 (2010) 5694–5699
and consequently to develop more biofilm biomass. Moreover, it ispossible to observe (Table 1) that a reduction of C/Si and N/Ti content,along with the decreasing ratio of the non-metallic (C,N,O) to metallic(Ti,Si) elements, leads to a decrease in the cell ability for biofilmformation.
The differences in cytotoxicity (Table 1) found between samplesfrom regime I and regime II (pb0.05) cannot be explained alone by theresults obtained on surface microstructure characterization. Samplesfrom regime I present extremes of cytotoxicity, having the higher andthe lower percentage of cell death from the group studied. On the otherhand, samples from regime II present similar and somewhat lowervaluesof cytotoxicity. It is known that titanium, aswell as its compoundswithnitrogenandoxygen, have excellent biocompatibility. This is due tothemoderate surface chargepresentunderbiological conditions and thesimilarity of its dielectric constant to that of water [28]. Additionally,nanosized clusters of silicon (as observed on the X-ray results) tend tohave increased cytotoxicity as compared with their micron-sizedcounterparts [29]. Here, samples from regime II present a high amountof titanium on their composition (bigger than 55%) which can accountfor the lower observed cytotoxicity. Thus, for biomedical purposes,samples with i) low values of C/Si and N/Ti (that presented lowroughness) and ii) high concentration of titanium should be selectedsince they present low biofilm formation and also low cytotoxicity. It isinteresting to note that similar coatings, deposited with differentpreparation conditions, but at the same low N/Ti ratio [11], were alsoless prone to S. epidermidis colonization.
4. Conclusions
Ti–Si–C–ON films were synthesized by unbalanced DC magnetronsputtering and their structural and biological properties were charac-terized. From the composition results, the variation of the C/Si ratio onthe depositedfilmswas obtained. TheN/Ti atomic ratio had a systematicreduction with decreasing C/Si. Taking into account the differentelemental compositions and structures, two different regimes couldbe considered: regime I: high C/Si atomic ratio (C/Si≥1.42) andintermediate N/Ti atomic ratio; and regime II: low C/Si atomic ratio(C/Si≤0.49) and low N/Ti atomic ratio. AFM observations showed thatthe surface morphology of these Ti–Si–C–ON films became smootherwith increasing silicon and lower nitrogen content, consistent with theformation of nanosized clusters with the reduction of the C/Si and N/Tiratios.
In regime I, the films crystallized in a B1-NaCl crystal structuretypical of TiC0.2N0.8 and the silicon was in grain boundaries in one SiNx
amorphous phase. Samples from regime I had higher roughness, thatinduced higher biofilm formation, and extremes in cytotoxicity.
In regime II, the decrease in C/Si with the consequent increase insilicon concentration, along with the increase in the number of N-vacancies, leads to the formation of Ti–Si–C–ON. They showed similarand somewhat lower cytotoxicities, due to the higher Ti content in thefilms, and lower biofilm formation.
Consequently, for biomedical purposes, samples with high Ticoncentrations and with low values of C/Si and N/Ti (regime II), which
presented lower roughness, should be selected, since they present lowbiofilm formation ability and also low cytotoxicity.
Acknowledgments
The authors are grateful to Dr. Alicia Andrés, Instituto de Ciencia deMateriales de Madrid (ICMM-CSIC), for her assistance in carrying outtheRaman spectroscopic analysis. The projectwasfinancially supportedby the CRUP Institution (project “AcçãoNº E-1007/08”), and the SpanishMinistry of Science and Innovation (projects FUNCOAT CSD2008-00023and HP2007-0116).
References
[1] N.M. Alves, C.S. Arroyo, M.A.R. Perez, R.L. Reis, J.F. Mano, Acta Biomater. 3 (2007) 69.[2] S. Roveta, A. Marchese, G.C. Schito, Int. J. Antimicrob. Agents 31 (2008) 321.[3] S. Veprěk, A. Nioderhofer, K. Moto, Surf. Coat. Technol. 133 (134) (2000) 152.[4] F. Vaz, P. Cerqueira, L. Rebouta, S.M.C. Nascimento, E. Alves, P.H. Goudeau, J.P.
Rivière, Surf. Coat. Technol. 174 (175) (2003) 197.[5] A.C. Fernandes, P. Carvalho, F. Vaz, S.L. Méndez, A.V. Machado, N.M.G. Parreira, J.F.
Pierson, N. Martin, Thin Solid Films 515 (2006) 866.[6] E. Ariza, L.A. Rocha, F. Vaz, L. Cunha, S.C. Ferreira, P. Carvalho, L. Rebouta, E. Alves,
P.H. Goudeau, J.P. Rivière, Thin Solid Films 469 (470) (2004) 274.[7] C. Lopes, N.M.G. Parreira, S. Carvalho, A. Cavaleiro, J.P. Rivière, E.L. Bourhis, F. Vaz,
Surf. Coat. Technol. 201 (2007) 7180.[8] A. Climent-Font, F. Pászti, G. Garcia, M.T.F. Jiménez, F. Agulló, Nucl. Instrum.
Methods. Phys. Res. Sect. B 219 (220) (2004) 400.[9] M. Henriques, J. Azeredo, R. Oliveira, Br. J. Biomed. Sci. 63 (2006) 5.
[10] M. Ohring, The Materials Science of Thin Films, Academic Press Inc., San Diego,1992.
[11] C. Oliveira, L. Gonçalves, B.G. Almeida, C.J. Tavares, S. Carvalho, F. Vaz, R. EscobarGalindo, M. Henriques, M. Susano, R. Oliveira, Surf. Coat. Technol. 203 (2008) 490.
[12] S. Carvalho, E. Ribeiro, L. Rebouta, J. Pacaud, Ph. Goudeau, P.O. Renault, J.P. Rivière,C.J. Tavares, Surf. Coat. Technol. 172 (2003) 109.
[13] B.D. Cullity, S.R. Stock, Elements of X-Ray Diffraction, Prentice Hall, Reading, MA,2001.
[14] C.P. Constable, J. Yarwood, W.D. Munz, Surf. Coat. Technol. 116 (119) (1999) 155.[15] D. Pilloud, J.F. Pierson, M.C.M. Lucas, A. Cavaleiro, Surf. Coat. Technol. 202 (2008)
2413.[16] X. Song, D. Gopireddy, C.G. Takoudis, Thin Solid Films 516 (2008) 6330.[17] J. Alami, P. Eklund, J. Emmerlich, O. Wilhelmsson, U. Jansson, H. Högberg, L.
Hultman, U. Helmersson, Thin Solid Films 515 (2006) 1731.[18] B. Mitu, G. Dinescu, M. Dinescu, A. Ferrari, M. Balucani, G. Lamedica, Thin Solid
Films 383 (2001) 230.[19] E.J. Liang, J.W. Zhang, J. Leme, C. Moura, L. Cunha, Thin Solid Films 469 (470) (2004)
410.[20] J.S. Colligon, V. Vishnyakov, R. Valizadeh, S.E. Donnelly, S. Kumashiro, Thin Solid
Films 485 (2005) 148.[21] B.G. Almeida, A. Pietka, P. Caldelas, J.A. Mendes, J.L. Ribeiro, Thin Solid Films 513
(2006) 275.[22] J. Perez-Mariano, K.-H. Lau, A. Sanjurjo, J. Caro, D. Casellas, C. Colominas, Surf. Coat.
Technol 201 (2006) 2217.[23] F. Zhaoa, X. Cuia, B. Wang, J.G. Hou, Appl. Surf. Sci. 253 (2006) 2785.[24] S. Veprĕk, A. Niederhofer, K. Moto, T. Bolom, H.-D. Männling, P. Nesladek, G.
Dollinger, A. Bergmaier, Surf. Coat. Technol. 133–134 (2000) 152.[25] H. Tang, T. Cao, X. Liang, A. Wang, S.O. Salley, J. McAllister II, K.Y. Simon Ng, J.
Biomed. Mater. Res. A 88A (2009) 454.[26] I. Apilanez, A. Gutierrez, M. Diaz, Biores. Tech. 66 (1998) 225.[27] B.L. Gabriel, J. Gold, A.G. Gristina, B. Kasemo, J. Lausmaa, C. Harrer, Q.N. Myrvik,
Biomaterials 15 (1994) 628.[28] D.M. Brunette, P. Tengvall, M. Textor, P. Thomsen, Titanium in Medicine: Material
Science, Surface Science, Engineering, Biological Responses and Medical Applica-tions, Springer, New York, 2001, p. 1019.
[29] J. Choi, Q. Zhang, V. Reip, N.S. Wang, M.E. Stratmeyer, V.M. Hitchins, P.L. Goering, J.Appl. Toxicol. 29 (2009) 52.