things are getting better all the time - wordpress.com
TRANSCRIPT

A snapshot of Australian living standards in the long run
Things are getting better all the time
Institute ofPublic A�airs
T H E V O I C E F O R F R E E D O ME S T A B L I S H E D − 1 9 4 3
Dr Mikayla NovakSenior Fellow
Dom TalimanidisIan Mence Fellow for Entrepreneurship
October, 2014
www.ipa.org.au

1
ABOUT THE INSTITUTE OF PUBLIC AFFAIRS The Institute of Public Affairs is an independent, non-profit public policy think tank, dedicated to
preserving and strengthening the foundations of economic and political freedom.
Since 1943, the IPA has been at the forefront of the political and policy debate, defining the
contemporary political landscape.
The IPA is funded by individual memberships and subscriptions, as well as philanthropic and
corporate donors.
The IPA supports the free market of ideas, the free flow of capital, a limited and efficient
government, evidence-based public policy, the rule of law, and representative democracy.
Throughout human history, these ideas have proven themselves to be the most dynamic, liberating
and exciting. Our researchers apply these ideas to the public policy questions which matter today.
ABOUT THE AUTHORS Dr Mikayla Novak is a Senior Fellow with the Institute of Public Affairs.
Mikayla has previously worked for Commonwealth and State public sector agencies, including the
Commonwealth Treasury and Productivity Commission. Mikayla was also previously advisor to the
Queensland Chamber of Commerce and Industry. Her opinion pieces have been published in The
Australian, Australian Financial Review, The Age, and the Courier Mail, on issues ranging from state
public finances to social services reform.
Dom Talimanidis is the Ian Mence Fellow for Entrepreneurship at the Institute of Public Affairs.
Dom has been published in the Herald Sun and has been interviewed on radio around the country as
part of his previous role as Director of the North Australia Project. Dom has previously worked as an
intern at United Kingdom Trade and Investment. Dom completed a Masters in European and
International Studies at Monash University after graduating from the University of Melbourne.
The authors gratefully acknowledge the assistance of Institute of Public Affairs colleagues in the
preparation of this report.

2
EXECUTIVE SUMMARY
Australians have come a long way over these past two centuries, as evidenced by the numerous
improvements in our health, education, and material living standards.
As diseases are increasingly being conquered thanks to medical technologies, nutritional
improvements and cleaner living environments, we are surmounting the perilous hurdle of
infant mortality to live, on average, to an older age with each passing generation.
Successive generations of Australians are even growing taller, thanks to our generally improving
health status.
This country has also enjoyed remarkable economic progress in the long run, with average
Australians today benefiting from the fruits of rising national incomes, wages and household
wealth which are unprecedented in a historical context.
There are more people employed by the private sector now than in any other period in
Australian history, and more women than ever are making an active contribution to the
workforce.
Our land is yielding even more food to feed ourselves and a hungry world, and our capacity to
deliver mineral resources for domestic and global advanced production has never been as great
as today.
The vast improvement in Australian material living standards are arguably no better evidenced
than by the historically high extent of motor vehicle usage, and the electrical appliances and
electronic devices which fill up our larger homes.
The present generation of Australians are the most educated in history, with more people
enrolling in universities and other higher education institutions than ever before.
Life has been getting better for most Australians, and it could be even better today if it were not
for intrusive government regulations and wasteful spending which makes housing less
affordable and contributes to cost of living pressures.
Reducing the size and scope of government will be instrumental to securing rising living
standards in the future, as this will harness opportunities for enterprising Australians to discover
new ways of improving the economic and social circumstances of others.

3
CONTENTS
INTRODUCTION ....................................................................................................................................... 4
1 MANY THINGS ARE GETTING BETTER ............................................................................................. 7
1.1 Life expectancy ....................................................................................................................... 7
1.2 Infant mortality ....................................................................................................................... 8
1.3 Human height.......................................................................................................................... 9
1.4 Infectious diseases ................................................................................................................ 10
1.5 Cancer and circulatory diseases ............................................................................................ 11
1.6 Economic output ................................................................................................................... 12
1.7 Earnings ................................................................................................................................. 13
1.8 Household wealth ................................................................................................................. 14
1.9 Private sector employment ................................................................................................... 15
1.10 Female labour market participation ..................................................................................... 16
1.11 Agricultural productivity ....................................................................................................... 17
1.12 Mineral production ............................................................................................................... 18
1.13 Electricity generation ............................................................................................................ 19
1.14 Economic openness .............................................................................................................. 20
1.15 Motor vehicles ...................................................................................................................... 21
1.16 Household appliance and entertainment equipment .......................................................... 22
1.17 Communications ................................................................................................................... 23
1.18 Education .............................................................................................................................. 24
2 OBSTACLES TO THINGS GETTING EVEN BETTER ........................................................................... 25
2.1 Regulatory burden ................................................................................................................ 25
2.2 Government spending .......................................................................................................... 26
2.3 Housing affordability ............................................................................................................. 27
2.4 Cost of living .......................................................................................................................... 28
CONCLUSION ......................................................................................................................................... 29
4
INTRODUCTION
Australia has come a long way over the past two centuries, but the great question of our time is will
the progress of the past continue into the future?
It is perhaps all too easy for modern Australians to forget that the first European settlers, whose
transportation to Australia was once described as ‘at least as risky as modern efforts to send a man
to the moon,’1 initially struggled through a most precarious existence within a harsh, inhospitable
environment.
The fledgling colony was established as a prison outpost of the British Empire and, lacking in
agricultural self-sufficiency, was forced to send for emergency food supplies as initial livestock and
poultry perished, and soils initially proved uncooperative for growing crops.2 Even by 1820, historical
estimates of Australia’s per capita income showed it was still close to subsistence levels, and on par
with incomes prevailing in Asia and Africa at the time.3
But a variety of complex factors helped Australians pull themselves out of the economic mire.
It was discovered, in time, that climactic and topographical conditions on this continent were most
conducive to the growing of the best quality wool and livestock on the planet, as well as extensive
crop yields especially in the wetter precincts hugging the Australian eastern seaboard.
Not long after the formation of the agricultural sector substantial coal deposits were discovered in
New South Wales and, later, gold in Victoria, which all helped expand and diversify the private
sector. This allowed ordinary people to acquire their own incomes and ensured that government
stepped aside from the near-total economic control that exemplified the convict era.
An underappreciated contributor to the beneficent wave of economic prosperity, which led to our
remarkable transition from subsistence income to the richest country on earth by the late
nineteenth century, were our inherited British economic, legal, political, and social institutions which
spurred individual creativity and ingenuity, and allowed enterprising Australians to attain ample
reward for effort.
With the market economy representing a part of the broader fabric of civil society, it should come as
no surprise that social conditions substantially improved, even for the poorest Australians, as rising
incomes were deployed in efforts to ensure improved health outcomes and a better education.
1 Phrase attributed to iconic Australian economic historian, Noel Butlin. H. M. Boot, 1998, ‘Government and
the Colonial Economies’, Australian Economic History Review 38 (1): 74-101, p. 74. 2 Geoffrey Blainey, [1966] 2001, The Tyranny of Distance: How Distance Shaped Australia’s History, Macmillan,
Sydney. 3 Jakob B. Madsen, ‘The Australian Productivity Miracle, 1800-2010: The Role of Innovations, Human Capital
and Natural Resources’, Monash University, Department of Economics, Working Paper.

5
It should come as no surprise, either, that as more Australians shared in the act of acquiring market
incomes and building savings nest eggs, and as more Australians shared in vanquishing lower life
expectancies, high mortality rates and communicable diseases, and as more Australians shared in
the experience of becoming more literate and numerate, the likes of which the world had never
previously seen, they would come to demand their share of political representation as substantive
equals.
This is why Australia was among those countries which led the charge for more representative
government, with South Australia introducing manhood suffrage in 1856 followed by the right of
women to vote during the final decade of the nineteenth century.4
It is no understatement to submit that the story of Australia is one in which its residents have
become healthier, smarter, wealthier, more open, and more connected with each other, with all of
these outcomes tending to feed into each other in a virtuous circle of improvement.
A century later, evidence of continuous improvement in the economic and social circumstances
enjoyed by many Australians still remains evident, but there is always some element of concern
within the community, not entirely unjustified, that a better life into the future cannot be an
outcome taken for granted.
Whilst there has certainly been a strain of complacency that improvements in our lives will simply
arrive, as if manna from heaven, there are several emergent forces at work within modern
Australian society that appears to be becoming more resistant to the necessary changes needed for
new vistas of progress to be made accessible.
Some degree of government involvement in our affairs is deemed necessary to ensure the equal
rights of all are equally respected, especially through the protection of life, limb and property of
individuals, but when ‘Australian democracy has come to look upon the state as a vast public utility’5
the scene is set for excessive degrees of government intervention intruding on our equal freedoms
and stifling our capacities to discover our own paths for improvement.
Our public commentaries abound with instances of excessive regulation impeding Australians from
cooperating with each other, economically and socially, in ways that do not render harm to others,
of uncompetitive taxation which hampers our ability to truck, trade and barter with people
domestically and internationally, and of wasteful spending which encourages unproductive
behaviours, such as ‘rent seeking,’ and makes Australians more reliant upon government itself.
All of these manifestations of over-government make us less wealthy than we should be, and our
social lives less dynamic and fulfilling than what it promises to be.
4 The right to vote in general elections, unfortunately, was not extended to indigenous Australians at the
federal level until the 1960s, although South Australia granted suffrage to indigenous women as early as 1894.
http://australia.gov.au/about-australia/australian-story/austn-suffragettes. 5 W. K. Hancock, [1930] 1961, Australia, Jacaranda Press, Brisbane, p. 55.

6
Government is, ultimately, a conservative set of institutions because, once the walls of intervention
are erected, it seems extremely difficult to pull the walls back down.
Once the veneer of their rhetorical argumentation is stripped back, it is not difficult to identify all
those vested interests earning artificial incomes and rents from public sector activities. Academics,
major banks, manufacturers, renewable energy companies, welfare recipients, and even taxi drivers,
conservatively defend their privileges at the cost of even greater generalised progress for all. The
most popular modern arguments for the more intensive application of government force are as
varied as they are extensive:
It is alleged that progress comes at the cost of inequality, mainly portrayed as growing gaps
between the rich and the poor.
It is alleged that progress comes at the cost of environmental degradation, ranging from the
destruction of landscapes through to human-induced warming of global temperatures.
It is alleged that progress has most certainly delivered a bounty of products, but that consumers
are either psychologically suffering from the burdens of choosing from the cornucopia of
abundance for themselves, or that some products, such as alcohol, energy-dense foods and
tobacco, are risky and hence should be withheld from consumers altogether (or, at least, not
cheaply).
But perhaps the most curious feature of modern Australia is that large numbers of people, especially
the politically disconnected who have benefited enormously from the legacy of long run economic
and social improvements, seem to be persuaded by these arguments for greater public sector
interference in our lives.
Witness the curious juxtaposition of the Australian who wastes little time acquiring the new gadget
or assuming the latest fashion, but in almost the same breath demands more of the very
government that crimps possibilities to actually provide such conveniences for people.
If the demands for ever-more government are met by obliging politicians and the bureaucratic class,
as they typically tend to do, this further threatens the capacity of individuals to freely broach the
future frontiers of progress.
Australians have indeed come a long way; this fact is made abundantly clear by the statistical
evidence. We should be proud of that.
But to give ourselves the best shot at ensuring that life keeps on getting better for everybody, in as
many dimensions of human endeavour as possible, we need to free ourselves from the tightening
shackles of burdensome government presently affixed about our ankles.

7
1 MANY THINGS ARE GETTING BETTER
1.1 Life expectancy
For much of human history death came at an early age, with 20 to 35 years being the typical average
life span.6 Even in early nineteenth-century England and Wales, life expectancy at birth hovered at
around 40 years of age.7
Life expectancy at birth has improved significantly for both males and females in Australia since the
early twentieth century, to now vastly exceed that of our ancestors.
Males born in 1921 were expected to live until the age of 59, and females until the age of 63. By
contrast, males born in 2012 are expected to live until the age of 80, whereas females are expected
to live until 84 years of age.
Figure 1: Average life expectancy (at birth)
50
55
60
65
70
75
80
85
90
1921 1931 1941 1951 1961 1971 1981 1991 2001 2011
Life
exp
ect
ancy
at
bir
th (
age
)
male female total
Average number of years a newborn is expected to live if current mortality rates continue to apply.
Source: Human Mortality Database; Australian Bureau of Statistics.
6 John R Wilmoth, 2009, ʻIncrease of Human Longevity: Past, Present and Futureʼ,
http://www.ipss.go.jp/seminar/j/seminar14/program/john.pdf. 7 Simon Szreter and Graham Mooney, 1998, ʻUrbanization, Mortality, and the Standard of Living Debate: New
Estimates of the Expectation of Life at Birth in Nineteenth-Century British Citiesʼ, The Economic History Review
51 (1): 84-112.

8
1.2 Infant mortality
The act of birth was not only a precarious event for many mothers prior to the twentieth century,
but even more so for infants, as many lost their lives at birth. A study of infant mortality during the
late nineteenth century described ʻseasonal variations in [infant] deaths and the heavy incidence of
death in the first six months of lifeʼ caused by ʻundifferentiated pathogenic micro-organisms,ʼ which
are ʻstill endemic in Third World countries today.ʼ8
The rate of Australian infant mortality has precipitously declined since the late nineteenth century,
dropping from as high as 139 deaths per 1,000 live births in 1875 to three deaths per 1,000 live
births in 2013. Even ten years ago, there were close to five deaths per 1,000 live births, illustrating
the generalised trend toward improvement for this indicator.
These trends have been driven by a range of factors, including improvements in prenatal and
postnatal care, declines in infectious diseases, improved sanitation, new medicines, mass
vaccinations, and improvements in birth conditions.9
Figure 2: Infant mortality rate (deaths per 1,000 live births)
0
20
40
60
80
100
120
140
160
1870 1880 1890 1900 1910 1920 1930 1940 1950 1960 1970 1980 1990 2000 2010
Infa
nt
mo
rtal
ity
rate
(p
er
1,0
00
live
bir
ths)
Number of deaths of babies under one year of age per 1,000 live births.
Source: Australian Bureau of Statistics.
8 M Durey, 1982, ʻBrief lives: Infant mortality in Perth, 1870-1914ʼ, Studies in Western Australian History 5:
62-71. 9 Australian Bureau of Statistics, Measures of Australiaʼs Progress, 2010, cat. no. 1370.0.

9
1.3 Human height
Long run trends in average human height have long been a field of interests for epidemiologists and
health practitioners, observing how the changes in average heights are influenced by nutrition and
disease.
Economists have also taken a greater interest in biological measures of living standards, establishing
links between stature and various economic indicators, such as earnings, over the long run. Analysis
also suggests correlation between height and measures of social status.
The average height for Australian males has increased by nearly ten centimetres from the
mid-nineteenth century to late twentieth century. The Australian Bureau of Statistics have also
undertaken periodic health status surveys, finding that average adult male height has increased by
0.8 centimetres from 1995 to 2012.10
Figure 3: Male height (average centimetres per decade)
164
166
168
170
172
174
176
178
180
1850 1860 1870 1880 1890 1900 1910 1920 1960 1970
Ave
rage
mal
e h
eig
ht
(ce
nti
me
tre
s)
Average male height by birth decade, centimetre equivalents.
Source: Joerg Baten and Matthias Blum, Economic History of Developing Regions (2012).
10
Australian Bureau of Statistics, Australian Health Survey: First Results, 2011-12, cat. no. 4364.0.55.001.

10
1.4 Infectious diseases
One of the key determinants of Australians living longer and healthier lives is the long term
reduction in deaths attributable to infectious and parasitic diseases, such as cholera, typhoid fever,
polio, smallpox, and measles. These diseases have long proven a scourge to human existence, with
various bacterial and viral infections wiping out vast segments of populations at various times in
history.
In the early 1920s it was estimated that about 143 people per 1,000 died annually as a result of
infectious and parasitic diseases. As a result of vaccines, better public health measures, and new
medicines, about nine people per 1,000 died in 2011 as a result of these diseases.
The number of cases of people suffering from other ailments, such as sudden infant death syndrome
(SIDS) and acquired immune deficiency syndrome (AIDS), has also decreased.
Figure 4: Infectious diseases death rate (deaths per 1,000 population)
0
20
40
60
80
100
120
140
160
180
200
1922 1932 1942 1952 1962 1972 1982 1992 2002 2012
De
ath
rat
e f
rom
infe
ctio
us
dis
eas
es
(de
ath
s p
er
10
0,0
00
pe
op
le)
Male Female Total
Number of deaths from intestinal and other bacterial diseases, sexually transmitted infections, viral infections,
and other infectious and parasitic diseases, per 1,000 people.
Source: Australian Institute of Health and Welfare.

11
1.5 Cancer and circulatory diseases
Despite general improvements to human health, cancer and circulatory diseases continue to serve as
major causes of human mortality in Australia. Even so, there are some encouraging signs of
improvement, at least in recent decades, by way of declining mortality rates resulting from these
ailments.
The overall death rate from cancer (left-hand diagram) has started to fall modestly since the
mid-1990s, thanks in no small part to better treatment, as well as a heightened public awareness of
symptoms. Survival rates from cancer have also improved.
The right-hand diagram shows the Australian death rate attributable to circulatory diseases, such as
cardiovascular diseases and rheumatic fever, has declined considerably since the late 1960s.
Figure 5: Cancer and circulatory diseases death rates (deaths per 100,000 population)
0
50
100
150
200
250
300
350
1907 1917 1927 1937 1947 1957 1967 1977 1987 1997 2007
De
ath
ra
te
fro
m c
an
ce
rs (
de
ath
s p
er 1
00
,00
0 p
eo
ple
)
Male Female Total
0
200
400
600
800
1,000
1,200
1907 1917 1927 1937 1947 1957 1967 1977 1987 1997 2007
De
ath
ra
te
fro
m c
irc
ula
to
ry
dis
ea
se
s (
de
ath
s p
er 1
00
,00
0 p
eo
ple
)
Male Female Total
Cancer refers to deaths from all neoplasms (cancer) per 100,000 people (left-hand diagram). Circulatory
diseases (right-hand diagram) refer to deaths from rheumatic fever and heart diseases, heart diseases,
cerebrovascular diseases, and other circulatory system diseases, per 100,000 people.
Source: Australian Institute of Health and Welfare.

12
1.6 Economic output
The most commonly used measure of economic performance, and indeed progress, is national
output or ʻgross domestic productʼ (GDP). GDP provides a measurement of the market value of all
final goods and services produced in a country during a given year. Expressing GDP in per capita
terms provides a gauge of the level of material living standards enjoyed, on average, by each person.
Adjusting for inflation, the real GDP of Australia has risen substantially from about $284 million in
1828, not long after the establishment of the wool industry, to about $1.5 trillion in 2013. The
average annual per person output in this country has grown from about $4,880 to $66,537 over the
same period.
The economic growth feeding into annual additions to GDP, and influencing GDP per capita, is
pivotal to the living standards enjoyed by the average Australian today, not least since it has allowed
them to escape the ʻsolitary, poor, nasty, brutish, and shortʼ existences of their ancestors.
Figure 6: Real GDP ($ millions) and real GDP per capita ($)
-
10,000
20,000
30,000
40,000
50,000
60,000
70,000
-
200,000
400,000
600,000
800,000
1,000,000
1,200,000
1,400,000
1,600,000
1,800,000
1828 1838 1848 1858 1868 1878 1888 1898 1908 1918 1928 1938 1948 1958 1968 1978 1988 1998 2008
$
$ m
illio
ns
Real GDP (LHS) Real GDP per capita (RHS)
Market value of final goods and services produced in a given year. GDP is also expressed in per capita terms.
Source: Measuring Worth; Australian Bureau of Statistics.

13
1.7 Earnings
The ability to earn an income enables an individual to purchase goods and services, including food,
clothing, shelter, transport and entertain, and to meet various financial commitments. It also staves
off absolute poverty, and all the troubling economic and social consequences that would entail.
In the early 1860s a worker, roughly three times more likely labouring in a menial farming or
rudimentary manufacturing job then than now, would earn a little over $2 per week. In 2013 a
worker would, on average, take home almost $1,100 a week in earnings.
Even though price inflation has also risen dramatically over that period, a worker on average
earnings is still well ahead in real terms over time, enabling him or her to enjoy more of the
amenities of life as provided through markets.
Figure 7: Average weekly earnings (log scale)
1
10
100
1,000
10,000
1861 1871 1881 1891 1901 1911 1921 1931 1941 1951 1961 1971 1981 1991 2001 2011
Ave
rage
we
ekl
y e
arn
ings
(lo
g sc
ale
)
Total Males Females
Average gross earnings of employees attained during a working week. This chart is expressed in log scale,
illustrating proportional changes in average weekly earnings rates over time.
Source: Measuring Worth; Australian Bureau of Statistics.

14
1.8 Household wealth
In addition to regular incomes earned through providing labour services, householders own an array
of other economic resources that support their consumption, augment their overall wellbeing, and
usefully serve as a hedge against poverty. These resources include houses and the other dwellings,
bank deposits, balances in superannuation funds, and other assets.
Since the early 1960s the value of household wealth in Australia has increased substantially. In 1960,
the total value of wealth owned by households was estimated at $46 billion. In 2013 household
wealth was valued at a little over $7 trillion. This increase has been attributable to factors including
rising property values and the uptake in superannuation, especially since the introduction of
compulsory superannuation regulations in the early 1990s.
Whilst some economic and financial commentators have expressed concerns about the
accumulation of greater debts by the household sector, official statistics have shown that the overall
value of assets continues to exceed indebtedness by a significant margin.11
Figure 8: Household wealth ($ billions)
-
1,000
2,000
3,000
4,000
5,000
6,000
7,000
8,000
1960 1970 1980 1990 2000 2010
$ b
illio
ns
Dwelling assets Non-dwelling assets Total wealth
Value of dwelling and non-dwelling assets owned by households.
Source: Commonwealth Treasury; Australian Bureau of Statistics.
11
Australian Bureau of Statistics, Australian Social Trends, 2014, cat. no. 4102.0.

15
1.9 Private sector employment
Another indicator of economic wellbeing is the number of people employed by private sector
entities. Growth in this area indicates that more individuals are being economically engaged to
provide goods and services for other people, both located in Australia and overseas, in a voluntary
and mutually beneficial manner.
At the beginning of the twentieth century it was estimated that about 1.3 million people worked
within the private sector. In 2013 about 9.5 million Australians worked in the private sector. Despite
periodic fluctuations as a consequence of the ebb and flow of business cycles, the long term trend
has been for growth in the numbers of private sector employees.
The number of public sector workers has also increased during this period. However, in recent
decades growth in government employment has tended to be capped somewhat by privatisation
initiatives, whereby the control and management of assets, and the sector in which those operating
those assets are classified, have been transferred from the government to private sector.
Figure 9: Private sector employment (millions)
0
2
4
6
8
10
12
1901 1911 1921 1931 1941 1951 1961 1971 1981 1991 2001 2011
Pri
vate
se
cto
r e
mp
loym
en
t (m
illio
ns)
Number of employees working in private sector.
Source: Barnard, Butlin and Pincus, Australian Economic Review (1977); Australian Bureau of Statistics.

16
1.10 Female labour market participation
The economic prosperity of Australia has been influenced, to no small degree, by the increasing
capacity of women to independently earn their own incomes and, more broadly, contribute to the
market process.
During the nineteenth century less than 20 per cent of the Australian female population was
engaged in the labour force, with most undertaking cleaning and child raising duties in the home
and, in most cases, having meagre amounts of assets next to their names. This left most women
dependent upon men for their sustenance.
As a result of legal liberalisations (including the end of the ʻmarriage barʼ on female public servants),
rising educational attainment, childcare availability and reductions in other barriers against
economic participation, female labour force participation rates have improved dramatically to nearly
60 per cent by 2011.
Figure 10: Female labour force participation rate (per cent of female population)
-
10
20
30
40
50
60
1841 1851 1861 1871 1881 1891 1901 1911 1921 1933 1947 1954 1961 1971 1981 1991 2001 2011
Fem
ale
lab
ou
r fo
rce
par
tici
pat
ion
rat
e (
pe
r ce
nt)
Number of women aged 15 and above engaged in the labour force, as a share of the total female population.
Source: A. M. Endres, Source Papers in Economic History, ANU (1984); Reserve Bank of Australia; Australian
Bureau of Statistics.
17
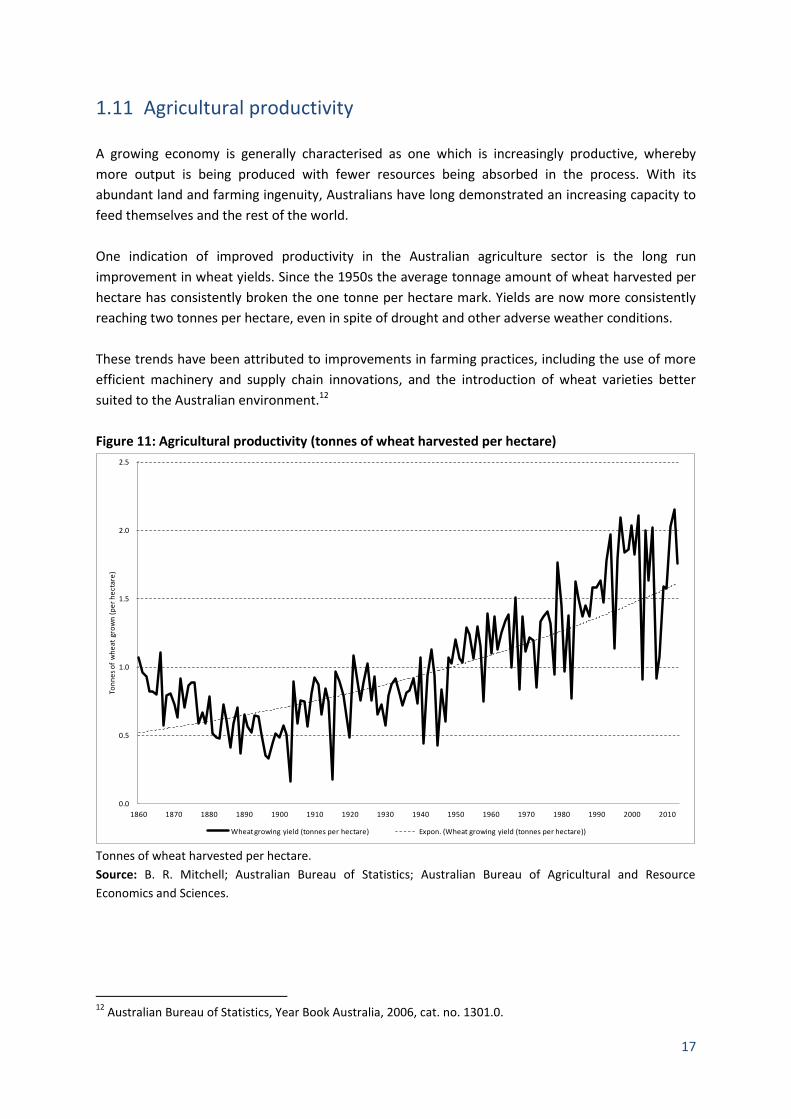
1.11 Agricultural productivity
A growing economy is generally characterised as one which is increasingly productive, whereby
more output is being produced with fewer resources being absorbed in the process. With its
abundant land and farming ingenuity, Australians have long demonstrated an increasing capacity to
feed themselves and the rest of the world.
One indication of improved productivity in the Australian agriculture sector is the long run
improvement in wheat yields. Since the 1950s the average tonnage amount of wheat harvested per
hectare has consistently broken the one tonne per hectare mark. Yields are now more consistently
reaching two tonnes per hectare, even in spite of drought and other adverse weather conditions.
These trends have been attributed to improvements in farming practices, including the use of more
efficient machinery and supply chain innovations, and the introduction of wheat varieties better
suited to the Australian environment.12
Figure 11: Agricultural productivity (tonnes of wheat harvested per hectare)
0.0
0.5
1.0
1.5
2.0
2.5
1860 1870 1880 1890 1900 1910 1920 1930 1940 1950 1960 1970 1980 1990 2000 2010
Ton
ne
s o
f w
he
at g
row
n (
pe
r h
ect
are
)
Wheat growing yield (tonnes per hectare) Expon. (Wheat growing yield (tonnes per hectare))
Tonnes of wheat harvested per hectare.
Source: B. R. Mitchell; Australian Bureau of Statistics; Australian Bureau of Agricultural and Resource
Economics and Sciences.
12
Australian Bureau of Statistics, Year Book Australia, 2006, cat. no. 1301.0.

18
1.12 Mineral production
Since the discoveries of coal deposits in the Hunter region of New South Wales in the late eighteenth
century, Australia has served as a global ʻsuperpowerʼ of minerals supply for domestic and
international production purposes.
In Australia the production of black and brown coal has increased significantly, as shown in the
left-hand diagram where total production has risen from about two million metric tonnes in 1881 to
about 459 billion metric tonnes in 2013. Iron ore production (right-hand diagram) has also shown
impressive gains in historical time, including as a result of the lifting of iron ore export embargoes in
the 1960s, increasing from about 494,000 metric tonnes in 1928 to about 521 million metric tonnes
in 2012.
As the recent terms of trade boom and mass relocation of labour toward the resource states
illustrated most acutely, mining now plays a major role in economic prosperity.
Figure 12: Mineral production (thousands of metric tonnes)
-
50,000
100,000
150,000
200,000
250,000
300,000
350,000
400,000
450,000
500,000
1881 1891 1901 1911 1921 1931 1941 1951 1961 1971 1981 1991 2001 2011
Co
al
ou
tp
ut (th
ou
sa
nd
m
etric
to
nn
es)
-
100,000
200,000
300,000
400,000
500,000
600,000
1928 1938 1948 1958 1968 1978 1988 1998 2008
Iro
n o
re
ou
tp
ut (th
ou
sa
nd
m
etric
to
nn
es)
Total coal production, in thousands of metric tonnes (left-hand diagram). Total iron ore production, in
thousands of metric tonnes (right-hand diagram).
Source: B. R. Mitchell; Australian Bureau of Agricultural and Resource Economics and Sciences; Bureau of
Resources and Energy Economics.

19
1.13 Electricity generation
Electricity has dramatically improved the economic and social circumstances of Australians, replacing
less efficient energy alternatives - such as water and steam, wind, and wood - in the delivery of
manufactured products, as well as providing light and heating in homes.
In Australia the earliest recorded displays of electricity usage were reported during the 1860s, with
the first power stations in Victoria developed by the private sector.13 In 1919 electricity generators
produced 461 gigawatt-hours of electricity for business and household concerns. This level of
production has increased dramatically in subsequent years, to almost 240,000 gigawatt-hours of
electricity in 2012. During this period the proportion of homes with electricity has substantially risen
to near-saturation levels today.
Australian electricity is primarily generated from our bountiful, and relatively cheap, coal deposits,
mainly located along the eastern seaboard. In recent years there have been increasing concerns
about rising electricity prices, attributable to some degree to government regulations mandating the
uptake of expensive renewable energy sources.
Figure 13: Electricity generation (gigawatt-hours produced)
-
50,000
100,000
150,000
200,000
250,000
300,000
1919 1929 1939 1949 1959 1969 1979 1989 1999 2008
Ele
ctri
city
ge
ne
rati
on
(G
wH
)
Electricity generation, in gigawatt-hours.
Source: B. R. Mitchell; International Energy Agency.
13
Dictionary on Electricity, http://www.ewh.ieee.org/r10/nsw/subpages/history/electricity_in_australia.pdf.

20
1.14 Economic openness
As a small and open economy, the long run economic performance of Australia has been heavily
influenced by its ability to trade goods and services across political borders. Indeed, studies have
illustrated there is a positive association between the degree of economic openness of a country and
its economic performance.
At the time of Federation, exports plus imports accounted for about 37 per cent of GDP. Despite
periodic fluctuations, partly caused by terms of trade changes, wars and others factors, this ratio has
gradually increased to about 41 per cent in 2013.
The long term trend has been for the Australian economy to become more open with the passage of
time, particularly since the 1970s as a consequence of tariff reductions and the liberalisation of
capital and financial flows.
Figure 14: Degree of economic openness (exports plus imports per cent of GDP)
20
25
30
35
40
45
50
1901 1911 1921 1931 1941 1951 1961 1971 1981 1991 2001 2011
Exp
ort
s p
lus
imp
ort
s as
pro
po
rtio
n o
f G
DP
(p
er
cen
t)
Total value of exports plus imports as a percentage of gross domestic product.
Source: Reserve Bank of Australia (M. W. Butlin); Australian Bureau of Statistics.

21
1.15 Motor vehicles
The extent of motor vehicle usage is another commonly used indicator for economic prosperity, as
this provides some information about the ability of individuals and families to attain a relatively
expensive item (i.e., a vehicle) for their own purposes.
In the early 1920s there were about 117,000 motor vehicles in use across Australia (21 vehicles per
1,000 population). While road networks were already reasonably extensive, especially between
major cities, even until the 1950s car ownership and usage was considered something of an elite
affair.14 By 2013 there were about 13 million motor vehicles used, equating to 562 vehicles per 1,000
people in Australia.
The motor vehicle has long been represented as a powerful aid to mobility for most people, enabling
individuals to go wherever they want, and whenever they want, even if vehicles have been
somewhat displaced by air travel mainly for interstate trips.
Figure 15: Motor vehicle usage (total, and per 1,000 population)
-
100
200
300
400
500
600
-
2,000
4,000
6,000
8,000
10,000
12,000
14,000
1923 1933 1943 1953 1963 1973 1983 1993 2003 2013
Pe
r 1
,00
0 p
eo
ple
Tho
usa
nd
s
Passenger motor vehicles in use (LHS) Passenger motor vehicles per 1,000 people (RHS)
Number of passenger motor vehicles in use, and passenger motor vehicle use per 1,000 people.
Source: B. R. Mitchell; Australian Bureau of Statistics.
14
Robert Lee, 2003, ʻLinking a Nation: Australiaʼs Transport and Communications 1788-1970ʼ,
http://www.environment.gov.au/resource/linking-nation-australias-transport-and-communications-1788-
1970-10.

22
1.16 Household appliance and entertainment equipment
The extent of household ownership of appliances and entertainment equipment illustrates the
degree of material prosperity enjoyed by individuals and families. Electrical and electronic goods
have also played an important role in reducing the laborious intensity of home production, allowing
women in particular to pursue work and other options with their time.
The diffusion of appliances and equipment in the average Australia household has been rapid over
time, with products formerly considered luxurious, such as air conditioning, dishwashers,
refrigerators and televisions, are now commonplace in almost every home. Even the extent of
pay-television has risen in recent decades, from five per cent in 1996 to 29 per cent in 2011.15
The growing prevalence of electronic equipment, whitegoods and other products in the home has
been greatly facilitated by substantial improvements in their affordability for even low income
earners. For a range of common household items, ranging from kettles and toasters to televisions, it
has been estimated that the number of hours of work needed to earn sufficient income to buy them
has declined dramatically.16
Table 1: Appliance and equipment ownership rates (per cent of households)
1950s 1960s 1970s 1980s 1990s 2000s 2010s
Air conditioner 33 (1994) 64 (2008) 73 (2011)
Computer 44 (1998) 78 (2009) 83 (2011)
Dishwasher 25 (1994) 45 (2008) 52 (2011)
Refrigerator 94 (1960) 100 (1994) 100 (2008) 100 (2011)
Television 1 (1956) 87 (1966) 92 (1976) 96 (2003) 99 (2011)
Washing machine 40 (1955) 60 (1960) 94 (1994) 97 (2008) 98 (2011)
Percentage of household ownership of selected appliances and equipment.
Source: Tony Dingle, Journal of Australian Studies (2009); Australian Bureau of Statistics; Australian
Communications and Media Authority; Bureau of Transport and Communications Economics.
15
Data sourced from Australian Bureau of Statistics and Screen Australia statistics. 16
Julie Novak, 2014, ʻLife Under Capitalism. Bigger! Better! Cheaper!ʼ, IPA Review 65 (4): 13-17.

23
1.17 Communications
The ability of Australians to communicate with each other over long distances has been substantially
enhanced by a range of communications technologies, which have superseded the unreliable and
slow distribution of telegraph dispatches and postal letters commonly used during the late
nineteenth and early twentieth centuries.
The number of telephones in use in Australia has grown from 25,000 in 1901 to almost 10.5 million
in 2012.17 Even the very nature of the telephone has profoundly changed for many Australians
within a relatively short span of time, from fixed, and sometimes cumbersome, installations
connected to largely underground cables beneath houses and offices, to mobile telephones to more
recently, very low-cost Skype connections on home computers.
The internet, the pervasive system of interconnected computer networks on a global basis, is
another technological application which has profoundly changed the lives of most Australians. In
1990 there was less than one internet user per 100 people. In 2013 there were 83 people per 100 in
Australia who were using the internet.
Figure 16: Mobile phone and internet usage (per 100 population)
-
20
40
60
80
100
120
1987 1988 1989 1990 1991 1992 1993 1994 1995 1996 1997 1998 1999 2000 2001 2002 2003 2004 2005 2006 2007 2008 2009 2010 2011 2012 2013
Nu
mb
er
of
sub
scri
be
rs/u
sers
pe
r 1
00
po
pu
lati
on
Mobile phone subscriptions Internet users
Number of mobile phone subscriptions, and internet users, per 100 population.
Source: World Bank.
17
Data sourced from B. R. Mitchell and the International Telecommunications Union.

24
1.18 Education
There are now more educated Australians than at any other time in our history. This is important
given the significant contribution of education, and the valuable knowledge and skills such activity
imparts upon individuals, has as a determinant of long run economic growth.
The number of students enrolled in universities has risen significantly since the early twentieth
century, from about 2,600 in 1906 to about 1.3 million in 2013. As a share of the total Australian
population, the number of university students has grown from 0.1 per cent of the population to 5.7
per cent over the same period.
Within this broader trend of greater human capital accumulation is the increasing uptake of higher
education by women, with the share of female university students increasing from 21 per cent of
students in 1949 to 56 per cent in 2011.
Figure 17: Higher education institution enrolments (number, and per cent of population)
0
1
2
3
4
5
6
-
200,000
400,000
600,000
800,000
1,000,000
1,200,000
1,400,000
1906 1916 1926 1936 1946 1956 1966 1976 1986 1996 2006
Pe
rce
nta
ge o
f po
pu
lati
on
Nu
mb
er
Number of students (LHS) Percentage of population (RHS)
Number of students enrolled in higher education institutions.
Source: B. R. Mitchell; Commonwealth Department of Education.

25
2 OBSTACLES TO THINGS GETTING EVEN BETTER
2.1 Regulatory burden
Governments impose a host of commands and rules upon individuals, businesses, associations, and
other groups, in efforts to alter their behaviour and conduct. This is known as ʻregulation,ʼ and is one
of the fundamental means by which government intervenes in the economy and society.
A commonly used proxy measure for the burden of regulation is the number of pages of legislation
passed or assented. During the 1830s the New South Wales colonial government passed an average
of 165 pages of Acts per annum. At the beginning of the twentieth century it required only 358
pages of legislation to federate the country. In 2012 alone, the commonwealth and state
governments collectively passed over 25,000 pages of primary legislation.
Whilst regulations are enacted by governments for a wide array of policy purposes, such as
consumer protection, environmental amenity, and public health and safety, there have been
longstanding concerns that heavier regulation is imposing undue costs upon the economy. It has
been estimated that regulatory compliance costs alone could be as high as four per cent of GDP per
annum.18
Figure 18: Regulatory burden (pages of primary legislation)
-
5,000
10,000
15,000
20,000
25,000
30,000
35,000
1824 1834 1844 1854 1864 1874 1884 1894 1904 1914 1924 1934 1944 1954 1964 1974 1984 1994 2004
Pag
es
of
pri
mar
y le
gisl
atio
n p
asse
d o
r as
sen
ted
(n
o.)
Total Commonwealth States
Number of pages of primary legislation passed or assented in each calendar year.
Source: Commonwealth, state and territory government legislation.
18
Productivity Commission, 2006, Potential Benefits of the National Reform Agenda, Report to The Council of
Australian Governments, Canberra.
26
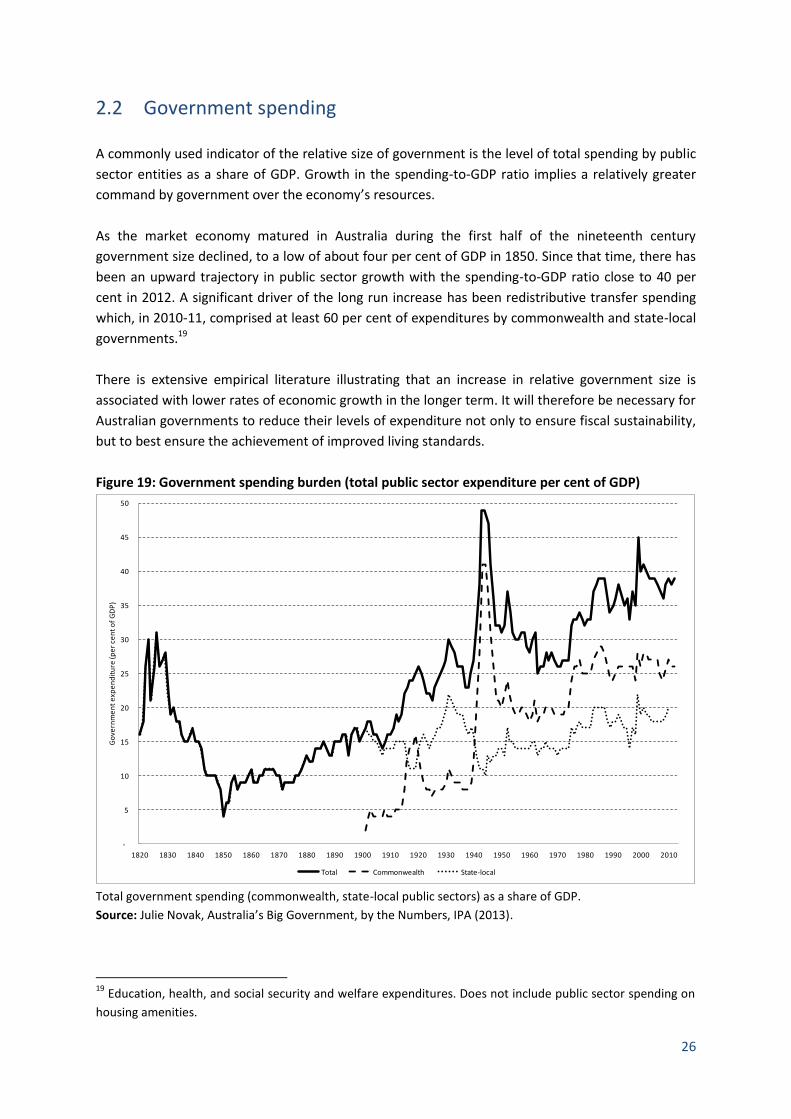
2.2 Government spending
A commonly used indicator of the relative size of government is the level of total spending by public
sector entities as a share of GDP. Growth in the spending-to-GDP ratio implies a relatively greater
command by government over the economyʼs resources.
As the market economy matured in Australia during the first half of the nineteenth century
government size declined, to a low of about four per cent of GDP in 1850. Since that time, there has
been an upward trajectory in public sector growth with the spending-to-GDP ratio close to 40 per
cent in 2012. A significant driver of the long run increase has been redistributive transfer spending
which, in 2010-11, comprised at least 60 per cent of expenditures by commonwealth and state-local
governments.19
There is extensive empirical literature illustrating that an increase in relative government size is
associated with lower rates of economic growth in the longer term. It will therefore be necessary for
Australian governments to reduce their levels of expenditure not only to ensure fiscal sustainability,
but to best ensure the achievement of improved living standards.
Figure 19: Government spending burden (total public sector expenditure per cent of GDP)
-
5
10
15
20
25
30
35
40
45
50
1820 1830 1840 1850 1860 1870 1880 1890 1900 1910 1920 1930 1940 1950 1960 1970 1980 1990 2000 2010
Go
vern
me
nt
exp
en
dit
ure
(pe
r ce
nt
of
GD
P)
Total Commonwealth State-local
Total government spending (commonwealth, state-local public sectors) as a share of GDP.
Source: Julie Novak, Australiaʼs Big Government, by the Numbers, IPA (2013).
19
Education, health, and social security and welfare expenditures. Does not include public sector spending on
housing amenities.

27
2.3 Housing affordability
Home ownership has played a defining role in Australian life, especially during much of the period
following World War II, both for reasons of family stability and wealth accumulation.
The dream of owning oneʼs own home is gradually slipping away, especially for young Australians
aspiring to purchase their first home. The median house price in a capital city in June 2013 was
about $530,000, which required 485 weeks (9.3 years) for a person on average weekly earnings to
accumulate sufficient savings to purchase outright. In the 1880s, a person on much lower earnings
needed only 340 weeks (6.5 years) to earn enough money to buy a median-priced house, without
recourse to borrowing.
A range of policy factors are acting to dilute the affordability of homes in our capital cities, where
most Australians prefer to live. These include land supply restrictions mainly by local and state
governments, land tax and transaction taxes on land transfers, and subsidies for first homeowners
which are artificially boosting demands.
Figure 20: Housing affordability (log scale, and number of weeks to purchase home)
-
100
200
300
400
500
600
0
1
10
100
1,000
1880 1890 1900 1910 1920 1930 1940 1950 1960 1970 1980 1990 2000 2010
Nu
mb
er
of
we
eks
Log
scal
e
Aust. median capital city house price Number of weeks to purchase house on AWE
Australian median capital city house price data expressed in log scale, illustrating proportional changes in
average weekly earnings rates over time.
Source: Nigel Stapledon, PhD dissertation (2007); Australian Bureau of Statistics.

28
2.4 Cost of living
The ability of consumers to purchase affordable goods and services is critically influenced by the
purchasing power of their income. A common measure of changes in purchasing power is the
consumer price index, which measures the price of a basket of various goods and services over time.
Since the introduction of the GST, the average price of numerous products that is subject either to
direct government subsidisation, or extensive regulation, have exceeded the rate of price inflation
for all goods and services in the economy.
The prices of utilities such as electricity, gas and water, which are subject to stringent government
price controls, have more than doubled since 2000-01, as has the price of tobacco products as a
result of strong increase in excise tax rates. Education and health care price increases have also been
significant over the last decade or so, adversely affecting the living standards of lower income
earners in particular.
Figure 21: General prices for selected goods and services (consumer price index values)
75
95
115
135
155
175
195
215
235
255
275
2001 2002 2003 2004 2005 2006 2007 2008 2009 2010 2011 2012 2013 2014
Ind
ex
valu
e (
bas
e 2
00
1 =
10
0.0
)
CPI
Utilities
Tobacco
Education
Health
Child care
Alcohol
Consumer price index for selected commodities and commodity groups, weighted average of eight capital
cities. Variations in child care price inflation reflect methodological changes associated with incorporating the
price effects of child care rebates.
Source: Australian Bureau of Statistics.

29
CONCLUSION
The vigorous debate about trends in relative income and wealth inequality waged in Australia runs
the risk that we lose perspective as to how the lives of everyday Australians, including the poorer
among us, have dramatically improved over the longer term.
But let us pause, and consider just how so many aspects of the lives of Australians have gotten
better, and in some respects exceedingly so, over time.
An infant born merely two years ago would expect to live for 82 years, on average. If that same
person were born forty years ago, in 1972, they could expect to live for 72 years. Taking the timeline
back even further, if the young boy or girl born in 2012 had, instead, arrived in the world during the
Great Depression they would, on average, have expected to live to 65 years.
So, in the span of eight decades, an average Australian could expect to add almost another twenty
years to what would likely to already be an increasingly productive, fulfilling life. This alone is an
extraordinary achievement, and is testament to the material improvements and innovations that can
only come through economic growth and development.
But increasing life expectancies are only the tip of the iceberg for what has been an amazing
trajectory of improvements, on a massive scale and across wide fronts, for everyone:
Cleaner and healthier environments are contributing to impressive long term trend declines in
mortality rates attributable to disease.
Australians on average are amassing greater incomes and more wealth with each passing year,
and our farms, mines, and electricity generation plants have been producing more product to
sell to people here and abroad.
We are becoming more educated with time, allowing us to command more attractive incomes in
the marketplace and to use our expanded knowledge base for intellectual pursuits.
Our larger homes are furnished with an amazing array of creature comforts, such as refrigerators
for stored food, washing machines for our clothing, and television for our entertainment, whilst
modern realities, such as mobile phones, home computing, and the internet would have been
considered as the frolics of science fiction writers a few short decades ago.
In the modern Australia, where poverty is increasingly defined as the lack of a plasma television in an
otherwise opulent home, it is not a glib statement to contend that practically every single person has
benefited from the secular trends of improvement over time. To quote American economist Deidre
McCloskey, whose words ring just as true for Australia:
ʻthe rich became richer, true. But the poor have gas heating, cars, smallpox vaccinations, indoor plumbing,
cheap travel, rights for women, low child mortality, adequate nutrition, taller bodies, ... schooling for their
kids, newspapers, a vote, a shot at university and respect.ʼ20
20
Deirdre Nansen McCloskey, 2014, ʻEquality vs. Lifting Up the Poorʼ, The Financial Times, 12 August.

30
The human mind may well be a potent ʻkiller appʼ to search and destroy cultural, economic, political
and social problems, but there is a risk that problems may be misidentified. The inordinate focus
upon income and wealth inequality statistics, in particular trends affecting the trumped up ʻone per
cent,ʼ appears to be one of those examples of problem misidentification, prosecuted by particularly
imaginative human minds hard-wired to search and destroy problems.
The purpose of this paper is to underline the notion that what really matters is not so much whether
the likes of Gina Rinehart, Andrew Forrest or Clive Palmer can afford longer stays at luxury hotels, or
more fancy cars and yachts. In fact, what matters is that the lives of the great bulk of Australians,
and including those on the lowest income rungs, are getting better as each week, month, year,
decade and century passes.
The evidence here suggests that things are actually getting better all the time for nearly all of us, and
this is unambiguously good.
If things have been getting better all the time for the great mass of ever-growing numbers of people
residing on this continent, then surely the key will be to ensure these beneficent trends continue.
This, in turn, implies that roadblocks against improvement be set aside.
If the present generations of Australians are at all concerned about their future prospects, and the
prospects of those who will follow them, they would move to ensure that governmental restrictions
against continuing betterment, such as excessive taxation, prescriptive regulations and wasteful
public sector spending, are cut down to size.
That way, in the most immediate sense, Australians can enjoy things like more affordable housing,
cheaper utilities and other outputs, and, in the furthest, their lives would be more broadly situated
within a generic climate of continuous improvement, as has already been experienced these last two
centuries.