think less. live more think less. live more. how to accelerate how to acceleratedeployment sis 09...
TRANSCRIPT

Think Less. Live MoreThink Less. Live More.www.shelleyrow.com
How to Accelerate How to Accelerate DeploymentDeployment
SIS 09SIS 09
Shelley Row, P.E., PTOE
Shelley Row Associates, LLC

Think Less. Live MoreThink Less. Live More.www.shelleyrow.com
Time to Rethink How We Sell ITSTime to Rethink How We Sell ITS
Benefit/Cost isn’t always Benefit/Cost isn’t always the best approachthe best approach
Logical isn’t always logicalLogical isn’t always logical
Learn from Our ExperienceLearn from Our Experience
Think Less. Live MoreThink Less. Live More.www.shelleyrow.com
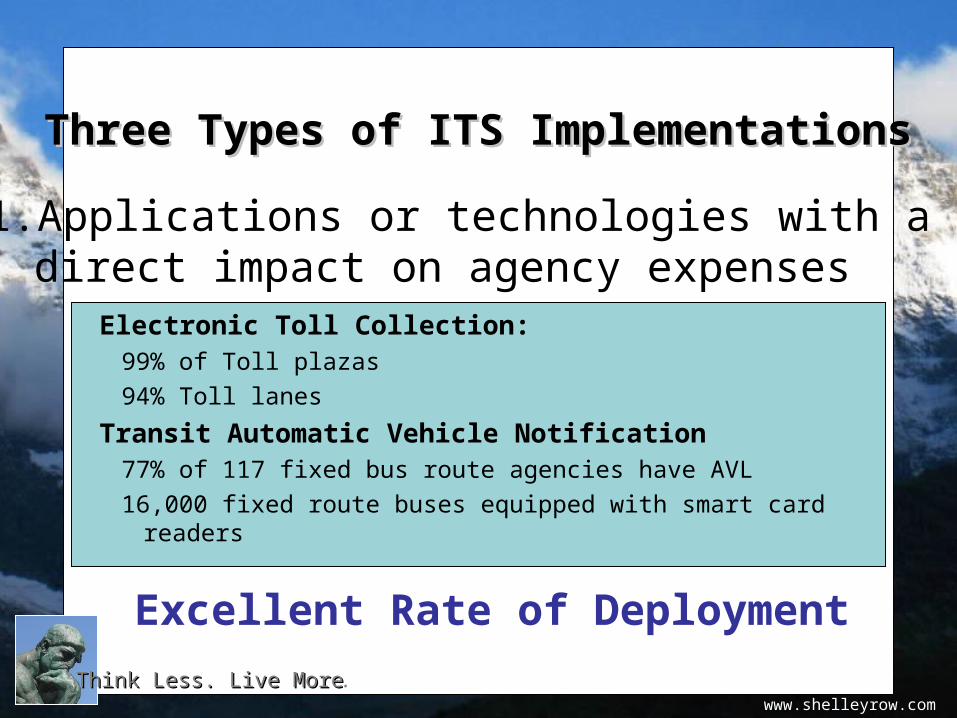
Three Types of ITS ImplementationsThree Types of ITS Implementations
1.Applications or technologies with a direct impact on agency expenses
Electronic Toll Collection: 99% of Toll plazas
94% Toll lanes
Transit Automatic Vehicle Notification77% of 117 fixed bus route agencies have AVL
16,000 fixed route buses equipped with smart card readers
Excellent Rate of Deployment
Think Less. Live MoreThink Less. Live More.www.shelleyrow.com
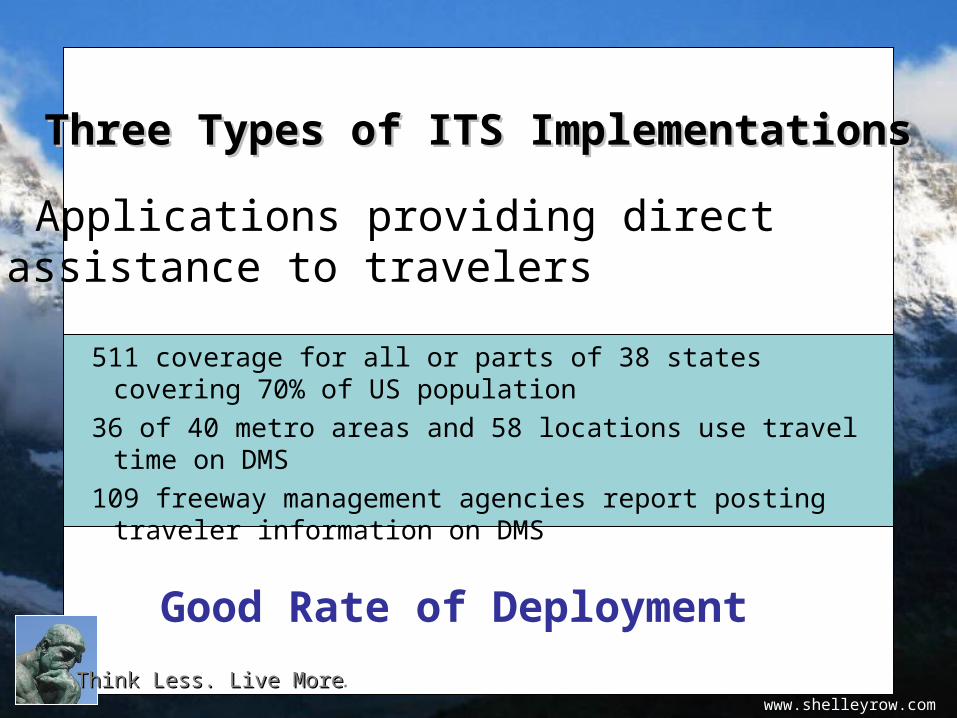
Three Types of ITS ImplementationsThree Types of ITS Implementations
2. Applications providing direct assistance to travelers
Good Rate of Deployment
511 coverage for all or parts of 38 states covering 70% of US population
36 of 40 metro areas and 58 locations use travel time on DMS
109 freeway management agencies report posting traveler information on DMS
5
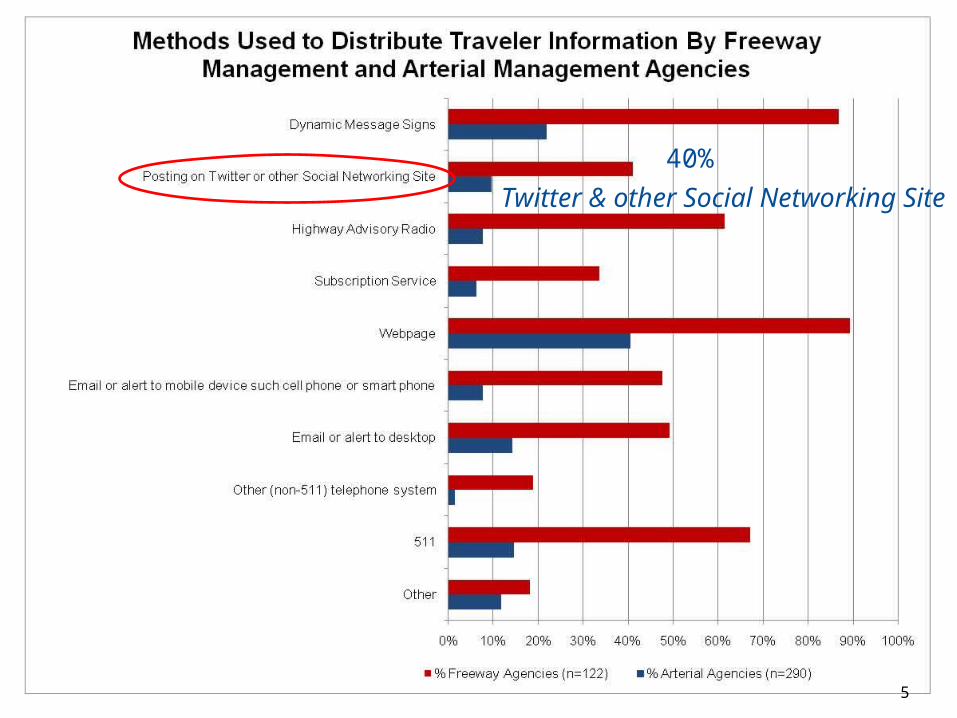
Twitter & other Social Networking Site
40%
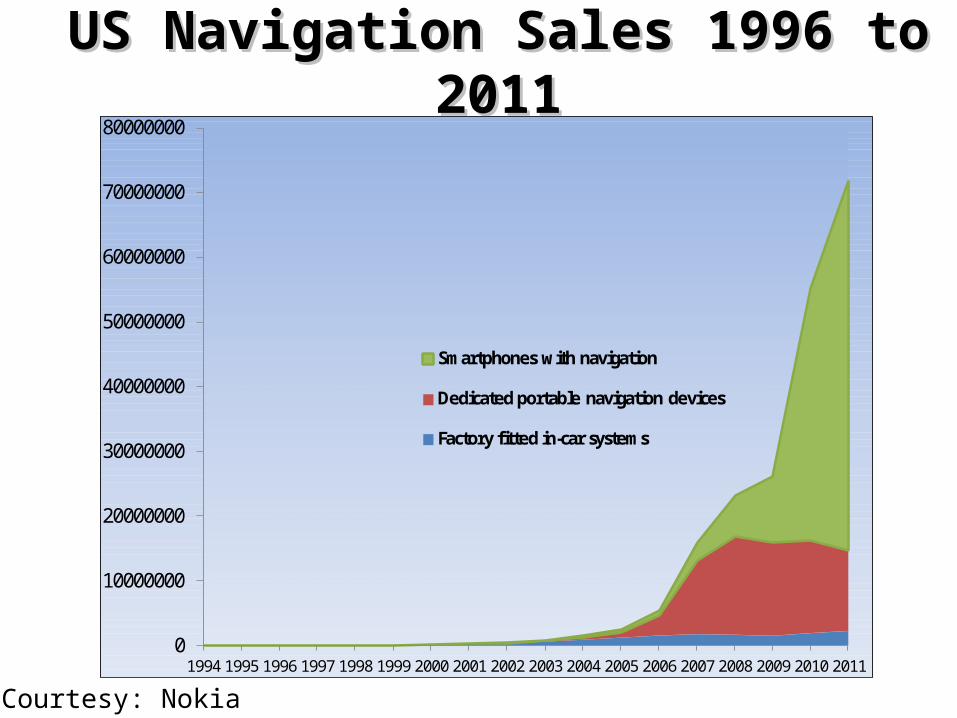
US Navigation Sales 1996 to 2011US Navigation Sales 1996 to 2011
0
10000000
20000000
30000000
40000000
50000000
60000000
70000000
80000000
1994 1995 1996 1997 1998 1999 2000 2001 2002 2003 2004 2005 2006 2007 2008 2009 2010 2011
Smartphones with navigation
Dedicated portable navigation devices
Factory fitted in-car systems
Courtesy: Nokia
Think Less. Live MoreThink Less. Live More.www.shelleyrow.com
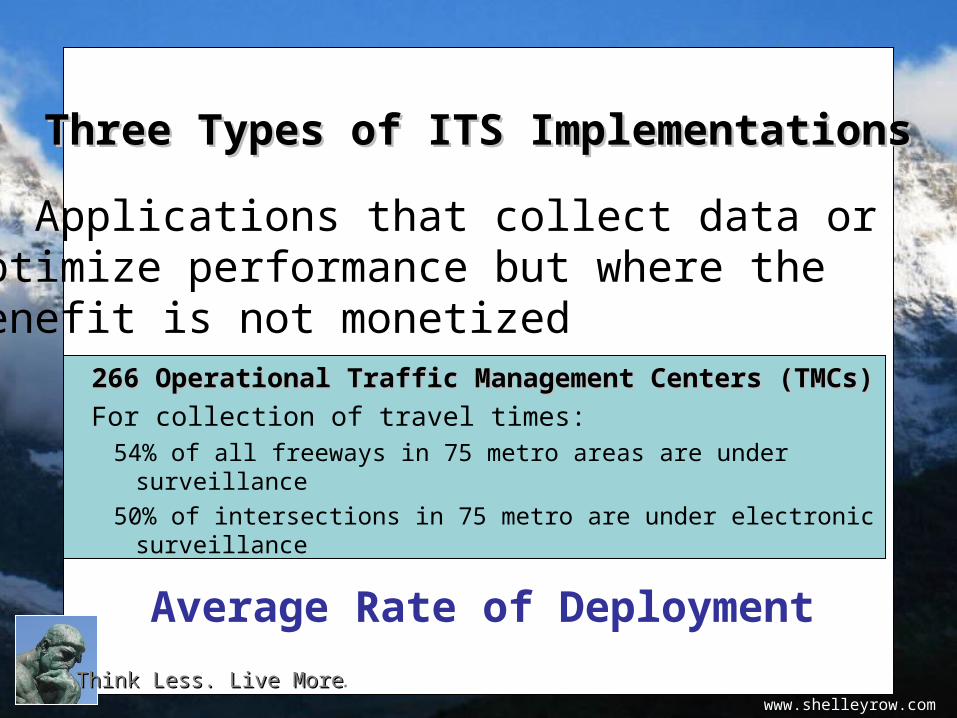
Three Types of ITS ImplementationsThree Types of ITS Implementations
3. Applications that collect data or optimize performance but where the benefit is not monetized
Average Rate of Deployment
266 Operational Traffic Management Centers (TMCs)266 Operational Traffic Management Centers (TMCs)
For collection of travel times:54% of all freeways in 75 metro areas are under surveillance
50% of intersections in 75 metro are under electronic surveillance
0
500
1000
1500
2000
2500
3000
3500
4000
4500
0%
10%
20%
30%
40%
50%
60%
70%
80%
90%
100%
1997
1998
1999
2000
2001
2002
2003
2004
2005
2006
2007
2008
2009
2010
Num
ber o
f Dyn
amic
Mes
sage
Sig
ns D
eplo
yed
% F
reew
ay M
iles
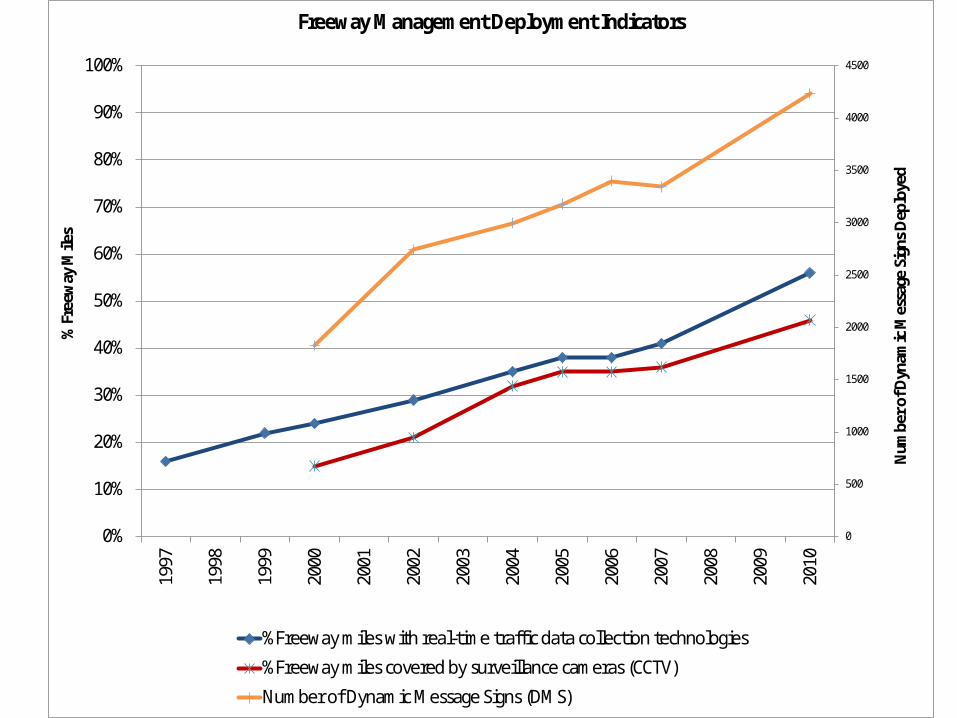
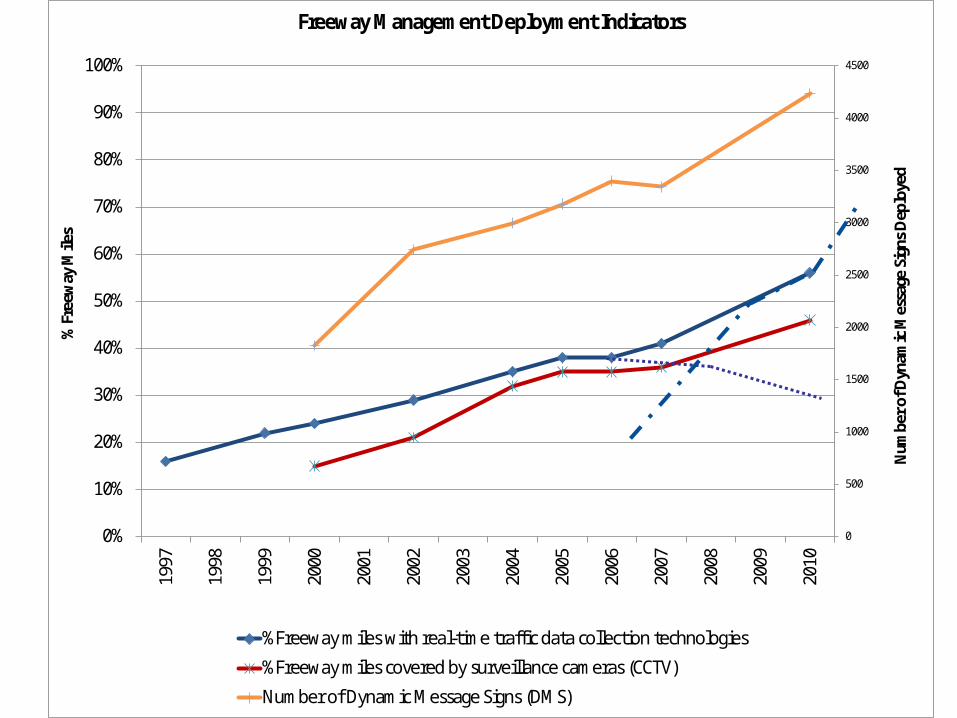
Freeway Management Deployment Indicators
%Freeway miles with real-time traffic data collection technologies
%Freeway miles covered by surveillance cameras (CCTV)
Number of Dynamic Message Signs (DMS)
Think Less. Live MoreThink Less. Live More.www.shelleyrow.com
What Are Our Options?What Are Our Options?
A. Connect projects with intangible benefits to ones with monetary benefits (ITS or roadway construction)
B. Reduce the price point to further increase the value

0
500
1000
1500
2000
2500
3000
3500
4000
4500
0%
10%
20%
30%
40%
50%
60%
70%
80%
90%
100%
1997
1998
1999
2000
2001
2002
2003
2004
2005
2006
2007
2008
2009
2010
Num
ber o
f Dyn
amic
Mes
sage
Sig
ns D
eplo
yed
% F
reew
ay M
iles
Freeway Management Deployment Indicators
%Freeway miles with real-time traffic data collection technologies
%Freeway miles covered by surveillance cameras (CCTV)
Number of Dynamic Message Signs (DMS)
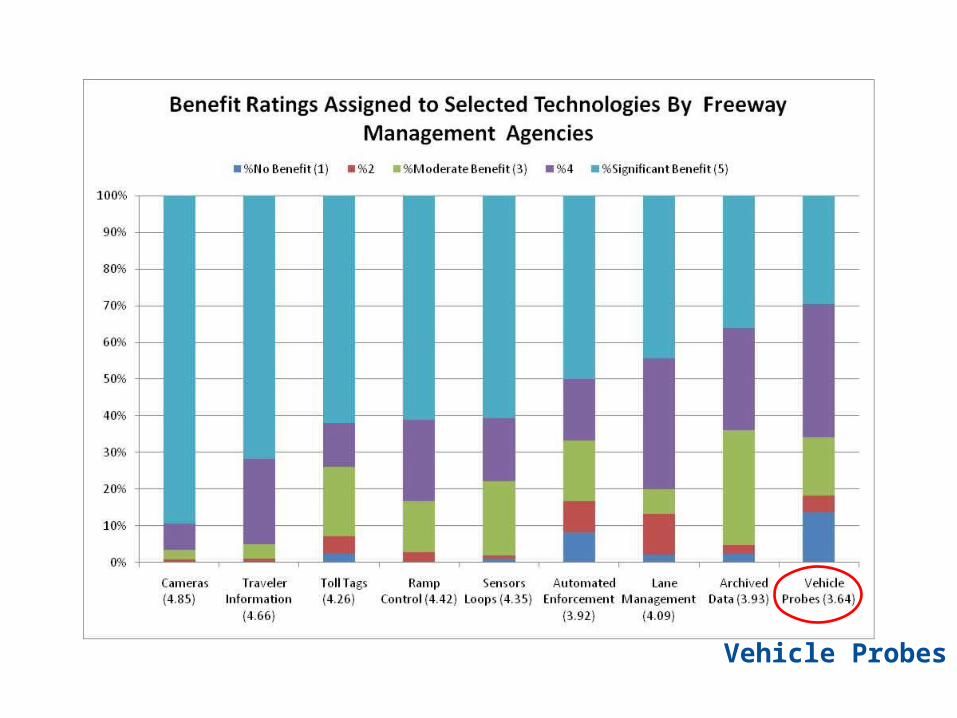
Vehicle Probes
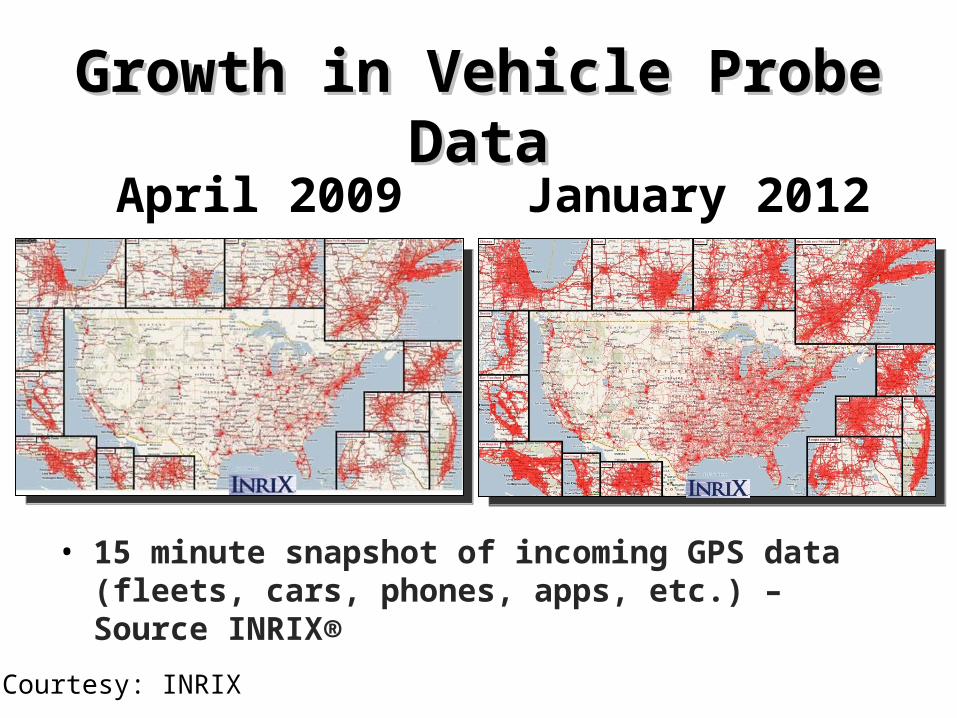
Growth in Vehicle Probe DataGrowth in Vehicle Probe Data
April 2009 January 2012
• 15 minute snapshot of incoming GPS data (fleets, cars, phones, apps, etc.) – Source INRIX®
Courtesy: INRIX
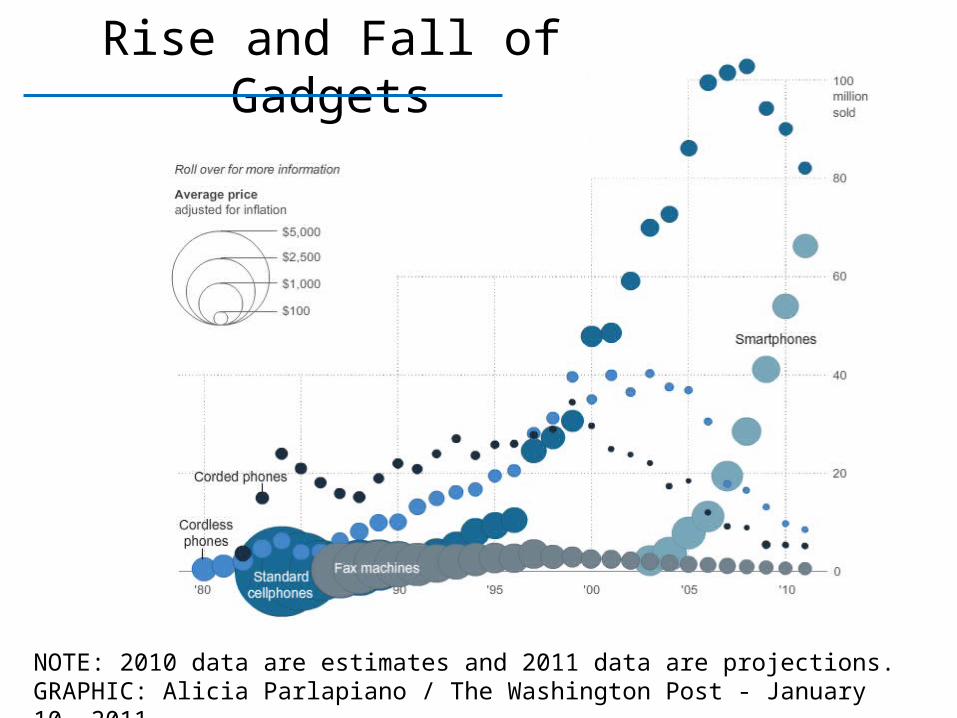
Rise and Fall of Gadgets
NOTE: 2010 data are estimates and 2011 data are projections. GRAPHIC: Alicia Parlapiano / The Washington Post - January 10, 2011
Think Less. Live MoreThink Less. Live More.www.shelleyrow.com
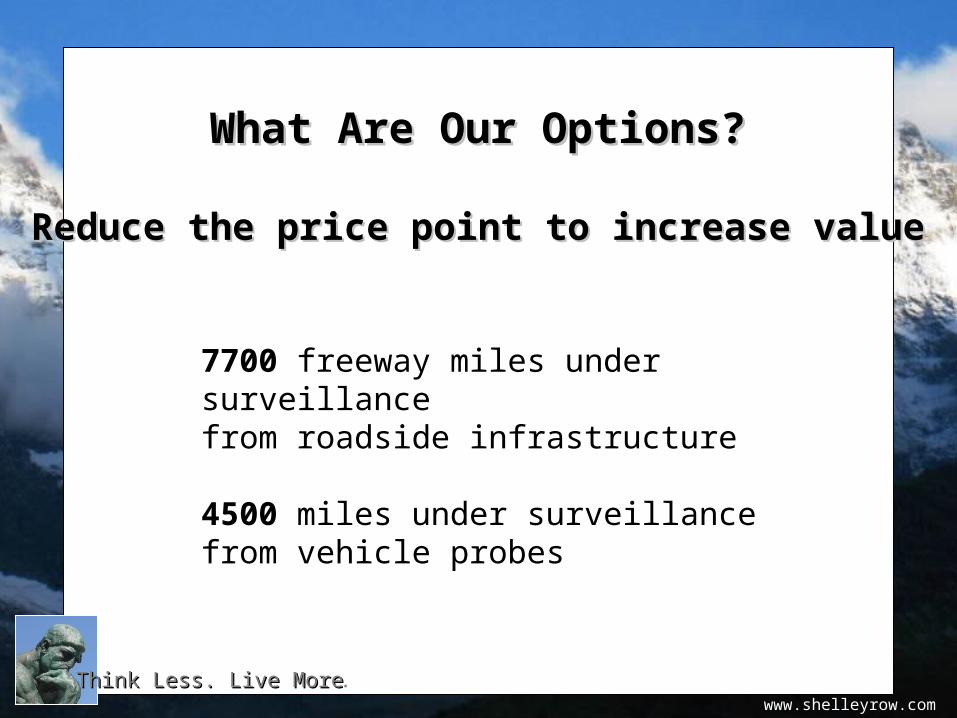
What Are Our Options?What Are Our Options?
Reduce the price point to increase valueReduce the price point to increase value
7700 freeway miles under surveillance from roadside infrastructure
4500 miles under surveillance from vehicle probes
0
500
1000
1500
2000
2500
3000
3500
4000
4500
0%
10%
20%
30%
40%
50%
60%
70%
80%
90%
100%
1997
1998
1999
2000
2001
2002
2003
2004
2005
2006
2007
2008
2009
2010
Num
ber o
f Dyn
amic
Mes
sage
Sig
ns D
eplo
yed
% F
reew
ay M
iles
Freeway Management Deployment Indicators
%Freeway miles with real-time traffic data collection technologies
%Freeway miles covered by surveillance cameras (CCTV)
Number of Dynamic Message Signs (DMS)
Think Less. Live MoreThink Less. Live More.www.shelleyrow.com
A. Connect projects with intangible benefits to ones with monetary benefits (ITS or roadway construction)
B. Reduce the price point to further increase the value
C. Sell the project to meet other objectives (political, social or other goals)
What Are Our Options?What Are Our Options?
Think Less. Live MoreThink Less. Live More.www.shelleyrow.com
Time to Rethink How We Sell ITSTime to Rethink How We Sell ITS
Benefit/Cost isn’t always Benefit/Cost isn’t always the best approachthe best approach
Logical isn’t always logicalLogical isn’t always logical
Learn from Our ExperienceLearn from Our Experience